
Ten Questions Concerning Indoor Environmental Quality (IEQ) Models: The Development and Applications


Department of Building Environment and Energy Engineering, The Hong Kong Polytechnic University, Hong Kong, China
*
Author to whom correspondence should be addressed.
Appl. Sci. 2023, 13(5), 3343; https://doi.org/10.3390/app13053343
Submission received: 6 February 2023
/
Revised: 2 March 2023
/
Accepted: 4 March 2023
/
Published: 6 March 2023
(This article belongs to the Special Issue Indoor Environment Quality and Environmental Comfort)
Abstract
:In the past two decades, with advances in data collection and in analytical techniques and tools, there has been a significant increase in research on indoor environmental quality (IEQ) assessment. To better understand the relationships between the overall IEQ performance and individual IEQ aspects, namely, indoor air quality, thermal comfort, acoustic quality, and visual quality, IEQ models have been developed by many previous studies. In this paper, the IEQ models proposed in the literature in the period from 2001 to 2022 are examined and summarized into ten questions, including but not limited to indicator selection, data collection, analysis methods, interpretation, and implication. The proposed answers aim to provide insight into current studies on IEQ models and identify gaps for future research. It has been found that the existing IEQ models differed for different building types or occupants. To compare the IEQ performance of various buildings in other countries, standardized data collection protocols are necessary, including the selection of IEQ aspects/indicators and their corresponding objective measurement strategies and standardized subjective survey methods. In addition, the data analysis approaches used to develop the IEQ models must be unified. Moreover, criteria for overall IEQ performance and the individual IEQ aspects should be provided. This study is the first comprehensive investigation of all the steps involved in IEQ model development. The answers to these ten questions can be seen as practical instructions for establishing an improved, standardized, and repeatable IEQ assessment model.
1. Introduction
Thanks to the development of numerous technologies, people’s living and working environments have improved considerably in the past few decades. Comfort and healthy indoor environmental quality (IEQ) have attracted much greater attention among researchers, architects, building managers, and occupants. Since 2001, when Chiang et al. [1] developed the first IEQ assessment system, several studies have proposed different IEQ assessment models to evaluate IEQ in various indoor environments. It has been found that by adjusting other IEQ aspects (such as indoor air quality (IAQ), thermal comfort, visual quality, and acoustic quality), an overall satisfactory IEQ could be achieved, and this could yield positive effects in terms of the occupants’ well-being and performance [2,3,4]. To better understand the relationships between individual IEQ aspects and overall IEQ satisfaction and to evaluate the overall IEQ performance in an indoor environment, the IEQ index has been proposed, and its connection with different IEQ aspects has been studied.
IEQ models, as described by Heinzerling [5], comprise an evaluation system that takes the performances of different IEQ aspects as input and provides a numerical IEQ index as the output. This definition is applied in the current study as well. According to a scientometric study on IEQ models, the number of publications about IEQ models keeps increasing; however, the research themes and methods have been updated in the past two decades [6]. The current IEQ model has solid potential to identify the weak aspects of an investigated environment and improve the overall IEQ performance effectively. A few review papers have summarized our knowledge of the IEQ models from different perspectives.
Frontczak and Wargocki [7] provided an overview of the ranking of the four main IEQ aspects, in terms of their relationships with overall IEQ satisfaction and the impact of occupant-related, building-related, and climate-related factors on overall IEQ satisfaction. This study has summarized the results obtained from seven previous investigations. We could not identify a clear trend regarding the ranking of these IEQ aspects because the related studies were not comprehensive enough. Nonetheless, based on the limited studies identified by the literature survey, this study concluded that personal characteristics, such as gender and working position, significantly impacted occupants’ IEQ satisfaction and suggested that future research should pay more attention to this aspect.
Heinzerling [8] critically reviewed eight studies regarding IEQ evaluation in commercial buildings. This review focused on subjective/objective evaluation methods (such as measurement parameters, instruments, and survey subjects) and IEQ assessment class schemes. Although comparing previous studies, controversial results on IEQ assessment classes were identified, particularly regarding the interpretation of EN15251-2007. This study proposed a new assessment class and appealed for additional research to avoid this conflict. Another significant result of this literature study was in identifying gaps in the research, namely, the need for consistent IEQ measurement protocols and reflections on the interaction between the aspects of IEQ in IEQ models.
After Heinzerling’s literature survey was published, further studies on IEQ models have been carried out, and some research gaps that were identified by Heinzerling have been addressed. Therefore, Roumi et al. [5] recently conducted a systematic literature study of 25 publications on IEQ models in commercial buildings to provide an updated review. They have classified these IEQ models into three categories: subjective–objective models, objective models, and subjective models, based on each model’s data collection approach, and discussed the analytical methods applied in these studies. Moreover, they have summarized five criteria for evaluating the quality of IEQ models, based on which criteria they proposed a scoring system and ranked the 25 IEQ models accordingly.
The existing literature has developed various IEQ models. However, the included variables and applied methods varied greatly from one study to another, and no clear patterns emerged. Therefore, the need is still to systematically provide a theoretical basis and practical guidance in IEQ model development and interpretation. Most studies focused on the development of the models while lacking a discussion of the application of these models. To address the research gaps, this study introduces the theoretical basis of the IEQ models, summarizes the methods of data collection, data analysis, and validation used in IEQ model developments, and provides the possible scenarios and challenges for IEQ model applications in the form of 10 questions. Questions 1 and 2 deal with the definition and importance of IEQ models. Questions 3 and 4 refer to the data collection methods used for selecting indicators and the related measurement methods. Question 5 addresses the issue of data analysis methods. Questions 6 to 9 concern the application and validation of IEQ models. Question 10 explores the challenges and future direction for IEQ model development and application. The answers to these questions reveal the challenges and limitations in the current research on IEQ models, in an attempt to shed light on the future development of IEQ models.
2. Methods
A literature study was performed in the Web of Science and Scopus databases to answer the proposed questions. The queries used for the literature search are as follows:
Web of Science: TS = ((indoor environmental quality OR IEQ) AND (model* OR weight* OR index*)).
Scopus: TITLE-ABS-KEY = (“indoor environmental quality” OR IEQ) AND (model* OR weight* OR index*).
After the first round of searches, a further screening procedure was conducted, based on the language used (English) and the published date (within two decades). Then the results identified in these two databases were compared, and the same published were removed. After that, a detailed screening was conducted, based on research topics and results. Only those focusing on IEQ models in school buildings and established mathematical models (or weighting schemes) were retained.
3. Results
3.1. Question 1: What Are IEQ Models?
An IEQ model is an evaluation tool used to assess the environmental quality of an indoor space by considering all the aspects of IEQ [9]. It combines the values of several indicators corresponding to different IEQ aspects into an overall index, which can be a serial number (such as a score from 0 to 100) [10] or a binary number (to indicate accepted/not accepted) [11]. The goal is to provide quantitative insights for the use of building owners, designers, and managers to evaluate IEQ and to indicate both the weakest IEQ aspect and the most important aspect, in order to optimize overall IEQ satisfaction.
Figure 1 illustrates the search result for the number of publications using the keywords “(indoor environmental quality OR IEQ) AND (model* OR weight* OR index*)” in Web of Science. As is shown, there is growing attention to the assessment of IEQ; the peak occurred in the past four years. According to the high-frequency items used in the abstracts of these publications (Figure 2), four research trends can be identified: (i) IAQ, thermal comfort, visual quality, and acoustic quality were the most commonly studied IEQ aspects, while IAQ and thermal comfort were mentioned more frequently than auditory and visual comfort; (ii) schools (or classrooms) and offices were the most popular of the investigated environments; (iii) occupants’ comfort, productivity, performance, satisfaction, and health were the focus of the research; (iv) field studies and surveys were the two most commonly used research methods.
A typical IEQ model consists of the individual IEQ indexes ( and their corresponding weights ():
It is worth noting that Equation (1) is just a single example of the IEQ models. There are diverse model forms that mainly vary according to the analysis methods employed. The individual IEQ indexes of the IEQ model are calculated using separate models that aim to predict the performance of each IEQ aspect (e.g., [13,14,15]). At the same time, the weighting schemes are determined through different analytical methods [16,17]. Combining the individual IEQ indexes and the weighting schemes could help to identify the most crucial aspect that contributes to overall IEQ satisfaction, along with the weakest aspect that needs urgent improvement. Figure 3 shows the necessary procedures for developing an IEQ model, including the selection of investigated subjects (namely, the measurement parameters and the surveyed occupants), data collection, data analysis, and the interpretation of the results. Each step of this process is explained in the following sections.
3.2. Question 2: Why Is the IEQ Model Needed?
It is well-known that people spend most of their time indoors, and IEQ significantly impacts the occupants’ health, comfort, and working performance [18,19,20,21,22]. Previous studies identified that poor IEQ could cause sick building symptoms (such as dry eyes, stuffy nose, and headache) [23,24] and may have a close connection with the prevalence of certain diseases (such as rhinitis and migraine) [18,19]. These health effects would inevitably result in uncomfortable workers and poor performance. Besides the occupants’ perspective, IEQ in the working environment has also aroused employers’ interest since an unhealthy IEQ might lead to leave being taken due to ill health and low productivity, thereby lowering yields. It has been known that personal experience accounts for a large proportion of companies’ operation and maintenance costs [25,26]. Take an employee in California as an example; Kats and Capital [27] claimed that decreasing 1% in one employee’s productivity was equal to USD 665 being lost yearly. Conversely, improving workers’ performance could result in a USD 20–160 billion increase per year [25].
Additionally, the impact of IEQ on occupants also concerns the managers of schools since children are much more sensitive to IEQ than adults [28]. Poor IEQ not only negatively impacts children’s comfort at school [29] and their performance [30] but also might cause health problems such as fatigue, stuffy nose, and headaches, which may impede children’s development [31]. For example, Haverinen-Shaughnessy and Shaughnessy [32] identified a negative relationship between classroom, temperature (within a specific range), and students’ test scores. An EU-level project, SINPHONIE (Schools’ Indoor Pollution and Health: Observatory Network in Europe), which investigated the IEQ in 53 schools across 12 European countries, found a significant impact in terms of visual quality, particularly the amount of daylight, on students’ school performance [33]. Sala and Rentala [34] reported the detrimental effect of poor classroom acoustic quality on students’ speech communication and learning ability. Moreover, poor IAQ, such as high concentrations of VOC (volatile organic compounds) and PM2.5 (particles that are 2.5 microns or less in diameter) or inadequate ventilation rates in classrooms, were also detrimental to school children’s health and performance [35,36,37].
All these IEQ aspects are essential to occupants’ health, comfort, performance, and overall IEQ satisfaction. However, the degree of importance of these aspects is not so clear, and it differed among different occupants with different occupancy duration in various types of buildings [7,38,39]. Building managers (or others with the right to control the IEQ in the buildings) usually allocate attention and energy resources based on their own experiences and understanding of the different IEQ aspects. Therefore, identifying how different IEQ factors impact occupant satisfaction could help building managers to decide what IEQ aspect should be prioritized, especially when resources are constrained [40].
Given the above, all the building’s designers, owners, and managers should be encouraged to invest in modifying the building designs or building operations if these modifications could improve the occupants’ health, comfort, and performance. Therefore, to help decision-makers to better understand the quantitative relationship between the overall IEQ performance (or occupants’ overall satisfaction with the indoor environment) and the performance of each IEQ factor (or occupants’ satisfaction with each factor) [14,40], we must identify the specific IEQ aspect that has the most significant (negative/positive) effect on the occupants’ satisfaction [1,39,41], and compare the IEQ performance between different indoor spaces [10,42]; for this reason, the IEQ model is needed.
Apart from the impact of IEQ, the standards relating to IEQ are also worth our attention. To date, the majority of IEQ standards and guidelines only focus on one IEQ aspect (i.e., thermal [43], visual [44], acoustic [45], or IAQ [46] factors) or provide separate categories for these different IEQ aspects [47]. Since no unified calculation method exists for an integrated IEQ index, the standards seldom stipulate the types for the overall IEQ performance. This makes evaluating and comparing the overall IEQ conditions in different buildings difficult. To develop an integrated IEQ standard, a unified IEQ index calculation method must be established, namely, an IEQ model. Based on this model, the IEQ evaluation system can be confirmed, promoting work at the design stage and making the IEQ more comfortable for the target occupants.
3.3. Question 3: Which Aspects and Indicators Should IEQ Models Include?
3.3.1. IEQ Aspects Involved in the Existing IEQ Models
Most existing IEQ models considered the four main aspects of IEQ-IAQ: thermal quality, visual quality, and acoustic quality [1,5,8,10,13,14,15,17,42,48,49,50,51,52,53,54,55]. Among the other models that did not involve all four IEQ aspects, thermal comfort was the most widely investigated; all the reviewed models considered it, but while IAQ was not included in the models developed by Buratti et al. [56], Huang et al. [57], and Xu et al. [58], visual quality was not included in the models proposed by Lai and Yik [41], Huang and Liao [59], and Mui and Chan [60], and acoustic quality was not included in the models provided by Xu et al. [58] and Huang and Liao [59]. The reason why these aspects were excluded differed between the studies, which might be due to the narrow range of the collected data [57,60], the research purposes [59], or the limitations of the experiment chamber [58]. However, according to Bluyssen et al. [61], there were significant interactions between the four IEQ aspects; for example, they found that under the same IAQ conditions, the occupants’ assessments of smells were different with different lighting or acoustic quality. This sensory interaction might influence the occupants’ overall IEQ assessment as well. Therefore, to achieve accurate IEQ perception, the four aspects should be considered simultaneously.
Although IAQ, thermal comfort, visual quality, and acoustic quality have been regarded as significant components of IEQ, the subject encompasses more conditions inside the building. The American Society of Heating, Refrigerating, and Air-Conditioning Engineers (ASHRAE) defined IEQ as “a perceived indoor experience of the indoor building environment that includes aspects of design, analysis, and operation of energy-efficient, healthy, and comfortable buildings” [62]. Therefore, the Center for the Built Environment (CBE) at the University of California, Berkeley, designed a web-based IEQ assessment questionnaire that consists of an evaluation of seven indoor environmental quality aspects, including office layout, office furnishings, thermal comfort, air quality, lighting, acoustics, and cleaning/maintenance [63]. Many researchers later applied this questionnaire to evaluate IEQ in several investigated buildings [40,64,65]. They found that apart from the four widely studied IEQ aspects, office layout, furnishing, and cleanliness (including indicators such as the amount of space, privacy, and the adjustability of furniture) had noticeable impacts on the occupants’ overall satisfaction [21,40,66]. Therefore, these aspects of IEQ are suggested for consideration in developing IEQ models. Electromagnetic fields, water quality, and energy were investigated in some IEQ assessments, due to society’s goals at the time and the severity of the problems that these aspects might cause [67,68,69]. However, no IEQ model has involved these aspects so far.
Since IAQ, thermal comfort, visual quality, and acoustic quality were the most widely studied factors, they are the main focus of the current study. In most previous studies, only one indicator was selected to represent one aspect of the IEQ, such as predicted mean vote (PMV)/operative temperature (Top) for thermal comfort, CO2 concentration for IAQ, illuminance for visual quality, and sound pressure level (SPL) for acoustic quality [13,14,42,50,60]. However, more parameters could affect these aspects of IEQ. Hence, to achieve a holistic understanding of IEQ performance, some studies have investigated more than one indicator for some or each IEQ aspect(s) [48,51,55,56]. A few researchers even included 18 [64] or 23 [69] indicators in their own IEQ evaluation surveys. The most commonly used indicators for each IEQ aspect will be discussed in the following sub-sections.
3.3.2. IEQ Indicators Involved in Existing IEQ Models
Thermal Comfort-Related Indicators
In terms of thermal comfort, air temperature, radiant temperature, humidity, and air movement are the four fundamental indicators that define physical and thermal environments. Apart from these factors, the occupants’ metabolic heat and clothing insulation were often also collected in previous thermal comfort-related studies. Using these six indicators together, the occupants’ thermal sensations can be determined in an indoor environment; furthermore, the PMV and predicted percentage of dissatisfaction (PPD) can be calculated based on Fanger’s thermal comfort equations [70]. However, the PMV and PPD indexes are limited in an air-conditioned environment. The Top measure was proposed and has been widely used in previous studies to better reflect occupants’ thermal sensations in naturally and mechanically ventilated buildings since it was closely related to the occupants’ thermal sensation votes (TSVs) [71]. Besides these objective indicators, to collect the occupants’ thermal sensations directly, the thermal sensation vote was also investigated as a subjective indicator of thermal comfort in many studies.
IAQ-Related Indicators
IAQ assessment can be established based on ventilation or the concentration of pollutants in an indoor environment. Therefore, two indicators were used to evaluate IAQ: ventilation rate and pollutant concentrations. Ncube and Riffat [15] proposed three ways to calculate the IAQ index using three different indicators, i.e., ventilation rate, CO2, and decipol (pollution perceived in the presence of an ordinary subject in an environment with ventilation equal to 10 L/s of clean air). Similarly, Mujan et al. [48] also developed three models to evaluate the IAQ index. Still, with the three different indicators of CO2, PM2.5, and TVOC (total volatile organic compounds), only the minimum value of the three indicators was used in the final IEQ model. Piasecki [52] also used three IAQ indicators—CO2, TVOC, and formaldehyde (HCHO)—but considered them together in one evaluation model. Among these IAQ indicators, CO2 was the most widely used indicator since it can be seen as a proxy for ventilation as well as the surrogate of human bio effluents [13,14,39]. Besides, occupants’ perceptions of air quality (such as freshness or odors) were also widely used as a subjective indicator to evaluate IAQ in previous studies [39,71,72,73].
Acoustic Quality-Related Indicators
To evaluate the acoustic quality in an indoor environment, SPL-related indicators, including the A-weighted equivalent sound pressure level, Leq(A) [13,15,74], and background noise level [5,60,75] were often used. These indicators were the same as those used to test the presence of noise sources. In addition, there are some indicators that are used to describe the sound insulation of an investigated environment (such as reverberation time (RT) and sound absorption coefficient) [76] and the intelligibility of speech (such as the signal-to-noise ratio and speech transmission index (STI)) [56,77]. However, considering the complexity of measurement, these indicators were not commonly used. Moreover, to subjectively evaluate the acoustic quality in an indoor environment, occupants’ perceptions of acoustic quality (such as noisy/quiet or speech intelligibility ratings) were often investigated [10,13,14,15,17,50,56,57,65,75].
Visual Quality-Related Indicators
Compared to other IEQ aspects, few alternate objective indicators are used to evaluate visual quality. In terms of visual quality, illuminance (E) was the most widely used indicator to assess lighting performance [10,13,14,15,58,64]. However, more subjective visual indicators have been used in previous studies, for example, the perception of artificial light/daylight, the occurrence of glare, etc. [56,64,69].
3.4. Question 4: How to Collect Data
The procedure of data collection is essential for IEQ assessment. In most studies, both subjective and objective data were collected through on-site measurements and questionnaires. However, some studies evaluated IEQ performance using objective or subjective data alone. Additionally, few studies used the data obtained through simulations or chamber experiments to assess IEQ performance [57,58,74,76].
3.4.1. On-Site Measurement
Technological advances have made measurement more accurate and convenient in the past few decades since several multifunctional devices that simultaneously measure numerous indicators have now been invented. However, the selection of measurement tools in the literature heavily depended on the study purposes or the amount of available funding. Moreover, measurement procedures, including time duration, time intervals, and the number and location of sensors were also decided, mainly based on the researchers’ personal experience. It seems that no consistent guidance for IEQ-related indicators measurement exists as yet. According to a comparison study between two measurement durations—15 min and 2 h—the exposure time significantly impacted the final IEQ model, specifically the weighting scheme [16].
Furthermore, a recently conducted full-scale laboratory study observed that CO2 concentrations varied significantly between different locations in the same room, especially under natural ventilation conditions [78]. The same results were also expected for other IEQ indicators. Therefore, future studies must develop a clear IEQ measurement guideline to instruct and unify the measurement procedure.
3.4.2. Questionnaire Survey
Since occupants know the surrounding environment best, questionnaires were commonly used in previous studies to collect their perceptions of IEQ and determine the combined effect of the IEQ factors. The questionnaire design was similar among these studies. Most of them consist of questions on the occupants’ personal information, along with their perceptions of and acceptance/satisfaction regarding the four IEQ aspects. The perception-related questions were, in general, answered using semantic differential evaluation scales (e.g., hot—warm—neutral—cool—cold), Likert scales (e.g., disagree—neither agree nor disagree—agree), or a visual analog assessment scale (e.g., 0–100 rating scales), while the acceptance/satisfaction-related questions were usually answered using a dichotomous assessment scale (e.g., acceptable/satisfied—not acceptable/unsatisfied) [79]. Apart from the occupants’ questionnaires, some researchers also collected experts’ questionnaires to better understand the importance of different IEQ aspects. A typical form of these questions served as a pairwise comparison. Through this process, experts’ preferences could easily be collected. Usually, a questionnaire survey was conducted simultaneously, with the physical measurements being taken in the indoor environment. The combination of on-site measurements and questionnaire surveys allows researchers to develop an in-depth and comprehensive understanding of the IEQ performance in the investigated environment. However, as with on-site measurement, most questionnaires were designed by the researcher empirically. The number of questions included for one IEQ aspect varied from one [13] to five [56], which, according to Fassio et al. [16], might influence the weighting of IEQ aspects concerning overall satisfaction. Therefore, a uniform set of questionnaires is needed. Some well-designed questionnaires were either adopted or revised by later studies, such as the CBE occupant IEQ survey [62] and the OFFICAIR questionnaire [80]. However, these questionnaires mainly focused on office environments; standard questionnaires for children in school and older adults in care centers are yet to be created.
3.4.3. Simulation
In addition to on-site measurement and questionnaire surveys, simulation is another method used to collect data while developing IEQ models, especially when predicting IEQ performance in the design stages [74,76]. According to Korsavi et al. [81], data generated through simulations needs to be more consistent with the results collected through the questionnaire, to a substantial extent. In simulations, more building-related indicators that might influence IEQ performance (such as shape, window size, lighting locations, the number of sound absorption panels, HAVC systems, etc.) could be analyzed since computers could simulate more scenarios. For instance, an extensive database with 15,800 cases was created by Catalina and Iordache [76] using simulations, where eight input indicators with wide ranges (e.g., the temperature range varied from −8.8 °C, representing Moscow in January, to 42.9 °C, representing Abu Dhabi in August) were considered. Using this database, they developed a set of individual models to predict the performance of the four aspects of IEQ, along with an integrated model to calculate the overall IEQ index, which was proven to be very accurate (R2 > 0.9).
3.4.4. Laboratory Experiments
Laboratory experiments were also applied in the various studies on IEQ evaluation models. Compared with field studies, environmental quality could be controlled in laboratory experiments, which is both advantageous and disadvantageous. In the experiment chambers, more combinations of the various environmental settings can be tested, and researchers could effectively collect the occupants’ responses toward different conditions. However, it is hardly possible to control every IEQ indicator in the experiment chamber, so previous studies conducted in the labs seldom considered all the aspects of IEQ. For example, in the study by Xu et al. [58], only thermal, visual, and space conditions could be changed; therefore, acoustic quality and IAQ were not examined. In the study by Huang et al. [57], lighting, acoustic, and thermal conditions could be controlled, while IAQ could not; therefore, their IEQ evaluation did not consider IAQ. Another possible limitation of the laboratory experiments is the limited size of the experience chamber and the limited number of participants. Tang et al. [82] experimented in an IEQ laboratory where all the IEQ aspects (including temperature, airspeed, SPL, illuminance, and CO2 concentration) could be changed, yet only eight university students participated in their experiment, which made it impossible for the results to be generalized. Besides, in this experiment, IAQ was controlled by increasing the CO2 concentration, which was irrelevant because CO2 concentration cannot be regarded directly as an indicator of IAQ. CO2 concentration, without specific intervention, can affect the ventilation performance, which could be used to evaluate the IAQ; however, increasing CO2 concentration by releasing CO2 into the chamber can hardly have any connection with the ventilation rate, hence, there is no impact on IAQ. Although there are several limitations to the current laboratory experiments, with technological progress, there is reason to believe that more advanced experimental chambers will be designed and built. Laboratory experiments will provide a powerful way to study IEQ models in the future.
No unified data collection methods have been developed, including both subjective and objective investigations. The empirical data collection procedures varied from study to study, which increased the uncertainty in the collected data and affected the trustworthiness and credibility of the IEQ models. Therefore, one of the most basic needs when establishing an accurate IEQ model is to define a standard, detailed, and widely applicable protocol for data collection. A standard questionnaire (for capable adults) and interview outline (for young children and older adults) including all the basic questions should be provided for subjective investigation. On this basis, several customized questions for the different indoor environments can be added, and many examples should be included in the protocol, while in the case of objective investigations, the procedures of on-site measurements (for existing buildings) and simulations (for future buildings) should be introduced in detail. In addition, the customization of objective investigations is also feasible, and possible options should be provided, based on previous studies. Following this protocol, a global database can be developed that will pave the way for establishing universal IEQ models.
3.5. Question 5: How to Calculate the Individual IEQ Indexes
To build an accurate IEQ model to predict the occupants’ overall IEQ satisfaction precisely, it is vital to understand the occupants’ satisfaction regarding each IEQ aspect separately in the first place. Therefore, in most existing studies on IEQ models, the individual indexes were calculated according to thermal comfort, IAQ, acoustic quality, and visual quality, using various models in the different studies.
3.5.1. Thermal Comfort Model
Among the thermal comfort models used in previous studies, the one developed based on Fanger’s investigations (see Equations (2) and (3)) [68] has the most extended history and was the one most widely used [14,15,48]:
where M is the metabolic rate (W/m2); W is the effective mechanical power (W/m2); is clothing insulation (); is the clothing surface area factor; is the air temperature (°C); is the mean radiant temperature (°C); is the air velocity (m/s); is the water vapor partial pressure (Pa); is the convective heat transfer coefficient ()); is the clothing surface temperature (°C).
The resulting indexes of Fanger’s thermal comfort model could be PMV or PPD. Some studies used these indexes directly, and some developed new indexes based on these indexes, such as Equations (4) [15,48] and (5) [14]. However, Fanger’s model has only been developed for adults in air-conditioned environments. To accurately refine the thermal comfort for different groups of people in various settings, adaptive models were proposed [83,84]. Consequently, some studies developed their thermal comfort models based on operative temperature [10,13,50] and most of them were quadratic regression models, such as for Equation (6) [13].
3.5.2. IAQ Model
For IAQ models, the most popular ones were developed based on CO2 concentrations. Among them, the simplest one was the linear regression model (e.g., Equation (7) [13,50]). Likewise, logistic regression models (e.g., Equation (8) [14,49]) and quadratic regression models (e.g., Equation (9) [42]) were also developed. Additionally, other indicators, such as airflow rate [10] and pollutant concentrations [15,48,52,55], were considered to be independent variables of the IAQ models as well. Some models that were developed based on air pollutants considered more than one indicator, as mentioned in question 4. The IAQ index was determined by the minimum value [48] or was calculated based on another linear regression model [52].
3.5.3. Acoustic Quality Model
In terms of acoustic quality models, almost all of them were developed based on SPL; one of the most popular models is Equation (10), which was used in several studies [15,48,52,55]. Besides this, some studies developed their acoustic models based on their own collected data, for which the linear regression model was the most common one [10,13,60,75,76], such as in Equation (11) [76]. Additionally, several logistic regression models were developed for evaluating acoustic quality [14,49,85], such as Equation (12) [14]. Another attractive acoustic-quality model that is worth mentioning is the one developed by Buratti et al. [56]. To achieve a holistic evaluation of acoustic quality in an indoor environment, the authors included five acoustic indicators in their model (see Equation (13)), namely, the index of background noise (IBN), the effect of noise (IEN), sound quality (ISQ), voice perception (IVP), and listening quality (ILQ), respectively. Unlike the thermal comfort or IAQ models, no quadratic regression model was developed to evaluate acoustic quality, indicating a monotonic relationship between SPL and acoustic quality—the lesser the SPL, the better the acoustic quality in the tested range:
3.5.4. Visual Quality Model
For the visual quality models, almost all of them used illuminance as an independent variable but in various forms, such as the linear regression model (e.g., Equation (14) [10,42]), logistic regression model (e.g., Equation (15) [14]), quadratic regression model (e.g., Equation (16) [13]), and complex logistic quadratic regression model (e.g., Equation (17) [15]). Likewise, similar to the acoustic quality model that involved five indicators, Buratti et al. [56] also used five lighting-related indicators to develop a holistic visual comfort model (see Equation (18)), wherein ALQ, ALS, ALG, NLR, and NLQ represented the indexes of artificial lighting quality, artificial lighting sources, artificial lighting glares, natural lighting quality, and natural lighting reflection, respectively.
3.6. Question 6: What Is the Combined Effect of Individual IEQ Aspects on Overall IEQ Satisfaction?
Usually, weighting schemes were applied in the previous studies to combine the individual index into an overall IEQ satisfaction model. Table 1 lists a summary of the weighting schemes used in the existing IEQ models. To ensure comparability, the weightings were normalized into a new array with a sum equal to one (those with the highest weightings were marked in bold). Among them, the most straightforward weighting scheme is a set of equal weights, namely, 0.25 for each factor [54,55,76]. This weighting scheme was officially proposed and justified by Piasecki et al. [54].
However, IEQ is a complex system, wherein multiple interaction effects among the individual IEQ aspects might occur [82,86], and the contributions of these aspects on the overall IEQ satisfaction might not equal (e.g., [14,60]). For example, Bluyssen et al. [61] conducted a laboratory study on the occupants’ perceptions of four IEQ aspects under different environmental configurations. They found that different background sound types could significantly affect the occupants’ perception of acoustic quality and IAQ. Therefore, to accurately predict the occupants’ IEQ satisfaction, the four IEQ aspects identified earlier should be investigated together. An integrated analysis approach that considers the combined effect of the individual IEQ aspects on the overall IEQ satisfaction should be applied.
The most commonly used integrated analysis methods were linear regression analysis, logistic regression analysis, the analytical hierarchy process (AHP), and structural equation modeling (SEM) to determine the weightings of the individual indexes. Leccese et al. [17] compared three different weighting schemes and found that different analytical approaches resulted in the different weightings of individual IEQ indexes. For example, the importance ranking of acoustic comfort and visual comfort on the overall IEQ performance obtained by linear regression analysis was opposite to that obtained by AHP. The difference in the weighting schemes obtained between linear and logistic regression methods was also identified by Fassio et al. [16]; they concluded that logistic regression analysis tended to generate more stable results than linear regression analysis. Some of the previously used methods addressing the weighting schemes are noted in the following paragraphs.
3.6.1. Linear Regression Analysis
Multiple linear regression is the most widely used approach for establishing the relationship between the over-IEQ index () and individual indexes. Most previous studies on IEQ model development have applied this method to determine the weightings of individual IEQ indexes [60]. A typical linear regression IEQ model that consists of four main IEQ aspects is shown in Equation (19) [13,15,54]:
where , , , represent the IAQ index, thermal comfort index, acoustic quality index, and visual quality index separately, and , , , were their corresponding weightings, indicating the significance of each index to the overall IEQ performance.
3.6.2. Logistic Regression Analysis
According to the literature survey, logistic regression analysis is another popular method used to determine the weightings of individual indexes. Wong et al. proposed logistic regression for the IEQ models [14]. As with linear regression analysis, the overall IEQ satisfaction value was calculated based on the occupants’ satisfaction with specific IEQ aspects. A typical logistic regression IEQ model that consists of four main IEQ aspects is shown in Equation (20) [14,49]. Usually, studies that used logistic regression analysis to determine the weights of individual IEQ indexes also preferred to use logistic regression analysis to calculate the unique IEQ indexes.
3.6.3. Analytical Hierarchy Process (AHP)
The analytical hierarchy process (AHP) is a basic approach for decision-making; it applies simple pairwise comparisons to rank the aspects of IEQ regarding their importance to the overall IEQ performance. Usually, to conduct an AHP, experts in the related fields are generally invited to participate in a questionnaire survey consisting of a set of comparisons between every two of the investigated indicators, with a 9–symmetric point scale. Based on these experts’ perceptions, a numerical weighting system can be derived for each investigated indicator. However, previous studies show that experts from different fields or countries might hold different opinions. For example, an online survey showed that Chinese engineers believed that all the IEQ aspects were equally important, while Chinese building designers and planners believed that IAQ was more important than other IEQ aspects.
In contrast, English experts, no matter their fields, believed that thermal quality was the most critical IEQ aspect. Therefore, a careful selection of expert panels is required when applying this method. Besides, by using AHP alone, researchers can only understand the rankings of IEQ aspects. To achieve a final model for quantitative evaluation, AHP must be combined with other statistical analysis methods, such as fuzzy comprehensive evaluation (FCE) [50].
3.6.4. Structural Equation Modeling (SEM)
In addition, structural equation modeling (SEM) was also used to investigate the relationship between overall IEQ satisfaction and the IEQ indicators [72,87,88]. SEM is a combination of regression analysis and exploratory factor analysis [87]. Using this method, Nimlyat et al. [87] identified the latent constructs between the IEQ performance, the four IEQ aspects, and their corresponding indicators. Based on their results, they developed a weighting scheme for the four IEQ aspects in the context of hospital environments. By applying SEM, one could determine the ranking importance of different IEQ aspects to the overall IEQ performance. However, an equation that results in an IEQ index must still be developed. To evaluate and compare the IEQ performance of different buildings, Nimlyat [72] developed a second-order model incorporating occupants’ satisfaction and established a relationship between the overall IEQ performance and occupants’ satisfaction. Then, he proposed a comprehensive occupants’ satisfaction index, namely, the percentage of variance in the occupants’ overall IEQ satisfaction that can be explained by the IEQ performance, using this as the final output of the model to rate the IEQ performance in healthcare facilities.
3.6.5. Other Analytical Methods
Apart from two-step analysis methods, Kano’s satisfaction model (usually used in the marketing field) was also applied to test the relationships between overall IEQ satisfaction and the IEQ indicators by Kim and de Dear [40]. They first developed a linear regression model to prepare for the deviation between overall IEQ satisfaction and 30 dummy variables that were converted by 15 IEQ indicators. As a result, each IEQ indicator had two regression coefficients representing their impacts on overall satisfaction and dissatisfaction, respectively. Based on these regression coefficients, the 15 IEQ indicators were divided into three categories: primary factors, proportional factors, and bonus factors. Although no IEQ indicators were identified as bonus factors in their study, they did prove that Kano’s satisfaction model could be used in the field of IEQ. It could help researchers to understand the influence of different IEQ indicators on overall IEQ satisfaction from a different perspective. Another exciting analytical method is artificial neural network (ANN) modeling; by employing this method, Sofoglu [89] analyzed eight different network structures and found one model with one hidden layer with 10 neurons that could successfully reflect the relationship between the occupants’ symptom prevalence and the measured IEQ indicators.
Humphreys [51] stated that developing an IEQ model that works in all countries is impossible. The comparison results between linear and non-linear regression analyses indicated that the selection of research approaches significantly influenced the assessment results [16]. Thus, it is necessary to set a unified analysis procedure that includes the individual index calculation and the weighting approach. If the same data analysis methods are applied in future studies, then the IEQ performance in different indoor environments can be compared, and a global database can be built. By that time, for those studies where subjective data are difficult to collect, the researchers could select suitable weighting schemes from the database, based on the building type, outdoor climate, etc.
3.7. Question 7: Where Do IEQ Models Apply?
In theory, IEQ models could assess the quality of any indoor environment. However, current IEQ models were mainly built to evaluate IEQ in public buildings, especially in offices and schools. In contrast, IEQ models for residential buildings were relatively few. There are two reasons for this. First, the benefit obtained by improving IEQ in public buildings is straightforward and considerable. Many studies indicated that IEQ in office buildings directly impacted workers’ health and productivity, whereby better IEQ could yield economic benefits [25,26,27,90]. For example, a Lawrence Berkeley National Laboratory study found that improving thermal comfort and visual quality in office buildings could reduce sick building syndrome symptoms and absence due to illness, yielding the equivalent of USD 16-44 billion in annual savings [25]. Besides this, it also could increase employees’ productivity and gain an additional USD 20–160 billion per year in the US [25]. Similar impacts of IEQ were also observed in educational buildings [32,91,92]. For instance, increasing the amount of daylight in classrooms could improve THE students’ performance by 20% [93], while reducing traffic noise by 15 dB (A) could improve children’s listening tests by almost 30% [94].
To monetize these impacts, Shan et al. [95] first tried to use the LCA (life cycle assessment) approach to investigate the effects of two different ventilation systems on students’ well-being and performance, and found that passive displacement ventilation could reduce the number of students taking sick leave. In contrast, mixing ventilation could improve students’ marks and offer more net benefits. However, because residential buildings are non-profit, the benefits of strengthening IEQ in living spaces were relatively less attractive, although people spend most of their time there. The second reason is that researchers have relatively easy access to public facilities, compared to residential buildings, and the measurements conducted in public buildings seem less intrusive. In addition, occupant density in public buildings, especially in office buildings and schools, is more extensive than in residential buildings, making collecting questionnaires easier. This also explains why the sample sizes in studies carried out in residential buildings were smaller than in public buildings. Therefore, fewer financial benefits and difficulty collecting data result in fewer studies on IEQ models in residential buildings. For the same reasons, the research attention paid to elderly care centers and day-care facilities was even more sparse.
3.8. Question 8: How Do We Update the IEQ Models?
Despite the many IEQ models that have been developed, hardly any were employed again in later studies because the models, especially in terms of the weighting values of different IEQ factors, varied with the building types, occupants’ professions, the purposes of occupation, etc. However, the process will be prolonged and laborious if a new model is needed every time the IEQ in a building is evaluated. Besides, as mentioned in the above section, sometimes it is difficult to collect enough data to develop a model with sufficient accuracy. Langevin et al. [96] first proposed a Bayes theorem-based method to update existing models, using limited data to deal with these issues. They established a new relationship between PMV and PPD, contemporizing the PMV model with their newly collected data.
Similarly, Wong et al. [97] used the Bayesian approach to update Fanger’s PMV-PPD model to better fit the occupants’ thermal sensations, as collected in offices, classrooms, apartments, and elderly care centers. In these cases, the PPD calculated using Fanger’s model was the prior probability P(A) used in Bayes’ theorem. The dissatisfaction percentages that were calculated based on the survey data were represented by P(B) in Bayes’ theorem. According to Bayes’ theorem, the updated dissatisfied percentage (namely, the posterior probability) can be calculated using the following equations:
where k is the number of dissatisfaction cases and n is the number of collected instances. Applying the same approach, Tsang et al. [98] updated two IEQ models (one was a linear regression model, where four IEQ factors were equally weighted, and the other was a logistic regression model that referred to a previous study), using only 52 cases collected in residential buildings. With the Bayesian approach, the IEQ models developed by previous studies could be used as prior information for future IEQ performance models, offering material closer to the newly collected field data. This way, more accurate IEQ assessment models could be developed using minor amounts of data.
Besides the additional data, additional IEQ factors, apart from the four main aspects, were also suggested for inclusion in the IEQ model. It has been found that privacy, office layout, cleaning, and maintenance might influence occupants’ satisfaction with IEQ [99]. However, almost none of the existing IEQ models considered the impact of these factors on the overall IEQ performance, which might lead to discrepancies between the predicted and actual IEQ performances. To address this limitation, Wong et al. [11] first proposed an open IEQ acceptance model, which was more inclusive and accurate than ‘traditional IEQ models’ based on regression analyses. This open acceptance model adopted frequency distribution functions; the overall IEQ acceptance is calculated using Equation (23):
where is the occurrence probability of each condition; is the acceptance probability with each condition, determined by the collected data; is the number of IEQ factors that influence the overall IEQ satisfaction. For each factor, there are two possibilities: acceptable and unacceptable (the acceptance probability with each IEQ factor is ); therefore, the investigated environments can be classified into conditions. If we take the model with four IEQ factors ( = 4) as an example, the related information is shown in Table 2.
This open IEQ model is flexible to allow for the inclusion of additional IEQ factors and is feasible for revising previous models with newly collected data. Moreover, applying this open model is more straightforward because no regression analysis is needed.
Both Bayes’ theorem and the open acceptance model can be used to update previous models, given limited sets of new or additional data. By adopting these approaches, IEQ models can be updated globally using field data from different countries, to generate a model incorporating the field settings’ influence on IEQ performance.
3.9. Question 9: How do we Interpret the IEQ Models?
Although many IEQ models have been proposed and updated, not all provided a matched interpretation method (i.e., appropriate benchmarks) to indicate the significance of their final IEQ index. Some studies merely compared their results with previous, similar studies [15]. The European standard EN15251 (2007) [100] is commonly used among those studies that mentioned comparing the data with the benchmarks. This standard could be seen as the catalyst of studies on the IEQ assessment models since it first advocated an overall index to represent IEQ performance and then provided clear IEQ assessment categories (see Table 3). The determination of classes in this standard is based on occupants’ subjective expectations. Therefore, many indexes of the resulting IEQ models involved the occupants’ acceptance or satisfaction [14,39]. Based on this standard, some studies further developed their classification methods. For example, Ncube and Riffat [15] proposed an IEQ classification with five categories for rating office buildings, while Marino et al. [74] drew up an indoor quality classification with seven scales. However, the researchers’ opinions did not coincide with standard EN15251-2007. Olesen [101] pointed out several issues regarding this standard, such as its non-applicability to personalized environments due to its lacking different categories for light and acoustic requirements. Considering the weaknesses of this standard, it was withdrawn and then replaced by EN 16798-1:2019 [47].
Although the new standard provided more categories for the different indicators, the main IEQ categories did not change greatly; they still have four levels and are based on the occupants’ expectations. However, according to Niclo and Wilson [102], using occupants’ expectations as a classification basis might encourage closer control, which usually consumes more energy. Additionally, more categories mean narrower ranges. Arens et al. [103] believed that occupants’ acceptance was broader than the range defined by EN15251 (similar to EN16798-1), which will also cause unnecessary energy consumption. Therefore, to avoid these problems, Heinzerling et al. [8] proposed a straightforward classification system with only two categories: compliance and non-compliance.
Other studies also invented IEQ assessment categories to interpret the results of their IEQ models. For example, based on the percentage of dissatisfaction with total IEQ (i.e., the final index of their model), Mui and Chan [60] proposed a classification with three categories to divide the investigated offices into ‘above average’, ‘average’, and ‘below average’ levels. Mihai and Iordache [10] divided the measured classrooms into five classes, based on the IEQ indexes calculated using their IEQ model. Ncube and Riffat [15] also applied a five-category IEQ classification to assess the investigated office buildings with different boundary levels. However, most existing assessment criteria only focused on the overall IEQ index and seldom considered the assessment of individual IEQ aspects (except in the case of [74]). Moreover, almost none of these studies mentioned the reason or offered theoretical support to explain each class’s boundary settings, making these classifications appear groundless. Since it is impossible to compare the IEQ performance in a different building without a scientific classification methodology, a set of unified benchmarks with a theoretical basis and a clear definition of boundaries is still needed.
3.10. Question 10: Is One IEQ Model Enough for One Investigated Building/Space?
The occupants’ perceptions and preferences for IEQ differed greatly, depending on their characteristics (such as gender, profession, and nationality) and building-related factors (such as the type of building and area). Occupants in different countries had different opinions on the importance of varying IEQ indicators/aspects. For example, air movement was the second most important IEQ indicator to the French but was the least essential IEQ indicator to the Greeks; conversely, noise was significant to the Swedish but hardly mattered to the Portuguese [51]. In the same country, the importance ranking of different IEQ aspects regarding overall IEQ performance might also differ in other buildings [17], even when using the same model-build methods [48]. Mujan et al. [48] found that IAQ was the primary aspect of overall IEQ satisfaction in office buildings, followed by thermal, acoustic, and visual comfort. In contrast, thermal comfort was the primary aspect in education buildings, followed by IAQ, acoustic comfort, and visual comfort. Besides this, occupants in private residential buildings thought that air quality was more important than noise, while the opposite opinion was found among the occupants of public residential buildings [39].
Moreover, occupants’ opinions on IEQ aspects might also change with the area, even within the same types of buildings in the same city. For example, thermal comfort was identified as the dominant aspect determining the occupants’ IEQ acceptances in typical residential buildings in Hong Kong [49]. At the same time, visual quality was the most critical aspect for the occupants of tiny residential units [85]. Furthermore, even in the same building, the IEQ models developed might also be different; the hierarchy of the IEQ aspects depended on the occupants’ gender, the task performed by the occupants, the duration of their stay, and the location of the investigated area [41,74]. For example, end-users perceived odor as the most critical factor and thermal comfort as the least important factor. At the same time, the noise factor was considered essential to the professional group, and air cleanliness was the least important factor [41]. Occupants who sat in the interior zone thought that lighting conditions were more critical than thermal conditions, compared with those who sat in the perimeter zone who thought that thermal conditions were more important than lighting [38]. To sum up, it seems impossible to propose a universal IEQ model that applies to all occupants or all locations in one building, let alone to different types of buildings.
4. Discussion
As mentioned in several of the previous literature surveys [8], one limitation of the current IEQ model development is the need for more unified data collection and analysis methods. To increase the accuracy and applicability of the IEQ models, a standardized IEQ measurement and analysis procedure is needed. The final models might be different for the different types of occupants and the various kinds of buildings. However, the data collection techniques and analysis methods used should be integrated and standardized to build a universal scientific database that can continuously expand. A series of comprehensive weighting schemes can be developed for all types of buildings. Then, targeted and specific measures could be suggested to improve IEQ accordingly. Consistent data collection protocols are needed to achieve this goal, whereby IEQ indicators and the related temporal and spatial measurement strategies are clearly stated. A standardized questionnaire should also be provided. A widely applicable data analysis process with step-by-step instructions is also necessary. Moreover, considering the interaction effects between the IEQ aspects/indicators, all the potential IEQ influencing factors should be investigated together, and a unified, integrated data analysis method should be used.
Furthermore, previous studies found that different occupants respond differently to the same indoor environment because people differ; therefore, not all are satisfied by the same conditions. A field study conducted among more than 1000 Dutch schoolchildren identified six different types of schoolchildren, based on their different perceptions, needs, and preferences for IEQ in classrooms: ‘concerned with sound’, ‘concerned with smell- and sound’, ‘concerned with thermal temperatures and drafts’, ‘concerned with light levels’, ‘all concerned cluster’, and ‘nothing concerning’ [28]. Additionally, the subjects’ perceived importance of IEQ aspects changed according to the occupants’ gender [38], profession [41], education level [7], and the type of building wherein they were occupied [17]. Therefore, further work is needed to identify the different types of occupants, employing clustering analysis, then to build the IEQ models for other groups of occupants for various kinds of buildings. Such an analysis could identify the specific requirements or expectations of different types of occupants; based on these models, personalized working/studying environments can be provided.
The answers to the ten proposed questions in this study provided an overall picture of the current state of IEQ models and indicated that there are still research gaps in this field. Therefore, future studies are suggested, to be conducted focusing on the following issues:
- The research methods used to develop IEQ models varied greatly in previous studies and were rarely repeated. A standardized research framework needs to be set up to benchmark IEQ performance on a large scale, including a data measurement protocol, a questionnaire survey, and a data analysis approach targeted at the different data types. The framework should include the core structure and optional branches, which can be customized based on the different investigated building types. In addition to developing the framework, validation tests under other conditions are also necessary for future studies.
- Earlier studies discussed the controversial assessment criteria for IEQ performance and indicated a lack of guidance regarding defining the boundaries of IEQ assessment categories. Thus, a set of IEQ assessment criteria with clear definitions of boundary values and the rationales behind the descriptions is demanded. These criteria should be able to be applied to both individual IEQ aspects and the overall IEQ performance.
- Considering the differences between occupants, future studies are suggested to develop an IEQ model profile wherein occupants are classified into clusters, based on their IEQ perceptions, and different IEQ models are established for the other occupants. By making this happen, more targeted and effective IEQ-improving approaches can be provided, and energy can be managed rationally inside the building.
5. Conclusions
Many IEQ evaluation models have been developed over the past two decades. They have varied greatly, including IEQ aspects and indicators, data collection and analysis methods, etc. Most consider the four main elements of IEQ: IAQ, thermal comfort, visual quality, and acoustic quality. However, more IEQ aspects (such as layout and furnishing) were also relevant to the overall IEQ performance, suggesting that they should be considered in future studies. The IEQ model is an effective and valuable tool with which to merge all the IEQ aspects into one summative index, which could assist building designers and managers in designing and maintaining a comfortable indoor environment. Several studies mainly used data collection (such as on-site measurement, questionnaire surveys, and simulation) and data analysis methods (such as regression analysis, AHP, and SEM) were summarized in the current study, which showed a need for a more uniform methodology. Moreover, two IEQ model-updating methods—the Bayesian approach and the open IEQ acceptance model—were presented, which could incorporate quantitative data (such as cleanliness and layout) and continuously revise the existing model with new data. Hence, they are potential methods for future IEQ model development.
This study summarized all the procedures involved in developing IEQ models in ten questions. The answers to these questions will help to promote IEQ model development and eventually integrate the IEQ models into a comprehensive profile that provides a reference for building operation, maintenance, and design.
Author Contributions
Conceptualization, D.Z. and L.-T.W.; methodology, D.Z. and L.-T.W.; writing—original draft preparation, D.Z.; writing—review and editing, K.-W.M. and L.-T.W.; supervision, K.-W.M. and L.-T.W.; project administration and funding, K.-W.M. and L.-T.W. All authors have read and agreed to the published version of the manuscript.
Funding
This research was funded by the General Research Fund (Project no. 15217221, PolyU P0037773/Q86B), the Collaborative Research Fund (CRF) COVID-19 (Project no. PolyU P0033675/C5108-20G), Research Grants Council of the Hong Kong Special Administrative Region, China, and partially supported by PolyU internal fund (P0043713 and P0043831).
Institutional Review Board Statement
Not applicable.
Informed Consent Statement
Not applicable.
Data Availability Statement
No data were collected in this study.
Conflicts of Interest
The authors declare no conflict of interest.
Abbreviations
The following abbreviations are used in this manuscript:
| IEQ | Indoor environmental quality |
| IAQ | Indoor air quality |
| VOC | Volatile organic compounds |
| PM2.5 | Particles that are 2.5 microns or less in diameter |
| CBE | Center for the Built Environment |
| PMV | Predicted mean vote |
| Top | Operative temperature |
| SPL | Sound pressure level |
| PPD | Percentage of dissatisfied |
| TSV | Thermal sensation vote |
| TVOC | Total volatile organic compounds |
| HCHO | Formaldehyde |
| RT | Reverberation time |
| STI | Speech transmission index |
| E | Illuminance |
| AHP | Analytical hierarchy process |
| FCE | Fuzzy comprehensive evaluation |
| SEM | Structural equation modeling |
| ANN | Artificial neural networks |
| LCA | Life cycle assessment |
References
- Chiang, C.M.; Chou, P.C.; Lai, C.M.; Li, Y.Y. A methodology to assess the indoor environment in care centers for senior citizens. Build. Environ. 2001, 36, 561–568. [Google Scholar] [CrossRef]
- Feige, A.; Wallbaum, H.; Janser, M.; Windlinger, L. Impact of sustainable office buildings on occupant’s comfort and productivity. J. Corp. Real Estate 2013, 15, 7–34. [Google Scholar] [CrossRef]
- al Horr, Y.; Arif, M.; Kaushik, A.; Mazroei, A.; Katafygiotou, M.; Elsarrag, E. Occupant productivity and office indoor environment quality: A review of the literature. Build. Environ. 2016, 105, 369–389. [Google Scholar] [CrossRef] [Green Version]
- Wyon, D.P.; Wargocki, P. Room temperature effects on office work. In Creating the Productive Workplace; Taylor & Francis: London, UK, 2006; pp. 209–220. [Google Scholar]
- Heinzerling, D.Z. Commercial Building Indoor Environmental Quality Evaluation: Methods and Tools (Master’s Thesis). 2012. Available online: http://escholarship.org/uc/item/2f6562gr (accessed on 11 November 2022).
- Roumi, S.; Zhang, F.; Stewart, R.A. Global Research Trends on Building Indoor Environmental Quality Modelling and Indexing Systems—A Scientometric Review. Energies 2022, 15, 4494. [Google Scholar] [CrossRef]
- Frontczak, M.; Wargocki, P. Literature survey on how different factors influence human comfort in indoor environments. Build. Environ. 2011, 46, 922–937. [Google Scholar] [CrossRef]
- Heinzerling, D.; Schiavon, S.; Webster, T.; Arens, E. Indoor environmental quality assessment models: A literature review and a proposed weighting and classification scheme. Build. Environ. 2013, 70, 210–222. [Google Scholar] [CrossRef] [Green Version]
- Roumi, S.; Zhang, F.; Stewart, R.A.; Santamouris, M. Commercial building indoor environmental quality models: A critical review. Energy Build. 2022, 263, 112033. [Google Scholar] [CrossRef]
- Mihai, T.; Iordache, V. Determining the Indoor Environment Quality for an Educational Building. Energy Procedia 2016, 85, 566–574. [Google Scholar] [CrossRef] [Green Version]
- Wong, L.T.; Mui, K.W.; Tsang, T.W. An open acceptance model for indoor environmental quality (IEQ). Build. Environ. 2018, 142, 371–378. [Google Scholar] [CrossRef]
- van Eck, N.J.; Waltman, L. Software survey: VOSviewer, a computer program for bibliometric mapping. Scientometrics 2010, 84, 523–538. [Google Scholar] [CrossRef] [Green Version]
- Cao, B.; Ouyang, Q.; Zhu, Y.; Huang, L.; Hu, H.; Deng, G. Development of a multivariate regression model for overall satisfaction in public buildings based on field studies in Beijing and Shanghai. Build. Environ. 2012, 47, 394–399. [Google Scholar] [CrossRef]
- Wong, L.T.; Mui, K.W.; Hui, P.S. A multivariate-logistic model for acceptance of indoor environmental quality (IEQ) in offices. Build. Environ. 2008, 43, 1–6. [Google Scholar] [CrossRef]
- Ncube, M.; Riffat, S. Developing an indoor environment quality tool for assessment of mechanically ventilated office buildings in the UK—A preliminary study. Build. Environ. 2012, 53, 26–33. [Google Scholar] [CrossRef] [Green Version]
- Fassio, F.; Fanchiotti, A.; de Lieto Vollaro, R. Linear, non-linear and alternative algorithms in the correlation of IEQ factors with global comfort: A case study. Sustainability 2014, 6, 8113–8127. [Google Scholar] [CrossRef] [Green Version]
- Leccese, F.; Rocca, M.; Salvadori, G.; Belloni, E.; Buratti, C. Towards a holistic approach to indoor environmental quality assessment: Weighting schemes to combine effects of multiple environmental factors. Energy Build. 2021, 245, 111056. [Google Scholar] [CrossRef]
- Bluyssen, P.M.; Zhang, D.; Ortiz, M. Self-reported rhinitis and headaches of students from universities in Taiwan, Chile, Suriname, China and the Netherlands, and its association with their home environment. Intell. Build. Int. 2021, 14, 679–689. [Google Scholar] [CrossRef]
- Bluyssen, P.M.; Zhang, D.; Kurvers, S.; Overtoom, M.; Ortiz-Sanchez, M. Self-reported health and comfort of school children in 54 classrooms of 21 Dutch school buildings. Build. Environ. 2018, 138, 106–123. [Google Scholar] [CrossRef]
- Mujan, I.; Anđelković, A.S.; Munćan, V.; Kljajić, M.; Ružić, D. Influence of indoor environmental quality on human health and productivity—A review. J. Clean. Prod. 2019, 217, 646–657. [Google Scholar] [CrossRef]
- Franke, M.; Nadler, C. Towards a holistic approach for assessing the impact of IEQ on satisfaction, health, and productivity. Build. Res. Inf. 2020, 49, 417–444. [Google Scholar] [CrossRef]
- Porras-Salazar, J.A.; Wyon, D.P.; Piderit-Moreno, B.; Contreras-Espinoza, S.; Wargocki, P. Reducing classroom temperature in a tropical climate improved the thermal comfort and the performance of elementary school pupils. Indoor Air 2018, 28, 892–904. [Google Scholar] [CrossRef]
- Wong, S.-K.; Lai, L.W.-C.; Ho, D.C.-W.; Chau, K.-W.; Lam, C.L.-K.; Ng, C.H.-F. Sick building syndrome and perceived indoor environmental quality: A survey of apartment buildings in Hong Kong. Habitat Int. 2009, 33, 463–471. [Google Scholar] [CrossRef] [PubMed]
- Hu, J.; He, Y.; Hao, X.; Li, N.; Su, Y.; Qu, H. Optimal temperature ranges considering gender differences in thermal comfort, work performance, and sick building syndrome: A winter field study in university classrooms. Energy Build. 2022, 254, 111554. [Google Scholar] [CrossRef]
- Fisk, W.J. Health and productivity gains from better indoor environments and their relationship with building energy efficiency. Annu. Rev. Energy Environ. 2000, 25, 537–566. [Google Scholar] [CrossRef] [Green Version]
- Pyke, C.; Mcmahon, S.; Dietsche, T. Green Building and Human Experience Testing Green Building Strategies with Volunteered Geographic Information; U.S. Green Building Counci: Washington, DC, USA, 2010. [Google Scholar]
- Kats, G.; Alevantis, L. The Costs and Financial Benefits of Green Buildings a Report to California’s Sustainable Building Task Force. 2003. Available online: https://noharm-uscanada.org/sites/default/files/documents-files/34/Building_Green_Costs_Benefits.pdf (accessed on 14 November 2022).
- Zhang, D.; Ortiz, M.A.; Bluyssen, P.M. Clustering of Dutch school children based on their preferences and needs of the IEQ in classrooms. Build. Environ. 2019, 147, 258–266. [Google Scholar] [CrossRef]
- Korsavi, S.S.; Montazami, A.; Mumovic, D. The impact of indoor environment quality (IEQ) on school children’s overall comfort in the UK; a regression approach. Build. Environ. 2020, 185, 107309. [Google Scholar] [CrossRef]
- Haverinen-Shaughnessy, U.; Shaughnessy, R.J.; Cole, E.C.; Toyinbo, O.; Moschandreas, D.J. An assessment of indoor environmental quality in schools and its association with health and performance. Build. Environ. 2015, 93, 35–40. [Google Scholar] [CrossRef]
- Turunen, M.; Toyinbo, O.; Putus, T.; Nevalainen, A.; Shaughnessy, R.; Haverinen-Shaughnessy, U. Indoor environmental quality in school buildings, and the health and wellbeing of students. Int. J. Hyg. Environ. Health 2013, 217, 733–739. [Google Scholar] [CrossRef]
- Haverinen-Shaughnessy, U.; Shaughnessy, R.J. Effects of classroom ventilation rate and temperature on students’ test scores. PLoS ONE 2015, 10, e0136165. [Google Scholar] [CrossRef]
- Baloch, R.M.; Nichole Maesano, C.; Christoffersen, J.; Mandin, C.; Csobod, E.; de Oliveira Fernandes, E.; Annesi-Maesano, I.; on behalf of the SINPHONIE Consortium. Daylight and School Performance in European Schoolchildren. Int. J. Environ. Res. Public Health 2021, 18, 258. [Google Scholar] [CrossRef]
- Sala, E.; Rantala, L. Acoustics and activity noise in school classrooms in Finland. Appl. Acoust. 2016, 114, 252–259. [Google Scholar] [CrossRef]
- Chatzidiakou, L.; Mumovic, D.; Summerfield, A.J. What do we know about indoor air quality in school classrooms? A critical review of the literature. Intell. Build. Int. 2012, 4, 228–259. [Google Scholar] [CrossRef]
- Sadrizadeh, S.; Yao, R.; Yuan, F.; Awbi, H.; Bahnfleth, W.; Bi, Y.; Cao, G.; Croitoru, C.; de Dear, R.; Haghighat, F.; et al. Indoor air quality and health in schools: A critical review for developing the roadmap for the future school environment. J. Build. Eng. 2022, 57, 104908. [Google Scholar] [CrossRef]
- Rosbach, J.T.; Vonk, M.; Duijm, F.; van Ginkel, J.T.; Gehring, U.; Brunekreef, B. A ventilation intervention study in classrooms to improve indoor air quality: The FRESH study. Environ. Health 2013, 12, 110. [Google Scholar] [CrossRef] [Green Version]
- Choi, J.H.; Aziz, A.; LoftnessLoftness, V. Decision support for improving occupant environmental satisfaction in office buildings: The relationship between sub-set of IEQ satisfaction and overall environmental satisfaction. In Proceedings of the 9th International Conference Healthy Buildings, Syracuse, NY, USA, 13–17 September 2009. [Google Scholar]
- Lai, J.H.K.; Yik, F.W.H. Perception of importance and performance of the indoor environmental quality of high-rise residential buildings. Build. Environ. 2009, 44, 352–360. [Google Scholar] [CrossRef]
- Kim, J.; de Dear, R. Nonlinear relationships between individual IEQ factors and overall workspace satisfaction. Build. Environ. 2012, 49, 33–40. [Google Scholar] [CrossRef] [Green Version]
- Lai, J.H.K.; Yik, F.W.H. Perceived importance of the quality of the indoor environment in commercial buildings. Indoor Built Environ. 2007, 16, 311–321. [Google Scholar] [CrossRef]
- Tahsildoost, M.; Zomorodian, Z.S. Indoor environment quality assessment in classrooms: An integrated approach. J. Build. Phys. 2018, 42, 336–362. [Google Scholar] [CrossRef]
- Standard 55-2020; ANSI/ASHRAE—Thermal Environmental Conditions for Human Occupancy. ASHRAE: Peachtree Corners, GA, USA, 2020.
- ISO 8995-1; 2002 Lighting of Work Places—Part 1: Indoor. ISO: Vienna, Austria, 2002.
- BS 8233; 2014 Guidance on Sound Insulation and Noise Reduction for Buildings. The British Standards Institution: London, UK, 2014.
- Standard 62.2-2022; ASHRAE—Ventilation and Acceptable Indoor Air Quality in Residential Buildings. ASHRAE: Peachtree Corners, GA, USA, 2022.
- EN 16798-1 2019; Energy Performance of Buildings—Ventilation for Buildings—Part 1: Indoor Environmental Input Parameters for Design and Assessment of Energy Performance of Buildings Addressing Indoor Air Quality, Thermal Environment, Lighting and Acoustics. CEN: Brussels, Belgium, 2019.
- Mujan, I.; Licina, D.; Kljajić, M.; Čulić, A.; Anđelković, A.S. Development of indoor environmental quality index using a low-cost monitoring platform. J. Clean. Prod. 2021, 312, 127846. [Google Scholar] [CrossRef]
- Lai, A.C.K.; Mui, K.W.; Wong, L.T.; Law, L.Y. An evaluation model for indoor environmental quality (IEQ) acceptance in residential buildings. Energy Build. 2009, 41, 930–936. [Google Scholar] [CrossRef]
- Yang, D.; Mak, C.M. Relationships between indoor environmental quality and environmental factors in university classrooms. Build. Environ. 2020, 186, 107331. [Google Scholar] [CrossRef]
- Humphreys, M.A. Quantifying occupant comfort: Are combined indices of the indoor environment practicable? Build. Res. Inf. 2005, 33, 317–325. [Google Scholar] [CrossRef]
- Piasecki, M. Practical implementation of the indoor environmental quality model for the assessment of nearly zero energy single-family building. Buildings 2019, 9, 214. [Google Scholar] [CrossRef] [Green Version]
- Piasecki, M.; Kostyrko, K.B. Indoor environmental quality assessment, part 2: Model reliability analysis. J. Build. Phys. 2018, 42, 288–315. [Google Scholar] [CrossRef]
- Piasecki, M.; Kostyrko, K.; Pykacz, S. Indoor environmental quality assessment: Part 1: Choice of the indoor environmental quality sub-component models. J. Build. Phys. 2017, 41, 264–289. [Google Scholar] [CrossRef]
- Piasecki, M.; Radziszewska-Zielina, E.; Czerski, P.; Fedorczak-Cisak, M.; Zielina, M.; Krzyściak, P.; Kwaśniewska-Sip, P.; Grześkowiak, W. Implementation of the indoor environmental quality (Ieq) model for the assessment of a retrofitted historical masonry building. Energies 2020, 13, 6051. [Google Scholar] [CrossRef]
- Buratti, C.; Belloni, E.; Merli, F.; Ricciardi, P. A new index combining thermal, acoustic, and visual comfort of moderate environments in temperate climates. Build. Environ. 2018, 139, 27–37. [Google Scholar] [CrossRef]
- Huang, L.; Zhu, Y.; Ouyang, Q.; Cao, B. A study on the effects of thermal, luminous, and acoustic environments on indoor environmental comfort in offices. Build. Environ. 2012, 49, 304–309. [Google Scholar] [CrossRef]
- Xu, H.; Huang, Q.; Zhang, Q. A study and application of the degree of satisfaction with indoor environmental quality involving a building space factor. Build. Environ. 2018, 143, 227–239. [Google Scholar] [CrossRef]
- Huang, M.; Liao, Y. Development of an indoor environment evaluation model for heating, ventilation and air-conditioning control system of office buildings in subtropical region considering indoor health and thermal comfort. Indoor Built Environ. 2022, 31, 807–819. [Google Scholar] [CrossRef]
- Mui, K.W.; Chan, W.T. A new indoor environmental quality equation for air-conditioned buildings. Archit. Sci. Rev. 2005, 48, 41–46. [Google Scholar] [CrossRef]
- Bluyssen, P.M.; Zhang, D.; Kim, D.H.; Eijkelenboom, A.; Ortiz-Sanchez, M. First SenseLab studies with primary school children: Exposure to different environmental configurations in the experience room. Intell. Build. Int. 2019, 13, 275–292. [Google Scholar] [CrossRef] [Green Version]
- ASHRAE. ASHRAE Terminology A Comprehensive Glossary of Terms for the Built Environment; ASHRAE: Peachtree Corners, GA, USA, 2022. [Google Scholar]
- Zagreus, L.; Huizenga, C.; Arens, E.; Lehrer, D. Listening to the occupants: A Web-based indoor environmental quality survey. Indoor Air 2004, 14, 65–74. [Google Scholar] [CrossRef] [Green Version]
- Cheung, T.; Schiavon, S.; Graham, L.T.; Tham, K.W. Occupant satisfaction with the indoor environment in seven commercial buildings in Singapore. Build. Environ. 2021, 188, 107443. [Google Scholar] [CrossRef]
- Kim, H.; Haberl, J.S. Field-Test of the New ASHRAE/CIBSE/USGBC Performance Measurement Protocols for Commercial Buildings: Basic Level. ASHRAE Trans. 2012, 118, 135. [Google Scholar]
- Lolli, F.; Marinello, S.; Coruzzolo, A.M.; Butturi, M.A. Post-Occupancy Evaluation’s (POE) Applications for Improving Indoor Environment Quality (IEQ). Toxics 2022, 10, 626. [Google Scholar] [CrossRef]
- Hunn, B.D.; Haberl, J.S.; Davies, H.; Owens, B. Measuring Commercial Building Performance: Protocols for energy, water, and indoor environmental quality. ASHRAE J. 2012, 54, 48–56. [Google Scholar]
- Malmqvist, T. Environmental rating methods: Selecting indoor environmental quality (IEQ) aspects and indicators. Build. Res. Inf. 2008, 36, 466–485. [Google Scholar] [CrossRef]
- Chiang, C.-M.; Lai, C.-M. A study on the comprehensive indicator of indoor environment assessment for occupants’ health in Taiwan. Build. Environ. 2002, 37, 387–392. [Google Scholar] [CrossRef]
- Fanger, P.O. Thermal Comfort: Analysis and Application in Environmental Engineering; Danish Technical Press: Copenhagen, Denmark, 1970. [Google Scholar]
- Riffelli, S. A Wireless Indoor Environmental Quality Logger Processing the Indoor Global Comfort Index. Sensors 2022, 22, 2558. [Google Scholar] [CrossRef]
- Nimlyat, P.S. Indoor environmental quality performance and occupants’ satisfaction [IEQPOS] as assessment criteria for green healthcare building rating. Build. Environ. 2018, 144, 598–610. [Google Scholar] [CrossRef]
- Pei, Z.; Lin, B.; Liu, Y.; Zhu, Y. Comparative study on the indoor environment quality of green office buildings in China with a long-term field measurement and investigation. Build. Environ. 2015, 84, 80–88. [Google Scholar] [CrossRef]
- Marino, C.; Nucara, A.; Pietrafesa, M. Proposal of comfort classification indexes suitable for both single environments and whole buildings. Build. Environ. 2012, 57, 58–67. [Google Scholar] [CrossRef]
- Yang, D.; Mak, C.M. An assessment model of classroom acoustical environment based on fuzzy comprehensive evaluation method. Appl. Acoust. 2017, 127, 292–296. [Google Scholar] [CrossRef]
- Catalina, T.; Iordache, V. IEQ assessment on schools in the design stage. Build. Environ. 2012, 49, 129–140. [Google Scholar] [CrossRef]
- Ricciardi, P.; Buratti, C. Environmental quality of university classrooms: Subjective and objective evaluation of the thermal, acoustic, and lighting comfort conditions. Build. Environ. 2018, 127, 23–36. [Google Scholar] [CrossRef]
- Zhang, D.; Ding, E.; Bluyssen, P.M. Guidance to assess ventilation performance of a classroom based on CO2 monitoring. Indoor Built Environ. 2022, 31, 1107–1126. [Google Scholar] [CrossRef]
- Portney, L.G.; Watkins, M.P. Foundations of Clinical Research: Applications to Practice, 3rd ed.; Prentice Hall Health: Upper Saddle River, NJ, USA, 2009. [Google Scholar]
- Sakellaris, I.A.; Saraga, D.E.; Mandin, C.; Roda, C.; Fossati, S.; De Kluizenaar, Y.; Carrer, P.; Dimitroulopoulou, S.; Mihucz, V.G.; Szigeti, T.; et al. Perceived indoor environment and occupants’ comfort in European ‘Modern’ office buildings: The OFFICAIR Study. Int. J. Environ. Res. Public Health 2016, 13, 444. [Google Scholar] [CrossRef] [Green Version]
- Korsavi, S.S.; Zomorodian, Z.S.; Tahsildoost, M. Visual comfort assessment of daylit and sunlit areas: A longitudinal field survey in classrooms in Kashan, Iran. Energy Build. 2016, 128, 305–318. [Google Scholar] [CrossRef]
- Tang, H.; Ding, Y.; Singer, B. Interactions and comprehensive effect of indoor environmental quality factors on occupant satisfaction. Build. Environ. 2020, 167, 106462. [Google Scholar] [CrossRef]
- de Dear, R.; Brager, G.S. Developing an Adaptive Model of Thermal Comfort and Preference; Center for the Built Environment: Berkeley, CA, USA, 1998. [Google Scholar]
- Carlucci, S.; Bai, L.; de Dear, R.; Yang, L. Review of adaptive thermal comfort models in built environmental regulatory documents. Build. Environ. 2018, 137, 73–89. [Google Scholar] [CrossRef] [Green Version]
- Mui, K.W.; Tsang, T.W.; Wong, L.T.; Yu, Y.P.W. Evaluation of an indoor environmental quality model for very small residential units. Indoor Built Environ. 2019, 28, 470–478. [Google Scholar] [CrossRef]
- Bluyssen, P.M. Towards an integrated analysis of the indoor environmental factors and its effects on occupants. Intell. Build. Int. 2020, 12, 199–207. [Google Scholar] [CrossRef]
- Nimlyat, P.S.; Isa, A.A.; Gofwen, N.C. Performance Indicators of Indoor Environmental Quality (IEQ) Assessment in Hospital Buildings: A Confirmatory Factor Analysis (CFA) Approach. ATBU J. Sci. Technol. 2017, 10, 139–159. [Google Scholar]
- Tekce, I.; Ergen, E.; Artan, D. Structural Equation Model of Occupant Satisfaction for Evaluating the Performance of Office Buildings. Arab. J. Sci. Eng. 2020, 45, 8759–8784. [Google Scholar] [CrossRef]
- Sofuoglu, S.C. Application of artificial neural networks to predict prevalence of building-related symptoms in office buildings. Build. Environ. 2008, 43, 1121–1126. [Google Scholar] [CrossRef] [Green Version]
- Humphreys, M.; Nicol, F. Self-Assessed Productivity and the Office Environment: Monthly Surveys in Five European Countries. ASHRAE Trans. 2007, 113, 606. [Google Scholar]
- Wargocki, P.; Wyon, D.P. Providing better thermal and air quality conditions in school classrooms would be cost-effective. Build. Environ. 2013, 59, 581–589. [Google Scholar] [CrossRef]
- Haverinen-Shaughnessy, U.; Moschandreas, D.J.; Shaughnessy, R.J. Association between substandard classroom ventilation rates and students’ academic achievement. Indoor Air 2011, 21, 121–131. [Google Scholar] [CrossRef]
- Aumann, D.; Heschong, L.; Wright, R.; Peet, R. Windows and Classrooms: Student Performance and the Indoor Environment. In Proceedings of the 2004 ACEEE Summer Study, Pacific Grove, CA, USA, 22–27 August 2004. [Google Scholar]
- Zhang, D.; Tenpierik, M.; Bluyssen, P.M. Interaction effect of background sound type and sound pressure level on children of primary schools in the Netherlands. Appl. Acoust. 2019, 154, 161–169. [Google Scholar] [CrossRef]
- Shan, X.; Melina, A.N.; Yang, E.H. Impact of indoor environmental quality on students’ wellbeing and performance in educational building through life cycle costing perspective. J. Clean. Prod. 2018, 204, 298–309. [Google Scholar] [CrossRef]
- Langevin, J.; Wen, J.; Gurian, P.L. Modeling thermal comfort holistically: Bayesian estimation of thermal sensation, acceptability, and preference distributions for office building occupants. Build. Environ. 2013, 69, 206–226. [Google Scholar] [CrossRef]
- Wong, L.T.; Mui, K.W.; Cheung, C.T. Bayesian thermal comfort model. Build. Environ. 2014, 82, 171–179. [Google Scholar] [CrossRef]
- Tsang, T.W.; Mui, K.W.; Wong, L.T.; Yu, W. Bayesian updates for indoor environmental quality (IEQ) acceptance model for residential buildings. Intell. Build. Int. 2021, 13, 17–32. [Google Scholar] [CrossRef]
- Bae, S.; Asojo, A.; Guerin, D.; Martin, C. A Post Occupancy Evaluation of the impact of indoor environmental quality on health and well-being in office buildings. J. Organ. Psychol. 2017, 17, 25–36. [Google Scholar]
- EN 15251; Indoor Environmental Input Parameters for Design and Assessment of Energy Performance of Buildings Addressing Indoor Air Quality, Thermal Environment, Lighting and Acoustics. CEN: Brussels, Belgium, 2007.
- Olesen, B.W. Revision of EN 15251: Indoor environmental criteria. REHVA J. 2012, 49, 6–12. [Google Scholar]
- Nicol, J.F.; Wilson, M. A critique of European Standard EN 15251: Strengths, weaknesses and lessons for future standards. Build. Res. Inf. 2011, 39, 183–193. [Google Scholar] [CrossRef]
- Arens, E.; Humphreys, M.A.; de Dear, R.; Zhang, H. Are ‘class A’ temperature requirements realistic or desirable? Build. Environ. 2010, 45, 4–10. [Google Scholar] [CrossRef] [Green Version]
Figure 1.
The number of publications on indoor environmental quality assessments.

Figure 2.
High-frequency items occurring in the abstracts. Note: Colors indicate the cluster to which an item was assigned by the clustering technique that is used by the VOSviewer, while the circle’s size represents the related item’s research frequency [12].
Figure 2.
High-frequency items occurring in the abstracts. Note: Colors indicate the cluster to which an item was assigned by the clustering technique that is used by the VOSviewer, while the circle’s size represents the related item’s research frequency [12].

Figure 3.
High-frequency items occurring in the various abstracts.


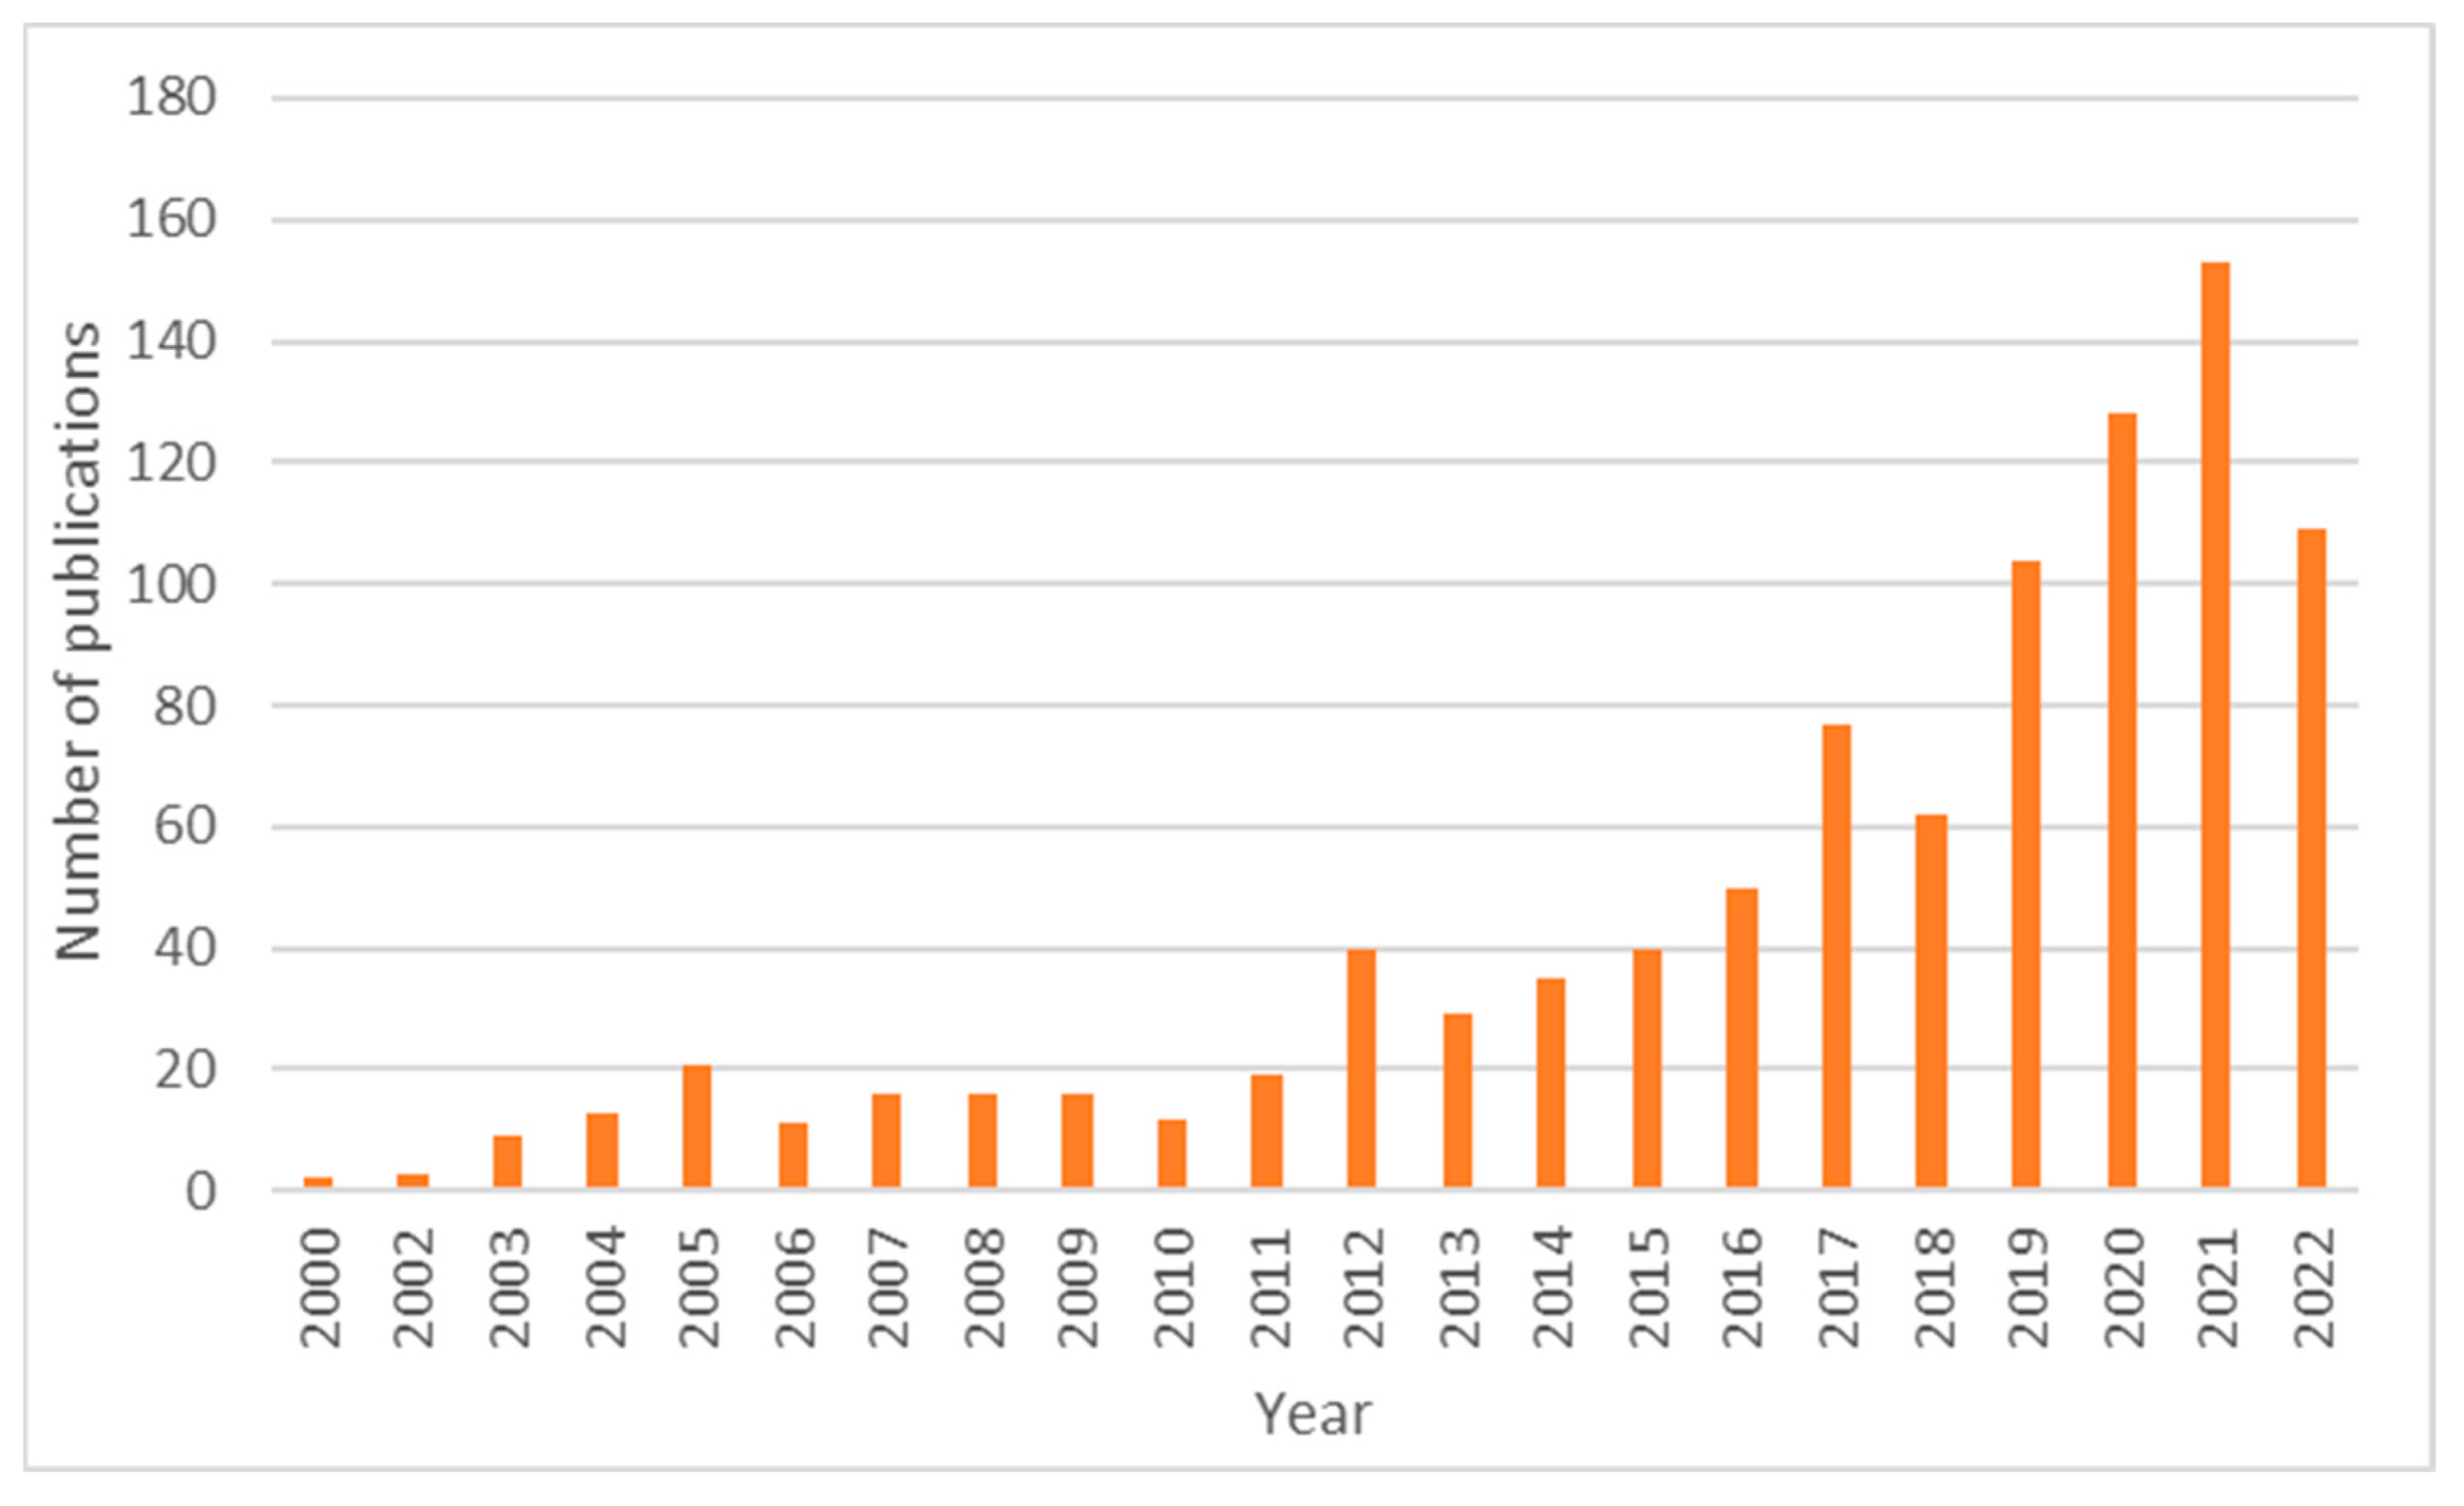
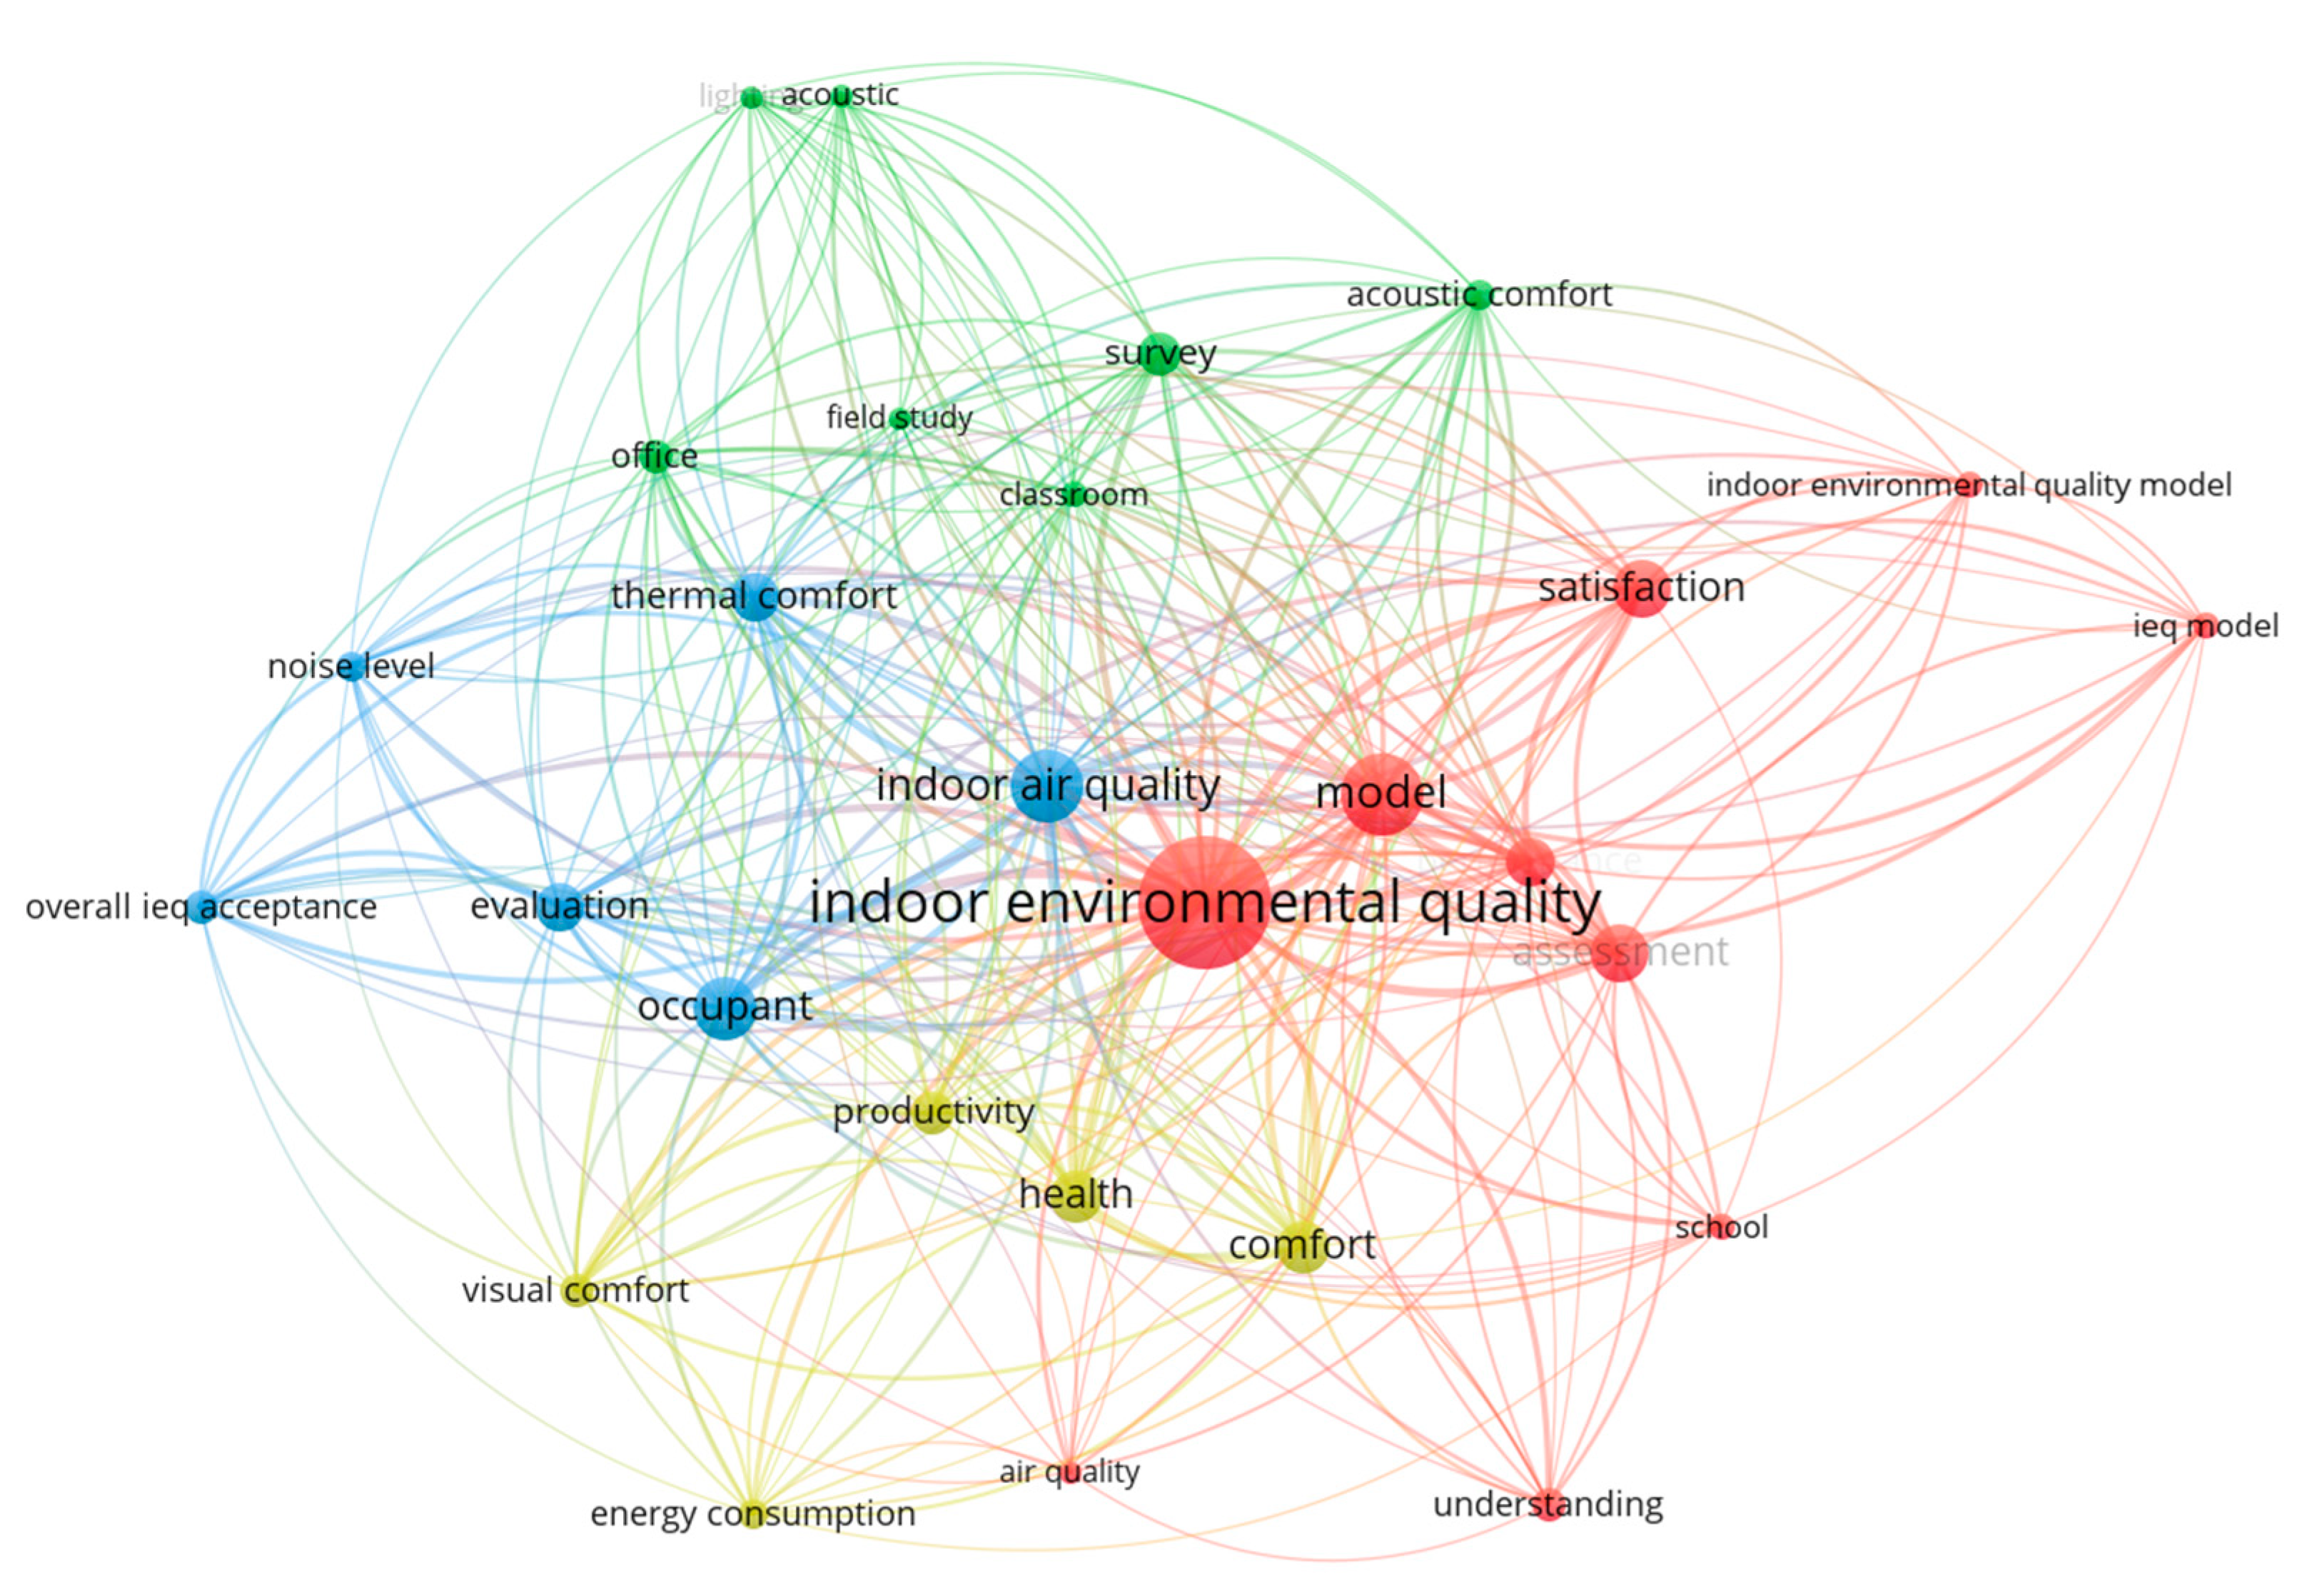
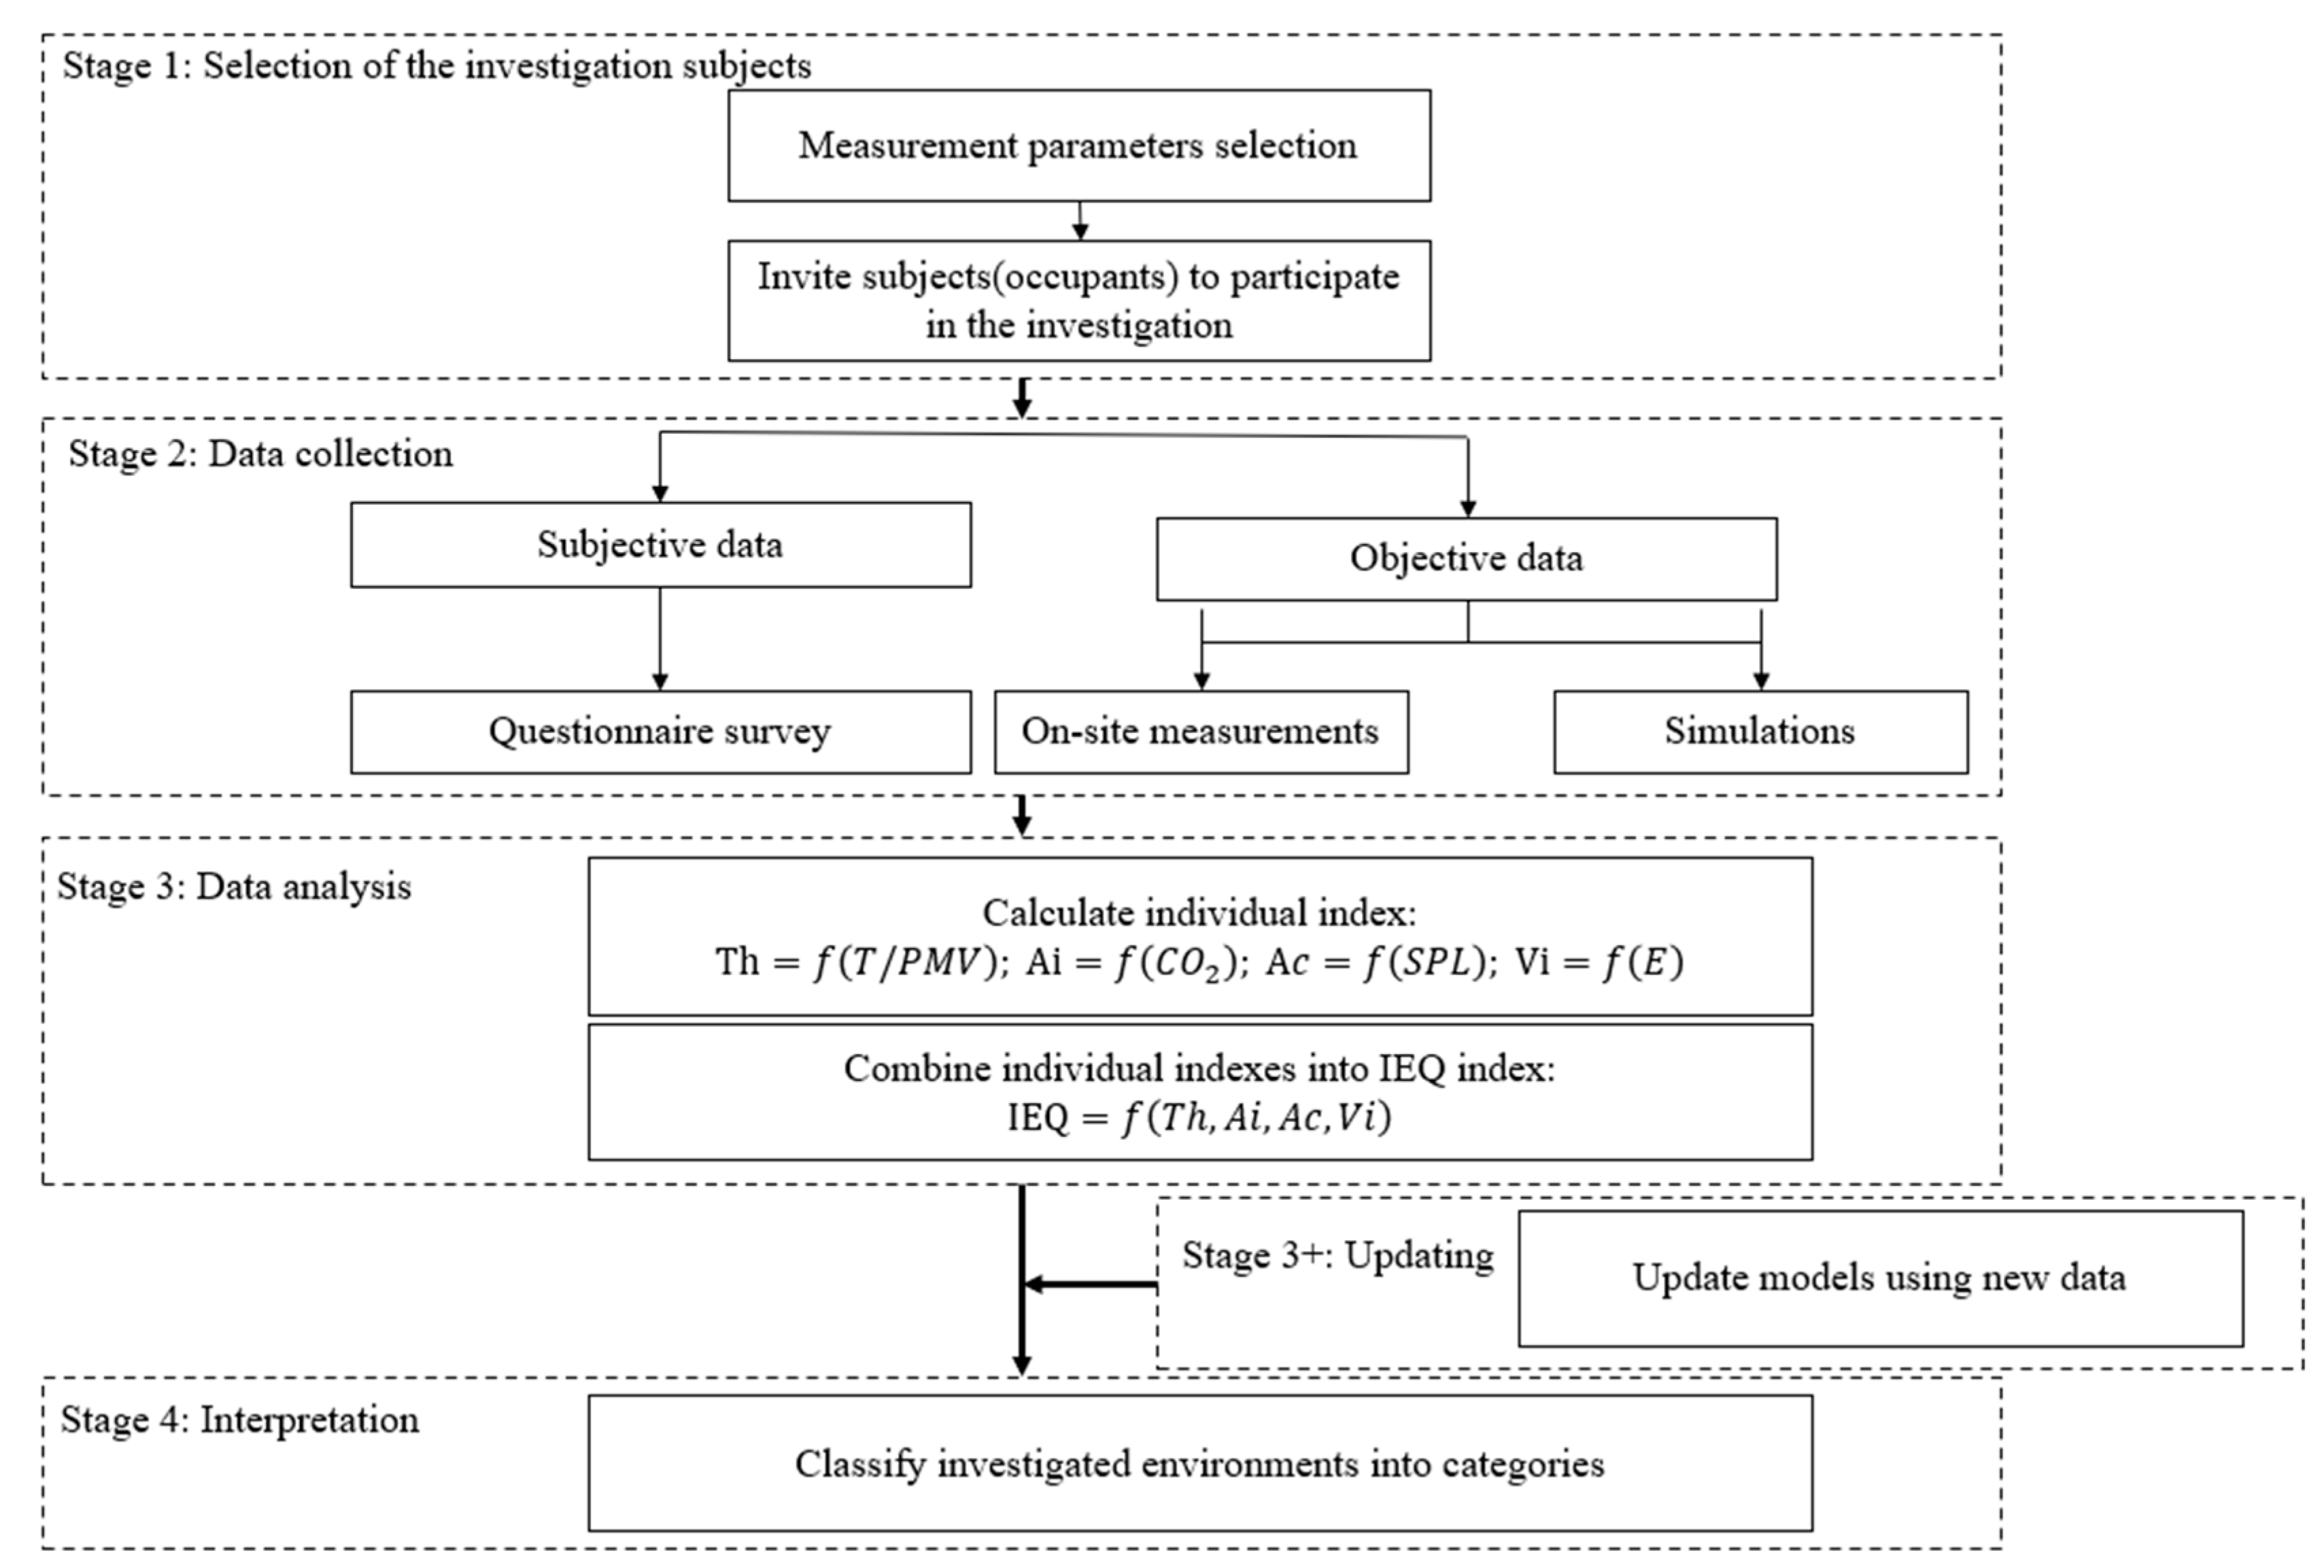
Table 1.
Summary of normalized weighting schemes used in the existing models.
| Reference | Building Type | Thermal | Air | Acoustic | Visual |
|---|---|---|---|---|---|
| Mui and Chan (2005) [60] | Office | 0.53 | 0.11 | 0.35 | / |
| Wong et al. (2008) [14] | Office | 0.31 | 0.25 | 0.24 | 0.19 |
| Humphreys (2005) [51] | Office | 0.42 | 0.39 | 0.14 | 0.05 |
| Lai and Yik (2009) [39] | Residents | 0.34 | 0.22 | 0.22 | 0.22 |
| Lai et al. (2009) [38] | Residents | 0.38 | 0.03 | 0.38 | 0.21 |
| Cao et al. (2012) [13] | Office and education | 0.39 | 0.14 | 0.27 | 0.20 |
| Ncube and Riffat (2012) [15] | Office | 0.30 | 0.36 | 0.18 | 0.16 |
| Catalina and Iordache (2012) [76] | Education | 0.25 | 0.25 | 0.25 | 0.25 |
| Heinzerling et al. (2013) [8] | Commercial | 0.12 | 0.20 | 0.39 | 0.29 |
| Fassio et al. (2014) [16] | Education | 0.31 | 0.25 | 0.24 | 0.19 |
| Mihai and Iordache (2016) [10] | Education | 0.25 | 0.26 | 0.24 | 0.24 |
| Piaseck et al. (2017) [54] | Office | 0.25 | 0.25 | 0.25 | 0.25 |
| Pontip Stephen Nimlyat (2018) [72] | Hospital | 0.31 | 0.21 | 0.25 | 0.24 |
| Tahsildoost and Zomorodia (2018) [42] | Education | 0.31 | 0.16 | 0.24 | 0.29 |
| Buratti et al. (2018) [56] | Education | 0.35 | / | 0.35 | 0.30 |
| Mui et al. (2019) [85] | Residents | 0.17 | 0.01 | 0.27 | 0.56 |
| Yang and Mak (2020) [50] | Education | 0.32 | 0.16 | 0.28 | 0.24 |
| Piasecki et al. (2020) [55] | Education | 0.25 | 0.25 | 0.25 | 0.25 |
| Mujan et al. (2021) [48] | Office | 0.29 | 0.35 | 0.20 | 0.17 |
| Stefano Riffelli (2022) [71] | Education | 0.37 | 0.30 | 0.16 | 0.17 |
Table 2.
IEQ acceptance model.
| Conditions | Occurrence Probability | Acceptance Probability | ||||
|---|---|---|---|---|---|---|
| = 1 | = 2 | = 3 | = 4 | |||
| 1 | 0 | 0 | 0 | 0 | ) | |
| 2 | 0 | 0 | 0 | 1 | ||
| 3 | 0 | 0 | 1 | 0 | ) | |
| 4 | 0 | 0 | 1 | 1 | ||
| 5 | 0 | 1 | 0 | 0 | ) | |
| 6 | 0 | 1 | 0 | 1 | ||
| 7 | 0 | 1 | 1 | 0 | ) | |
| 8 | 0 | 1 | 1 | 1 | ||
| 9 | 1 | 0 | 0 | 0 | ) | |
| 10 | 1 | 0 | 0 | 1 | ||
| 11 | 1 | 0 | 1 | 0 | ) | |
| 12 | 1 | 0 | 1 | 1 | ||
| 13 | 1 | 1 | 0 | 0 | ) | |
| 14 | 1 | 1 | 0 | 1 | ||
| 15 | 1 | 1 | 1 | 0 | ) | |
| 16 | 1 | 1 | 1 | 1 | ||
Note: * 0 indicates that acceptance is unsatisfied; 1 indicates that acceptance is satisfied.
Table 3.
The IEQ categories proposed in EN15251-2007.
| Category | Explanation |
|---|---|
| I | A high level of expectation, used for spaces occupied by very sensitive and fragile persons |
| II | A normal level of expectation, used for new buildings and renovations |
| III | An acceptable and moderate level of expectation, used for existing buildings |
| IV | Values outside the criteria for the above categories, used for a limited part of the year |
Disclaimer/Publisher’s Note: The statements, opinions and data contained in all publications are solely those of the individual author(s) and contributor(s) and not of MDPI and/or the editor(s). MDPI and/or the editor(s) disclaim responsibility for any injury to people or property resulting from any ideas, methods, instructions or products referred to in the content. |
© 2023 by the authors. Licensee MDPI, Basel, Switzerland. This article is an open access article distributed under the terms and conditions of the Creative Commons Attribution (CC BY) license (https://creativecommons.org/licenses/by/4.0/).
Share and Cite
MDPI and ACS Style
Zhang, D.; Mui, K.-W.; Wong, L.-T. Ten Questions Concerning Indoor Environmental Quality (IEQ) Models: The Development and Applications. Appl. Sci. 2023, 13, 3343. https://doi.org/10.3390/app13053343
AMA Style
Zhang D, Mui K-W, Wong L-T. Ten Questions Concerning Indoor Environmental Quality (IEQ) Models: The Development and Applications. Applied Sciences. 2023; 13(5):3343. https://doi.org/10.3390/app13053343
Chicago/Turabian StyleZhang, Dadi, Kwok-Wai Mui, and Ling-Tim Wong. 2023. "Ten Questions Concerning Indoor Environmental Quality (IEQ) Models: The Development and Applications" Applied Sciences 13, no. 5: 3343. https://doi.org/10.3390/app13053343
Note that from the first issue of 2016, this journal uses article numbers instead of page numbers. See further details here.