Article

Thermodynamics of Liquid Immiscibility in Iron-Silicate Melt Systems: A Study of Nuclear Fallout Glass

1
Lawrence Livermore National Laboratory, Livermore, CA 94551-0808, USA
2
Department of Nuclear Engineering, University of California, Berkeley, CA 94720-5800, USA
*
Author to whom correspondence should be addressed.
Appl. Sci. 2023, 13(5), 3220; https://doi.org/10.3390/app13053220
Submission received: 28 December 2022 / Revised: 22 February 2023 / Accepted: 27 February 2023 / Published: 2 March 2023
(This article belongs to the Special Issue Feature Paper Collection in Section Materials)

Abstract

:
In a ground-interacting nuclear explosion, elements derived from environmental and anthropogenic material, such as iron, silicon, and aluminum, can be incorporated into the fireball. When significant amounts of metals are entrained, the resulting melt may display immiscible textures. The composition of these textures is a record of the temperature of formation and cooling rates (or thermodynamic stability) of the melts and can provide unique constraints on the early cooling conditions of these events. Here, a thermodynamic approach using calculated phase diagrams, the CALPHAD method, is used to predict temperature and composition ranges where stable liquid immiscibility might result in the textures observed in nuclear fallout glass. Sensitivity of the immiscibility to the presence of relative Al, Ca, and Mg content is also explored and compared to fallout samples, and partition coefficients are introduced to understand the preferred distribution of components into each liquid phase.

1. Introduction

In a ground-interacting nuclear explosion, fallout forms from the mixing of local material (e.g., structure, soil, etc.) with vaporized device components [1]. The entrainment of proximate materials may influence the oxygen fugacity, composition of the vapor phase, and cooling rate of the fireball, and in turn affect radionuclide partitioning in the resulting fallout material [2,3,4,5,6,7]. In a situation where sources of silicates and metals are entrained with the fireball vapor, fallout glasses enriched in metallic content can result. For example, in an urban environment, minerals in soil and building materials (i.e., concrete, glass) can provide Si-rich inputs, while significant amounts of iron can originate from steel structures, buildings, and vehicles. Recent studies have documented the presence of metals and metal oxide species [8,9,10] in macroscale and particulate fallout with some samples displaying textural evidence of liquid immiscibility [3,11]. Understanding the physical and chemical nature of how the fallout glass microstructure is influenced by the chemistry of entrained material is useful to predict the local thermal and chemical conditions relevant to the nuclear fireball cooling and debris formation conditions.
Fallout microstructures from nuclear tests conducted in predominantly silicate environments contain on average less than 5 wt% FeO [2,8,12,13], with some microscale inclusions reported at ~40 wt% FeO [8]. However, recent work reported iron-rich fallout compositions with bulk FeO content ranging between 45–53 wt% and microscale metal inclusion textures with >60 wt% FeO [3,11]. Fallout glass microstructures from melts with enriched iron composition preserve unique textures [1] hypothesized to be a product of liquid immiscibility of the iron-silicate system. Early observations of fallout glass from the Trinity nuclear explosion included evidence of liquid immiscibility [8]; however, interpretation of these features to understand fallout formation processes remains essentially unexplored. Similar immiscibility features have been observed in some geological systems where temperature, pressure, and composition play a role in the formation of natural and volcanic rocks, magmas, and lunar basalt, as summarized in [14].
The CALPHAD method (CALculation of PHAse Diagrams) [15,16,17] was previously applied to model phase formation in nuclear fallout [18]. Preliminary constraints on the chemistry/environment of nuclear fallout microstructure formation were achieved through understanding the effects of temperature, oxygen fugacity, and iron-aluminosilicate compositional variance on liquid immiscibility. In this work, we apply computational thermodynamics to elucidate the underlying phase behavior of iron-silicate melts in nuclear fallout glass as a function of temperature and composition of interacting species (alumina, calcia, etc.), which provides an understanding of formation conditions and offers an opportunity to determine local fireball conditions associated with fallout. We continue to explore the effects of temperature and composition sensitivity on liquid immiscibility for iron-rich fallout samples that exhibit microstructures referred to as amoeboids, as described by Genda et al. [3], and are depicted in Figure 1 of this work and in Figure 2 of Genda et al. [3]. These glassy fallout microstructures contain two distinct phases: one rich in Si (LSi) and one rich in Fe (LSi). These phases are dispersed in two distinct morphologies, one that consists of LSi particles dispersed in an LFe (LSi-dispersed) and another that consists of LFe particles in an LSi matrix (LFe-dispersed). Thermodynamic modeling of multicomponent melt systems using the CALPHAD method provides insight into formation conditions where immiscible two-phase liquid stability might be the dominant mechanism. This phenomenon might be responsible for the LSi-dispersed/LFe-dispersed features observed in glassy fallout microstructures such as the unique amoeboid textures preserved in Fe-rich fallout glass. It is clear from the presence of SiO2 glass and the absence of precipitated SiO2 crystals that non-equilibrium solidification occurs. However, higher temperature liquid phase separation may or may not occur as a result of equilibrium processes. This work aims to explore whether preserved liquid compositions in the form of solid two-phase compositions are consistent with equilibrium liquid phase separation.

2. Sample Selection and Characterization

Fallout samples exhibiting textures that could potentially be attributed to liquid immiscibility, as seen in the works of Genda et al. [3,11], were investigated. Sample selection and preparation are reported in detail in Genda et al. [3,11]. Briefly, millimeter-scale samples were collected from a historic near-surface nuclear test. Several iron-rich samples with aerodynamic morphologies (smooth surface and spherical or tear-drop shaped) were chosen for analysis [11]. Samples were mounted in epoxy and polished to expose their approximate mid-plane cross section. After polishing to a 1 μm surface roughness and carbon coated, backscattered electron images were obtained by Scanning Electron Microscopy (SEM) (Figure 1) with compositional analysis achieved by X-ray Energy Dispersive Spectroscopy (EDS) through SEM and Transmission Electron Microscopy (TEM) methods [3].
Figure 1. Backscatter electron images of typical amoeboids ((A)—LSi-dispersed, (B)—LFe-dispersed) observed in iron-rich fallout glasses. Bright regions represent Fe-rich regions (LFe), whereas darker regions are more Si-rich (LSi).
Applsci 13 03220 g001
For this work, additional sample analysis was performed on selected samples using an FEI Inspect F Scanning Electron Microscope with an annular solid-state silicon backscatter electron (BSE) detector for imaging and an XFlash 6-60 Silicon Drift Detector for EDS analysis. For BSE imaging analysis, an electron beam of 20 keV was used, and EDS analysis was performed using a 10 keV electron beam for better spatial resolution. Additional measurements using a FEI Titan 80-300 S/TEM enabled two-phase EDS measurements for the LFe-dispersed amoeboids and offered better compositional estimates for LSi-dispersed amoeboids. TEM measurements were performed under 300 kV accelerating voltage. TEM samples were prepared using an FEI Nova 600i dual beam focused ion beam (FIB) to obtain 100 nm thick foils. Compositional analysis was obtained for bulk and liquid-immiscibility features of the samples using TEM-EDS mapping under STEM (Scanning Transmission Electron Microscopy) mode. Regions defining the entire amoeboid and each of the two-phase regions were used to estimate the bulk and two-phase compositions [3]. Any compositional analysis performed using SEM-EDS and S/TEM-EDS analysis will here on out be referred to as SEM and TEM, respectively.
Two predominant microstructures were analyzed from the samples and denoted as follows: (1) LSi-dispersed where the silicon rich features (LSi) are dispersed in an iron-rich (LFe) matrix (Figure 1A) and (2) LFe-dispersed, where the iron-rich features are dispersed in a silicate-rich matrix (Figure 1B). Semi-quantitative estimates of the entire exposed amoeboid cross section compositions for both LFe-dispersed and LSi-dispersed amoeboids were obtained by EDS. The electron beam was rastered over the amoeboid exposed cross sections during SEM and TEM measurements. The amoeboid compositions were assumed to be combinations of standard stoichiometric oxide compositions: SiO2, FeO, Al2O3, CaO, MgO. Compositional data for each of the two liquid phases (LFe and LSi) of the LSi-dispersed microstructures were obtained using both SEM and TEM methods. However, only TEM data were obtained for the liquid compositions of LFe-dispersed microstructures because the small diameters (sub-micron) of the dispersed features were beyond spatial resolution of EDS. Bulk compositions for LFe-dispersed and LSi-dispersed microstructures were obtained using both SEM and TEM.
The amoeboid bulk compositions are listed in Table 1 in oxide weight percent for the two types of amoeboids. Average bulk compositional data were obtained from the average SEM measurement of 23 LSi-dispersed amoeboids, with error reported as the standard error of the mean. For the LFe-dispersed bulk compositions, SEM measurements on 11 amoeboids were averaged, with uncertainties calculated using the standard error of the mean. A single measurement of the bulk for each amoeboid morphology was made using TEM, which are reported in Table 1, with uncertainties representing instrument analytical uncertainty. To estimate individual LFe and LSi compositions in the LSi-dispersed amoeboids, quantitative data of the two liquid phase compositions were obtained by averaging TEM spectra of 11 Si-rich (LSi) and 2 Fe-rich (LFe) data points. To estimate individual LFe and LSi compositions in the LFe-dispersed amoeboids, measurements were obtained by averaging 5 Si-rich and 13 Fe-rich data points (see Appendix in [11]).

3. CALPHAD Method

CALPHAD modeling is based on a set of models and adjustable parameters to represent Gibbs energy functions for a given phase as a function of composition, temperature, and pressure. Once a model is selected (depending on the phase), the model parameters are optimized by fitting inputs of critically selected thermochemical and constitutive data from the literature, including experiment and ab initio calculations. The assessed functions are compiled in a database for use in computational thermodynamic predictions across multicomponent materials. The strength of the CALPHAD method relies on the ability of the assessed database to be self-consistent and thus can be applied to predict the thermodynamic behavior of multicomponent systems. To demonstrate the applicability of thermodynamic modeling with respect to fallout glass, we modeled the liquid phase behavior of the SiO2-FeO-Al2O3-CaO-MgO system using the thermodynamic description from the Thermodynamics of Advanced Fuels-International Database (TAF-ID) and the solid phases models from the constituent binary and ternary systems [19,20,21,22,23,24,25,26,27,28,29,30,31,32,33,34,35,36].
In more detail, the liquid phase for non-metallic systems is described with a two-sublattice ionic liquid model [37,38] as:
(Al3+,Ca2+,Fe2+,Mg3+,Si4+)P(AlO2,O2−,SiO44−, VaQ−,FeO3/2, SiO2)Q
The first sublattice describes the cations of the system and the second considers anions, negatively charged vacancies (Va), and neutral species, with P and Q being the number of sites on each sublattice. The neutral species are introduced to help describe non-metallic liquids. To maintain electroneutrality, P and Q vary with composition such that:
P = i v i y A i + Q y V a
Q = j v j y C j
where vi is the valency of ion i or ion j, and yi is the site fraction of ion i or ion j, which is the atomic fraction within each sublattice (A denotes an anion, C denotes a cation, and B is for neutral species). The summation over i is made over all anions and the summation over j is made for all cations. The vacancies (Va) are assumed to hold a charge that is equal to the average charge of the cation sublattice (Q). The summation of the constituent fractions on each sublattice is unity. The Gibbs energy of the liquid phase described above can be written as:
G l i q = G l i q r e f + G l i q i d + G l i q e x
G l i q r e f = C A y C y A   ° G C A l i q + Q y V a C y C   ° G C l i q + Q B y B   ° G B l i q  
G l i q i d = R T P C y C ln   y C + Q A y A ln   y A + y V a ln   y V a + B y B ln y B  
G l i q e x = C 1 C 2 A y C 1 y C 2 y A   L C 1 , C 2 A l i q + C 1 C 2 y C 1 y C 2 y V a 2   L C 1 , C 2 V a l i q + C A 1 A 2 y C y A 1 y A 2   L C A 1 , A 2 l i q + C A y C y A y V a   L C A , V a   l i q + C A B y C y A y B   L C A , B l i q + C B y C y B y V a   L C V a , B l i q + B 1 B 2 y B 1 y B 2   L B 1 , B 2 l i q
In the reference term (Equation (5)), ° G C A l i q is the Gibbs energy of (vC + vA) moles of liquid C v A A v C ,   ° G C l i q is the temperature-dependent Gibbs energy term of the liquid phase for the pure element corresponding to the cation (C), and   ° G B l i q represents the Gibbs energy of the liquid phase for the neutral species B. The reference Gibbs energy terms are taken from [insert Dinsdale Reference]. The ideal term (Equation (6)) corresponds to the ideal configurational entropy on each sublattice; R is the ideal gas constant (J/mol/K) and T is the temperature in Kelvin. An excess term is described by (Equation (7)), where the L-parameters represent interaction between different species in each sublattice, and where commas are used to separate interacting species in a same sublattice. The interaction terms are usually in the form of a polynomial expans. The parameters are stored in a thermodynamic database, and the subsequent calculations are carried out in equilibrium. For this work, the bulk oxide data obtained for the LFe-dispersed/LSi-dispersed amoeboid compositions are used as input for the equilibrium calculations. The equilibrium calculations are presented in Section 4.3, Figure 3 (LFe-dispersed), and Figure 4 (LSi-dispersed). The computed distribution of oxide components in each liquid phase are compared to the measured compositions and are used to predict formation conditions in the fallout microstructures.

4. Results and Discussion

4.1. Inputs for Modeling Fallout Microstructures
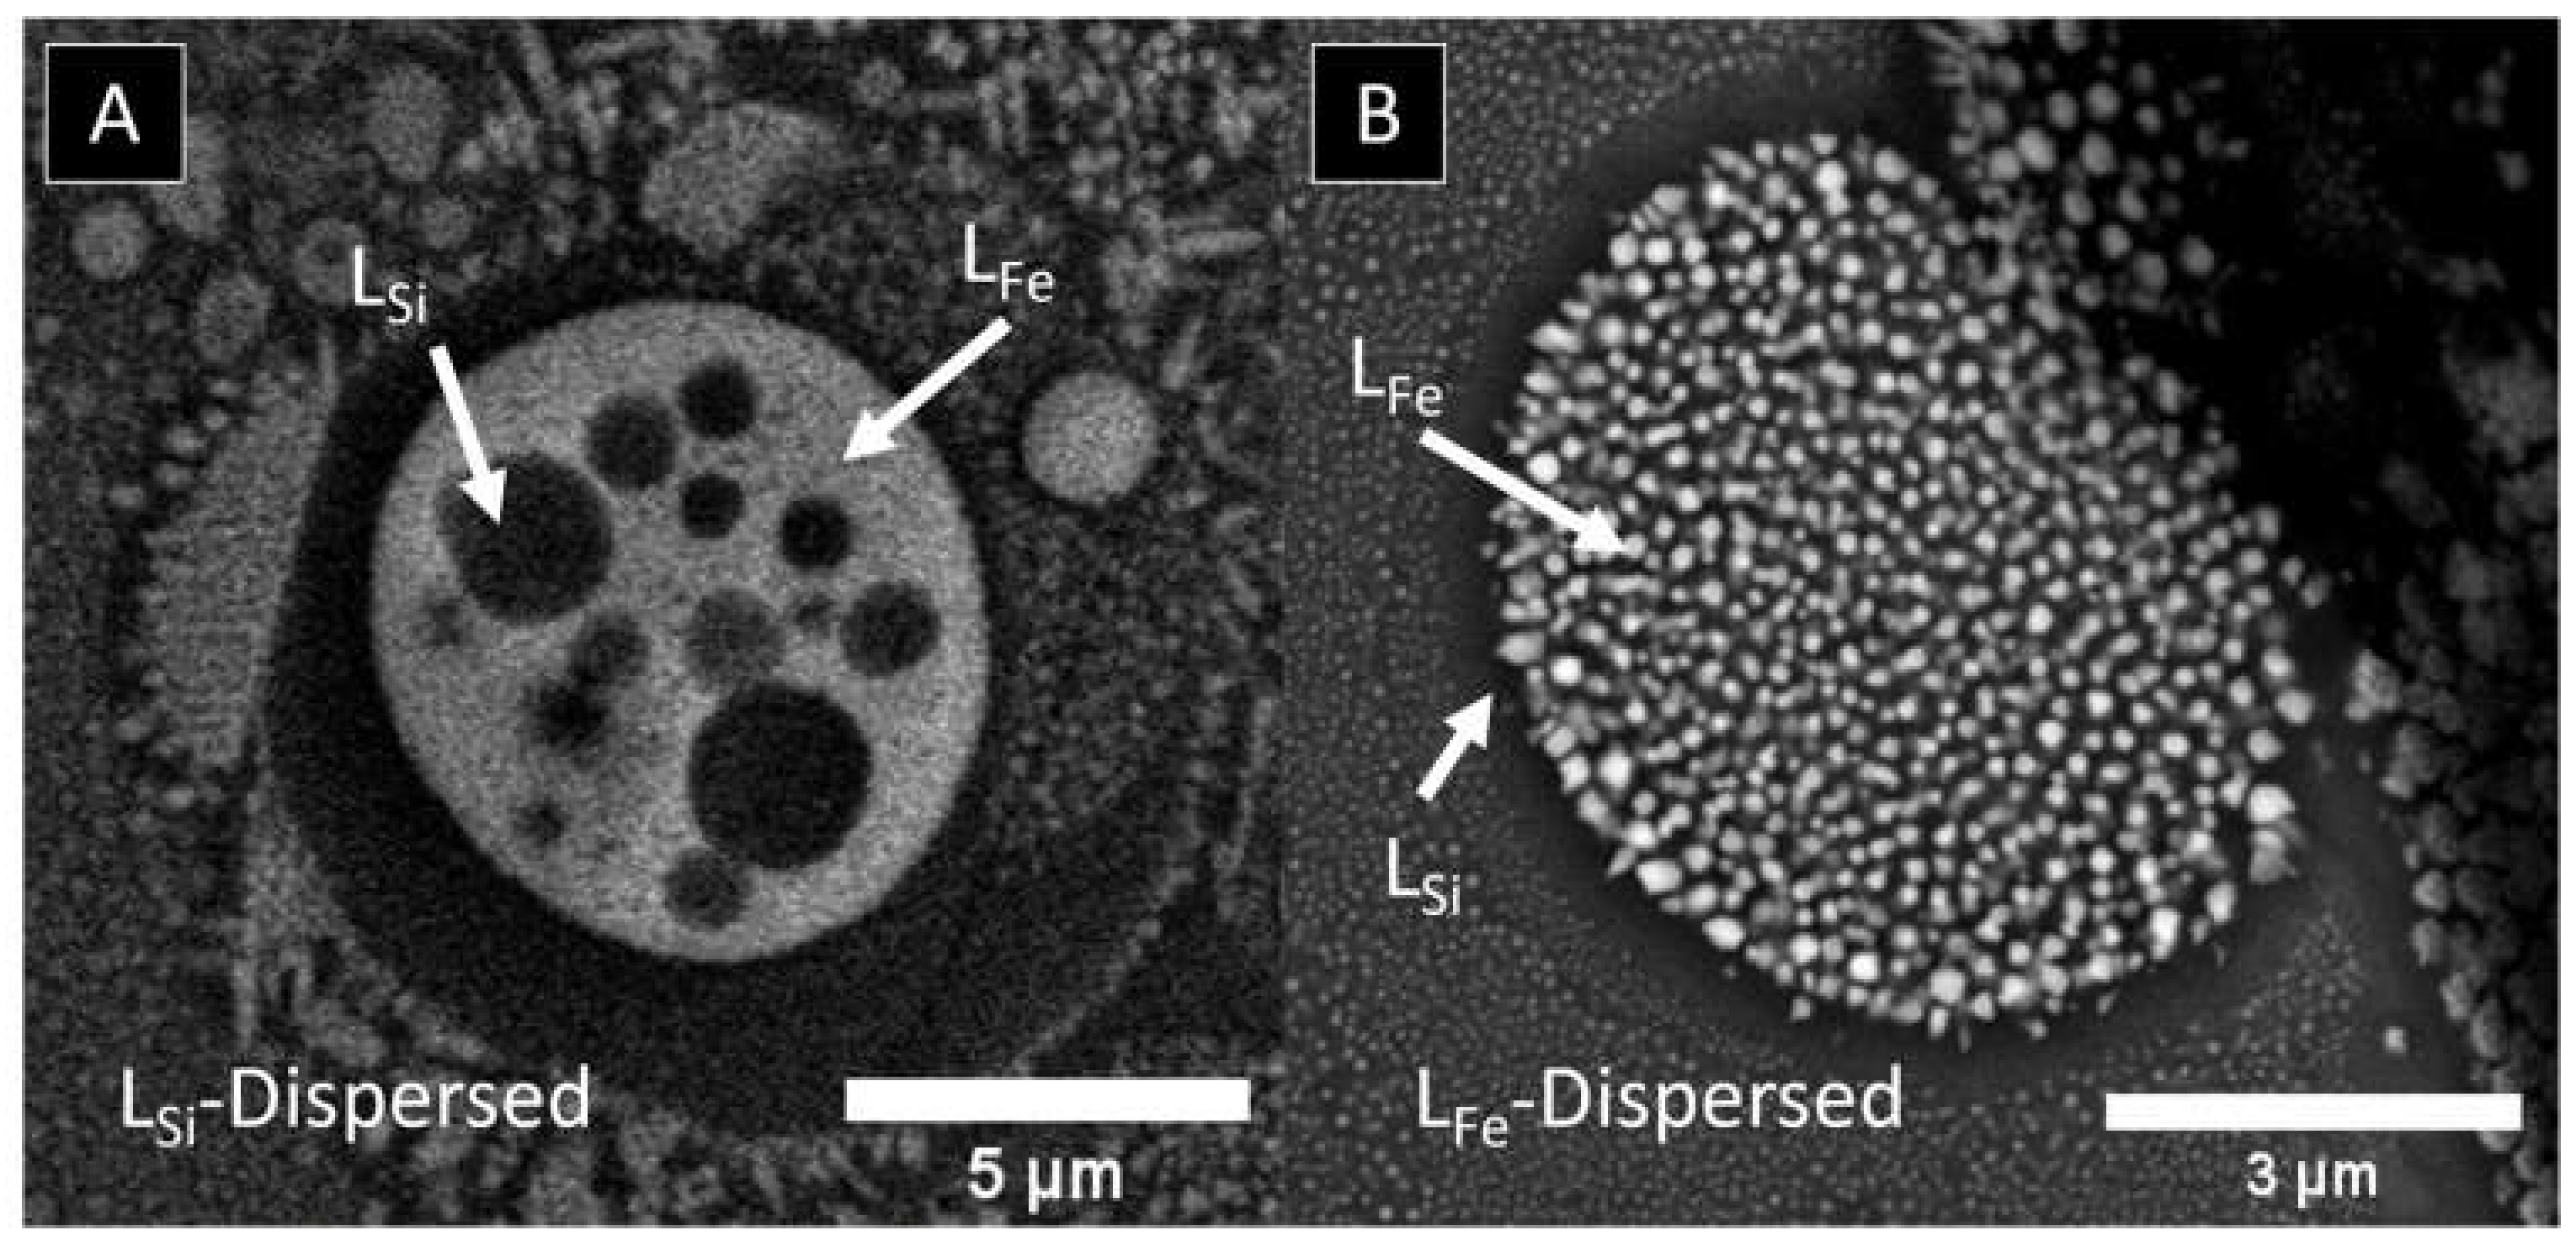
The physical measured data from SEM and TEM of the amoeboids are reported in Table 1. These samples were higher than expected with respect to FeO content and exhibited lower levels of SiO2 than typical fallout glasses. The compositions measured using TEM resulted in generally higher iron levels compared with SEM-EDS measurements, which may be due to analytical bias or because the particular amoeboids measured by TEM happened to be more iron rich than those selected for SEM analysis. The bulk values reported here were used as inputs for the CALPHAD modeling. As described above, two-phase liquid compositions for both LFe-dispersed and LSi-dispersed microstructures were only measurable using TEM, therefore the bulk TEM compositions in Table 1 are used as model inputs. These data are the overall amoeboid compositional measurements of each morphology, but are not the compositions of each of the two phases in the amoeboids. The compositions of each liquid were used as comparison for the equilibrium calculations presented in Section 4.3, see dashed lines in Figure 3b,c and Figure 4b,c. We performed the CALPHAD calculations using the TAF-ID thermodynamic database [39] that contains data for the SiO2-FeO-Al2O3-CaO-MgO multicomponent system. While the samples also contain oxides from the alkali group (K2O, Na2O totaling ~2–3 wt%) and transition metals (MnO, TiO2 totaling <1 wt%), the compositions in Table 1 neglect these species and are normalized to account for components within the SiO2-FeO-Al2O3-CaO-MgO system. However, alkali oxides are generally predicted to partition in the silicate-rich liquids and behave similarly to Al2O3 in that they likely further suppress the miscibility gap to lower temperature domains and constrained composition ranges [40,41].
Table 1. Bulk composition of amoeboids as measured by SEM (average) and TEM in oxide weight percent.
LFe-DispersedLSi-Dispersed
ComponentSEMTEMSEMTEM
SiO250.2 ± 3.144.6 ± 8.932.5 ± 1.625.2 ± 0.8
FeO41.4 ± 4.045.2 ± 6.361.0 ± 3.167.1 ± 6.0
Al2O35.9 ± 0.56.8 ± 1.44.6 ± 0.34.8 ± 0.1
CaO1.0 ± 0.11.3 ± 0.20.6 ± 0.11.8 ± 0.02
MgO1.5 ± 0.22.1 ± 0.41.3 ± 0.11.2 ± 0.01

4.2. Compositional Sensitivity

The compositional sensitivity of liquid phase iron-silicate systems with respect to Al2O3-content has been presented previously [18]. Since Al2O3 is known to suppress liquid immiscibility of silicate systems [40], it may be one parameter that explains the presence or absence of immiscibility textures in these fallouts. The Al2O3 content in Table 1 is lower than other compositions reported in non-metallic fallout, where fewer immiscible textures were described by Weisz et al. [6,7]. The combined effects of the amoeboids with compositional variations in alumina (Al2O3), calcia (CaO), and magnesia (MgO) concentrations on liquid thermodynamics, specifically miscibility gap formation and stability, is explored here.
The effect of 5 wt% and 10 wt% Al2O3 additions to the liquid immiscible region of a pseudo-binary FeO-SiO2 system (Figure 2a) is explored using equilibrium calculations. The calculations presented here are a rough estimation of the experimental data with ranges that bound the amoeboid compositions with respect to Al2O3 content. There exists a wide range of stability of the two-phase liquid domain across compositions between 5–67 wt% FeO (black curve). The maximum temperature limit (Tmax or critical temperature of immiscibility) of the two-phase liquid region is calculated to be 1950 °C at a composition of 24 wt% FeO, above which the liquids are completely miscible. The miscibility gap extends across a temperature range of from 1620–1950 °C. Upon cooling from Tmax and 24 wt% FeO composition, the phase boundaries expand and shift so that the majority liquid becomes enriched in SiO2, and the minority liquid is iron-rich in accordance with the lever rule [42]. The addition of Al2O3 alters the stability of the two-phase liquid domain (blue and brown curves), decreasing the maximum temperature of the two-liquid region by 95 and 208 °C for 5 and 10 wt% Al2O3, respectively, but extending the stability range down to lower temperatures (~1420 °C) as seen in [43]. Incidentally, the presence of Al2O3 leads to a contraction of the liquid immiscibility range with respect to composition. The composition range of FeO, where two liquids are stable, is significantly reduced at the lower temperature limits. This is especially pronounced for higher Al2O3-content, such that the two liquids coexist between 14–60 wt% FeO at 1420 °C for 10 wt% Al2O3 (Figure 2a). The composition at Tmax is shifted towards enrichment in FeO (depletion in SiO2), to 27 wt% FeO and 30 wt% FeO for 5 at 10 wt% Al2O3, respectively.
To be more representative of fallout sample compositions, the effects of select other minor elements known to be entrained in the fireball from near-ground explosions were added to the calculation. The combined effects Al2O3 with CaO and MgO additions are compared to the FeO-SiO2 pseudo-binary and FeO-SiO2-5Al2O3 (Figure 2b). In the presence of CaO and 5 wt% Al2O3, the minor CaO additions (orange-curves) further reduce Tmax, 1838 °C to and 1818 °C for 1 wt% and 2 wt% additions, respectively, which is 17 °C and 37 °C lower compared to the Tmax of FeO-SiO2-5Al2O3 (blue curve). However, the FeO wt% composition at Tmax is not significantly affected. The purple curve in Figure 2b corresponds to the liquid phase stability of FeO-SiO2 with additions of 5 wt% Al2O3, 2 wt% CaO and 1 wt% MgO. In this case the addition of MgO further reduces Tmax. The addition of components such as Al2O3, CaO, and MgO lead to significant contractions in the miscibility gap limiting the compositional range of stability where liquid immiscibility is favored. This is in agreement with [14], whose work indicated a suppression of the miscibility gap with the addition of these components. The contraction of the phase boundary with additions of alkaline +2 oxides shifts the phase boundary towards SiO2 (depletion in FeO) as reported by [40].
The bulk compositions for the LFe-dispersed (red-dashed lines) and LSi-dispersed (green-dashed lines) amoeboids, as measured by SEM-EDS (left-dashed lines) and TEM-EDS (right-dashed lines) can be shown relative to these calculations. Superimposing the observed compositions with the model suggests that the LSi-dispersed amoeboid compositions would fail to experience stable phase separation with the combined addition of 5 wt% Al2O3, 2% CaO, and 1% MgO.
Figure 2. Compositional and temperature sensitivity to (a) Al2O3 and (b) Al2O3 with CaO and MgO. The labels indicate the weight percent composition for each of the oxide species. The dashed areas (b) indicate the bulk composition ranges of the LSi-dispersed (labeled LSi) and LFe-dispersed (labeled Lfe) measured by SEM and TEM-EDS.
Applsci 13 03220 g002
From the observed fallout microstructures, the LFe-dispersed and LSi-dispersed amoeboid compositions are expected to lie on opposite sides of the miscibility gap compared to their dispersed phase. Where the dispersed phase is the minority phase, such that LSi-dispersed comprises an iron-rich matrix that includes Si-rich dispersed. However, CALPHAD predictions would expect both amoeboid morphologies to be LSi-dispersed, where the majority phase is FeO-rich according to the lever rule [42], since both compositions lie on the iron-rich side of the miscibility gap. From Figure 2b, it can be seen that the experimentally observed compositions of the LFe-dispersed amoeboids lie on the iron-rich side of the miscibility gap. However, the observed LFe-dispersed morphologies indicate that the iron-rich dispersed phase should correspond to the minority phase, although phase fractions of the relative amounts of LFe and LSi liquid phases were not measured experimentally. Conversely, the LSi-dispersed amoeboid morphology is expected to contain an FeO-rich majority phase and a dispersed LSi-rich minority phase; this is accurately represented in Figure 2b. Equilibrium calculations predict an LFe-dispersed phase (where the majority phase is SiO2 rich) at composition <30 wt% FeO, and the LSi-dispersed phase (majority phase FeO-rich amoeboids) at compositions >30 wt%. While these calculations demonstrate immiscibility sensitivity to overall composition, they do not consider alkali components such as Na2O or K2O. These metal oxide species undoubtedly play a role in constraining the miscibility region [40], but they are not represented in our equilibrium calculations due to constraints on the available elements in the TAF-ID database.

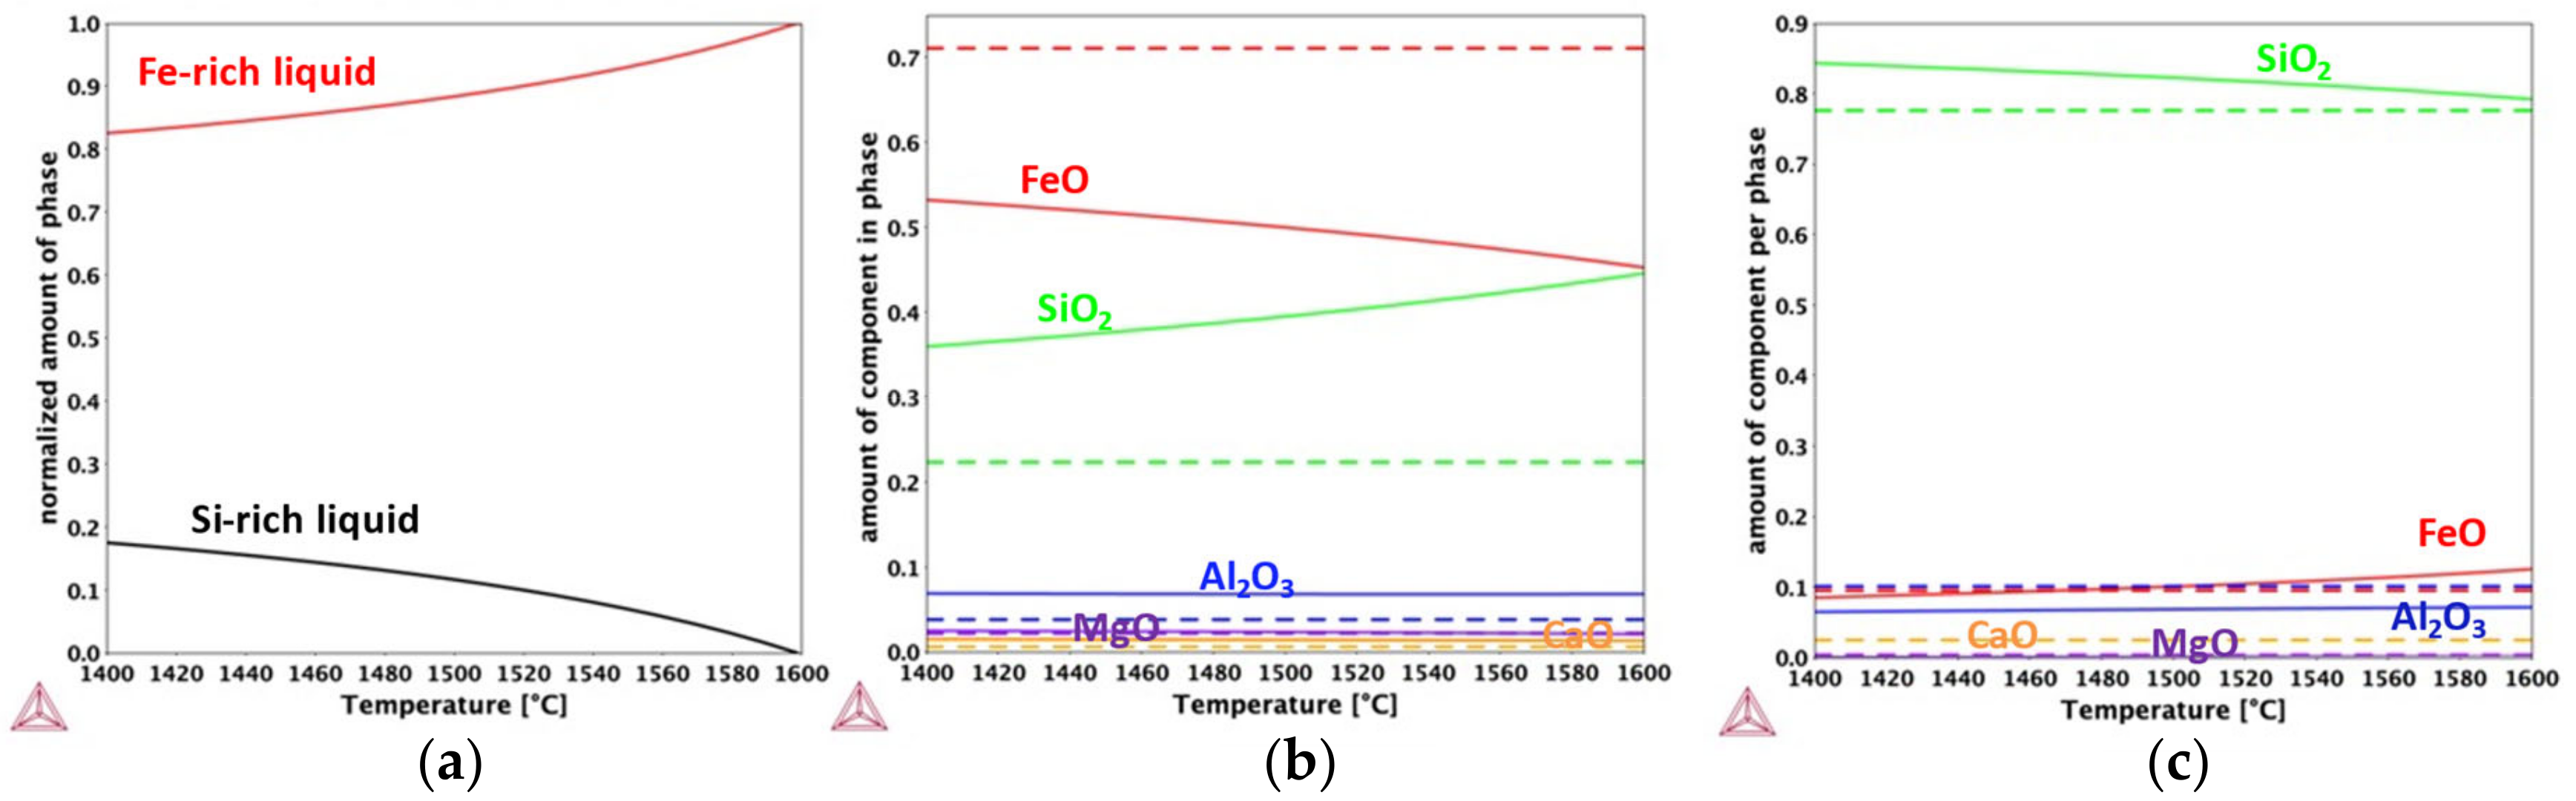
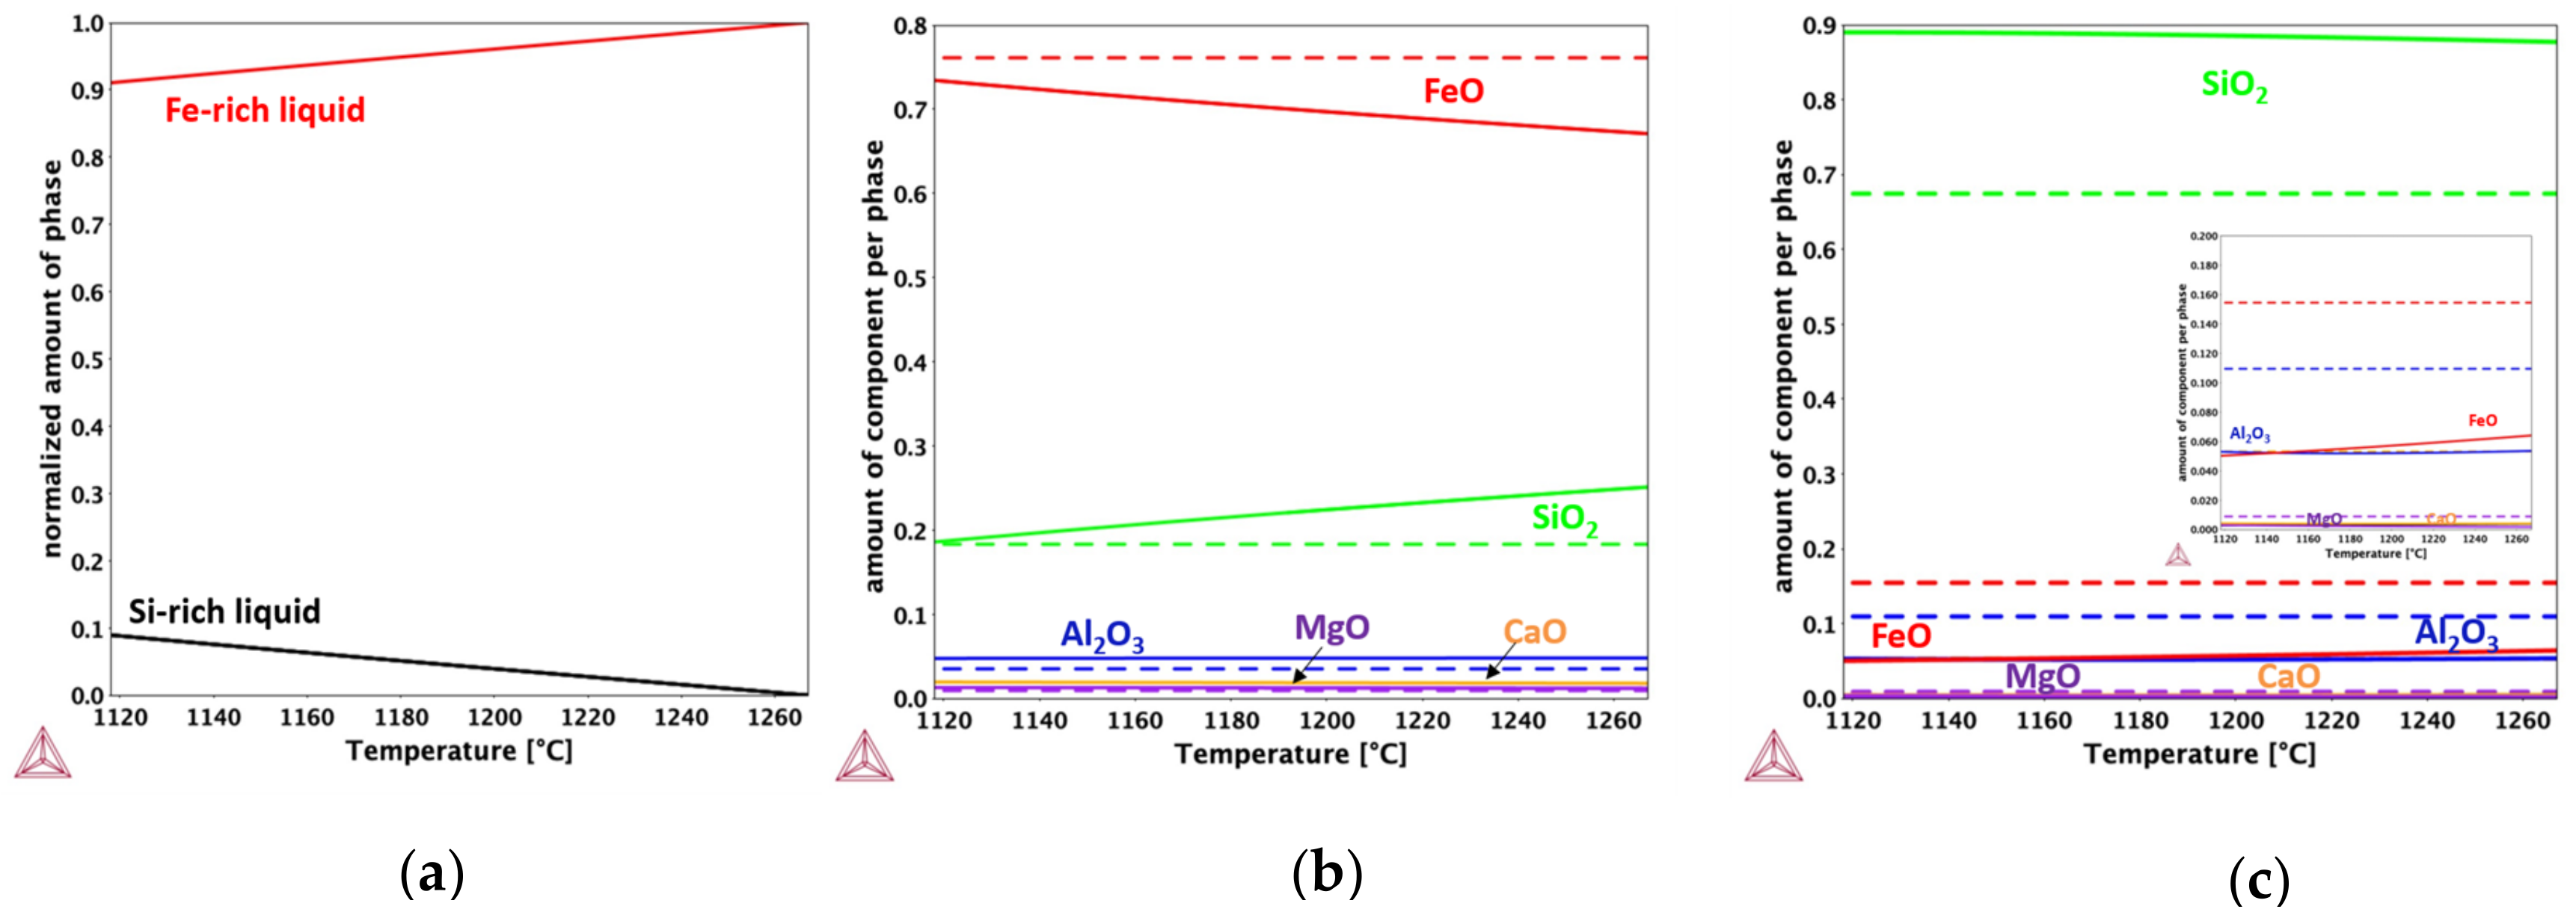
4.3. Temperature Sensitivity

The temperature dependence of the two immiscible liquid phases for an LFe-dispersed and LSi-dispersed amoeboid composition was computed. Such predictions bound the temperature ranges over which the amoeboid morphologies might be stable under thermodynamic equilibrium conditions. Prediction of the liquid phase fractions was performed for the amoeboid compositions obtained by TEM (Table 1), only. The computed results for LFe-dispersed compositions (Figure 3) predict that the Fe-rich phase is predominant (Figure 3a), contrary to analytical measurements, which show the matrix phase to be Si-rich and the dispersed phase to be Fe-rich. Average compositions lie on the FeO-rich domain of the miscibility gap (Figure 2b), as discussed in the previous section. The two-phase liquid domain is stable between 1400–1600 °C, above which the two liquids are completely miscible. Upon cooling, the amount of Fe-rich liquid is reduced but remains dominant, and the Si-rich liquid increases in phase fraction.
Figure 3. Temperature dependence of (a) phase fraction of LFe-dispersed amoeboids and composition of (b) Fe-rich and (c) Si-rich liquids. Dashed curves correspond to analytical measurements from TEM and colors correspond to different components (FeO-red, SiO2-green, Al2O3-blue, CaO-orange, MgO-purple).
Applsci 13 03220 g003
The composition of each liquid as a function of temperature is plotted in Figure 3b,c for the FeO- and SiO2-rich liquids, respectively. The dashed lines are the analytically measured compositions of each liquid phase based on TEM. Figure 3b reveals that the predicted iron content in the Fe-rich liquid is significantly underestimated and the SiO2 and Al2O3 content is overestimated compared to chemical analysis (dashed lines). MgO and CaO contents are in relative agreement with compositions measured by TEM for the FeO-rich liquid. The computed results indicate the Fe-rich liquid becomes increasingly enriched in FeO and depleted in SiO2 as a function of decreasing temperature.
Broadly, better agreement between compositions obtained by TEM and our computed results is observed at reduced temperatures, such as 1400 °C. The Si-rich liquid is calculated to be the minority phase (Figure 3a) and the predicted values for each component are in relative agreement with the analytically measured compositions, except for CaO, which is underestimated (Figure 3c). The Si-rich liquid becomes slightly enriched in SiO2 as a function of decreasing temperature.
From these predictions, we can propose a constraint in temperature for the formation of these amoeboids. The dispersed phase (FeO-rich) forms at 1400 °C, as the computed composition approaches the analytically measured composition with decreasing temperature. However, the SiO2-rich phase is in better agreement with compositions achieved by chemical analysis (TEM) at temperatures ~1600 °C, as seen in Figure 3c. The relative amounts of computed phase fraction, i.e., that the Fe-rich liquid is the majority phase, is in contrast with the observed morphologies, which would expect the dispersed phase (Fe-rich liquid) to be present in smaller amounts compared to the matrix phase. This deviation could point to non-equilibrium formation conditions for the amoeboid morphologies in the fallout glass. CALPHAD predictions indicate that the dispersed phase (LFe) forms at lower temperatures than the Si-rich matrix phase. This would mean that the dispersed phase might nucleate within the matrix phase as the fireball condenses.
The computed results for LSi-dispersed compositions (Figure 4) show that the compositions of these amoeboids are predicted to lie outside of the stability limit of the FeO-SiO2 miscibility gap (see Figure 2b). However, contrary to the calculations above (Figure 2 and Figure 3), if no solid phases are included in the calculation to constrain the solidus and all phases other than the liquid phase are suspended, a small metastable region of two-phase liquid stability can be induced between 1120 °C < T < 1265 °C. While this can be used to provide some preliminary insight into compositional constraints of LSi-dispersed amoeboids, the metastable low-temperature range of formation provides an indication that non-equilibrium conditions are likely the contributing factor for amoeboid morphologies in the fallout glass. The calculations indicate that the predominant phase is predicted to be Fe-rich (Figure 4a), in agreement with experimental findings where the primary/matrix phase contains high levels of iron and the minor dispersed-phase is Si-rich. As temperature decreases in Figure 4a, the amount of Fe-rich liquid is reduced but remains dominant, and the Si-rich liquid increases in phase fraction. The composition of each liquid as a function of temperature is plotted in Figure 4b,c for the FeO and SiO2-rich liquids, respectively. The dashed lines are the experimentally observed compositions of each liquid phase based on TEM measurements and are inherently temperature independent. While the FeO content in Figure 4b is underestimated compared to experiments, we achieve reasonable agreement at temperatures around 1120 °C for most of the components in the Fe-rich liquid. The Si-rich liquid is calculated to be the minority phase (Figure 4a) and the predicted values for each component in this phase are computed in Figure 4c and compared to experimentally observed compositions obtained from TEM (dashed lines). The SiO2 content is not predicted to change much with temperature, showing that the overall sensitivity to temperature for the components in the dispersed Si-rich phase is not significant.
Figure 4. Temperature dependence of (a) phase fraction of LSi-dispersed amoeboids and composition of (b) Fe-rich and (c) Si-rich liquids. Dashed curves correspond to analytical measurements from TEM and colors correspond to different components (FeO-red, SiO2-green, Al2O3-blue, CaO-orange, MgO-purple).
Applsci 13 03220 g004
Generally, the disagreement between the computed and analytically measured compositions might indicate that the LSi-dispersed amoeboids are not necessarily formed under equilibrium conditions. However, the effects of alkali metals are also not considered in this work, which could have demonstrable consequences on the two-phase liquid stability. If instead of performing the calculation with compositions measured by TEM from Table 1, we consider the slightly more iron- (and calcium-) deficient data measured by SEM (refer to the left green-dashed line in Figure 2b), a small range of stability for the two-phase liquid is predicted between 1404–1415 for LSi-dispersed amoeboid morphologies. This is calculated near the iron-rich phase boundary, which extends just beyond the SEM composition (61 wt% FeO) to 61.6 wt% FeO at 1404 °C.

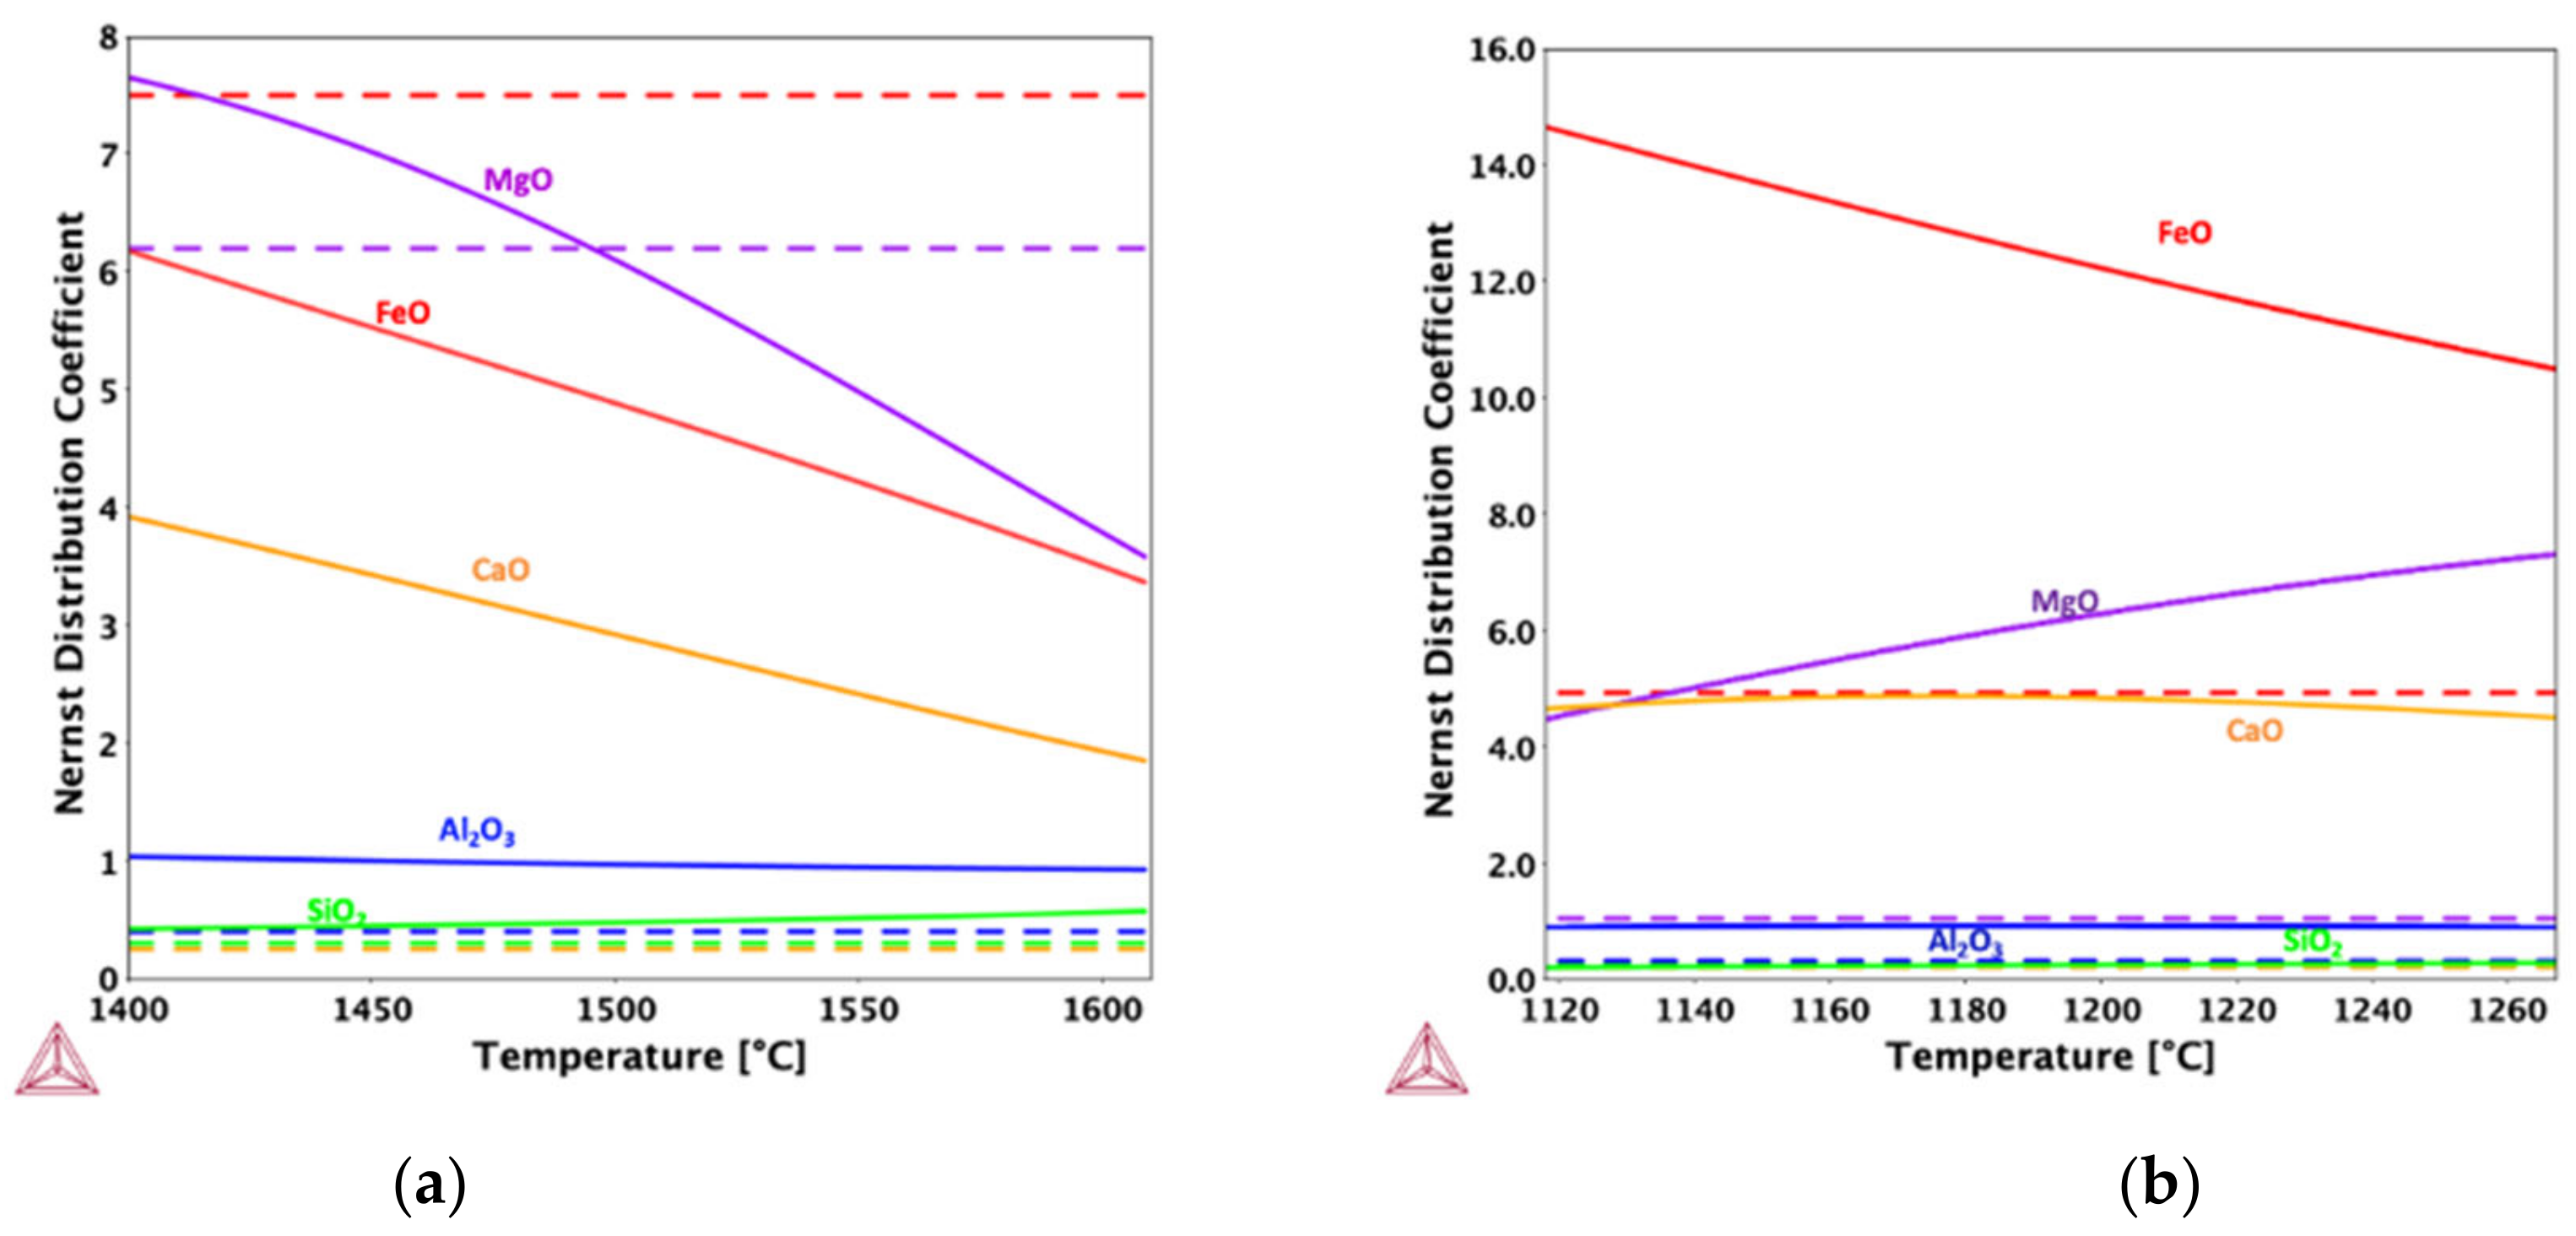
4.4. Component Partitioning

The Nernst distribution coefficient [44], also called the partition coefficient, in this case represents the affinity of each of the oxide components for the two liquid phases, either a component preferably partitions into Fe-rich or Si-rich liquid. Nernst distribution coefficients are the simplest conventional form of quantitative presentation of element partitioning between phases. In this work, we calculate ratios of the oxide wt% in the LFe phase to that in the LSi phase for the two amoeboid morphologies, so that any values calculated greater than unity would indicate the component partitions into the iron-rich liquid, and values less than one mean that the component prefers the Si-rich liquid. Nernst coefficients (Figure 5) are another representation of the computed compositions of each phase plotted in Figure 3 and Figure 4. The CALPHAD computed coefficients are calculated as a function of temperature, whereas the coefficients calculated from analytically measured data using TEM (dashed lines) are independent of temperature.
The computed Nernst coefficients for MgO, FeO, and CaO are most sensitive to temperature, offering a constraint for partitioning. For instance, in LFe-dispersed amoeboids, the coefficient computed for FeO broadly approaches agreement with coefficients derived from analytical measurements at ~1400 °C, and MgO is in agreement with analytical measurements around 1500 °C. The CALPHAD method, which predicted the partitioning of CaO into LFe liquid, disagrees with observed microstructures, where CaO clearly partitions in the silicate-rich liquid phase (true for both LFe-dispersed and LSi-dispersed morphologies). In LFe-dispersed amoeboids, the distribution coefficient is underestimated compared to analytical measurements. Specifically, the dispersed phase (FeO-rich liquid) was calculated to be rather iron-deficient compared to the compositions observed in TEM. Al2O3 content in both liquids are calculated to be near equal, with a slight preference for Si-rich liquid at elevated temperatures in LFe-dispersed amoeboids. Coefficients from analytical measurements clearly indicate a preference of Al2O3 for the Si-rich matrix phase, as their values are greater than unity.
Distribution coefficients for LSi-dispersed amoeboid compositions show sensitivity to temperature for FeO and MgO, while CaO distribution appears to be less temperature dependent. All three components partition into the iron-rich liquid; however, coefficients derived from analytical measurements of CaO indicate a preference for the Si-rich liquid, contrary to conditions computed under equilibrium. While most of the component partitioning is in qualitative agreement with measurements of chemical analysis, discrepancies still exist. Inconsistent agreement of CALPHAD-computed Nernst coefficients with those that were derived from analytical measurements suggests that either amoeboids reflect non-equilibrium behavior or, if they represent equilibrium behavior, incorporation of alkali behavior (Na and K oxides) is needed to better describe equilibrium formation conditions. Alternatively, amoeboids could form as a result of emulsification of compositionally distinct liquids rather than decomposition from a single miscible liquid, but this process was not evaluated for this study.

5. Conclusions

CALPHAD calculations are used to establish temperature and composition bounds on fallout morphologies that exhibit two-phase immiscible liquid textures. The miscibility gap of the FeO-SiO2 pseudo-binary system is computed assuming equilibrium conditions with the additions of Al2O3 and Al2O3 with MgO and CaO. Both types of observed morphologies, LFe-dispersed and LSi-dispersed, are calculated to be in the iron-rich side of the miscibility gap. The majority liquid is always predicted to be iron rich under equilibrium conditions for amoeboid compositions observed in this work. This is contrary to observed microstructures, where the LFe-dispersed amoeboids are expected to have a Si-rich matrix (majority-phase) and dispersed iron features within the Si-rich matrix phase. The LSi-dispersed amoeboids appear to be on the outer compositional limit of two-phase liquid stability. Nernst distribution coefficients are used to investigate the partitioning of components into each of the liquids, and qualitative agreement with values derived from analytical data is achieved. This method has also demonstrated sensitivity of immiscibility to Al, which is consistent with our observations. However, predicted Ca distribution between two liquid compositions is not consistent with our observations. Addition of alkalis into this method would greatly increase the quantitative nature of these constraints.

Author Contributions

Data curation, E.E.M. and T.P.G.; Formal analysis, E.E.M., E.B. and Z.D.; Funding acquisition, K.B.K.; Investigation, E.E.M. and K.B.K.; Methodology, E.E.M., T.P.G., Z.D., A.P. and K.B.K.; Project administration, E.B. and K.B.K.; Resources, E.B.; Software, E.E.M.; Supervision, E.B., A.P. and K.B.K.; Validation, E.E.M., T.P.G. and E.B.; Visualization, E.E.M. and T.P.G.; Writing—original draft, E.E.M. and T.P.G.; Writing—review & editing, E.E.M., T.P.G., E.B., Z.D., A.P. and K.B.K. All authors have read and agreed to the published version of the manuscript.

Funding

This research received no external funding.

Acknowledgments

This work was performed under the auspices of the U.S Department of Energy by Lawrence Livermore National Laboratory under contract DE-AC52-07NA27344 and was supported by the LLNL-LDRD Program under Project No. 20-SI-006.

Conflicts of Interest

The authors declare no conflict of interest.

References

  1. Adams, C.; Farlow, N.; Schell, W. The compositions, structures and origins of radioactive fall-out particles. Geochim. Cosmochim. Acta 1960, 18, 42–56. [Google Scholar] [CrossRef]
  2. Wimpenny, J.; Eppich, G.R.; Marks, N.; Ryerson, F.; Knight, K.B. Characterizing major and trace element compositions in fallout melt glass from a near-surface nuclear test. J. Environ. Radioact. 2022, 243, 106796. [Google Scholar] [CrossRef] [PubMed]
  3. Genda, T.; Knight, K.; Dai, Z.R.; Balboni, E.; Goldblum, B.L.; Hosemann, P. Iron-rich microstructure records of high temperature multi-component silicate melt behavior in nuclear fallout. J. Environ. Radioact. 2021, 237, 106700. [Google Scholar] [CrossRef] [PubMed]
  4. Balboni, E.; Dai, Z.; Matzel, J.; Ferrier, M.G.; Knight, K. Chemical and structural characterization of particulate fallout isolated from air-filters. J. Radioanal. Nucl. Chem. 2022, 331, 5371–5379. [Google Scholar] [CrossRef]
  5. Cassata, W.S.; Prussin, S.G.; Knight, K.B.; Hutcheon, I.D.; Isselhardt, B.H.; Renne, P.R. When the dust settles: Stable xenon isotope constraints on the formation of nuclear fallout. J. Environ. Radioact. 2014, 137, 88–95. [Google Scholar] [CrossRef] [Green Version]
  6. Weisz, D.G.; Jacobsen, B.; Marks, N.E.; Knight, K.B.; Isselhardt, B.H.; Matzel, J.E. Diffusive mass transport in agglomerated glassy fallout from a near-surface nuclear test. Geochim. Cosmochim. Acta 2018, 223, 377–388. [Google Scholar] [CrossRef]
  7. Weisz, D.G.; Jacobsen, B.; Marks, N.E.; Knight, K.B.; Isselhardt, B.H.; Matzel, J.E.; Weber, P.K.; Prussin, S.G.; Hutcheon, I.D. Deposition of vaporized species onto glassy fallout from a near-surface nuclear test. Geochim. Cosmochim. Acta 2017, 201, 410–426. [Google Scholar] [CrossRef] [Green Version]
  8. Eby, N.; Charnley, N.; Pirrie, D.; Hermes, R.; Smoliga, J.; Rollinson, G. Trinitite redux: Mineralogy and petrology. Am. Mineral. 2015, 100, 427–441. [Google Scholar] [CrossRef]
  9. Bellucci, J.J.; Simonetti, A. Nuclear forensics: Searching for nuclear device debris in trinitite-hosted inclusions. J. Radioanal. Nucl. Chem. 2012, 293, 313–319. [Google Scholar] [CrossRef]
  10. Bunch, T.E.; Hermes, R.E.; Moore, A.M.T.; Kennett, D.J.; Weaver, J.C.; Wittke, J.H.; DeCarli, P.S.; Bischoff, J.L.; Hillman, G.C.; Howard, G.A.; et al. Very high-temperature impact melt products as evidence for cosmic airbursts and impacts 12,900 years ago. Proc. Natl. Acad. Sci. USA 2012, 109, E1903–E1912. [Google Scholar] [CrossRef] [Green Version]
  11. Genda, T. Nuclear Fallout Formation in Iron Rich Environments; University of California: Berkeley, CA, USA, 2022. [Google Scholar]
  12. Eppich, G.R.; Knight, K.B.; Jacomb-Hood, T.W.; Spriggs, G.D.; Hutcheon, I.D. Constraints on fallout melt glass formation from a near-surface nuclear test. J. Radioanal. Nucl. Chem. 2014, 302, 593–609. [Google Scholar] [CrossRef]
  13. Bonamici, C.E.; Kinman, W.S.; Fournelle, J.H.; Zimmer, M.M.; Pollington, A.D.; Rector, K.D. A geochemical approach to constraining the formation of glassy fallout debris from nuclear tests. Contrib. Mineral. Petrol. 2017, 172, 2. [Google Scholar] [CrossRef]
  14. Roedder, E. Silicate liquid immiscibility in magmas and in the system K2O-FeO-AI2O3-SiO2: An example of serendipity. Geochim. Cosmochim. Acta 1978, 42, 1597–1617. [Google Scholar] [CrossRef]
  15. Kaufman, L.; Bernstein, H. Computer Calculation of Phase Diagrams. With Special Reference to Refractory Metals; Academic Press: New York, NY, USA, 1970. [Google Scholar]
  16. Saunders, N.; Miodownik, A.P. CALPHAD (Calculation of Phase Diagrams): A Comprehensive Guide; Elsevier: Amsterdam, The Netherlands, 1998. [Google Scholar]
  17. Sundman, B.; Lukas, H.; Fries, S. Computational Thermodynamics: The Calphad Method; Cambridge University Press: Cambridge, UK, 2007. [Google Scholar]
  18. Genda, T.; Moore, E.; Perron, A.; Knight, K. Phase Formation in Nuclear Fallout; Lawrence Livermore National Lab.(LLNL): Livermore, CA, USA, 2020. [Google Scholar]
  19. Mao, H.; Selleby, M.; Fabrichnaya, O. Thermodynamic reassessment of the Y2O3–Al2O3–SiO2 system and its subsystems. Calphad 2008, 32, 399–412. [Google Scholar] [CrossRef]
  20. Ozturk, K.; Zhong, Y.; Chen, L.-Q.; Liu, Z.-K.; Sofo, J.O.; Wolverton, C. Linking first-principles energetics to CALPHAD: An application to thermodynamic modeling of the Al-Ca binary system. Metall. Mater. Trans. A 2005, 36, 5–13. [Google Scholar] [CrossRef]
  21. Sundman, B.; Ohnuma, I.; Dupin, N.; Kattner, U.R.; Fries, S.G. An assessment of the entire Al–Fe system including D03 ordering. Acta Mater. 2009, 57, 2896–2908. [Google Scholar] [CrossRef]
  22. Liang, P.; Su, H.-L.; Donnadieu, P.; Harmelin, M.G.; Quivy, A.; Ochin, P.; Effenberg, G.; Seifert, H.J.; Lukas, H.L.; Aldinger, F. Experimental investigation and thermodynamic calculation of the central part of the Mg–Al phase diagram. Int. J. Mater. Res. 1998, 89, 536–540. [Google Scholar]
  23. Mao, H.; Selleby, M.; Sundman, B. A re-evaluation of the liquid phases in the CaO–Al2O3 and MgO–Al2O3 systems. Calphad 2004, 28, 307–312. [Google Scholar] [CrossRef]
  24. Gröbner, J.; Lukas, H.L.; Aldinger, F. Thermodynamic calculation of the ternary system Al-Si-C. Calphad 1996, 20, 247–254. [Google Scholar] [CrossRef]
  25. Mao, H.; Selleby, M. Thermodynamic reassessment of the Si3N4–AlN–Al2O3–SiO2 system—Modeling of the SiAlON and liquid phases. Calphad 2007, 31, 269–280. [Google Scholar] [CrossRef]
  26. Selleby, M.; Sundman, B. A reassessment of the Ca-Fe-O system. Calphad 1996, 20, 381–392. [Google Scholar] [CrossRef]
  27. Anglezio, J.; Servant, C.; Ansara, I. Contribution to the experimental and thermodynamic assessment of the Al-Ca-Fe-Si system—I. Al-Ca-Fe, Al-Ca-Si, Al-Fe-Si and Ca-Fe-Si systems. Calphad 1994, 18, 273–309. [Google Scholar] [CrossRef]
  28. Hillert, M.; Xizhen, W. Thermodynamic calculation of the CaO-MgO system. Calphad 1989, 13, 267–271. [Google Scholar] [CrossRef]
  29. Kjellqvist, L.; Selleby, M.; Sundman, B. Thermodynamic modelling of the Cr–Fe–Ni–O system. Calphad 2008, 32, 577–592. [Google Scholar] [CrossRef] [Green Version]
  30. Selleby, M. An assessment of the Ca-Fe-O-Si system. Metall. Mater. Trans. B 1997, 28, 577–596. [Google Scholar] [CrossRef]
  31. Lacaze, J.; Sundman, B. An assessment of the Fe-C-Si system. Metall. Trans. A 1991, 22, 2211–2223. [Google Scholar] [CrossRef]
  32. Hallstedt, B. The Magnesium—Oxygen system. Calphad 1993, 17, 281–286. [Google Scholar] [CrossRef]
  33. Hillert, M.; Wang, X. A study of the thermodynamic properties of MgO-SiO2 system. Calphad 1989, 13, 253–266. [Google Scholar] [CrossRef]
  34. Hallstedt, B. Thermodynamic calculation of some subsystems of the Al-Ca-Mg-Si-O system. J. Phase Equilibria 1993, 14, 662–675. [Google Scholar] [CrossRef]
  35. Selleby, M. An Assessment of the Fe-O-Si System. Metall. Mater. Trans. B 1997, 28, 563–576. [Google Scholar] [CrossRef]
  36. Gröbner, J.; Chumak, I.; Schmid-Fetzer, R. Experimental study of ternary Ca–Mg–Si phase equilibria and thermodynamic assessment of Ca–Si and Ca–Mg–Si systems. Intermetallics 2003, 11, 1065–1074. [Google Scholar] [CrossRef]
  37. Hillert, M.; Jansson, B.; Sundman, B. A two-sublattice model for molten solutions with different tendency for ionization. Metall. Trans. A 1985, 16, 261–266. [Google Scholar] [CrossRef]
  38. Sundman, B. Modification of the two-sublattice model for liquids. Calphad 1991, 15, 109–119. [Google Scholar] [CrossRef]
  39. Thermodynamics of Advanced Fuels-International Database (TAF-ID). Nucl. Energy Agency NEA (n.d.). Available online: https://www.oecd-nea.org/jcms/pl_24703/thermodynamics-of-advanced-fuels-international-database-taf-id (accessed on 20 January 2023).
  40. Thompson, A.B.; Aerts, M.; Hack, A.C. Liquid Immiscibility in Silicate Melts and Related Systems. Rev. Mineral. Geochem. 2007, 65, 99–127. [Google Scholar] [CrossRef]
  41. Hudon, P.; Baker, D.R. The nature of phase separation in binary oxide melts and glasses. I. Silicate systems. J. Non-Cryst. Solids 2002, 303, 299–345. [Google Scholar] [CrossRef]
  42. Gaskell, D.R. Introduction to the Thermodynamics of Materials, 5th ed.; Taylor & Francis Group, LLC.: New York, NY, USA, 2008. [Google Scholar]
  43. JF, S.; Yagi, K. The system FeO-Al2O3-SiO2. J. Jpn. Assoc. Mineral. Petrol. Econ. Geol. 1953, 37, 83–102. [Google Scholar]
  44. Nernst, W. Verteilung eines Stoffes zwischen zwei Lösungsmitteln und zwischen Lösungsmittel und Dampfraum. Z. Phys. Chem. 1891, 8, 110–139. [Google Scholar] [CrossRef]
Figure 5. Predicted Nernst distribution coefficients between two liquids vs. those derived by analytical measurements for (a) LFe-dispersed and (b) LSi-dispersed. Dashed curves correspond to analytical measurements and colors correspond to different components (FeO-red, SiO2-green, Al2O3-blue, CaO-orange, MgO-purple).
Applsci 13 03220 g005
Disclaimer/Publisher’s Note: The statements, opinions and data contained in all publications are solely those of the individual author(s) and contributor(s) and not of MDPI and/or the editor(s). MDPI and/or the editor(s) disclaim responsibility for any injury to people or property resulting from any ideas, methods, instructions or products referred to in the content.

