
Energy Efficient Routing Protocol for an IoT-Based WSN System to Detect Forest Fires

Abstract
:1. Introduction
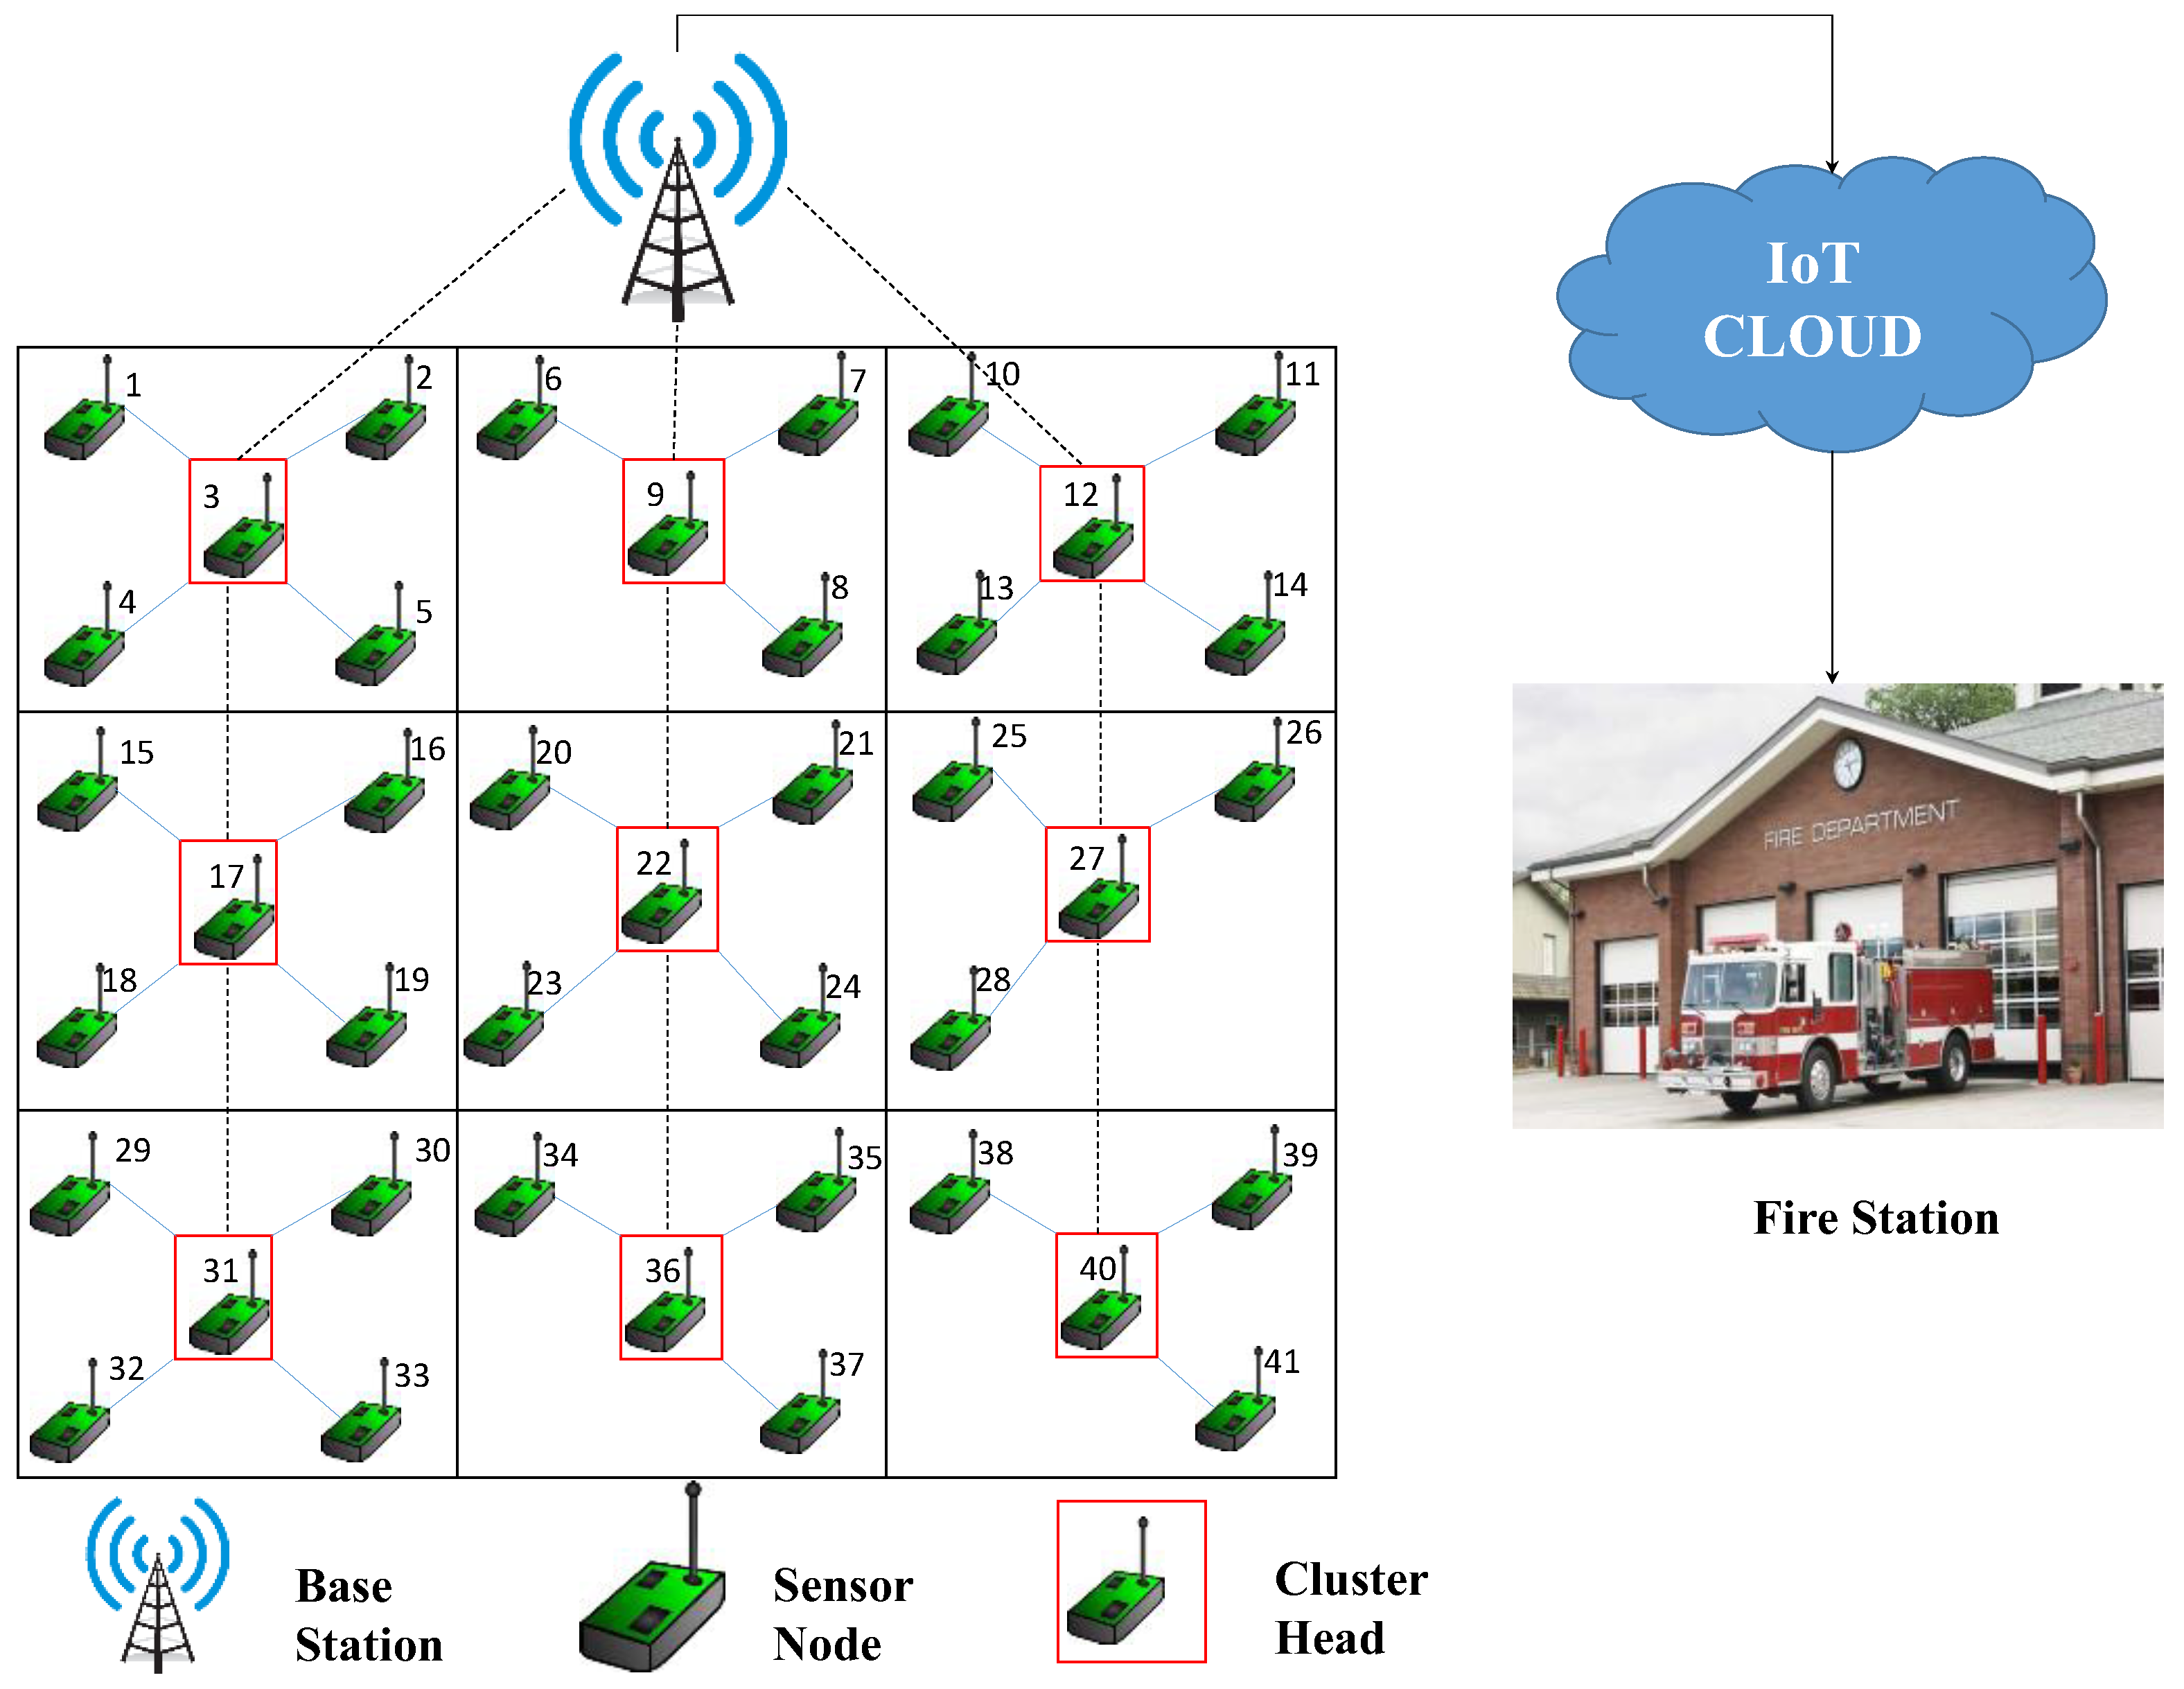
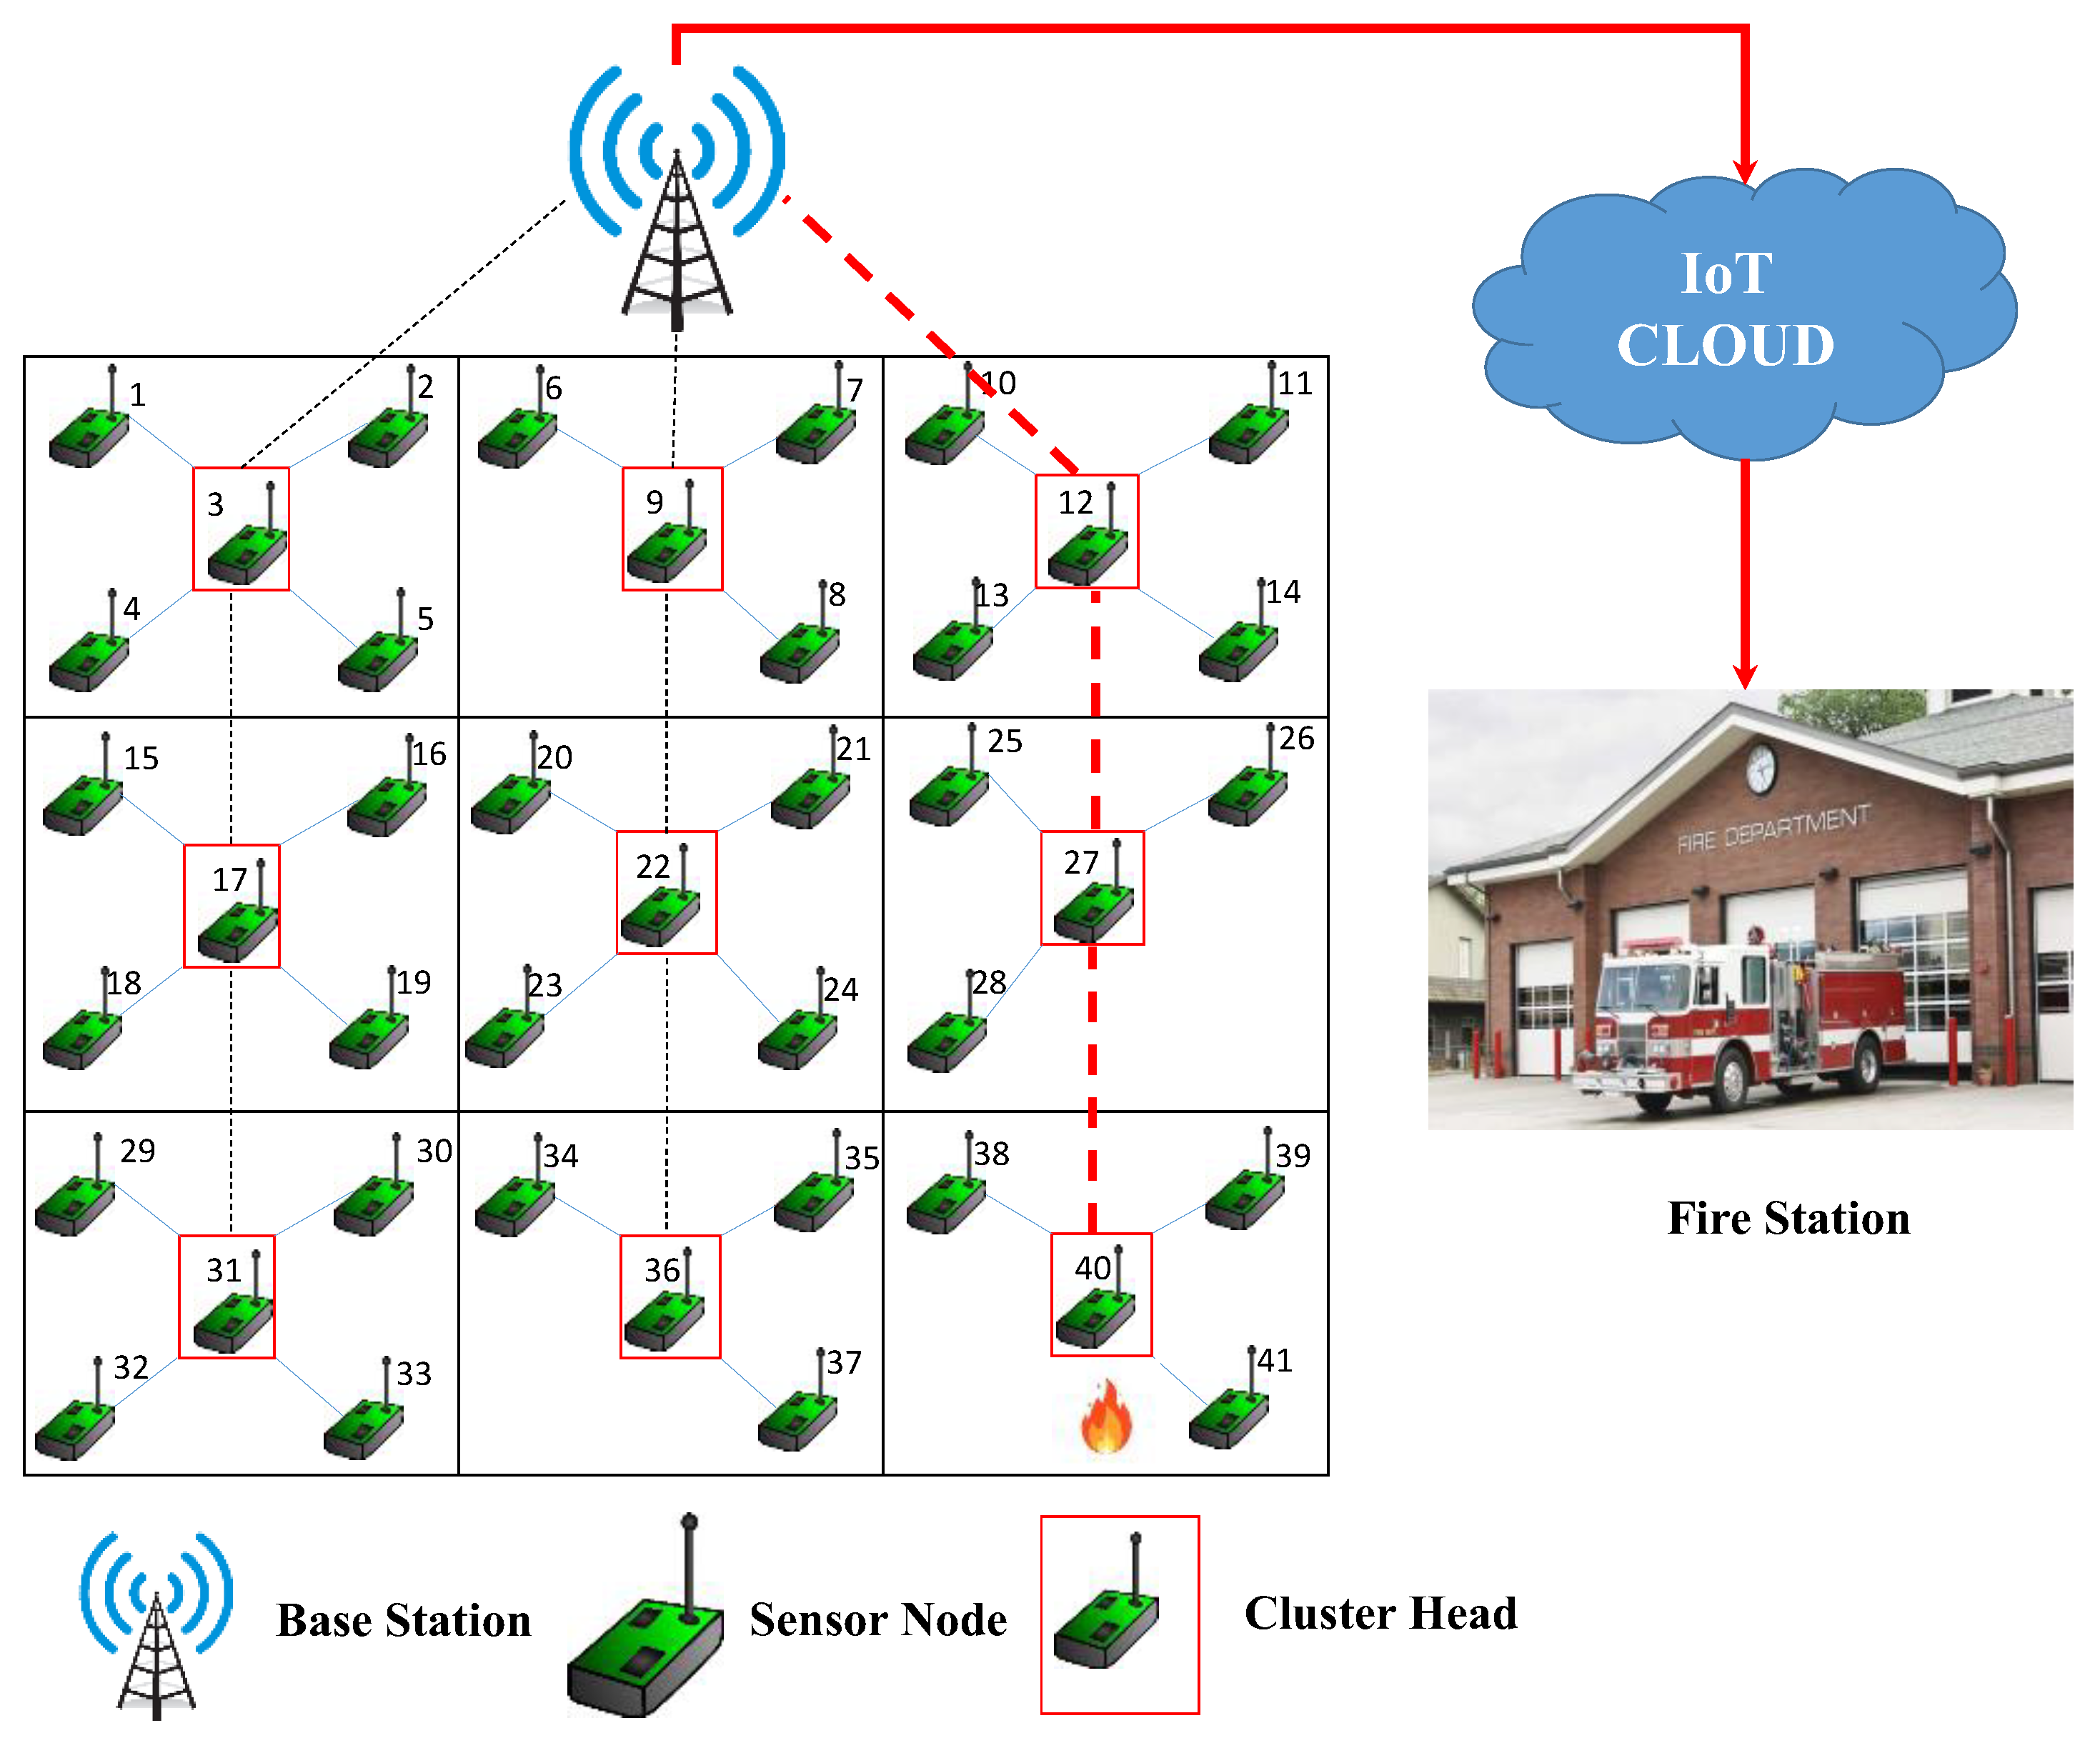
- This paper discusses a TDMA-based MAC protocol named Energy Efficient Routing Protocol (EERP) that uses energy-efficient clustering and routing algorithms. EERP employs a novel CH selection mechanism to ensure that all CHs are uniformly distributed in the network. To communicate with the CHs in the network, the BS creates multi-hop paths. So, the CHs do not have to communicate with the BS using high-power signals (long-range transmissions) that are energy exhaustive. To ensure that the load is distributed evenly across all the nodes in the network, an efficient CH rotation mechanism is also used.
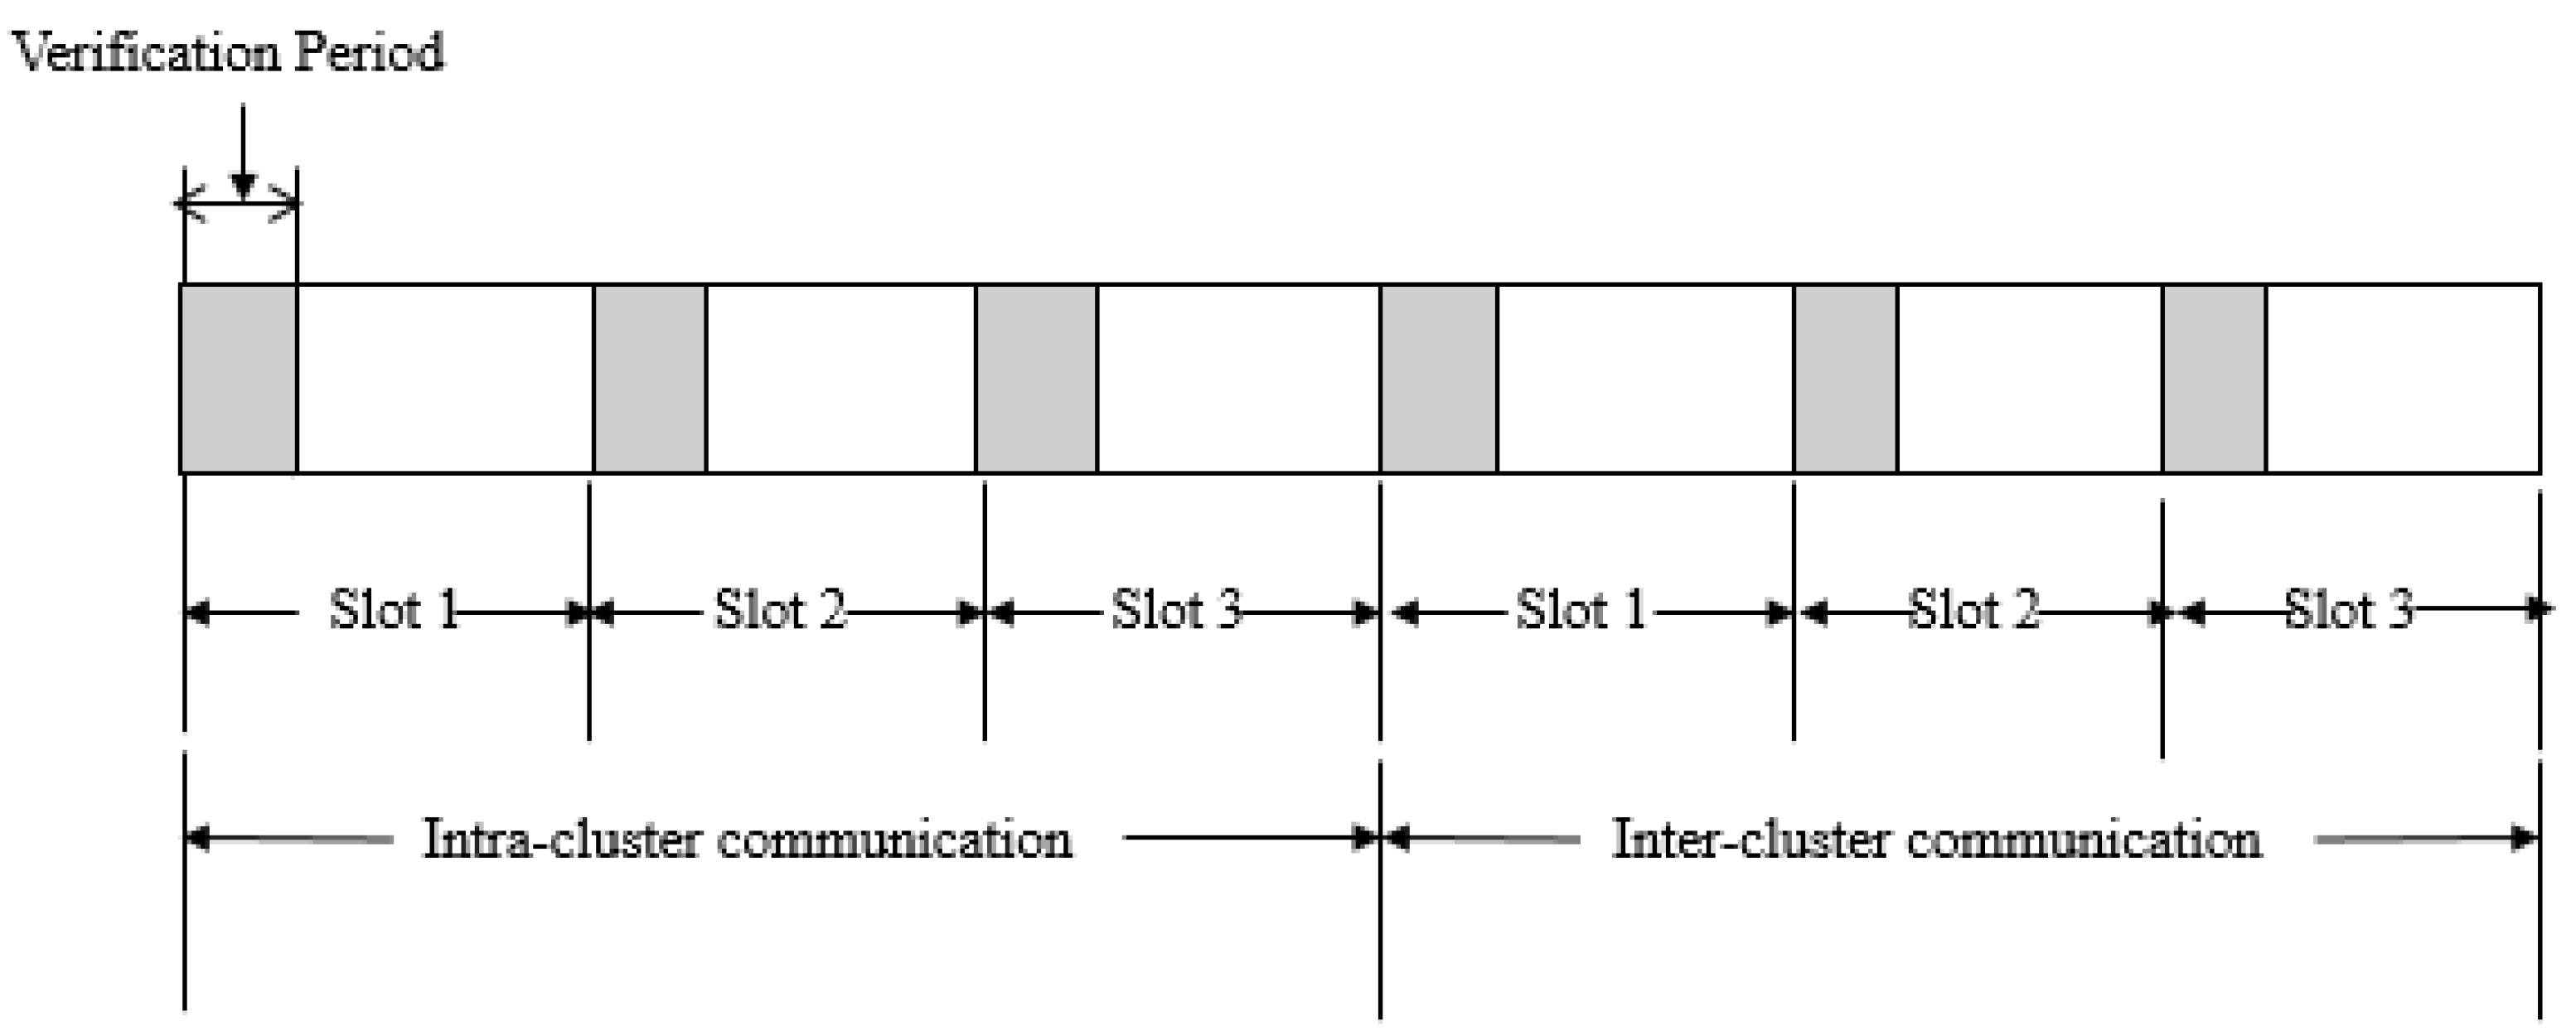
- EERP considers three important parameters to do its job - Distance to the Event (DE), Threshold Energy (TE), and Verification Period (VP). The DE (predefined value in meters) ensures that only the nodes in the proximity of an event report it. The sensor nodes located more than DE meters away from the event do not report the event to their CHs. The TE value ensures that sensor nodes with low energy levels do not become CHs. The VP is a small time duration in each slot in which a CH checks the medium for any signal from the slot owner. The VP contributes to reducing idle listening in CHs.
- The proposed model assumes that the target area (forest area) is composed of small sub-areas or grids. In each grid, one CH is appointed to collect data from the rest of the nodes in the grid. These data are sent to the BS via one of the multi-hop routes established during the cluster formation phase. As WSNs are usually deployed to monitor very large forest areas, single-hop transmissions to the BS can be very costly.
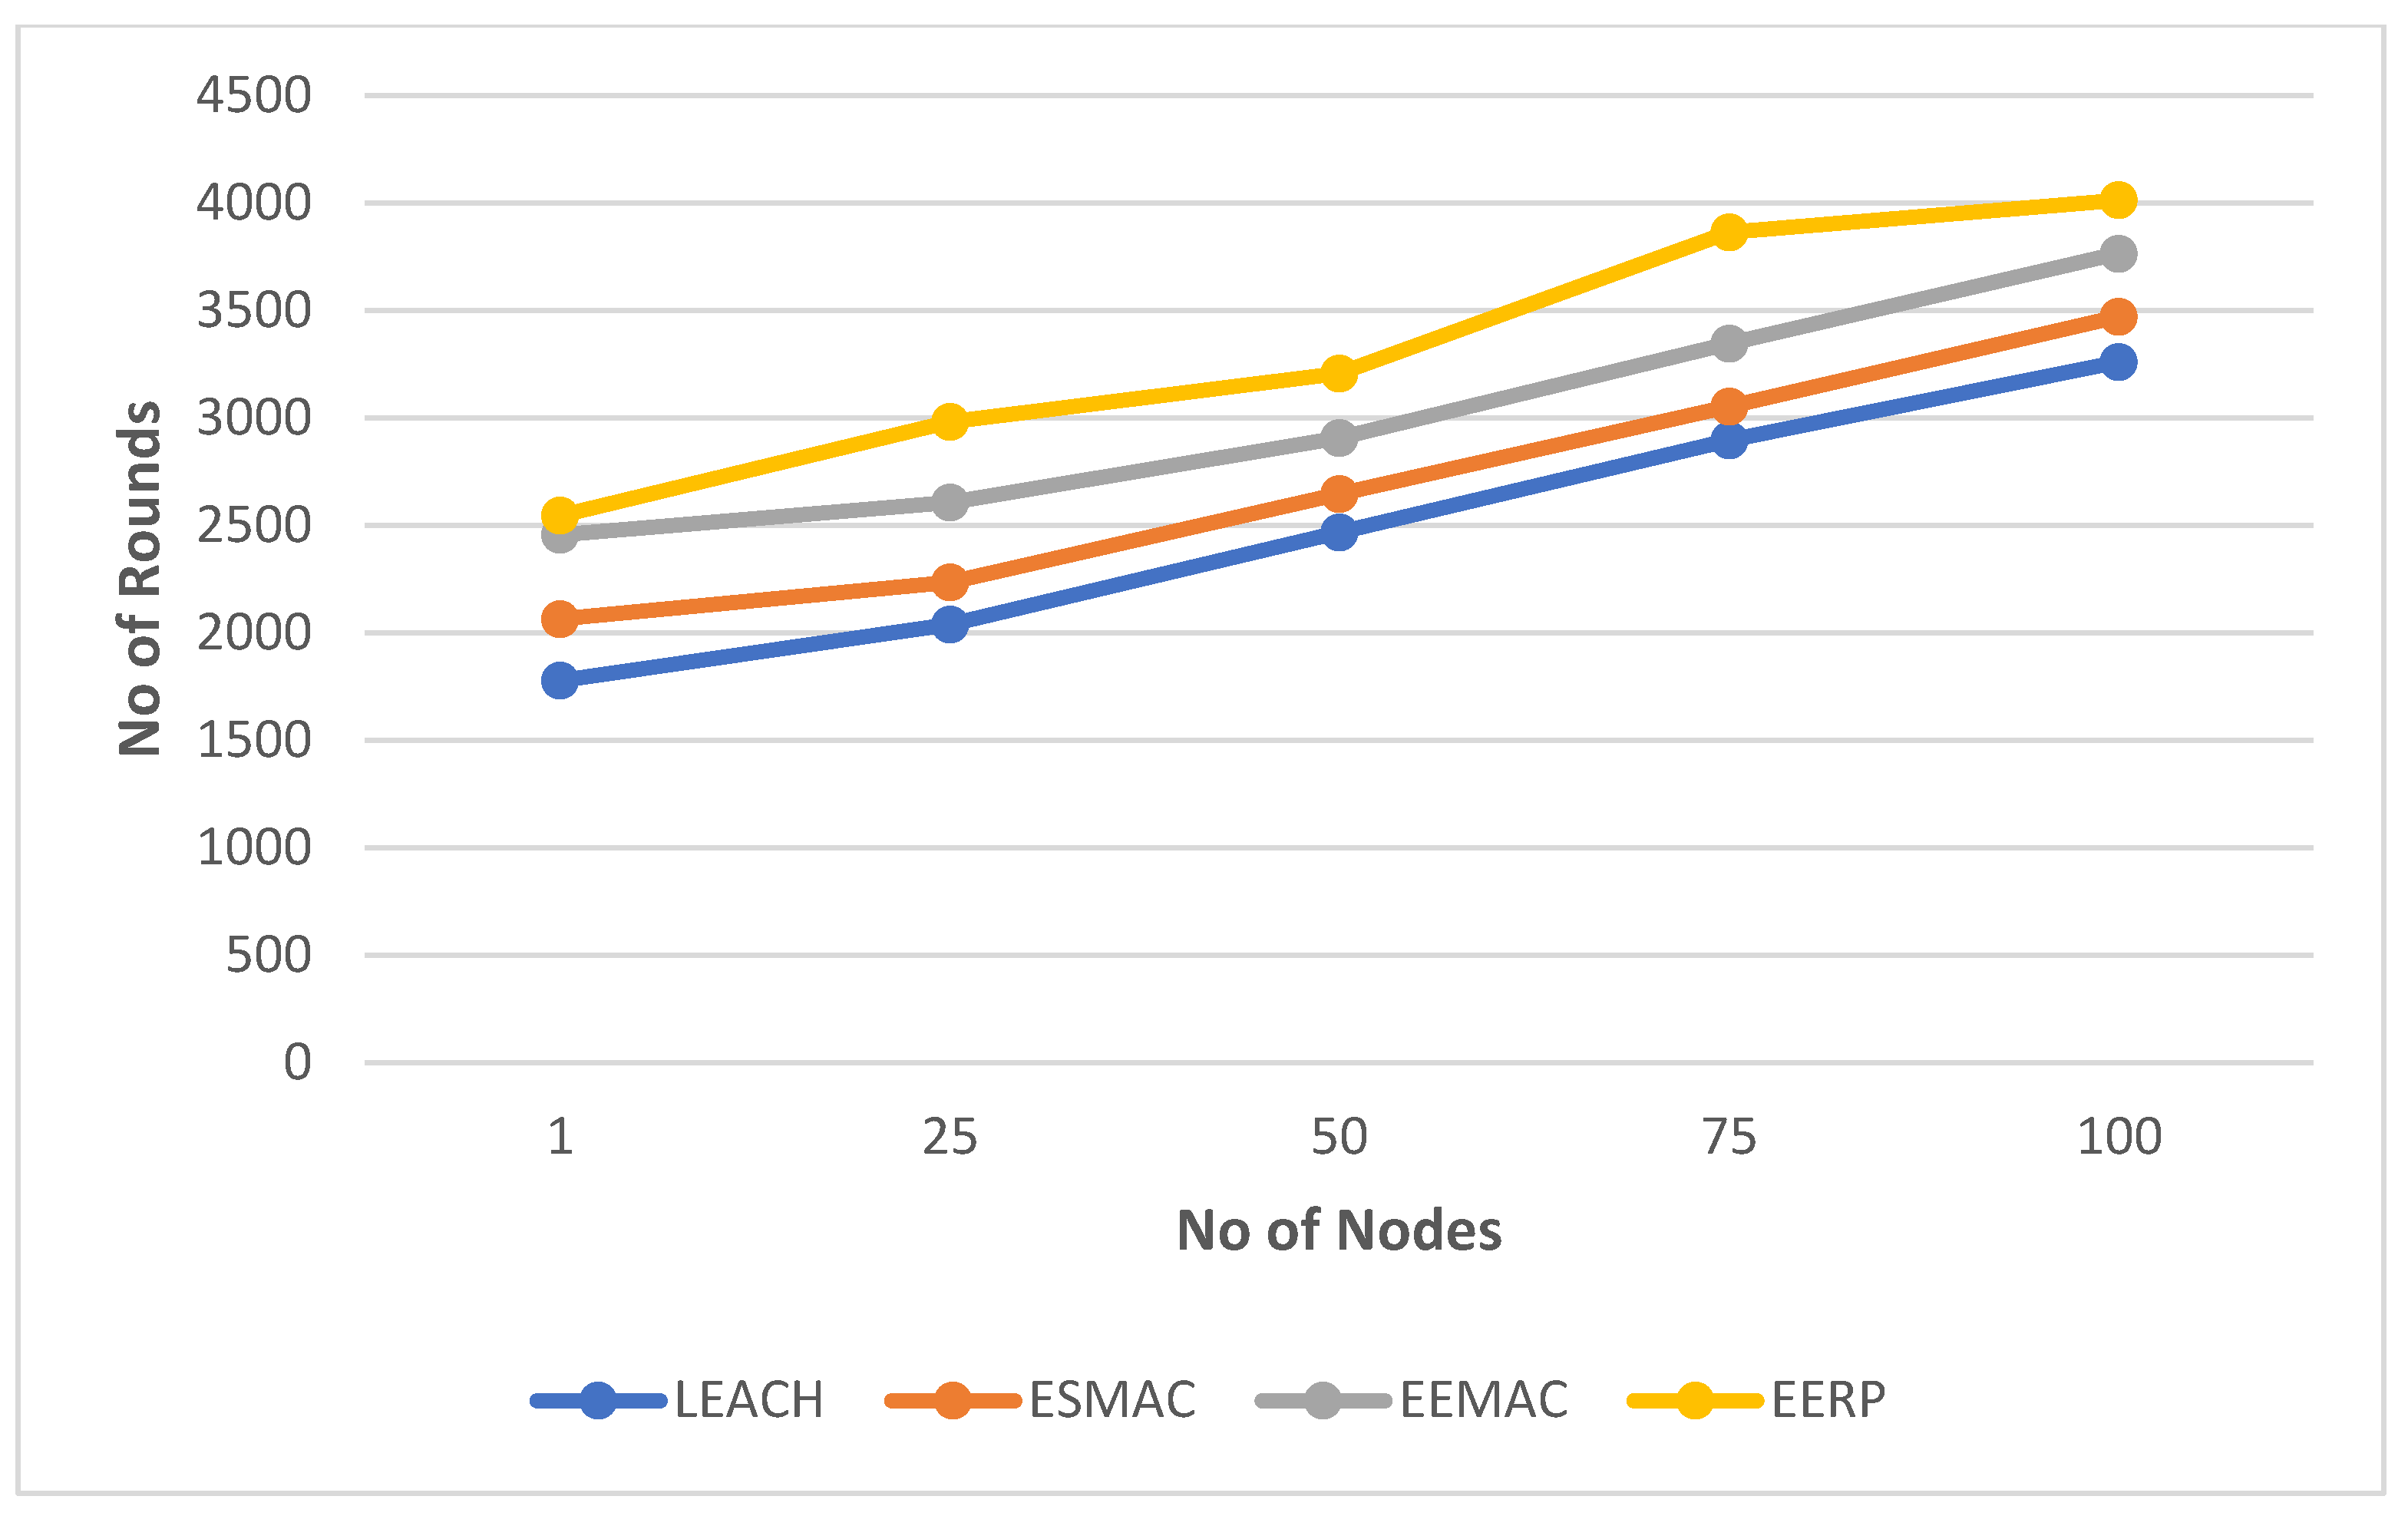
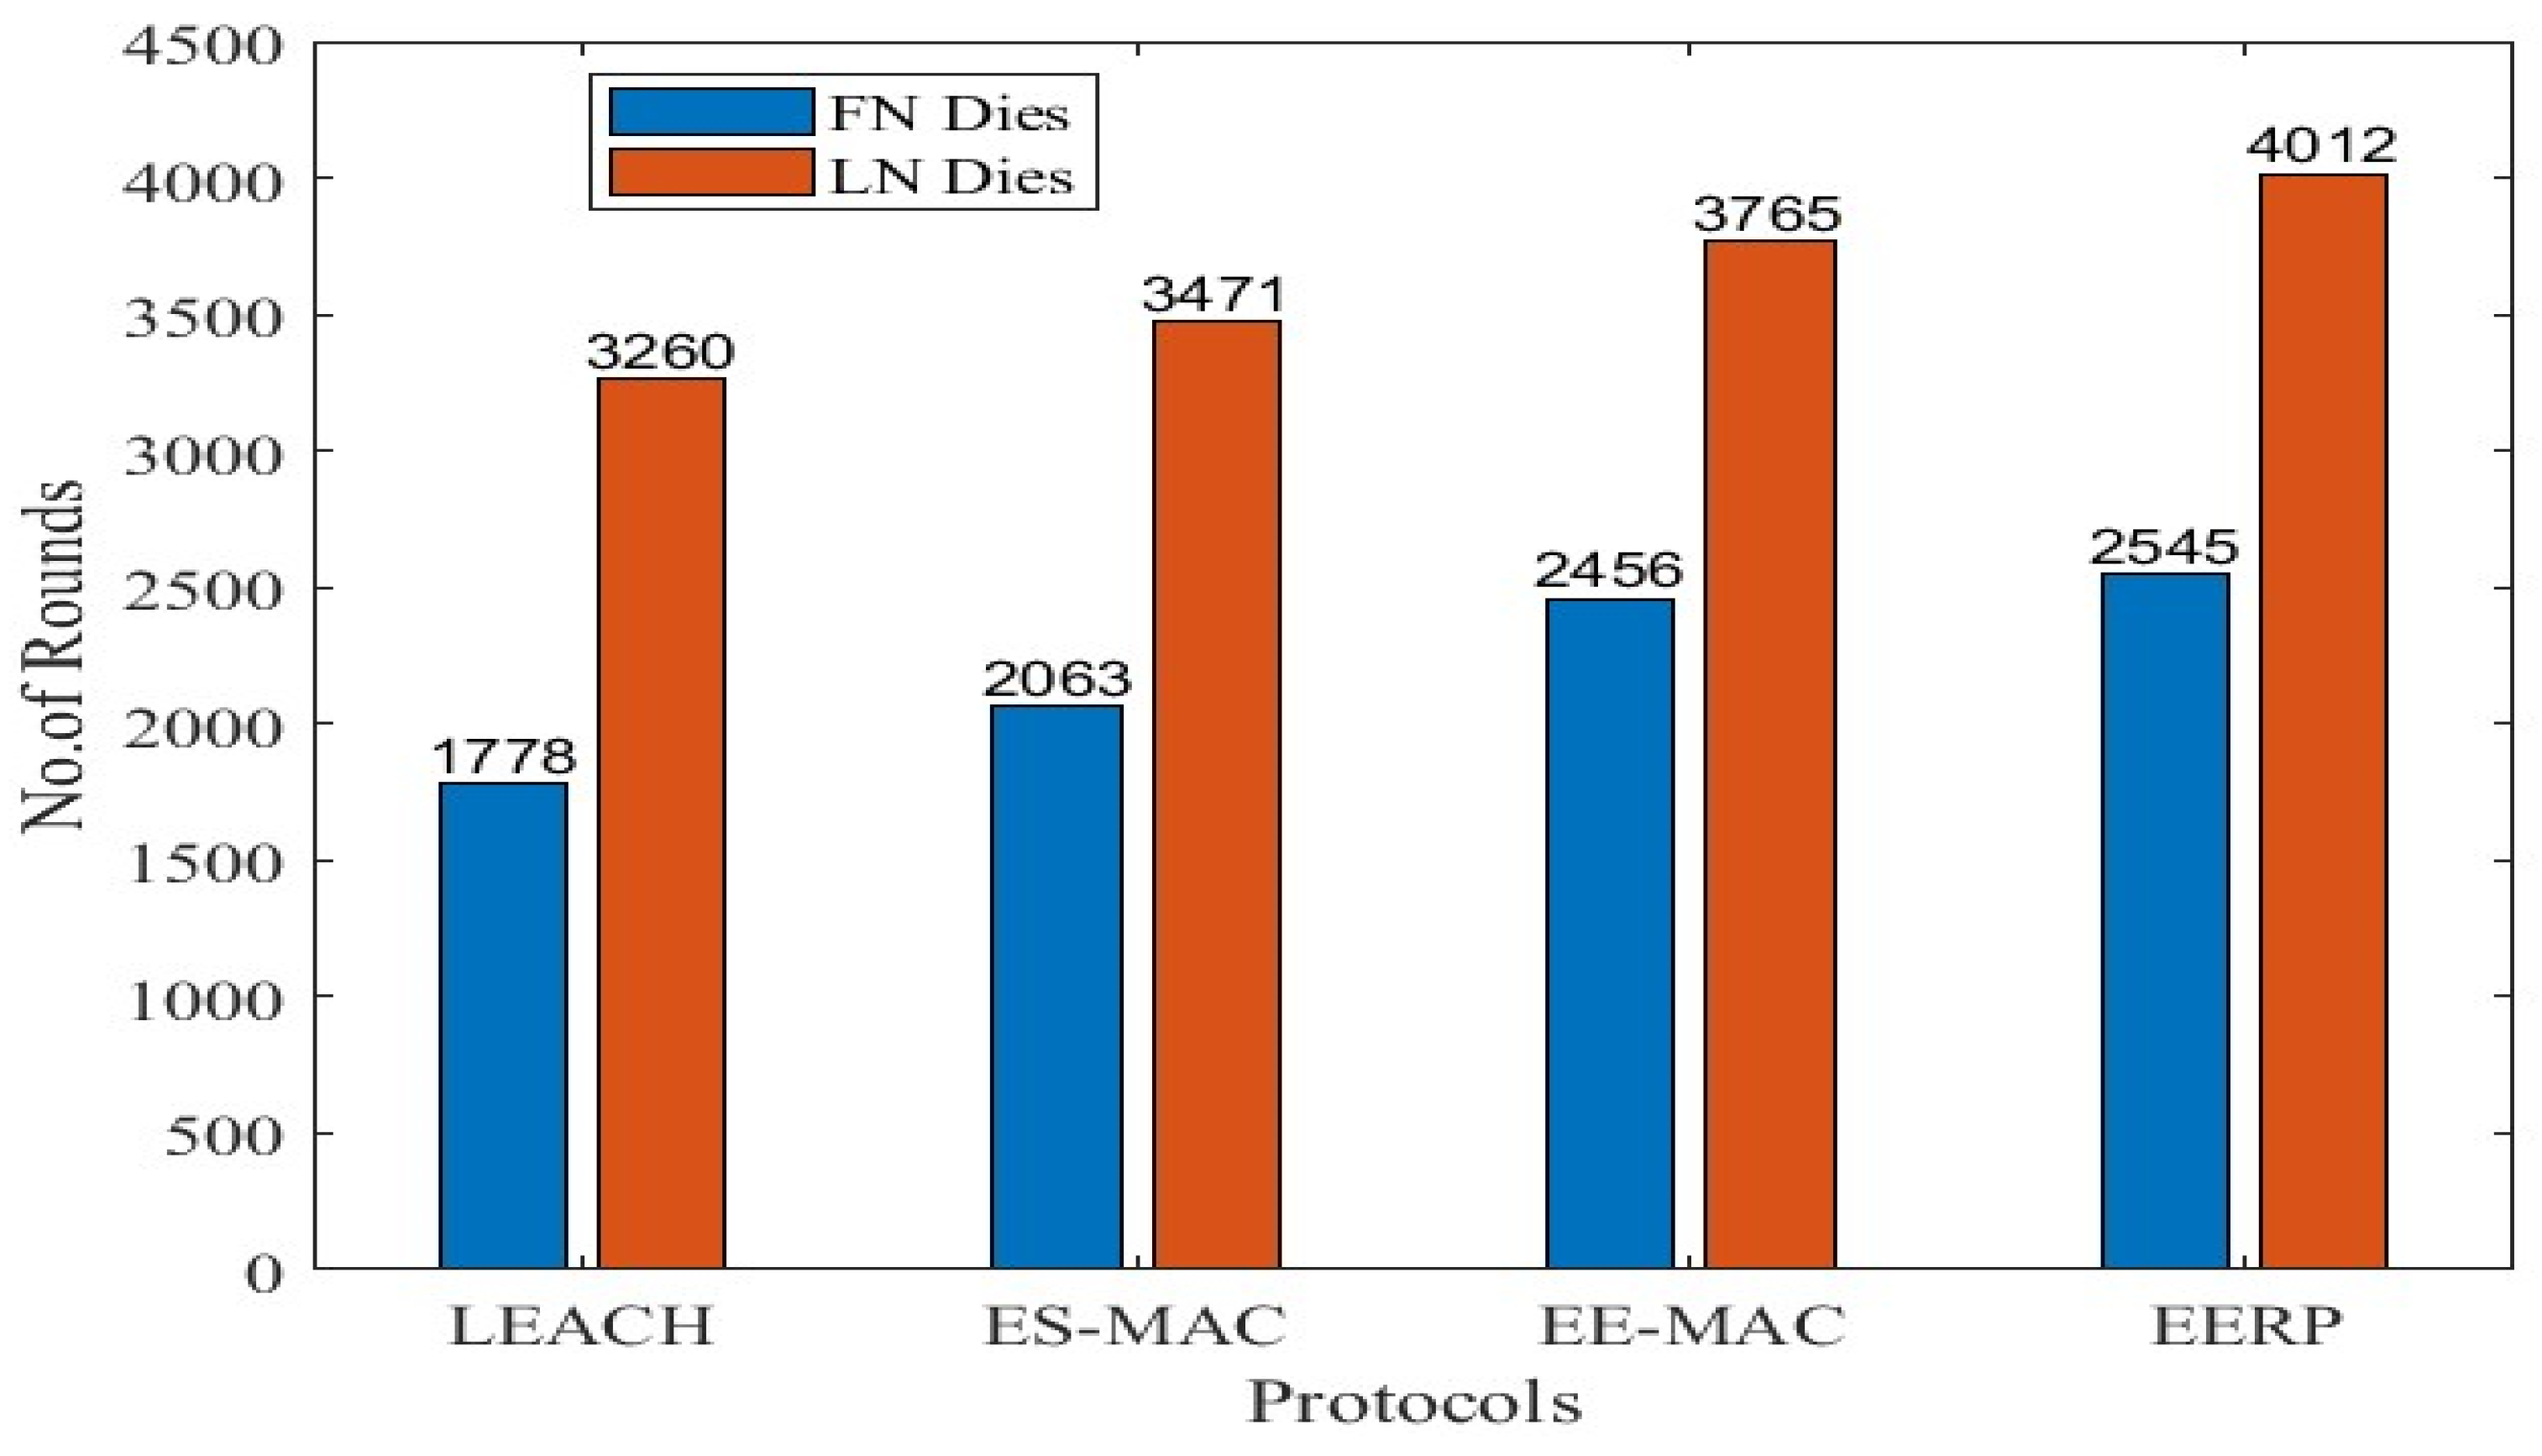
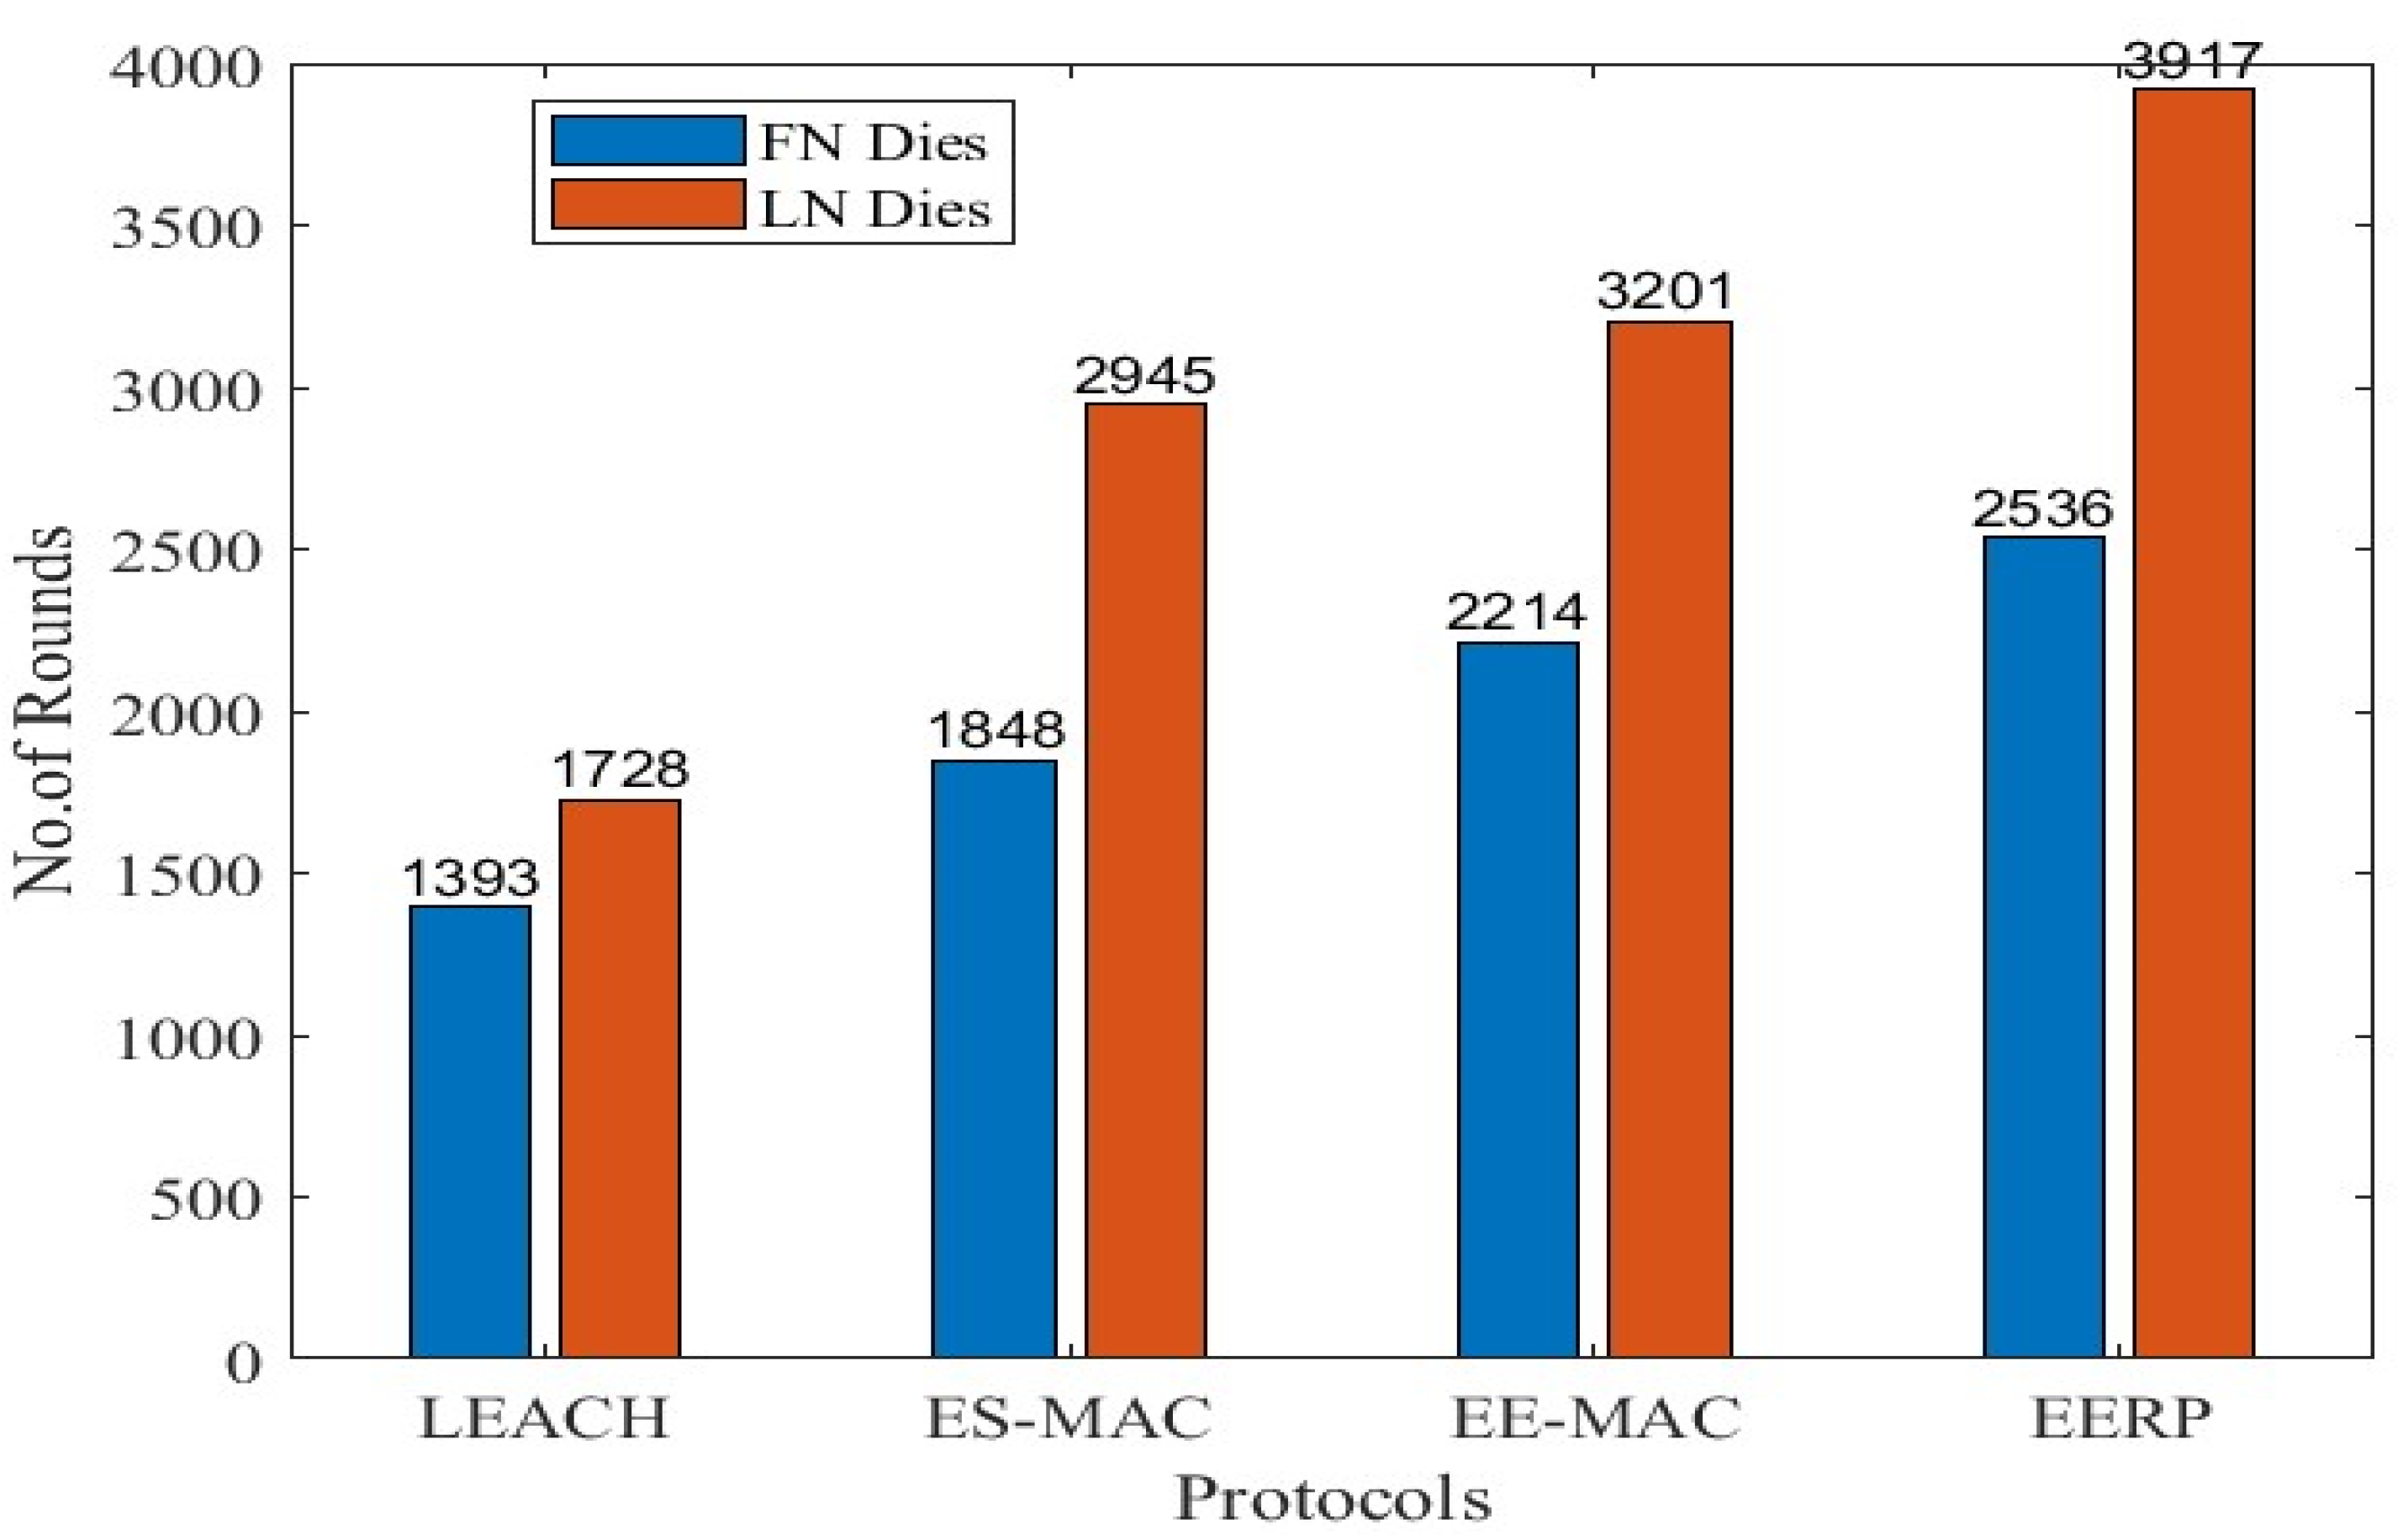
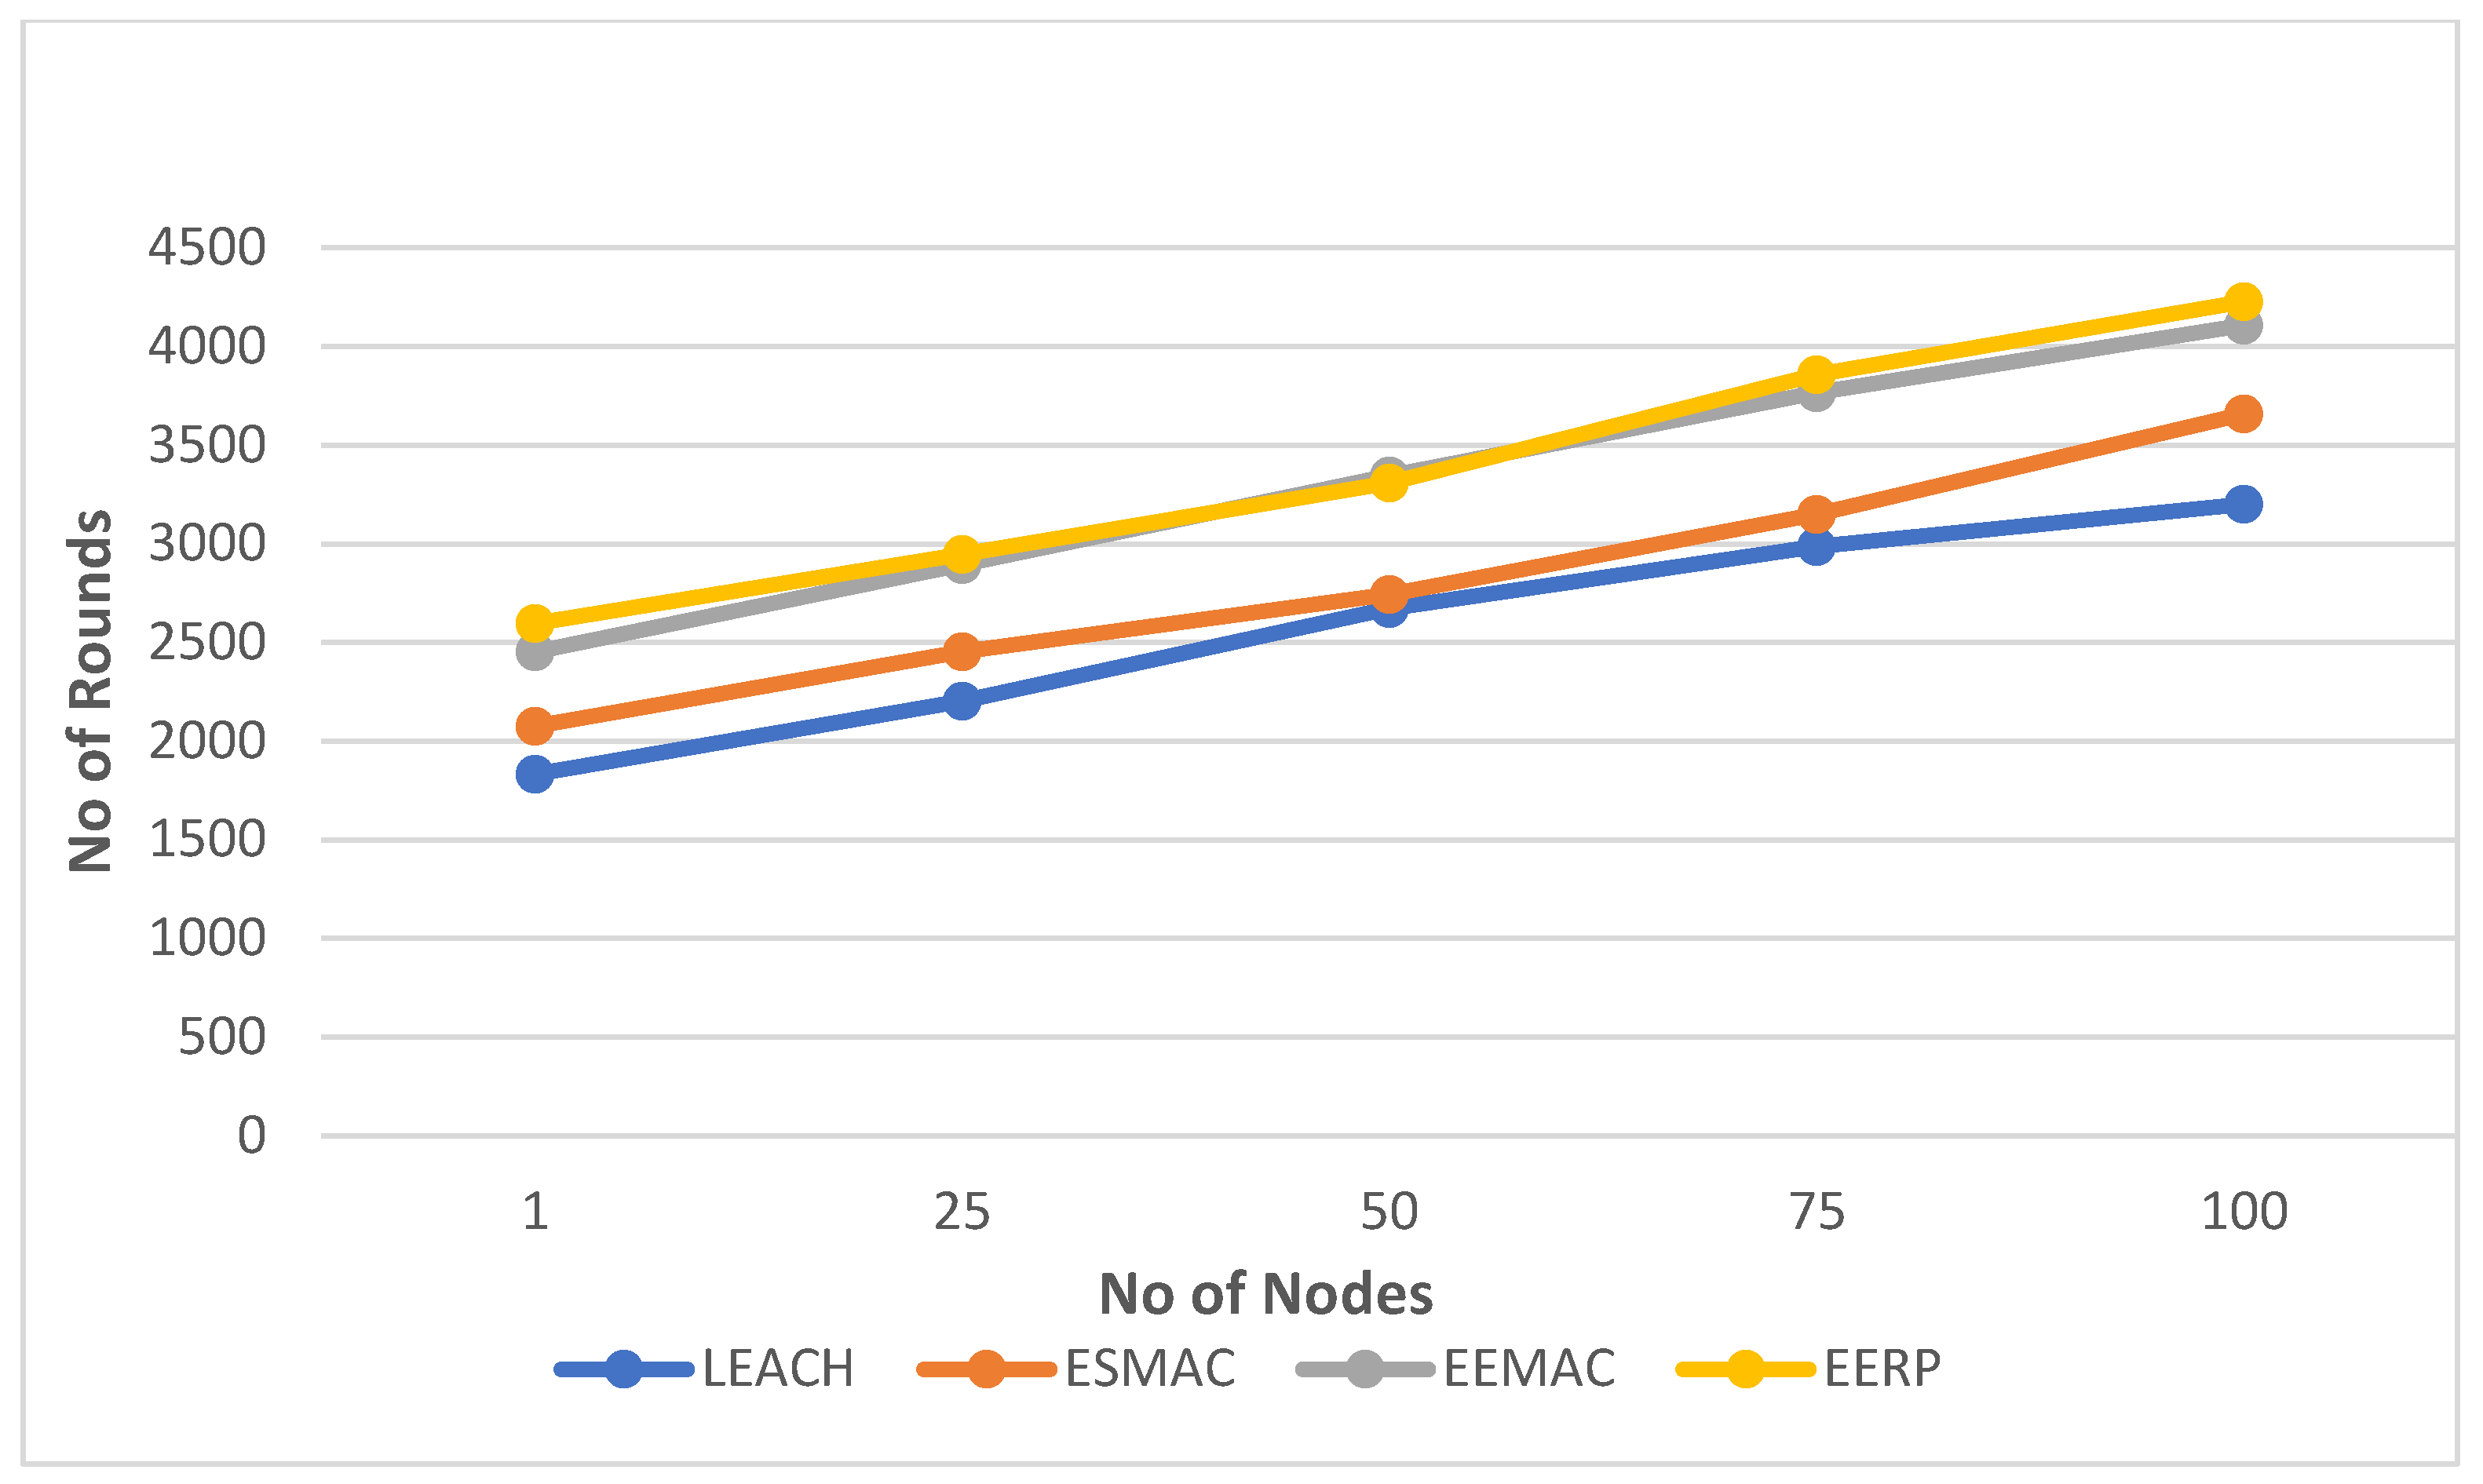
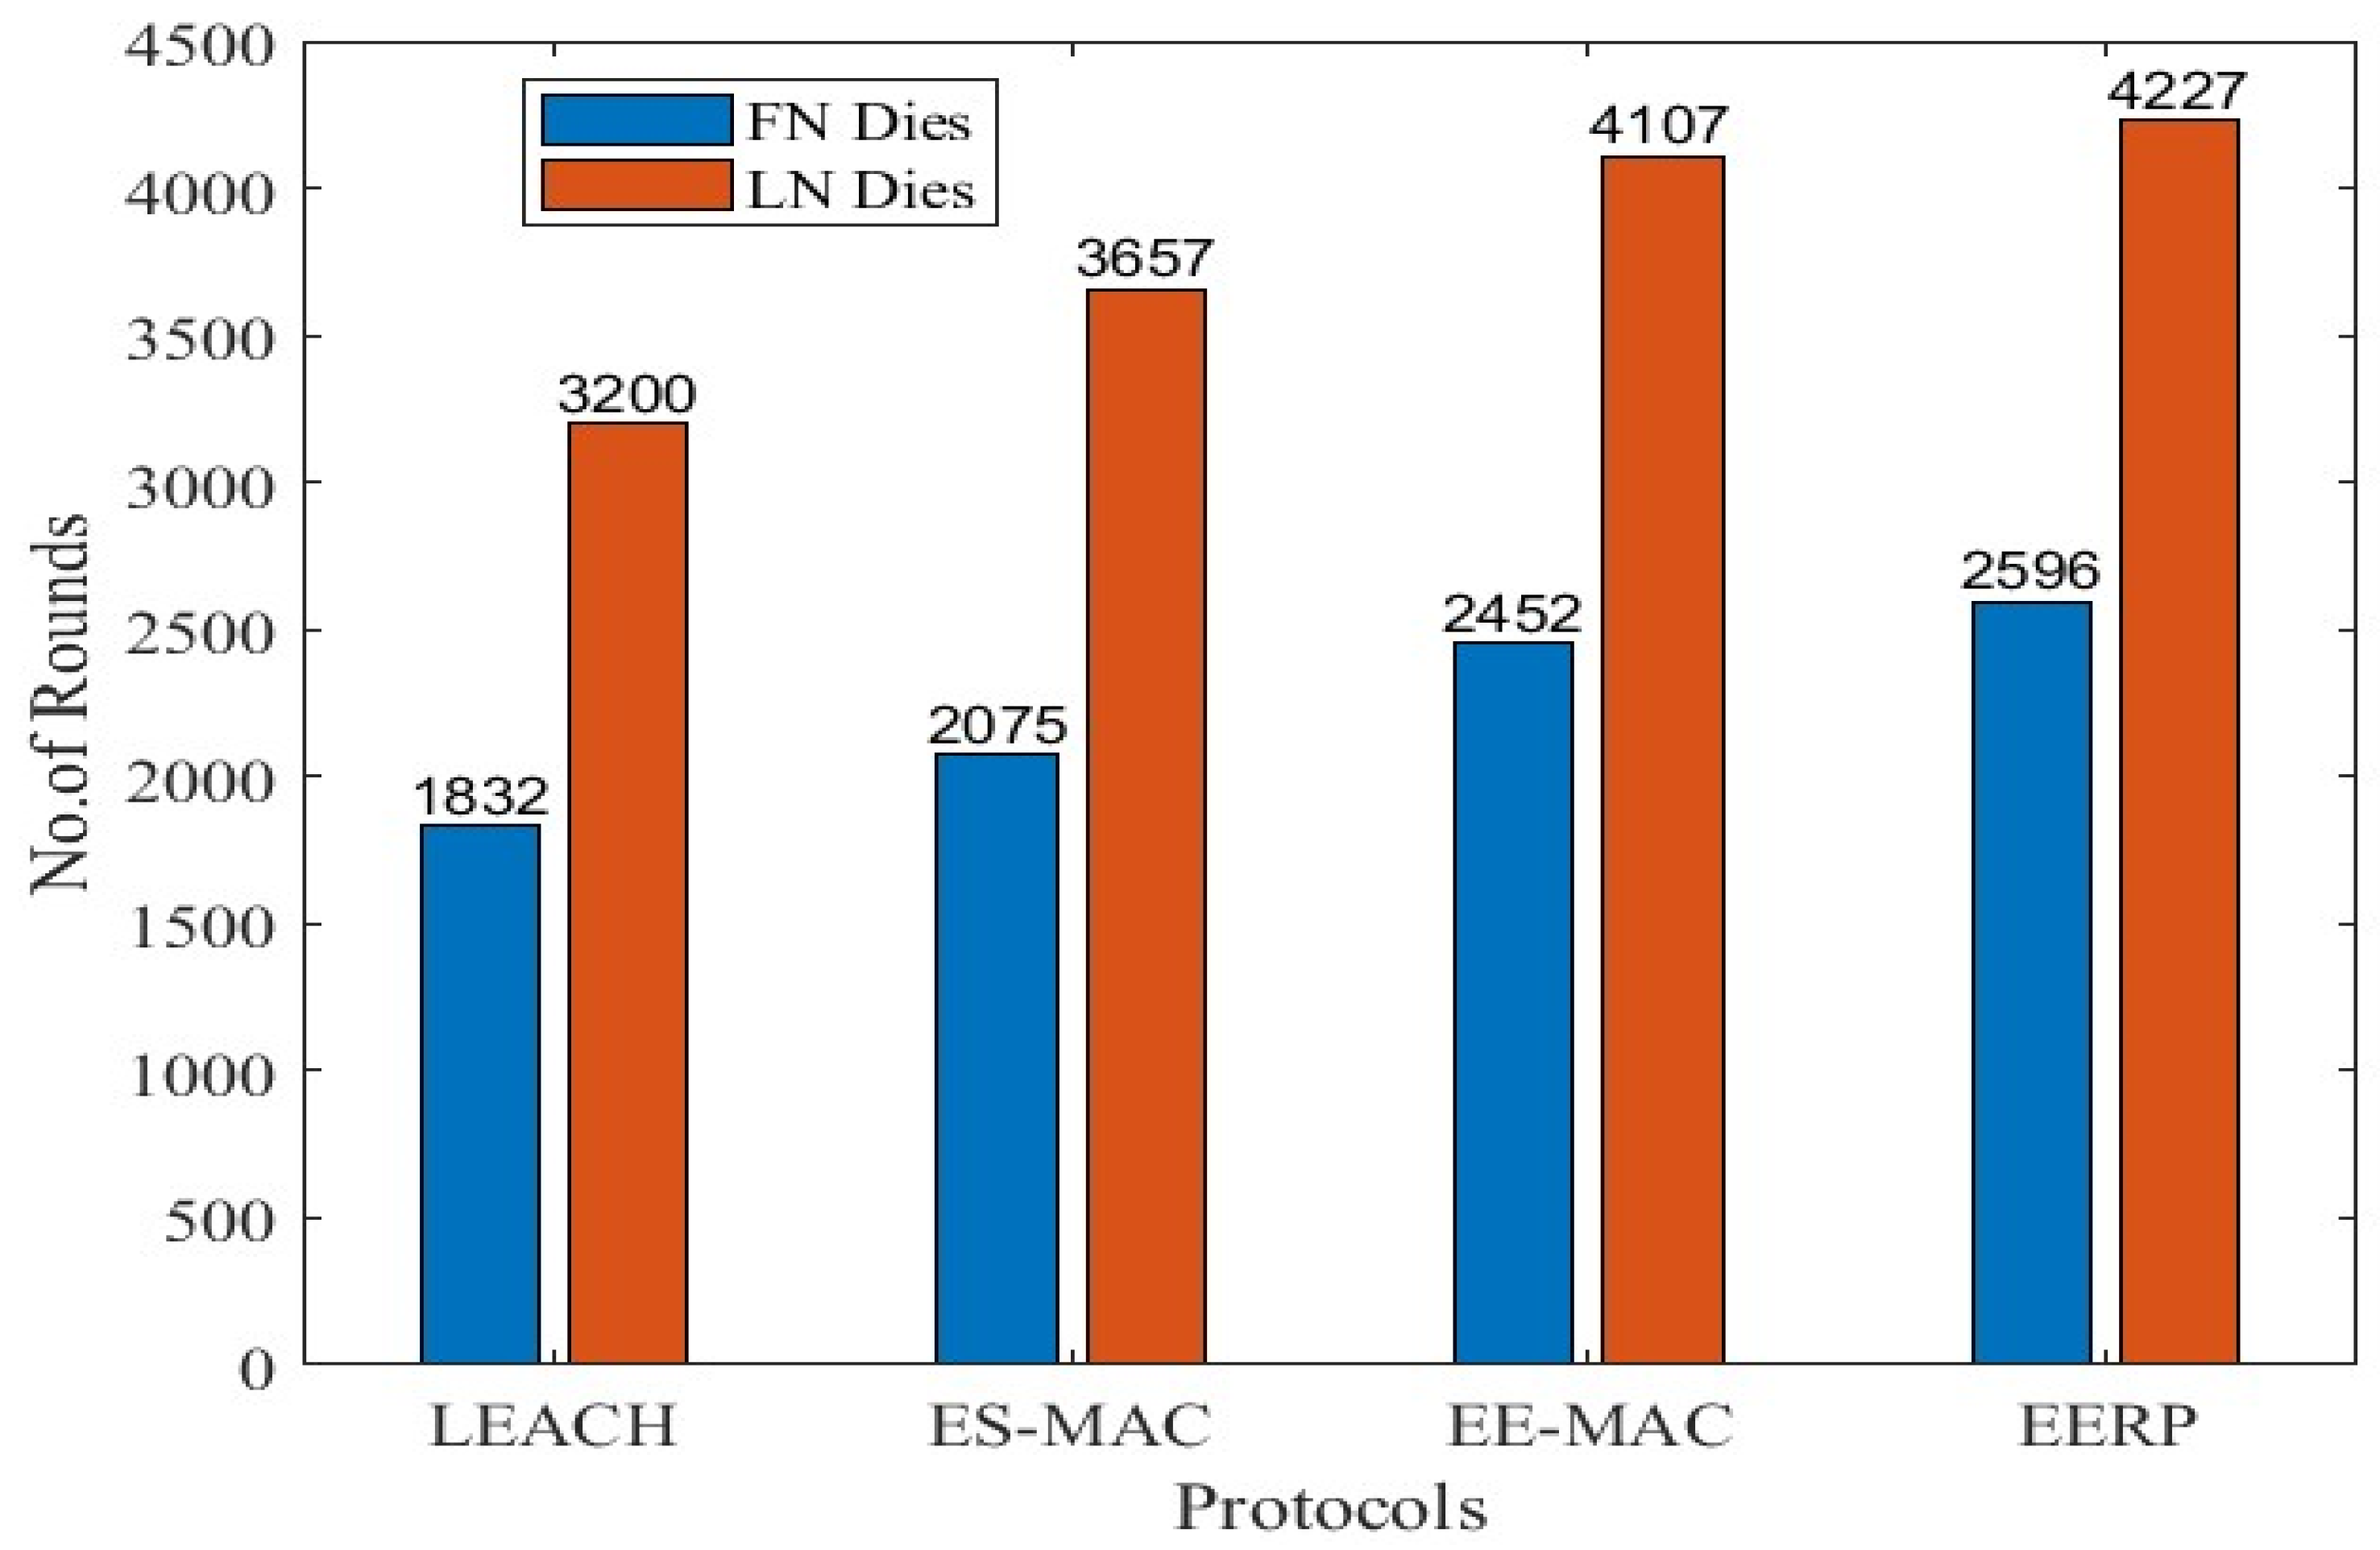
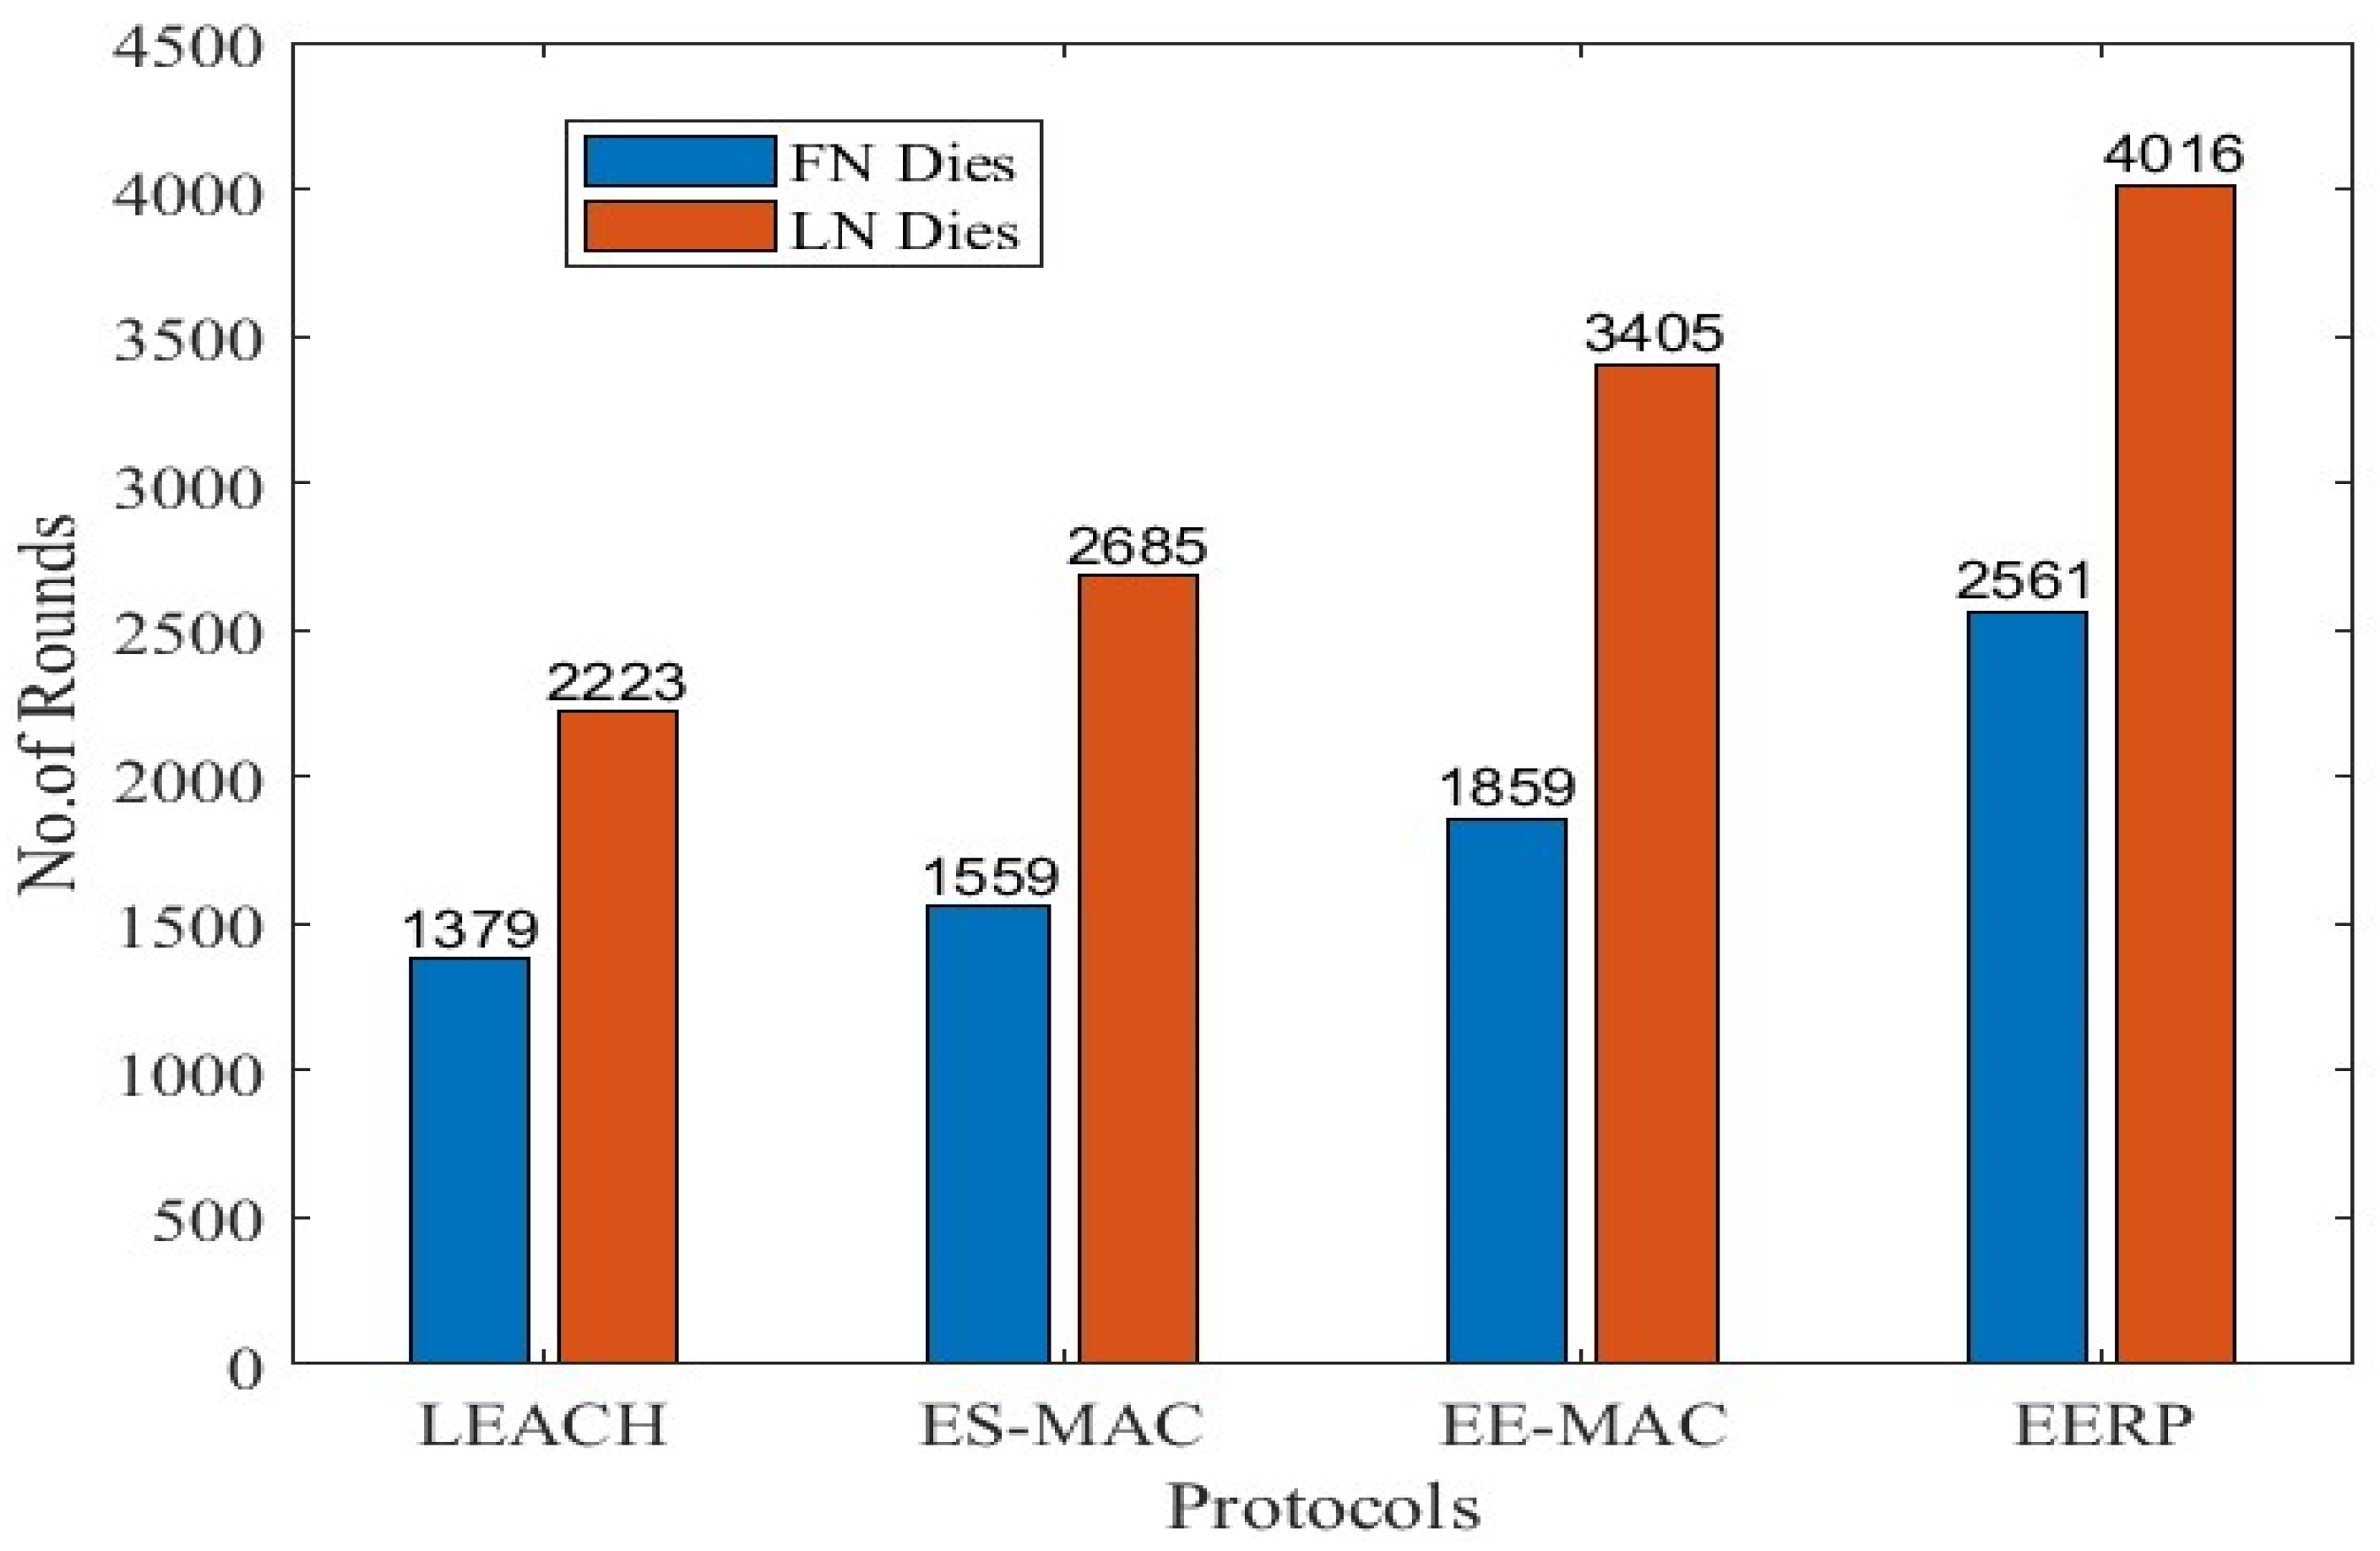
- In the result section, the performance of EERP is compared with that of some existing energy-efficient TDMA-based MAC protocols. The simulation results prove that the proposed model performs better in reducing the energy consumption in sensor nodes and extending the lifetime of WSNs.
2. Related Work
3. Proposed Model
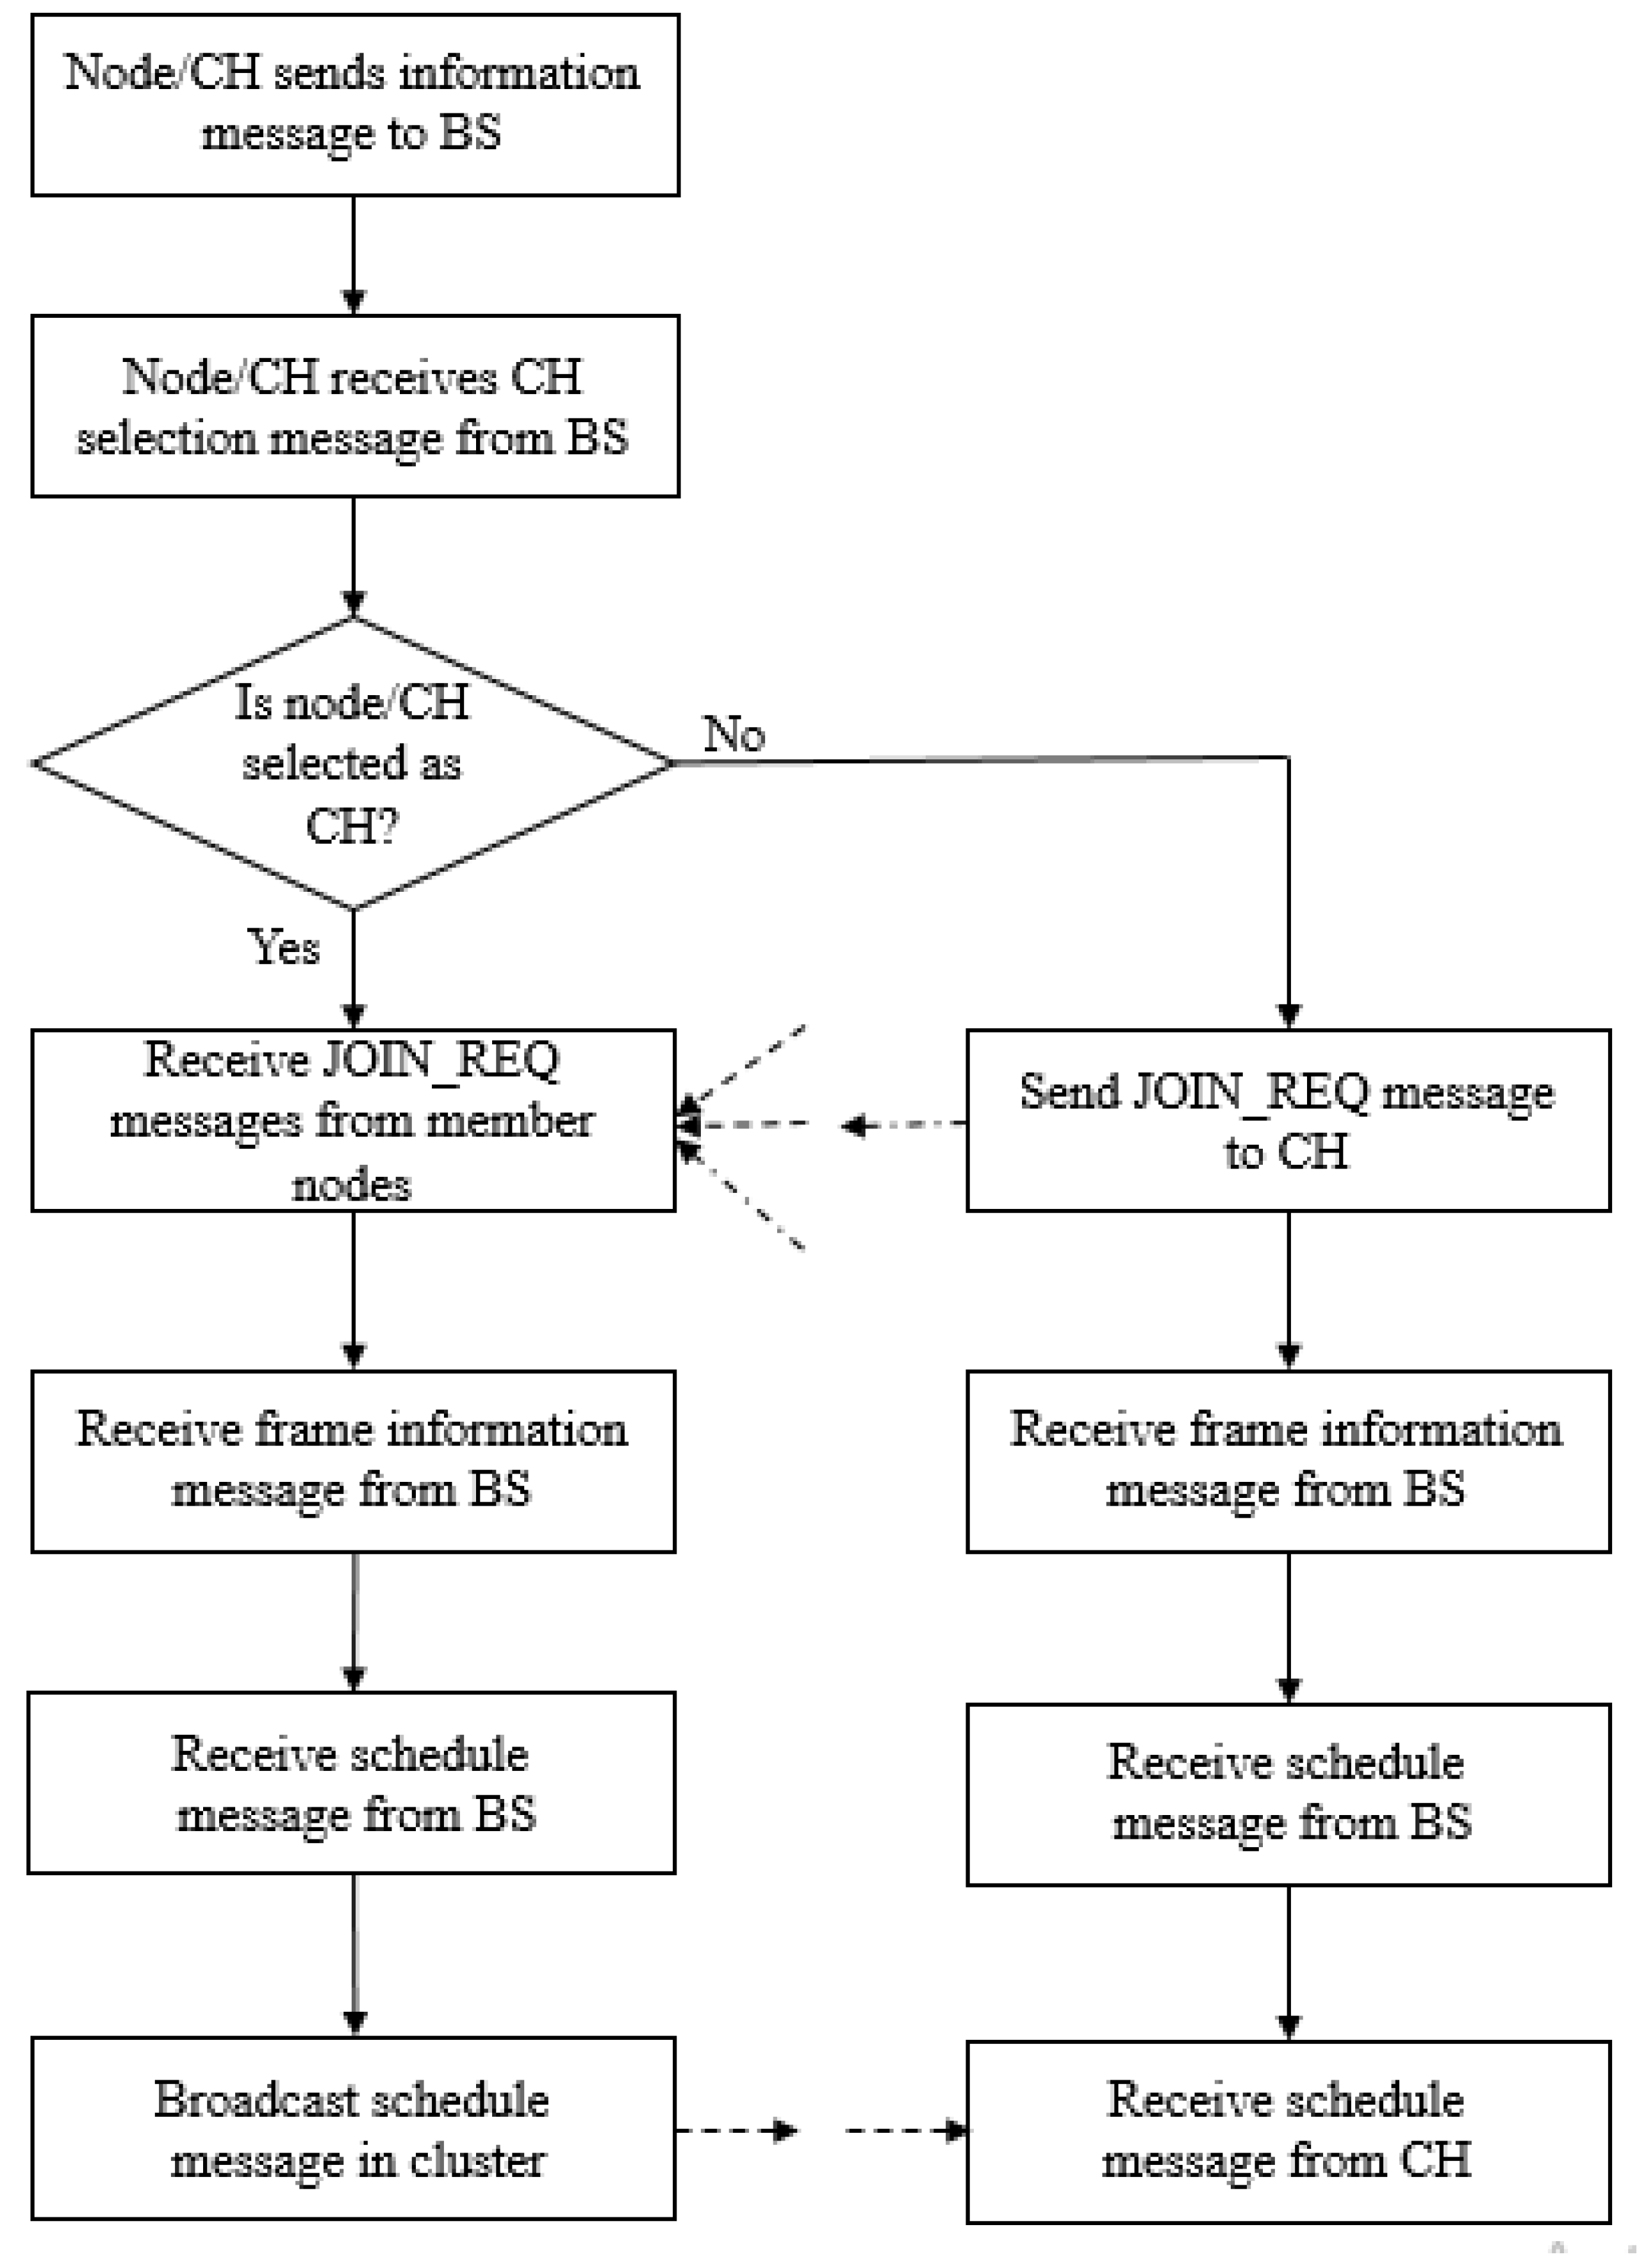
3.1. Setup Phase
| Algorithm 1: Pseudo-code for Setup-phase |
| 1: Input: Sensor nodes deployed in target area 2: Output: Formation of clusters in target area 3: N= number of CHs/grids 4: n= number of cluster nodes 5: m= number of nodes in the target area 6: i = 0, j = 0, k = 0, l = 0, c = 0 7: for i = 1 to m 8: each node sends INF message to BS 9: end for 10: for i = 1 to N 11: for j = 1 to n 12: if (RE > UT) 13: node can participate in CH selection procedure 14: c = c + 1 15: else 16: node will become an ordinary node 17: end if 18: end for 19: end for 20: for i = 1 to N 21: for k = 1 to c 22: if (RE = max(RE)) 23: node appointed as CH 24: else 25: node will become ordinary node 26: end if 27: end for 28: end for 29: for i = 1 to m 30: each node receives CH selection message from BS 31: end for 32: for i = 1 to n−1 33: each ordinary node sends JOIN_REQ message to its CH 34: end for 35: for i = 1 to m 36: each node receives frame information message from BS 37: end for 38: for i = 1 to m 39: each node receives schedule message from BS 40: end for 41: for i = 1 to n−11 42: each ordinary node receives schedule message from its CH 43: end for |
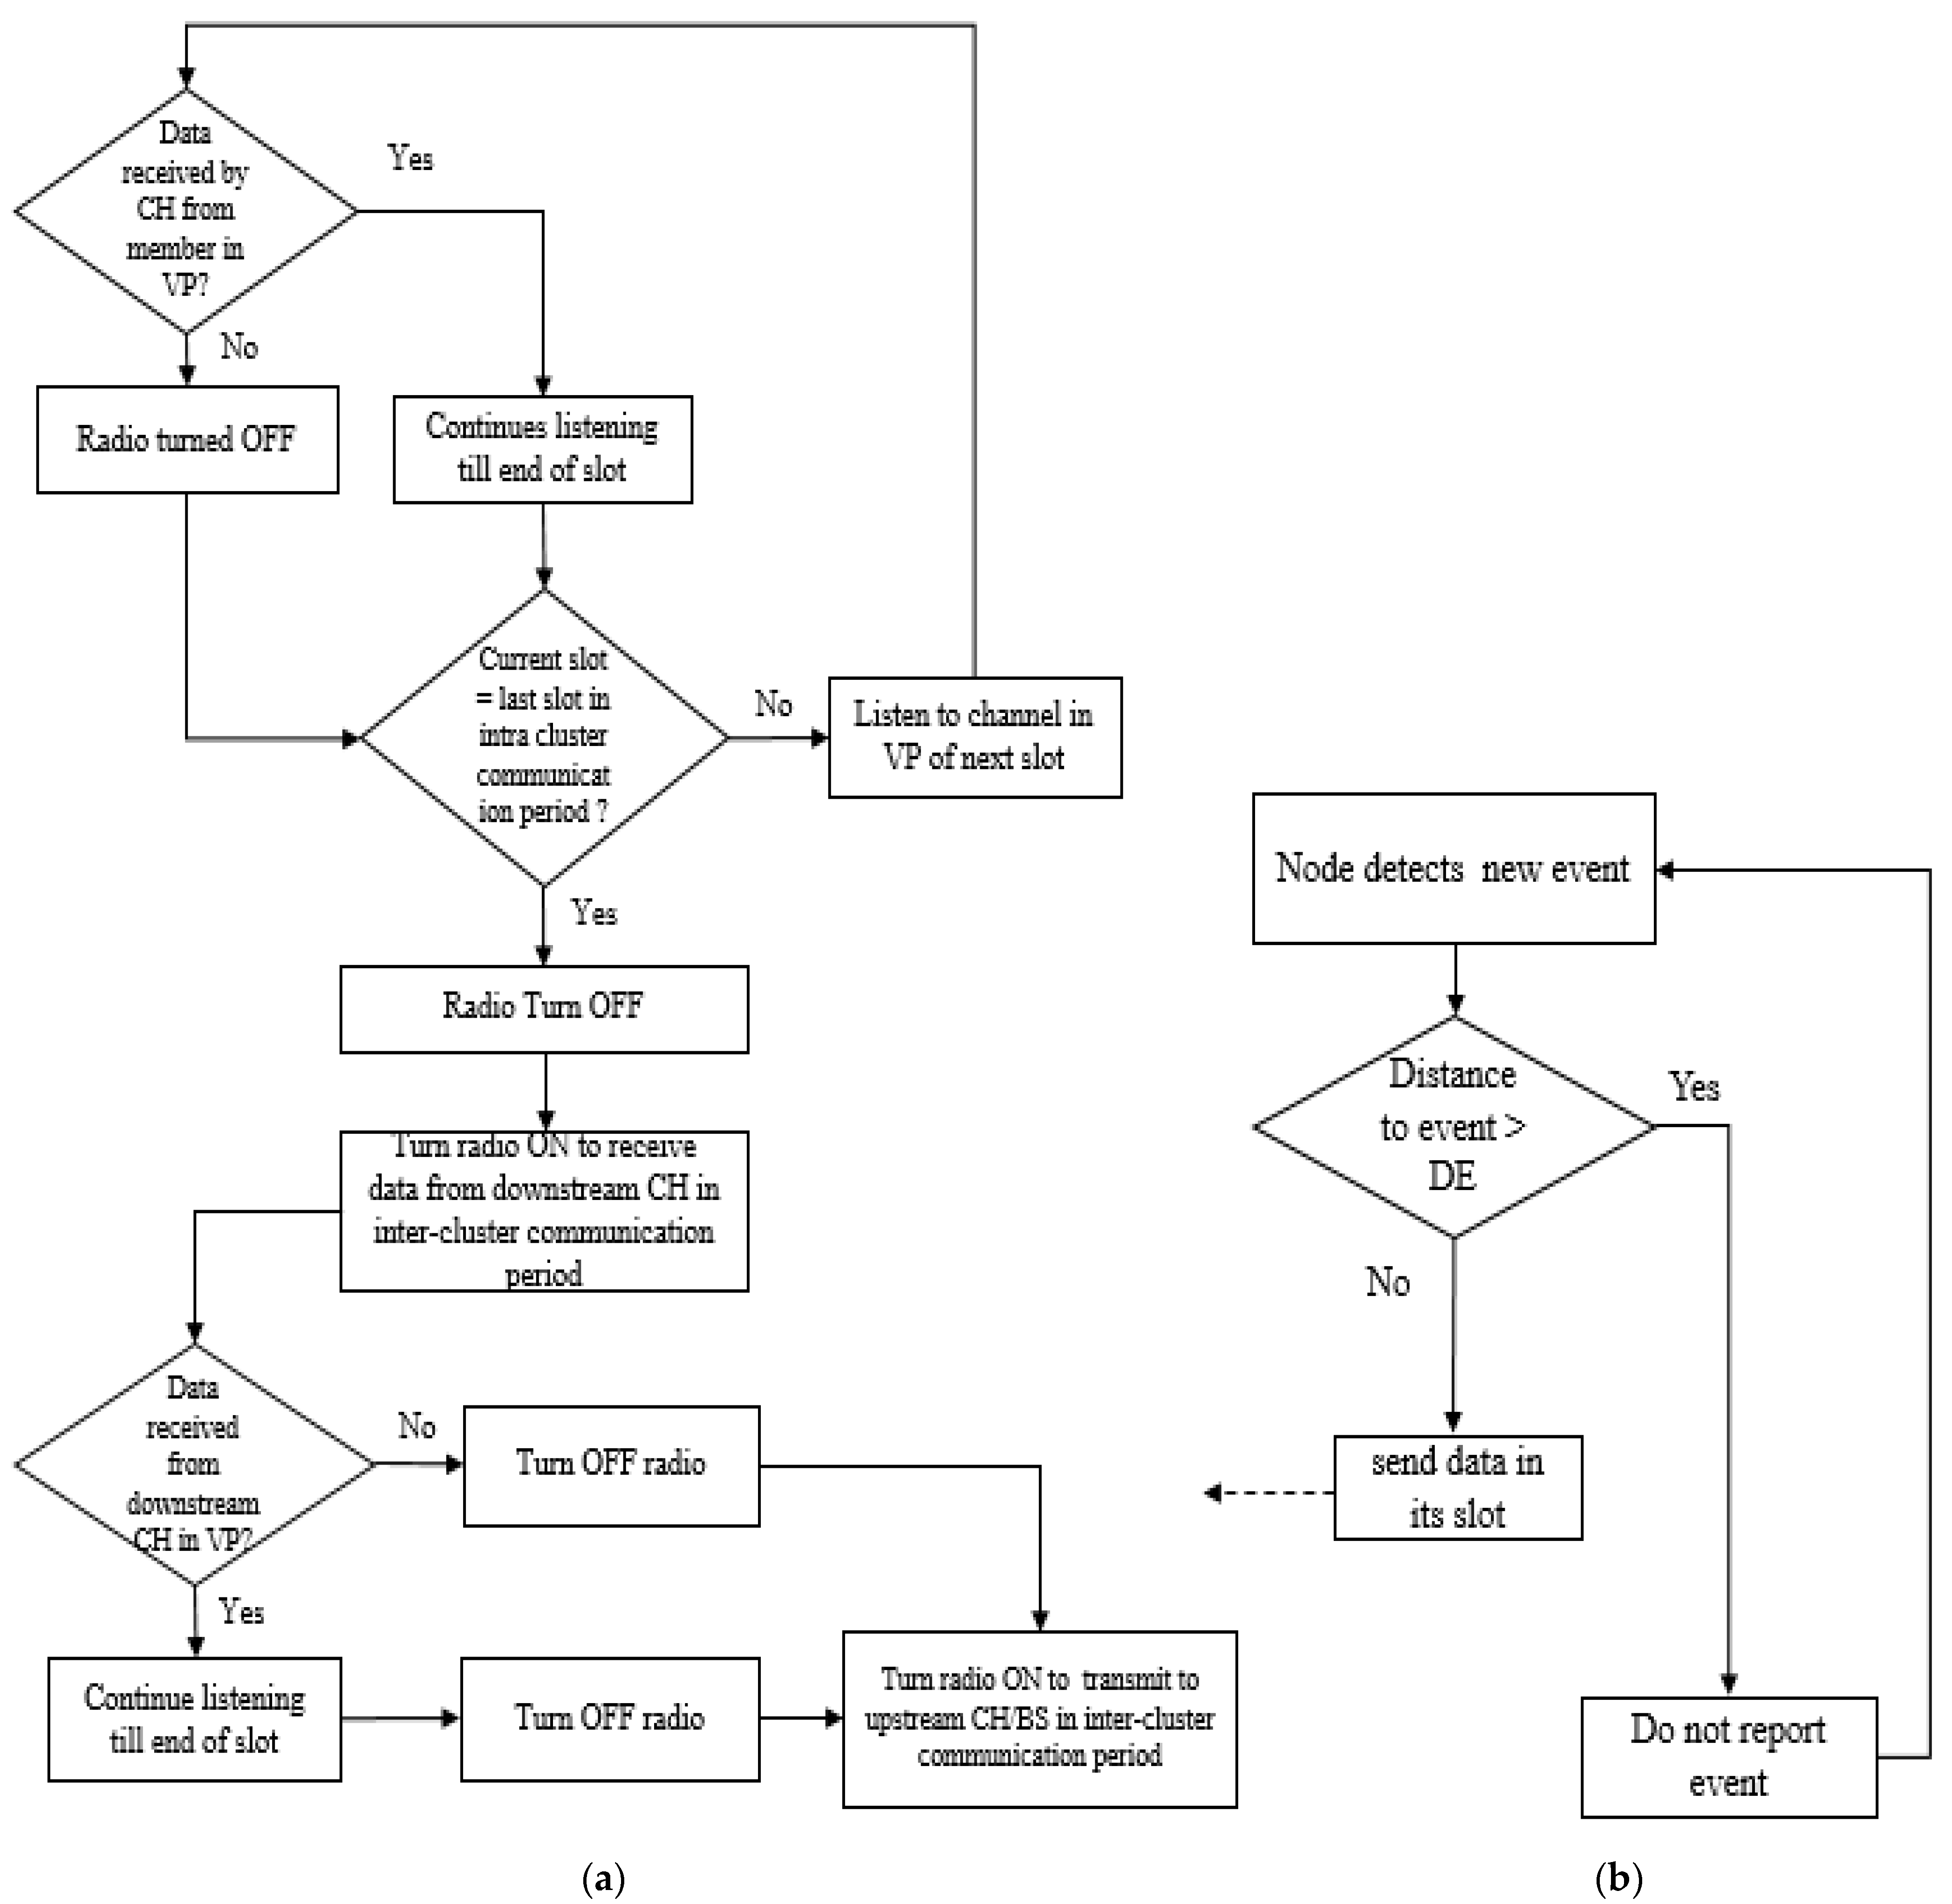
3.2. Steady-State Phase
| Algorithm 2: Pseudo-Code for Steady-State Phase |
| 1: Input: Clusters formed in Setup Phase 2: Output: Data Transmission to the IoT Cloud 3: N = total number of clusters 4: n = total nodes in a cluster 5: i = 0, j = 0, s = no of slots 6: Node detects a new event 7: If (distance to event > DE) 8: do not report the event 9: else 10: report event in its slot 11: end if 12: for i = 1 to s 13: if (CH receives data from its member in VP) 14: continue listening till the end of the slot 15: else 16: turn radio OFF 17: end if 18: end for 19: for i = 1 to s 20: if (Current slot = last time slot for intra-cluster communication) 21: wait to receive data from downstream CH in the inter-cluster communication period 22: else 23: listen to channel in VP of next slot 24: end if 25: end for 26: if (Data is received from downstream CH in VP) 27: Continue listening till the end of the slot 28: else 29: Turn off radio 30: end for 31: for i = 1 to N 32: CH sends aggregate data to its upstream CH /BS 33: end for |
4. Simulation Results
4.1. Scenario 1
4.2. Scenario 2
4.3. Scenario 3
4.4. Scenario 4
5. Comparative Analysis
5.1. Energy Consumption in LEACH
5.2. Energy Consumption in ES-MAC
5.3. Energy Consumption in EE-MAC
5.4. Energy Consumption in EERP
6. Conclusion and Future Work
Author Contributions
Funding
Institutional Review Board Statement
Informed Consent Statement
Data Availability Statement
Acknowledgments
Conflicts of Interest
References
- Rawat, P.; Chauhan, S. Clustering protocols in wireless sensor network: A survey, classification, issues, and future directions. Comput. Sci. Rev. 2021, 40, 100396. [Google Scholar] [CrossRef]
- Heinzelman, W.R.; Chandrakasan, A.; Balakrishnan, H. Energy-efficient communication protocol for wireless microsensor networks. In Proceedings of the 33rd Annual Hawaii International Conference on System Sciences, Maui, HI, USA, 7 January 2000; p. 10. [Google Scholar]
- Dionisis, K.; Nakas, C.; Vomvas, D.; Koulouras, G. Applications of wireless sensor networks: An up-to-date survey. Appl. Syst. Innov. 2020, 3, 14. [Google Scholar]
- Ju, X. Energy-efficient routing sensing technology of wireless sensor networks based on Internet of Things. J. High Speed Netw. 2021, 27, 225–235. [Google Scholar] [CrossRef]
- Fatemeh, S.; Souri, A.; Baker, T.; al Ridhawi, I.; Aloqaily, M. PriNergy: A priority-based energy-efficient routing method for IoT systems. J. Supercomput. 2020, 76, 8609–8626. [Google Scholar]
- Zin, M.C.; Gopal, L.; Aung, Y.L. WSN-based reconfigurable water quality monitoring system in IoT environment. In Proceedings of the 2017 14th International Conference on Electrical Engineering/Electronics, Computer, Telecommunications and Information Technology (ECTI-CON), Phuket, Thailand, 27–30 June 2017; pp. 741–744. [Google Scholar]
- Santanu, M.; Nguyen, H.A.D.; Ha, Q.P. IoT-enabled wireless sensor networks for air pollution monitoring with extended fractional-order Kalman filtering. Sensors 2021, 21, 5313. [Google Scholar]
- Lo Sciuto, G. Air pollution effects on the intensity of received signal in 3G/4G mobile terminal. Int. J. Energy Environ. Eng. 2019, 10, 221–229. [Google Scholar] [CrossRef] [Green Version]
- Giacomo, C.; Sciuto, G.L.; Monforte, P.; Napoli, C. Cascade feed forward neural network-based model for air pollutants evaluation of single monitoring stations in urban areas. Int. J. Electron. Telecommun. 2015, 61, 327–332. [Google Scholar] [CrossRef]
- Khalid, H.; Din, I.U.; Almogren, A.; Islam, N. An energy efficient and secure IoT-based WSN framework: An application to smart agriculture. Sensors 2020, 20, 2081. [Google Scholar]
- Sushanth, G.; Sujatha, S. IOT based smart agriculture system. In Proceedings of the 2018 International Conference on Wireless Communications, Signal Processing and Networking (WiSPNET), Chennai, India, 22–24 March 2018; pp. 1–4. [Google Scholar]
- Maryam, S.; Sadeghi-Niaraki, A.; Choi, S.; Islam, S.M.R. Performance analysis of IoT-based health and environment WSN deployment. Sensors 2020, 20, 5923. [Google Scholar]
- Alamelu, J.V.; Mythili, A. Design of IoT based generic health care system. In Proceedings of the 2017 International Conference on Microelectronic Devices, Circuits and Systems (ICMDCS), Vellore, India, 10–12 August 2017; pp. 1–4. [Google Scholar]
- Sabrine, K.; el Houssaini, D.; Kammoun, I.; Kanoun, O. Precision irrigation: An IoT-enabled wireless sensor network for smart irrigation systems. In Women in Precision Agriculture; Springer: Cham, Switzerland, 2021; pp. 107–129. [Google Scholar]
- Rani, S.R.; Maheswar, G.R. Kanagachidambaresan; Integration of WSN and IoT for smart cities; Jayarajan, P., Ed.; Springer: Cham, Switzerland, 2020. [Google Scholar]
- Khedr, A.M.; Osamy, W.; Ahmed, S.; Abdel-Aziz, S. Privacy preserving data mining approach for IoT based WSN in smart city. Int. J. Adv. Comput. Sci. Appl. 2019, 10, 555–563. [Google Scholar] [CrossRef] [Green Version]
- Shao, X. Improved energy-efficient routing architecture for traffic management system using a hybrid meta-heuristic algorithm in Internet of vehicles. J. High Speed Netw. Prepr. 2022, 1–10. [Google Scholar] [CrossRef]
- Marek, K.; Bijok, T.; Sciuto, G.L. Design and Modeling of Intelligent Building Office and Thermal Comfort Based on Probabilistic Neural Network. SN Comput. Sci. 2022, 3, 485. [Google Scholar]
- Pedro, C.; Martinez, J.; Rodriguez-Molina, J.; Cuerva, A. Integration of wearable devices in a wireless sensor network for an E-health application. IEEE Wirel. Commun. 2013, 20, 38–49. [Google Scholar]
- Alduais, N.A.M.; Abdullah, I.; Jamil, A. An efficient data collection algorithm for wearable/mobile tracking system in IoT/WSN. In Proceedings of the 2018 Electrical Power, Electronics, Communications, Controls and Informatics Seminar (EECCIS), Batu, Indonesia, 9–11 October 2018; pp. 250–254. [Google Scholar]
- Muttashar, A.G.; Khalaf, O.I. An improved algorithm to fire detection in forest by using wireless sensor networks. Int. J. Civ. Eng. Technol. (IJCIET)-Scopus Index. 2018, 9, 369–377. [Google Scholar]
- Zhang, J.; Li, W.; Yin, Z.; Liu, S.; Guo, X. Forest fire detection system based on wireless sensor network. In Proceedings of the 2009 4th IEEE Conference on Industrial Electronics and Applications, Xi’an, China, 25–27 May 2009; pp. 520–523. [Google Scholar]
- Noureddine, M.; Nurellari, E.; El Alaoui, A.E. A novel energy-efficient and reliable ACO-based routing protocol for WSN-enabled forest fires detection. J. Ambient. Intell. Humaniz. Comput. 2022, 1–17. [Google Scholar]
- Pouya, B.; Uysal, S. Forest fire detection in wireless sensor network using fuzzy logic. In Proceedings of the 2013 Fifth International Conference on Computational Intelligence, Communication Systems and Networks, Madrid, Spain, 5–7 June 2013; pp. 83–87. [Google Scholar]
- Carl, H.; Han, R.; Seielstad, C.; Holbrook, S. FireWxNet: A multi-tiered portable wireless system for monitoring weather conditions in wildland fire environments. In Proceedings of the 4th International Conference on Mobile Systems, Applications and Services, Uppsala, Sweden, 19–22 June 2006; pp. 28–41. [Google Scholar]
- Mohamed, H.; Bagheri, M. Forest fire modeling and early detection using wireless sensor networks. Ad Hoc Sens. Wirel. Netw. 2009, 7, 169–224. [Google Scholar]
- Kasyap, V.L.; Sumathi, D.; Alluri, K.; Reddy Ch, P. Navod Thilakarathne, and R. Mahammad Shafi. Early detection of forest fire using mixed learning techniques and UAV. Comput. Intell. Neurosci. 2022, 2022. [Google Scholar] [CrossRef]
- Heinzelman, W.B.; Chandrakasan, A.P.; Balakrishnan, H. An application-specific protocol architecture for wireless microsensor networks. IEEE Trans. Wirel. Commun. 2002, 1, 660–670. [Google Scholar] [CrossRef] [Green Version]
- Shuo, S.; Liu, X.; Gu, X. An energy-efficiency Optimized LEACH-C for wireless sensor networks. In Proceedings of the 7th International Conference on Communications and Networking in China, Kunming, China, 8–10 August 2012; pp. 487–492. [Google Scholar]
- Adrian, P.; Szewczyk, R.; Tygar, J.D.; Wen, V.; Culler, D.E. SPINS: Security protocols for sensor networks. Wirel. Netw. 2002, 8, 521–534. [Google Scholar]
- Wang, X.; Li-zhen, Y.; Ke-fei, C. Sleach: Secure low-energy adaptive clustering hierarchy protocol for wireless sensor networks. Wuhan University J. Nat. Sci. 2005, 10, 127–131. [Google Scholar]
- Basit, M.; Javaid, N.; Rehman, O.; Akbar, M.; Nadeem, Q.; Iqbal, A.; Ishfaq, M. Q-LEACH: A new routing protocol for WSNs. Procedia Comput. Sci. 2013, 19, 926–931. [Google Scholar]
- Yang, L.; Shang, F.; Long, Z.; Ren, Y. An energy efficient multiple-hop routing protocol for wireless sensor networks. In Proceedings of the 2008 First International Conference on Intelligent Networks and Intelligent Systems, Wuhan, China, 1–3 November 2008; pp. 147–150. [Google Scholar]
- Mu, T.; Tang, M. LEACH-B: An improved LEACH protocol for wireless sensor network. In Proceedings of the 2010 6th International Conference on Wireless Communications Networking and Mobile Computing (WiCOM), Chengdu, China, 23–25 September 2010; pp. 1–4. [Google Scholar]
- Seli, M.; Behera, P.K.; Sahoo, P.K.; Bisoy, S.K.; Hui, K.L.; Sain, M. Mobility Induced Multi-Hop LEACH Protocol in Heterogeneous Mobile Network. IEEE Access 2022, 10, 132895–132907. [Google Scholar]
- Hicham, O.; Lagraini, H.; Mouhsen, A.; Chhiba, M.; Tabyaoui, A. MG-leach: An enhanced leach protocol for wireless sensor network. Int. J. Electr. Comput. Eng. 2019, 9, 2088–8708. [Google Scholar]
- Kumar, D.; Singh, M.P. Bit-map-assisted energy-efficient MAC protocol for wireless sensor networks. Int. J. Adv. Sci. Technol. 2018, 119, 111–122. [Google Scholar]
- Kumar, D.; Singh, M.P.; Gupta, R. An energy saving medium access control protocol for wireless sensor networks. J. Ambient. Intell. Humaniz. Comput. 2021, 12, 1435–1448. [Google Scholar]
- Rajeev, R.; Debasis, K.; Gupta, R.; Singh, M.P. Energy-Efficient Medium Access Control in Wireless Sensor Networks. Wirel. Pers. Commun. 2022, 122, 409–427. [Google Scholar]
- Babu, P.R.; Debasis, K. A Low Energy Consuming MAC Protocol for Wireless Sensor Networks. In Proceedings of the 2022 2nd International Conference on Artificial Intelligence and Signal Processing (AISP), Vijayawada, India, 12–14 February 2022; pp. 1–5. [Google Scholar]
- Byungrak, S.; Her, Y.; Kim, J. A design and implementation of forest-fires surveillance system based on wireless sensor networks for South Korea mountains. Int. J. Comput. Sci. Netw. Secur. 2006, 6, 124–130. [Google Scholar]
- Doolin, D.M.; Sitar, N. Wireless sensors for wildfire monitoring. In Smart Structures and Materials 2005: Sensors and Smart Structures Technologies for Civil, Mechanical, and Aerospace Systems; SPIE: Bellingham, WA, USA,, 2005; Volume 5765, pp. 477–484. [Google Scholar]
- Krešimir, P.; Belani, H.; Vuković, M. Early forest fire detection with sensor networks: Sliding window skylines approach. In Proceedings of the Knowledge-Based Intelligent Information and Engineering Systems: 12th International Conference, KES 2008, Proceedings, Part I 12. Zagreb, Croatia, 3–5 September 2008; Springer: Berlin/Heidelberg, Germany, 2008; pp. 725–732. [Google Scholar]
- Al-Dhief, F.T.; Muniyandi, R.C.; Sabri, N.; Hamdan, M.; Latiff, N.M.A.; Albadr, M.A.A.; Khairi, M.H.H.; Hamzah, M.; Khan, S. Forest Fire Detection Using New Routing Protocol. Sensors 2022, 22, 7745. [Google Scholar] [CrossRef]
- Vikram, R.; Sinha, D.; De, D.; Das, A.K. EEFFL: Energy efficient data forwarding for forest fire detection using localization technique in wireless sensor network. Wirel. Netw. 2020, 26, 5177–5205. [Google Scholar] [CrossRef]
- Noureddine, M.; Khemiri-Kallel, S.; El Alaoui, A.E. Fog-assisted hierarchical data routing strategy for IoT-enabled WSN: Forest fire detection. Peer--Peer Netw. Appl. 2022, 15, 2307–2325. [Google Scholar]
- Emre, A.Y.; Korpeoglu, I.; Ulusoy, Ö. A framework for use of wireless sensor networks in forest fire detection and monitoring. Comput. Environ. Urban Syst. 2012, 36, 614–625. [Google Scholar]


| Protocol | Cluster Formation | Slot Allocation | Communication Technique | Energy Consumption | Application |
|---|---|---|---|---|---|
| LEACH [28] | Yes | Self allocation | Single-hop | Medium | General |
| LEACH-C [29] | Yes | Self allocation | Single-hop | Medium | General |
| SLEACH [31] | Yes | Self allocation | Single-hop | High | General |
| Q-LEACH [32] | Yes | Self allocation | Single-hop | Medium | General |
| MG-LEACH [36] | Yes | Self allocation | Multi-hop | Low | General |
| LEACH-B [34] | Yes | Self allocation | Single-hop | Medium | General |
| BEE-MAC [37] | Yes | Self allocation | Single-hop | Medium | General |
| ES-MAC [38] | Yes | Allocation by CH | Single-hop | Medium | General |
| EE-MAC [39] | Yes | Allocation by CH | Single-hop | Medium | General |
| LEC-MAC [40] | Yes | Allocation by CH | Single-hop | Medium | General |
| FFSS [41] | No | Self allocation | Multi-hop | Low | Forest fire Detection |
| E-RARP [23] | Yes | Allocation by CH | Multi-hop | Low | Forest fire Detection |
| LARRR [44] | No | Self allocation | Single-hop | High | Forest fire Detection |
| FWI [26] | Yes | Allocation by CH | Multi-hop | Medium | Forest fire Detection |
| HDRS [46] | Yes | Allocation by Fog Node | Multi-hop | Medium | Forest fire Detection |
| EEFFL [45] | Yes | Self allocation | Multi-hop | Medium | Forest fire Detection |
| Parameter | Value |
|---|---|
| Target Area | 100 × 100 m2 / 50 × 50 m2 |
| Eelec | 50 nJ/bit |
| Quantity of Nodes | 100/200 |
| Control packet size | 20 bytes |
| Data/schedule packet size | 100 bytes |
| Eidle | 40 nJ/bit |
| Node initial energy | 5 Joules |
| Eamp | 100 pJ/bit/m2 |
| Number of cluster heads | 16 |
| Number of frames | 20 |
| Threshold Energy | 1 Joule |
| LEACH | ES-MAC | EE-MAC | EERP | |
|---|---|---|---|---|
| Threshold Energy | ✕ | ✕ | ✓ | ✓ |
| Proximity Threshold | ✕ | ✕ | ✓ | ✕ |
| Maximum Cluster Size | ✕ | ✕ | ✓ | ✕ |
| Cluster Selection Criteria | Strength of ADV | Strength of ADV | Strength of ADV & MCS | Based on location (join Upstream CH when no node can become CH in own grid |
| Distance to Event | ✕ | ✕ | ✕ | ✓ |
| Verification Period | ✕ | ✓ | ✓ | ✓ |
Disclaimer/Publisher’s Note: The statements, opinions and data contained in all publications are solely those of the individual author(s) and contributor(s) and not of MDPI and/or the editor(s). MDPI and/or the editor(s) disclaim responsibility for any injury to people or property resulting from any ideas, methods, instructions or products referred to in the content. |
© 2023 by the authors. Licensee MDPI, Basel, Switzerland. This article is an open access article distributed under the terms and conditions of the Creative Commons Attribution (CC BY) license (https://creativecommons.org/licenses/by/4.0/).
Share and Cite
Pedditi, R.B.; Debasis, K. Energy Efficient Routing Protocol for an IoT-Based WSN System to Detect Forest Fires. Appl. Sci. 2023, 13, 3026. https://doi.org/10.3390/app13053026
Pedditi RB, Debasis K. Energy Efficient Routing Protocol for an IoT-Based WSN System to Detect Forest Fires. Applied Sciences. 2023; 13(5):3026. https://doi.org/10.3390/app13053026
Chicago/Turabian StylePedditi, Ramesh Babu, and Kumar Debasis. 2023. "Energy Efficient Routing Protocol for an IoT-Based WSN System to Detect Forest Fires" Applied Sciences 13, no. 5: 3026. https://doi.org/10.3390/app13053026