


Selection of a Photovoltaic Panel Cooling Technique Using Multi-Criteria Decision Analysis

1
Department of Mechanical Engineering, College of Engineering, King Saud University, Riyadh 11421, Saudi Arabia
2
Department of Industrial Engineering, College of Engineering, King Saud University, Riyadh 11421, Saudi Arabia
*
Author to whom correspondence should be addressed.
Appl. Sci. 2023, 13(3), 1949; https://doi.org/10.3390/app13031949
Submission received: 7 January 2023
/
Revised: 25 January 2023
/
Accepted: 30 January 2023
/
Published: 2 February 2023
(This article belongs to the Special Issue Photovoltaic Power System: Modeling and Performance Analysis)
Abstract
:Featured Application
A guide for photovoltaic panel installation projects to implement cooling technologies to increase efficiency.
Abstract
Photovoltaic panel performance in terms of its efficiency and durability is severely affected by operating temperature when the temperature is much higher than the nominal operating cell temperature in hot climates. Different cooling methods have been reported over several decades, but photovoltaic panel manufacturers or users are yet to adopt a popular method of panel cooling. This is the main concern of the present work. Potential cooling solutions differ in terms of their criteria for performance evaluation, which are efficiency enhancement, costs, reliability, environmental aspects and ergonomics. Hence, there is a need to identify the optimum cooling method. Eight different cooling methods were identified, and the analysis was made with the multi-criteria analysis tool on the different possible attributes. Two different climate zones with different weight schemes are considered for the evaluation process, and the best to the worst cooling solutions have been identified. Five different scenarios depending on the importance given to each evaluation criterion are analyzed. The best cooling method to the worst cooling method has been arranged under each scenario. When the efficiency of operation was given maximum weight, aluminum fin cooling proved to be the best panel cooling method. When the emission reduction criterion was given maximum weight, thermosiphon cooling was the best cooling option. A comparison of the results indicates that thermosiphon works out to be the best option. The second-best method was found to be forced convection cooling when equal weights were applied and thermosiphon cooling when a 40% weight on efficiency enhancement criteria was applied, which is a more practical weight distribution. Phase change cooling and forced convection cooling had the poorest performance among the different cooling methods for all the weighing scenarios.
1. Introduction
The recovery of valuable electrical power with minor alterations in the heat dissipation process of photovoltaic (PV) panels by implementing diverse passive or active panel cooling procedures are reported over several years of photovoltaic research. A steep decline in cell net power output or efficiency is a consequence of elevated panel temperature. A linear relationship between efficiency and temperature was established when the temperature goes above the nominal operating cell temperature [1]. The maximum power output of a PV panel is a product of its open circuit voltage, short circuit current and the filling factor. An increase in panel temperature increases the short circuit current and decreases the open circuit voltage as well as the filling factor. The overall effect is a decrease in the power output of the PV panel. Only a minor fraction of the incident solar radiation is extracted as useful PV power, and the rest is converted to heat, because of which the cell temperature rises. The power output from the panel decreases from 0.25% to 5% for every °C temperature elevation. Especially for PV systems with concentrators, where high levels of solar radiation fall on the panel, the temperature effect reduces efficiency as well as the life span of the panel in spite of higher power output levels [2,3,4,5]. Thin film solar panels are less affected by a temperature rise compared to silicon-based panels. Their temperature coefficient, which is the percentage reduction in efficiency for a unit °C increase in temperature, is −0.0984% compared to −0.109% for mono-crystalline panels and −0.124% for polycrystalline panels [6]. Several cooling mechanisms have already been proposed, which are in the laboratory stage and in the field, apart from the development of new cooling techniques [7]. It has been shown that a considerable quantity of power can be gained, up to a total of 5%, by the utilization of cooling systems. Panel cooling techniques with simultaneous heat usage for heating requirements were proposed early on in PV exploitation [8]. Although cooling evidently gives higher electrical output, it requires an extra arrangement that can remove heat from the panel and deliver it elsewhere. Notably, the construction and maintenance of such a cooling technique can be expensive, and there is a possibility that the cost of system maintenance could outweigh the benefits of the improved electrical yield.
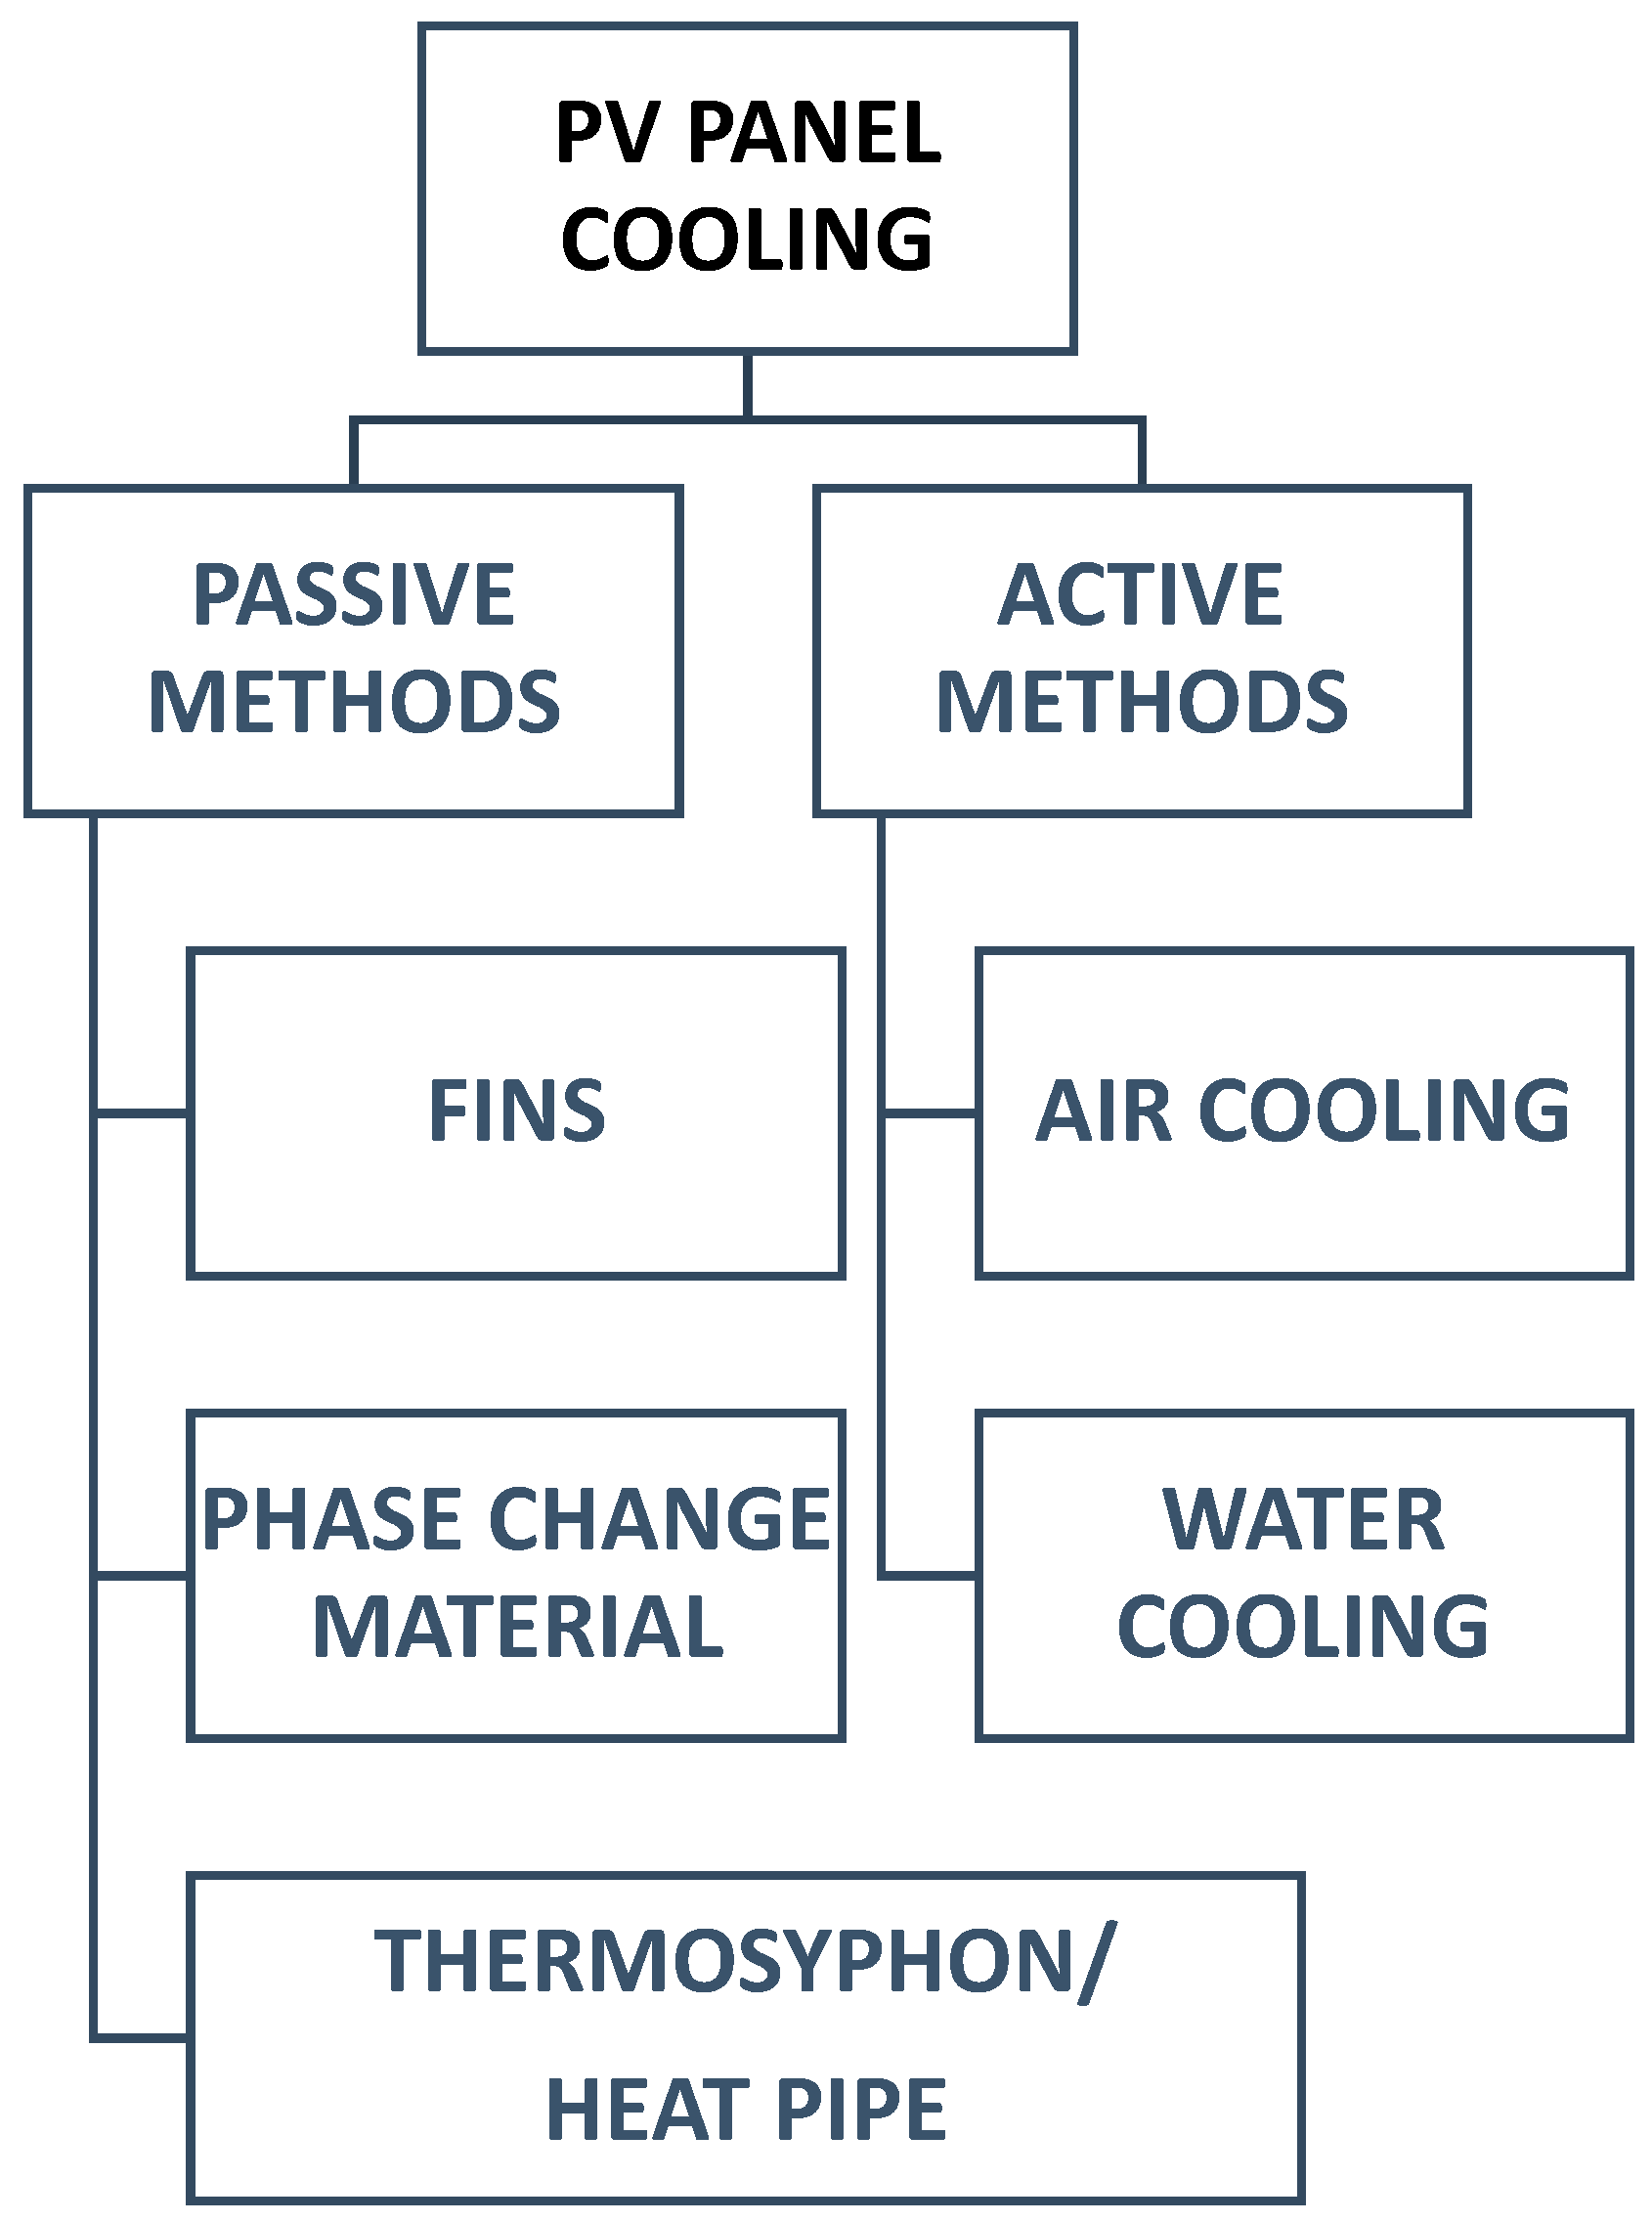
Cooling techniques adopted different physical approaches using sensible and latent heat storage and dissipation or heat convection techniques using different mediums, and these were tested in order to study the reduction in panel operating temperature. These techniques can be classified as either passive methods, where no external energy is used, or active methods, where extra energy is used to circulate the cooling fluid. Passive techniques include the application of fins or extended surfaces to promote heat transfer, the application of phase change material for absorbing the heat produced in the panel and using heat pipe cooling and convection by natural circulation water or air cooling. Active techniques involve the circulation of air or water on the panel surfaces with and without the help of fins with the hot fluid being used for other applications, as given in Figure 1.
Research on the passive cooling of PV panels has utilized a variety of principles such as air passive cooling, water passive cooling, conductive cooling, heat pipe or thermosiphon cooling and phase change cooling. Conductive cooling involves heat transfer by conduction through the panel material or fin material and finally disposal by convection to air or water. A relative increase in electric efficiency of 9% has been gained via the usage of passive cooling with a heat sink, and the depth of the air-flow channel beneath the PV cells was found to have a significant influence on passive cooling for larger PV surfaces [9]. It has been shown that, for a length-to-depth ratio of 0.085, the PV module cools by 5–6 °C when compared with a PV module without any cooling arrangement [10]. Numerical studies on heat-sink-based PV panel cooling with different variations in configuration and geometry achieved a temperature reduction of about 10 °C and the corresponding increase in power output [11]. Since the temperature difference of a panel with the environment rises with the increase in solar radiation intensity, passive flow channels can have the reverse effect on PV module cooling. Hence, optimization of the cooling mechanism is essential. In addition, a fairly stable PV-T panel temperature was obtained with water-cooled heat pipes when the peak insolation rate was 800 W/m2. The surface of the panel was around 1.0 m2, while the total amount of circulating water was around 200 L. Heat pipe cooling uses phase change cooling together with convection of the cooling medium, which is usually a liquid that evaporates at the temperature at which the panel is to be maintained. Inside the heat pipe, the evaporating liquid evaporates and expands taking up the heat produced by the panel. The vapor then condenses and releases heat into the surroundings. In the case of heat pipes, the return of the liquid to the evaporator occurs through capillary tubes or wicks. This is adopted when the condenser region is below the evaporator region. In some cases, the condenser region is above the evaporator region and the liquid returns by gravity, in which case, they are called thermosiphon heat pipes. A relation between the number of heat pipes and panel electrical efficiency has been reported [12]. A heat pipe was used to cool down a 0.0625 m2 panel and obtain an increase in efficiency of 2.6% and a decrease in temperature of 4.7 °C with a maximum increase in power yield of 8.4 [13].
Tests were conducted on different types of phase change material for cooling panels, and one such study concluded that up to a 10.26 °C reduction in temperature can be obtained resulting in an efficiency improvement of 3.73% [14]. Paraffin graphite in the form of panels was used with a thickness of 15 mm covered with an aluminum sheet at the back and was tested for cooling the PV panel. It was found that panel efficiency improved when the temperature was more than the phase change temperature, but the result was counterproductive due to the heat dissipation being stopped at a lower panel temperature [15].
Thermosiphon heat pipe cooling methods were adopted and reported by several researchers. Thermosiphon heat pipes were used to cool PV panels and a temperature reduction from 20 to 34% was reported [16]. Thermosiphon systems were tested by using a copper sheet and tubing with a water capacity of 80 L and reported an increase in the relative efficiency of 19% [17]. Thermosiphon heat pipes have the additional advantage of easy manufacturability because of the absence of the wick structure. The working liquid is evaporated when heat from the photovoltaic panel is conducted into the metallic pipe from the surface of the panel. The vapor moves up to the condensation region where it is exposed to cooler temperatures from the external environment. The condensed liquid then returns back to the evaporator region by gravity.
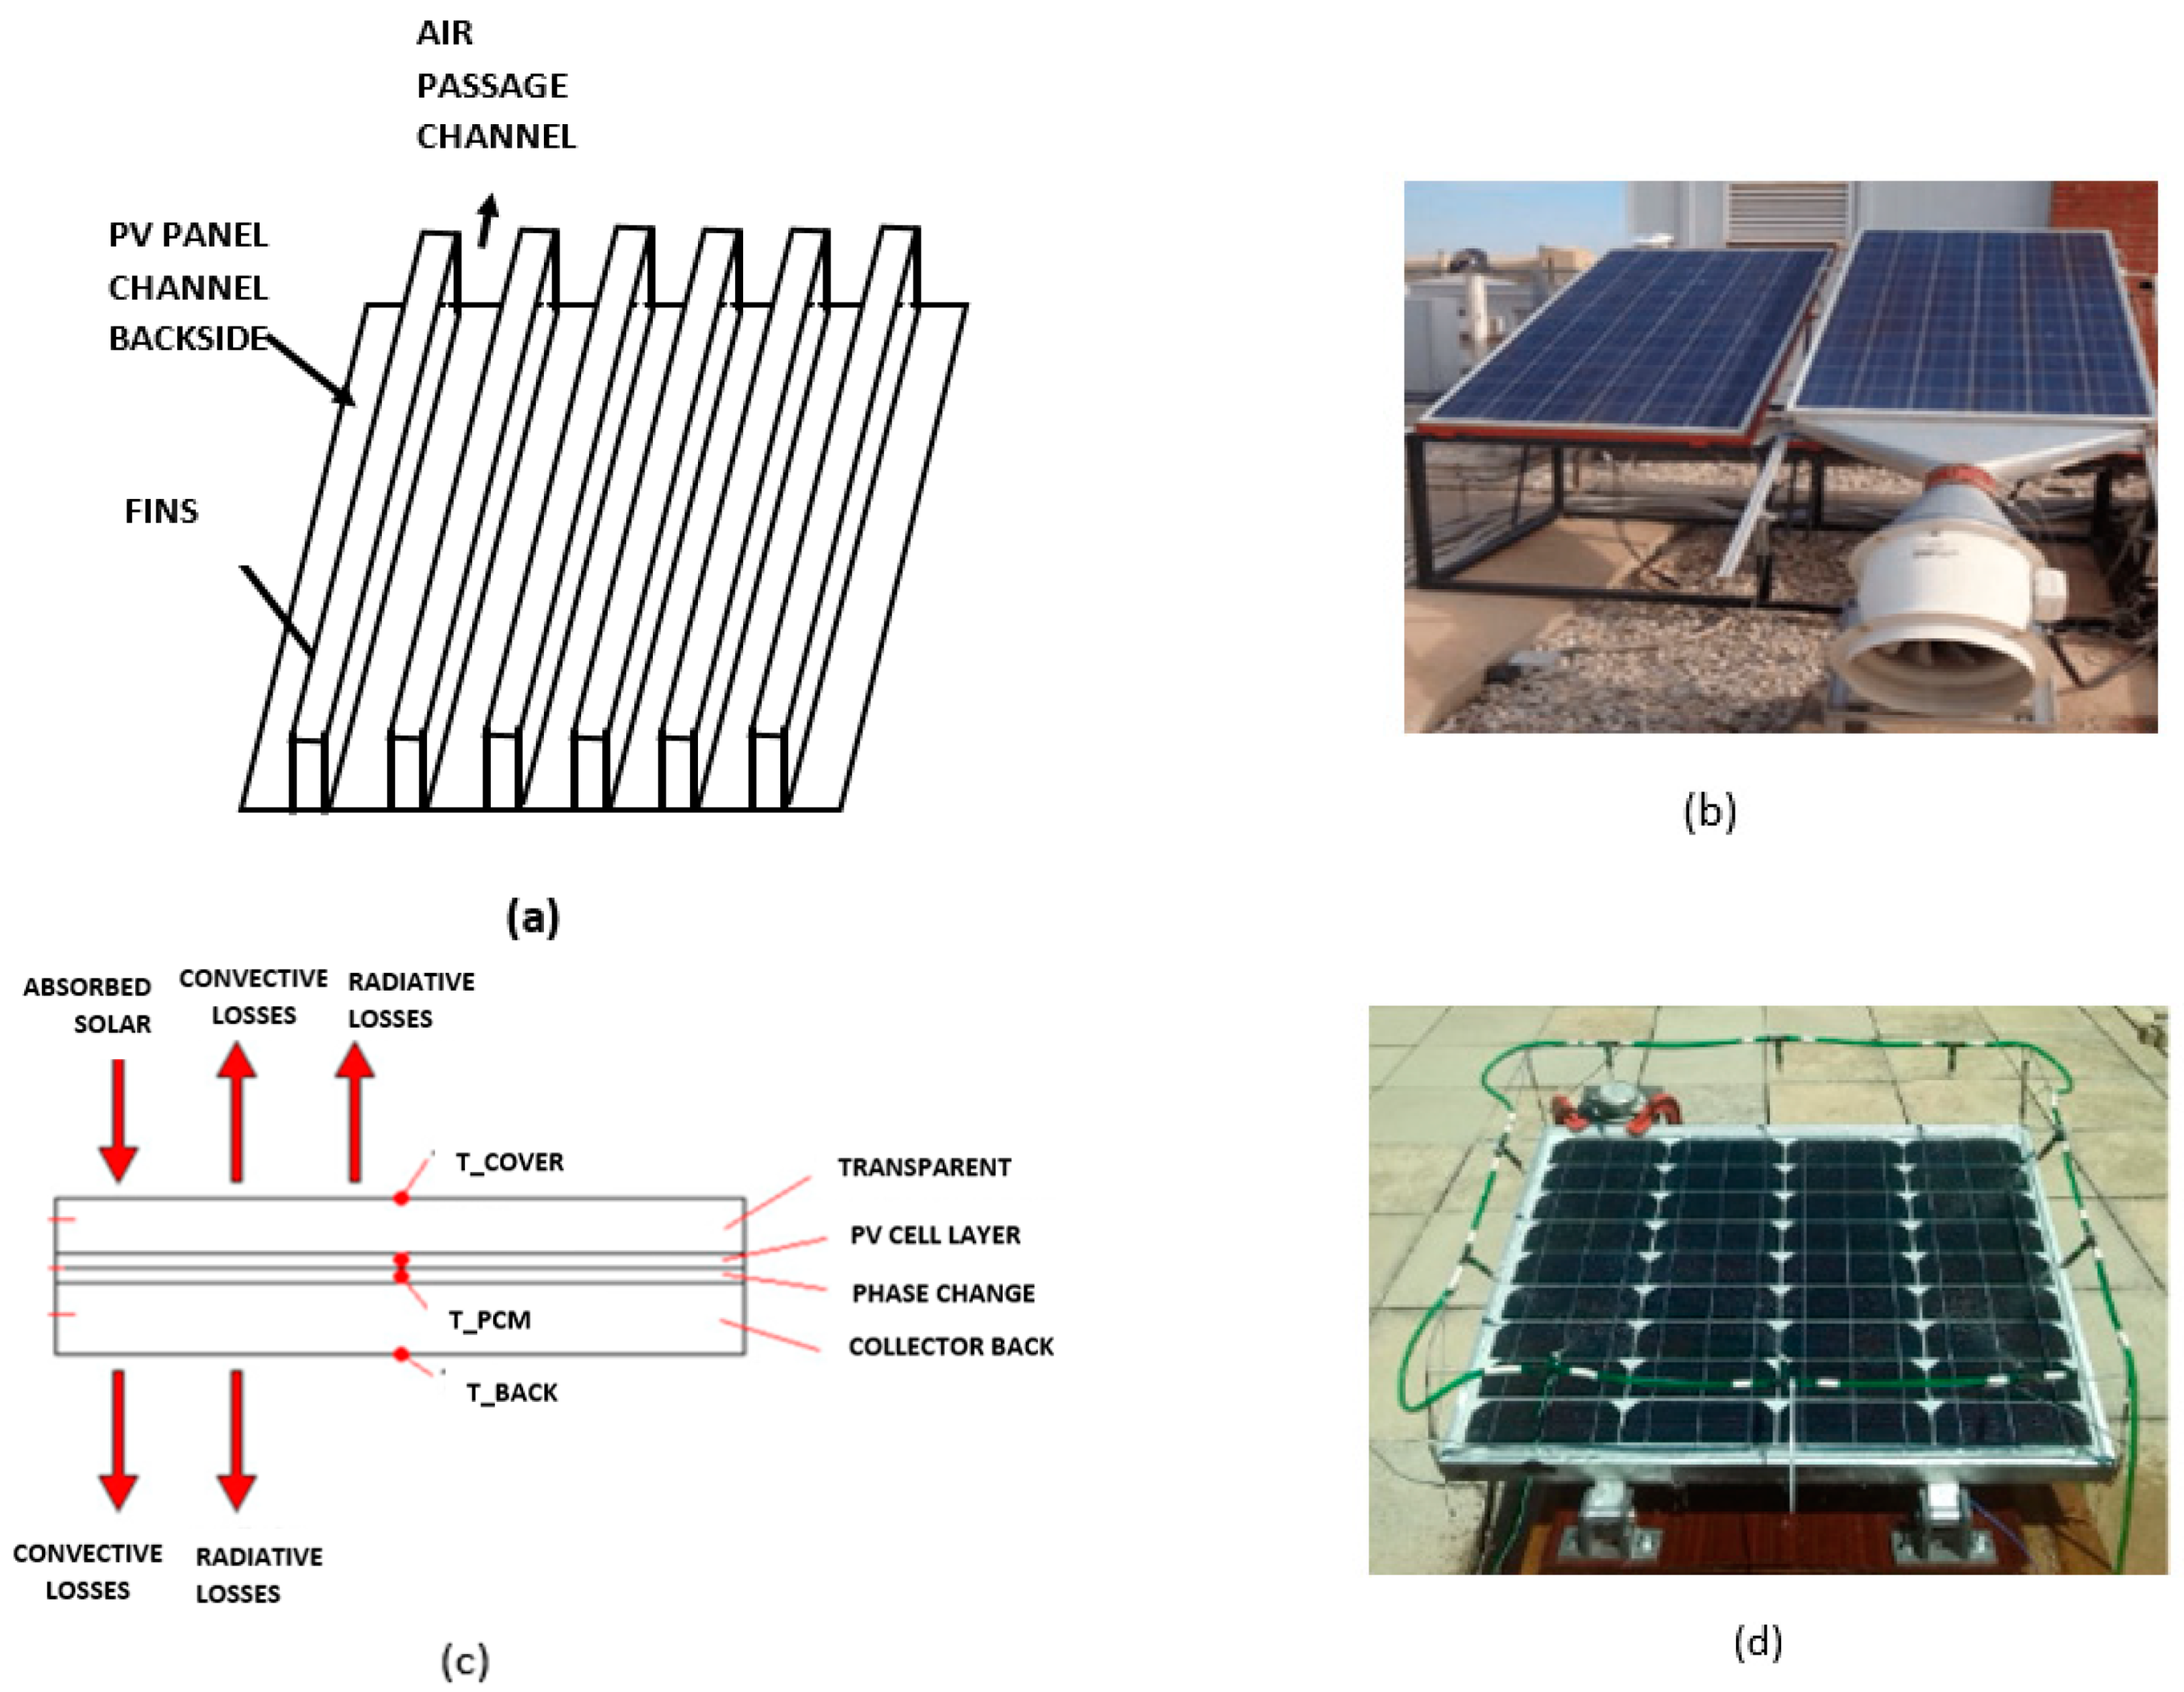
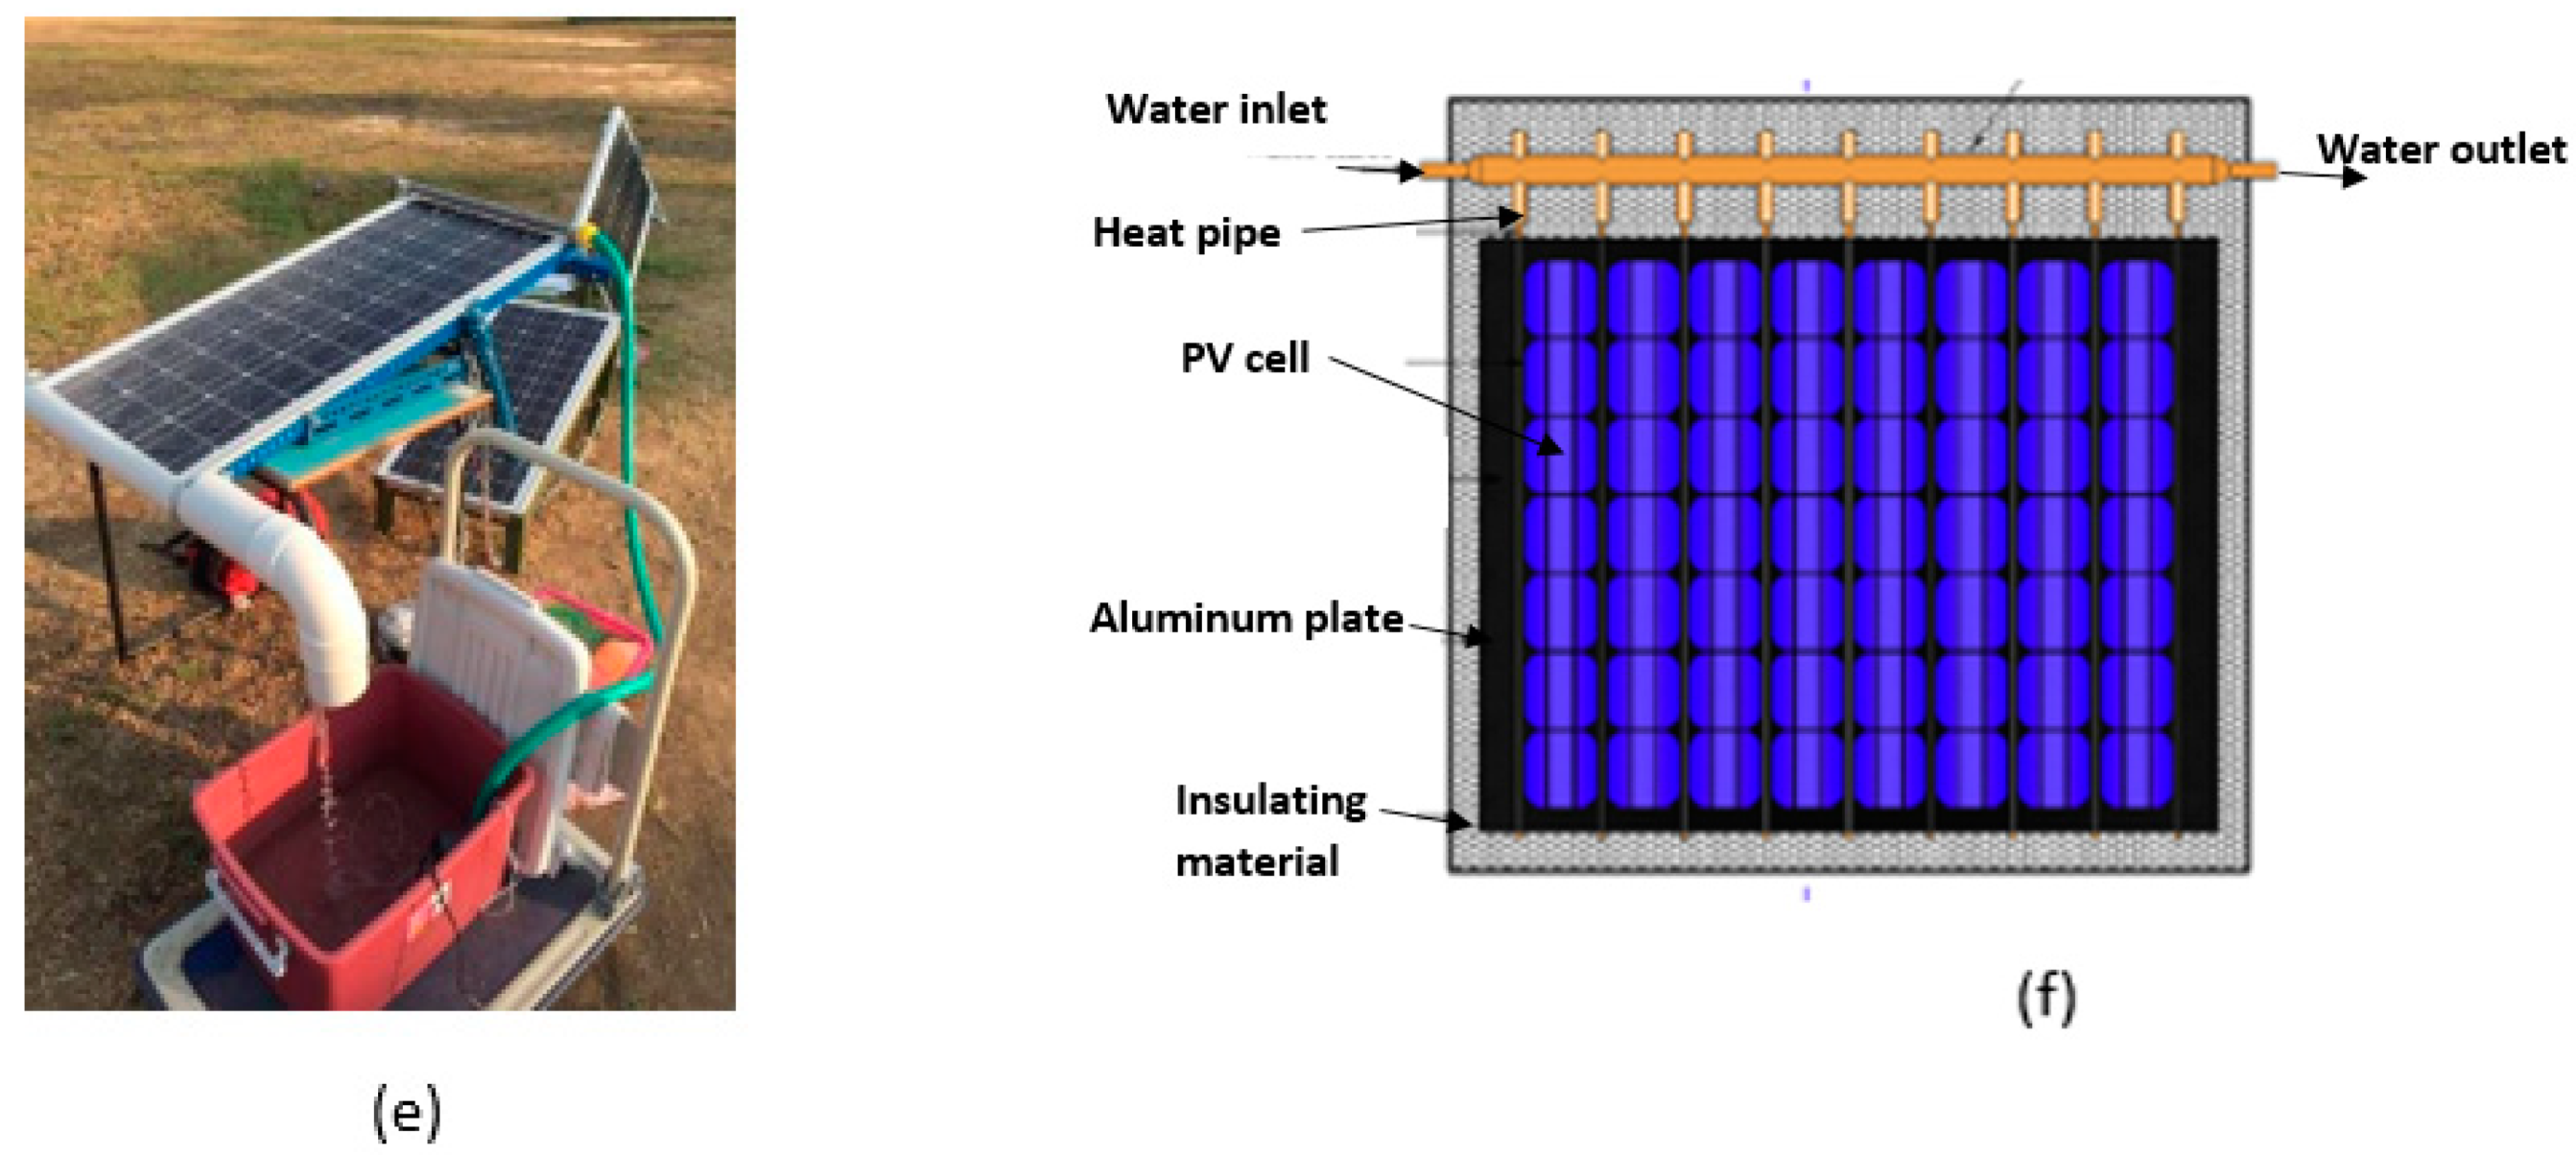
Heat removal from the PV module using forced convection of the cooling medium or extracting heat from the cooling medium is generally referred to as active cooling. Usually, water or air is used as the cooling medium. Power consumption is incurred mainly to drive the fans or pumps, which are designed to overcome the friction within flow conduits arranged across the panel. Active-cooled PV panels deliver more power due to the output enhancement achieved by lower temperatures. The heat removed can be used elsewhere. The percentage of energy available for in-house consumption is important. In the case of concentrated solar PV, cooling is essential due to intense heat generation, and the power gained due to cooling is proportionately higher compared to non-concentrating PV panels. Experiments were conducted using four PV panels of polycrystalline silicon type which had a rated power production capacity of 55 W each, and the back side of the panels with an area of 0.78 m2 was cooled with forced air circulation [6]. Air was circulated through specially designed air channels and a 1% enhancement of power output was obtained. The optimum air mass flow rate was 0.055 kg/s for a single panel. A study provided forced air cooling by using specially constructed ducts on the back of the panel using a 3.6 W fan and an improvement in the overall efficiency of 0.6% was obtained. Water cooling experimented with aluminum pipes attached to the panel backside and an efficiency gain of 0.8% was reported [18]. Figure 2a–f illustrates the arrangement of some of the different cooling systems considered in this study. Fin cooling (Figure 2a) uses a natural convective heat transfer mechanism in which heat from the PV cell is conducted to the fins and further travels by convection by natural wind movement [15]. Forced convection (Figure 2b) uses air movement with fans, and the heat is removed from below the panel with fins or without fins [15]. The availability of multiple methods for panel cooling necessitates a scientific procedure to select an appropriate method. Local metrological conditions such as ambient temperature and wind speed play a key role in the performance of the cooling mechanism [19]. Two different climatic conditions have been considered in this study, namely, hot and dry arid desert conditions (BWh) and continental dry winter (Dwa). This study pertains to flat plate non-concentrating photovoltaic panels.
The various alternatives for cooling PV panels in PV installations that have been reviewed above demonstrate that choosing the optimum method for cooling PV panels involves the use of a scientific instrument to evaluate the options. Different cooling techniques have been used successfully in a number of cases, thus making choosing difficult. Hence, five attributes were used to select the appropriate method. These attributes are technology feasibility in terms of efficiency increase, economic performance, environmental aspects, reliability and ergonomics. The attribute values were obtained with calculations and from published sources in order to select the best method. Multi-criteria decision analysis is the best instrument and has been utilized well in these circumstances. One should weigh the trade-offs between the advantages, possibilities, costs and dangers of alternatives in order to have an effective, sustainable, environmentally friendly and economically sound strategy. In order to compare, evaluate and rank the various PV panel cooling techniques, it is necessary to include numerous qualitative and quantitative criteria. Therein, expert evaluation is used with qualitative evaluation methods such as the safety check list method, the fault hypothesis analysis method, etc. Techniques for quantitative evaluation include artificial neural networks, fuzzy synthetic evaluation, probability, exponential and probability [20]. Aside from their unique qualities and viability, they also have significant drawbacks. Researchers and practitioners paid close attention to multi-criteria decision-making (MCDM) while evaluating, assessing and rating alternatives across many industrial and non-industrial sectors. Examples include assessing urban sustainable development in China [21], assessing sustainable energy planning techniques [22] and optimizing renewable energy systems [23,24]. Comparing and evaluating various choices for PV panel cooling techniques in large PV systems is one of the main goals of this multi-criteria decision analysis.
2. Methods and Criteria
The following five attributes are considered to make the selection of the appropriate cooling method from among the above options:
- Technology feasibility in terms of efficiency increase;
- Economic performance;
- Environmental aspects;
- Reliability;
- Ergonomics.
2.1. Technology Feasibility
The effectiveness of a cooling method on the PV panel is indicated by the temperature reduction attained and the efficiency enhancement achieved. Results from technology feasibility analysis efforts provide input to the implementation of the appropriate cooling method. The effect of the cooling technique on the panel temperature has been researched both numerically and experimentally by several researchers. Normally, the cooling effect is higher in the case of active methods than by passive methods. Active methods have higher convective heat removal rates due to the higher convective heat transfer coefficient achieved by the fans or pumps that drive the cooling fluid. Passive methods depend on natural convection heat transfer, which is much lower than forced convection. Thus, the electrical efficiency is a function of cell temperature [25] (refer to Equation (1)).
In the above Equation (1), is the nominal efficiency of the panel at a reference temperature of 298 K, is the cell temperature (K) and is the cell temperature coefficient, which indicates a drop of efficiency with temperature. The temperature coefficient used in this calculation of panel efficiency is −0.4%/°C. Table 1 gives the technical performance of different cooling methods commonly employed along with the equivalent power gain for a solar irradiation of 1000 W/m2.
Active cooling systems require electricity that is taken from panel output [31]. The net quantity of power produced after considering efficiency enhancement due to cooling and power consumed to operate the cooling system components differs according to the type of method used. Air-cooled methods use fans and consume less energy compared to water-cooled methods that use pumps. The intensity of solar radiation, which depends on the location and time of the year, is another factor that determines power consumption by the auxiliary cooling equipment. The power consumed by active cooling methods reduces the net power output of the panel depending on the above factors. Power consumption (PC) depends (refer to Equation (2)) on pressure losses (ΔHC) in the cooling conduits set up for the purpose, the density (ρ) of fluid used and its flow rate (Q).
The net power output of panel (P) with active cooling depends on the net power output after taking into account the power consumed by the cooling system, which is estimated using Equation (3). In Equation (3), “IT” represents the intensity of solar radiation in W/m2, “A” represents the area of PV panel in m2 and “ηel” represents the electrical efficiency of the PV panel.
The temperature of the panel is different in different climatic regions as well as in summer and winter conditions. The temperature of the PV cell (TC), which is given below in Equation (4), depends on the ambient temperature (Ta) and solar radiation intensity (IT). NOCT is the nominal operating temperature of the PV cell, which is 45 °C [32].
2.2. Technology Reliability
The reliability of the cooling mechanism depends on the complexity of the technique used as well as prevailing weather conditions in the location. Solar PV installations are subjected to changing atmospheric conditions in different temperature, humidity, wind and dust levels. The different possible possibilities of failure in cooling equipment are listed and a negative ranking for each possibility is given along with its corresponding weight depending on the type of cooling method [33]. The different possible factors are listed below:
- A.
- Corrosion, coating formation and scaling of heat transfer surfaces;
- B.
- Physical degradation of heat transfer fluids;
- C.
- Leakage of fluid conduits;
- D.
- Electric equipment failure.
The following Table 2 gives the corresponding weights of the failure possibility under each type of cooling method. The weights are −1, −2 or −3 depending on the degree of possibility in the individual cooling method, with −1 representing minimum adverse impact or maximum reliability and −3 representing maximum adverse impact or minimum reliability. Data obtained from existing literature regarding the performance of different cooling systems were used to make Table 2.
Aluminum fins are located at the bottom of the panels and are subjected to air contact and dust particles that form layers which can cause resistance to heat flow from the fin and thereby cause panel temperature elevation over years of operation. Since this factor is minimal due to air cooling, the weight given is −1. Other causes of failure are negligible in this case and hence given 0. Heat pipe cooling involves low-boiling point organic or inorganic fluids such as water, acetone and other low-boiling liquids. These fluids cause coatings on surfaces as well as undergo degradation due to continuous heating and cooling [34]. Thermosiphon cooling uses water as a heat transfer fluid, and the cooling fluid moves through the bottom side of the panel through ducts or pipes in contact with the panel. The possibility of coatings on the heat transfer fluid as well as the possibility of leakage are dominant in this method. Thermosiphon cooling with a clay pot is another method where evaporative cooling taking place in the clay pot is used to produce cold fluid. The possibility of leakage loss of the fluid is very high over a longer period of time in this method. Forced convection fan cooling also results in coating formation over the heat transfer surface thus reducing heat transport. Since electrical components are involved, failure of these components is also possible over several years of operation. This is also the case for water spray cooling as well as evaporative cooling in which the wastage of water and equipment degradation due to water impacts over a period of time reduces reliability.
2.3. Economic Performance
The investment cost and operating cost of the cooling system involved differs according to the type of method used. Since PV panels operate with a very low margin of cost-effectiveness, cost reduction in the cooling mechanism is important [35]. The actual cost analysis of a cooling mechanism is determined from the initial fixed cost, annual maintenance cost and net savings achieved due to the cooling mechanism. Net present cost (NPC) is given by the following relation (refer to Equation (5) below):
In above Equation (5), MC is the maintenance and operation cost; AS is the annual savings in energy; i is the rate of interest; and n is the number of years and FC is fixed cost.
Fins are used to liberate heat from solar panels by air convective movement by natural convection or wind movement. Normally, two types of arrangements are used, namely, lapping fins and longitudinal fins [36]. PV panels using fins made of different materials incur the additional cost of the fin. The average fixed cost of fins is USD 58 per square meter panel area and the maintenance cost is USD 4/year [37]. Heat pipes come at a cost of USD 168 for a 1 m2 area [37]. PCM cooling of PV involves PCM casing with heat transfer arrangements in the form of fins to enhance the phase change. The PCM is the component with the maximum cost in this method with an average cost of USD 20–30/kW-hr. PCM material such as paraffin costs about USD 25 per kilogram, and a 1 square meter panel has a thickness of up to 5 cm per layer of PCM [14]. This will be equal to 45 kg of PCM per square meter PV area. Thermosiphon cooling mechanisms have round or rectangular piping embedded at the back of PV panels with either a storage tank or heat dissipation arrangement. The total cost of the piping and heat dissipation mechanism is roughly USD 25 USD for a 1 square meter area of the panel. Thermosiphon mechanisms using clay pot cooling have evaporative cooling of coolant water in the pot. The cost of this method is the same as that of the normal thermosiphon describe above. Force convection fan cooling uses the fin mechanism for heat dissipation and fans for maintaining air movement. The fans used for air circulation have power requirements proportional to the panel area. Usually, a 0.84 W fan is sufficient to cool a 1 square meter panel area [38]. Water spray cooling and evaporative cooling use pressure pumps to force water through nozzles and have a power rating of 50–100 W [39]. Table 3 gives the cost particulars for the different methods.
2.4. Environmental Aspects
Air cooling and water cooling in large PV installations have both direct short-term impacts as well as indirect long-term effects on the environment. Absorption and liberation of the heat accumulated on the panels disturb the thermal profile and can harm the flora and fauna of the location. Water cooling consumes considerable water taken from nearby reservoirs or from underground [41]. Usually, the treatment of water becomes necessary in order to protect panels from chemical effects such as corrosion and deposits. Passive cooling methods have a lesser environmental impact which is restricted to the impact of material usage and thermal interaction with surroundings. In the case of active cooling methods, the use of conventional power is avoided, and a fraction of the energy produced by the panel is used to drive fans or pumps used in the panel cooling mechanisms. Hence, emissions due to this electrical usage are not accounted for. However, the use of material for the piping and ducting for cooling are associated with emissions during their manufacturing process. About 0.00185 kg of CO2 is produced for every kilogram of steel produced [42] and 5.42 kg of CO2 for every kilogram of PVC. The other emissions occurring due to the installation of cooling systems are negligible and hence not taken into account. Phase change cooling involves the use of organic compounds or salts for latent heat absorption. Paraffin or similar organic chemicals which are used in PCM-based PV cooling are not bio-degradable and hence are harmful to the environment. In the case of heat pie cooling, low boiling point organic chemicals such as acetone are used which are also harmful to the environment. Hence, qualitative ranking is done in the case of environmental effects due to the different cooling mechanisms based on an extensive study of the impact of each method.
2.5. Ergonomics
The interaction of the equipment with the movement of manpower is the ergonomic factor. As the PV industry is expanding with mega-size installations along with large-scale equipment for cooling and other maintenance requirements, it becomes increasingly important to the installation process. Cooling systems which are too complicated in arrangement and which require a complex piping network that can obstruct human movement are ergonomically unacceptable. Incorporating ergonomics into the design process offers benefits beyond worker safety such as marketability [43]. In this regard, each of the above cooling systems is arranged according to their complexity of arrangement from the best option to worst option in Table 4 below.
From the above Table 4, it is evident that fin cooling has a minimum ergonomic impact as they do not involve the use of pipes or ducts and are closely fitted within the back of the panel. In the case of forced convection fan cooling, small fans are attached to the bottom of the panels in addition to the fins that drive the air away from the heat zone. Phase change material cooling involves a separate chamber at the bottom of the panel which makes them heavy and voluminous, and hence, they are ranked three. Thermosiphon cooling involves piping which may be rectangular or circular in cross-section with an arrangement for dumping the heat with fins or for other end uses as in the case of photovoltaic thermal systems. The extra projections from the panel can cause hindrance to the movement of personnel. Similarly, clay pots connected with thermosiphon systems need additional support structures and protection against breakage. Water sprays involve pumping mechanisms along with piping systems for distributing the water to spray nozzles. Water treatment mechanisms are also required in order to prevent deposits due to impure water. Evaporative cooling requires water treatment mechanisms and fans to drive air for the evaporation of moisture. Therefore, evaporative cooling methods create a maximum obstruction to the layout because of simultaneous water and air handling systems.
Table 5 gives the consolidated attributes of the different options. Efficiency enhancement depends on the climatic region as well as on whether it is summer or winter. Two climatic regions as per the Koppen climate classification, namely, the arid desert weather condition (BWh) and continental cold and dry conditions (Dwa) are considered in this study [44]. Temperatures attained by the panel in the summer and winter are calculated using Equation (5). It is to be noted that winter conditions in the Dwa climate region do not require cooling because of very low average winter temperatures. There are eight evaluation criteria including the four types of climate-based efficiency enhancement criteria. C1, C2, C3 and C4 represent the percentage of efficiency enhancements under BWh summer, BWh winter, Dwa summer and Dwa winter conditions. C5, C6, C7 and C8 represent the reliability, cost, emission factor and ergonomics, respectively.
3. MCDM Approach to Evaluate PV Panel Cooling Methods Evaluation
The objective is to determine suitable weights of evaluation for the PV panel cooling methods criterion, and the entropy weight method by Shannon is used. The lower the entropy value, the lower the amount of disorder in the cooling climatic zone criterion. In this article, the entropy weighting method is adopted to determine the weight of the criterion and sub-criterion related to the solar panel cooling methods. The multi-criteria decision approach can be applied where a set of alternative methods for cooling photovoltaic panels must be selected on the basis of a set of criteria. The multi-criteria decision-making approach adopted is simple, and the concept allows one to find the best alternatives for each criterion described by selecting the alternative PV panel cooling method that is the closest to the ideal PV panel cooling method and farthest from the negative ideal PV panel cooling method. For a specified set of m alternative PV panel cooling and n attributes/criteria and the rating of each PV cooling method against each criterion, refer to Table 5 above. The following sub-sections present the PV panel cooling method evaluation approach.
3.1. Structure of the Decision Matrix and its Standardization
Assuming there are a PV panel cooling method m and evaluation criteria n for the PV panel cooling method, Pij is the value of the criterion j and PV panel cooling method i. In order to eliminate the influence of the size of the criteria on immeasurability, it is necessary to standardize the criteria using equations of relative optimum membership degree. For the maximization criterion, the attribute value of criterion j in the method of cooling photovoltaic panels can be standardized using Equation (6), whereas for the minimization criterion, the same can be standardized by using Equation (7).
In Equations (6) and (7), is the standardized criterion value for the jth criterion of the ith alternative PV panel cooling method; is the jth criterion’s value for the ith alternative PV panel cooling method; and (i = 1, …, m) and (j = 1, …, n). Supposing that the evaluation set of the multi-attribute decision making problem with the jth criterion’s value in the ith PV panel cooling method is , then the decision matrix is P = [Pij]m × n; refer to Table 6 below.
After the standardization of all evaluation criteria for the given set of PV panel cooling method, the decision matrix is as below:
After the standardization of all evaluation criteria for all given PV panel cooling methods (refer Equations (6) to (8)), the decision matrix is expressed for each PV panel cooling method type as shown below in Table 7.
3.2. Estimation of Criterion Entropy Weights
The entropy weight represents useful information on the criterion related to PV panel cooling methods evaluation. Note that the higher the entropy weight of the evaluation criterion, the more important the criterion and vice versa. The entropy weight Ej of the jth criterion of the ith alternative PV panel cooling methods is determined by Equation (9). Subsequently, based on Ej of the jth criterion, Wj, the criterion entropy weights, is determined by using Equation (10).
The above Equations (9) and (10) determine Wj, an entropy weight of the jth evaluation criterion, using the standardization of all evaluation criteria. Table 8 below lists the obtained EWj values for each PV panel cooling assessment criterion (j).
3.3. The Decision Matrix Normalization
The above standardized matrix must be normalized to ensure that all attributes are equal and have the same format in order to remove the impact of the criteria dimension and its variation range on the evaluation results of the PV panel cooling methods. The normalized decision matrix is then obtained using Equation (11).
After the normalization of all evaluation criteria for all given PV panel cooling methods (refer to Equation (11)), the decision matrix is expressed for each cooling climatic zone types as shown below in Table 9.
3.4. Determine the Best and Worst PV Panel Cooling Methods for a Given Criterion
By multiplying each element of the normalized decision matrix above by its associated entropy weight EWj, the decision matrix is obtained using the below Equation (12).
The following Equations (13) and (14) are used, respectively, to obtain the best and worst solutions from the output of the aforementioned Equation (12).
In Equation (13)
In Equation (14)
3.5. Calculate Each Alternative PV Panel Cooling Method’s Proximity to the Best Solution for a Specific Criterion before Rating the Alternatives
For a given alternative PV panel cooling method for a given criterion, its proximity from the best ideal cooling strategy and its proximity from the worst cooling strategy is calculated using Equations (15) and (16), respectively.
For a given PV panel cooling method, its closeness to the ideal PV panel cooling method is obtained using Equation (17).
In Equation (17) above, the Ci value ranges between one and zero. The alternative PV panel cooling method i with the maximum positive value of Ci is ranked number one. Thus, the decision matrix of the 3 cooling climatic zones and the corresponding eight cooling strategies and 30 evaluation criteria are established according to the data in Table 7. The normalized decision matrix is established, and the weighted decision matrix is estimated (refer to Table 9), and then the best solution and the worst solution values are obtained by using Equations (13) and (14), respectively.
4. Results and Discussion
The best and worst cooling strategies for each PV panel cooling method are given in Table 10 below.
From Table 10, it is evident that for criteria C4, C5 and C8, cooling strategy 1: AFC is best and that this strategy is the worst for criteria C1, C2 and C7. This is supported by the fact that AFC is a reliable cooling method due to its efficient performance in all weather conditions and least impact on the surrounding workspace due to its compactness. AFC is ineffective in hot climatic conditions compared to the other methods and hence it is the worst case in the above-mentioned criteria. While cooling strategies 7: WSC and 8: ESC are best for criterion C3, they are worst for criterion C5. This can be explained by the fact that water spray and evaporative cooling enhances the cooling effect in hot conditions in dry weather compared to other methods. This is because the evaporation rate is high when the ambient conditions are dry and more latent heat of evaporation is need, which produces more cooling. In contrast, corrosion problems, leakages and material degradation, which are associated with the use of water, makes this strategy a poor performer in terms of reliability. Another interesting observation is that thermosiphon cooling is best in terms of cost due to a lesser investment required for the piping and heat transfer arrangements while, understandably, phase change cooling is the worst because of the higher volume requirements and the cost of phase change material. Now, as a decision maker, it is very difficult to reach a unique preference under multiple criteria. So, the closeness to the ideal solution for each alternative PV panel cooling method for a given criterion and the alternative PV panel cooling methods ranking is a must. Therefore, the weights of the scenarios are changed according to the requirement. Here, in this study, six weighting scenarios are adopted (refer to Table 11 below) and the rankings are obtained.
As can be seen from Table 11 above, the evaluation ranks of the eight PV panel cooling methods are AFC > WSC > TCC >ESC > TPC > FFC > HPC > PCC when equal weights are assigned to each criterion. However, it must be accepted that equal weights to all the criteria is an exaggeration, and this scenario is just used as a reference. On the other hand, when the need is to focus on minimizing cost, the preference of the eight PV panel cooling methods is AFC > TCC > FFC > TPC > WSC > ESC > HPC > PCC. This clearly indicates that the cost of AFC is minimum due to its minimum investment and maintenance cost. The least preferred in terms of cost is PCC due to the large quantities of phase change material required and its cost. Sometimes, certain operating requirements need a maximization of the efficiency of the cooling system to obtain the maximum power output. Hence, the objective is to maximize the efficiency of the operating plant, and the ranking is observed to be AFC > WSC > ESC > TPC > TCC > FFC > HPC > PPC, in which case AFC is the best option. If the objective is to minimize environmental impact by minimizing CO2 emissions, then the approach suggests the preference order as TCC > PCC > AFC > WSC > ESC > TPC > HPC > FFC, which shows that TCC is the best option. A comparison of the different scenarios indicates TCC ranks well in most of the cases. Thus, when it comes to total energy economics and environmental impact, choosing the best PV panel cooling technology for a given application is one of the trickiest issues. This has grown in complexity and should make it easier to dynamically incorporate shifting cooling needs and environmental variables. It has been noted that experts’ preference weights for the evaluation criterion for various locales vary. Therefore, in order to obtain the desired global energy production with minimal cost and specialized application capability, the decision maker must choose the most appropriate cooling technique. The primary focus of this research is on choosing the most effective PV panel cooling solution using MCDM to meet cooling needs. The MCDM method and entropy weight, which both have high resolution and straightforward calculation processes, might objectively assess the PV panel cooling methods for large PV solar panels. This approach is different as compared to the other known approaches.
5. Conclusions
The importance of PV panel cooling especially under high temperature ambient conditions has been frequently reported in the literature, and multiple methods for reducing the temperature have evolved recently. Selection of the right cooling method requires the consideration of different criteria, namely, technology feasibility, economic performance, environmental aspects and ergonomics. Multi-criteria decision analysis, which is an ideal tool, has been successfully used in this situation to rank the different cooling technologies. Eight different cooling methods were identified, and the analysis was made with the multi-criteria analysis tool on the different possible attributes. Two different climate zones with different weight schemes are considered for the evaluation process and the best to the worst cooling solution has been identified. Five different scenarios depending on the importance given to each evaluation criterion are analyzed. The best cooling method to the worst cooling method has been arranged under each scenario. When the efficiency of operation was given maximum weight, aluminum fin cooling proved to be the best panel cooling method. When the emission reduction criterion was given maximum weight, thermosiphon cooling was the best cooling option. A comparison of the results indicates that thermosiphon works out to be the best option. The second-best method was found to be forced convection cooling when equal weights were applied and thermosiphon cooling when a 40% weight on the efficiency enhancement criterion was applied, which is a more practical weight distribution. Phase change cooling and forced convection cooling were the poorest in performance from among the different cooling methods for all weighing scenarios. The strategy here takes into account the hazy nature of decision-making. To create the desired outranking connection between all of the various cooling solutions, it synthesizes the preference relationships for each alternative. To determine the impact of changes in the weighting given to objective criteria, a sensitivity analysis can also be performed. Future studies can be performed with the end use of the heat removed from the panel as one of the possible attributes which are reported in photovoltaic thermal collectors in recent research. Similar studies can be specifically focused on the different photovoltaic technologies.
Author Contributions
Formal analysis, Z.K. and A.U.R.; Methodology, Z.K.; TROPSIS, A.U.R.; Writing and original draft, Z.K.; Review and editing, A.U.R. All authors have read and agreed to the published version of the manuscript.
Funding
This research was funded by the Deputyship for Research & Innovation, Ministry of Education in Saudi Arabia, which funded this research work through the project no. IFKSURG-2-1570.
Institutional Review Board Statement
Not applicable.
Informed Consent Statement
Not applicable.
Data Availability Statement
Not applicable.
Acknowledgments
The authors extend their appreciation to the Deputyship for Research & Innovation, Ministry of Education in Saudi Arabia for funding this research work through the project no. IFKSURG-2-1570.
Conflicts of Interest
The authors declare no conflict of interest.
References
- Skoplaki, E.; Palyvos, J.A. On the Temperature Dependence of Photovoltaic Module Electrical Performance: A Review of Efficiency/Power Correlations. Sol. Energy 2009, 83, 614–624. [Google Scholar] [CrossRef]
- Taqwa, A.; Dewi, T.; Kusumanto, R.D.; Sitompul, C.R. Automatic Cooling of a PV System to Overcome Overheated PV Surface in Palembang. J. Phys. 2020, 1500, 012013. [Google Scholar] [CrossRef]
- Al-Ghezi, M.; Tariq Ahmedhamdi, R.; Chaichan, M. The Influence of Temperature and Irradiance on Performance of the Photovoltaic Panel in the Middle of Iraq. Int. J. Renew. Energy Dev. 2022, 11, 501–553. [Google Scholar] [CrossRef]
- Kumar, R.; Rosen, M.A. A Critical Review of Photovoltaic–Thermal Solar Collectors for Air Heating. Appl. Energy 2011, 88, 3603–3614. [Google Scholar] [CrossRef]
- Daghigh, R.; Ruslan, M.H.; Sopian, K. Advances in Liquid Based Photovoltaic/Thermal (PV/T) Collectors. Renew. Sustain. Energy Rev. 2011, 15, 4156–4170. [Google Scholar] [CrossRef]
- Adeeb, J.; Farhan, A.; Al-Salaymeh, A. Temperature Effect on Performance of Different Solar Cell Technologies. J. Ecol. Eng. 2019, 20, 249–254. [Google Scholar] [CrossRef]
- Makki, A.; Omer, S.; Sabir, H. Advancements in Hybrid Photovoltaic Systems for Enhanced Solar Cells Performance. Renew. Sustain. Energy Rev. 2015, 41, 658–684. [Google Scholar] [CrossRef]
- Tonui, J.K.; Tripanagnostopoulos, Y. Improved PV/T Solar Collectors with Heat Extraction by Forced or Natural Air Circulation. Renew. Energy 2007, 32, 623–637. [Google Scholar] [CrossRef]
- Arifin, Z.; Suyitno, S.; Tjahjana, D.D.D.P.; Juwana, W.E.; Putra, M.R.A.; Prabowo, A.R. The Effect of Heat Sink Properties on Solar Cell Cooling Systems. Appl. Sci. 2020, 10, 7919. [Google Scholar] [CrossRef]
- Popovici, C.G.; Hudişteanu, S.V.; Mateescu, T.D.; Cherecheş, N.-C. Efficiency Improvement of Photovoltaic Panels by Using Air Cooled Heat Sinks. Energy Procedia 2016, 85, 425–432. [Google Scholar] [CrossRef] [Green Version]
- Gang, P.; Huide, F.; Huijuan, Z.; Jie, J. Performance Study and Parametric Analysis of a Novel Heat Pipe PV/T System. Energy 2012, 37, 384–395. [Google Scholar] [CrossRef]
- Liu, F. Draw of Infinite Energy from Space and Negations of Two Important Laws. Energy Power Eng. 2010, 2, 137–142. [Google Scholar] [CrossRef]
- Tang, X. Experimental Investigation of Solar Panel Cooling by a Novel Micro Heat Pipe Array. Energy Power Eng. 2010, 2, 171–174. [Google Scholar] [CrossRef]
- Arıcı, M.; Bilgin, F.; Nižetić, S.; Papadopoulos, A.M. Phase Change Material Based Cooling of Photovoltaic Panel: A Simplified Numerical Model for the Optimization of the Phase Change Material Layer and General Economic Evaluation. J. Clean. Prod. 2018, 189, 738–745. [Google Scholar] [CrossRef]
- Kiwan, S.; Ahmad, H.; Alkhalidi, A.; Wahib, W.O.; Al-Kouz, W. Photovoltaic Cooling Utilizing Phase Change Materials. E3S Web Conf. 2020, 160, 02004. [Google Scholar] [CrossRef]
- Amelia, A.R.; Irwan, Y.M.; Irwanto, M.; Leow, W.Z.; Gomesh, N.; Safwati, I.; Anuar, M.A.M. Cooling on Photovoltaic Panel Using Forced Air Convection Induced by DC Fan. Int. J. Electr. Comput. Eng. 2016, 6, 526. [Google Scholar] [CrossRef]
- Sharaf, M.; Yousef, M.S.; Huzayyin, A.S. Review of Cooling Techniques Used to Enhance the Efficiency of Photovoltaic Power Systems. Env. Sci. Pollut. Res. 2022, 29, 26131–26159. [Google Scholar] [CrossRef]
- Teo, H.G.; Lee, P.S.; Hawlader, M.N.A. An Active Cooling System for Photovoltaic Modules. Appl. Energy 2012, 90, 309–315. [Google Scholar] [CrossRef]
- Arcuri, N.; Reda, F.; De Simone, M. Energy and Thermo-Fluid-Dynamics Evaluations of Photovoltaic Panels Cooled by Water and Air. Sol. Energy 2014, 105, 147–156. [Google Scholar] [CrossRef]
- Bevilacqua, P.; Bruno, R.; Arcuri, N. Comparing the Performances of Different Cooling Strategies to Increase Photovoltaic Electric Performance in Different Meteorological Conditions. Energy 2020, 195, 116950. [Google Scholar] [CrossRef]
- Wang, G.; Zhou, J. Lightweight Neural Networks-Based Safety Evaluation for Smart Construction Devices. Comput. Intell. Neurosci. 2022, 2022, e3192552. [Google Scholar] [CrossRef]
- Ding, L.; Shao, Z.; Zhang, H.; Xu, C.; Wu, D. A Comprehensive Evaluation of Urban Sustainable Development in China Based on the TOPSIS-Entropy Method. Sustainability 2016, 8, 746. [Google Scholar] [CrossRef]
- Pohekar, S.D.; Ramachandran, M. Application of Multi-Criteria Decision Making to Sustainable Energy Planning—A Review. Renew. Sustain. Energy Rev. 2004, 8, 365–381. [Google Scholar] [CrossRef]
- Arriola, E.R.; Ubando, A.T.; Chen, W.-H. A Bibliometric Review on the Application of Fuzzy Optimization to Sustainable Energy Technologies. Int. J. Energy Res. 2022, 46, 6–27. [Google Scholar] [CrossRef]
- Dubey, S.; Sarvaiya, J.N.; Seshadri, B. Temperature Dependent Photovoltaic (PV) Efficiency and Its Effect on PV Production in the World—A Review. Energy Procedia 2013, 33, 311–321. [Google Scholar] [CrossRef]
- Habeeb, L.J.; Mutasher, D.G. Solar Panel Cooling and Water Heating with an Economical Model Using Thermosiphon. Jordan J. Mech. Ind. Eng. 2018, 12, 189–196. [Google Scholar]
- Waqas, A.; Ji, J. Thermal Management of Conventional PV Panel Using PCM with Movable Shutters—A Numerical Study. Sol. Energy 2017, 158, 797–807. [Google Scholar] [CrossRef]
- Abd Ali, F.; Habeeb, L. Cooling Photovoltaic Thermal Solar Panel by Using Heat Pipe at Baghdad Climate. Int. J. Mech. Mechatron. Eng. 2021, 17, 171–185. [Google Scholar]
- Owhaib, W.; Qanadah, Y.; Al-Ajalin, H.; Tuffaha, A.; Al-Kouz, W. Photovoltaic Panel Efficiency Improvement by Using Direct Water Passive Cooling with Clay Pot. In Proceedings of the 2021 12th International Renewable Engineering Conference (IREC), Amman, Jordan, 14–15 April 2021; pp. 1–4. [Google Scholar]
- Mazón-Hernández, R.; García-Cascales, J.R.; Vera-García, F.; Káiser, A.S.; Zamora, B. Improving the Electrical Parameters of a Photovoltaic Panel by Means of an Induced or Forced Air Stream. Int. J. Photoenergy 2013, 2013, e830968. [Google Scholar] [CrossRef]
- Grubišić-Čabo, F.; Nižetić, S.; Giuseppe Marco, T. Photovoltaic Panels: A Review of the Cooling Techniques. Trans. FAMENA 2016, 40, 63–74. [Google Scholar]
- Alami, A.H. Effects of Evaporative Cooling on Efficiency of Photovoltaic Modules. Energy Convers. Manag. 2014, 77, 668–679. [Google Scholar] [CrossRef]
- Dwivedi, P.; Sudhakar, K.; Soni, A.; Solomin, E.; Kirpichnikova, I. Advanced Cooling Techniques of P.V. Modules: A State of Art. Case Stud. Therm. Eng. 2020, 21, 100674. [Google Scholar] [CrossRef]
- Dhokane, N.; Ramesh, S. Enhancement of Reliability and Efficiency of Solar Panel Using Cooling Methods; Springer: Cham, Switzerland, 2021; Available online: https://link.springer.com/chapter/10.1007/978-3-030-69925-3_13 (accessed on 23 December 2022).
- Peyghambarzadeh, S.M.; Shahpouri, S.; Aslanzadeh, N.; Rahimnejad, M. Thermal performance of different working fluids in a dual diameter circular heat pipe. Ain Shams Eng. J. 2013, 4, 855–861. [Google Scholar] [CrossRef] [Green Version]
- Sajjad, U.; Amer, M.; Ali, H.M.; Dahiya, A.; Abbas, N. Cost Effective Cooling of Photovoltaic Modules to Improve Efficiency. Case Stud. Therm. Eng. 2019, 14, 100420. [Google Scholar] [CrossRef]
- Elbreki, A.M.; Muftah, A.F.; Sopian, K.; Jarimi, H.; Fazlizan, A.; Ibrahim, A. Experimental and Economic Analysis of Passive Cooling PV Module Using Fins and Planar Reflector. Case Stud. Therm. Eng. 2021, 23, 100801. [Google Scholar] [CrossRef]
- Heat Pipes—Heat Exchanger Pipe Latest Price, Manufacturers & Suppliers. Available online: https://dir.indiamart.com/impcat/heat-pipes.html (accessed on 23 December 2022).
- Sahu, P.P.; Swain, A.; Sarangi, R.K. Role of PCM in Solar Photovoltaic Cooling: An Overview. In Proceedings of International Conference on Thermofluids; Revankar, S., Sen, S., Sahu, D., Eds.; Springer: Singapore, 2021; pp. 245–259. Available online: https://dokumen.pub/proceedings-of-international-conference-on-thermofluids-kiit-thermo-2020-1st-ed-9789811578304-9789811578311.html (accessed on 2 December 2022).
- Nižetić, S.; Čoko, D.; Yadav, A.; Grubišić-Čabo, F. Water Spray Cooling Technique Applied on a Photovoltaic Panel: The Performance Response. Energy Convers. Manag. 2016, 108, 287–296. [Google Scholar] [CrossRef]
- Javaid, M.S. Groundwater Hydrology; IntechOpen: Rijeka, Croatia, 2020; ISBN 978-1-83880-621-7. [Google Scholar]
- Chunbao Charles, X.U.; Cang, D.Q. A Brief Overview of Low CO2 Emission Technologies for Iron and Steel Making. J. Iron Steel Res. Int. 2010, 17, 1–7. [Google Scholar] [CrossRef]
- Tawalbeh, M.; Al-Othman, A.; Kafiah, F.; Abdelsalam, E.; Almomani, F.; Alkasrawi, M. Environmental Impacts of Solar Photovoltaic Systems: A Critical Review of Recent Progress and Future Outlook. Sci. Total Environ. 2021, 759, 143528. [Google Scholar] [CrossRef]
- Available online: https://www.mindat.org/climate.php (accessed on 22 January 2023).
Figure 1.
Classification of different PV panel cooling methods.

Figure 2.
(a–f) The alternative PV panel cooling methods.


Table 1.
Technical performance of different cooling methods.
| S.No | Cooling Method | Temperature Drop (°C) | Panel Area and Type (cm × cm) | Peak Power W | % Efficiency Enhancement | Net Power gain W/m2 | Reference |
|---|---|---|---|---|---|---|---|
| 1 | Aluminum fins | 12.5 | 50 × 50 | 20 | 4% | 40 | [14] |
| 2 | Heat pipe cooling | 14.2 | 1240 × 541 | 80 | 8% | 80 | [25] |
| 3 | Phase change material | 23 | 48.5 × 34.5 | 20 | 10% | 100 | [26] |
| 4 | Thermosiphon cooling | 23 | 1240 × 541 | 80 | 8% | 80 | [27] |
| 5 | Thermosiphon/clay pot cooling | 28 | 43 × 43 | 20 | 10% | 100 | [28] |
| 6 | Forced convection fan cooling | 22 | 88 × 88 | 55 | 7% | 70 | [29] |
| 7 | Water spraying | 40 | 75 × 75 | 50 | 15% | 150 | [30] |
| 8 | Evaporative cooling | 40 | 75 × 75 | 50 | 15% | 150 | [16] |
1,2,8-monocrystalline silicon PV cells 3,4,5,6, 7-polycrystalline silicon.
Table 2.
Weights of different cooling methods in terms of reliability.
| Sr. No. | Cooling Method | Weights of the Reliability Factors | Total Rank | |||
|---|---|---|---|---|---|---|
| A | B | C | D | |||
| 1 | Aluminum fins | −1 | 0 | 0 | 0 | −1 |
| 2 | Heat pipe cooling | 0 | −2 | −2 | 0 | −4 |
| 3 | Phase change material | 0 | −1 | −1 | 0 | −2 |
| 4 | Thermosiphon cooling | −1 | −1 | −2 | 0 | −4 |
| 5 | Thermosiphon with clay pot cooling | −1 | −1 | −3 | 0 | −5 |
| 6 | Forced convection fan cooling | −1 | 0 | 0 | −2 | −3 |
| 7 | Water spraying | −1 | −1 | −1 | −2 | −5 |
| 8 | Evaporative cooling | −2 | −1 | −1 | −2 | −5 |
Table 3.
Cost of different cooling methods per square meter of the panel area.
| Sr. No. | Cooling Method | Total Cost USD/m2 | |
|---|---|---|---|
| 1 | Aluminum fins | 58 | [37] |
| 2 | Heat pipe cooling | 168 | [37] |
| 3 | Phase change material | 1125 | [14] |
| 4 | Thermosiphon cooling | 25 | [40] |
| 5 | Thermosiphon with clay pot cooling | 25 | [40] |
| 6 | Forced convection fan cooling | 68 | [38] |
| 7 | Water spraying | 75 | [39] |
| 8 | Evaporative cooling | 75 | [39] |
Table 4.
Ranking of cooling methods based on ergonomic acceptability.
| Cooling Method | Ergonomic Ranking |
|---|---|
| Aluminum fins | 1 |
| Forced convection fan cooling | 2 |
| Phase change material | 3 |
| Thermosiphon cooling | 4 |
| Heat pipe cooling | 5 |
| Thermosiphon with clay pot cooling | 6 |
| Water spraying | 7 |
| Evaporative cooling | 8 |
Table 5.
Consolidated attribute list for different factors in the cooling method selection.
| Alternative Cooling Method | %Efficiency Enhancement (MAX) | Reliability Negative Rank (MAX) | Cost USD/m2 (MIN) | Emission CO2 in Kg (MIN) | Ergonomics Ranks (MIN) | |||
|---|---|---|---|---|---|---|---|---|
| BWh | Dwa | |||||||
| Summer C1 | Winter C2 | Summer C3 | Winter C4 | C5 | C6 | C7 | C8 | |
| Aluminum fins cooling (AFC) | 4% | 2% | 3% | 0% | −1 | 58 | Good | 1 |
| Heat pipe cooling (HPC) | 8% | 2% | 6% | 0% | −4 | 168 | Acceptable | 5 |
| Phase change material cooling (PCC) | 10% | 2% | 8% | 0% | −2 | 1125 | Poor | 3 |
| Thermosiphon cooling (TCC) | 8% | 2% | 6% | 0% | −4 | 25 | Poor | 4 |
| Thermosiphon with clay pot cooling (TPC) | 10% | 2% | 8% | 0% | −5 | 25 | Good | 6 |
| Forced convection fan cooling (FCC) | 7% | 2% | 1% | 0% | −3 | 68 | Good | 2 |
| Water spray cooling (WSC) | 15% | 2% | 12% | 0% | −5 | 75 | Good | 7 |
| Evaporative cooling (EVC) | 15% | 2% | 12% | 0% | −5 | 75 | Good | 8 |
Table 6.
Decision matrix P for the jth criterion’s value for the ith alternative PV panel cooling method.
Table 6.
Decision matrix P for the jth criterion’s value for the ith alternative PV panel cooling method.
| Alternative PV Panel Cooling Method (i) | Evaluation Criterion (j) | |||
|---|---|---|---|---|
| 1 | 2 | . | n | |
| 1 | PP11 | P12 | . | P1n |
| 2 | P21 | P22 | . | P2n |
| . | . | . | . | . |
| . | . | . | . | . |
| M | Pm1 | Pm2 | . | Pmn |
| Criterion Weight → | W1 | W2 | . | Wn |
Table 7.
Standardized decision matrix for alternative PV panel cooling methods.
| Evaluation Criterion (j) | Alternative PV Panel Cooling Methods (i) | |||||||
|---|---|---|---|---|---|---|---|---|
| AFC $ | HPC | PCC | TCC | TPC | FFC | WSC | ESC | |
| C1 $ | 0.04 | 0.08 | 0.1 | 0.08 | 0.1 | 0.07 | 0.15 | 0.15 |
| C2 | 0.02 | 0.02 | 0.02 | 0.02 | 0.02 | 0.02 | 0.02 | 0.02 |
| C3 | 0.03 | 0.06 | 0.08 | 0.06 | 0.08 | 0.01 | 0.12 | 0.12 |
| C4 | 0 | 0 | 0 | 0 | 0 | 0 | 0 | 0 |
| C5 | −1 | −4 | −2 | −4 | −5 | −3 | −5 | −5 |
| C6 | 58 | 168 | 1125 | 25 | 25 | 68 | 75 | 75 |
| C7 | Good | Acceptable | Poor | Poor | Good | Good | Good | Good |
| C8 | 1 | 5 | 3 | 4 | 6 | 2 | 7 | 8 |
Note: $ Refer to Table 5.
Table 8.
Entropy weight Ej values for each PV panel cooling assessment criterion (j).
| Evaluation Criterion (j) | Entropy Weight Values (EWj) |
|---|---|
| C1 $ | 0.039418 |
| C2 | 0.24979 |
| C3 | 0.057353 |
| C4 | 0.24979 |
| C5 | 0.098977 |
| C6 | 0.216416 |
| C7 | 0.041632 |
| C8 | 0.046626 |
Note: $ Refer to Table 5.
Table 9.
Decision matrix for PV panel cooling methods.
| Evaluation Criterion (j) | Alternative PV Panel Cooling Methods (i) | |||||||
|---|---|---|---|---|---|---|---|---|
| AFC $ | HPC | PCC | TCC | TPC | FFC | WSC | ESC | |
| C1 $ | 0.1378 | 0.2755 | 0.3444 | 0.2755 | 0.3444 | 0.2411 | 0.5166 | 0.5166 |
| C2 | 0.0000 | 0.3780 | 0.3780 | 0.3780 | 0.3780 | 0.3780 | 0.3780 | 0.3780 |
| C3 | 0.1344 | 0.2689 | 0.3585 | 0.2689 | 0.3585 | 0.0448 | 0.5377 | 0.5377 |
| C4 | 1.0000 | 0.0000 | 0.0000 | 0.0000 | 0.0000 | 0.0000 | 0.0000 | 0.0000 |
| C5 | −0.0909 | −0.3636 | −0.1818 | −0.3636 | −0.4545 | −0.2727 | −0.4545 | −0.4545 |
| C6 | 0.0506 | 0.1465 | 0.9813 | 0.0218 | 0.0218 | 0.0593 | 0.0654 | 0.0654 |
| C7 | 0.4508 | 0.3607 | 0.2705 | 0.2705 | 0.3607 | 0.3607 | 0.3607 | 0.3607 |
| C8 | 0.0700 | 0.3501 | 0.2100 | 0.2801 | 0.4201 | 0.1400 | 0.4901 | 0.5601 |
Note: $ Refer to Table 5.
Table 10.
The best and worst solutions for cooling PV panels for respective evaluation criterion.
| Evaluation Criterion (j) | PV Panel Cooling Method | |||
|---|---|---|---|---|
| V+ | Cooling Strategy | V− | Cooling Strategy | |
| C1 $ | 0.020364 | WSC $ | 0.00543 | AFC |
| C2 | 0.094412 | HPC to EVC | 0 | AFC |
| C3 | 0.030841 | WSC, EVC | 0.00257 | FCC |
| C4 | 0.24979 | AFC | 0 | HPC to EVC |
| C5 | 0.0000 | AFC | −0.04499 | TPC, WSC, EVC |
| C6 | 0.004719 | TCC | 0.212367 | PCC |
| C7 | 0.011261 | PCC, TCC | 0.018769 | AFC |
| C8 | 0.003264 | AFC | 0.026116 | EVC |
Note: $ Refer to Table 5.
Table 11.
The PV panel cooling method’s distance from the best ideal and the worst cooling method and their ranks using various weighting scenarios.
Table 11.
The PV panel cooling method’s distance from the best ideal and the worst cooling method and their ranks using various weighting scenarios.
| PV Panel Cooling Method (i) | Scenario 1: Entropy Weights | ||||
|---|---|---|---|---|---|
| Di+ (Distance from the Best Ideal) | Di− (Distance from the Worst Ideal) | Di−/(Di+ + Di−) | Rank Ci | ||
| AFC $ | 0.0988 | 0.3237 | 0.7661 | 1 | |
| HPC | 0.2537 | 0.2048 | 0.4466 | 7 | |
| PCC | 0.3253 | 0.1018 | 0.2383 | 8 | |
| TCC | 0.2521 | 0.2292 | 0.4762 | 2 | |
| TPC | 0.2532 | 0.2291 | 0.4750 | 3 | |
| FFC | 0.2524 | 0.2224 | 0.4684 | 4 | |
| WSC | 0.2533 | 0.2219 | 0.4670 | 5 | |
| ESC | 0.2536 | 0.2219 | 0.4667 | 6 | |
| PV panel cooling method (i) | Scenario 2: 65% weight to reliability and the rest equal to 5% each | ||||
| Di+ (distance from the best ideal) | Di− (distance from the worst ideal) | Di−/(Di+ + Di−) | Rank Ci | ||
| AFC | 0.0347 | 0.2473 | 0.8769 | 1 | |
| HPC | 0.1858 | 0.0768 | 0.2924 | 5 | |
| PCC | 0.0922 | 0.1803 | 0.6618 | 2 | |
| TCC | 0.1854 | 0.0812 | 0.3047 | 4 | |
| TPC | 0.2426 | 0.0555 | 0.1862 | 8 | |
| FFC | 0.1315 | 0.1301 | 0.4974 | 3 | |
| WSC | 0.2426 | 0.0588 | 0.1950 | 6 | |
| ESC | 0.2429 | 0.0587 | 0.1945 | 7 | |
| PV panel cooling method (i) | Scenario 3: Equal weights to all | ||||
| Di+ (distance from the best ideal) | Di− (distance from the worst ideal) | Di−/(Di+ + Di−) | Rank Ci | ||
| AFC | 0.0868 | 0.1874 | 0.6834 | 1 | |
| HPC | 0.1429 | 0.1231 | 0.4627 | 7 | |
| PCC | 0.1772 | 0.0896 | 0.3357 | 8 | |
| TCC | 0.1397 | 0.1399 | 0.5003 | 3 | |
| TPC | 0.1439 | 0.1388 | 0.4910 | 5 | |
| FFC | 0.1461 | 0.1381 | 0.4860 | 6 | |
| WSC | 0.1435 | 0.1469 | 0.5058 | 2 | |
| ESC | 0.1470 | 0.1466 | 0.4994 | 4 | |
| PV panel cooling method (i) | Scenario 4: 60% weight to cost and the rest total 40% | ||||
| Di+ (distance from the best ideal) | Di− (distance from the worst ideal) | Di−/(Di+ + Di−) | Rank Ci | ||
| AFC | 0.0301 | 0.5623 | 0.9492 | 1 | |
| HPC | 0.0890 | 0.5016 | 0.8493 | 7 | |
| PCC | 0.5765 | 0.0497 | 0.0794 | 8 | |
| TCC | 0.0435 | 0.5768 | 0.9299 | 2 | |
| TPC | 0.0574 | 0.5761 | 0.9094 | 4 | |
| FFC | 0.0423 | 0.5552 | 0.9292 | 3 | |
| WSC | 0.0669 | 0.5499 | 0.8915 | 5 | |
| ESC | 0.0715 | 0.5499 | 0.8849 | 6 | |
| PV panel cooling method (i) | Scenario 5: 50% weight to emission and the rest total 50% | ||||
| Di+ (distance from the best ideal) | Di− (distance from the worst ideal) | Di−/(Di+ + Di−) | Rank Ci | ||
| AFC | 0.1076 | 0.1040 | 0.4916 | 3 | |
| HPC | 0.1054 | 0.0744 | 0.4137 | 7 | |
| PCC | 0.1025 | 0.1039 | 0.5035 | 2 | |
| TCC | 0.0946 | 0.1108 | 0.5394 | 1 | |
| TPC | 0.1039 | 0.0810 | 0.4380 | 6 | |
| FFC | 0.1106 | 0.0765 | 0.4090 | 8 | |
| WSC | 0.1023 | 0.0905 | 0.4695 | 4 | |
| ESC | 0.1031 | 0.0905 | 0.4674 | 5 | |
| PV panel cooling method (i) | Scenario 6: 60% weight to efficiency and the rest total 40% | ||||
| Di+ (distance from the best ideal) | Di− (distance from the worst ideal) | Di−/(Di+ + Di−) | Rank Ci | ||
| AFC | 0.1022 | 0.1873 | 0.6470 | 1 | |
| HPC | 0.1649 | 0.1111 | 0.4025 | 7 | |
| PCC | 0.1827 | 0.0932 | 0.3378 | 8 | |
| TCC | 0.1632 | 0.1232 | 0.4302 | 5 | |
| TPC | 0.1628 | 0.1260 | 0.4362 | 4 | |
| FFC | 0.1736 | 0.1189 | 0.4064 | 6 | |
| WSC | 0.1603 | 0.1429 | 0.4714 | 2 | |
| ESC | 0.1622 | 0.1428 | 0.4681 | 3 | |
Note: $ Refer to Table 5.
Disclaimer/Publisher’s Note: The statements, opinions and data contained in all publications are solely those of the individual author(s) and contributor(s) and not of MDPI and/or the editor(s). MDPI and/or the editor(s) disclaim responsibility for any injury to people or property resulting from any ideas, methods, instructions or products referred to in the content. |
© 2023 by the authors. Licensee MDPI, Basel, Switzerland. This article is an open access article distributed under the terms and conditions of the Creative Commons Attribution (CC BY) license (https://creativecommons.org/licenses/by/4.0/).
Share and Cite
MDPI and ACS Style
Kaneesamkandi, Z.; Rehman, A.U. Selection of a Photovoltaic Panel Cooling Technique Using Multi-Criteria Decision Analysis. Appl. Sci. 2023, 13, 1949. https://doi.org/10.3390/app13031949
AMA Style
Kaneesamkandi Z, Rehman AU. Selection of a Photovoltaic Panel Cooling Technique Using Multi-Criteria Decision Analysis. Applied Sciences. 2023; 13(3):1949. https://doi.org/10.3390/app13031949
Chicago/Turabian StyleKaneesamkandi, Zakariya, and Ateekh Ur Rehman. 2023. "Selection of a Photovoltaic Panel Cooling Technique Using Multi-Criteria Decision Analysis" Applied Sciences 13, no. 3: 1949. https://doi.org/10.3390/app13031949
Note that from the first issue of 2016, this journal uses article numbers instead of page numbers. See further details here.