
Examining the Amount of Particulate Matter (PM) Emissions in Urban Areas


Department of Road and Urban Transport, University of Žilina, 01026 Žilina, Slovakia
*
Author to whom correspondence should be addressed.
Appl. Sci. 2023, 13(3), 1845; https://doi.org/10.3390/app13031845
Submission received: 28 December 2022
/
Revised: 27 January 2023
/
Accepted: 29 January 2023
/
Published: 31 January 2023
(This article belongs to the Special Issue Sources, Processing, Transport, Health and Climate Impacts of Air Pollutants)
Abstract
:Featured Application
Road transport emissions are a considerable source of air pollution. Our research presents a possible tool for quantifying particulate matter emissions in an urban environment.
Abstract
Particulate matter significantly contributes to environmental pollution, negatively affects human health and irreparably damages all living things. The purpose of the research is to help determine the concentration of particulate matter in metropolitan areas. Three measuring stations in a city in central Slovakia were selected for the research. The sites were located at the main bus terminal, near primary schools, and at a railway crossing. Each station formed a measuring point. During the investigation, we monitored the amount of flying dust; at the same time, the intensity of traffic in the vicinity of the measuring stations was monitored. The research made it possible to determine the link between the volume of traffic and the concentration of particulate matter. The level of dependence between the concentration of particulate matter and the volume was first evaluated based on correlation coefficients. From the results of the research, it is possible to consider the dependence of the concentration of pollutants and the intensity of traffic as high. For each measurement, the correlation coefficient values were above 0.7 and, in some cases, exceeded 0.9, which can be considered very high levels of dependence. The highest level of pollution was detected at the bus station where the concentration of PM10 exceeded the value of 83 μg/m3 and the concentration of PM2.5 was at a level exceeding the limit of 16 μg/m3. This evidence can be considered very negative due to the high occurrence of people in this place. Different concentrations of particulate matter can also be monitored at other measuring points. According to research results, metropolitan road transport has a significant impact on the concentration of particulate matter, which have an adverse effect on nearby pedestrians.
1. Introduction
The results of recent studies have found that air quality in cities has deteriorated due to the increasing concentration of human activities that produce polluting emissions [1]. The main cause of current air pollution is mainly emissions from household heating and emissions from transport. Studies [2,3] have shown that solid particles and nitrogen oxides contribute to excessive pollution. Their increased concentration is particularly observable in metropolitan areas with an extreme number of cars. Residents in such conditions have difficulty breathing. In such environmental conditions, pollutants begin to accumulate, especially particulate matter PM10 and PM2.5 [4]. These are very small particles that are hardly visible to the naked eye. Particulate matter from city roads contain toxic metals and act as carriers of pollutants released into the air as well as carcinogens, which pose a potential risk to human health [5,6].
The resuspension of PM and road wear particles accumulated on the surface, in addition to fine and coarse space particles that are mostly produced by tire and brake wear, are the main contributors to non-exhaust emissions [7,8]. Particulate matter (PM) air pollution is largely the result of burning fossil fuels. The AQLI (Air Quality Life Index) study shows that the life expectancy of all women, men, and children worldwide who live in areas with a PM concentration higher than what was considered safe by the World Health Organization (WHO) [9] could be reduced by almost 2.2 years. Poor air quality shortens human lives around the world and has a negative effect worse than cigarettes, therefore, there is no greater risk to human life at present [10].
When investigating the concentration of particulate matter, size is important. A study by Schneider et al. points to the formation and impact of particles smaller than 1 μm in metropolitan areas [11]. The smaller the fine dust particles, the more insidious their inhalation is for our organisms. Much also depends on their chemical composition. PM is composed of liquid and particulate matter, that can remain suspended in the air for long periods of time. Particles that are larger than PM10 are already filtered out in the nasal cavity and do not pose a considerable risk to human health. However, smaller particles (PM2,5) penetrate the larynx and lower respiratory tract, subsequently settling in the bronchi. Because of their small sizes, PM2.5 particles can remain in the air for days after being emitted or formed in the atmosphere and can be transported long distances from their source [12,13,14].
According to the World Health Organization, PM was responsible for 3 million premature deaths worldwide in 2016 [15]. Decreasing PM2.5 levels by 10 μg/m3 could increase life expectancy by 0.61 years [16]. Moreover, the results of several studies have shown a significant positive association between the quantities of PM2.5 in road dust and the frequency of hospitalization due to cardiovascular and respiratory complications [17,18].
Young children, the elderly, and people suffering from allergies or asthma are sensitive to air pollution. The biggest air quality problem in Slovakia is air pollution comprising dust particles (PM10); furthermore, PM also causes the greatest damage to human health in Europe [19,20,21].
Air pollution is hard to escape, no matter where one is. Particulate matter in general can come from very diverse sources both natural and anthropogenic. The natural sources include processes that normally occur in nature (forest fires, erosion processes, etc.). Anthropogenic sources include emissions from combustion processes household heating, transport, electricity production, heating plants, waste incinerators, and various other production processes. To a lesser extent, increased dustiness is also contributed by dust from the road residues from the wear of brakes and tires, winter litter, and road pollution. The harmfulness of particulate matter to human health depends not only on the size of the particles but also on their composition, which is conditioned by what source they come from [22,23]. In the studies of Tomar et al., the amount of concentration of particulate matter depending on the road surface is characterized. The research results show that in the rural urban landscape, the main source of PM2.5 is automobile activity. Suspended particulate matter accounts for 89% and 75% of total PM2.5 on rural and urban roads, respectively. The proportion is higher in rural areas due to the poor condition of roads. In addition, vehicles driving on rural roads contribute to emissions in a similar proportion to the length of rural roads. It seriously affects human health as well as the environment [24,25].
Several studies have been conducted to investigate the state of PM pollution, which in most cases exceeds global air quality guidelines [26,27]. Therefore, air quality has become an important measure of life quality in densely populated cities and industrial areas. Air quality control is currently highly desirable to improve the sustainability of cities and the quality of life of their inhabitants [28,29]. Legislative air quality standards and emission control policies regulate the release of harmful substances into the atmosphere and manage the concentrations of air pollutants, such as PM2.5, PM10, NOX, and O3 [30,31].
However, it is necessary to monitor and forecast air quality for the effective prevention of air pollution. Several studies have been conducted that focus on different method-selection strategies for effective PM concentration mapping [32,33]. Several authors have addressed the relationship between the number of vehicles and PM concentration; however, they declared uneven results. Some researchers found that increases in traffic congestion in urban areas resulted in increasing PM levels [34,35,36], while others discovered very weak or zero [37,38,39,40] correlation between variables. The COVID-19 pandemic also had an impact on improvements to air quality when there were mass restrictions on human activities, which led to changes in air pollution levels in many regions around the world [41,42].
The research conducted was aimed at evaluating the relationship between the number and category of vehicles in relation to the concentration of particulate matter. The research points to different levels of pollution depending on the category and number of vehicles that were registered during the research. Currently, the Slovak Republic does not have a universal tool for monitoring air quality in urban areas. Within cities or larger agglomerations, there is no study available on how to monitor and evaluate air quality in a specific section. In the near future, it is planned to create measuring points in selected places that will continuously monitor air quality. One of the assessed values is the concentration of particulate matter. For this reason, the research is carried out in such a form. The results of the study can serve as a tool for the correct placement of measuring devices in order to permanently monitor air quality. Based on the results of measurements and current data, specific measures can be introduced (entry ban, limited entry for selected types of vehicles, etc.) with the aim of permanently reducing emissions in the urban environment. The research findings further provide support for planning the optimization of air quality management policies toward the creation of sustainable cities. In the Slovak Republic, there is still no instrument to prevent the movement of passenger traffic in the city center. To a large extent, the study could be beneficial in building a green policy and permanently reducing emissions due to traffic within cities.
We evaluated data provided by the Slovak Hydrometeorological Institute, the only institution in the Slovak Republic that deals with monitoring and evaluating air quality. However, the institution only participates in the assessment (it is informative in nature). Based on the results, it is not possible to implement any steps that would lead to the improvement of the current situation in the territory of the Slovak Republic.
Table 1 shows the categorization of the measured components of particulate matter based on intervals. After placing the measured value in the appropriate interval, we receive information about air quality. The color design provides visual information to alert the reader if there is a deterioration in air quality, and this information is traceable online. The results of the particulate matter examination are also reproduced with the same expressions.
2. Measurement Methodology
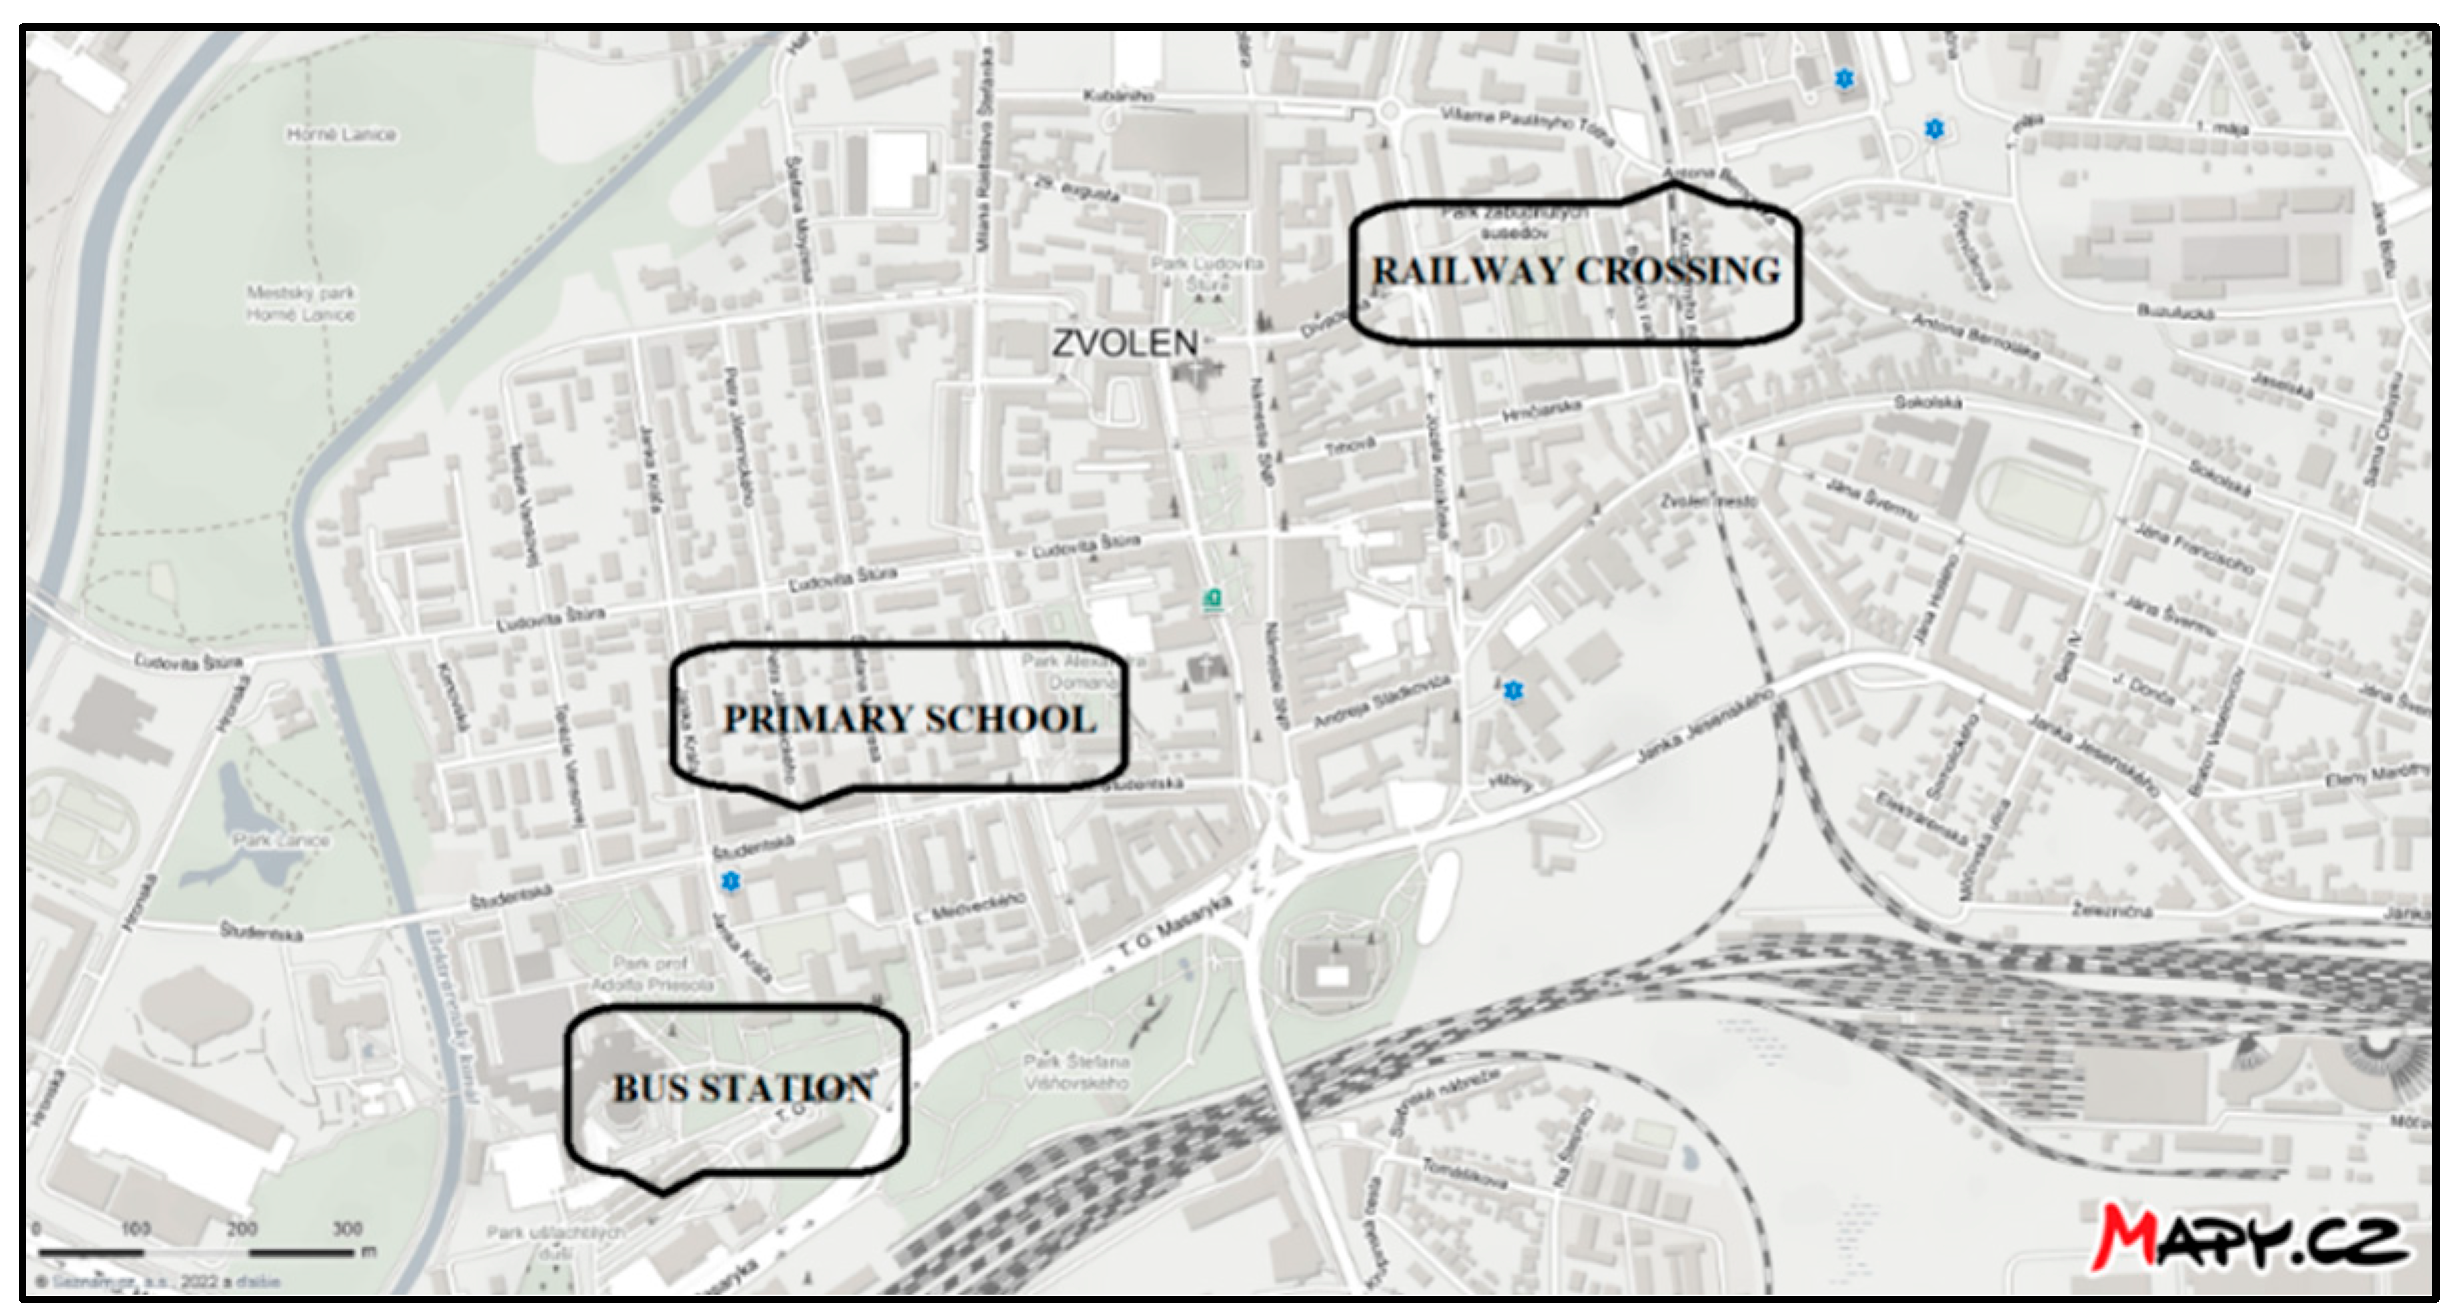
For our research, we chose the measuring points where the measurements were carried out. We performed the study in a city located in central Slovakia. We selected places with a high intensity of pedestrians and traffic congestion that are located directly in the built-up area of the city. We aim to quantify the concentration of particulate matter at selected locations (Figure 1). A thorough analysis of the monitoring stations showed that there were no places in the vicinity that could affect the measurements and distort the results of the particulate matter concentration research. Our results highlight that air pollution is mainly due to traffic activity.
Figure 1 shows the distribution of the measurement points. We selected the points based on the high intensity of pedestrian movement in the area. Additionally, a high intensity of vehicle movement was also a key consideration when choosing a location. In our paper, we examine whether an increase in the number of vehicles in a given location can negatively affect air quality. We chose the following locations for conducting our research: a bus station, a location near elementary schools, and a railroad crossing.
We chose places where there is an increased intensity of vehicles and pedestrian movement. In the research on the number of vehicles, a record of the passage of vehicles was made. Each vehicle was assigned to a category. Three categories were monitored: passenger vehicles, trucks (weight over 3.5 tons), buses. Because the measuring points are located in the city center, the passage of non-passenger vehicles is excluded furthermore, as only vehicles with a valid exemption are allowed to enter the area. For that reason, we do not record these vehicles in our results. Moreover, their ratio to the passenger vehicles we recorded at the measurement points is negligible. (For example, for a measurement point near a railway crossing, the number of passenger vehicles/number of trucks/number of buses was 10,296:24:21.) Regarding trains, most are powered exclusively by electric energy; therefore, we do not expect the results to be distorted by the passage of trains.
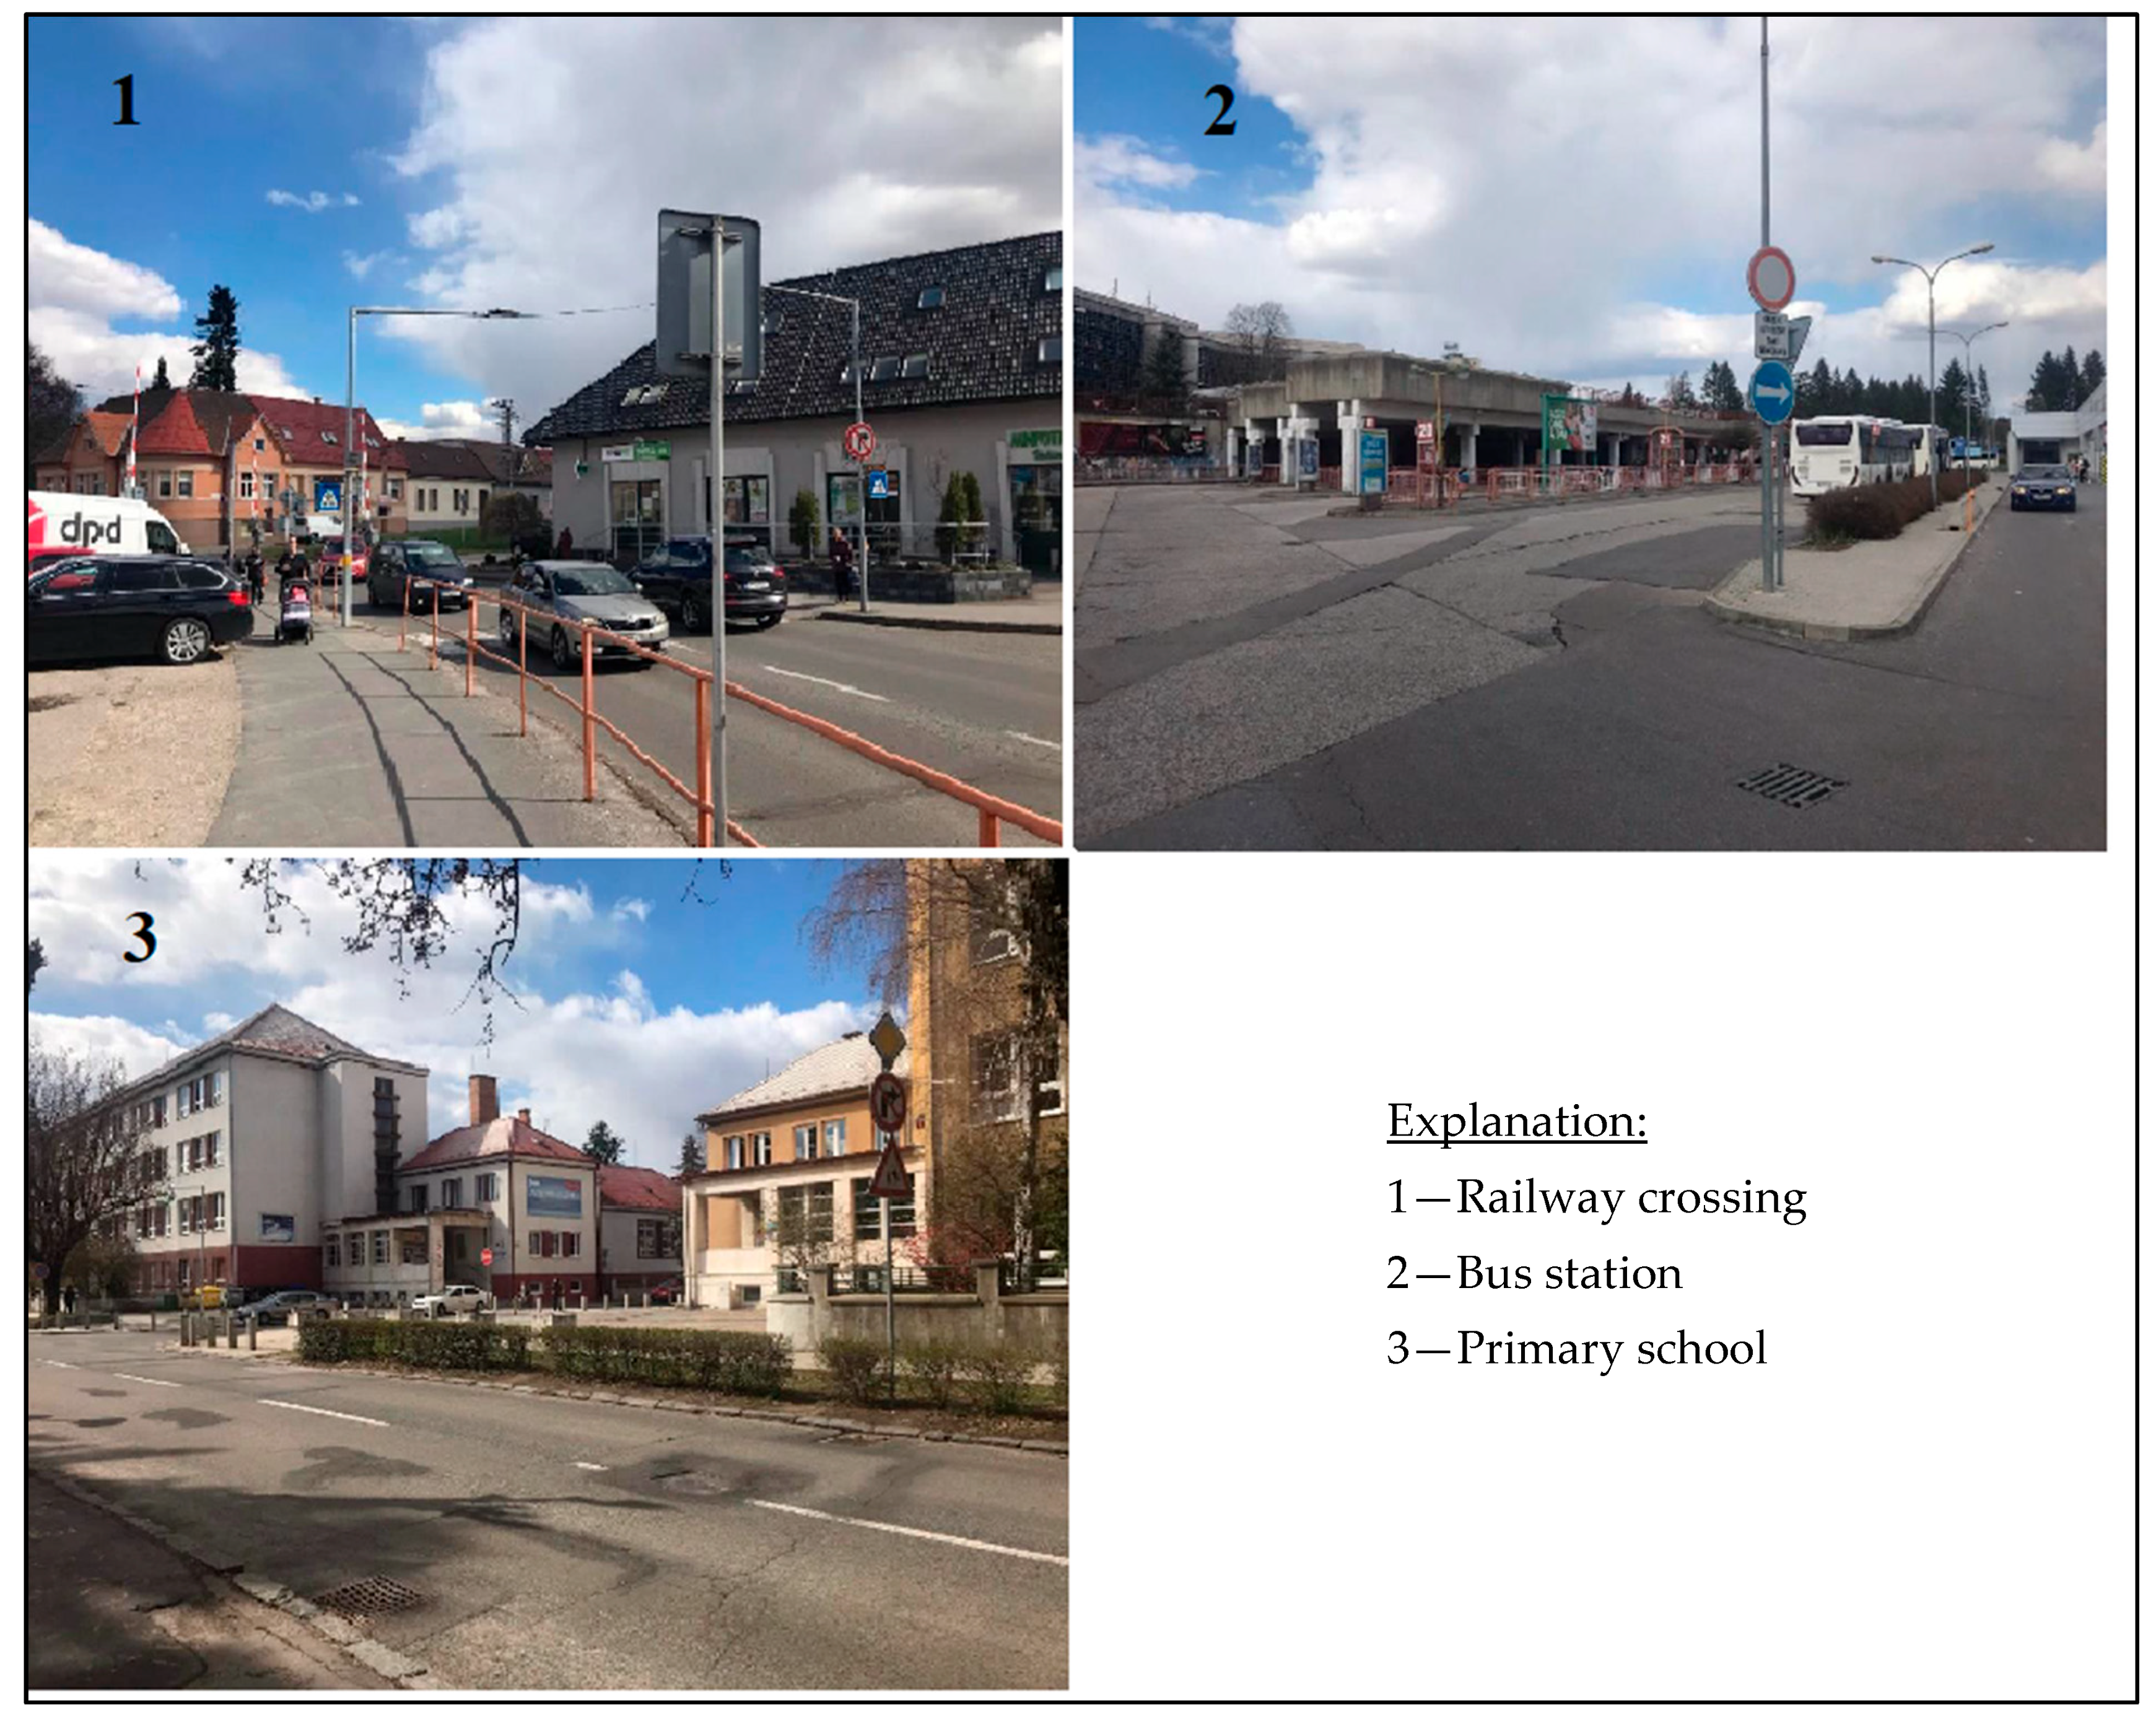
We selected all locations based on their pre-observed characteristics, such as traffic intensity, the number of departures and arrivals of buses at the bus station, the number of trains passing, and the average length of stops at the railway crossing. During our research, we monitored the values of PM2.5 and PM10 particulate matter. We measured and recorded these values using a measuring device at regular intervals. For research purposes, we repeated particulate matter measurements every 15 min for the duration of the survey. This means that we conducted four particulate matter measurements within 1 h of the survey. At the same intervals, we also monitored the number of vehicles that passed through the road near the measurement point. Figure 2 shows the individual measuring points. We took the measurements immediately one after the other during working days. We carried out the first measurement on Tuesday and the last on Thursday. We excluded the beginning and end of the week due to distorted measurement results.
Figure 2 shows the individual measuring points. Each measuring point is located near a road or a place with increased vehicle traffic. Figure 2(2) shows particulate matter levels measured at the bus station. For that reason, we monitored the intensity of bus traffic, as well as the movement of buses, that arrived and left the station. Figure 2(1) shows the particulate matter measurement at a railway crossing. Large numbers of vehicles accumulated at this measuring point when waiting for the train to pass at the crossing. The average waiting time for the train departure and subsequent opening of the mechanical crossing safety device was 3.5 min. Figure 2(3) shows the vicinity of two elementary schools, which are located in the built-up city center. At this type of measuring site, we predicted increased PM concentration in the morning hours, similar to that at the bus station. We set the measurement duration at the elementary schools from 7:00 to 10:00 a.m. according to the start of classes at 8:00 a.m. For this reason, we predicted increased pedestrian and vehicle mobility in the specified interval. At the measuring point near the bus station, we set the measuring time from 6:00 a.m. to 10:00 a.m. As with elementary schools, we predicted an increase in the mobility of pedestrians and buses at a specified interval.
We carried out traffic intensity monitoring with the help of a team of collaborators who manually recorded the vehicles that passed through the measuring location on tally sheets. After the measurement, we evaluated the individual counting sheets and compared the data with the measured particulate matter values.
Measuring Device
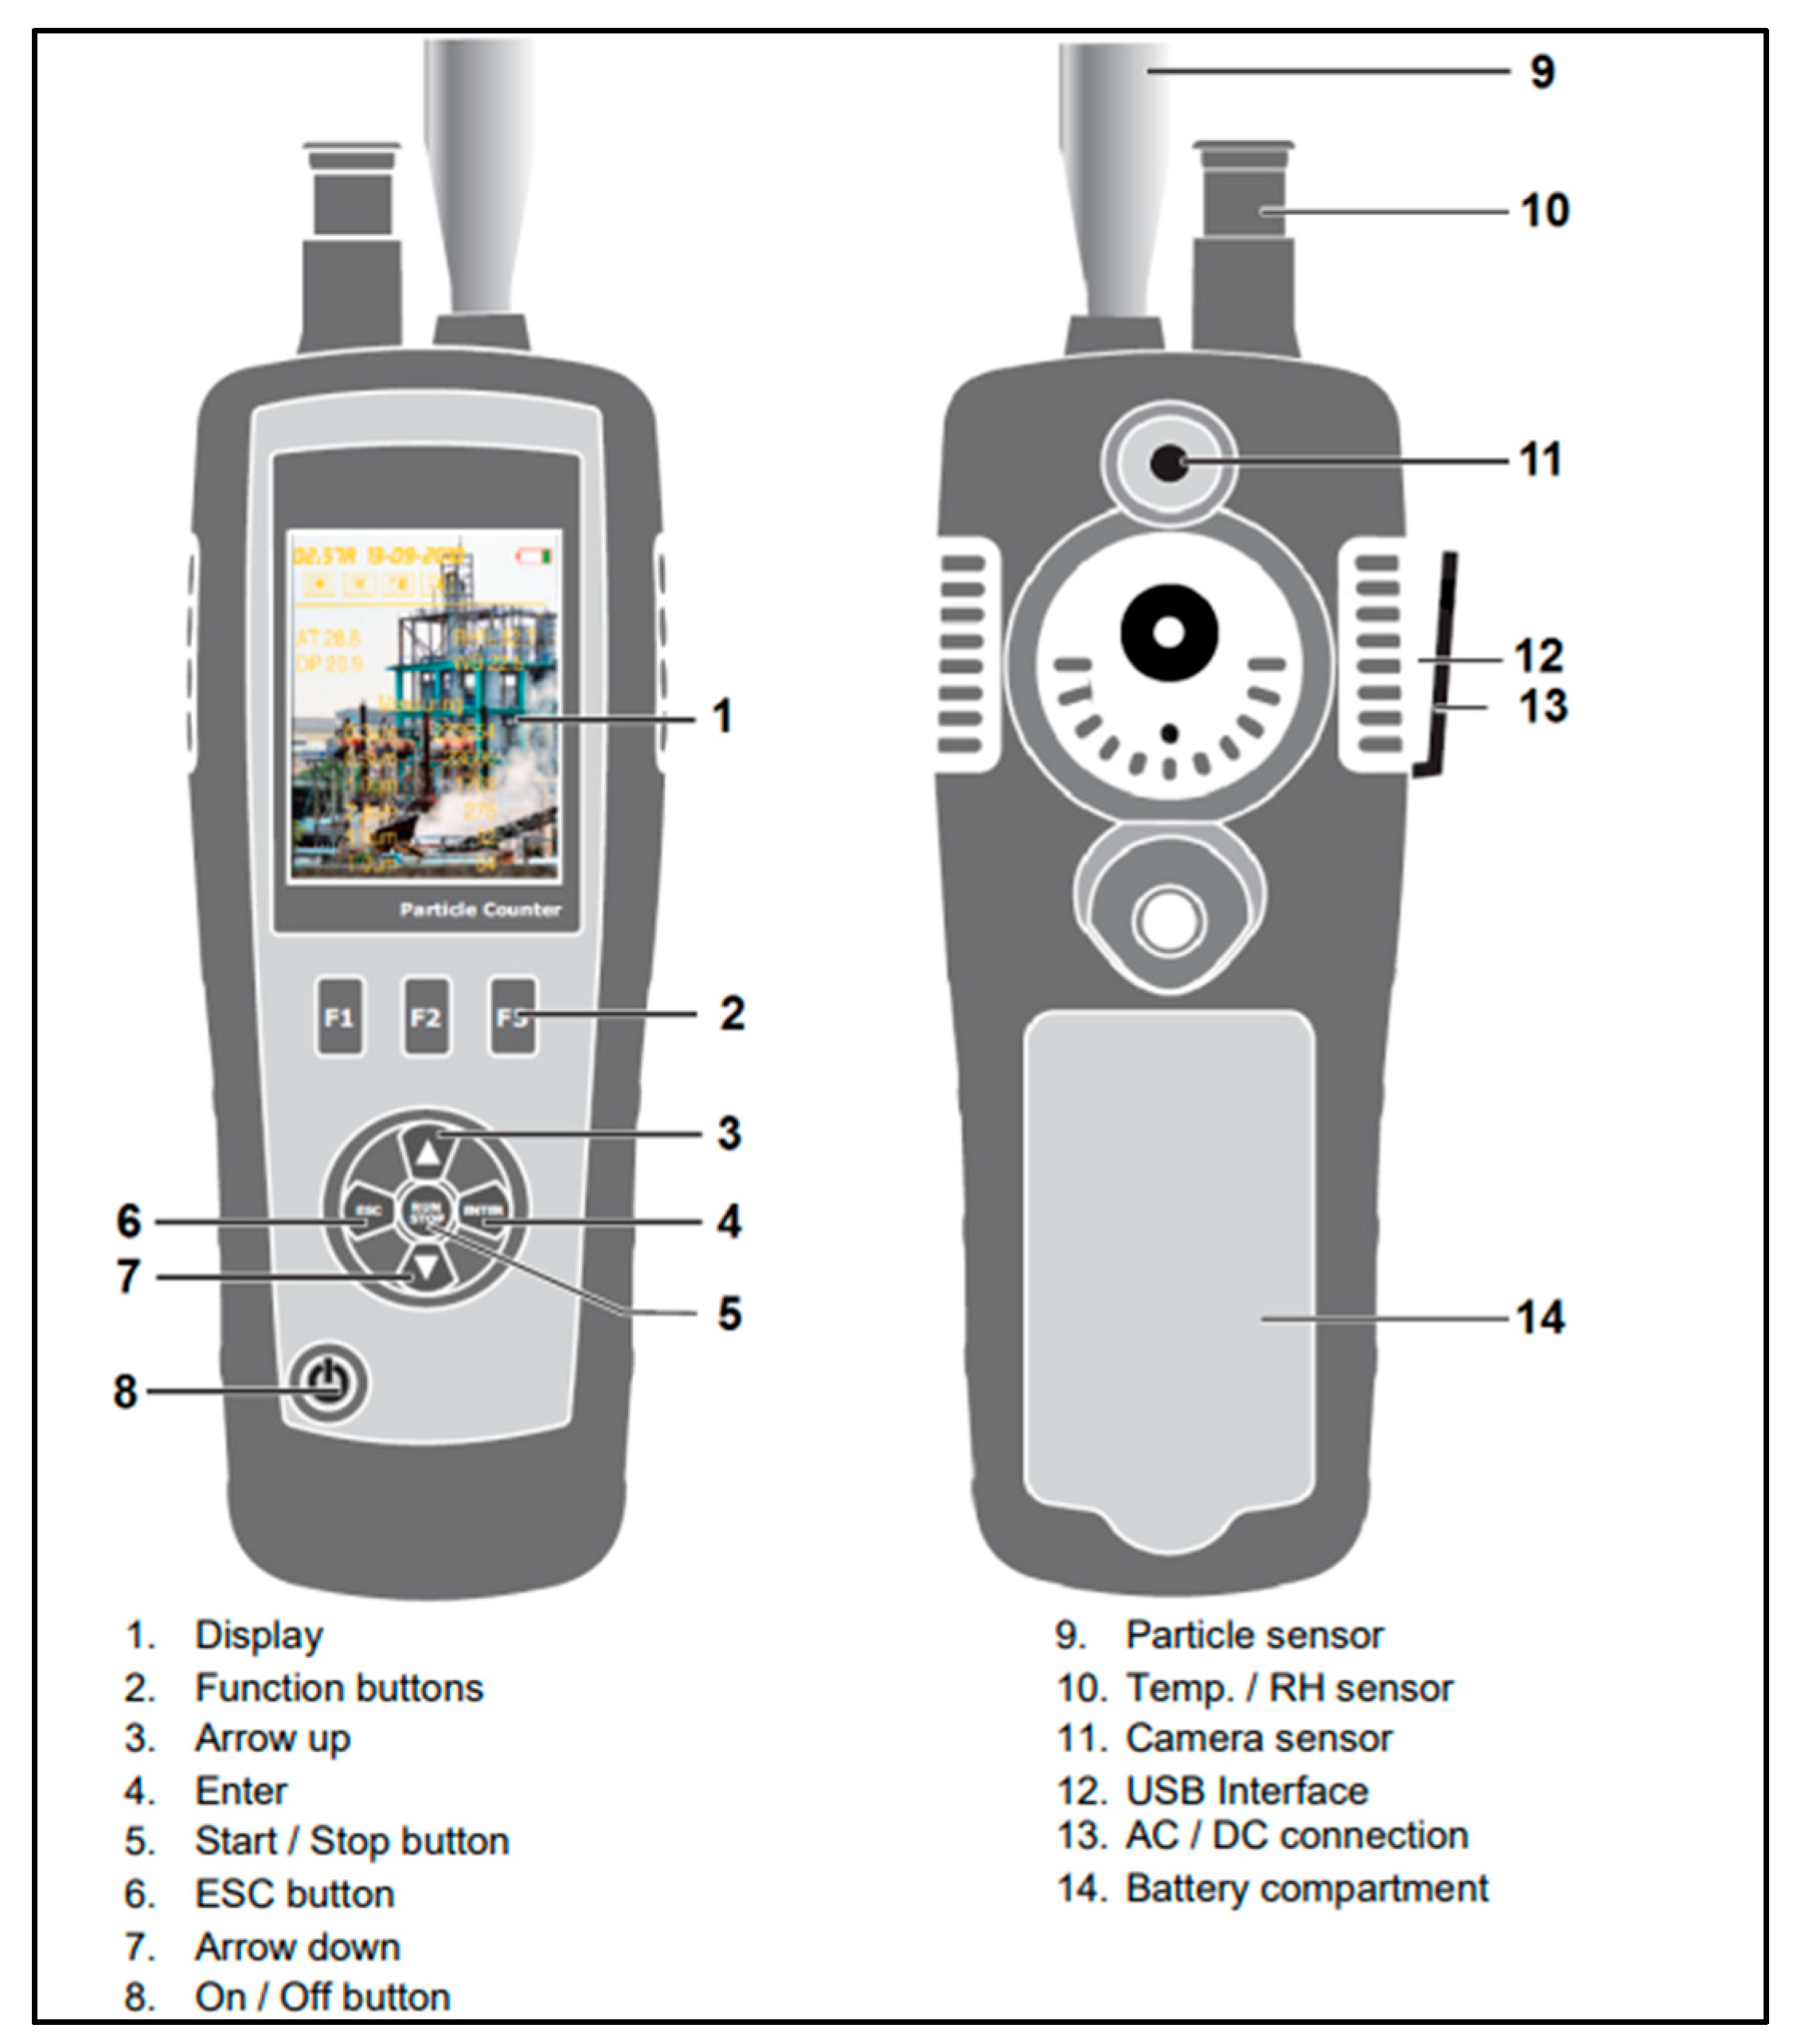
We used a portable, handheld PCE-PCO 2 measuring device to record the concentration of particulate matter in the air. The device is primarily designed for monitoring environments that are exposed to exhaust gas, smoke, and other harmful substances. We held the device in a fixed location during the measurement. The distance of the device from the ground was 160 cm. This is the height at which a pedestrian’s head normally moves when walking. However, because our research focusses on negative impacts to human health, the data acquisition level was set to the average height of the human olfactory organs. The device (Figure 3) sucks air through the upper part [43].
We manually switched on the measuring device every 15 min. Before we began actual measurements, the device automatically performed a flushing test. Immediately after performing the flushing test, the device automatically started sucking in ambient air. The length of the sample recording lasted 5 s then, the device determined the concentration of PM2.5 and PM10 particulate matter. Table 2 shows the technical parameters of the measuring device.
3. Measurement Results
3.1. Bus Station
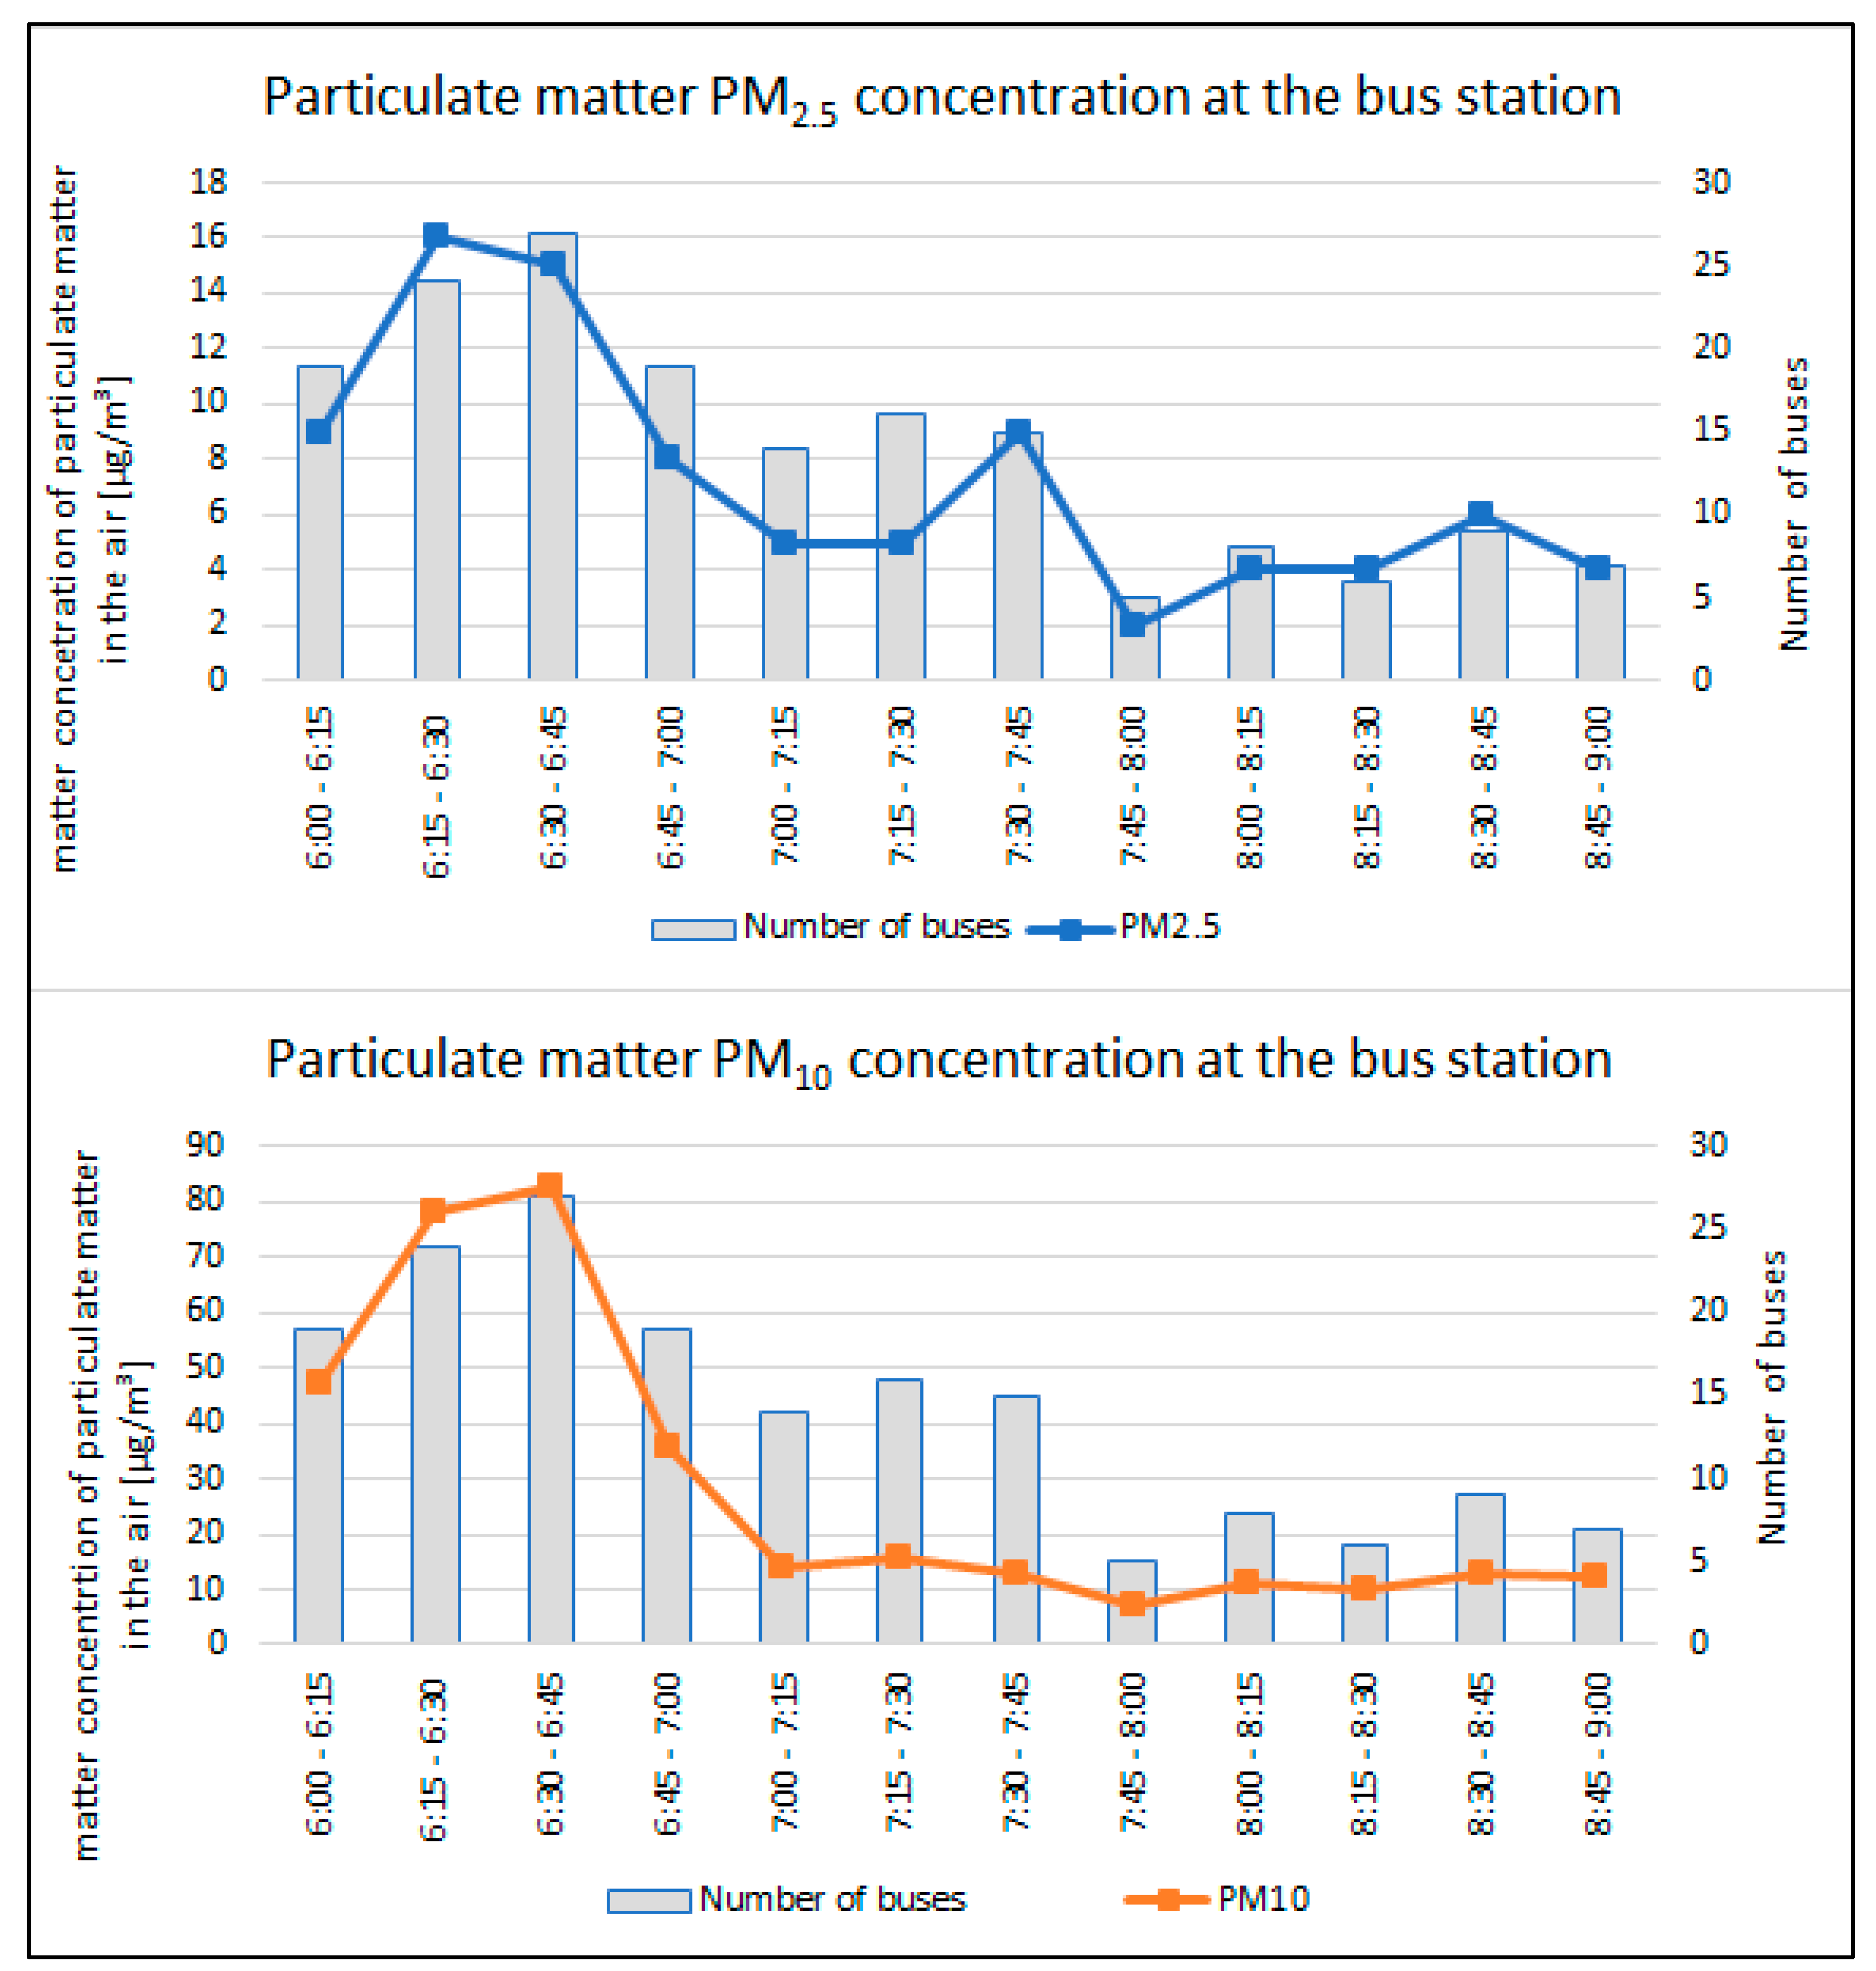
We performed the measurements at the bus station between 6:00 a.m. and 9:00 a.m. At this time, there is the greatest mobility of buses and pedestrians at the station. Buses have their engines off during their stay at the bus station. Due to longer boarding and disembarking of passengers, vehicle drivers turn off their engines. Since all vehicles are powered by diesel combustion engines, this phenomenon is strongly reflected in the concentration of particulate matter emissions. The morning peak at the bus station is at 6–7 a.m. At this time, we observe the largest number of passengers boarding buses, which increases the time it takes for buses to stop at individual platforms.
Figure 4 shows the detected values of PM2.5 and PM10 particulate matter concentrations at the bus station. From the graph, we can see the increased concentration of particulate matter, especially in the morning hours from 6:00 to 7:00. This is due to the high intensity of buses that served the bus station at that time. In the graph’s background, we show the fluctuations in the number of buses at the station. The highest number of vehicles at the station was between 6:30 and 6:45 (27 vehicles). The measured values of particulate matter emissions and the number of buses at the station show correlation. The higher the number of vehicles serving the station, the higher the concentration of particulate matter emissions. The values of PM10 emissions worsened, especially in the morning between 6:30 and 6:45 when their value rose to 83 μg/m3. The average value of PM10 emissions in the first hour of the survey is at the level of 61 μg/m3. According to the Slovak Hydrometeorological Institute, this value corresponds to a deterioration in air quality. PM2.5 emission values were normal during this measurement. From the graph, it is possible to observe the decrease in emissions of particulate matter from 8:00 a.m. This is due to the reduced number of buses at the station at the end of the morning peak.
From such a course of data, when comparing two consecutive series of data, a situation may arise that the increasing number of buses in the monitored time interval will not mean an increase in the concentration of particulate matter. This phenomenon can be caused by several factors. For example, the length of the vehicle standing on the platform, or the emission class of the buses in operation. We then consider the determination index to be relevant, which in other graphs confirms the hypothesis of the impact of the monitored categories of vehicles on the concentration of particulate matter in the air.
Table 3 shows the hourly concentrations of particulate matter at the bus station. During the first hour of measurement, we assessed the air quality as deteriorated based on the concentration of PM10 emissions. The graph in Figure 4, which tracks the increase in the number of vehicles and the production of emissions, supports our conclusions. The increased number of buses serving the bus station at that time is responsible for the increase in emissions concentration.
3.2. Railway Crossing
We chose the location near the railway crossing due to the large accumulation of stationary vehicles during the passage of the train through the railway crossing. Vehicles are forced to stop and wait for the train to leave the station when the no entry signal activates. We carried out measurements at this location for 12 h because of the high all-day traffic intensity levels.
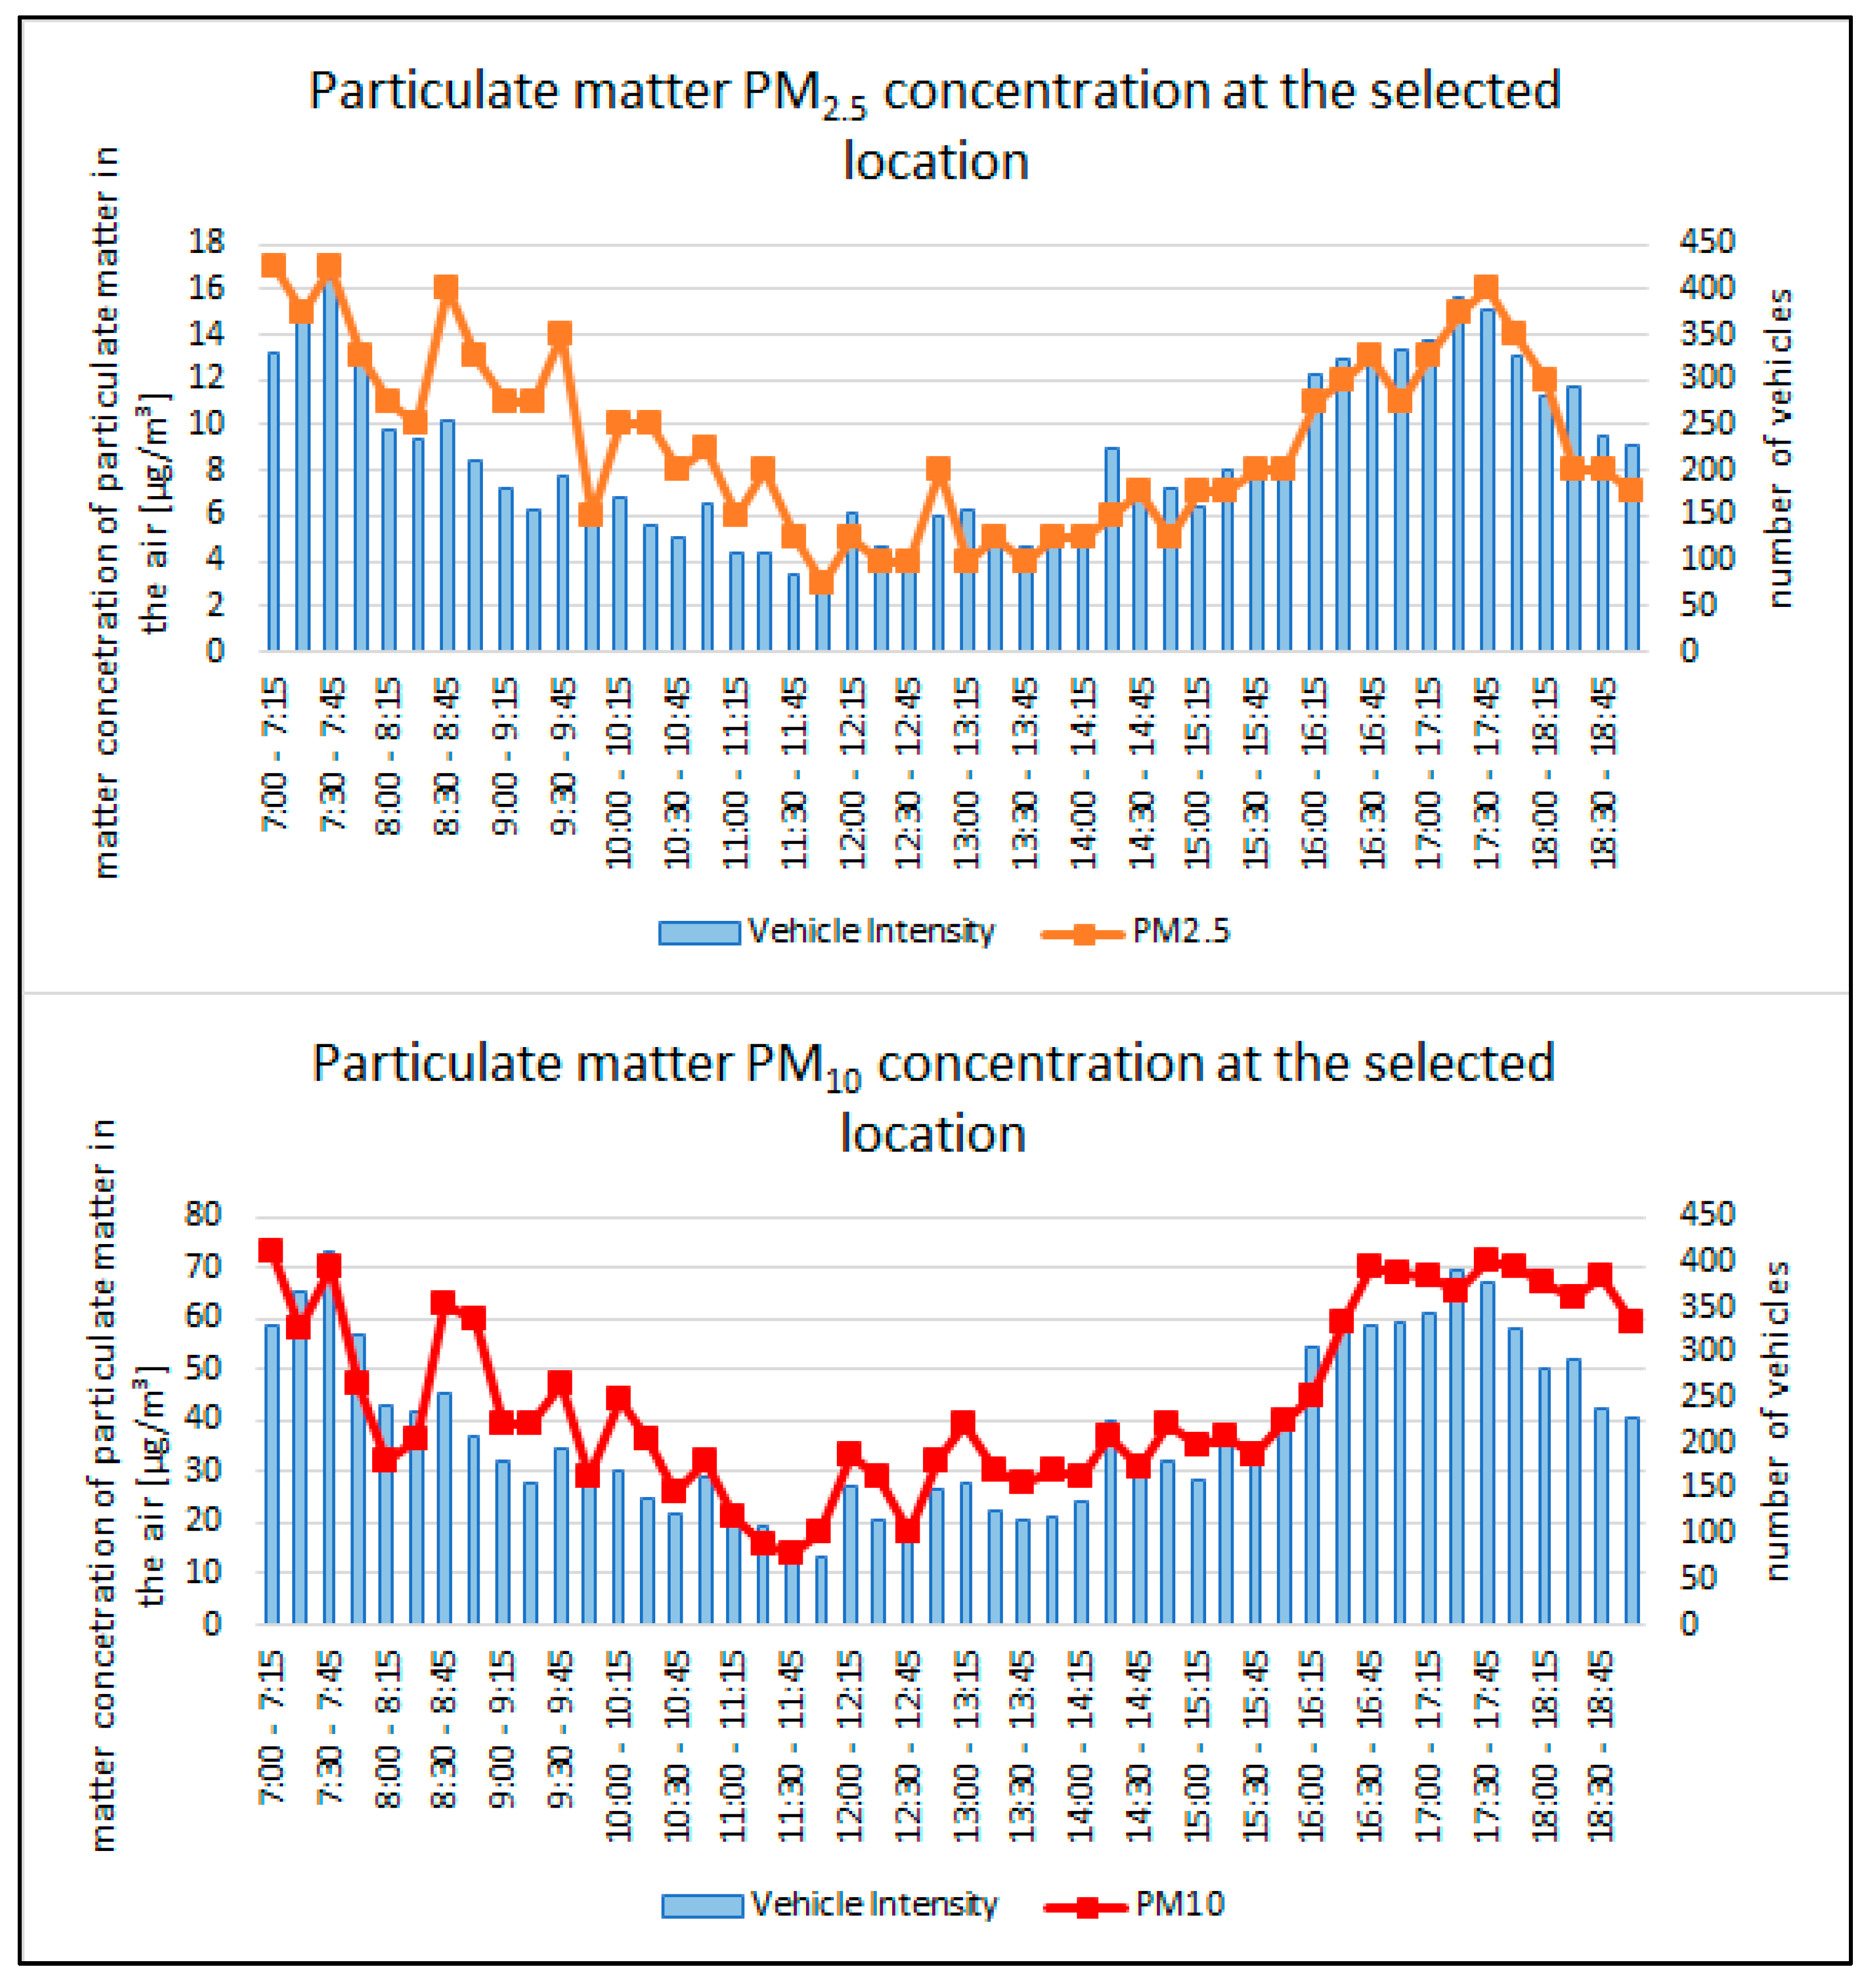
Figure 5 shows similar results for the railway crossing as those in Figure 4. There was a high intensity of vehicles in the monitored section in the morning hours. For this reason, we monitored the increased amounts of PM10 and PM2.5 emissions. The highest number of vehicles passed through the location in the morning hours between 7:30 and 7:45 (411 vehicles). This corresponds to the amount of emissions produced, which also reached the highest levels at that time. The graph shows the high dependence between the produced emissions and the number of vehicles that passed the measuring section. As the number of vehicles decreases at the end of the morning rush hour, emission values also decrease. During the afternoon rush hour, which starts at 3:15 p.m., we observe a further increase in emissions, though this increase is not as intense as that during the morning peak.
Table 4 shows the hourly concentrations of particulate matter at the measuring point. Table 4 and the graph (Figure 5) show the increase in emissions, especially in the morning and afternoon hours. This increase is mainly attributed to the increased passage of vehicles through the measuring point. In the morning peak, the particulate matter emissions values were at 62 μg/m3 however, this does not mean that the overall air quality can be assessed as deteriorated from the PM10 emissions concentration point of view. On the other hand, after 10 a.m., the intensity of vehicle traffic decreases, and the emission values also decrease. This difference represents up to a 28% drop in PM10 particulate matter emissions in the air.
3.3. Measuring Points at Primary Schools
For primary schools, we expect an increased intensity of vehicle traffic in the morning hours, which is caused by the transportation of pupils to schools. We set the duration of the survey from 7:00 a.m. to 10:00 a.m. During our measurement, we also monitored the number of vehicle stops near the schools.
Figure 6 shows similar trends to the other measurements. Particulate matter emissions concentration increases directly corresponding with the number of vehicles that pass the measuring point. When the monitoring vehicle stopped at schools, only 16% of the total number of 335 vehicles that passed stopped. This means that the air pollution in this section is not caused by the transportation of children to schools; instead, air pollution is attributed to general traffic activity. When monitoring the air quality, we found that the air quality in the monitored section reached a good level despite the high number of vehicles in the morning rush hour.
Table 5 shows a worsening of the hourly air quality in the vicinity of elementary schools. However, this pollution is high enough to represent deteriorated air quality. Based on our results, we assumed that the air quality deterioration was because of the increased passage of vehicles through the measuring point.
4. Assessment of Dependence between Monitored Data
For research purposes, we measured the dependence between the size of particulate matter (PM10 and PM2.5) and the number of vehicles that passed each measurement point. We found that the amount of particulate matter air pollution depends on the number of vehicles that pass the measuring point. We evaluated the dependence between monitored data within the framework of correlation, which is a measure of dependence between two or more variables.
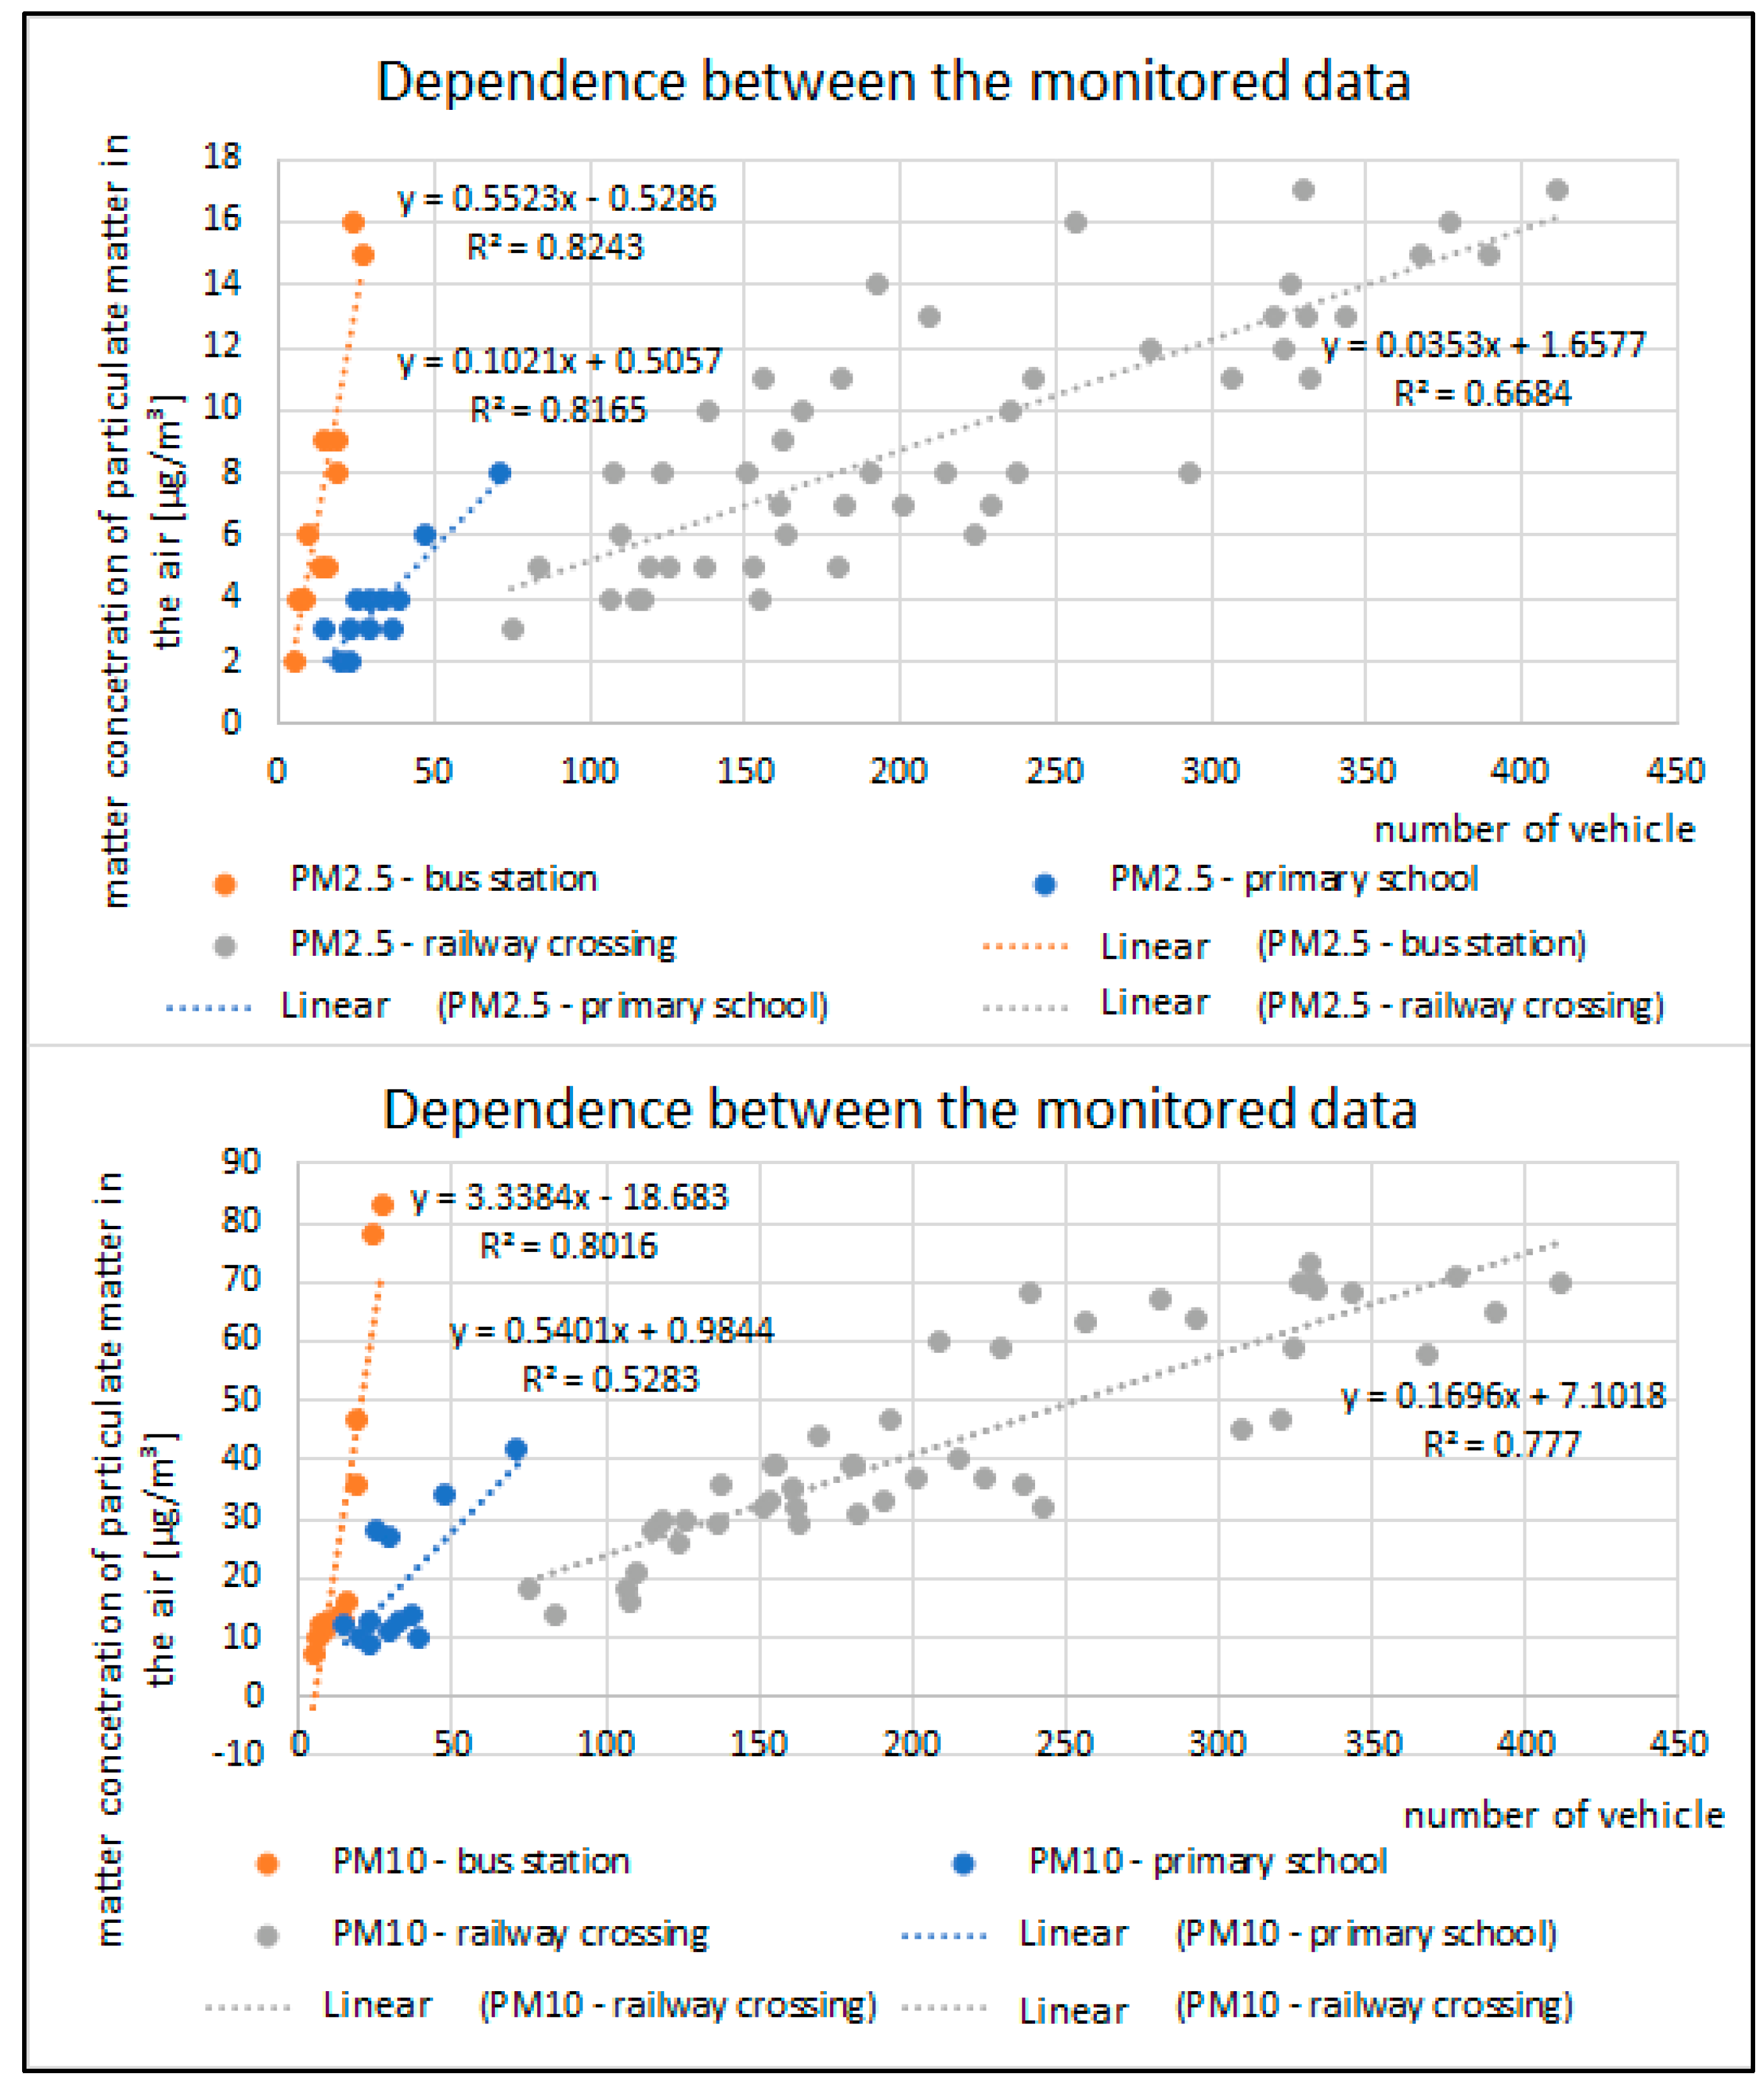
Figure 7 shows a linear relationship between particulate matter emissions concentration and the number of vehicles that passed the measuring point. We monitored the highest PM10 emissions values at the bus station measuring point; the values are comparable to those at the railway crossing measuring point, despite the number of vehicles at the railway crossing being several times higher. This may be because the emissions at the bus station were mainly created by buses, in contrast to the measuring point at the railway crossing where the emissions were mainly produced by passenger vehicles. The exact values of the correlation coefficients can be found in Table 6.
Based on the results of our correlation analysis, we observed a high dependence between the number of vehicles passing a measuring point and the particulate matter emissions concentration values. The highest degree of dependence for PM10 particulate matter is at the bus station. The correlation coefficient is 0.895, which means that the observed data have great dependence, and we observed a high dependency in all assessments. Table 7 shows there is a high degree of dependence for the monitored data, with a correlation coefficient value of 0.7.
Table 7 shows a high dependence between the number of vehicles passing each measuring point and the amount of particulate matter emissions concentration. Based on these results, we attribute particulate matter air pollution with traffic activity in the monitored areas.
5. Discussion
Our results show that the concentration of particulate matter does not only depend on the number of vehicles but also on their category and vehicle emission class. These facts were also confirmed by studies aimed at identifying the biggest polluters by category and vehicle emission class [45,46]. In addition to vehicle emission class, the type of fuel is also important, e.g., diesel engines recorded a lower amount of PM compared to LNG and CNG [47]. Researchers have also studied the environmental impacts of trucks using LNG [48]. The stationary measuring location within the city’s urban area is also an important factor. Researchers conducting studies on PM2.5 pollution within the city of Philadelphia recorded lower values in locations surrounded by greenery. In addition, they found that proximity to major roads (60 m) was associated with higher pollution levels [49]. The graphs displaying the results of our research show the immediate impact of traffic during the day on PM values; however, the results of other studies also show that temporal variations of air pollutants are related to traffic during the morning/evening peaks in the winter/summer seasons. Increased concentration levels of PM10, PM2.5, and PM1 were observed more often during the morning and in winter seasons than at other times in all locations of the city of Dhanbad in India [50].
To a large extent, it is also necessary to pay attention to the correct location of the sensor that records the quality of the surrounding air. In the research, the sensor is placed according to land use and also according to the possibility and logical behavior of the traffic stream. A similar procedure was described in a study by Kanaroglou et al. [51]. Another study [52] presents a new approach based on information theory to the deployment of air pollution sensors. This entropy-based approach has been compared with methods based on hotspots and random metrics. A final approach to sensor placement is their ability to produce accurate pollution maps [53].
The results found during the research show that the highest concentration (PM10) was measured at the railway crossing (68.5 μg/m3), while PM2.5 values (15.25 μg/m3) reached their lowest values when there were lower numbers of vehicles at other time intervals.
These figures represent an hourly average value. The concentration was at a relatively low level in the areas near the elementary school and the bus station. This could be caused, on the one hand, by low traffic intensity, but also by the location of the measured places, which were located on the outskirts of the city [54,55,56]. This can also point to sources of emissions other than transportation. In terms of dispersion and concentration, mobility in individual parts of cities is also important [57,58]. However, meteorology itself also has a high influence on PM concentration. Researchers have found that they reach their maximum values in the morning peaks, decrease during the day due to atmospheric dilution processes (increases in wind speed and the height of the boundary layer), and then rise again in the evening [59]. Values measured during the winter period with the lowest mean solar radiation are characterized by a sharp increase in pollutant levels during peak hours, especially in the evening when wind speeds are at their lowest levels [60]. In the case of relative humidity, a strong positive correlation with fine particles was observed during the peak hours of winter morning (r = 0.75; PM2.5) and evening (r = 0.67; PM2.5). However, very small positive correlations were also observed during the summer morning and evening peaks [61]. The results of wind direction and speed studies show a better understanding of the dispersion of air pollutants in a specific urban built environment under different wind conditions, which can support urban management, planning and design, leading to the effective mitigation of traffic induced air pollution in urban areas [62,63,64].
Correlation was used to determine dependence where increased PM values due to traffic can be seen. We observed the lowest dependence for PM10 around the elementary school and the highest value of PM2.5 at the bus station. Researchers conducting studies in the central and western regions of North China also used correlation coefficients for analysis, and their results pointed to increased concentrations of PM 2.5 [65]. Additionally, Schwarz et al. observed local impacts resolved by correlations of PM2.5 with size-resolved particle counts [66].
Despite the same traffic volume, there were also differences between PM10 and PM2.5 values, and they did not always increase or decrease in tandem. This result indicates that vehicle category considerably affects air quality levels, in addition to whether they move smoothly or stand still in congested traffic. The COVID-19 pandemic also had a considerable impact on the overall reduction of air pollution, and several studies have evaluated the state of pollution during the lockdown [67,68,69].
The values we obtained in our correlation analysis can be used to approximate the concentration of PM in different locations of the city. Therefore, it is necessary to take into account the impact of emissions from transport when planning, designing, and building a residential community.
A measurement based on a study of emissions of particulate matter at a bus station [70] proves the increase in emissions precisely with the increase in the number of bus passes—and confirms conclusions drawn from measurements. Particulate matter pollution at bus stations is primarily attributable to fuel combustion in vehicles, wear and tear of vehicle components (e.g., tires and brakes), suspended road dust, cigarette smoking, and industrial emissions. In addition, meteorological factors including wind speed, vehicle flow, temperature, relative humidity, pressure, rain volume, and cloud cover, as well as the structure and direction of bus stops, also affect the distribution of PM inside or outside bus stops [71].
6. Conclusions
When monitoring PM concentration at the bus station, only the number of buses was recorded, and there were no other vehicles nearby. At the railway station, we recorded all vehicles that passed through the measuring area. In 12 h, 10,290 passenger vehicles and 21 buses passed through. However, we detected greater concentrations of PM at the bus station than at the railway crossing, despite the fact that the number of vehicles at the railway crossing was much higher. We hypothesize that the concentration of particulate matter emissions is higher in connection with bus transport in this specific city. In future research, we must focus on the vehicle fleet of specific carriers and analyze the emission standards of buses used in the given location.
We continuously monitored the number of vehicles that passed the measuring areas, and recorded the highest number of vehicles near the railway crossing. During the monitored period, 10,296 passenger vehicles, 24 trucks, and 21 buses passed through the measuring area. The number of other means of transport is negligible due to the considerable preponderance of the number of passenger vehicles. At elementary schools, we only monitored the number of vehicles in the morning hours when the intensity of driving and the concentration of PM are the highest. We recorded 391 passenger vehicles in this area. Only buses travelled through the bus station, and during the observed period, we recorded 169.
We used a correlation between the monitored values to monitor the dependence between the number of vehicles and the detected levels of pollution. From our results, we observed a strong dependence between the intensity of traffic and the level of air pollution, and the values of the correlation coefficient were >0.7 at each point. We observed deteriorated air quality during our measurements, especially at the railway crossing, where the concentration values of PM10 emissions ranged from 47 to 67 μg/m3. This pollution was detected in peak intervals. At this time, an increased number of vehicles moves on the measuring section. We assessed the air quality levels based on assessments provided the Slovak Hydrometeorological Institute.
However, we did not consider other meteorological influences, such as wind speed or direction, during our measurements. In future projects, we want to assign data on air temperature and humidity, and wind speed, to the factors influencing the degree of correlation between traffic and air quality. In further research, it would be possible to expand the methodology of the work by processing data indicating air quality. It is possible to assume that the results of such measurements would be similar. The results of research confirmed that road transport considerably contributes to air quality, especially near roads.
Author Contributions
Conceptualization, M.L. and V.H.; methodology, B.Š. and M.L.; formal analysis, J.G. and V.H.; investigation, B.Š. and J.G.; resources, M.L. and V.H.; data curation J.G., B.Š. and M.L.; writing—original draft preparation, J.G. and V.H.; writing—review and editing, B.Š., V.H. and M.L.; visualization M.L. and V.H.; supervision, J.G. and B.Š.; project administration, J.G. All authors have read and agreed to the published version of the manuscript.
Funding
This research was funded by the project of institutional research of the Faculty of Operation and Economics of Transport and Communications, University of Žilina, no. 2/KCMD/2021, “Research on the impact of urban logistics on the environment”.
Institutional Review Board Statement
Not applicable.
Informed Consent Statement
Not applicable.
Data Availability Statement
Data available in a publicly accessible repository. The data presented in this study are openly available in FigShare.
Conflicts of Interest
The authors declare no conflict of interest.
References
- Fenger, J. Air pollution in the last 50 years—From local to global. Atmos. Environ. 2009, 43, 13–22. [Google Scholar] [CrossRef]
- Kendrick, C.M.; Koonce, P.; George, L.A. Diurnal and seasonal variations of NO, NO2 and PM2.5 mass as a function of traffic volumes alongside an urban arterial. Atmos. Environ. 2015, 122, 133–141. [Google Scholar] [CrossRef] [Green Version]
- Anjum, M.S.; Ali, S.M.; Subhani, M.A.; Anwar, M.N.; Nizami, A.S.; Ashraf, U.; Khokhar, M.F. An emerged challenge of air pollution and ever-increasing particulate matter in Pakistan; a critical review. J. Hazard. Mater. 2021, 402, 123943. [Google Scholar] [CrossRef]
- Graham, A.M.; Pringle, K.J.; Arnold, S.R.; Pope, R.J.; Vieno, M.; Butt, E.W.; Conibear, L.; Stirling, E.L.; McQuaid, J.B. Impact of weather types on UK ambient particulate matter concentrations. Atmos. Environ. X 2020, 5, 100061. [Google Scholar] [CrossRef]
- Zeng, Y.; Bi, C.; Jia, J.; Deng, L.; Chen, Z. Impact of intensive land use on heavy metal concentrations and ecological risks in an urbanized river network of Shanghai. Ecol. Indic. 2020, 116, 106501. [Google Scholar] [CrossRef]
- Dietrich, M.; Wolfe, A.; Burke, M.; Krekeler, M.P. The first pollution investigation of road sediment in Gary, Indiana: Anthropogenic metals and possible health implications for a socioeconomically disadvantaged area. Environ. Int. 2019, 128, 175–192. [Google Scholar] [CrossRef]
- Karagulian, F.; Belis, C.A.; Dora, C.F.C.; Prüss-Ustün, A.M.; Bonjour, S.; Adair-Rohani, H.; Amann, M. Contributions to cities’ ambient particulate matter (PM): A systematic review of local source contributions at global level. Atmos. Environ. 2015, 120, 475–483. [Google Scholar] [CrossRef]
- Keuken, M.P.; Henzing, J.S.; Zandveld, P.; Van den Elshout, S.; Karl, M. Dispersion of particle numbers and elemental carbon from road traffic, a harbour and an airstrip in the Netherlands. Atmos. Environ. 2012, 54, 320–327. [Google Scholar] [CrossRef]
- How Does Particulate Air Pollution Impact Health? Available online: https://aqli.epic.uchicago.edu/pollution-facts/ (accessed on 5 July 2022).
- Greenstone, M.; Fan, Q. Indonesia’s worsening air quality and its impact on life expectancy. Air Qual. Life Index 2019, 1–10. Available online: https://aqli.epic.uchicago.edu/wp-content/uploads/2019/03/Indonesia-Report.pdf (accessed on 28 January 2023).
- Schneider, I.L.; Teixeira, E.C.; Dotto, G.L.; Pinto, D.; Yang, C.X.; Silva, L.F. Geochemical study of submicron particulate matter (PM1) in a metropolitan area. Geosci. Front. 2022, 13, 101130. [Google Scholar] [CrossRef]
- Turner, M.C.; Andersen, Z.J.; Baccarelli, A.; Diver, W.R.; Gapstur, S.M.; Pope III, C.A.; Prada, D.; Samet, J.; Thurston, G.; Cohen, A.; et al. Outdoor air pollution and cancer: An overview of the current evidence and public health recommendations. CA A Cancer J. Clin. 2020, 70, 460–479. [Google Scholar] [CrossRef]
- Ali, M.U.; Liu, G.; Yousaf, B.; Ullah, H.; Abbas, Q.; Munir, M.A.M. A systematic review on global pollution status of particulate matter-associated potential toxic elements and health perspectives in urban environment. Environ. Geochem. Health 2019, 41, 1131–1162. [Google Scholar] [CrossRef] [PubMed]
- Prospero, J.M.; Lamb, P.J. African droughts and dust transport to the Caribbean: Climate change implications. Science 2003, 302, 1024–1027. [Google Scholar] [CrossRef] [PubMed]
- Chalvatzaki, E.; Chatoutsidou, S.E.; Lehtomäki, H.; Almeida, S.M.; Eleftheriadis, K.; Hänninen, O.; Lazaridis, M. Characterization of human health risks from particulate air pollution in selected European cities. Atmosphere 2019, 10, 96. [Google Scholar] [CrossRef] [Green Version]
- Héroux, M.-E.; Anderson, H.R.; Atkinson, R.; Brunekreef, B.; Cohen, A.; Forastiere, F.; Hurley, F.; Katsouyanni, K.; Krewski, D.; Krzyzanowski, M.; et al. Quantifying the health impacts of ambient air pollutants: Recommendations of a WHO/Europe project. Int. J. Public Health 2015, 60, 619–627. [Google Scholar] [CrossRef] [PubMed] [Green Version]
- Bell, M.L.; Ebisu, K.; Leaderer, B.P.; Gent, J.F.; Lee, H.J.; Koutrakis, P.; Wang, Y.; Dominici, F.; Peng, R.D. Associations of PM2.5 constituents and sources with hospital admissions: Analysis of four counties in Connecticut and Massachusetts (USA) for persons ≥65 years of age. Environ. Health Perspect. 2014, 122, 138–144. [Google Scholar] [CrossRef] [PubMed] [Green Version]
- Mar, T.F.; Larson, T.V.; Stier, R.A.; Claiborn, C.; Koenig, J.Q. An analysis of the association between respiratory symptoms in subjects with asthma and daily air pollution in Spokane, Washington. Inhal. Toxicol. 2004, 16, 809–815. [Google Scholar] [CrossRef]
- Pokrývková, J.; Jurík, Ľ. Development of emission to air in central Europe. J. Ecol. Eng. 2019, 20, 51–57. [Google Scholar] [CrossRef]
- Kim, K.H.; Kabir, E.; Kabir, S. A review on the human health impact of airborne particulate matter. Environ. Int. 2015, 74, 136–143. [Google Scholar] [CrossRef]
- Skrúcaný, T.; Kendra, M.; Stopka, O.; Milojević, S.; Figlus, T.; Csiszár, C. Impact of the electric mobility implementation on the greenhouse gases production in central European countries. Sustainability 2019, 11, 4948. [Google Scholar] [CrossRef] [Green Version]
- Slovak Hydrometeorological Institute. Available online: https://www.shmu.sk/File/oko/vystrahy/nove/1579130025_zakladne_vseobecne_informacie_smogu_pm10_.pdf (accessed on 16 January 2023).
- Sun, J.; Huang, L.; Liao, H.; Li, J.; Hu, J. Impacts of regional transport on particulate matter pollution in China: A review of methods and results. Curr. Pollut. Rep. 2017, 3, 182–191. [Google Scholar] [CrossRef]
- Tomar, G.; Nagpure, A.S.; Kumar, V.; Jain, Y. High resolution vehicular exhaust and non-exhaust emission analysis of urban-rural district of India. Sci. Total Environ. 2022, 805, 150255. [Google Scholar] [CrossRef] [PubMed]
- Chianese, E.; Tirimberio, G.; Dinoi, A.; Cesari, D.; Contini, D.; Bonasoni, P.; Marinoni, A.; Andreoli, V.; Mannarino, V.; Moretti, S.; et al. Particulate Matter Ionic and Elemental Composition during the Winter Season: A Comparative Study among Rural, Urban and Remote Sites in Southern Italy. Atmosphere 2022, 13, 356. [Google Scholar] [CrossRef]
- Khan, R.K.; Strand, M.A. Road dust and its effect on human health: A literature review. Epidemiol. Health 2018, 40, e2018013. [Google Scholar] [CrossRef] [PubMed]
- Schibuola, L.; Tambani, C. Indoor environmental quality classification of school environments by monitoring PM and CO2 concentration levels. Atmos. Pollut. Res. 2020, 11, 332–342. [Google Scholar] [CrossRef]
- Ly, H.-B.; Le, L.M.; Van Phi, L.; Phan, V.-H.; Tran, V.Q.; Pham, B.T.; Le, T.-T.; Derrible, S. Development of an AI model to measure traffic air pollution from multisensor and weather data. Sensors 2019, 19, 4941. [Google Scholar] [CrossRef] [Green Version]
- Wang, H.; Tan, Y.; Zhang, L.; Shen, L.; Zhao, T.; Dai, Q.; Guan, T.; Ke, Y.; Li, X. Characteristics of air quality in different climatic zones of China during the COVID-19 lockdown. Atmos. Pollut. Res. 2021, 12, 101247. [Google Scholar] [CrossRef]
- Sicard, P.; Agathokleous, E.; De Marco, A.; Paoletti, E.; Calatayud, V. Urban population exposure to air pollution in Europe over the last decades. Environ. Sci. Eur. 2021, 33, 28. [Google Scholar] [CrossRef]
- Tan, Y.; Wang, H.; Zhu, B.; Zhao, T.; Shi, S.; Liu, A.; Liu, D.; Pan, C.; Cao, L. The interaction between black carbon and planetary boundary layer in the Yangtze River Delta from 2015 to 2020: Why O3 didn’t decline so significantly as PM2.5. Environ. Res. 2022, 214, 114095. [Google Scholar] [CrossRef]
- Hutchison, K.D.; Smith, S.; Faruqui, S. The use of MODIS data and aerosol products for air quality prediction. Atmos. Environ. 2004, 38, 5057–5070. [Google Scholar] [CrossRef]
- Xu, S.; Zou, B.; Lin, Y.; Zhao, X.; Li, S.; Hu, C. Strategies of method selection for fine-scale PM 2.5 mapping in an intra-urban area using crowdsourced monitoring. Atmos. Meas. Tech. 2019, 12, 2933–2948. [Google Scholar] [CrossRef] [Green Version]
- Grivas, G.; Chaloulakou, A.; Samara, C.; Spyrellis, N. Spatial and temporal variation of PM10 mass concentrations within the greater area of Athens, Greece. Water Air Soil Pollut. 2004, 158, 357–371. [Google Scholar] [CrossRef]
- Madrazo, J.; Clappier, A.; Cuesta, O.; Belalcazar, L.; González, Y.; Bolufé, J.; Sosa, C.; Carrillo, E.; Manso, R.; Canciano, J.; et al. Evidence of traffic-generated air pollution in Havana. Atmosphere 2019, 32, 15–24. [Google Scholar] [CrossRef]
- Chang, P.K.; Griffith, S.M.; Chuang, H.C.; Chuang, K.J.; Wang, Y.H.; Chang, K.E.; Hsiao, T.C. Particulate matter in a motorcycle-dominated urban area: Source apportionment and cancer risk of lung deposited surface area (LDSA) concentrations. J. Hazard. Mater. 2022, 427, 128188. [Google Scholar] [CrossRef] [PubMed]
- Kurz, C.; Orthofer, R.; Sturm, P.; Kaiser, A.; Uhrner, U.; Reifeltshammer, R.; Rexeis, M. Projection of the air quality in Vienna between 2005 and 2020 for NO2 and PM10. Urban Clim. 2014, 10, 703–719. [Google Scholar] [CrossRef]
- Qu, H.; Lu, X.; Liu, L.; Ye, Y. Effects of traffic and urban parks on PM10 and PM2.5 mass concentrations. Energy Sources Part A Recovery Util. Environ. Eff. 2019. [Google Scholar] [CrossRef]
- Duque, L.; Relvas, H.; Silveira, C.; Ferreira, J.; Monteiro, A.; Gama, C.; Rafael, S.; Freitas, S.; Borrego, C.; Miranda, A. Evaluating strategies to reduce urban air pollution. Atmos. Environ. 2016, 127, 196–204. [Google Scholar] [CrossRef]
- Roorda-Knape, M.C.; Janssen, N.A.; De Hartog, J.J.; Van Vliet, P.H.; Harssema, H.; Brunekreef, B. Air pollution from traffic in city districts near major motorways. Atmos. Environ. 1998, 32, 1921–1930. [Google Scholar] [CrossRef]
- Singh, V.; Singh, S.; Biswal, A.; Kesarkar, A.P.; Mor, S.; Ravindra, K. Diurnal and temporal changes in air pollution during COVID-19 strict lockdown over different regions of India. Environ. Pollut. 2020, 266, 115368. [Google Scholar] [CrossRef]
- Khan, Z.; Ualiyeva, D.; Khan, A.; Zaman, N.; Sapkota, S.; Khan, A.; Ali, B.; Ghafoor, D. A Correlation among the COVID-19 Spread, Particulate Matters, and Angiotensin-Converting Enzyme 2: A Review. J. Environ. Public Health 2021, 2021, 1–8. [Google Scholar] [CrossRef]
- Air Quality Particle Counting Meter PCE-PCO2. Available online: https://www.pce-instruments.com/eu/api/getartfile?_fnr=1720693&_dsp=inline (accessed on 22 June 2022).
- Statistical Methods. Available online: https://amos.ukf.sk/mod/book/view.php?id=8452&chapterid=3191 (accessed on 23 June 2022).
- Kontses, A.; Ntziachristos, L.; Zardini, A.A.; Papadopoulos, G.; Giechaskiel, B. Particulate emissions from L-Category vehicles towards Euro 5. Environ. Res. 2020, 182, 109071. [Google Scholar] [CrossRef]
- European Environment Agency. Air Quality in Europe—2019 Report. Available online: https://www.eea.europa.eu/publications/air-quality-in-europe-2019 (accessed on 22 June 2022).
- Giechaskiel, B. Solid particle number emission factors of Euro VI heavy-duty vehicles on the road and in the laboratory. Int. J. Environ. Res. Public Health 2018, 15, 304. [Google Scholar] [CrossRef] [PubMed] [Green Version]
- Gnap, J.; Dočkalik, M. Impact of the operation of LNG trucks on the environment. Open Eng. 2021, 11, 937–947. [Google Scholar] [CrossRef]
- Tian, X.; Wang, M.; Li, W.; Jiang, B.; Xu, D.; Wang, X.; Xu, J. Improve accuracy of fingerprinting localization with temporal correlation of the RSS. IEEE Trans. Mob. Comput. 2017, 17, 113–126. [Google Scholar] [CrossRef]
- Gupta, S.K.; Elumalai, S.P. Dependence of urban air pollutants on morning/evening peak hours and seasons. Arch. Environ. Contam. Toxicol. 2019, 76, 572–590. [Google Scholar] [CrossRef]
- Aggarwal, C.C.; Bar-Noy, A.; Shamoun, S. On sensor selection in linked information networks. In Proceedings of the 2011 International Conference on Distributed Computing in Sensor Systems and Workshops (DCOSS), Barcelona, Spain, 27–29 June 2011; pp. 1–8. [Google Scholar]
- Mano, Z.; Kendler, S.; Fishbain, B. Information Theory Solution Approach to the Air Pollution Sensor Location—Allocation Problem. Sensors 2022, 22, 3808. [Google Scholar] [CrossRef]
- Kanaroglou, P.S.; Jerrett, M.; Morrison, J.; Beckerman, B.; Arain, M.A.; Gilbert, N.L.; Brook, J.R. Establishing an air pollution monitoring network for intra-urban population exposure assessment: A location-allocation approach. Atmos. Environ. 2005, 39, 2399–2409. [Google Scholar] [CrossRef]
- Jeong, J.C.; Lee, P.S.H. Spatial distribution of particulate matters in comparison with land-use and traffic volume in Seoul, Republic of Korea. J. Cadastre Land Inf. 2018, 48, 123–138. [Google Scholar]
- Qiu, Z.; Xu, X.; Song, J.; Luo, Y.; Zhao, R.; Zhou, B.X.W.; Li, X.; Hao, Y. Pedestrian exposure to traffic PM on different types of urban roads: A case study of Xi’an, China. Sustain. Cities Soc. 2017, 32, 475–485. [Google Scholar] [CrossRef]
- Tian, Y.; Yao, X. Urban form, traffic volume, and air quality: A spatiotemporal stratified approach. Environ. Plan. B Urban Anal. City Sci. 2022, 49, 92–113. [Google Scholar] [CrossRef]
- Zhang, R.; Wang, G.; Guo, S.; Zamora, M.L.; Ying, Q.; Lin, Y.; Wang, W.; Hu, M.; Wang, Y. Formation of urban fine particulate matter. Chem. Rev. 2015, 115, 3803–3855. [Google Scholar] [CrossRef] [PubMed]
- Zhao, Z.; Guo, M.; An, J.; Zhang, L.; Tan, P.; Tian, X.; Zhao, Y.; Liu, L.; Wang, X.; Luo, Y.; et al. Acute effect of air pollutants’ peak-hour concentrations on ischemic stroke hospital admissions among hypertension patients in Beijing, China, from 2014 to 2018. Environ. Sci. Pollut. Res. 2022, 29, 41617–41627. [Google Scholar] [CrossRef] [PubMed]
- Reche, C.; Viana, M.; Brines, M.; Pérez, N.; Beddows, D.; Alastuey, A.; Querol, X. Determinants of aerosol lung-deposited surface area variation in an urban environment. Sci. Total Environ. 2015, 517, 38–47. [Google Scholar] [CrossRef]
- Arkouli, M.; Ulke, A.G.; Endlicher, W.; Baumbach, G.; Schultz, E.; Vogt, U.; Müller, M.; Dawidowski, L.; Faggi, A.; Wolf-Benning, U.; et al. Distribution and temporal behavior of particulate matter over the urban area of Buenos Aires. Atmos. Pollut. Res. 2010, 1, 1–8. [Google Scholar] [CrossRef] [Green Version]
- Li, B.; Li, X.B.; Li, C.; Zhu, Y.; Peng, Z.R.; Wang, Z.; Lu, S.J. Impacts of wind fields on the distribution patterns of traffic emitted particles in urban residential areas. Transp. Res. Part D Transp. Environ. 2019, 68, 122–136. [Google Scholar] [CrossRef]
- Mukherjee, A.; Agrawal, M. World air particulate matter: Sources, distribution and health effects. Environ. Chem. Lett. 2017, 15, 283–309. [Google Scholar] [CrossRef]
- Ortolani, C.; Vitale, M. The importance of local scale for assessing, monitoring and predicting of air quality in urban areas. Sustain. Cities Soc. 2016, 26, 150–160. [Google Scholar] [CrossRef]
- Font, A.; Guiseppin, L.; Blangiardo, M.; Ghersi, V.; Fuller, G.W. A tale of two cities: Is air pollution improving in Paris and London? Environ. Pollut. 2019, 249, 1–12. [Google Scholar] [CrossRef]
- Lu, D.; Xu, J.; Yang, D.; Zhao, J. Spatio-temporal variation and influence factors of PM2.5 concentrations in China from 1998 to 2014. Atmos. Pollut. Res. 2017, 8, 1151–1159. [Google Scholar] [CrossRef]
- Schwarz, J.; Cusack, M.; Karban, J.; Chalupníčková, E.; Havránek, V.; Smolík, J.; Ždímal, V. PM2.5 chemical composition at a rural background site in Central Europe, including correlation and air mass back trajectory analysis. Atmos. Res. 2016, 176, 108–120. [Google Scholar] [CrossRef]
- Gao, C.; Li, S.; Liu, M.; Zhang, F.; Achal, V.; Tu, Y.; Zhang, S.; Cai, C. Impact of the COVID-19 pandemic on air pollution in Chinese megacities from the perspective of traffic volume and meteorological factors. Sci. Total. Environ. 2021, 773, 145545. [Google Scholar] [CrossRef]
- Hicks, W.; Beevers, S.; Tremper, A.; Stewart, G.; Priestman, M.; Kelly, F.; Lanoisellé, M.; Lowry, D.; Green, D. Quantification of non-exhaust particulate matter traffic emissions and the impact of COVID-19 lockdown at London Marylebone road. Atmosphere 2021, 12, 190. [Google Scholar] [CrossRef]
- Ghiasi, B.; Alisoltani, T.; Jalali, F.; Tahsinpour, H. Effect of COVID-19 on transportation air pollution by moderation and mediation analysis in Queens, New York. Air Qual. Atmos. Health 2022, 15, 289–297. [Google Scholar] [CrossRef]
- Ngoc, L.T.N.; Kim, M.; Bui, V.K.H.; Park, D.; Lee, Y.C. Particulate matter exposure of passengers at bus stations: A review. Int. J. Environ. Res. Public Health 2018, 15, 2886. [Google Scholar] [CrossRef] [PubMed] [Green Version]
- Yu, Q.; Li, T. Evaluation of bus emissions generated near bus stops. Atmos. Environ. 2014, 85, 195–203. [Google Scholar] [CrossRef]
Figure 1.
Distribution of measuring points in the city (based on mapy.cz).

Figure 2.
Photographic representation of measurement points.

Figure 3.
PCE-PCO 2 measuring device [43].
Figure 3.
PCE-PCO 2 measuring device [43].

Figure 4.
Particulate matter concentration at bus station.

Figure 5.
Particulate matter concentration at selected location—railway crossing.

Figure 6.
Particulate matter concentrations at selected location—primary school.

Figure 7.
Relationship between the number of vehicles and concentration of particulate emissions.


Table 1.
Evaluation of air quality in measurement of particulate matter (according to Slovak Hydrometeorological Institute).
Table 1.
Evaluation of air quality in measurement of particulate matter (according to Slovak Hydrometeorological Institute).
| Air Quality Evaluated According to Slovak Hydrometeorological Institute [μg/m3] | ||
|---|---|---|
| Quality Level | PM2.5 | PM10 |
| very good | 0–14 | 0–20 |
| good | 14–25 | 20–40 |
| worse | 25–70 | 40–100 |
| bad | 70–140 | 100–180 |
| very bad | >140 | >180 |
Table 2.
Technical parameters of measuring instrument [43].
Table 2.
Technical parameters of measuring instrument [43].
| Particle Specifications | |
|---|---|
| Particulate matter channels | PM2.5/PM10 |
| Particle concentrations | 0…2000 μg/m3 |
| Resolution | 1 μg/m3 |
| Particle counter specifications | |
| Particle sizes (in micrometers) | 0.3/0.5/1.0/2.5/5.0 and 10 μm |
| Flow rate | 2.83 L/min |
| Coincidence error | <5% at 2,000,000 particles per cubic foot |
| Counting efficiency | 50% at 0.3 μm |
| Memory capacity | Stores up to 5000 data sets |
| Counting modes | Cumulative, differential, concentration |
Table 3.
Hourly particulate emissions at bus station.
| Interval | PM2.5 [μg/m3] | PM10 [μg/m3] | Number of Buses |
|---|---|---|---|
| 6:00–7:00 | 12 | 61 | 89 |
| 7:00–8:00 | 5.25 | 12.5 | 50 |
| 8:00–9:00 | 4.5 | 11.5 | 30 |
Table 4.
Hourly particulate emissions in measurement location.
| Interval | PM2.5 [μg/m3] | PM10 [μg/m3] | Number of Vehicles |
|---|---|---|---|
| 7:00–8:00 | 15.25 | 62 | 930 |
| 8:00–9:00 | 12.5 | 47.75 | 587 |
| 9:00–10:00 | 10.5 | 38.5 | 454 |
| 10:00–11:00 | 9.25 | 34.5 | 383 |
| 11:00–12:00 | 5.5 | 17.25 | 247 |
| 12:00–13:00 | 5.25 | 28 | 346 |
| 13:00–14:00 | 4.5 | 31.75 | 332 |
| 14:00–15:00 | 5.75 | 34 | 472 |
| 15:00–16:00 | 7.5 | 36.25 | 506 |
| 16:00–17:00 | 11.75 | 61.25 | 842 |
| 17:00–18:00 | 14.5 | 68.5 | 933 |
| 18:00–19:00 | 8.75 | 64.5 | 675 |
Table 5.
Hourly particulate emissions in measurement location.
| Interval | PM2.5 [μg/m3] | PM10 [μg/m3] | Number of Vehicles |
|---|---|---|---|
| 7:00–8:00 | 5.5 | 32.75 | 172 |
| 8:00–9:00 | 3.5 | 12 | 110 |
| 9:00–10:00 | 2.5 | 11 | 109 |
Table 6.
Evaluation of monitored data dependence.
| Correlation Coefficient Values of Monitored Data | ||
|---|---|---|
| Measuring Point | PM2.5 | PM10 |
| Bus station | 0.907 | 0.895 |
| Primary school | 0.904 | 0.727 |
| Railway crossing | 0.818 | 0.882 |
Table 7.
Evaluation of correlation coefficients [44].
Table 7.
Evaluation of correlation coefficients [44].
| Degree of Dependence of Monitored Data | |
|---|---|
| very high dependence | 0.9–1 |
| high dependence | 0.7–0.9 |
| moderate dependence | 0.5–0.7 |
| low dependence | 0.3–0.5 |
| no dependence | 0–0.3 |
Disclaimer/Publisher’s Note: The statements, opinions and data contained in all publications are solely those of the individual author(s) and contributor(s) and not of MDPI and/or the editor(s). MDPI and/or the editor(s) disclaim responsibility for any injury to people or property resulting from any ideas, methods, instructions or products referred to in the content. |
© 2023 by the authors. Licensee MDPI, Basel, Switzerland. This article is an open access article distributed under the terms and conditions of the Creative Commons Attribution (CC BY) license (https://creativecommons.org/licenses/by/4.0/).
Share and Cite
MDPI and ACS Style
Šarkan, B.; Gnap, J.; Loman, M.; Harantová, V. Examining the Amount of Particulate Matter (PM) Emissions in Urban Areas. Appl. Sci. 2023, 13, 1845. https://doi.org/10.3390/app13031845
AMA Style
Šarkan B, Gnap J, Loman M, Harantová V. Examining the Amount of Particulate Matter (PM) Emissions in Urban Areas. Applied Sciences. 2023; 13(3):1845. https://doi.org/10.3390/app13031845
Chicago/Turabian StyleŠarkan, Branislav, Jozef Gnap, Michal Loman, and Veronika Harantová. 2023. "Examining the Amount of Particulate Matter (PM) Emissions in Urban Areas" Applied Sciences 13, no. 3: 1845. https://doi.org/10.3390/app13031845
Note that from the first issue of 2016, this journal uses article numbers instead of page numbers. See further details here.