
Development of a Collaborative Robotic Platform for Autonomous Auscultation


Abstract
:1. Introduction
2. Materials and Methods
2.1. Materials
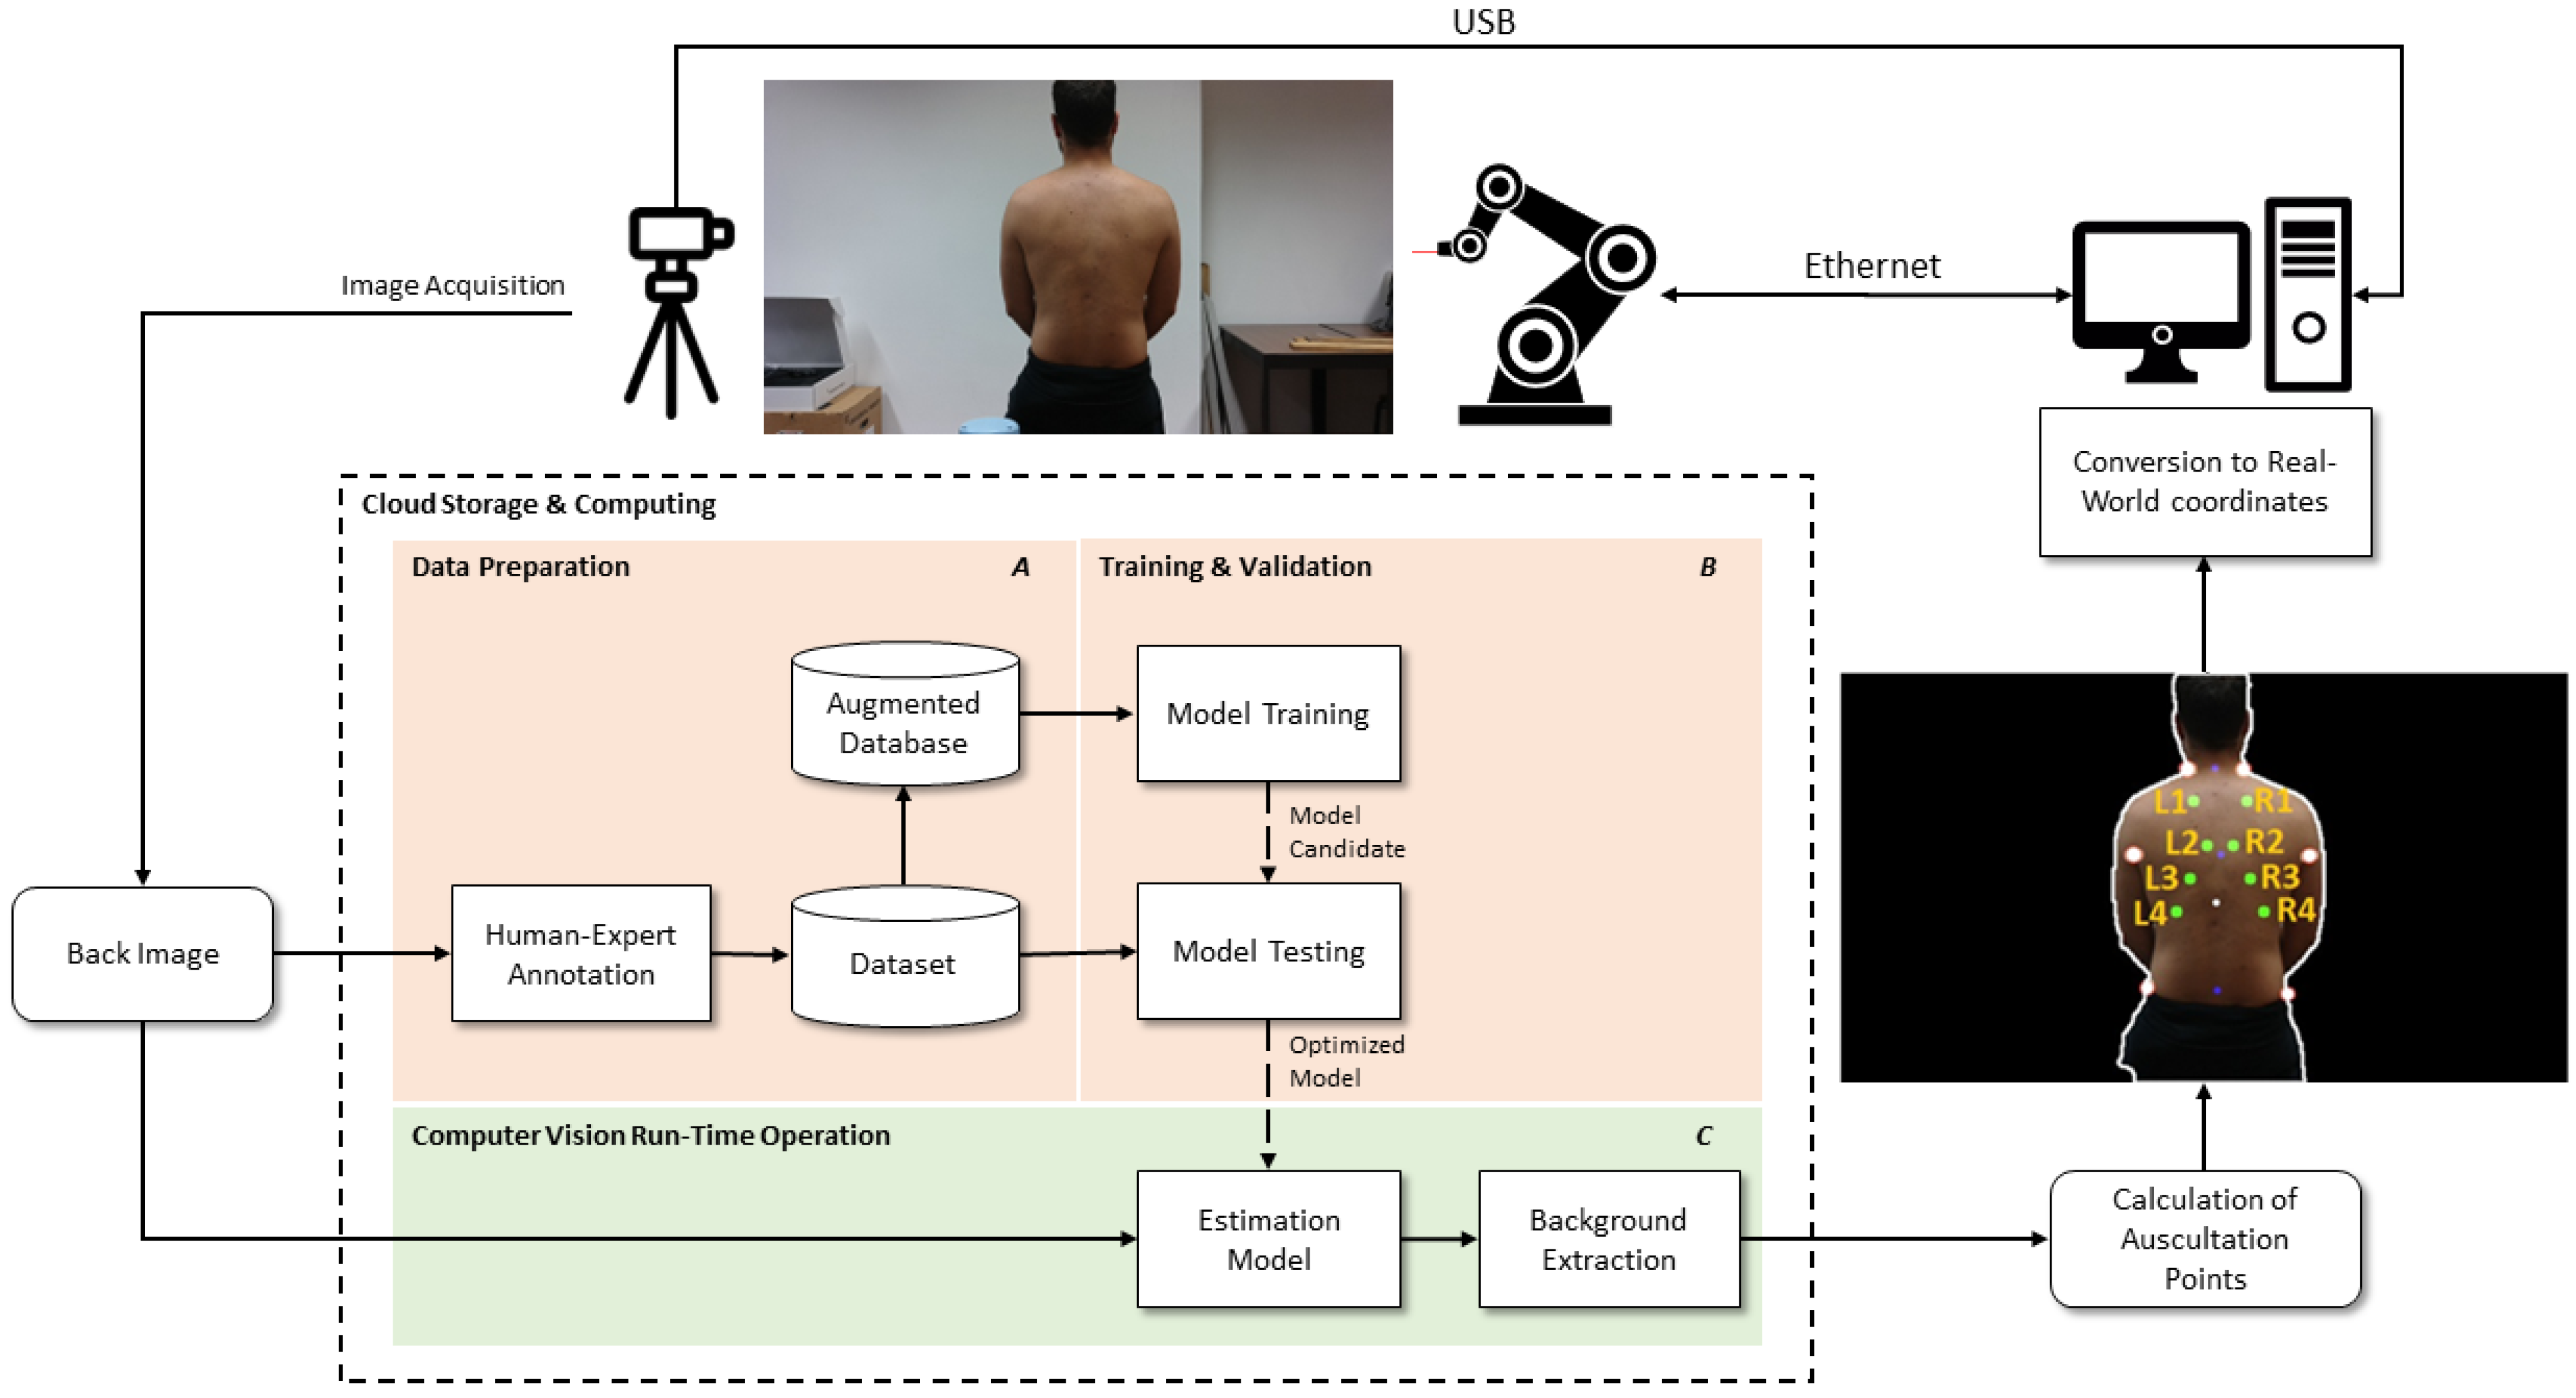
2.2. Methods
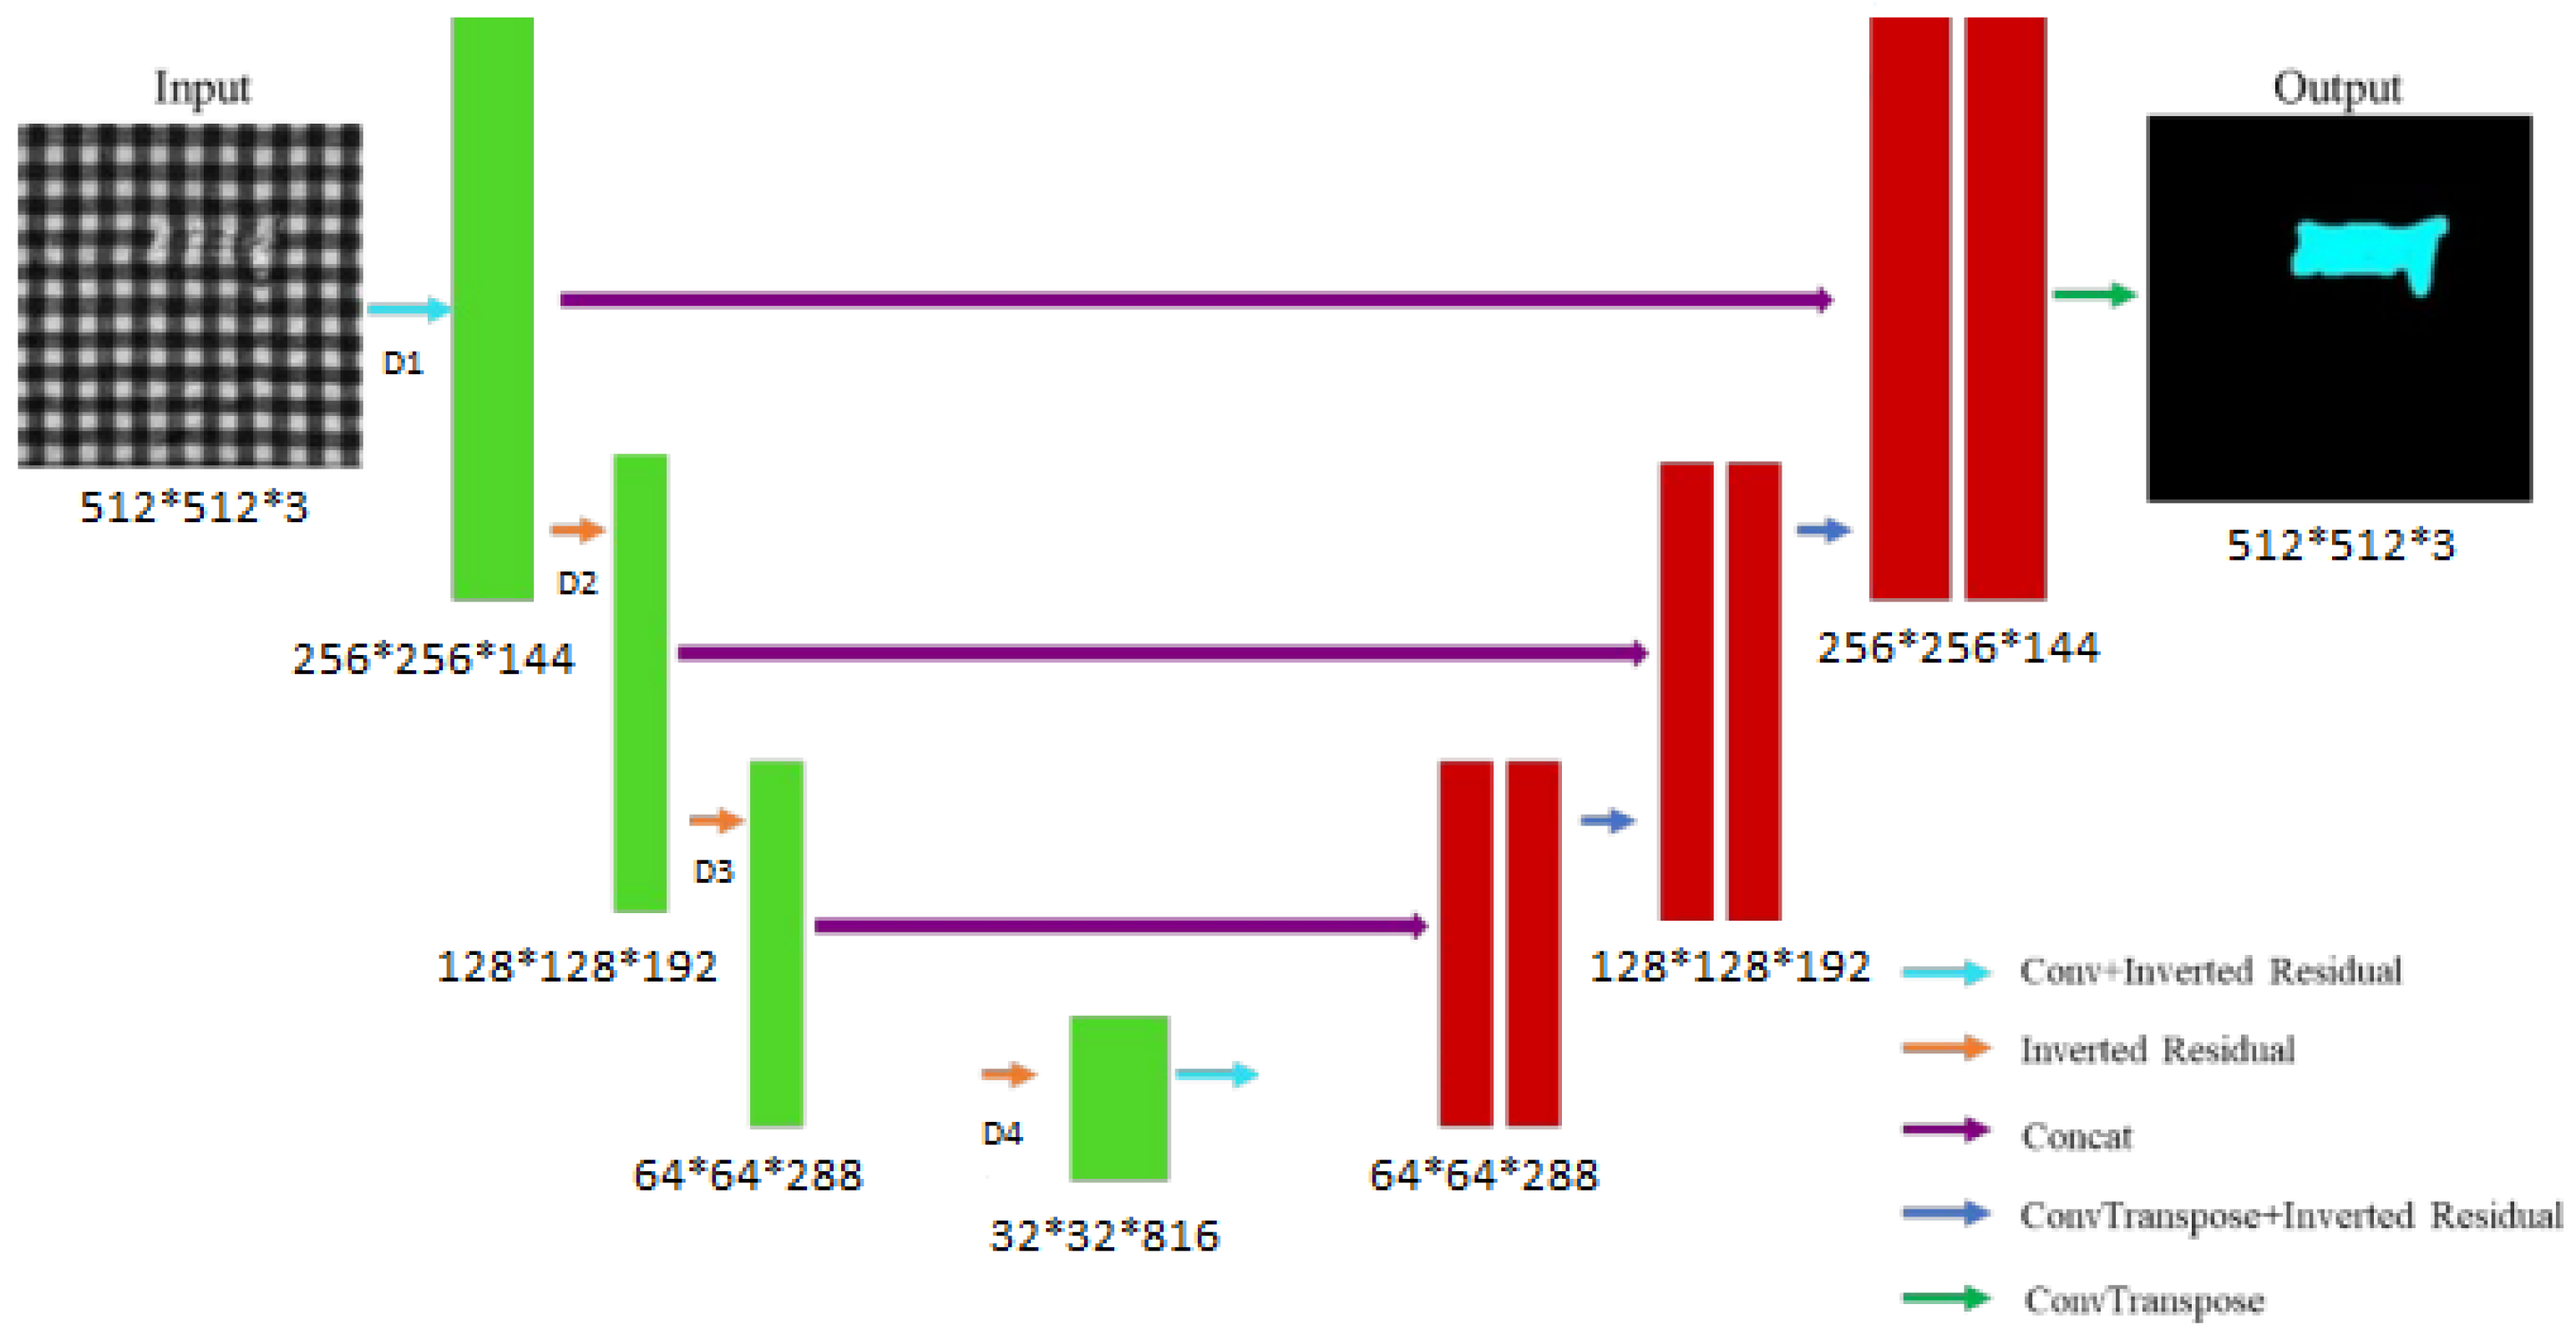
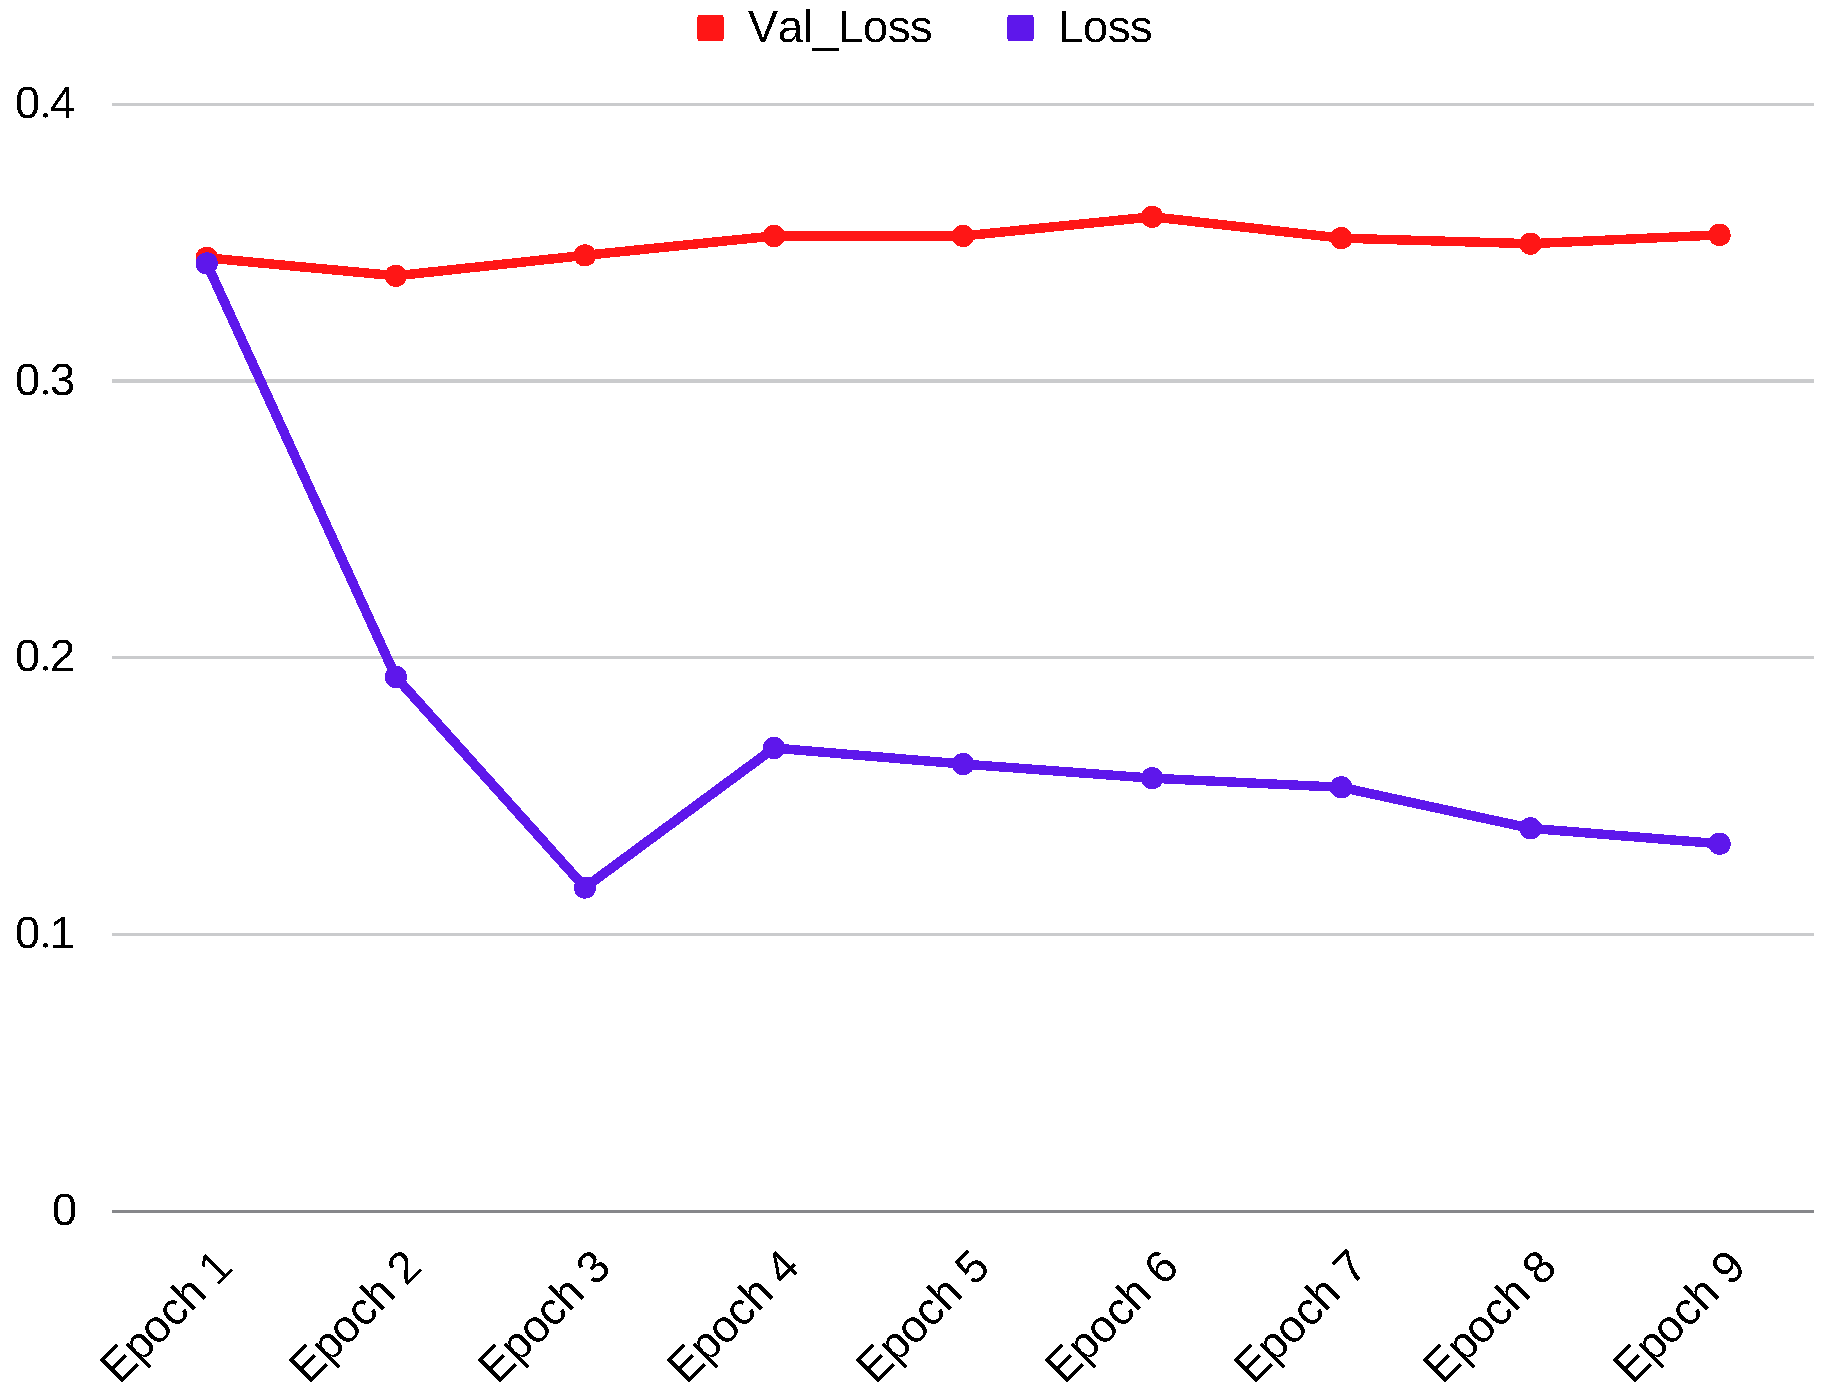
2.2.1. Model Training
- The model has fewer parameters, requiring less computational effort during training and eventually less data;
- Using a pre-trained encoder helps the model converge much faster compared to the non-pre-trained model;
- A pre-trained encoder helps the model achieve high performance compared to a non-pre-trained model.
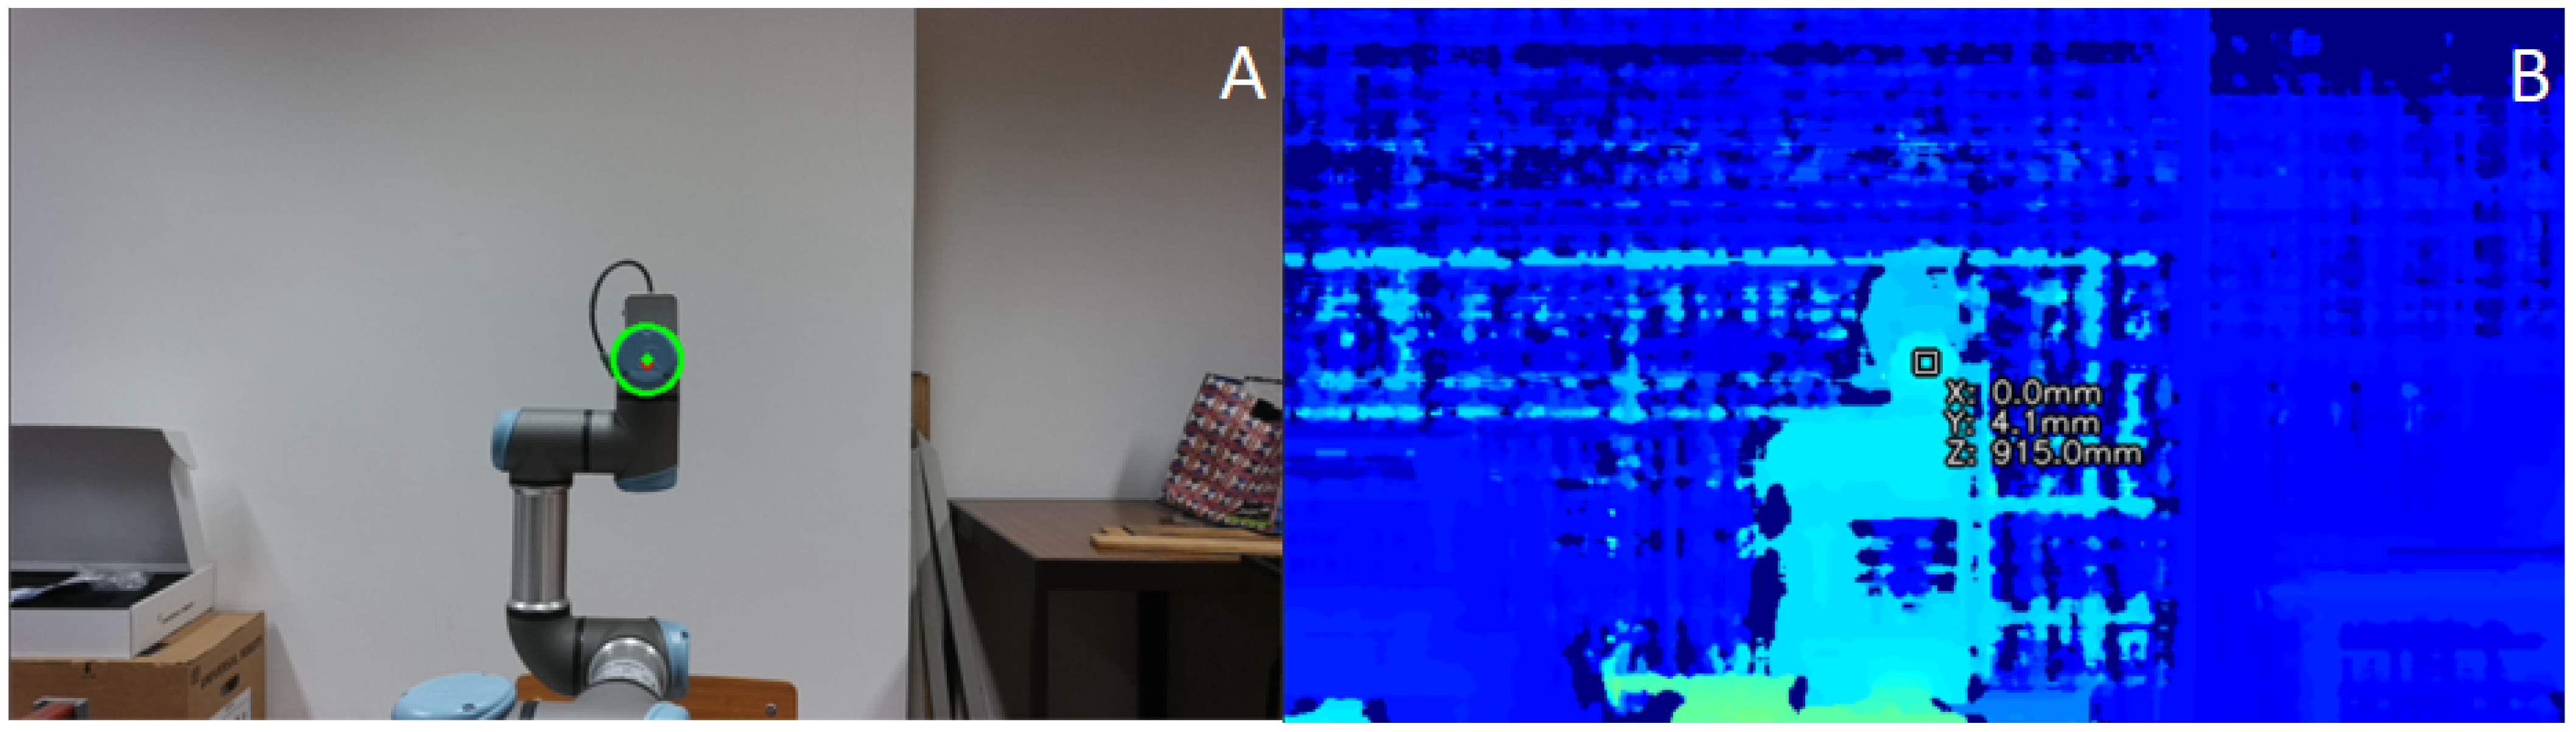
2.2.2. Calculating the Offset of the Camera’s Alignment with the Robotic Arm
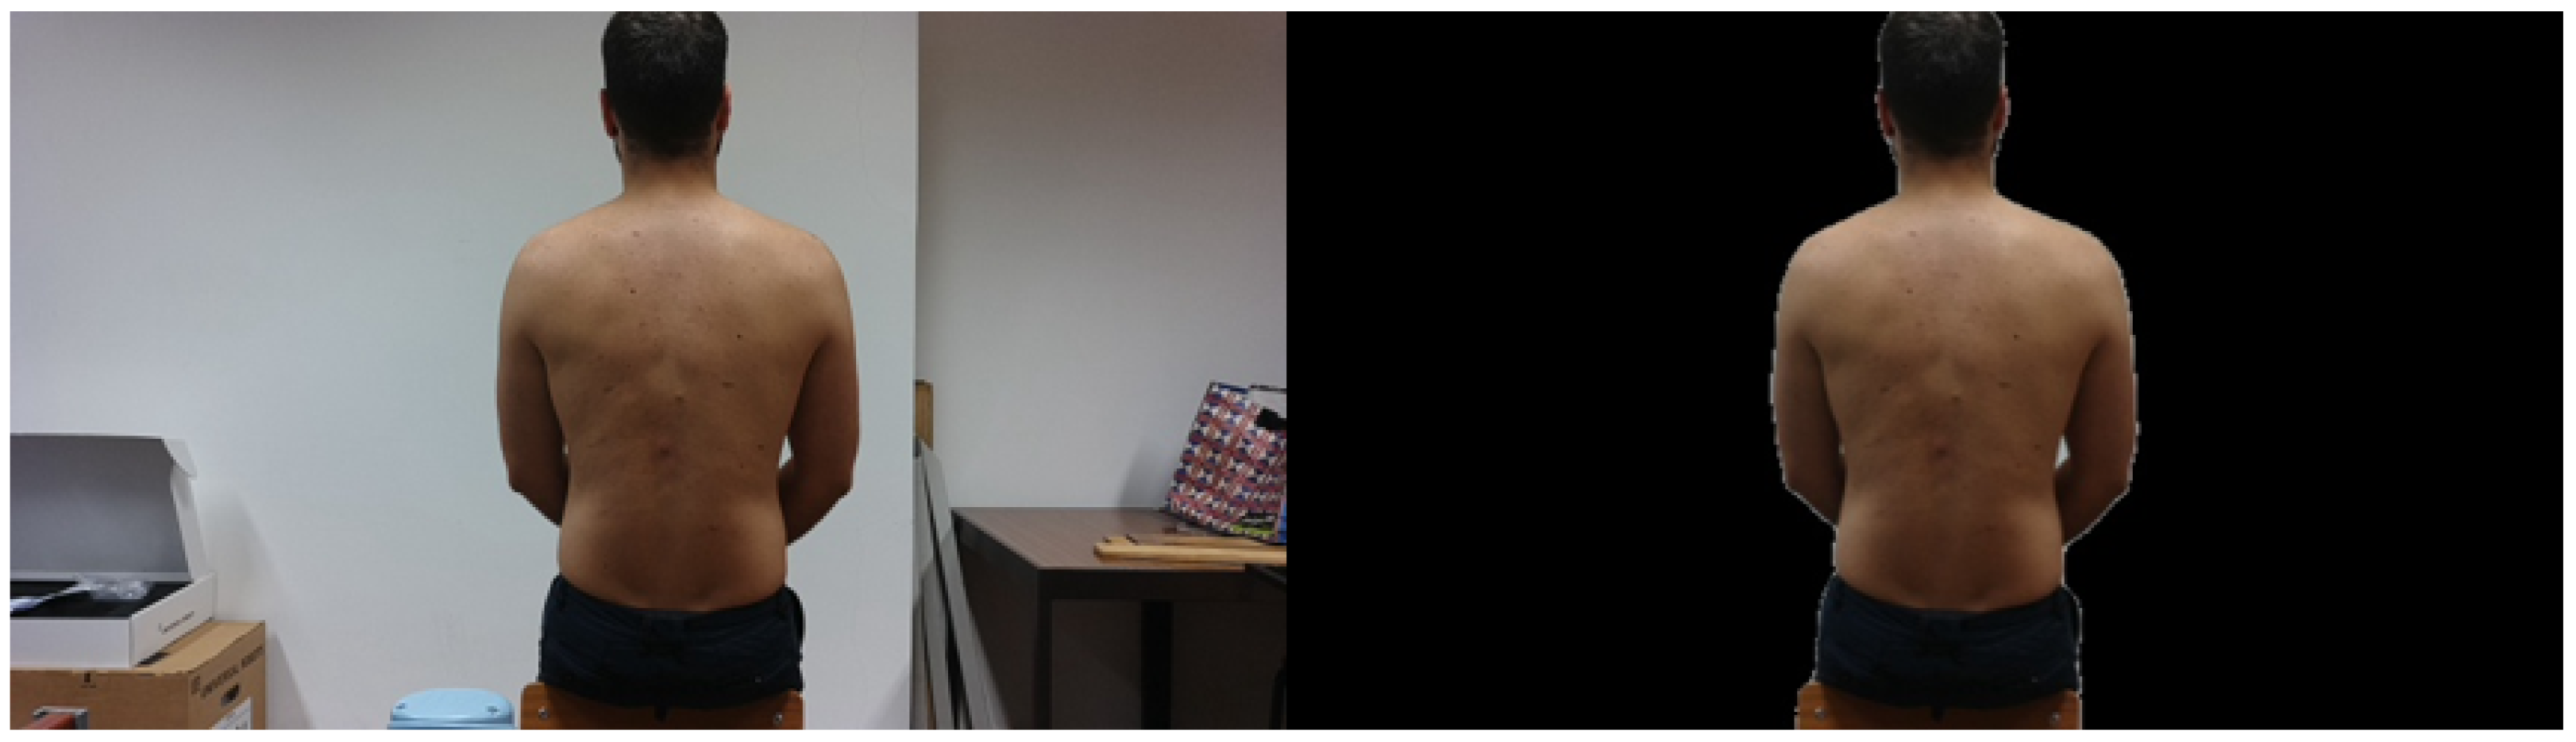
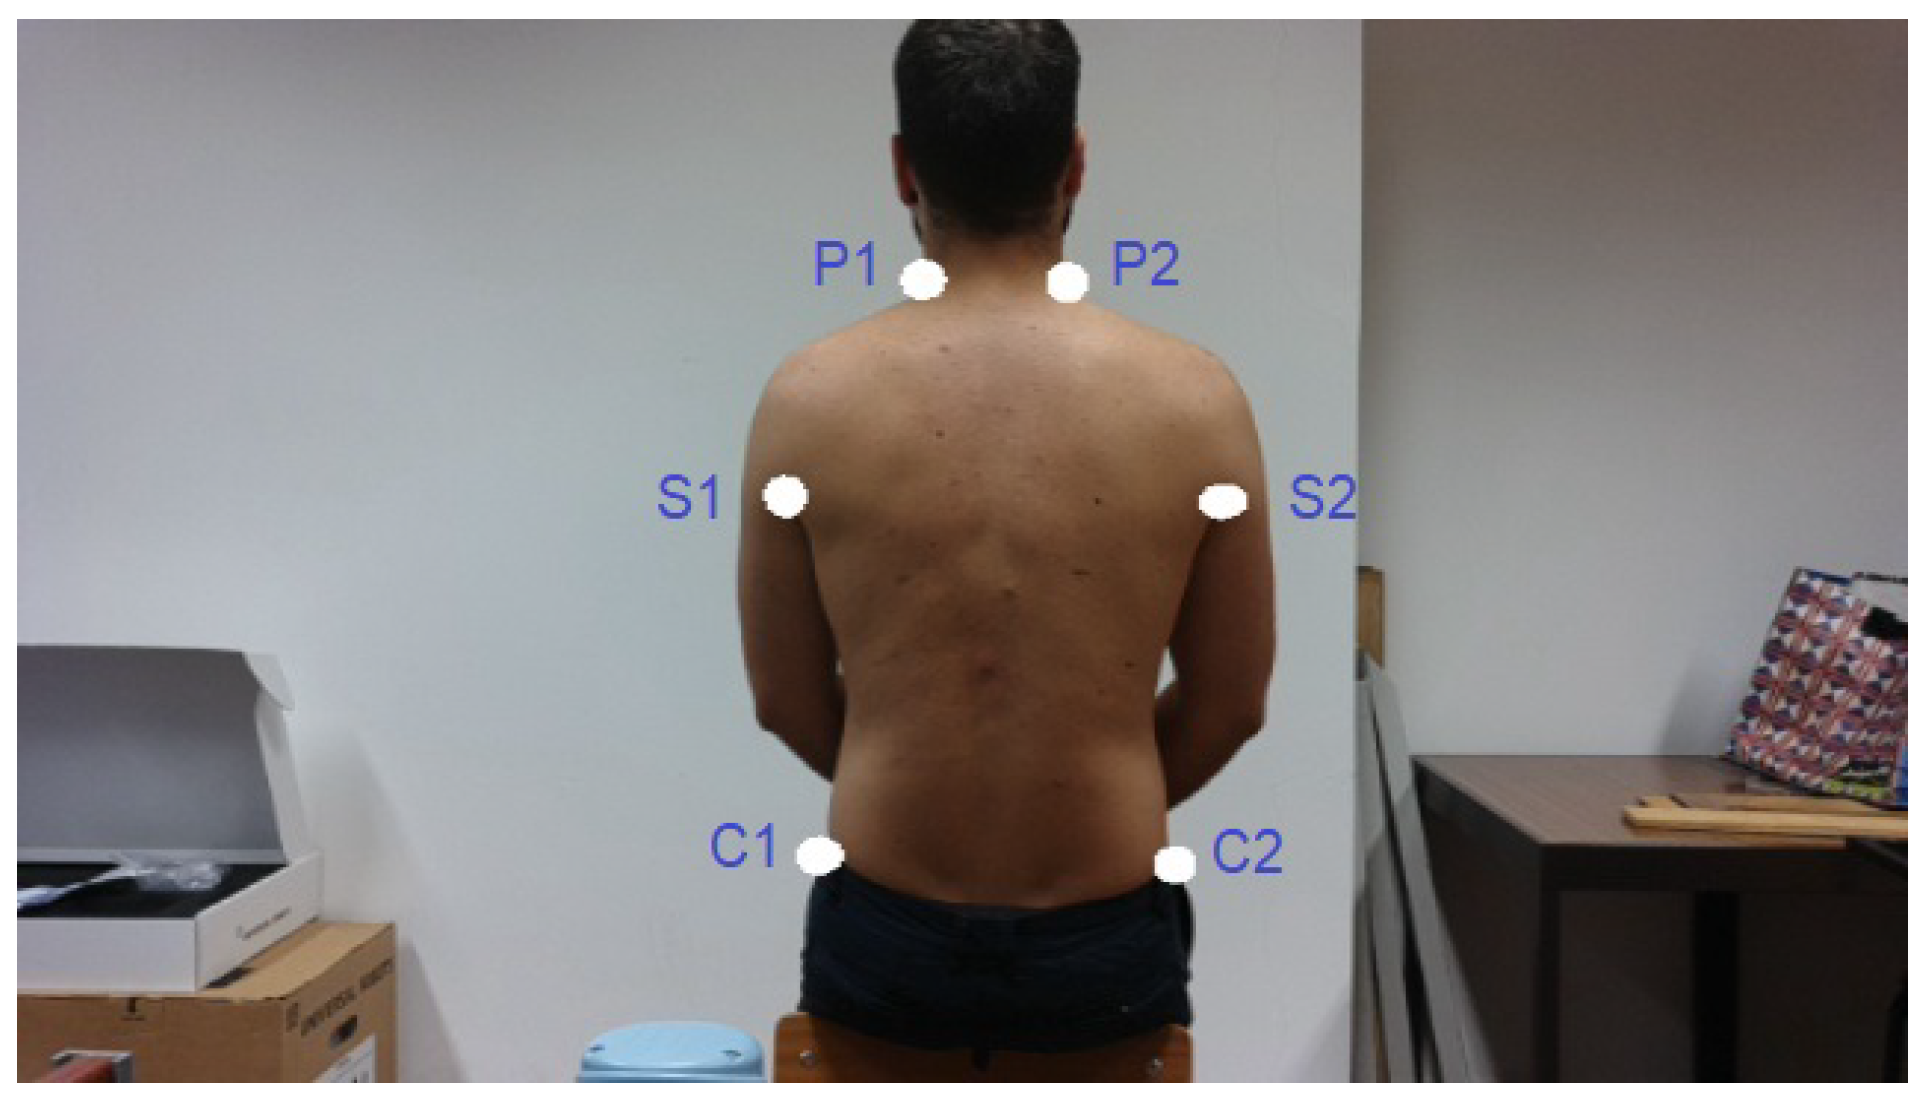
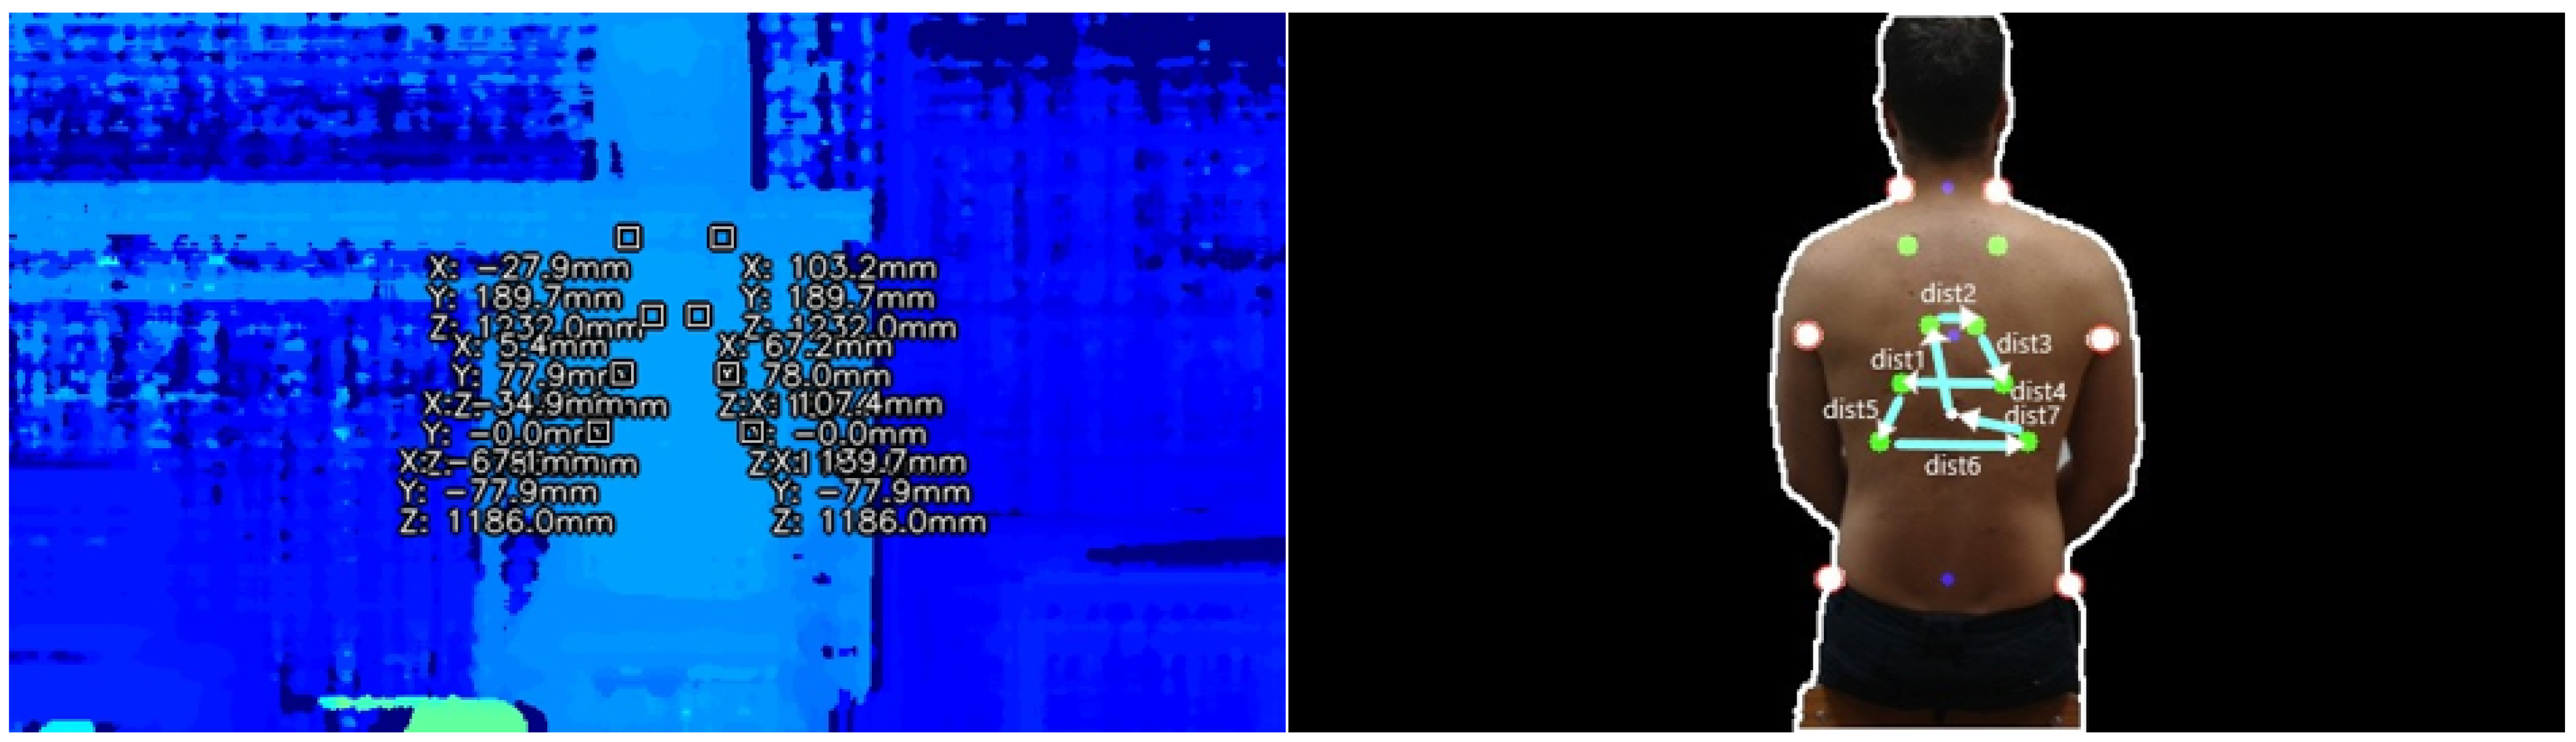
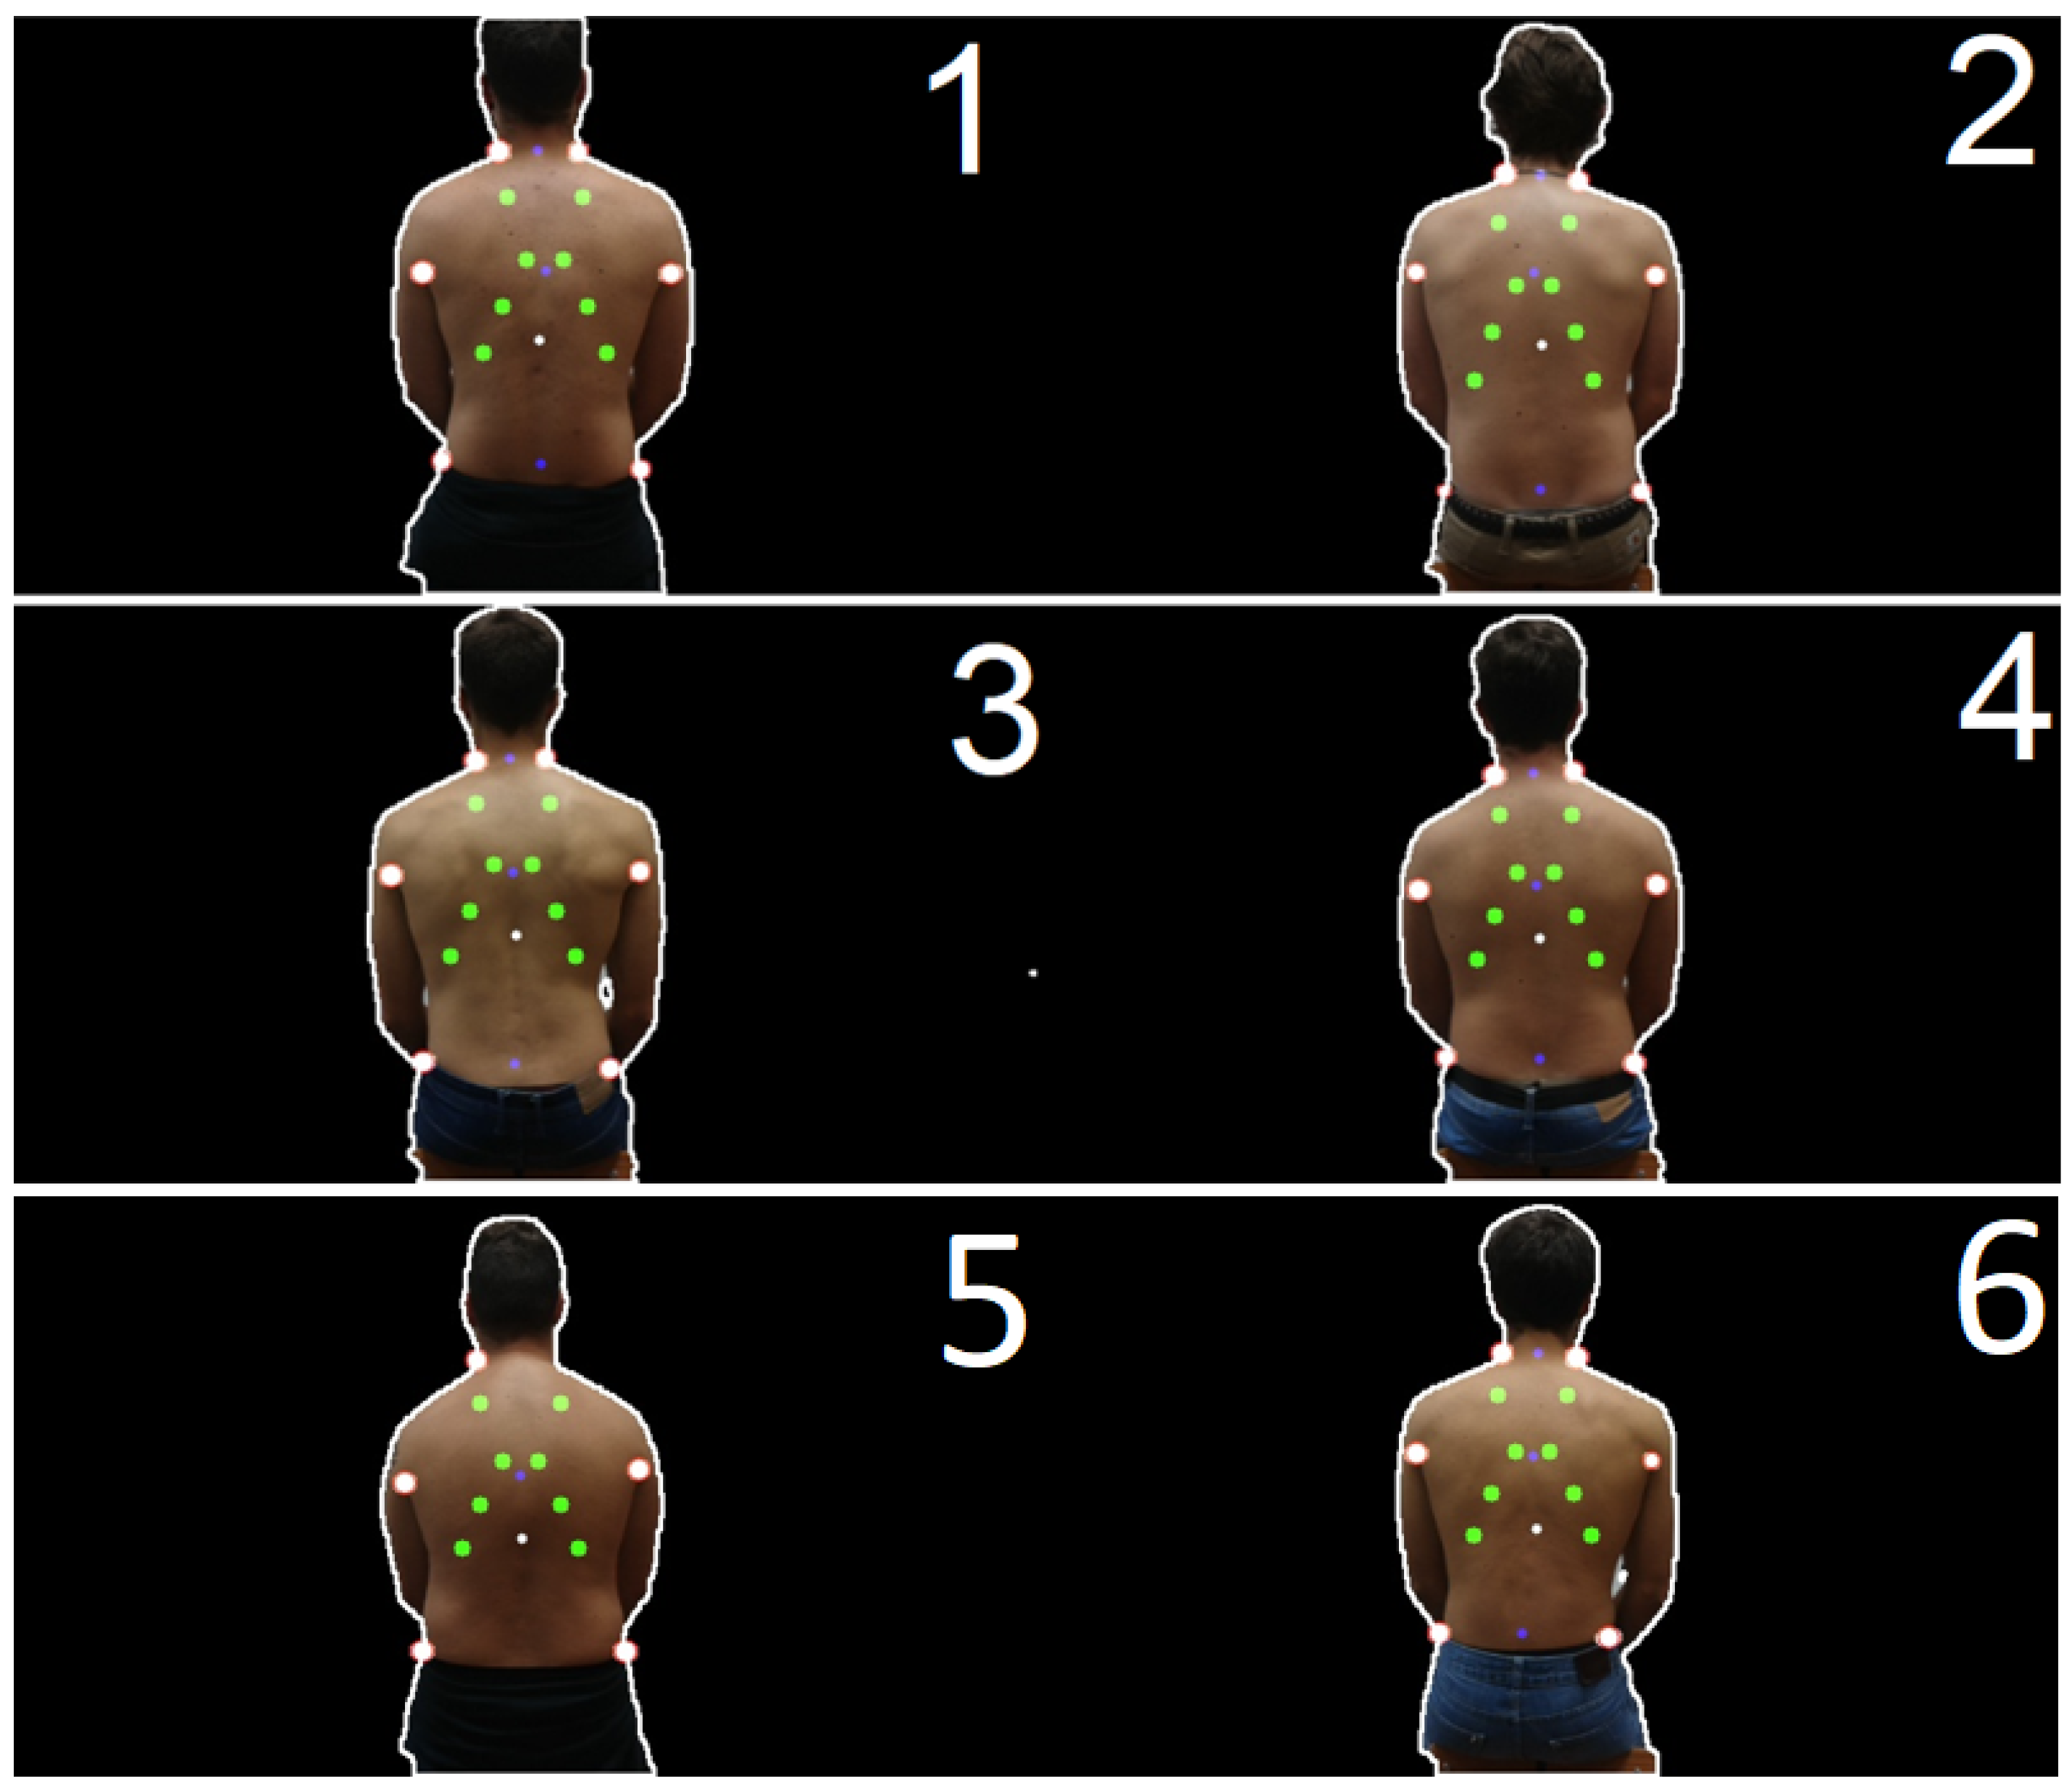
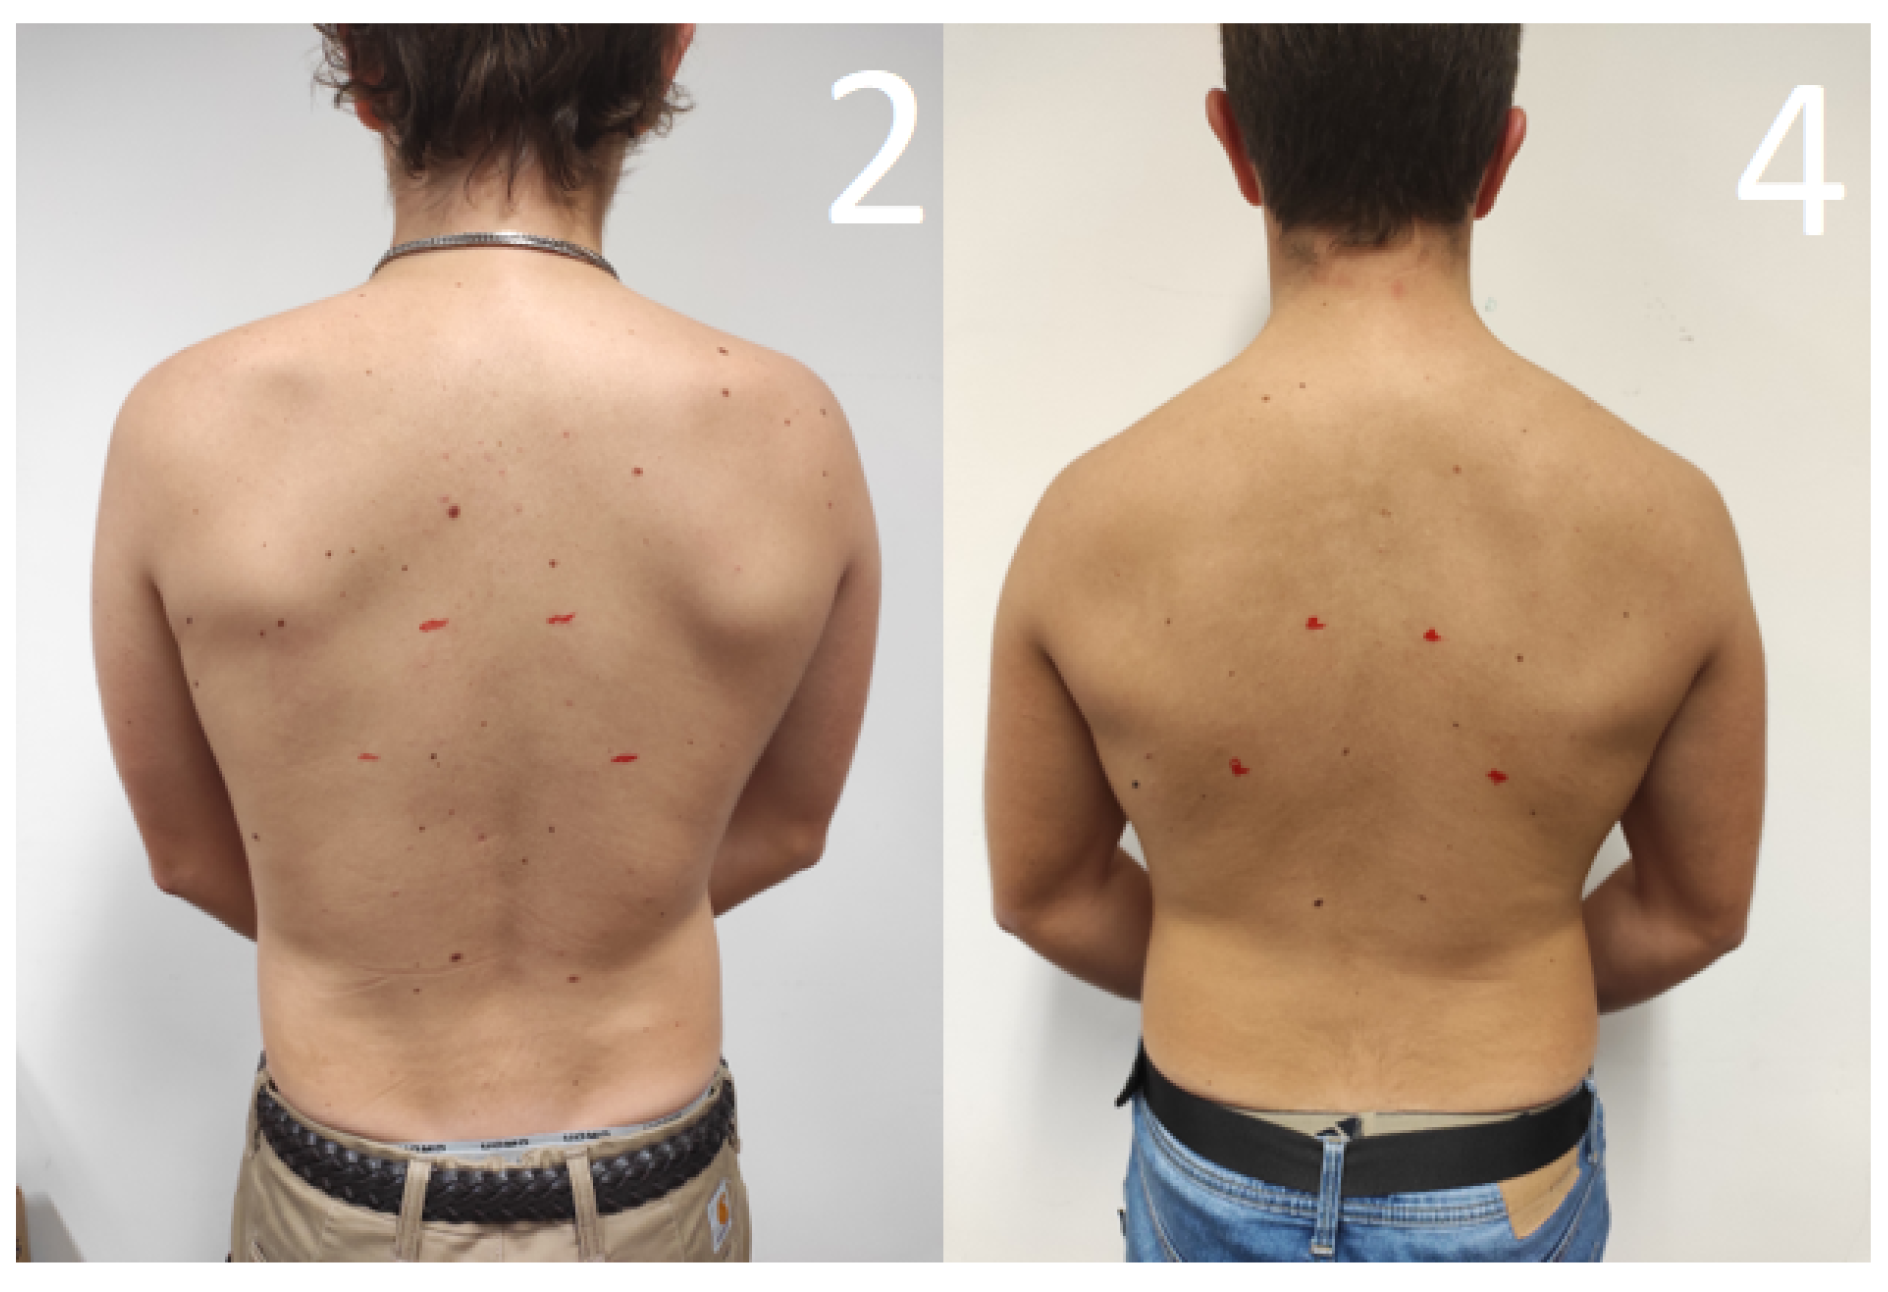
2.2.3. Prediction of Reference Points
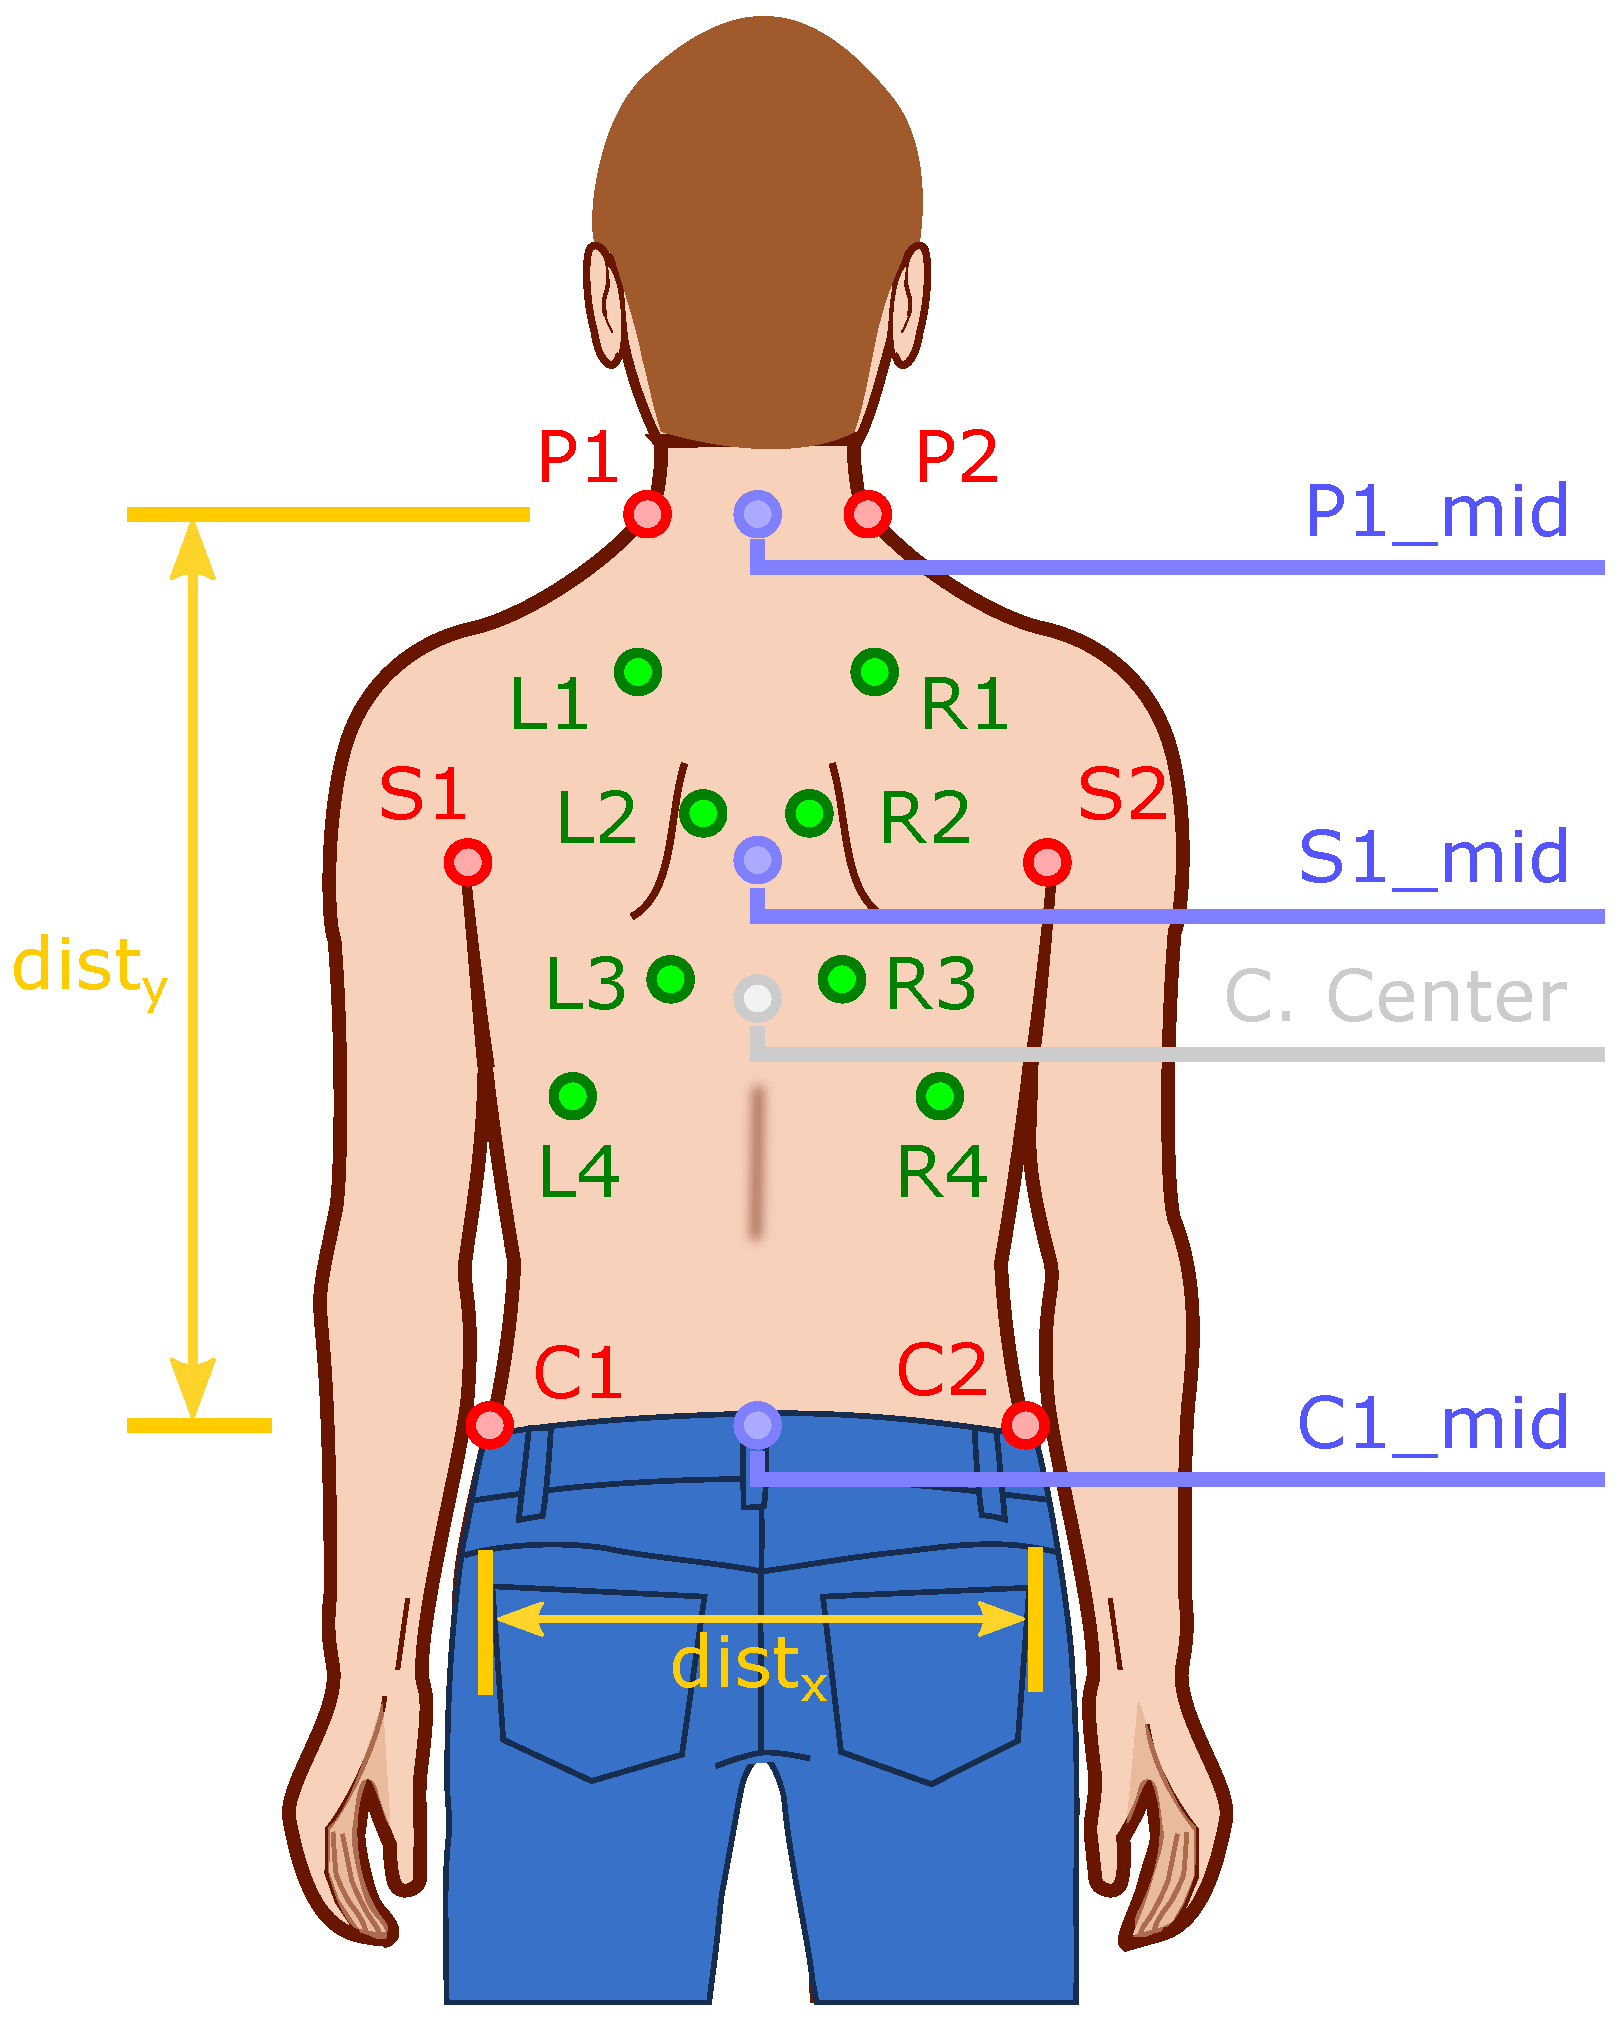
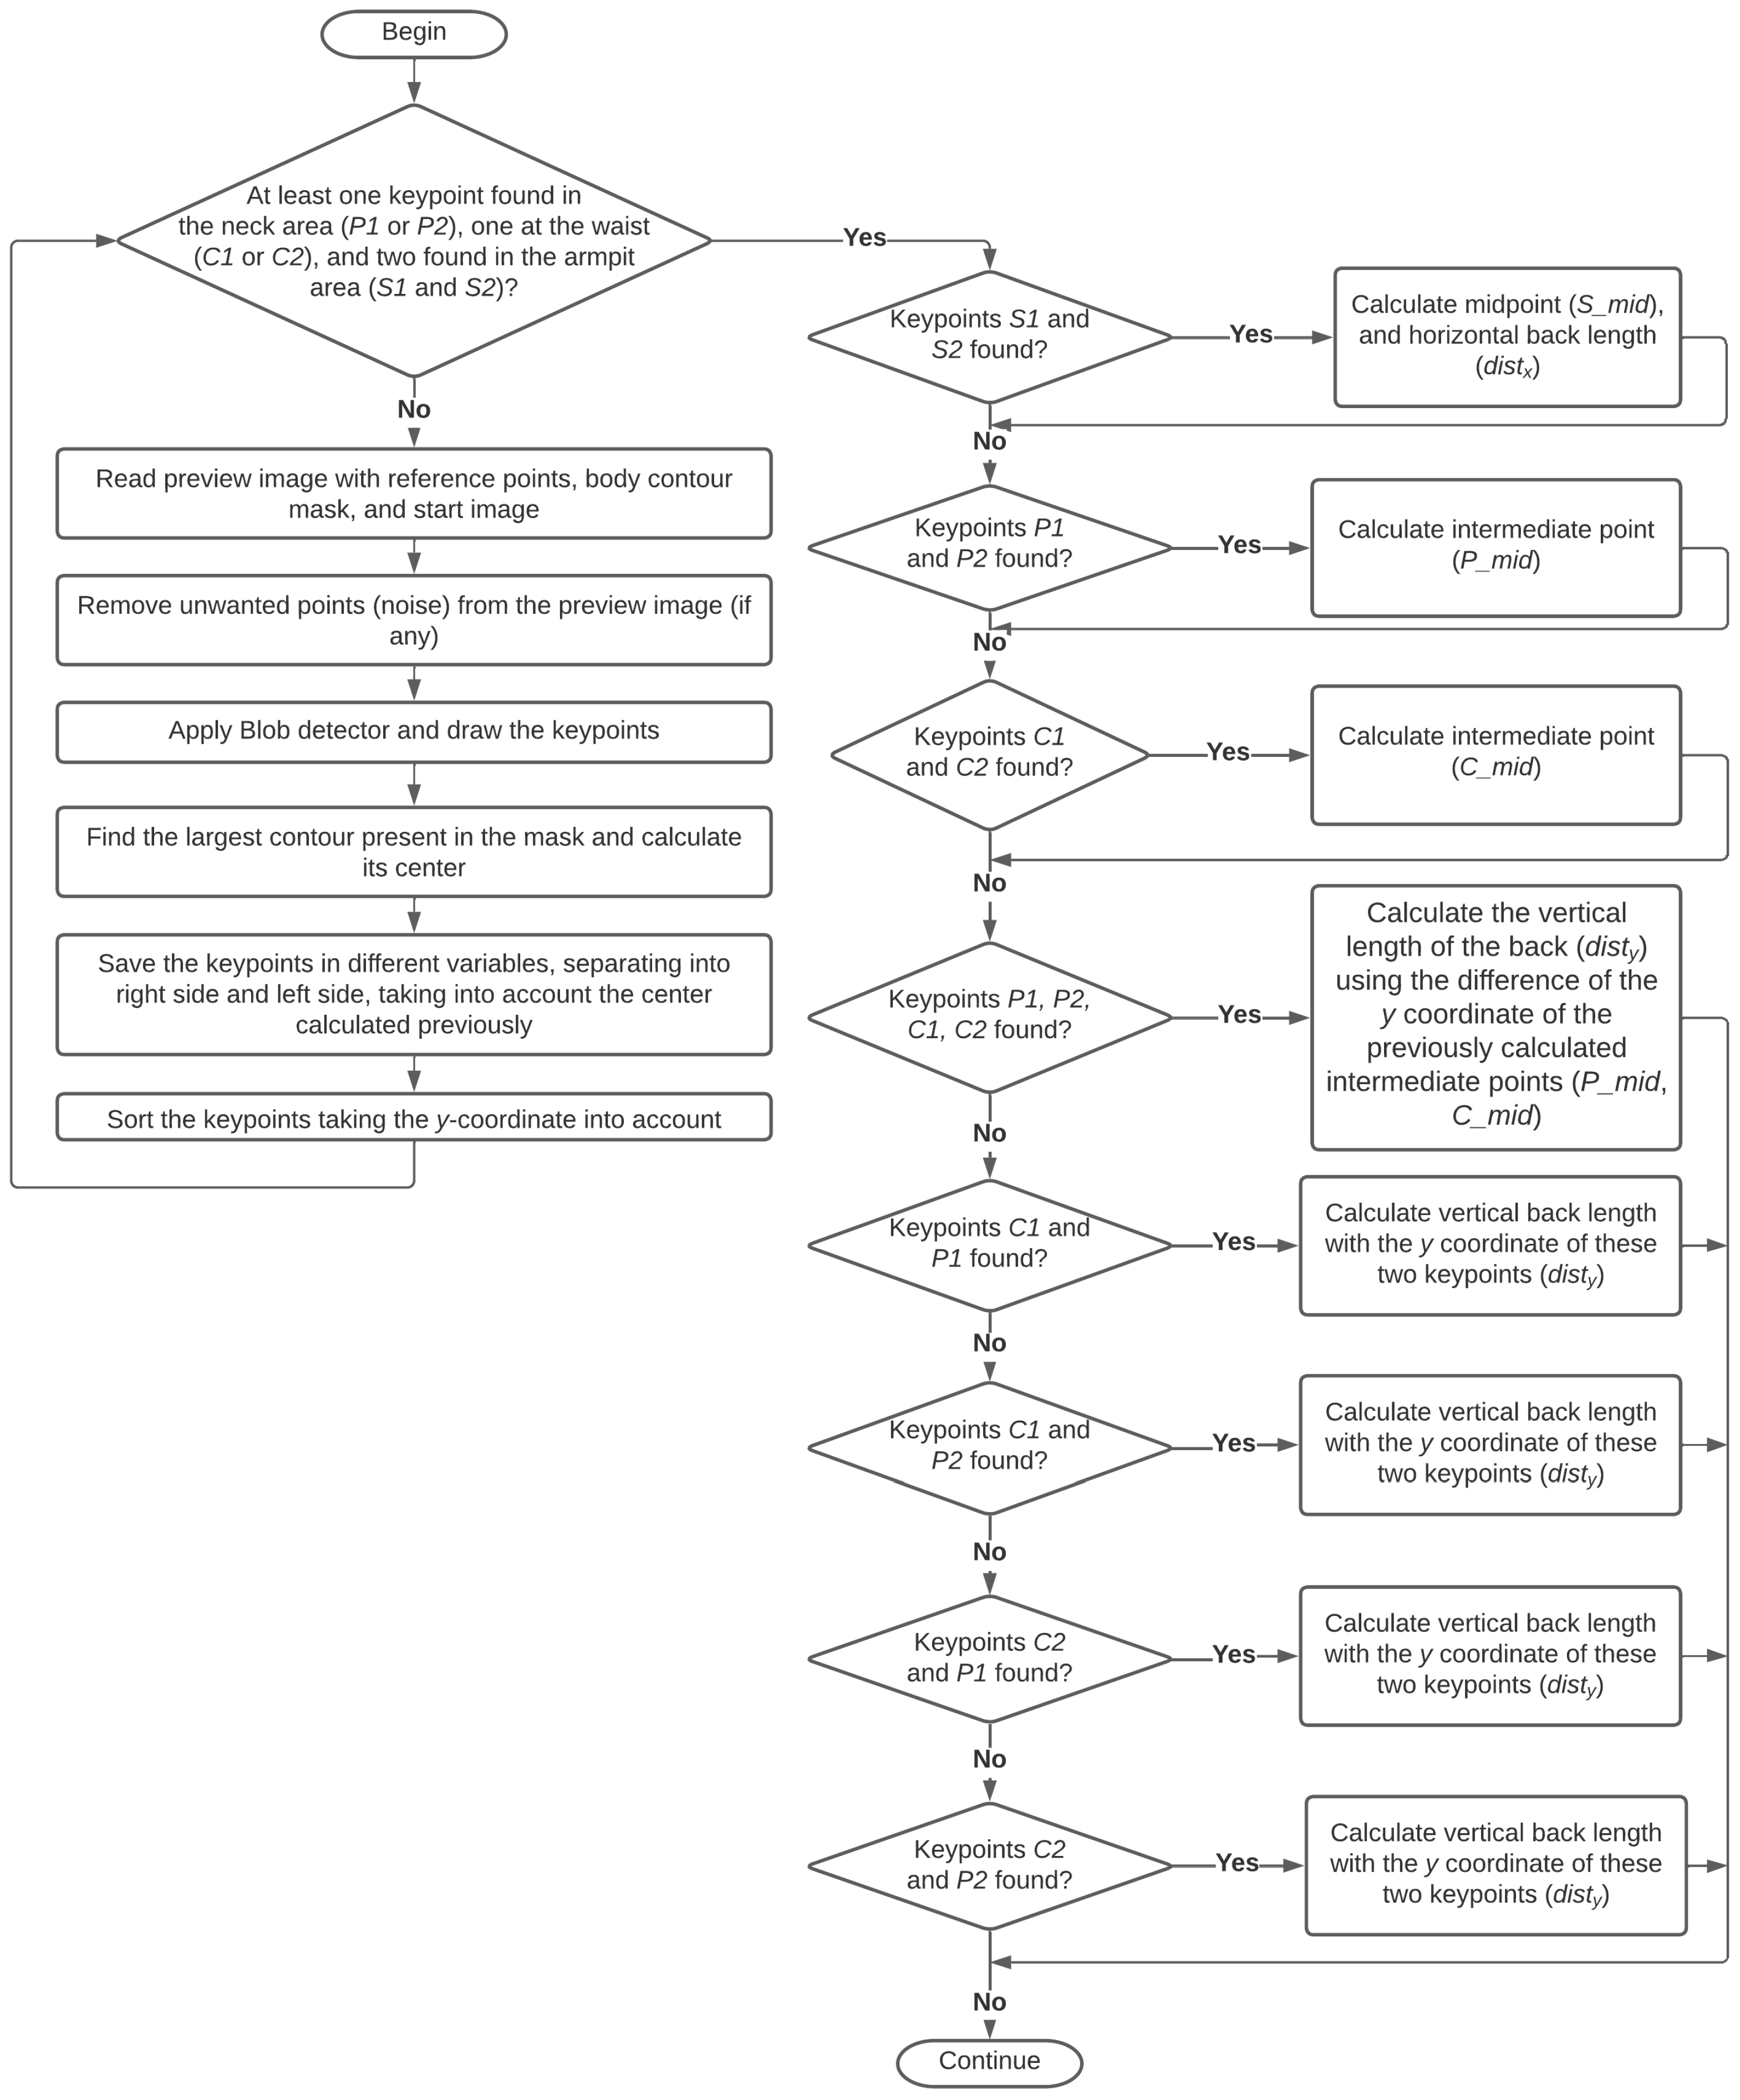
2.2.4. Calculation of the Points to Be Auscultated
- In the axilla area ( and ):
- –
- is computed the midpoint between points and (), and the horizontal length of the back through the x coordinate of these points (difference between these two points) ();
- In the neck area (, ):
- –
- is computed the midpoint between points and ();
- In the waist area ( and ):
- –
- is computed the midpoint between points and ();
- In the neck and waist area (, , and ):
- –
- is computed the vertical length of the back () by difference of the y coordinate of the intermediate points calculated earlier (, );
- Only at the neck and waist on the left side ( and ):
- –
- is computed the vertical length of the back using the y coordinate of these points and (the difference between these two points) ();
- Only at the neck on the right side and at the waist on the left side ( and ):
- –
- is computed the vertical length of the back through the y coordinate of these points and (difference between these two points) ();
- Only at the neck on the left side and at the waist on the right side ( and ):
- –
- is computed the vertical length of the back through the y coordinate of these points and (difference between these two points) ();
- Only at the neck and waist on the right side ( and ):
- –
- is computed the vertical length of the back through the y coordinate of these points and (difference between these two points) ();
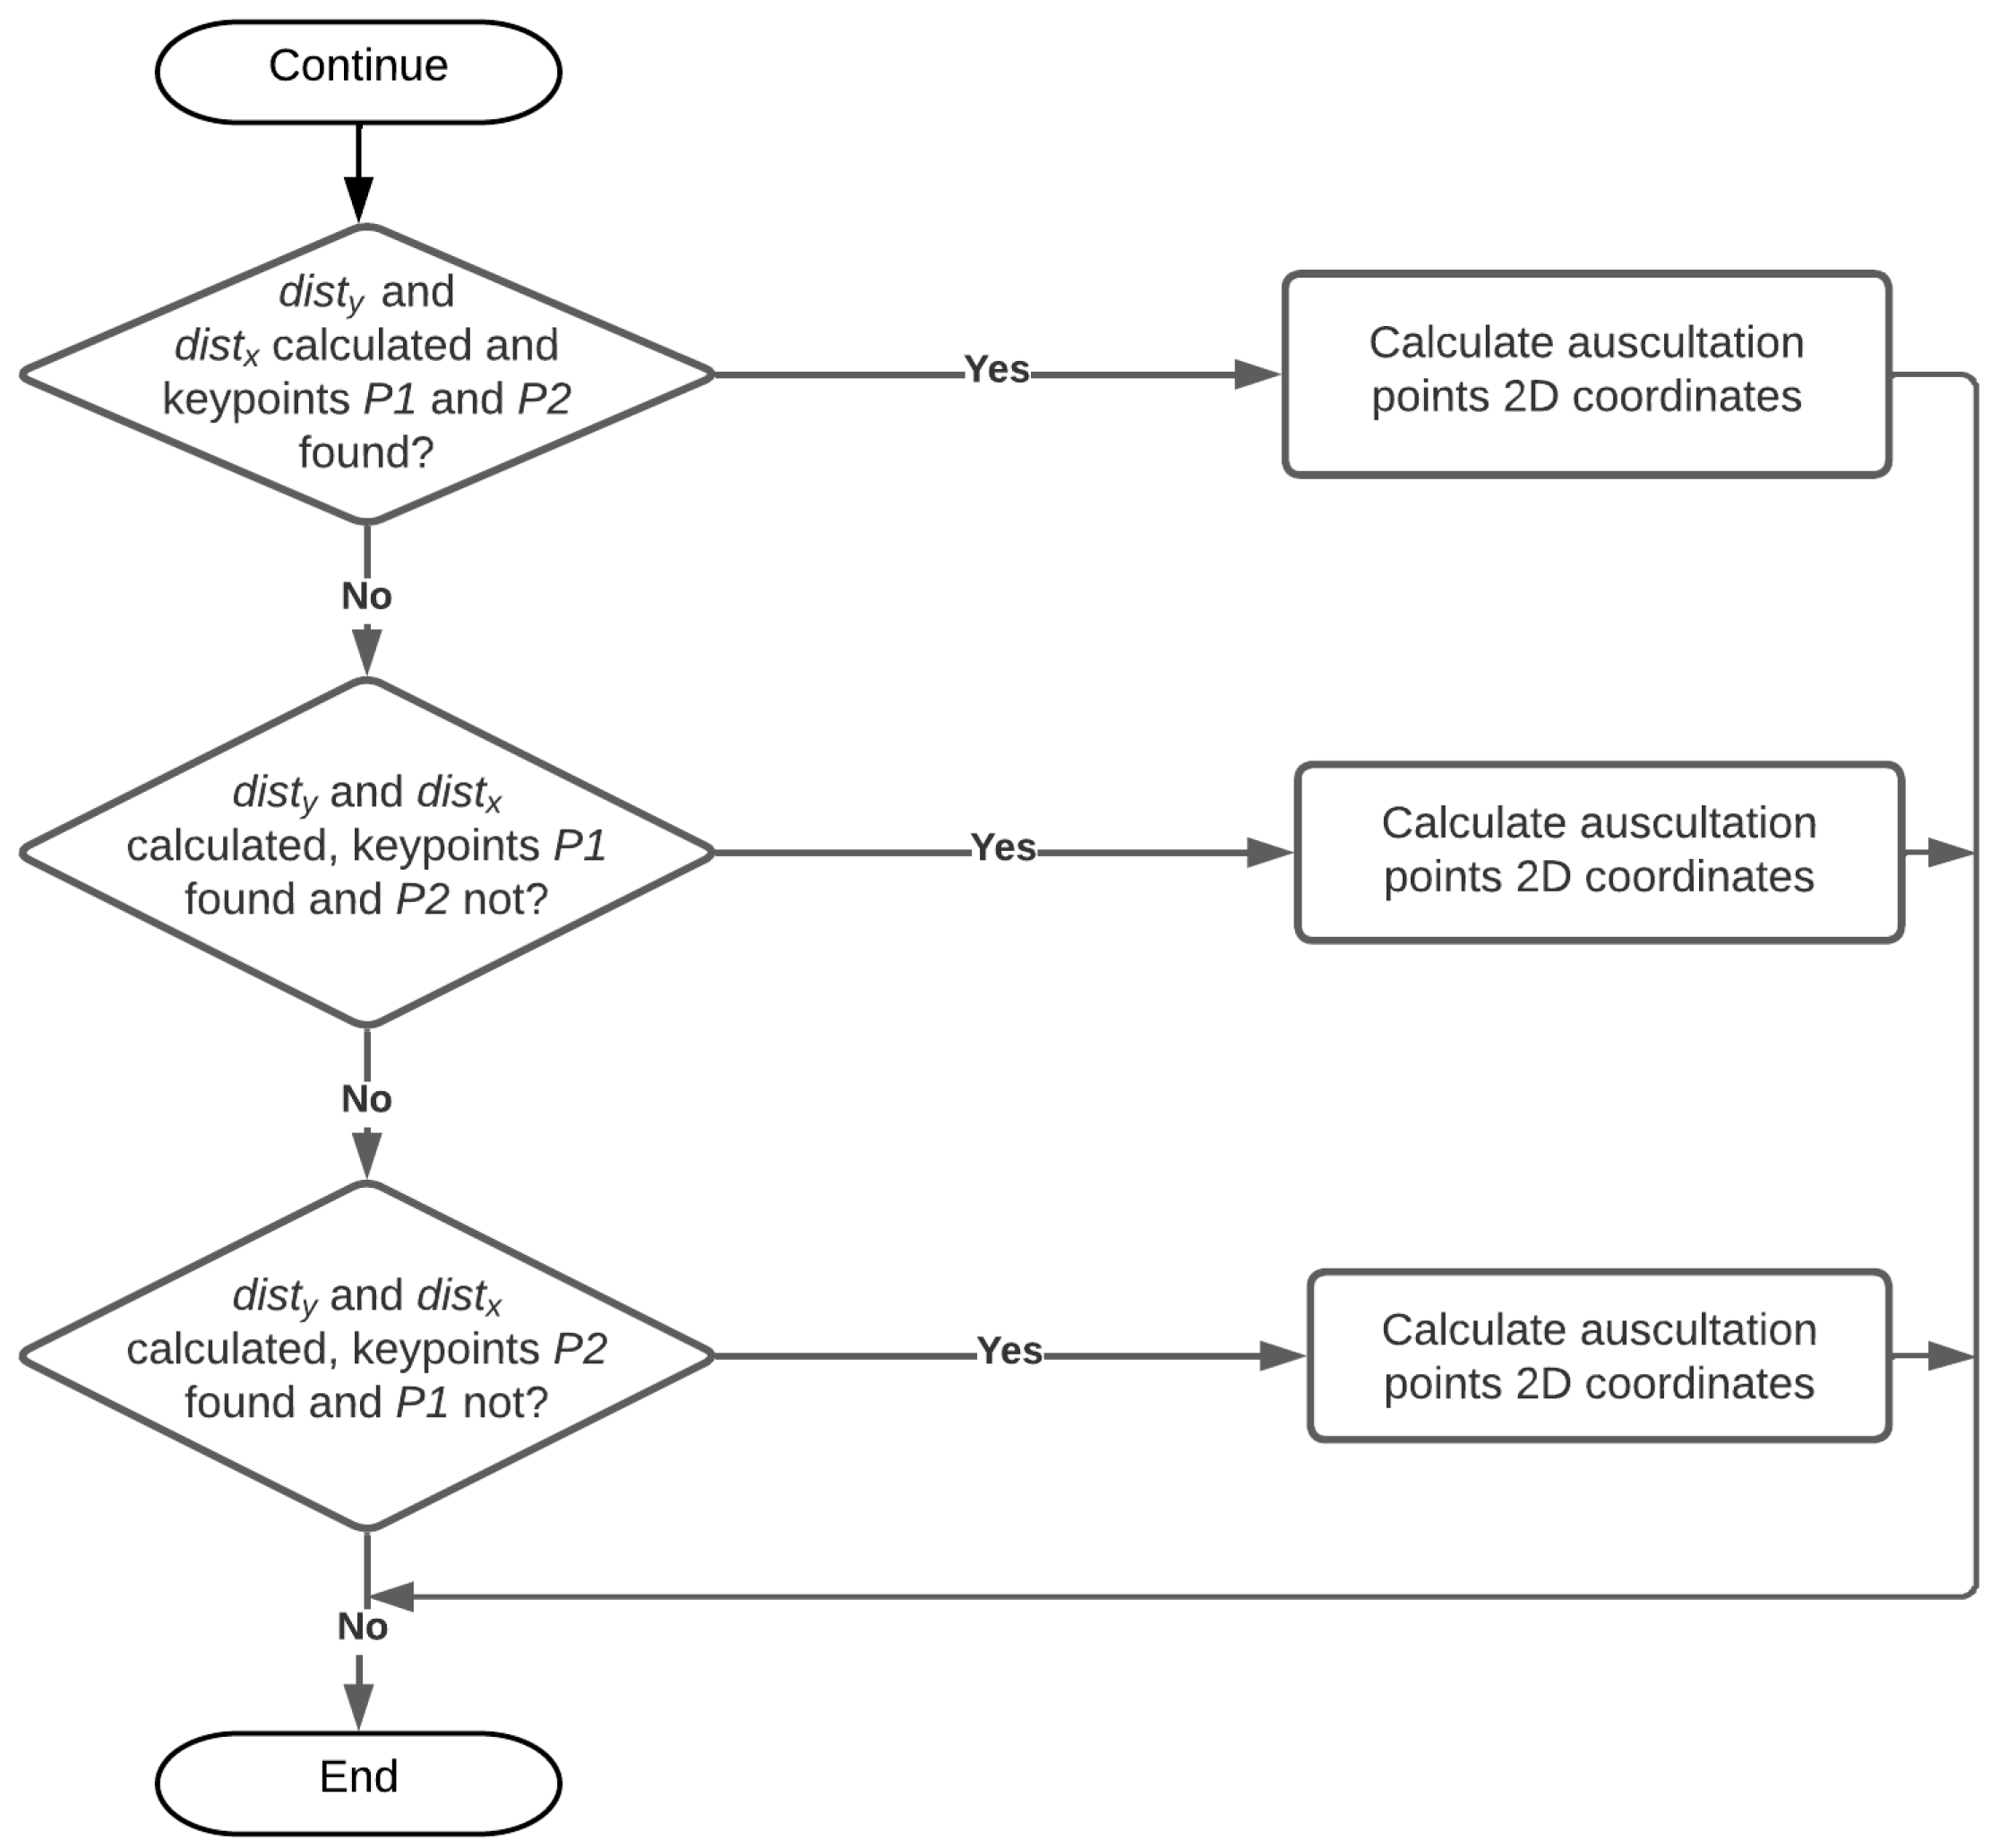
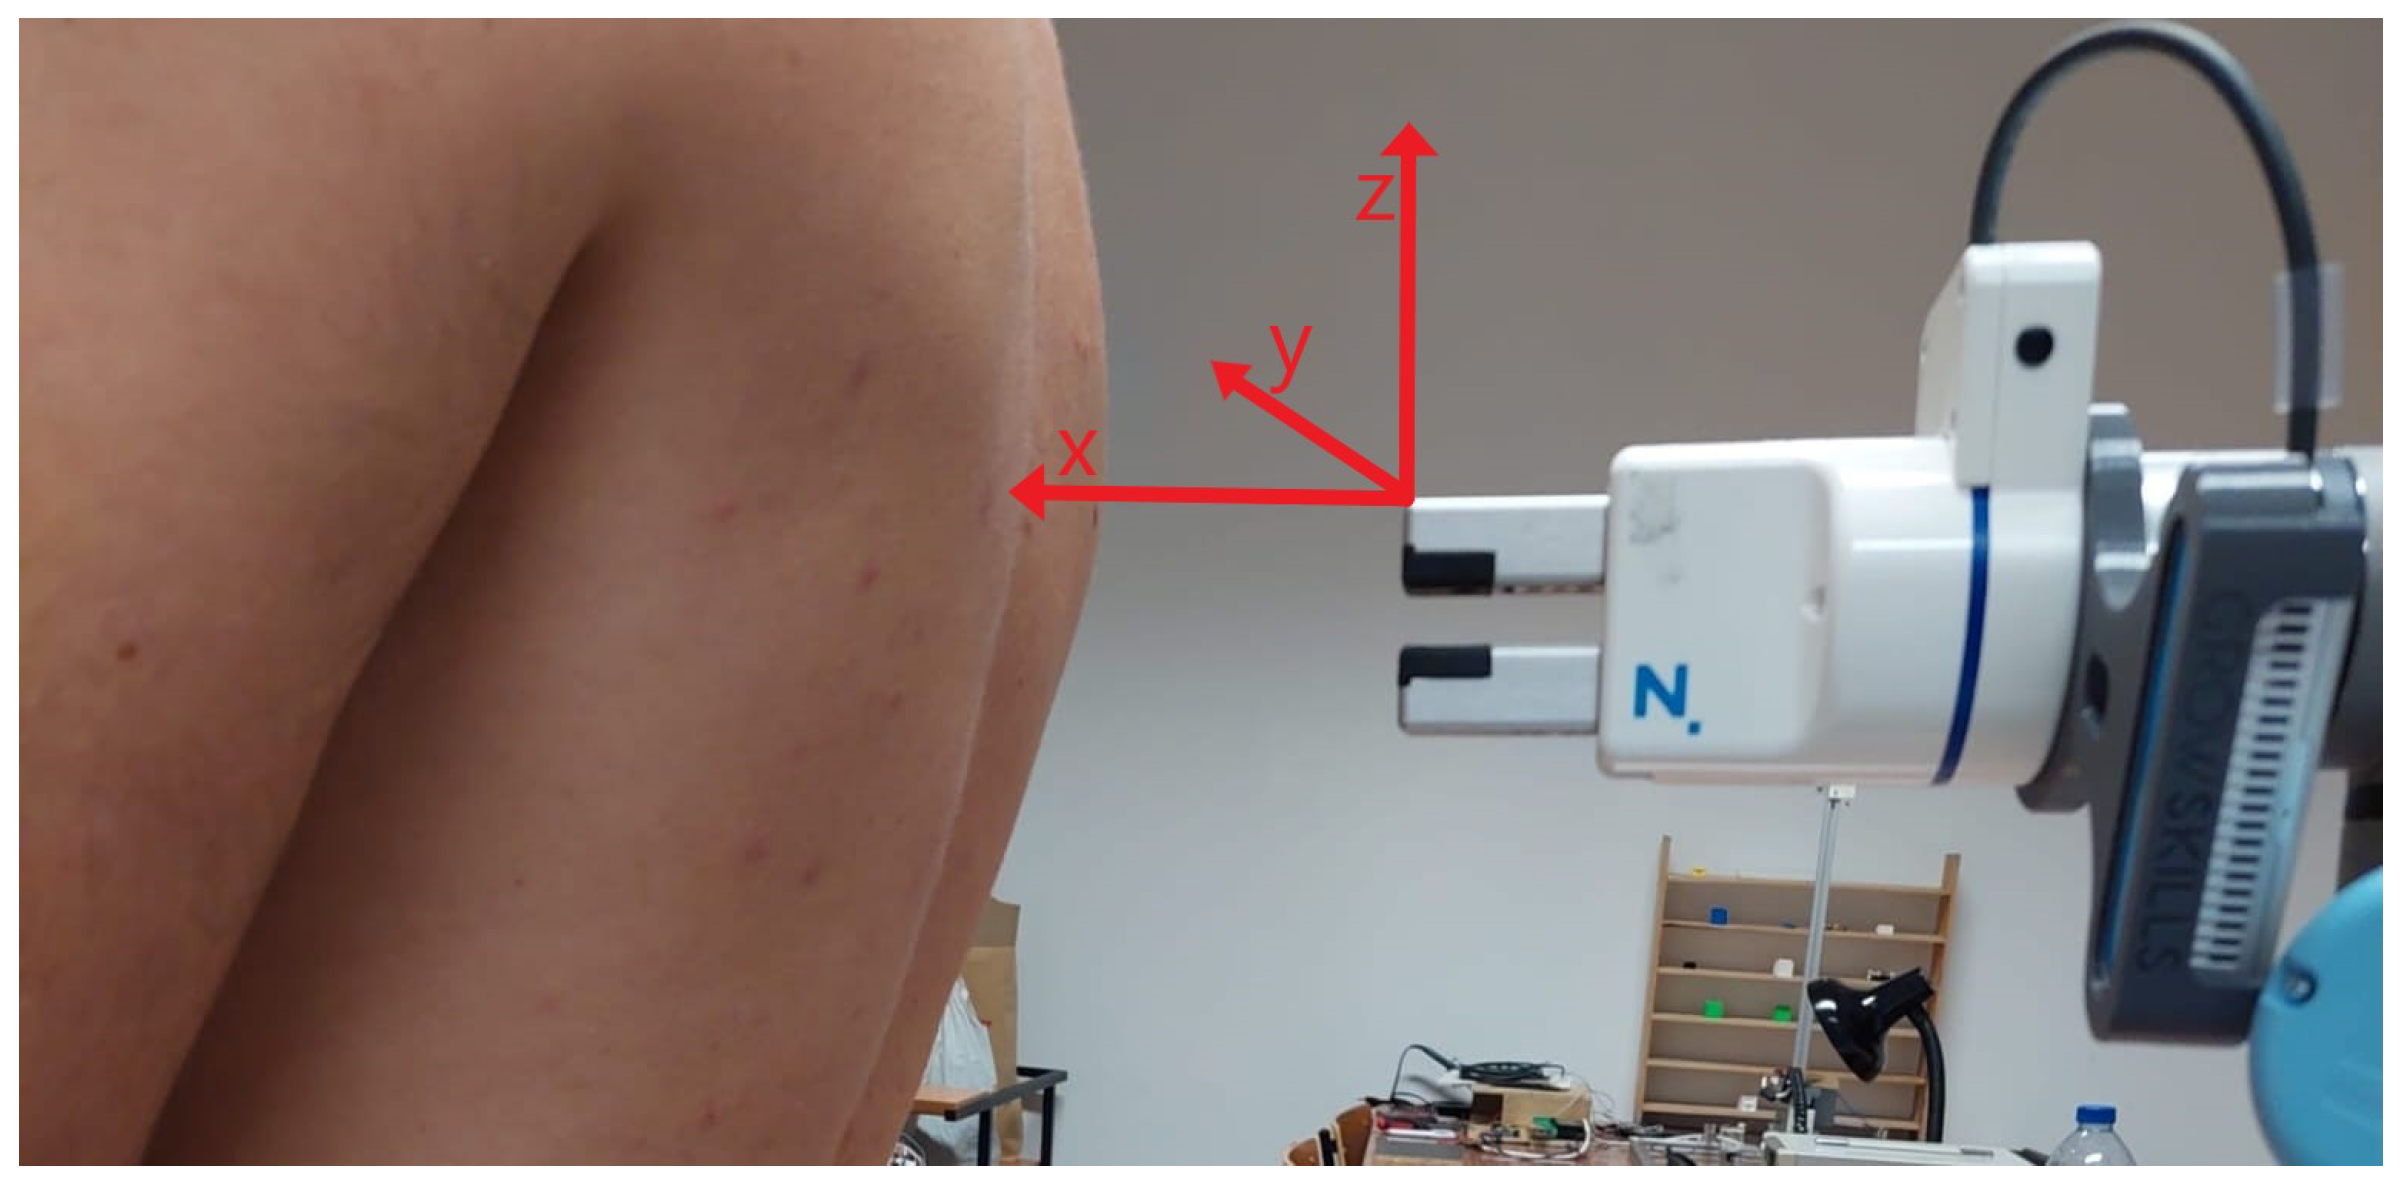
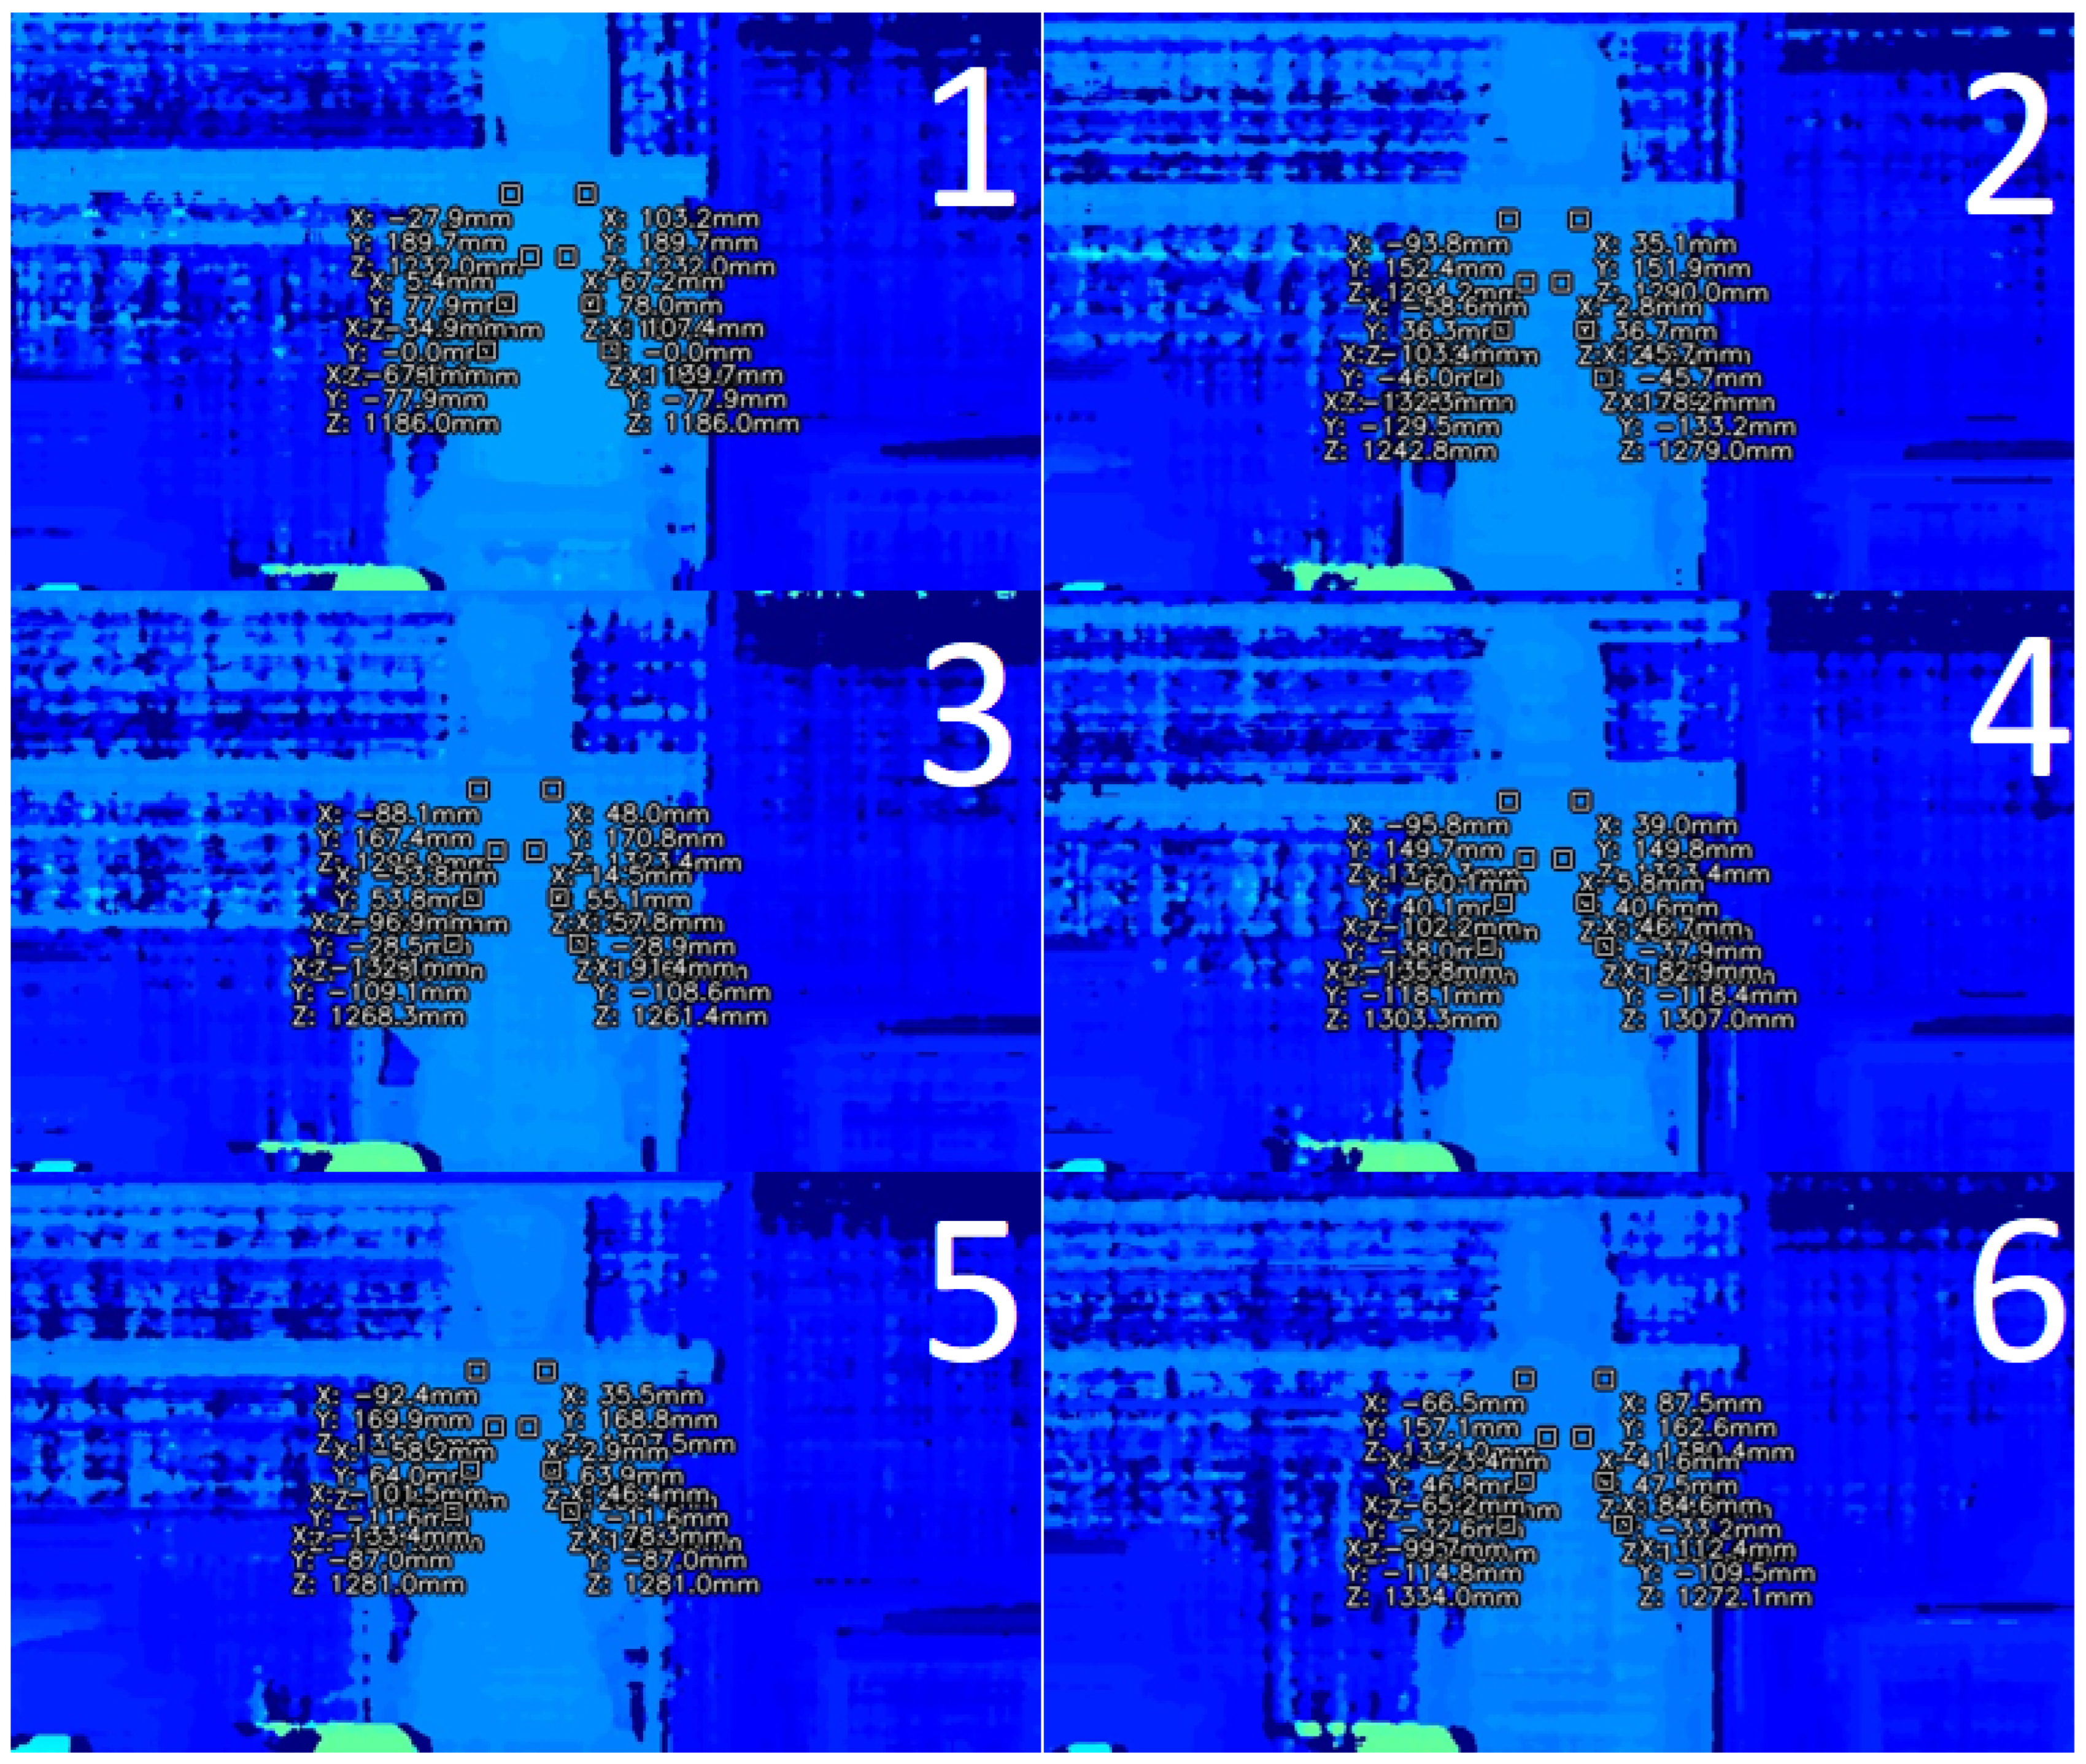
2.2.5. Calculation of the Auscultation Points 3D Spatial Coordinates
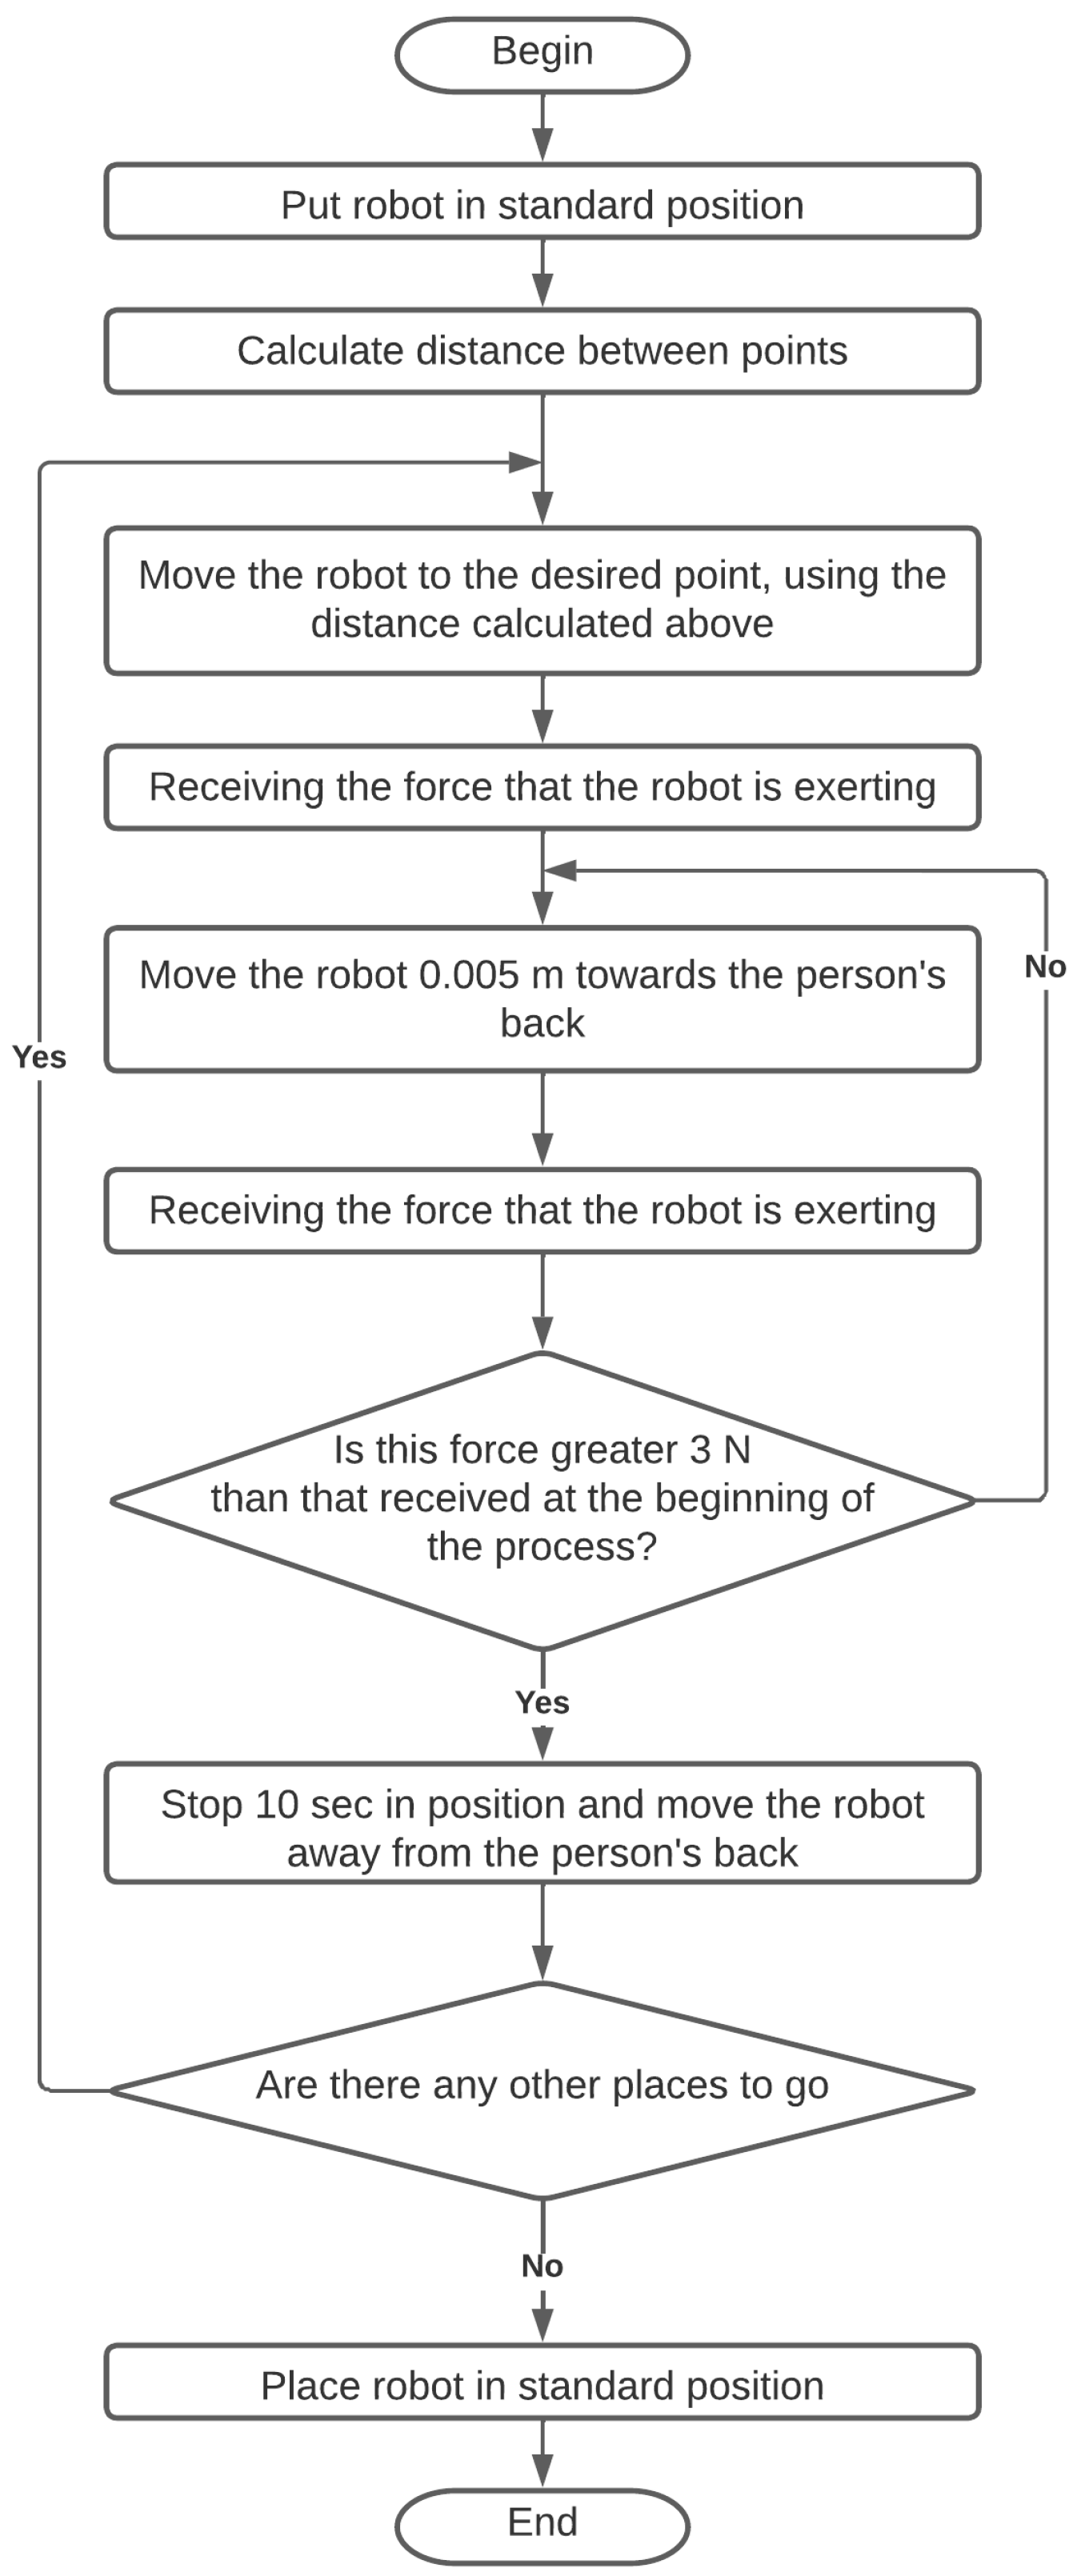
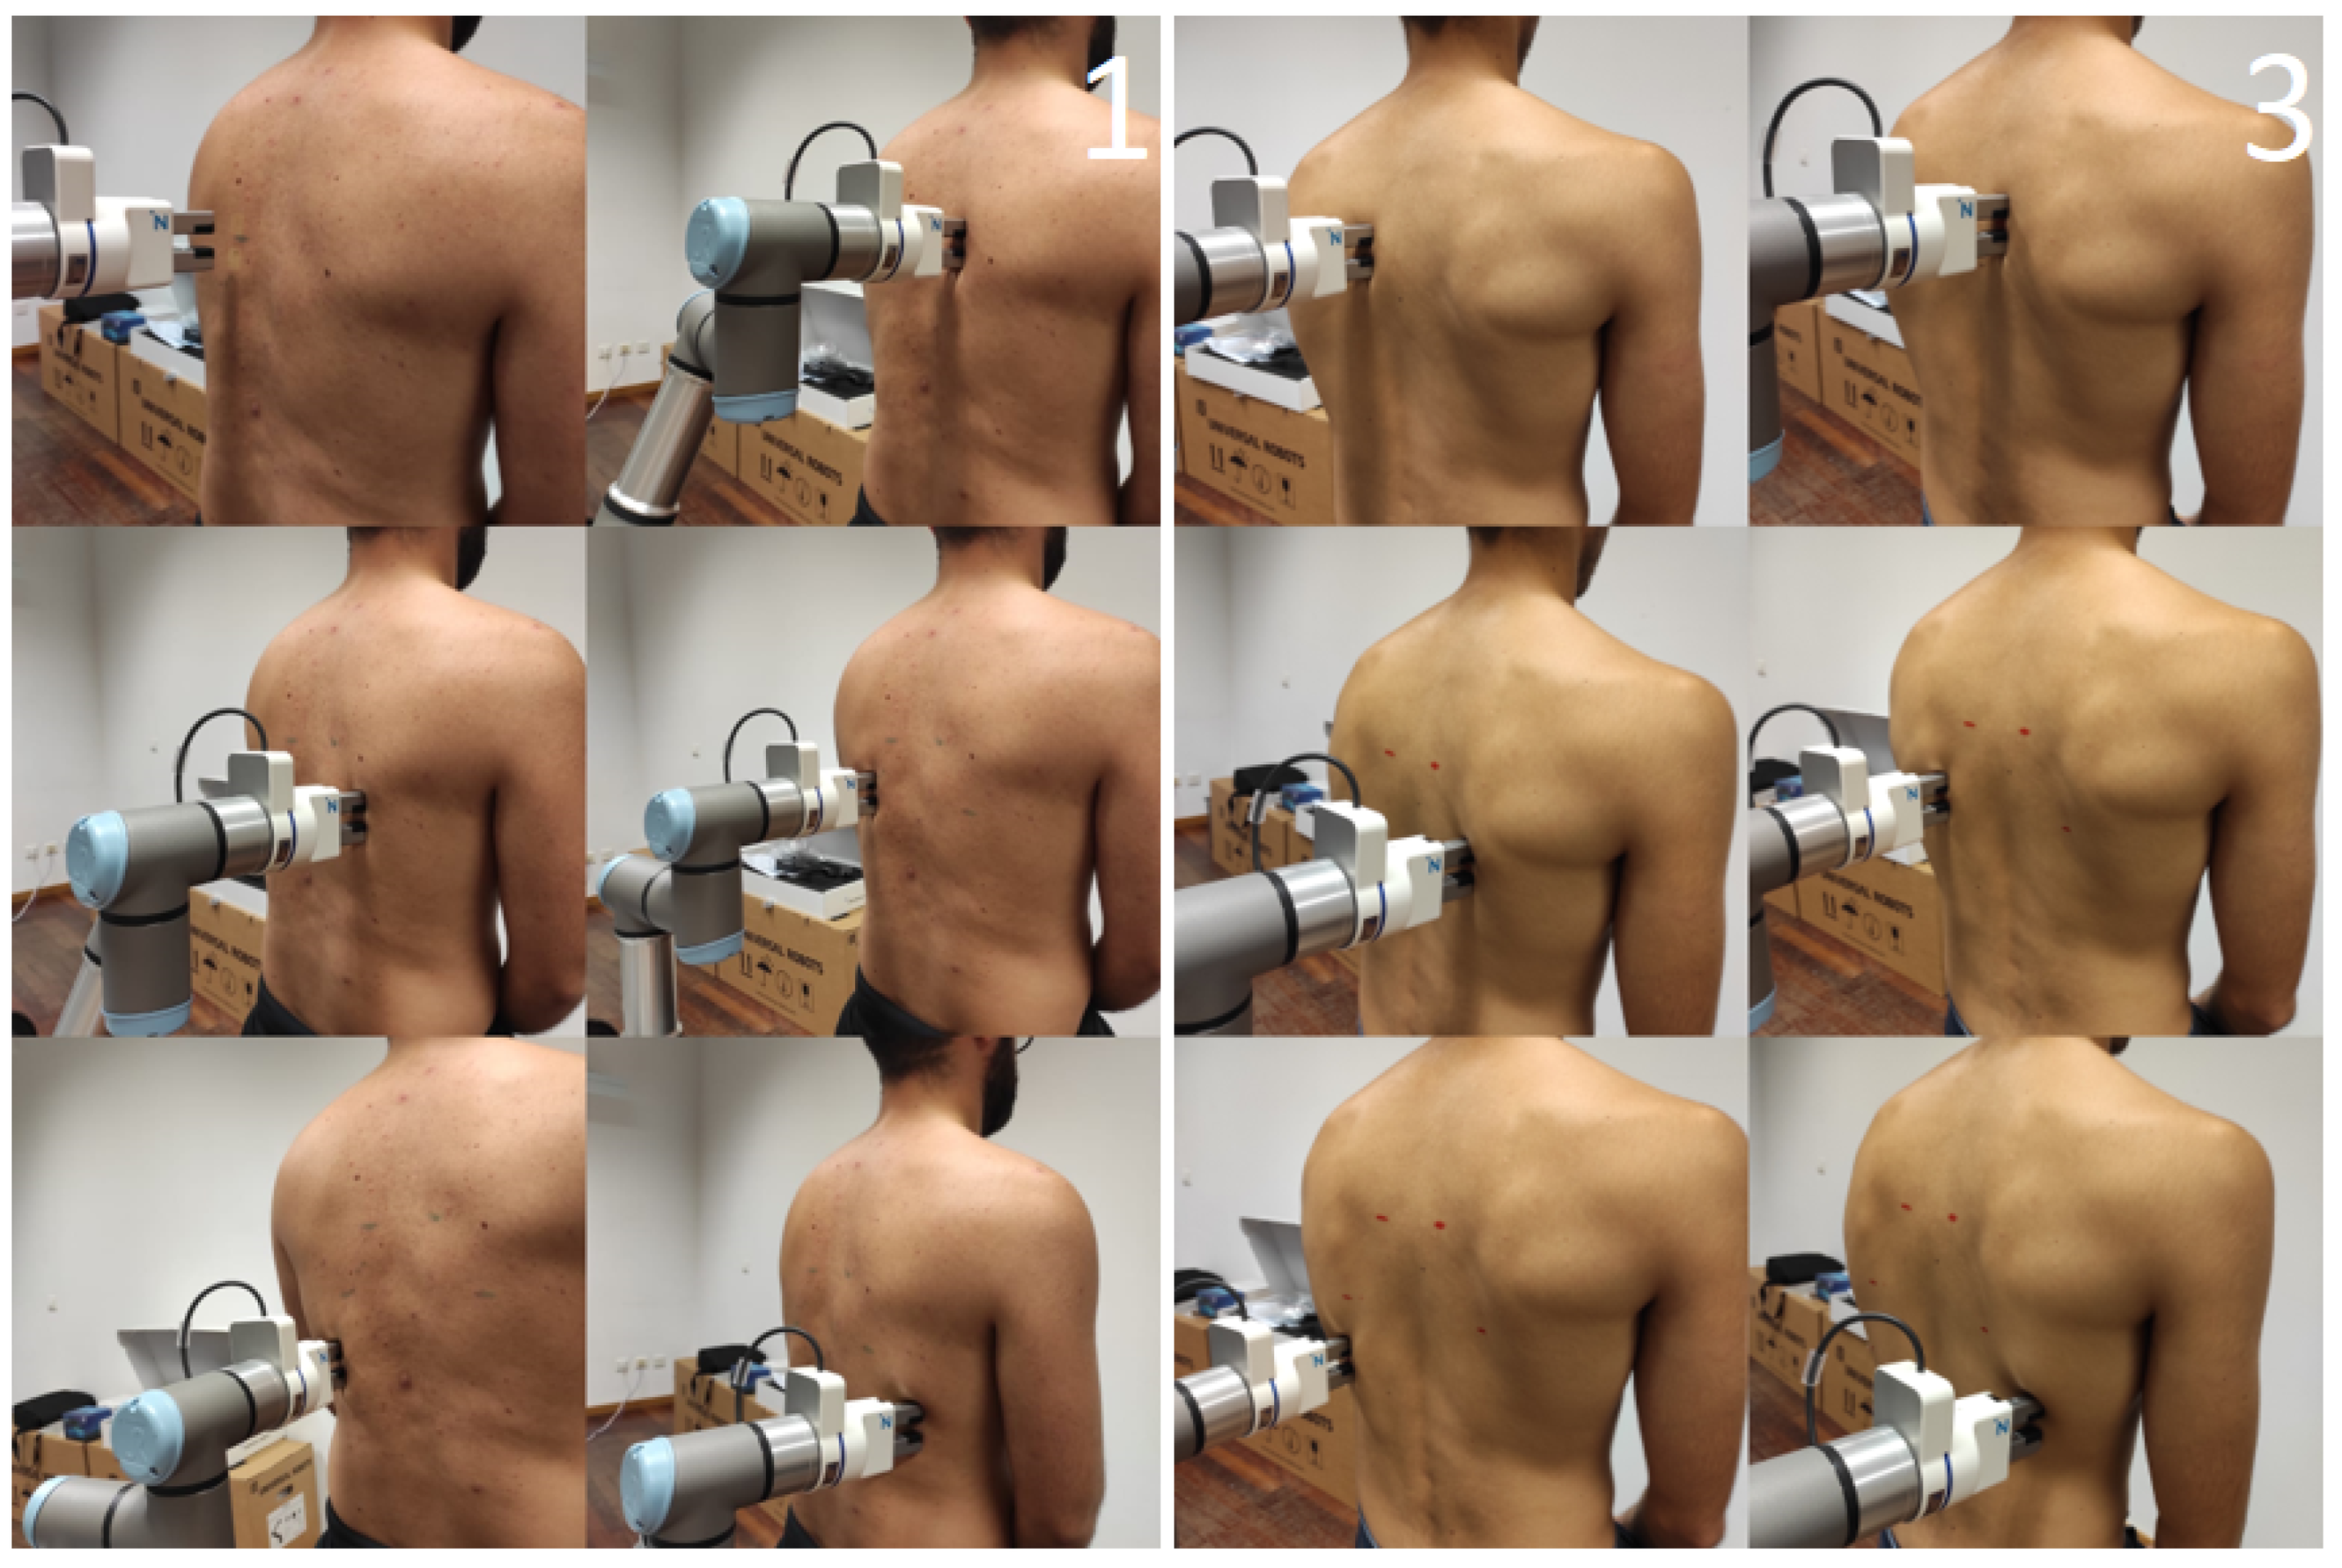
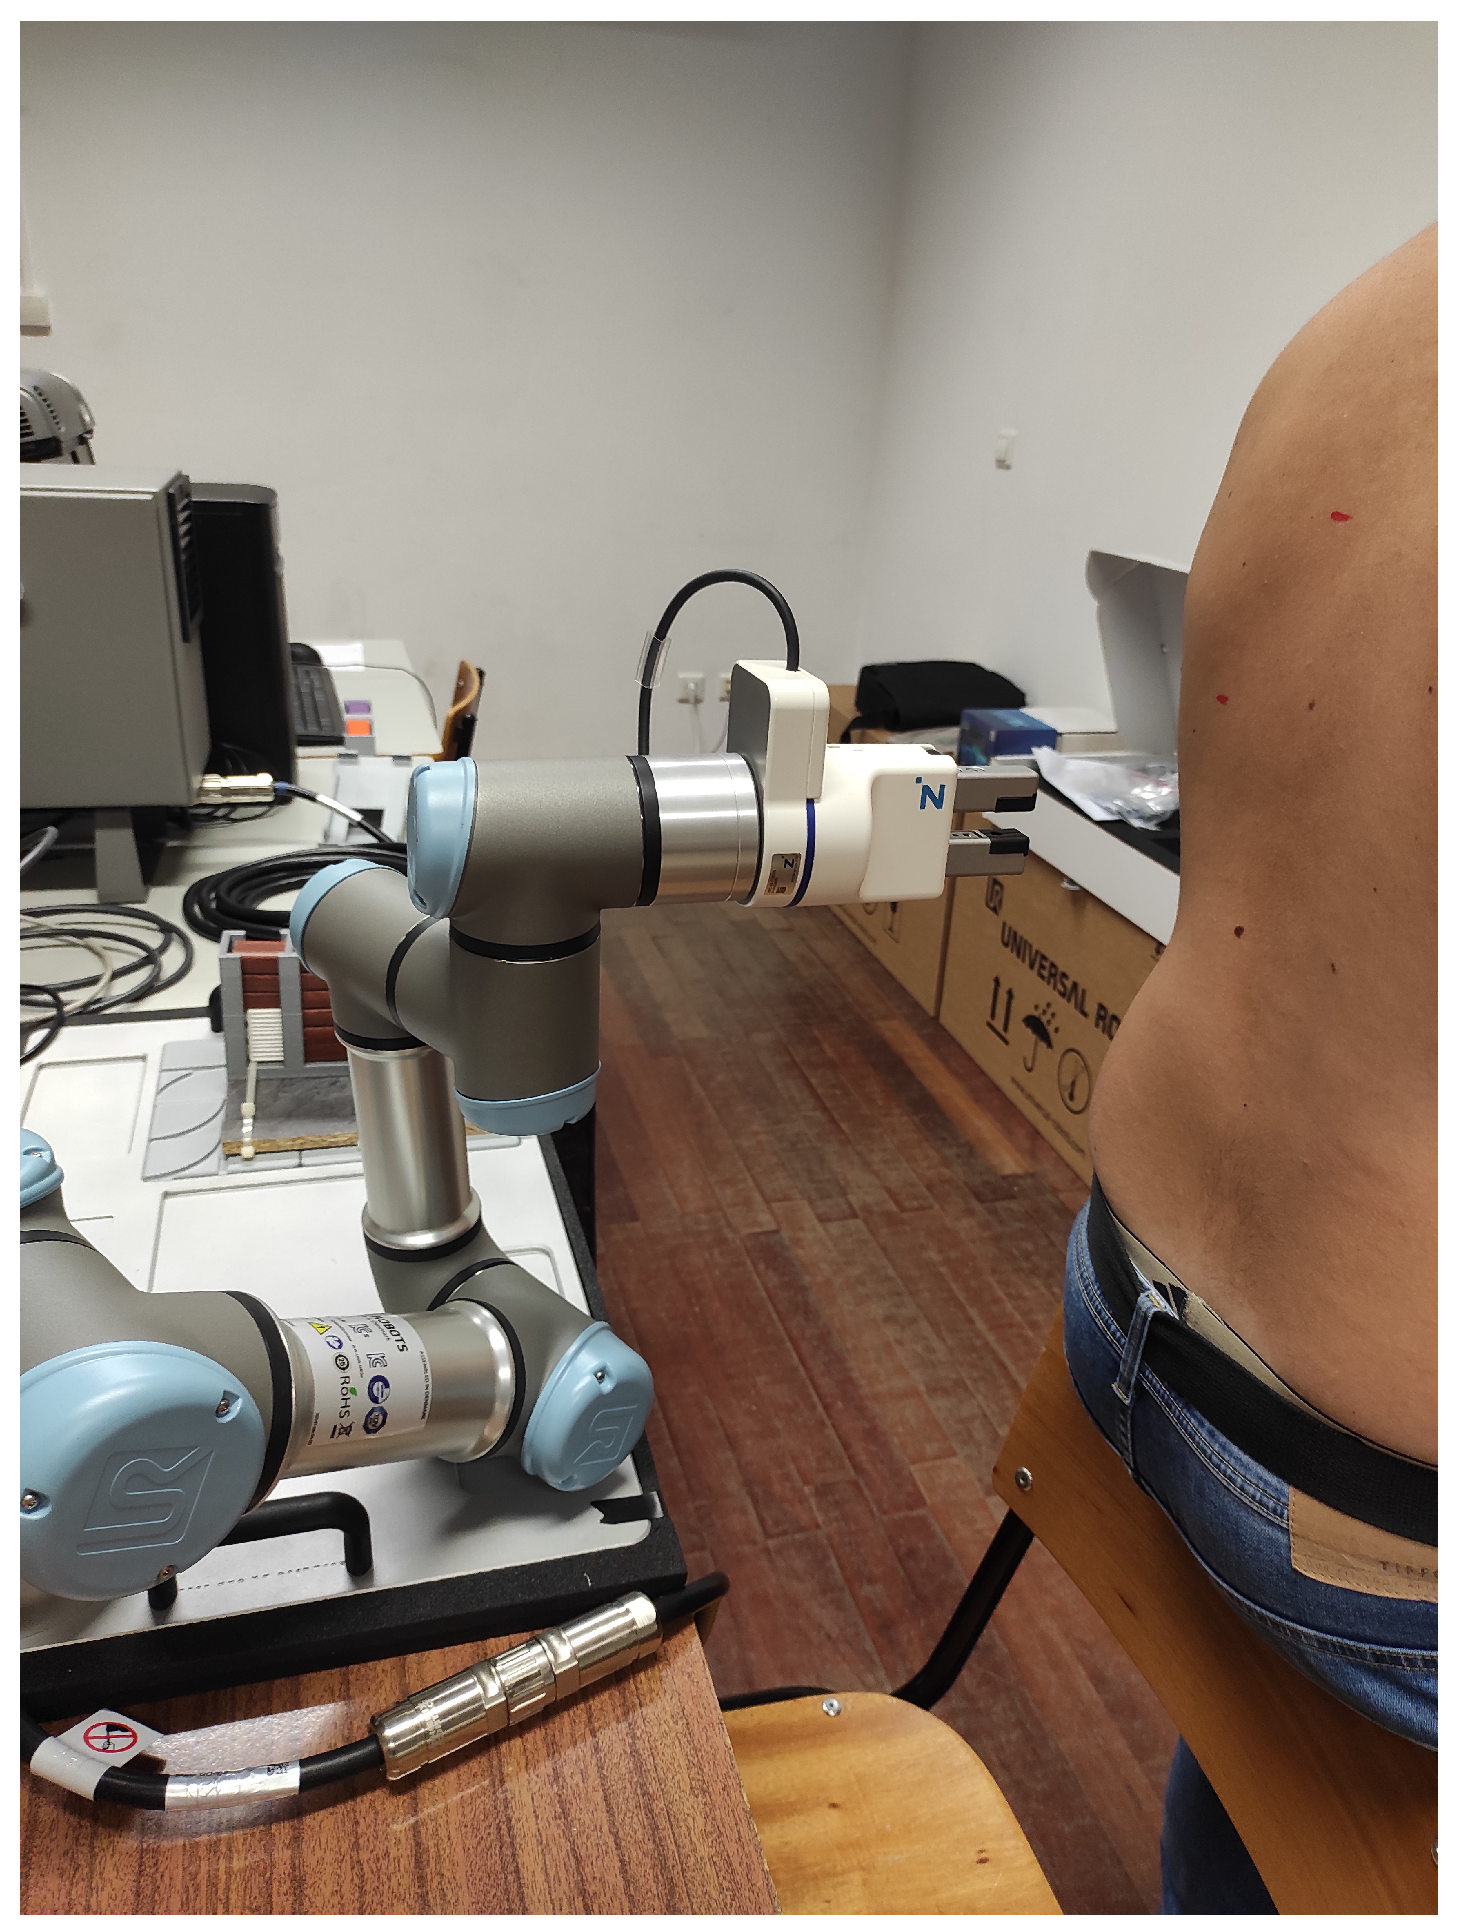
2.2.6. Performing the Auscultation
3. Results
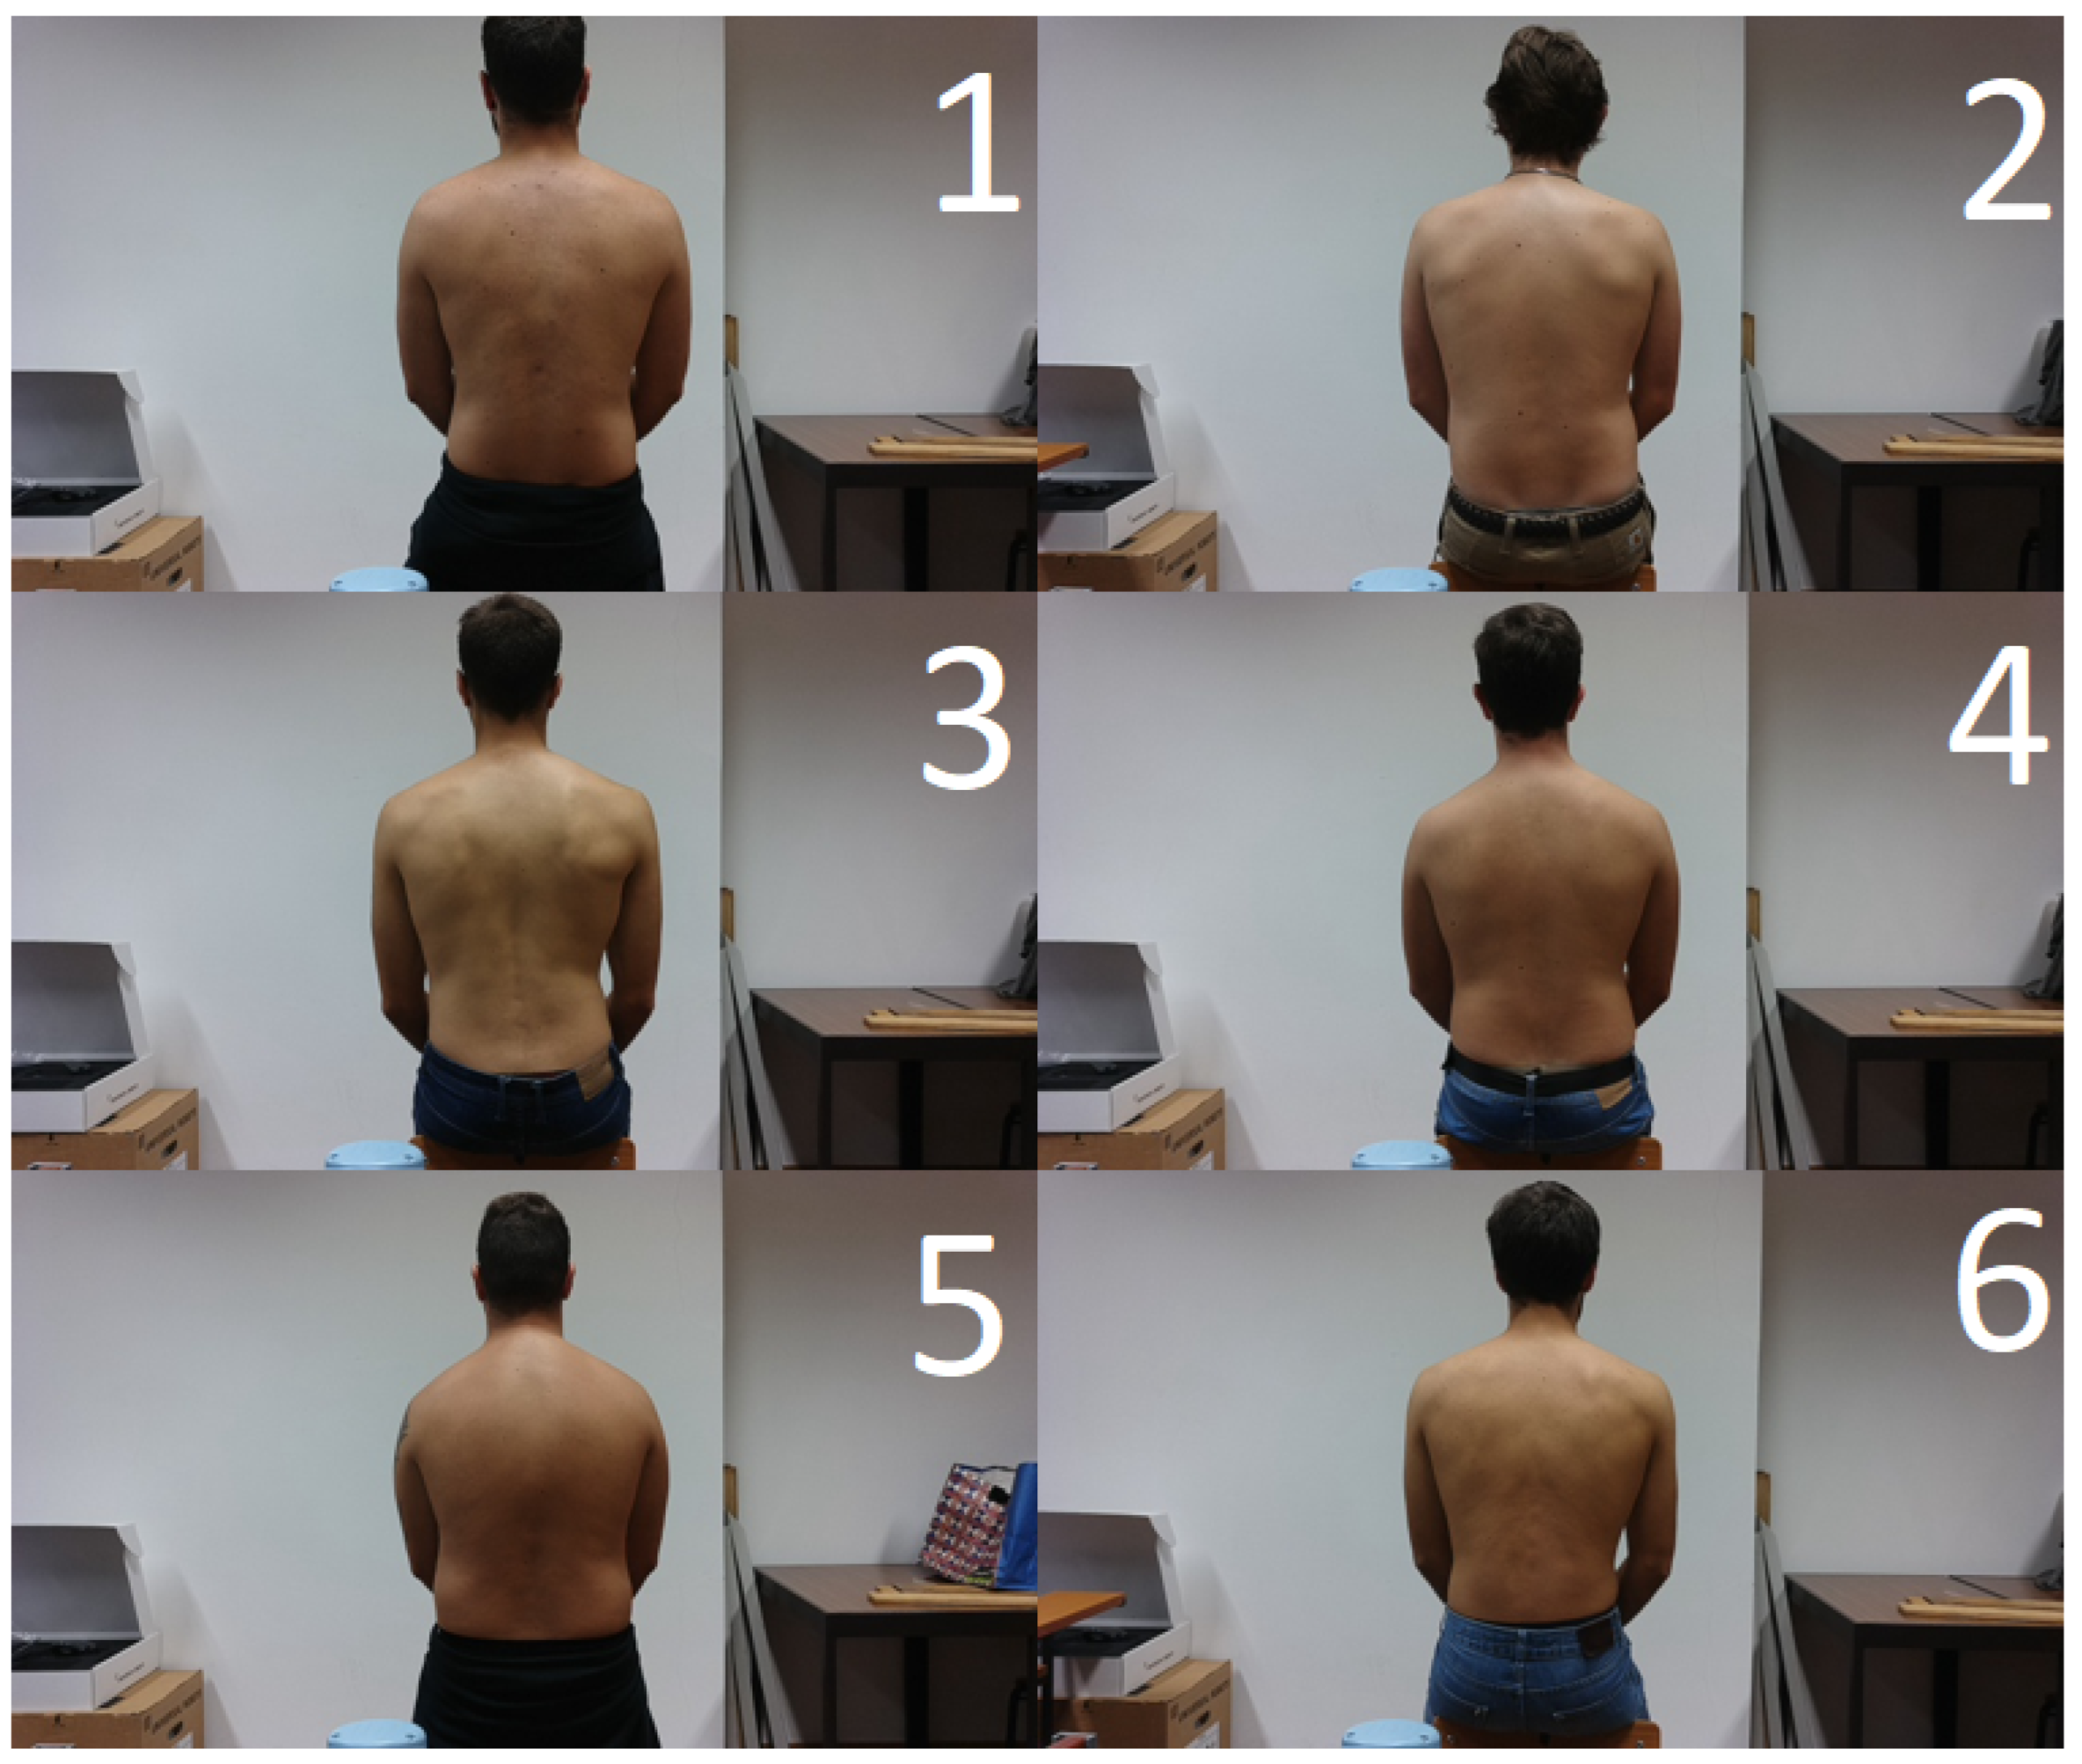
3.1. Vision Subsystem
3.2. Positioning Subsystem
4. Discussion
5. Conclusions
Author Contributions
Funding
Institutional Review Board Statement
Informed Consent Statement
Data Availability Statement
Conflicts of Interest
References
- Groover, M.P. Automation; Encyclopedia Britannica: Chicago, IL, USA, 2020. [Google Scholar]
- El Zaatari, S.; Marei, M.; Li, W.; Usman, Z. Cobot programming for collaborative industrial tasks: An overview. Robot. Auton. Syst. 2019, 116, 162–180. [Google Scholar] [CrossRef]
- Aaltonen, I.; Salmi, T. Experiences and expectations of collaborative robots in industry and academia: Barriers and development needs. Procedia Manuf. 2019, 38, 1151–1158. [Google Scholar] [CrossRef]
- Zayas-Cabán, T.; Haque, S.N.; Kemper, N. Identifying Opportunities for Workflow Automation in Health Care: Lessons Learned from Other Industries. Appl. Clin. Inform. 2021, 12, 686–697. [Google Scholar] [CrossRef]
- Dupont, P.E.; Nelson, B.J.; Goldfarb, M.; Hannaford, B.; Menciassi, A.; O’Malley, M.K.; Simaan, N.; Valdastri, P.; Yang, G.Z. A decade retrospective of medical robotics research from 2010 to 2020. Sci. Robot. 2021, 6, eabi8017. [Google Scholar] [CrossRef]
- Stumpo, V.; Staartjes, V.; Klukowska, A.; Kafai Golahmadi, A.; Gadjradj, P.; Schröder, M.; Veeravagu, A.; Stienen, M.; Serra, C.; Regli, L. Global adoption of robotic technology into neurosurgical practice and research. Neurosurg. Rev. 2021, 44, 1–13. [Google Scholar] [CrossRef]
- Athanasiou, A.; Xygonakis, I.; Pandria, N.; Kartsidis, P.; Arfaras, G.; Kavazidi, K.R.; Foroglou, N.; Astaras, A.; Bamidis, P. Towards Rehabilitation Robotics: Off-The-Shelf BCI Control of Anthropomorphic Robotic Arms. BioMed Res. Int. 2017, 2017, 5708937. [Google Scholar] [CrossRef] [PubMed] [Green Version]
- Montinari, M.R.; Minelli, S. The first 200 years of cardiac auscultation and future perspectives. J. Multidiscip. Healthc. 2019, 12, 183. [Google Scholar] [CrossRef] [PubMed] [Green Version]
- Ferlay, J.; Ervik, M.; Lam, F.; Colombet, M.; Mery, L.; Pineros, M. Global Cancer Observatory: Cancer Today; Technical Report; International Agency for Research on Cancer: Lyon, France, 2020. [Google Scholar]
- Alyafei, K.; Ahmed, R.; Abir, F.F.; Chowdhury, M.E.; Naji, K.K. A comprehensive review of COVID-19 detection techniques: From laboratory systems to wearable devices. Comput. Biol. Med. 2022, 149, 106070. [Google Scholar] [CrossRef] [PubMed]
- Huang, Y.; Meng, S.; Zhang, Y.; Wu, S.; Zhang, Y.; Zhang, Y.; Ye, Y.; Wei, Q.; Zhao, N.; Jiang, J.; et al. The respiratory sound features of COVID-19 patients fill gaps between clinical data and screening methods. medRXiv 2020. [Google Scholar] [CrossRef] [Green Version]
- Hirosawa, T.; Harada, Y.; Ikenoya, K.; Kakimoto, S.; Aizawa, Y.; Shimizu, T. The Utility of Real-Time Remote Auscultation Using a Bluetooth-Connected Electronic Stethoscope: Open-Label Randomized Controlled Pilot Trial. JMIR mHealth uHealth 2020, 9, e23109. [Google Scholar] [CrossRef]
- WHO. Chronic Obstructive Pulmonary Disease (COPD)—World Health Organization; Technical Report; World Health Organization: Geneva, Switzerland, 2022.
- Sarkar, M.; Madabhavi, I.V.; Niranjan, N.; Dogra, M. Auscultation of the respiratory system. Ann. Thorac. Med. 2015, 10, 158–168. [Google Scholar] [CrossRef]
- Rennoll, V.; McLane, I.; Emmanouilidou, D.; West, J.; Elhilali, M. Electronic Stethoscope Filtering Mimics the Perceived Sound Characteristics of Acoustic Stethoscope. IEEE J. Biomed. Health Inform. 2021, 25, 1542–1549. [Google Scholar] [CrossRef] [PubMed]
- Nowak, L.; Nowak, K. Sound differences between electronic and acoustic stethoscopes. BioMedical Eng. OnLine 2018, 17, 104. [Google Scholar] [CrossRef] [Green Version]
- Kalinauskienė, E.; Razvadauskas, H.; Morse, D.; Maxey, G.; Naudžiūnas, A. A Comparison of Electronic and Traditional Stethoscopes in the Heart Auscultation of Obese Patients. Medicina 2019, 55, 94. [Google Scholar] [CrossRef] [PubMed] [Green Version]
- Leng, S.; Tan, R.S.; Chai, K.T.C.; Wang, C.; Ghista, D.N.; Zhong, L. The electronic stethoscope. BioMedical Eng. OnLine 2015, 14, 66. [Google Scholar] [CrossRef] [Green Version]
- OECD. Health Statistics; Technical Report; OECD: Paris, France, 2022. [Google Scholar]
- Ma, Y.; Xu, X.; Yu, Q.; Zhang, Y.; Li, Y.; Zhao, J.; Wang, G. LungBRN: A Smart Digital Stethoscope for Detecting Respiratory Disease Using bi-ResNet Deep Learning Algorithm. In Proceedings of the 2019 IEEE Biomedical Circuits and Systems Conference (BioCAS), Nara, Japan, 17–19 October 2019; pp. 1–4. [Google Scholar] [CrossRef]
- Kim, Y.; Hyon, Y.; Lee, S.; Woo, S.D.; Ha, T.; Chung, C. The coming era of a new auscultation system for analyzing respiratory sounds. BMC Pulm. Med. 2022, 22, 119. [Google Scholar] [CrossRef] [PubMed]
- Liu, J.X.; Goryakin, Y.; Maeda, A.; Bruckner, T.; Scheffler, R. Global Health Workforce Labor Market Projections for 2030. Hum Resour Health. Hum. Resour. Health 2017, 15, 11. [Google Scholar] [CrossRef] [Green Version]
- Tsumura, R.; Koseki, Y.; Nitta, N.; Yoshinaka, K. Towards fully automated robotic platform for remote auscultation. Int. J. Med. Robot. Comput. Assist. Surg. 2022, 19, e2461. [Google Scholar] [CrossRef]
- Zhu, Y.; Smith, A.; Hauser, K. Automated Heart and Lung Auscultation in Robotic Physical Examinations. IEEE Robot. Autom. Lett. 2022, 7, 4204–4211. [Google Scholar] [CrossRef]
- UR3e Technical Specifications. Available online: https://www.universal-robots.com/media/1807464/ur3e-rgb-fact-sheet-landscape-a4.pdf (accessed on 18 January 2023 ).
- UR3e Collaborative Robot Arm That Automates Almost Anything. Available online: https://www.universal-robots.com/products/ur3-robot/ (accessed on 18 January 2023).
- OAK-D—DepthAI Hardware Documentation 1.0.0 Documentation. Available online: https://docs.luxonis.com/projects/hardware/en/latest/pages/BW1098OAK.html (accessed on 18 January 2023).
- Ronneberger, O.; Fischer, P.; Brox, T. U-Net: Convolutional Networks for Biomedical Image Segmentation; Springer: Cham, Switzerland, 2015. [Google Scholar] [CrossRef]
- Long, J.; Shelhamer, E.; Darrell, T. Fully Convolutional Networks for Semantic Segmentation. In Proceedings of the IEEE Conference on Computer Vision and Pattern Recognition, Boston, MA, USA, 7–12 June 2015. [Google Scholar] [CrossRef]
- Sandler, M.; Howard, A.; Zhu, M.; Zhmoginov, A.; Chen, L.C. MobileNetV2: Inverted Residuals and Linear Bottlenecks. In Proceedings of the IEEE Conference on Computer Vision and Pattern Recognition, Salt Lake City, UT, USA, 18–23 June 2018. [Google Scholar] [CrossRef]
- Jing, J.; Wang, Z.; Rätsch, M.; Zhang, H. Mobile-Unet: An efficient convolutional neural network for fabric defect detection. Text. Res. J. 2020, 92, 004051752092860. [Google Scholar] [CrossRef]
- Perez, L.; Wang, J. The Effectiveness of Data Augmentation in Image Classification using Deep Learning. arXiv 2017, arXiv:1712.04621. [Google Scholar] [CrossRef]
- Yang, S.; Xiao, W.; Zhang, M.; Guo, S.; Zhao, J.; Shen, F. Image Data Augmentation for Deep Learning: A Survey. arXiv 2022, arXiv:2204.08610. [Google Scholar] [CrossRef]
- Kingma, D.P.; Ba, J. Adam: A Method for Stochastic Optimization. arXiv 2014, arXiv:1412.6980. [Google Scholar]
- Sudre, C.H.; Li, W.; Vercauteren, T.; Ourselin, S.; Cardoso, M.J. Generalised Dice Overlap as a Deep Learning Loss Function for Highly Unbalanced Segmentations. In Deep Learning in Medical Image Analysis and Multimodal Learning for Clinical Decision Support; Springer International Publishing: Berlin/Heidelberg, Germany, 2017; pp. 240–248. [Google Scholar] [CrossRef] [Green Version]
- Robots, U. The URScript Programming Language, 2019. Available online: https://www.universal-robots.com/download/manuals-e-series/user/ur3e/513/user-manual-ur3e-e-series-sw-513-portuguese-pt/ (accessed on 18 January 2023).
- GitHub—Depthai-Experiments/Gen2-Calc-Spatials-on-Host at Master·Luxonis/Depthai-Experiments. Available online: https://github.com/luxonis/depthai-experiments/tree/master/gen2-calc-spatials-on-host#calculate-spatial-coordinates-on-the-host (accessed on 30 July 2022).
- Chen, D.; Xuan, W.; Gu, Y.; Liu, F.; Chen, J.; Xia, S.; Jin, H.; Dong, S.; Luo, J. Automatic Classification of Normal–Abnormal Heart Sounds Using Convolution Neural Network and Long-Short Term Memory. Electronics 2022, 11, 1246. [Google Scholar] [CrossRef]
- Rocha, B.M.; Pessoa, D.; Marques, A.; Carvalho, P.; Paiva, R.P. Automatic Classification of Adventitious Respiratory Sounds: A (Un)Solved Problem? Sensors 2020, 21, 57. [Google Scholar] [CrossRef] [PubMed]


| Val_loss | Loss | Accuracy | F1-Score | Jaccard | Recall | Precision |
|---|---|---|---|---|---|---|
| 0.338 | 0.162 | 0.9973 | 0.713 | 0.557 | 0.654 | 0.805 |
Disclaimer/Publisher’s Note: The statements, opinions and data contained in all publications are solely those of the individual author(s) and contributor(s) and not of MDPI and/or the editor(s). MDPI and/or the editor(s) disclaim responsibility for any injury to people or property resulting from any ideas, methods, instructions or products referred to in the content. |
© 2023 by the authors. Licensee MDPI, Basel, Switzerland. This article is an open access article distributed under the terms and conditions of the Creative Commons Attribution (CC BY) license (https://creativecommons.org/licenses/by/4.0/).
Share and Cite
Lopes, D.; Coelho, L.; Silva, M.F. Development of a Collaborative Robotic Platform for Autonomous Auscultation. Appl. Sci. 2023, 13, 1604. https://doi.org/10.3390/app13031604
Lopes D, Coelho L, Silva MF. Development of a Collaborative Robotic Platform for Autonomous Auscultation. Applied Sciences. 2023; 13(3):1604. https://doi.org/10.3390/app13031604
Chicago/Turabian StyleLopes, Daniel, Luís Coelho, and Manuel F. Silva. 2023. "Development of a Collaborative Robotic Platform for Autonomous Auscultation" Applied Sciences 13, no. 3: 1604. https://doi.org/10.3390/app13031604