1. Introduction
Technological progress has historically relied on the introduction of special materials capable of addressing the needs of many engineering disciplines. In recent times, the wide use of polymers has played a crucial role in the acceleration of this progress, mainly due to the possibility of forging ad hoc materials designed for specific applications so as to manipulate their mechanical strength [
1], chemical resistance [
2], hydrophilicity/hydrophobicity [
3], radiation transparency/blocking [
4], weight saving [
5], etc. Environmental fatigue imposed on those materials [
6] is a typical hindrance that is commonly overcome with the use of specially designed protective coatings and enclosures. In particular, UV radiation is responsible for photocatalytic degradation [
7,
8] to the sample surfaces, while sorbed moisture (SM) causes hydrolysis, disruption of hydrogen bonds in the polymer, chain scission and plasticization [
9,
10,
11,
12,
13].
Epoxy resins are lightweight, easily processed and low-cost materials, which exhibit low shrinkage after curing, impact resistance, low moisture ingress and chemical resistance [
14,
15,
16,
17]. When reinforced with carefully selected fillers, certain resin properties may be critically enhanced. For instance, the incorporation of 5 wt% zinc oxide (ZnO) into the epoxy matrix is responsible for the creation of a composite material with improved mechanical strength, as reported in the literature [
18,
19]. ZnO is a well-known n-type inorganic compound of the II–VI semiconductor group with a large band gap of 3.37 eV and a high exciton binding energy of 60 meV [
20].
Although dielectric properties of aged ZnO-filled epoxy resins have been investigated in low (10 mHz–1 MHz) [
21,
22,
23] and microwave frequency ranges [
24,
25,
26], the VHF frequency range has not been thoroughly investigated in the existing literature. However, S. Singha et al. [
27] studied a ZnO-loaded epoxy composite in the 1 MHz–1 GHz frequency range and reported increased relative permittivity for 5 wt% filler loadings, in contrast to decreased k’ for filler loadings below 1 wt%, when compared to bare epoxy. Moreover, they found tan
δ decreased for all filler loadings when compared to bare epoxy. In the same manner, the 0.5 wt% ZnO epoxy composite, produced by Xinyu Wang et al. [
28], exhibited a significant k’ reduction, in contrast to the k’ increase found in higher filler loadings, when examined in the frequency range 1 MHz–1 GHz. Interestingly, the same phenomenon, namely the decrease of relative permittivity in epoxy composites with low filler content, as opposed to the increase observed at higher filler content, has also been reported in lower frequencies by S. Singha et al. [
23] in the frequency range of 0.4 KHz–1 MHz.
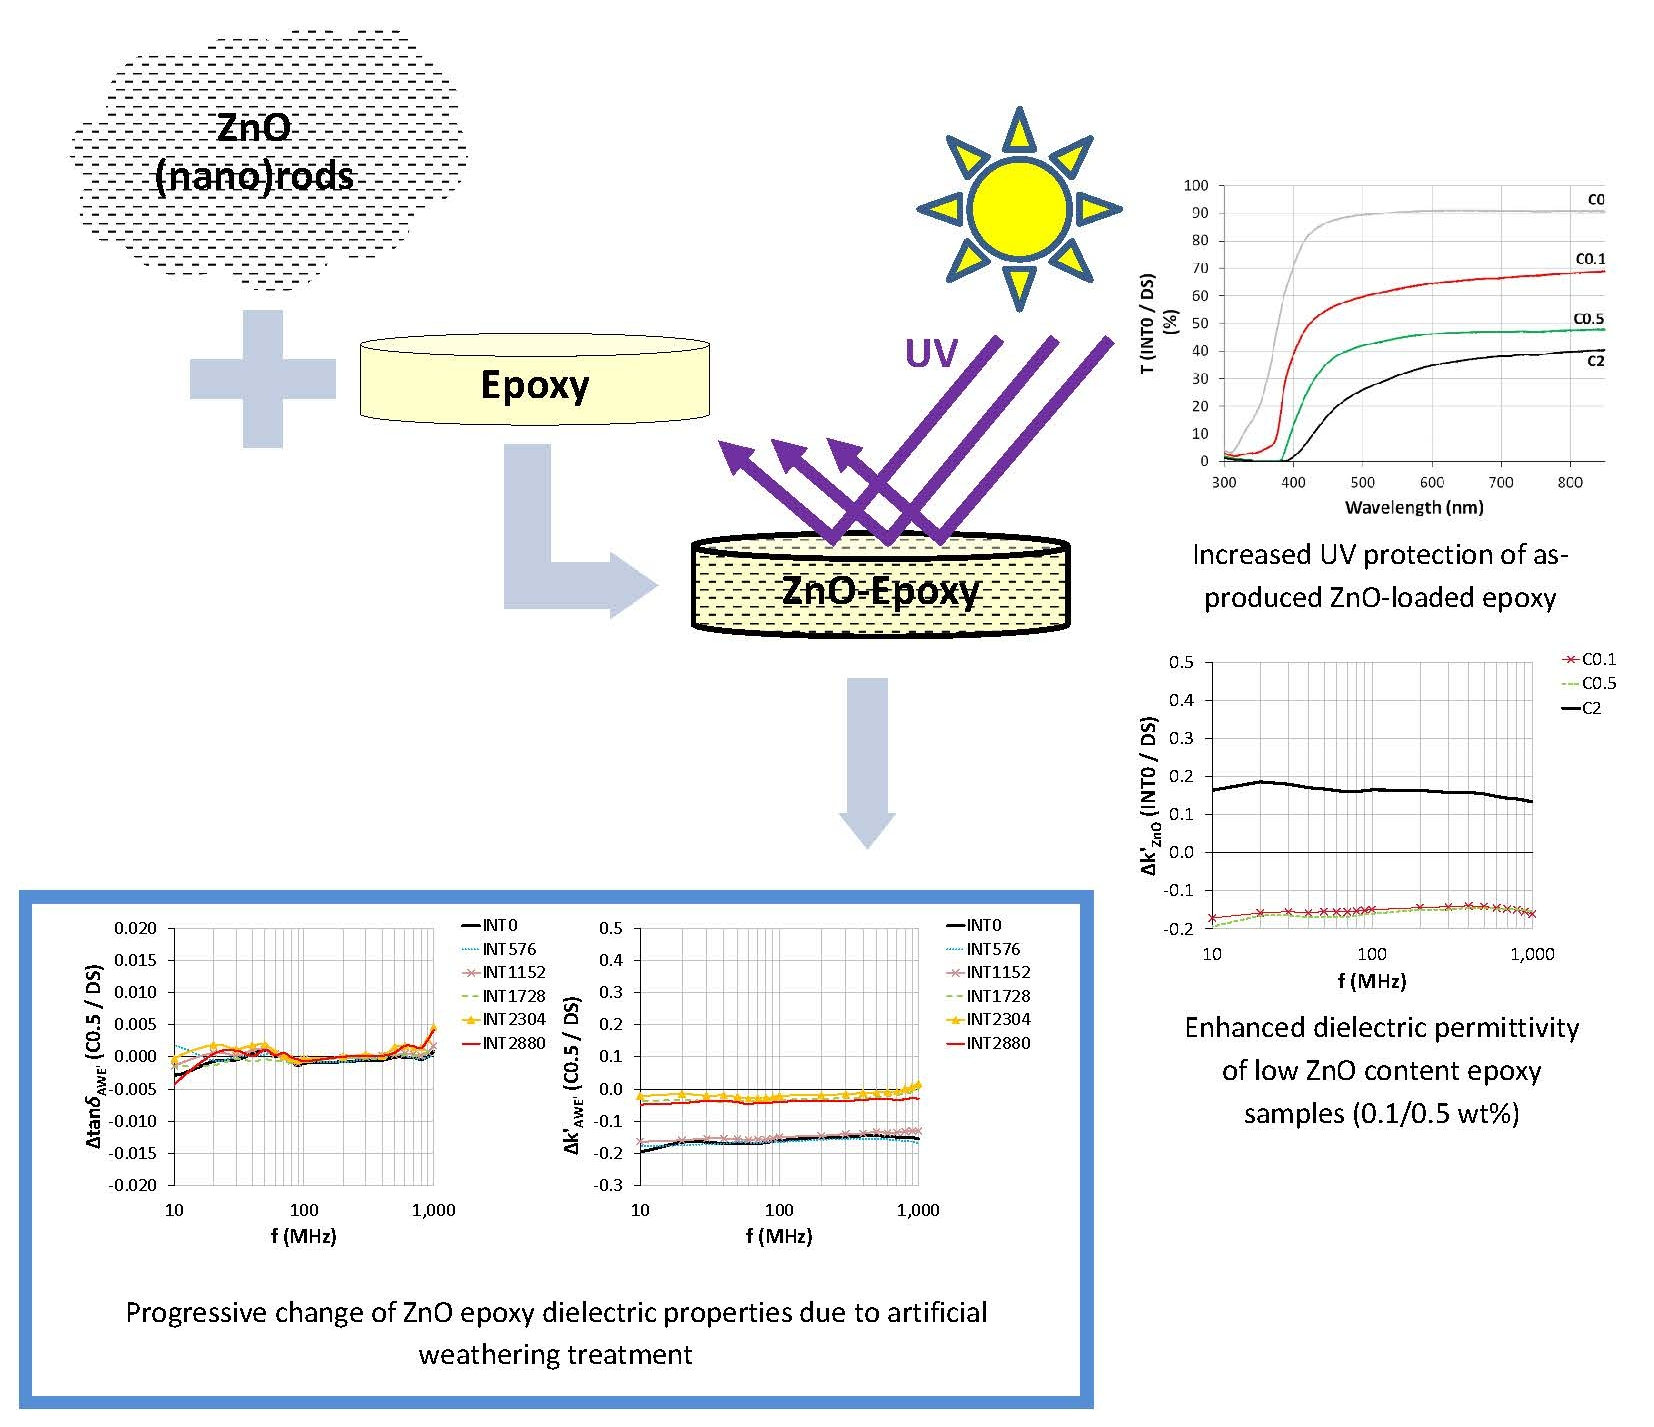
In this study, thermosetting Bisphenol F diglycidyl ether epoxy resin was chosen as a base material, due to its inherent superior mechanical strength and low moisture ingress, in order to fabricate a protective composite intended for outdoor use. Furthermore, in order to shape the composite’s dielectric behaviour in the 10 MHz–1 GHz frequency range, which fully covers the VHF spectrum and partially the UHF, while extending its overall endurance against UV radiation damage, ZnO has been chosen as the right filler due to its known semiconducting properties, UV resistance and non-toxicity [
27,
29,
30,
31]. The applied synthesis procedure, which is environmentally friendly, yielded ZnO (nano)rods in both nano- and micro-scale. The aim of this paper is to determine the impact of varying ZnO content on the dielectric behaviour of artificially aged epoxy composites in the VHF/early UHF frequency range and to correlate them with structural alterations. The implementation of this research will be based upon material characterizations, complemented with gravimetric, FTIR, colorimetric, UV-Vis, wettability and gloss measurements as AWE treatment progresses.
2. Materials and Methods
2.1. Filler Fabrication
ZnO (nano)rods in wurtzite shape have been hydrothermally synthesized. A solution of 15 mL of zinc chloride (ZnCl2) and sodium hydroxide (NaOH) at a molar ratio of 1:16 was sonicated for 45 min. An amount of 0.03 g of polyethylene glycol (PEG) was dissolved in 105 mL of H2O, and then both solutions were mixed under magnetic stirring for 10 min. The new solution was inserted in an autoclave and underwent heating up to 200 °C, under which it was kept for 5 h at a maximum pressure of 608 kPa. After ambient conditions were reached, the solution was centrifuged for 40 min at 4000 rpm, and the obtained ZnO powder was dried at 100 °C.
2.2. Sample Fabrication
Thermosetting epoxy resin (Neotex EPOXOL 2874) was used, consisting of two ingredients: the main resin (bisphenol F based) and the hardener (cycloaliphatic amine based) at a weight ratio of 100:58, respectively. Prior to loading into the main resin, the filler had been vacuum-dried for 1 h at 10 Pa (0.1 mbar) at ambient conditions in order to remove the contained moisture. Filler blending has been initially attained by the mechanical stirring of the main resin at 2000 rpm for a period of 1 h and, additionally, by exposure of the solution to ultrasonic treatment (Bek Nilas U25H) for 15 min. During sonication, a thermo-controlled glass tube coil heat exchanger was immersed in the water volume of the ultrasonic bath chamber in order to prevent the solution temperature from exceeding room temperature levels. Finally, the hardener was introduced to the solution, followed by gentle omnidirectional mechanical stirring by hand for 2 min. Casting was performed by slowly pouring the mixture at the centre of the Teflon moulds. Curing progressed in a protected enclosure at the above ambient conditions for a period of 168 h, as per manufacturer specifications. A total number of twenty round-shaped composite samples, with a 5.5 cm diameter and an average thickness of 3.65 mm, were manufactured on the basis of ASTM D570 specifications. The full fabrication process was performed under ambient conditions [
32].
2.3. Research Setup
Four sets of four thermosetting resin samples (diameter: 5.5 cm/thickness: 3.65 mm ± 0.3 mm) were fabricated and enriched with ZnO (nano)particles at 4 percentages: bare 0 wt% (C0), 0.1 wt% (C0.1), 0.5 wt% (C0.5) and 2 wt% (C2). An additional sample of every concentration was fabricated and kept untreated, serving as control samples. DSC measurements (Mettler Toledo DSC 1) pinpointed the glass transition temperature and thus, the suitability of the selected resin as a protecting agent.
The samples were exposed to an Artificial Weathering Environment (AWE) (QUV/Spray with UVB-313 EL lamps) for a total period of 2880 h. Treatment was based on 4-h interchanging UV radiation cycles (0.68 W/m2 at 45 °C) and condensation cycles (100% RH at 40 °C). In that manner, the full experimental procedure comprised 5 sets of 576-h AWE treatment intervals, between which measurements took place.
The morphology of ZnO powder and its dispersion were examined by SEM (ThermoFischer Scientific Phenom XL G2). Optical microscopy outlined surface damage of all samples (Leitz Aristomet). X-Ray crystallography (Bruker D8 Advance with CuKα radiation, 40 KV, 40 mA at an increment step of 0.040°/min, λ = 0.154 nm) was performed for determining filler crystallinity. Surface degradation was evaluated by glossimetry (Sheen Tri-Microgloss 20-60-85). Contact angle (Rame-hart 590/DROPimage Advanced) established surface wettability. Gravimetric measurements determined sample weight loss (WL) and sorbed moisture (SM) inside sample bodies. Specifically, all samples were placed inside a controlled humidity chamber (100% RH/40 °C) for a period of 168 h. Then, they were carefully washed with jets of distilled water and left to dry in a protected enclosure under ambient conditions (temperature 28 ± 2 °C, RH 30 ± 5%) for a period of 24 h, until the SM inside them reached equilibrium concentration. This sample state has been designated as the humid state (HS). As a next step, samples were reconditioned by means of vacuum-drying for a period of 168 h at 0.1 mbar/28 ± 2 °C. This condition has been designated as the dried state (DS). Moisture content was then calculated by gravimetric comparison of samples between HS and DS, with the use of analytical balance (Ohaus Galaxy 110, 0.1 mg precision). Next, 2880 h aged samples were exposed to a further 1000 h time period under 40 °C/100% RH environment, so as to determine the saturation moisture content. UV-Vis spectroscopy (Jasco V-770) was performed at a wavelength range of 300–850 nm. FTIR measurements (Jasco FT/IR 4200) were performed at a wavenumber range of 4000–400 cm
−1 using KBr tablets containing a portion of sample surfaces. Additionally, sample surfaces were assessed by means of colorimetry measurements in CIELAB colour space (Sheen Micromatch Plus), where parameter L* quantifies/stands for the brightness levels in a range of 0–100 (0: darkest, 100: brightest), parameter a* quantifies/stands for greenness when a* < 0 and redness when a* > 0 and parameter b* quantifies/stands for blueness when b < 0 and yellowness when b* > 0 [
33]. Dielectric spectroscopy (Agilent 4287A) was studied in the VHF and a portion of the UHF frequency spectrum.
Measurements were performed under virtually the same ambient conditions (28 ± 2 °C/RH 30 ± 5%); additionally, throughout the entire experiment, all samples were kept in protected cases to avoid contamination by volatile content, and they were handled carefully, preventing all tactile contact. Finally, the experiment was designed to not impose any further strain (mechanical, chemical, etc.) on the samples, other than the AWE treatment.
3. Results
3.1. SEM/XRD
According to SEM imaging, the morphology of the ZnO powder consists mainly of isolated rods that may also appear branched together (
Figure 1a,b). No amorphous material was observed in all images. Moreover, the ZnO rod diameter ranged between 70 nm and 1 μm.
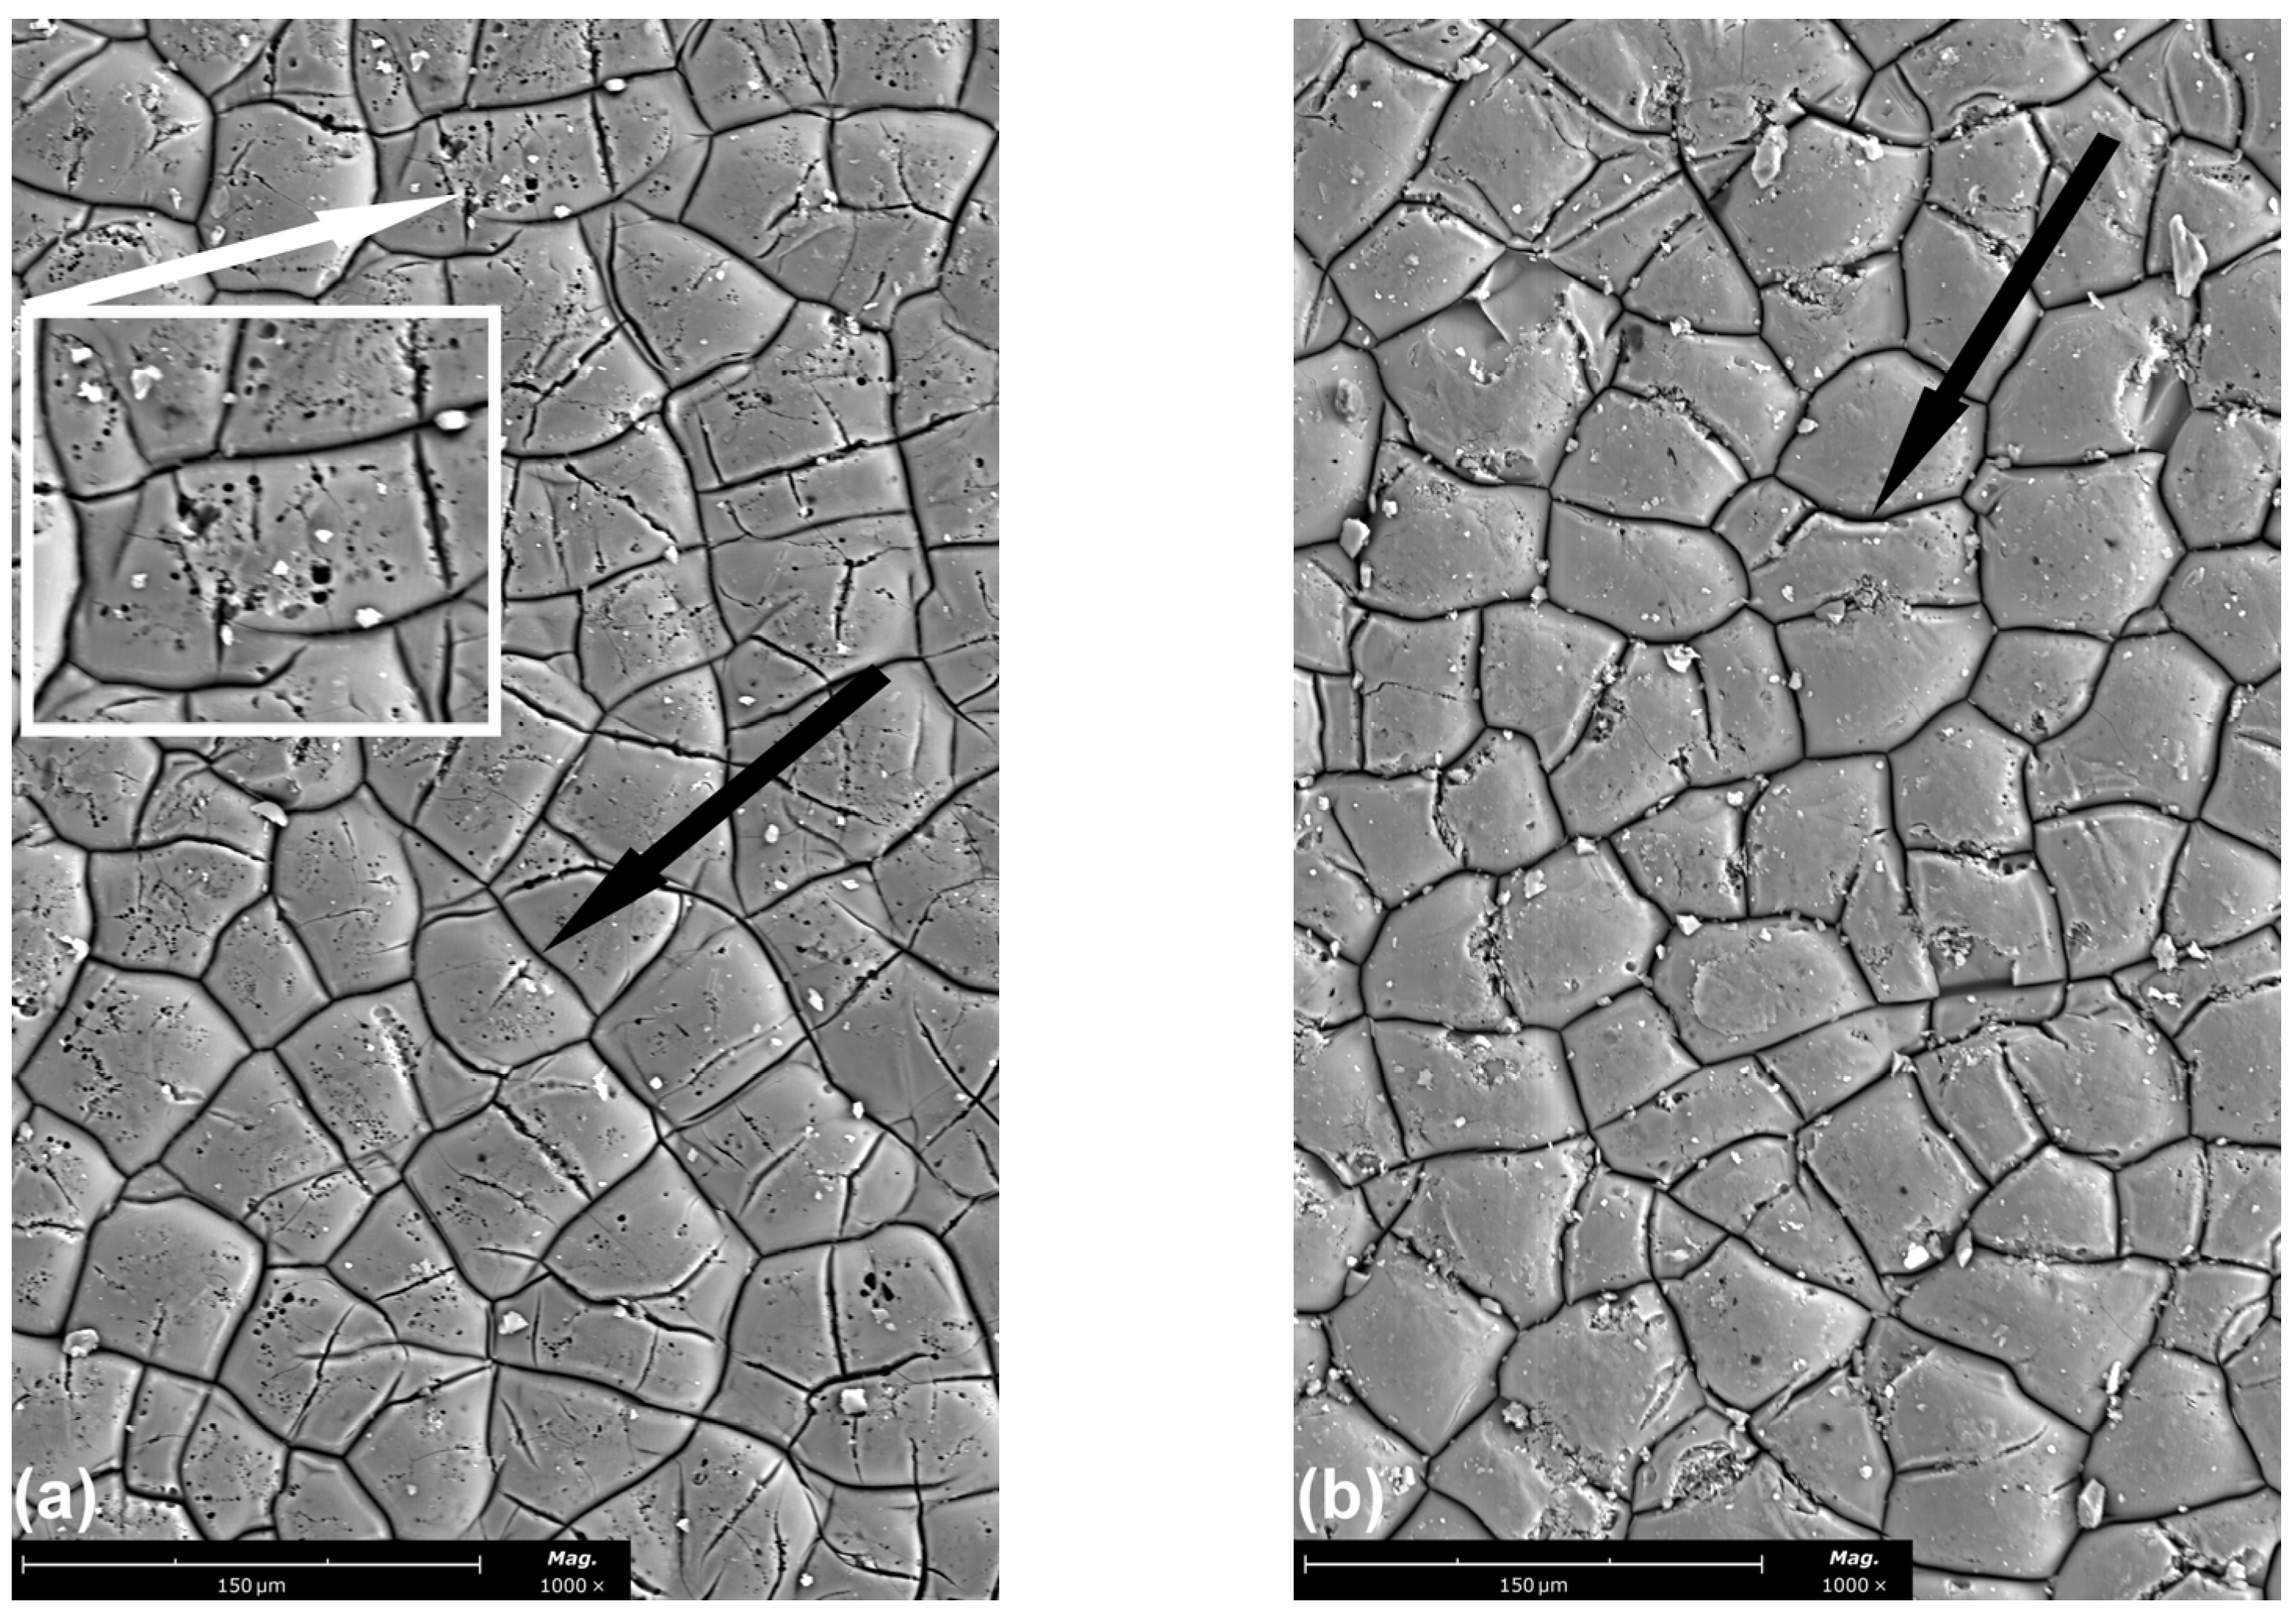
SEM imaging at 1000× magnification (
Figure 2a–d) revealed the same situation as above. Additionally, C0 sample decomposition was indicated by its porous surfaces. The same, but to a lesser extent, applied to C0.1 samples, whereas C0.5 and C2 samples were free from pores. Furthermore, spot imaging on the white areas of
Figure 2d ascertained the presence of ZnO.
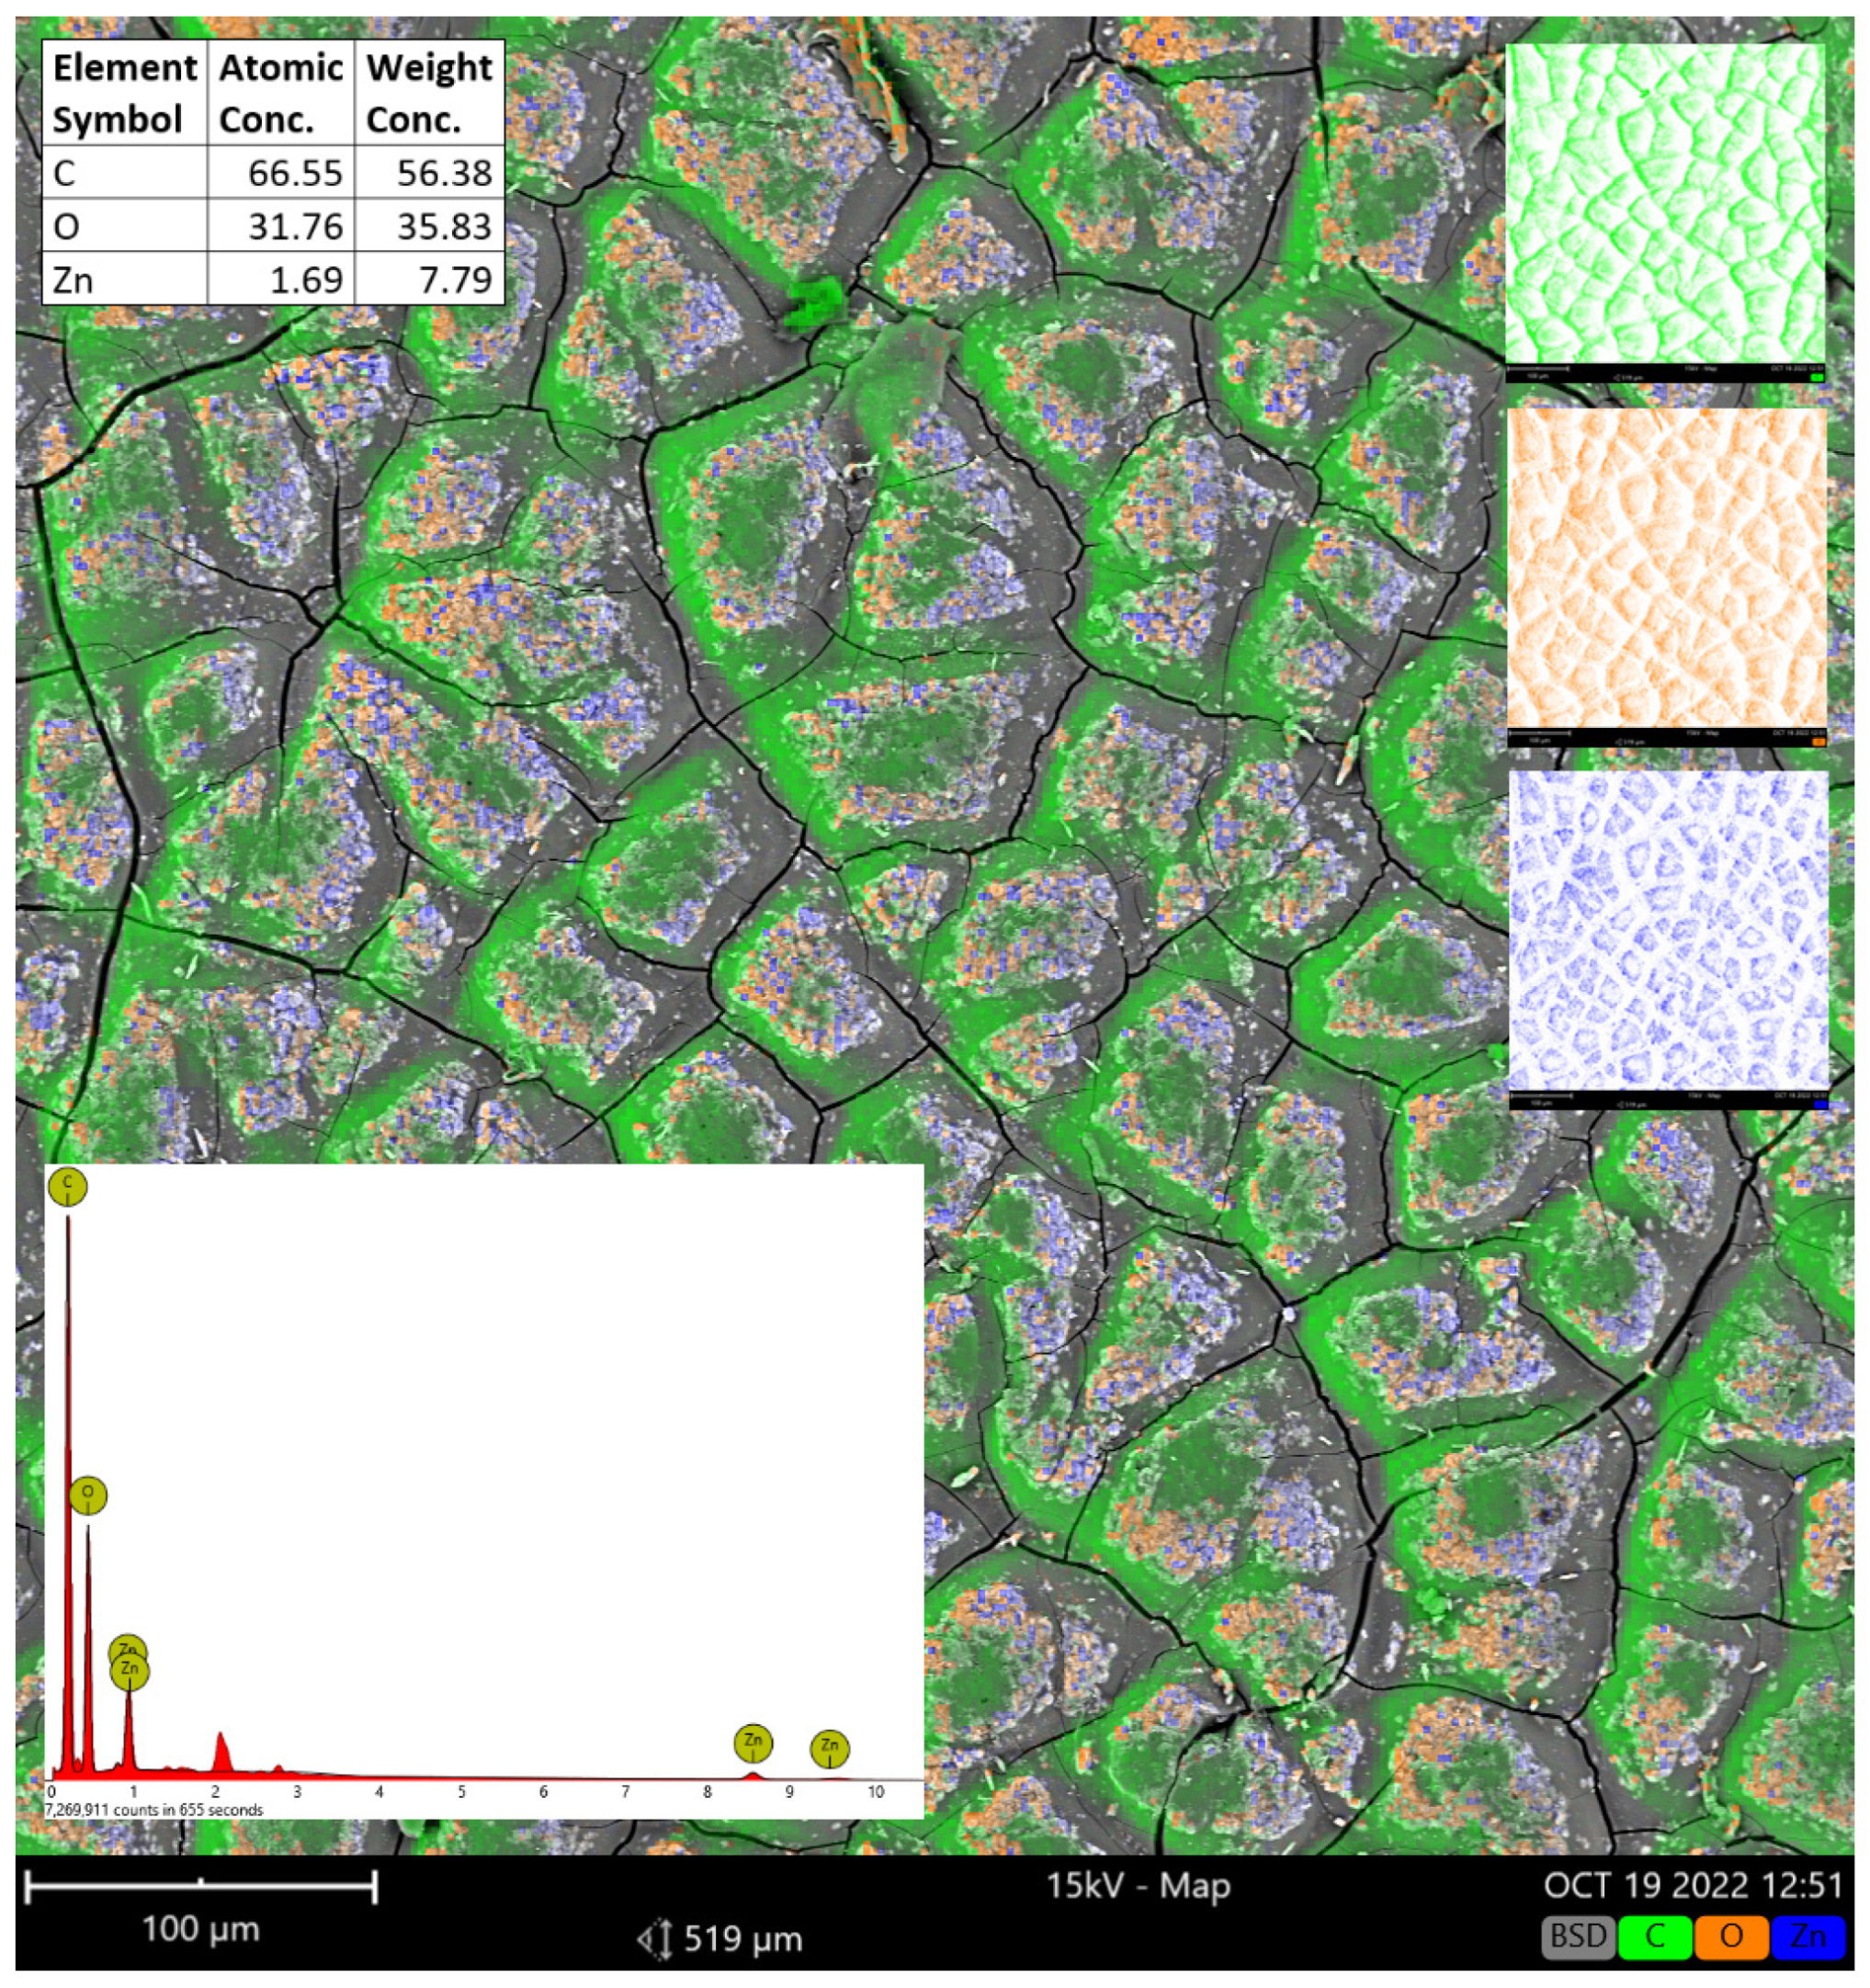
Additionally, the SEM energy dispersive spectroscopy of C2 samples at INT2880 (
Figure 3), and of C0.5 samples (
Figure S1 Addendum), revealed satisfactory ZnO dispersion, portrayed by the group of blue dots (Zn). However, Zn presence was not detected on samples of C0.1 filler concentration, but the oxygen variation was found for untreated C0 samples 17.23 at% and for AWE-treated samples 25.81 at% (C0), 25.33 at% (C0.1), 27.65 at% (C0.5) and 31.76 at% (C2), due to increasing ZnO content and the oxidation of the material.
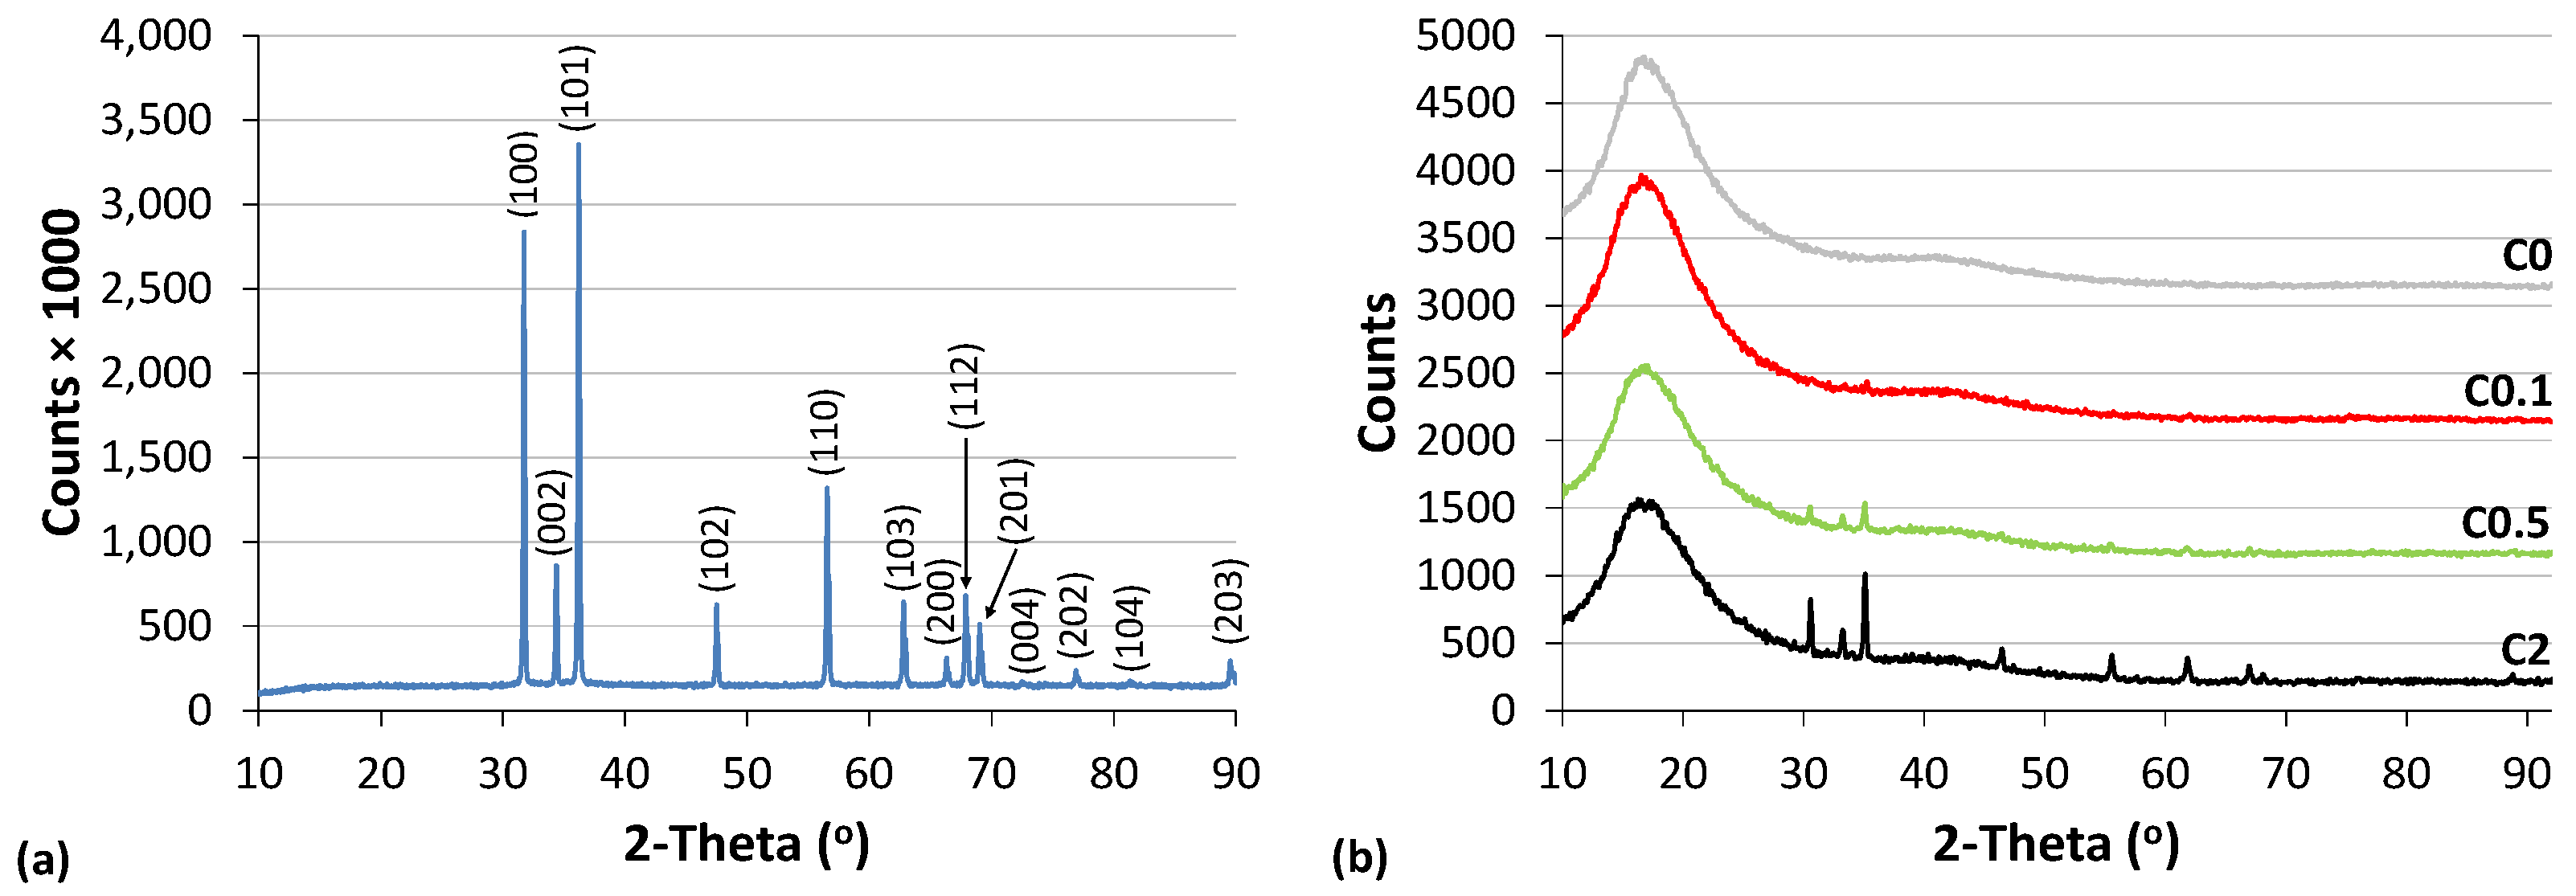
Figure 4a shows the XRD pattern of the as-produced ZnO powder. The XRD diffraction peaks were characterized according to the literature [
29,
34,
35], and they were assigned to a ZnO hexagonal wurtzite structure with lattice constants a = 3.249 Å (a = b) and c = 5.207 Å. The faces (100), (101) and (001) of the hexagonal crystallographic system corresponded to m (side structure), +p (regular hexagonal pyramid structure) and +c (regular hexagonal prism structure), respectively [
34,
36]. Based on
Figure 4a, the ZnO powder consisted of hexagonal rods with mainly hexagonal pyramidal structure. Additionally, there were not any other crystalline intermediate structures; thus, the powder was pure ZnO. The average crystalline size of the ZnO rods (average of L
c, L
a) was evaluated by Williamson-Hall analysis [
37] using the peak width at the half maximum of the crystallographic faces (002) (stacking), (100) and (101). Based on the aforementioned information, the synthesized ZnO powder consisted of rods, with an average crystal size D = 46 nm (L
a = 49 nm, L
c = 43 nm).
In the same manner, XRD measurements of the samples revealed that ZnO diffraction peaks were clearly detectable on the C2 samples and barely detectable on the C0.5 samples, while on the C0.1 samples only the 101 peak could be attributed to ZnO presence (
Figure 4b).
3.2. Glossimetry
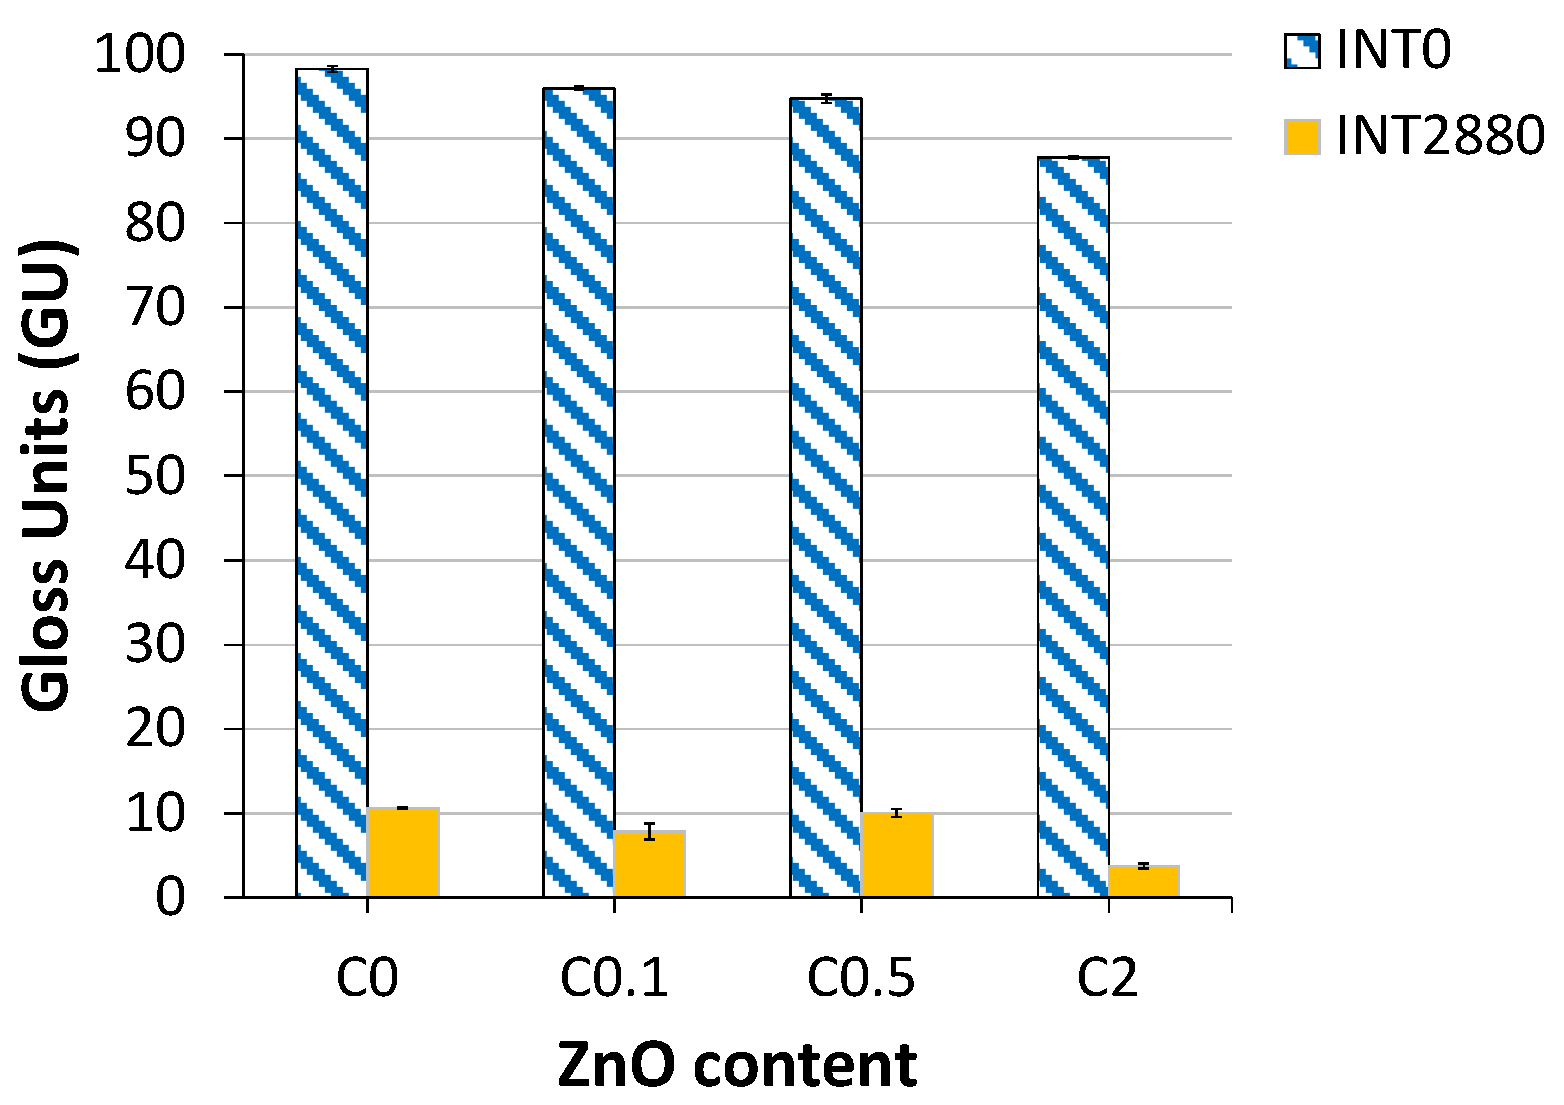
Gloss deterioration is one of the most prominent visual symptoms of surface degradation due to AWE treatment. Untreated (INT0), bare (C0) epoxy samples exhibited a highly glossy surface (GU = 98). The incorporation of the ZnO filler caused minor gloss reduction, exacerbated as the ZnO content increased (
Figure 5). Additionally, surface roughness was increased as the filler content increased [
38]. Moreover, all samples subjected to 2880 h AWE treatment became more opaque [
39], particularly the C2 ones.
3.3. Wettability
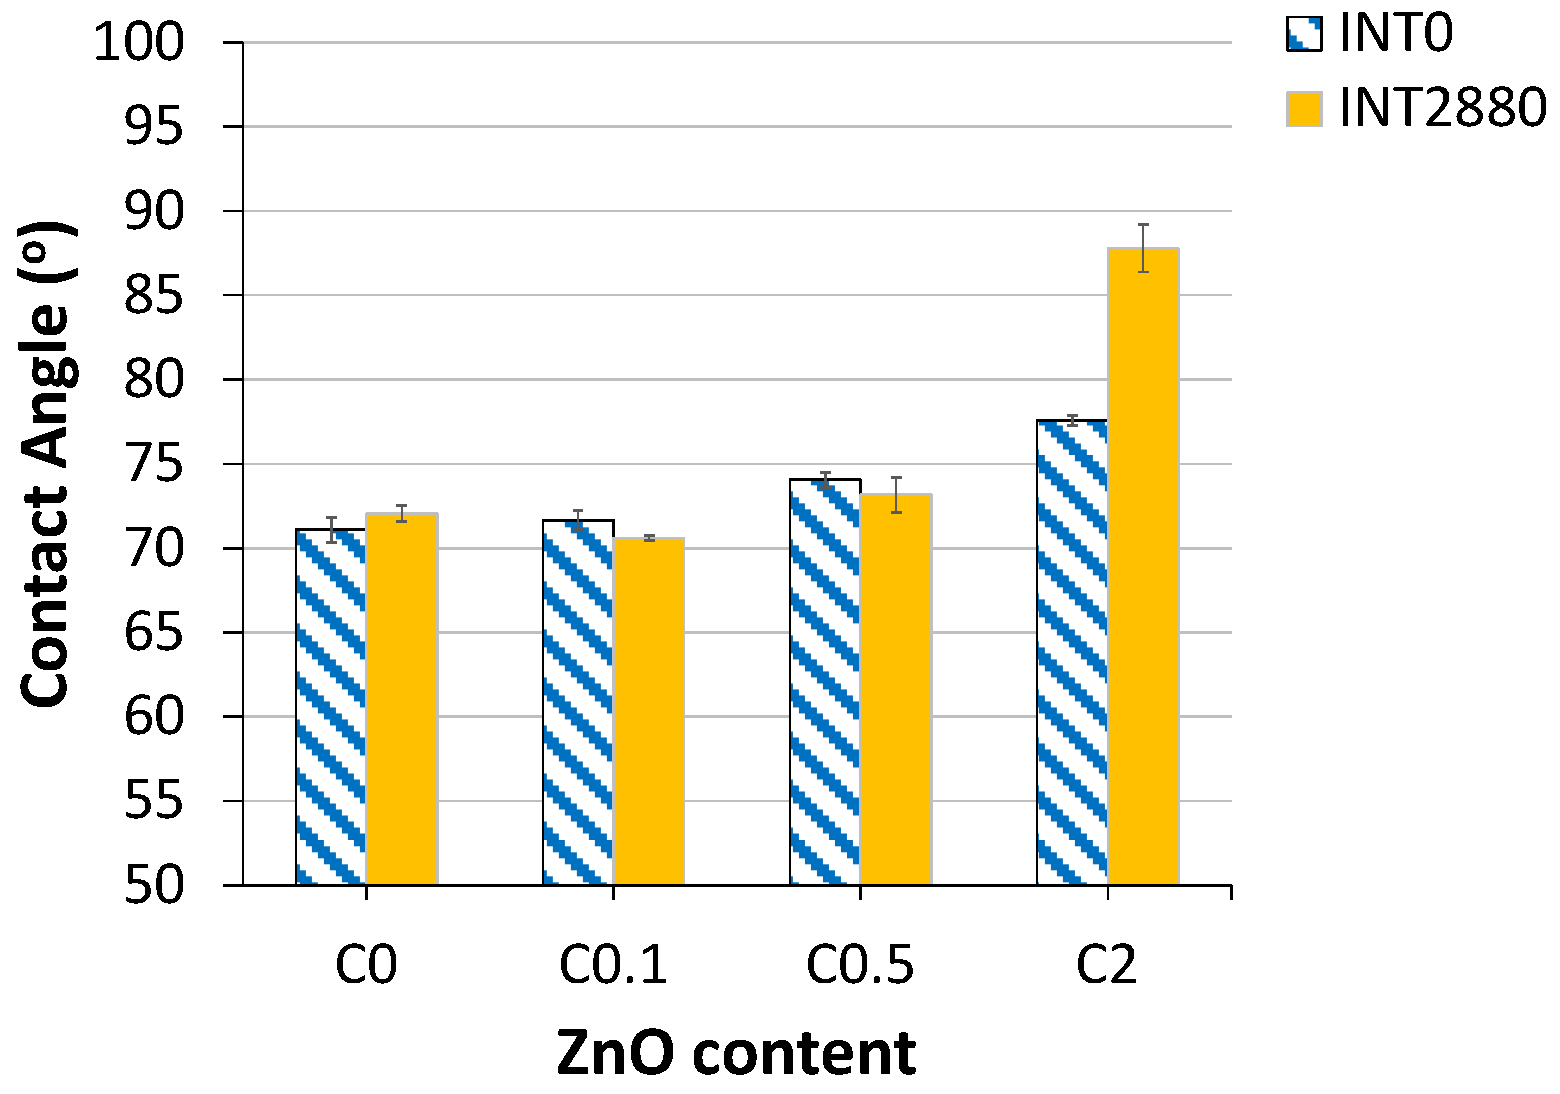
The untreated bare epoxy (C0) surface was found to be mildly hydrophilic (CA = 71) (
Figure 6). In the same figure, it is evident that the incorporation of the ZnO filler caused CA to increase in higher ZnO content, namely C0.5 and especially C2, thus changing corresponding sample surfaces slightly hydrophobic, as reported in the literature [
40,
41]. As ZnO content increased, the surface roughness of the samples also increased. Given that wettability is largely affected by surface roughness and surface free energy [
42], and that air bubbles are trapped between surface ups and downs of the material, contact with water droplets is hindered. As a result, surface energy is reduced, which leads to increasing hydrophobicity, a phenomenon most prominent for C2 samples. However, although the 2880 h AWE treatment did not actually affect the CA of C0/C0.1/C0.5 samples, it increased the CA of C2 samples; this made their surfaces even more hydrophobic (CA = 88), as seen in
Figure 6, due to ZnO protective properties, namely by limiting polymer oxidation reactions and chain scissions that cause the formation of polar groups [
39].
3.4. Gravimetry
Gravimetry was focused on measurements regarding (a) weight loss (WL) and (b) sorbed moisture (SM). WL was calculated for reconditioned samples, namely at dried state (DS), according to:
where SW
INTx−1 is the sample weight measured in the previous AWE treatment interval (1 ≤ x ≤ 5) and SW
INTx is the sample weight measured in the current AWE treatment interval. In the same manner, SM was calculated according to:
where SW
HS/INTx is the sample weight in humid state (HS) for AWE treatment interval INTx (1 ≤ x ≤ 5) and SW
DS/INTx is the sample weight in DS for the same treatment interval. Due to small variations of sample weights, SM
INTx (%) was recalculated in regard to the specific sample weight. A complementary 1000 h exposure of samples in a humidity chamber (100% RH/40 °C) revealed that all samples, regardless of filler content, were capable of withholding additional moisture content, leading to the conclusion that saturation level was not achieved during the treatment process. Moreover, the 7 day medium vacuum exposure at 0.1 mbar was not sufficient to fully remove saturation-level SM, which is estimated to have deeply penetrated the epoxy matrix.
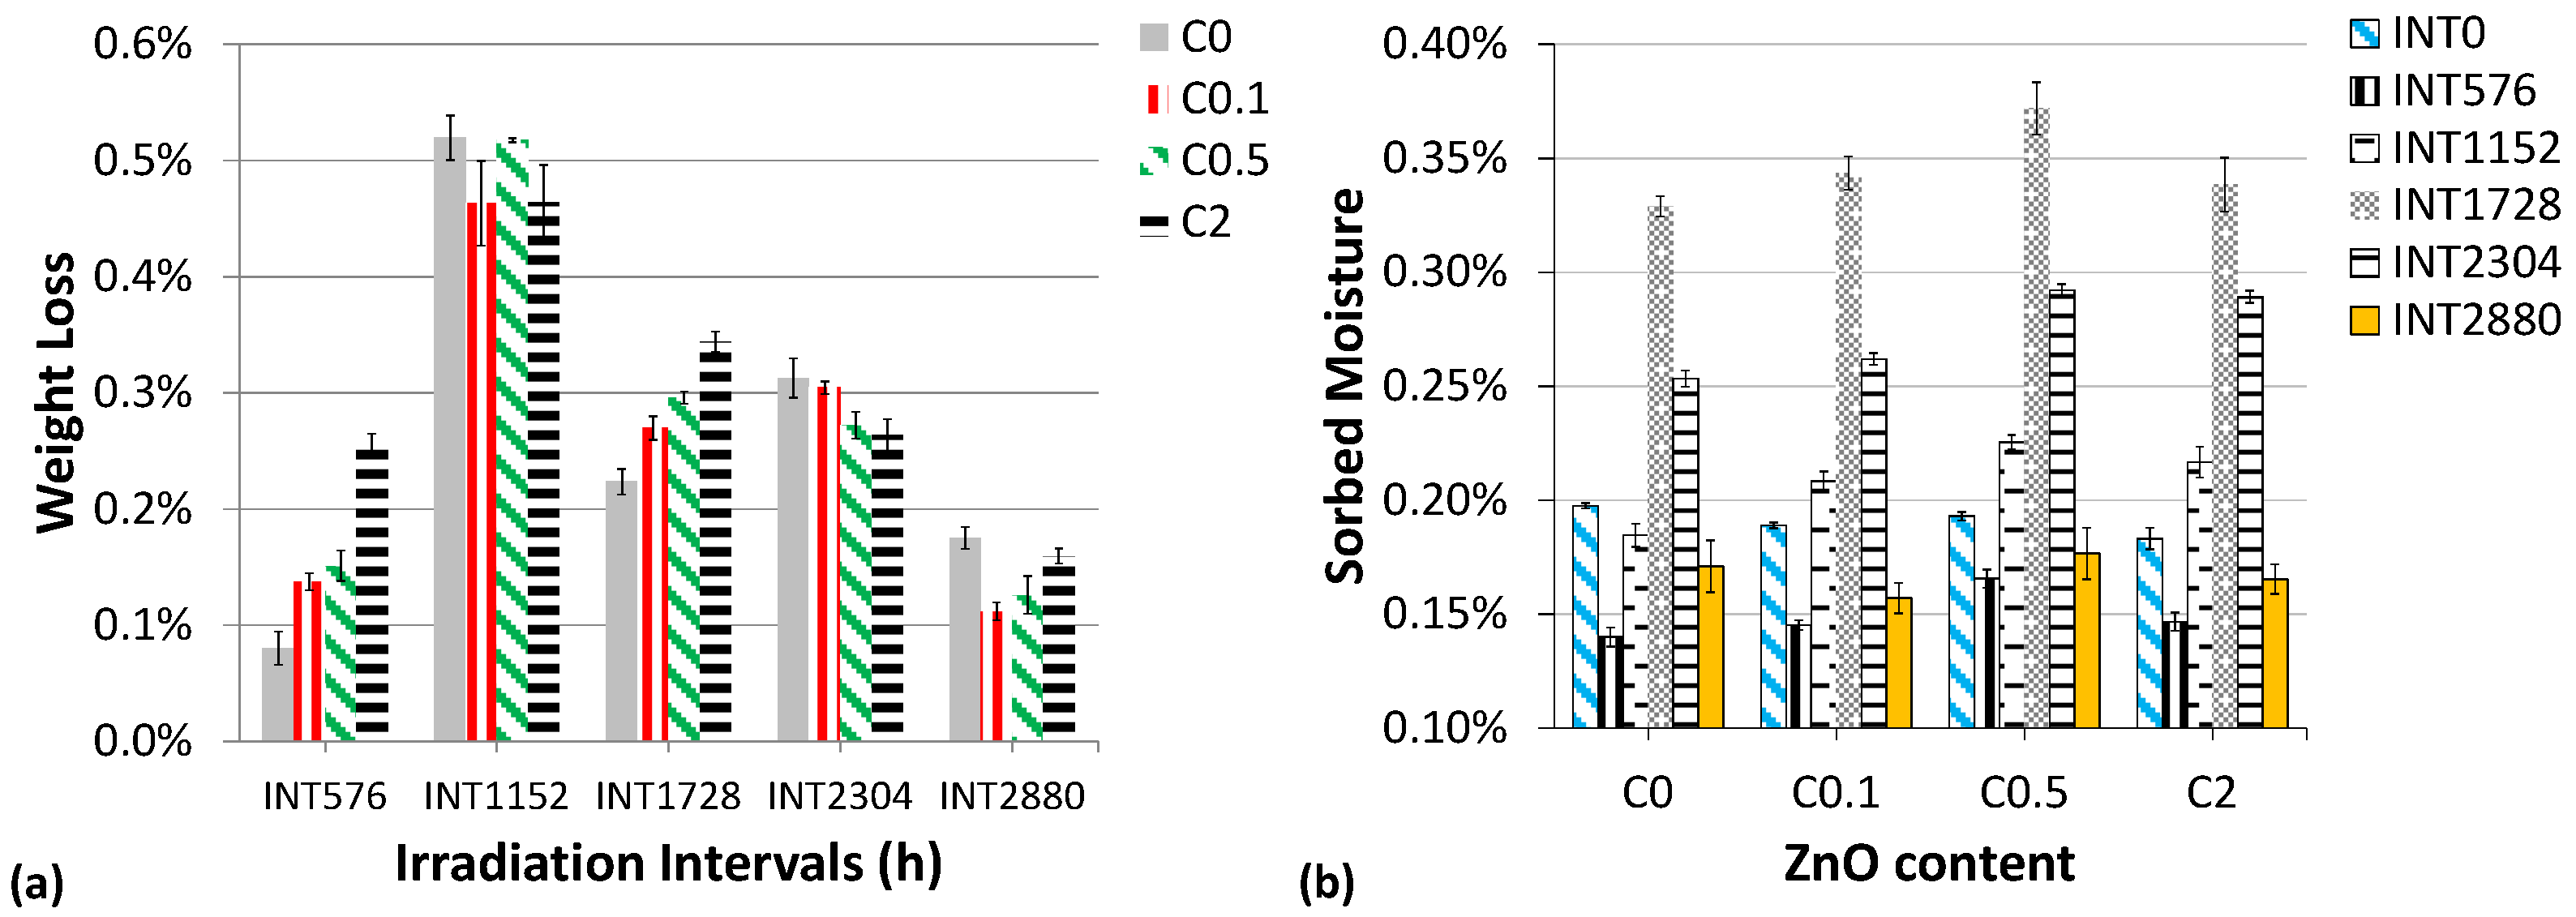
Figure 7a presents WL in regard to previous AWE treatment interval. The bare resin initially (INT0) exhibited weight gain up to 288 h of treatment (
Figure S2, Addendum) and, at INT576, WL commenced, reaching a maximum at INT1152. In the following treatment intervals, WL continued up to INT2880, but at a lower rate. According to the literature [
43], two antagonizing phenomena occur during photodegradation, namely (i) photo-oxidation due to chemical interaction of oxygen with the polymeric matrix, which leads to weight gain and (ii) polymeric chain scissions due to decomposition reactions. Additionally, it is important to note that, since weight change measurements were implemented in atmospheric conditions, samples cannot be considered as fully dry and thus, WL cannot be ascribed merely to decomposition reactions. The same stands for ZnO composite samples.
On the other hand, bare samples exhibited maximum SM content at INT1728, in consequence to maximum WL observed at INT1152 (
Figure 7a). The same behaviour was observed for ZnO-loaded samples, leading to the conclusion that moisture retention is fluctuating in response to WL as AWE treatment proceeds (
Figure 7b).
3.5. UV-Vis Spectroscopy
Based on
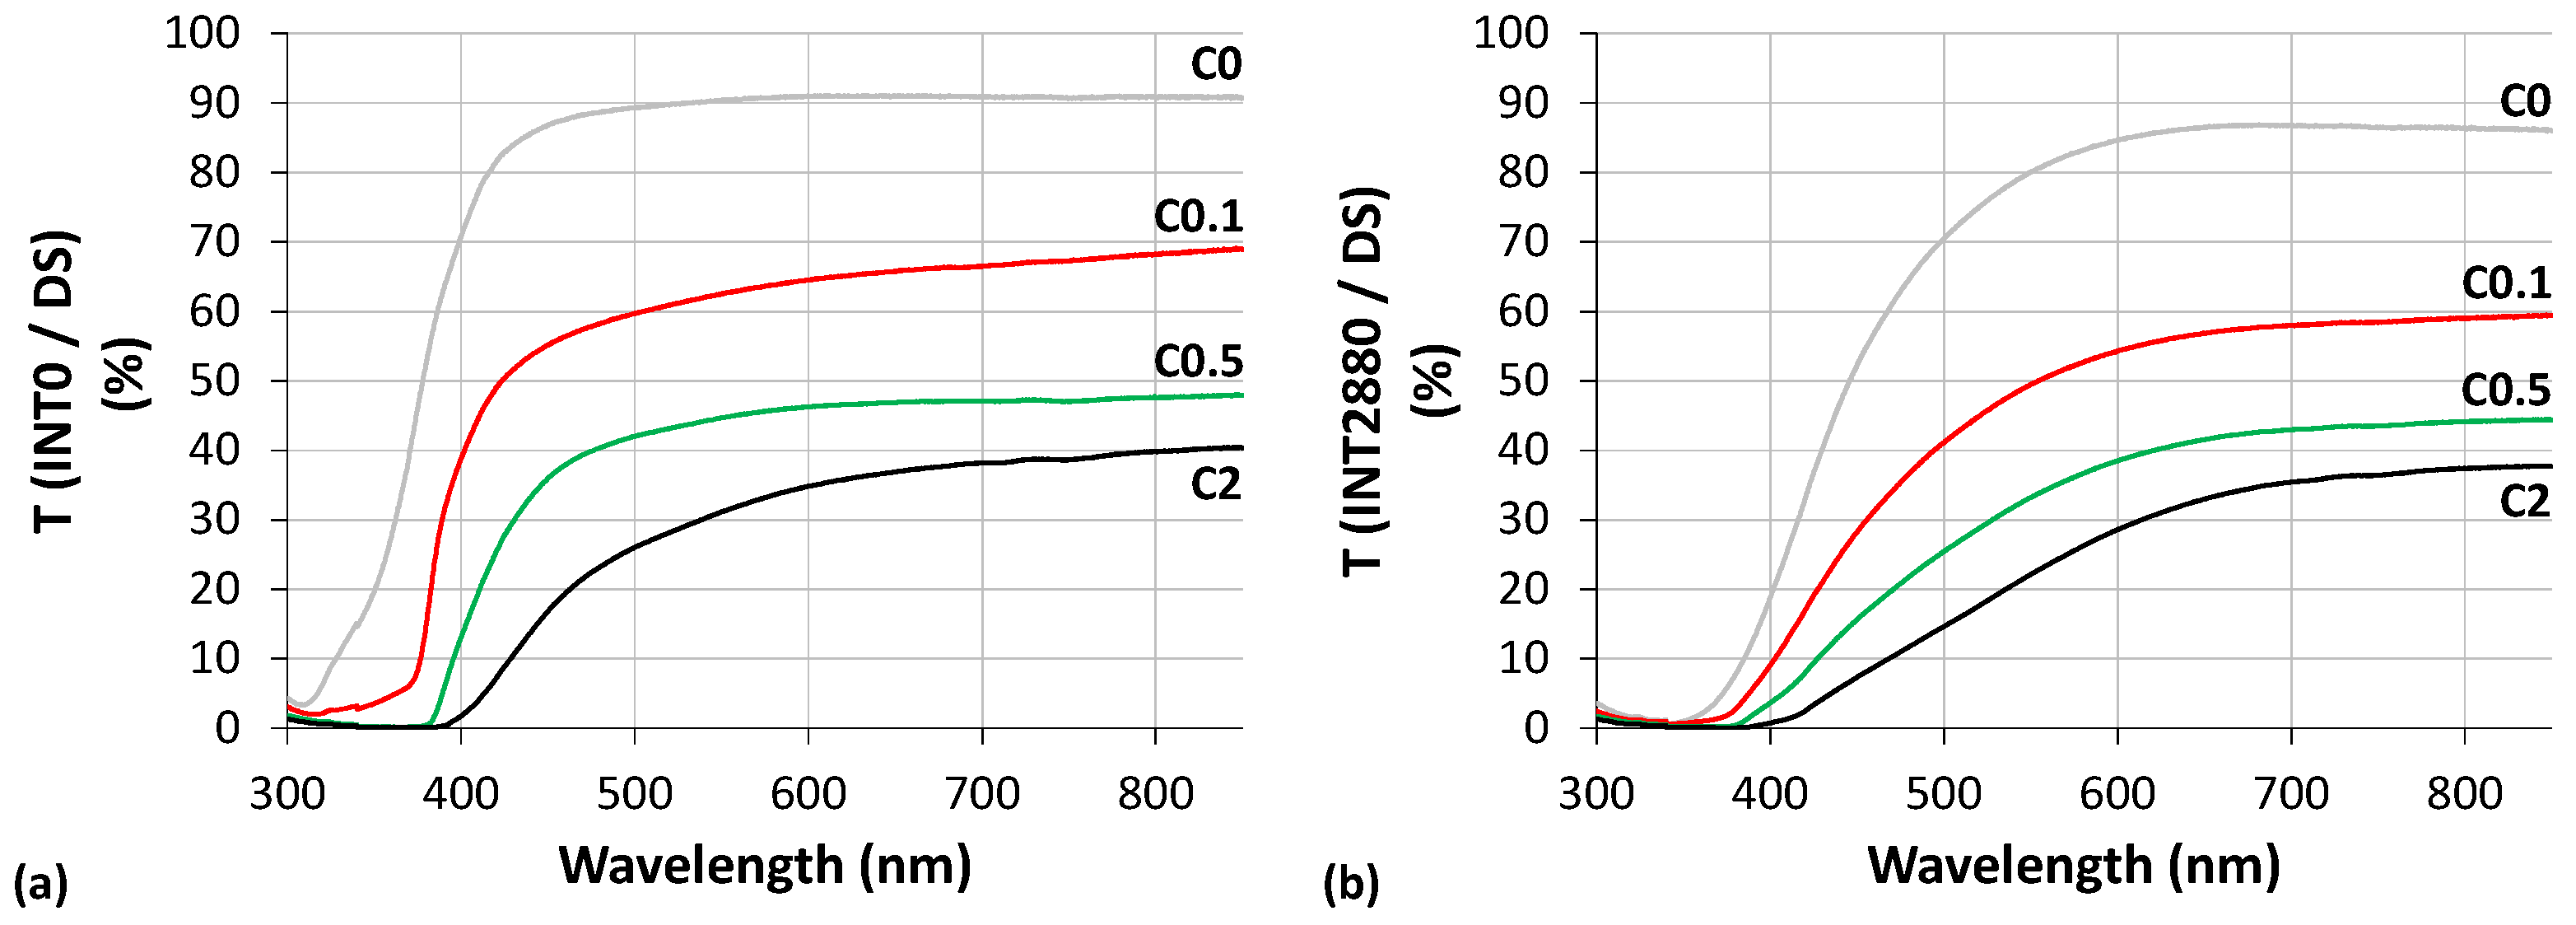
Figure 8a, bare resin at INT0 exhibited UV blocking capability in the close proximity of wavelength 310 nm. Incorporation of the increasing content of the ZnO filler at INT0 led to wider blocking, affecting the whole near-UV range (300–400 nm) due to UV blocking transmittance properties of ZnO (by radiation absorption) [
44,
45]. Additionally, the percentage of transmittance decreased as ZnO content increased, which was especially prominent in the visible up to the beginning of near-IR spectra (400–850 nm), without achieving total blockage. This decrease may be attributed to the added influence of (a) surface roughness caused by ZnO presence, (b) light scattering due to filler agglomeration, a phenomenon most prominent in the visible region and (c) refractive index difference between ZnO and polymer matrix [
38,
46]. As seen in
Figure 8b, the 2880 h AWE treatment of C0 samples caused additional transmittance reduction in the UV region from 350 up to 500 nm, as expected, due to absorbance of UV energy. Consequently, photolytic/photooxidative reactions resulted in the decomposition of the material [
7]. All ZnO-loaded samples, regardless of filler concentration, exhibited blocking in the whole near-UV region. Compared to the corresponding untreated samples, the AWE-treated samples exhibited a slight reduction of transmittance percentage in the visible region.
3.6. FTIR Spectroscopy
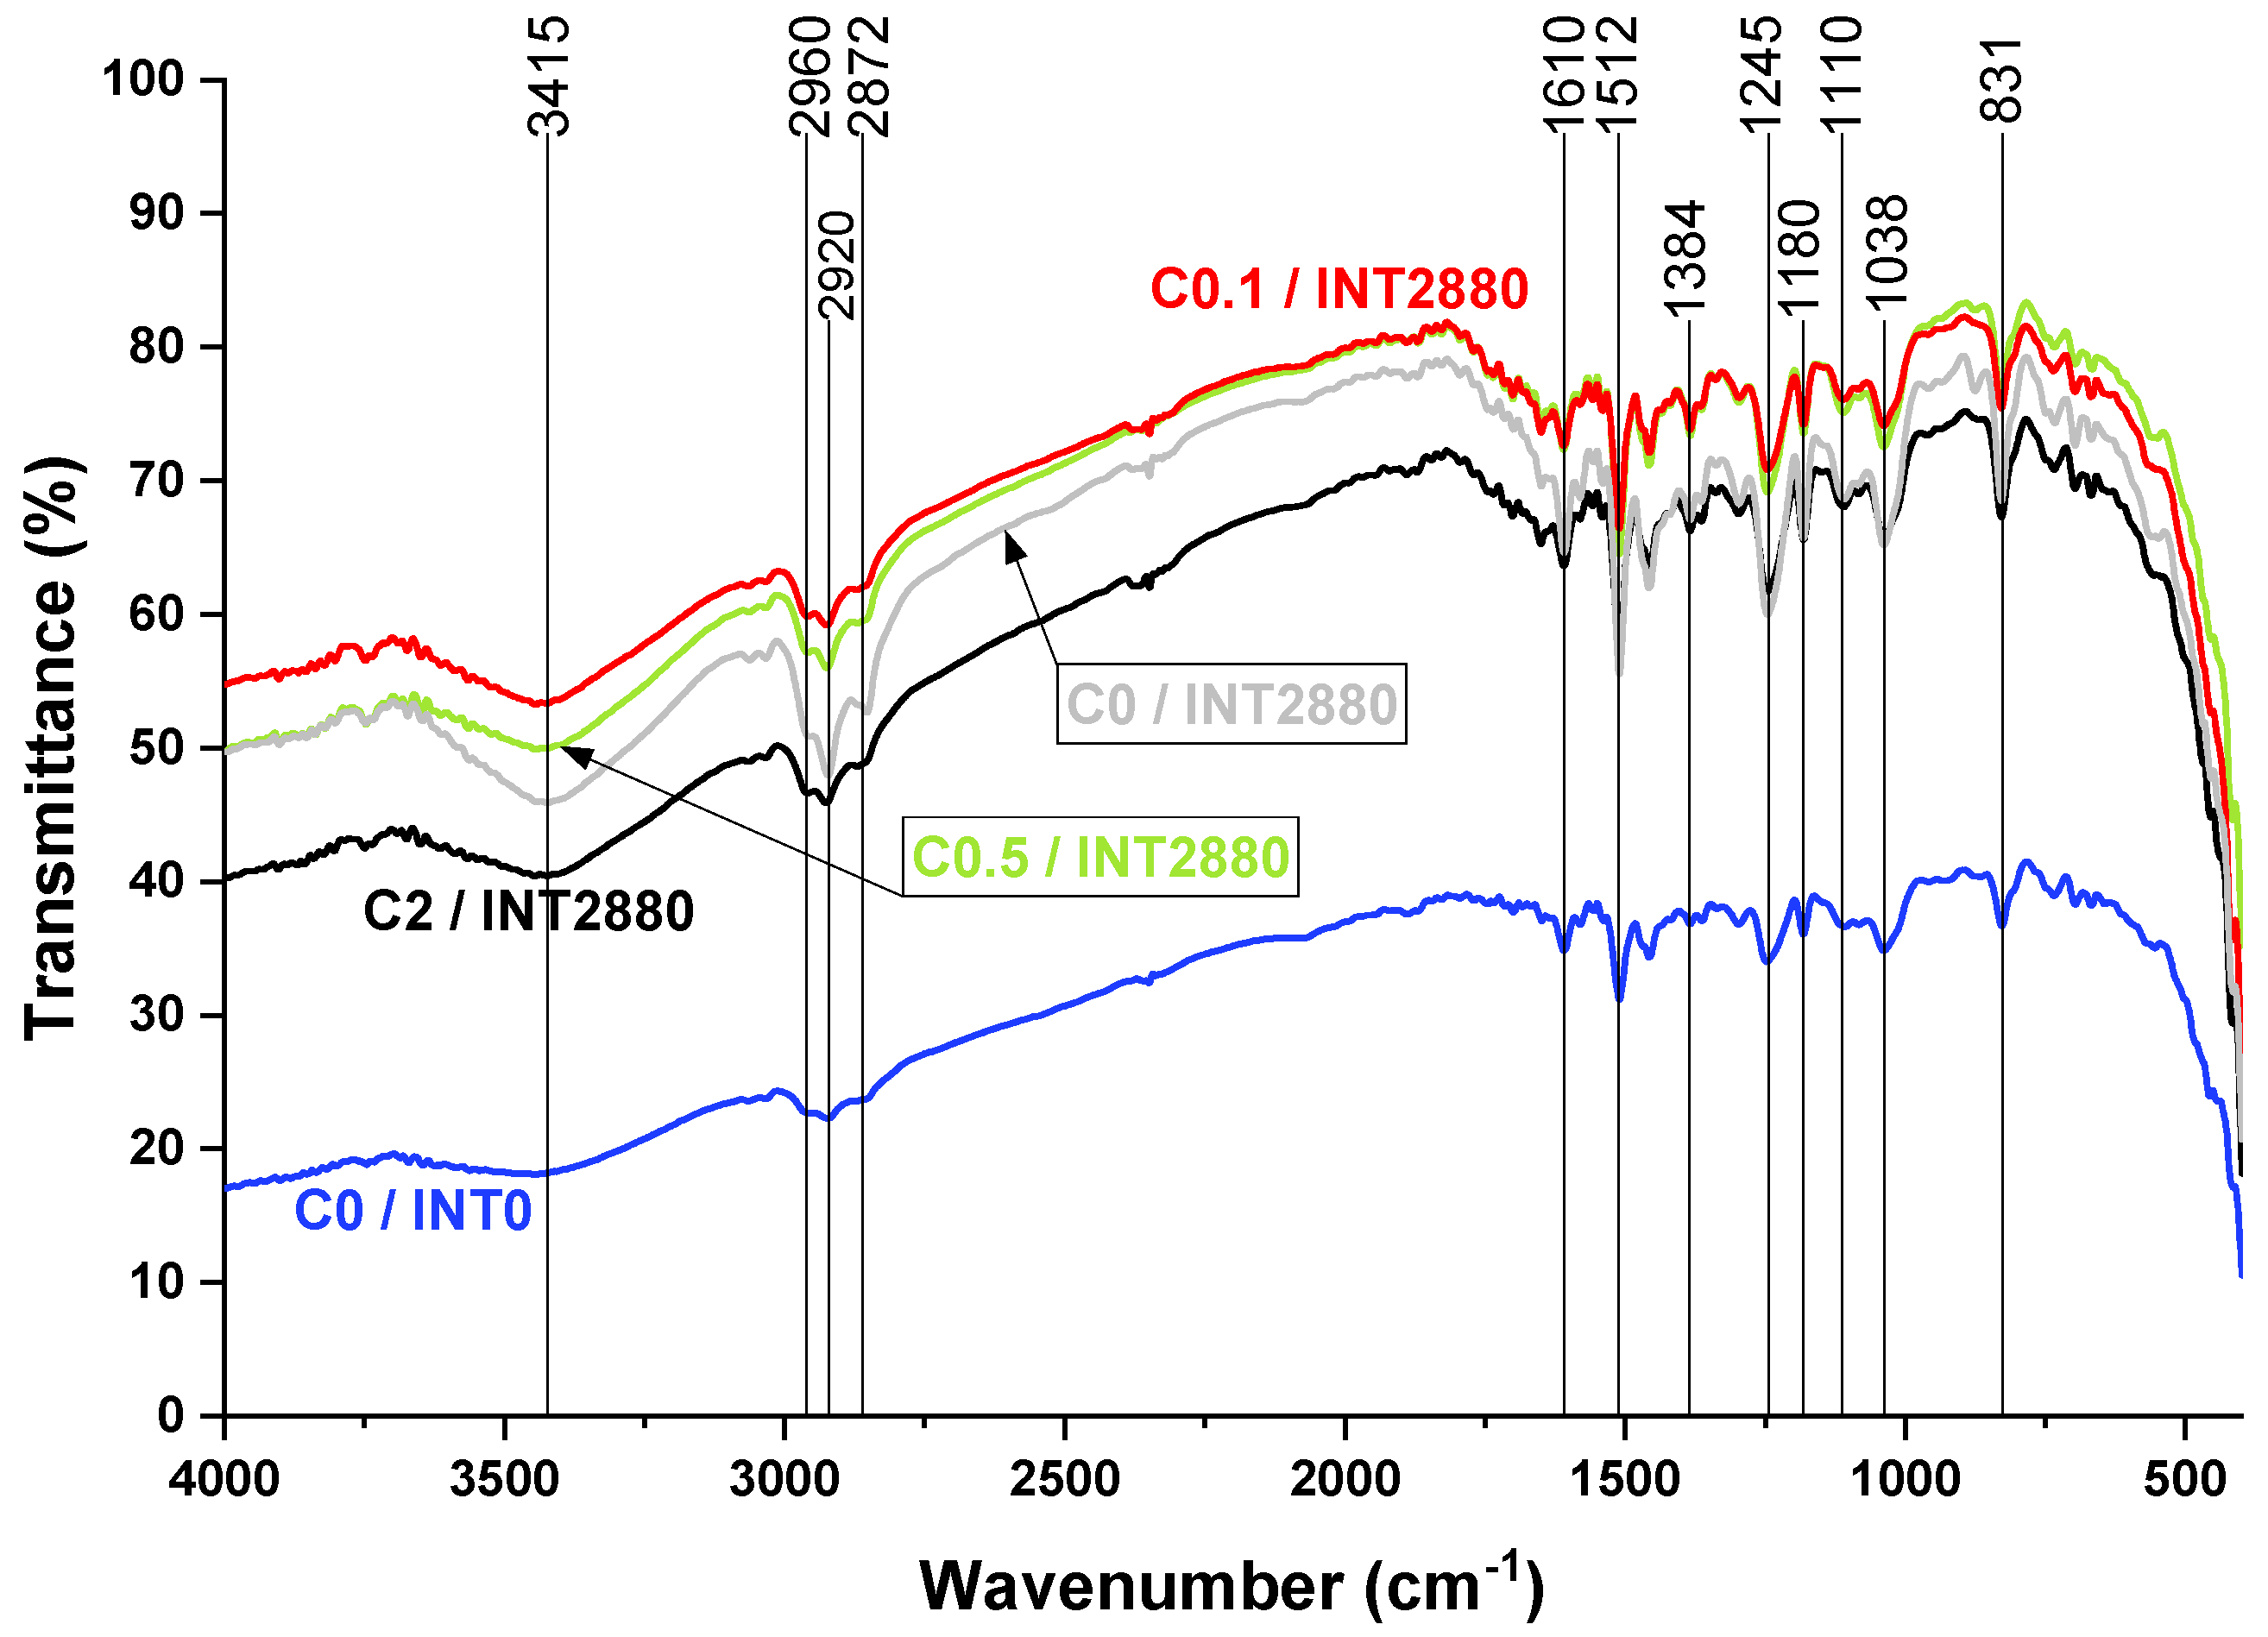
Figure 9 shows the FTIR spectra of epoxy resin and epoxy resin/ZnO samples before and after 2880 h of AWE treatment.
Table 1 summarizes the assignments for the main absorption bands of these spectra, according to the literature [
27,
47,
48]. However, the Zn-O stretching vibration, at approximately 500 cm
−1, is not discrete in the composite samples. The transmittance drop after 750 cm
−1 is explained by KBr presence, which was used as a carrier material in the tablets for the FTIR measurements. Additional measurements of KBr carrier alone revealed the aforementioned tendency.
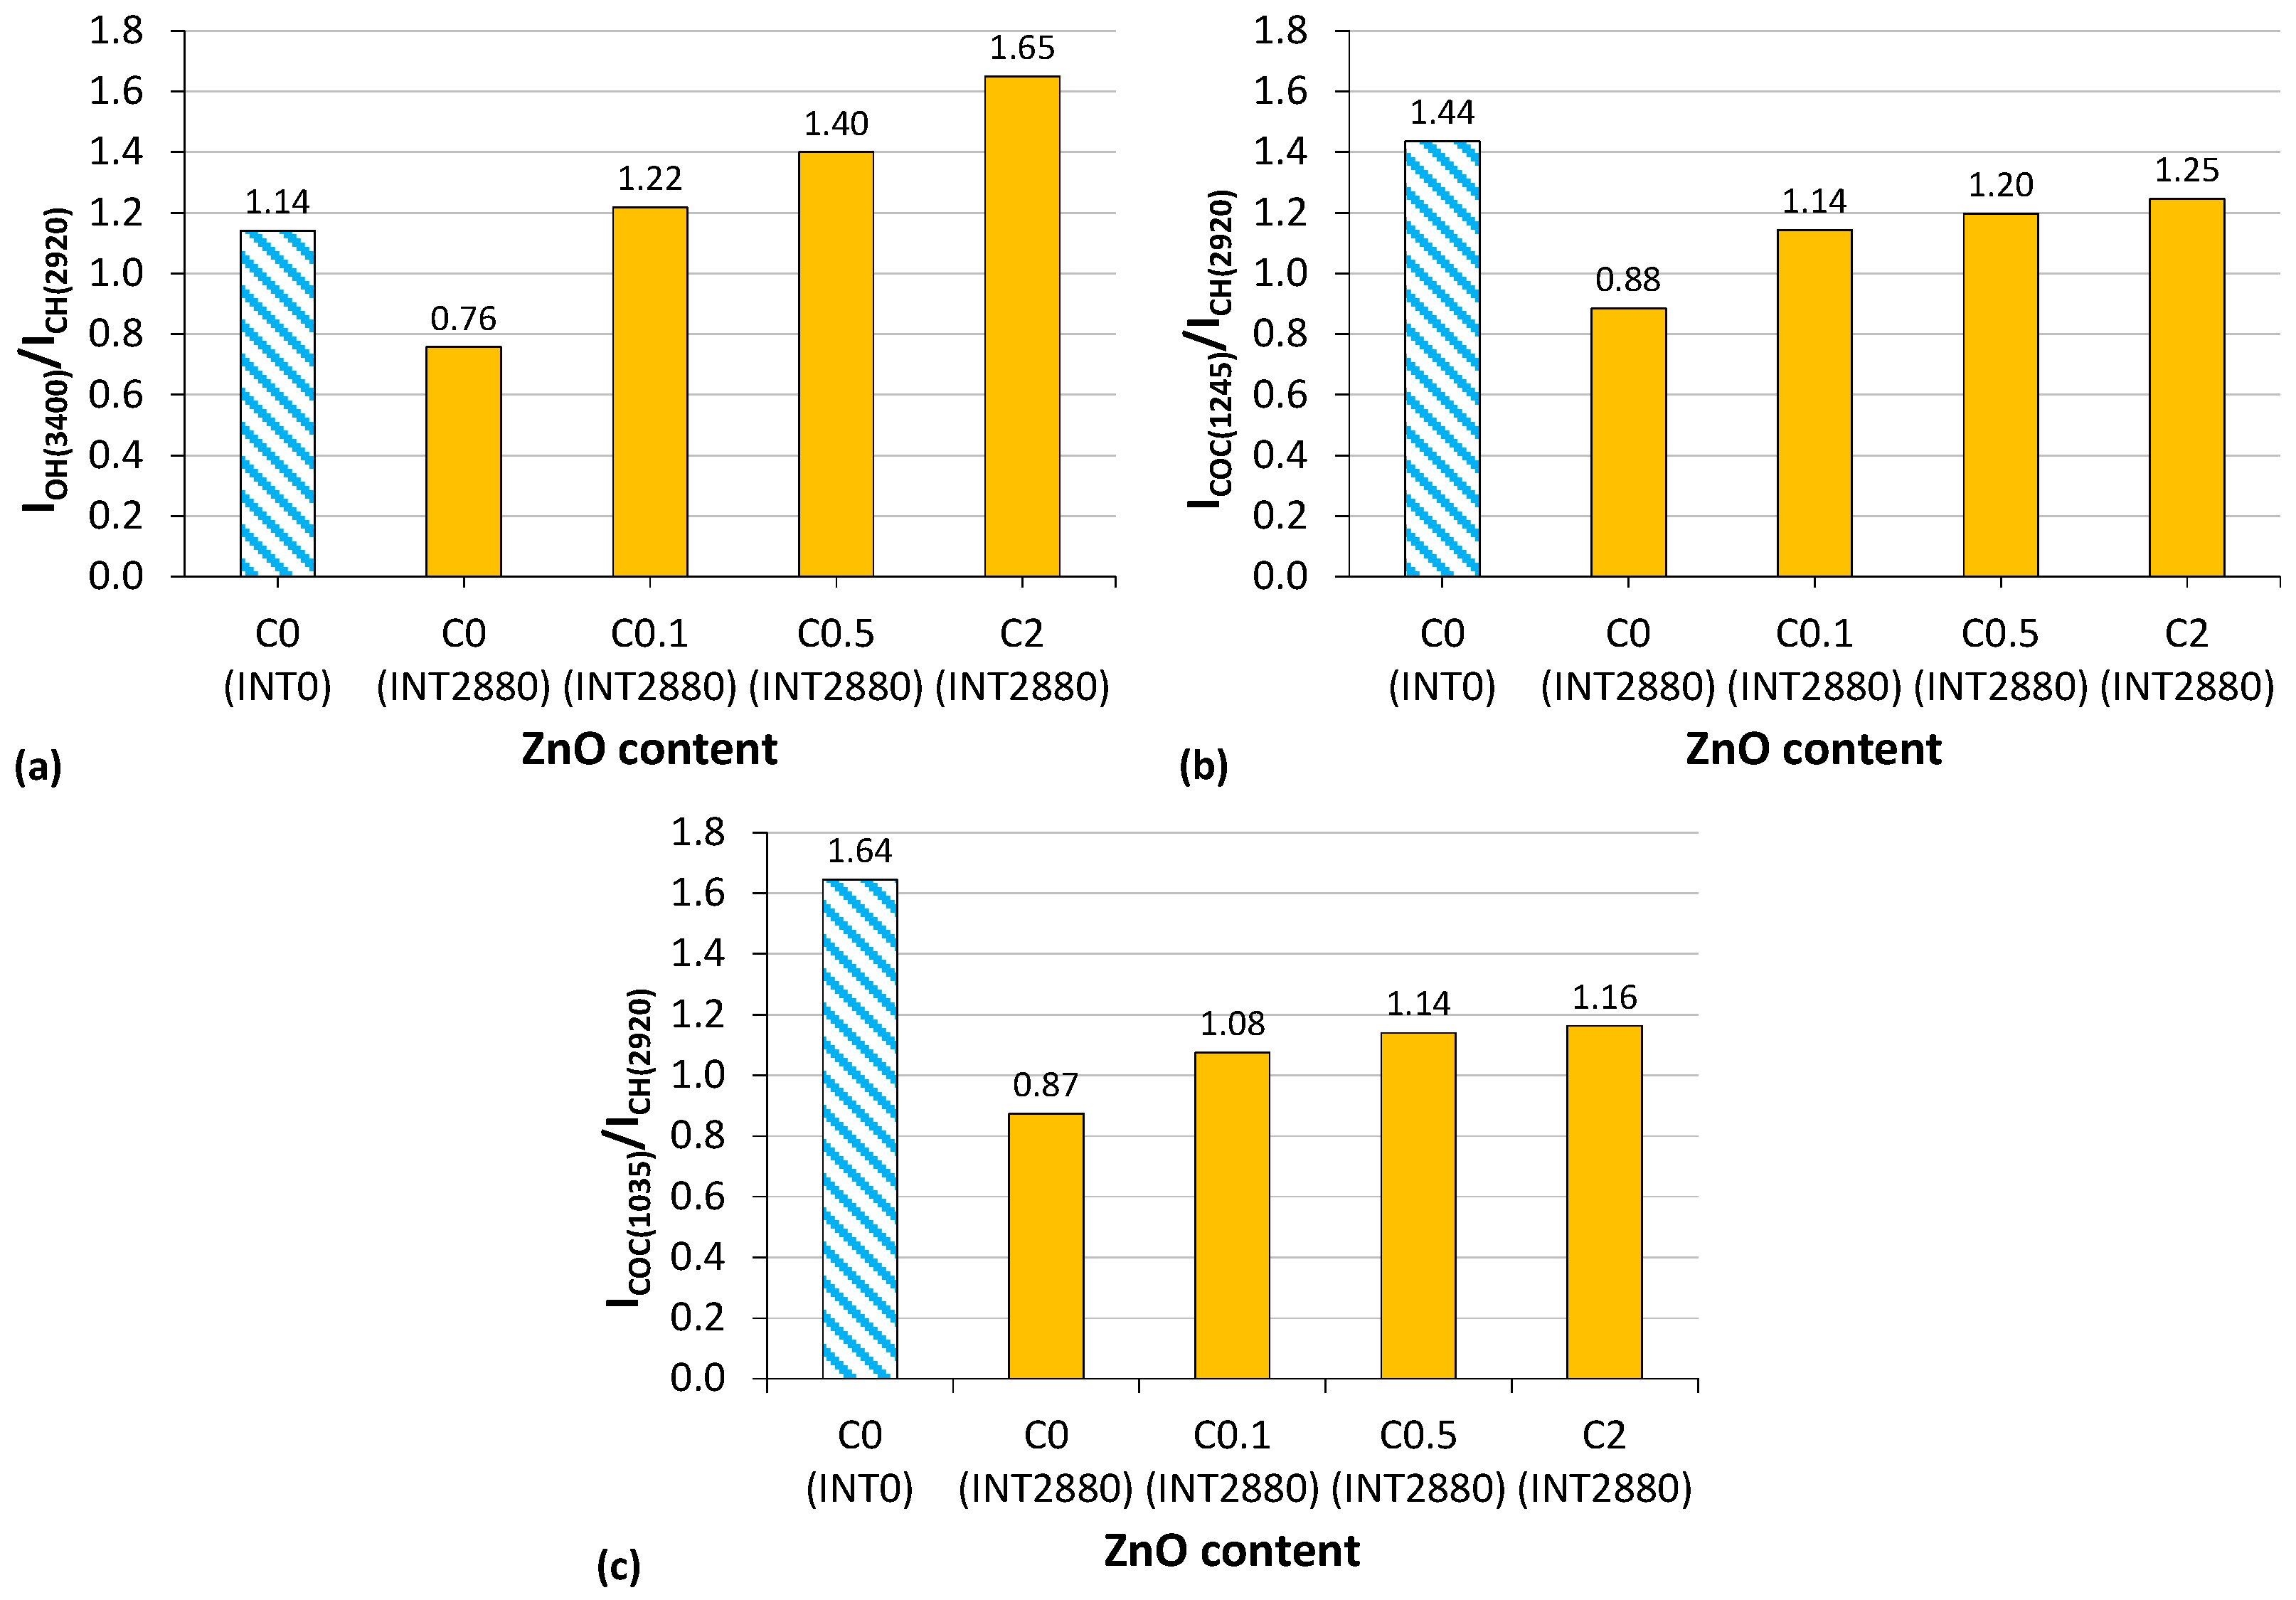
To study the photo-degradation phenomena and the effect of ZnO content, or the irradiated samples, the intensities of hydroxyl (I
OH(3400)), etheric (epoxide) (I
COC(1245), I
COC(1035)) and the C–H (I
CH(2920)) absorption bands were calculated, and the ratios I
OH(3400)/I
CH(2920), I
COC(1245)/I
CH(2920) and I
COC(1035)/I
CH(2920) were determined. The results of those calculations are presented in
Figure 10a–c.
According to
Figure 10a, the ratio I
OH(3400)/I
CH(2920) of the non-irradiated C0 sample was 1.14. After its irradiation, this ratio took a lower value (i.e., 0.76), indicating that photo-degradation of the resin takes place, eliminating –OH groups. The C0.1 sample exhibited a higher ratio value (i.e., 1.22), indicating that photo-oxidation reactions occur, creating –OH groups on the resin. By increasing the ZnO content up to C2, this ratio increased almost linearly, indicating that ZnO was responsible for withholding OH moieties [
49] during high moisture processing. As a result, ZnO prevented the resin from extensive photo-oxidation or photo-degradation reactions related to –OH groups.
According to
Figure 10b,c, the ratios I
COC(1245)/I
CH(2920) and I
COC(1035)/I
CH(2920) exhibited quite similar behaviour. The non-irradiated C0 samples exhibited higher ratios than the corresponding irradiated ones, which exhibit the lowest values. The latter showed that photo-degradation of the resins takes place, eliminating –C-O-C groups. By increasing the ZnO content (C0.1, C0.5 or C2), these ratios had lower values than the non-irradiated sample with 0 wt% ZnO; however, they were higher compared to C0 irradiated samples and the ratios increased with the increasing ZnO content. Thus, the incorporation of 2 wt% ZnO prevented the resin from extensive photo-degradation reactions related to –C-O-C groups.
3.7. Colorimetry
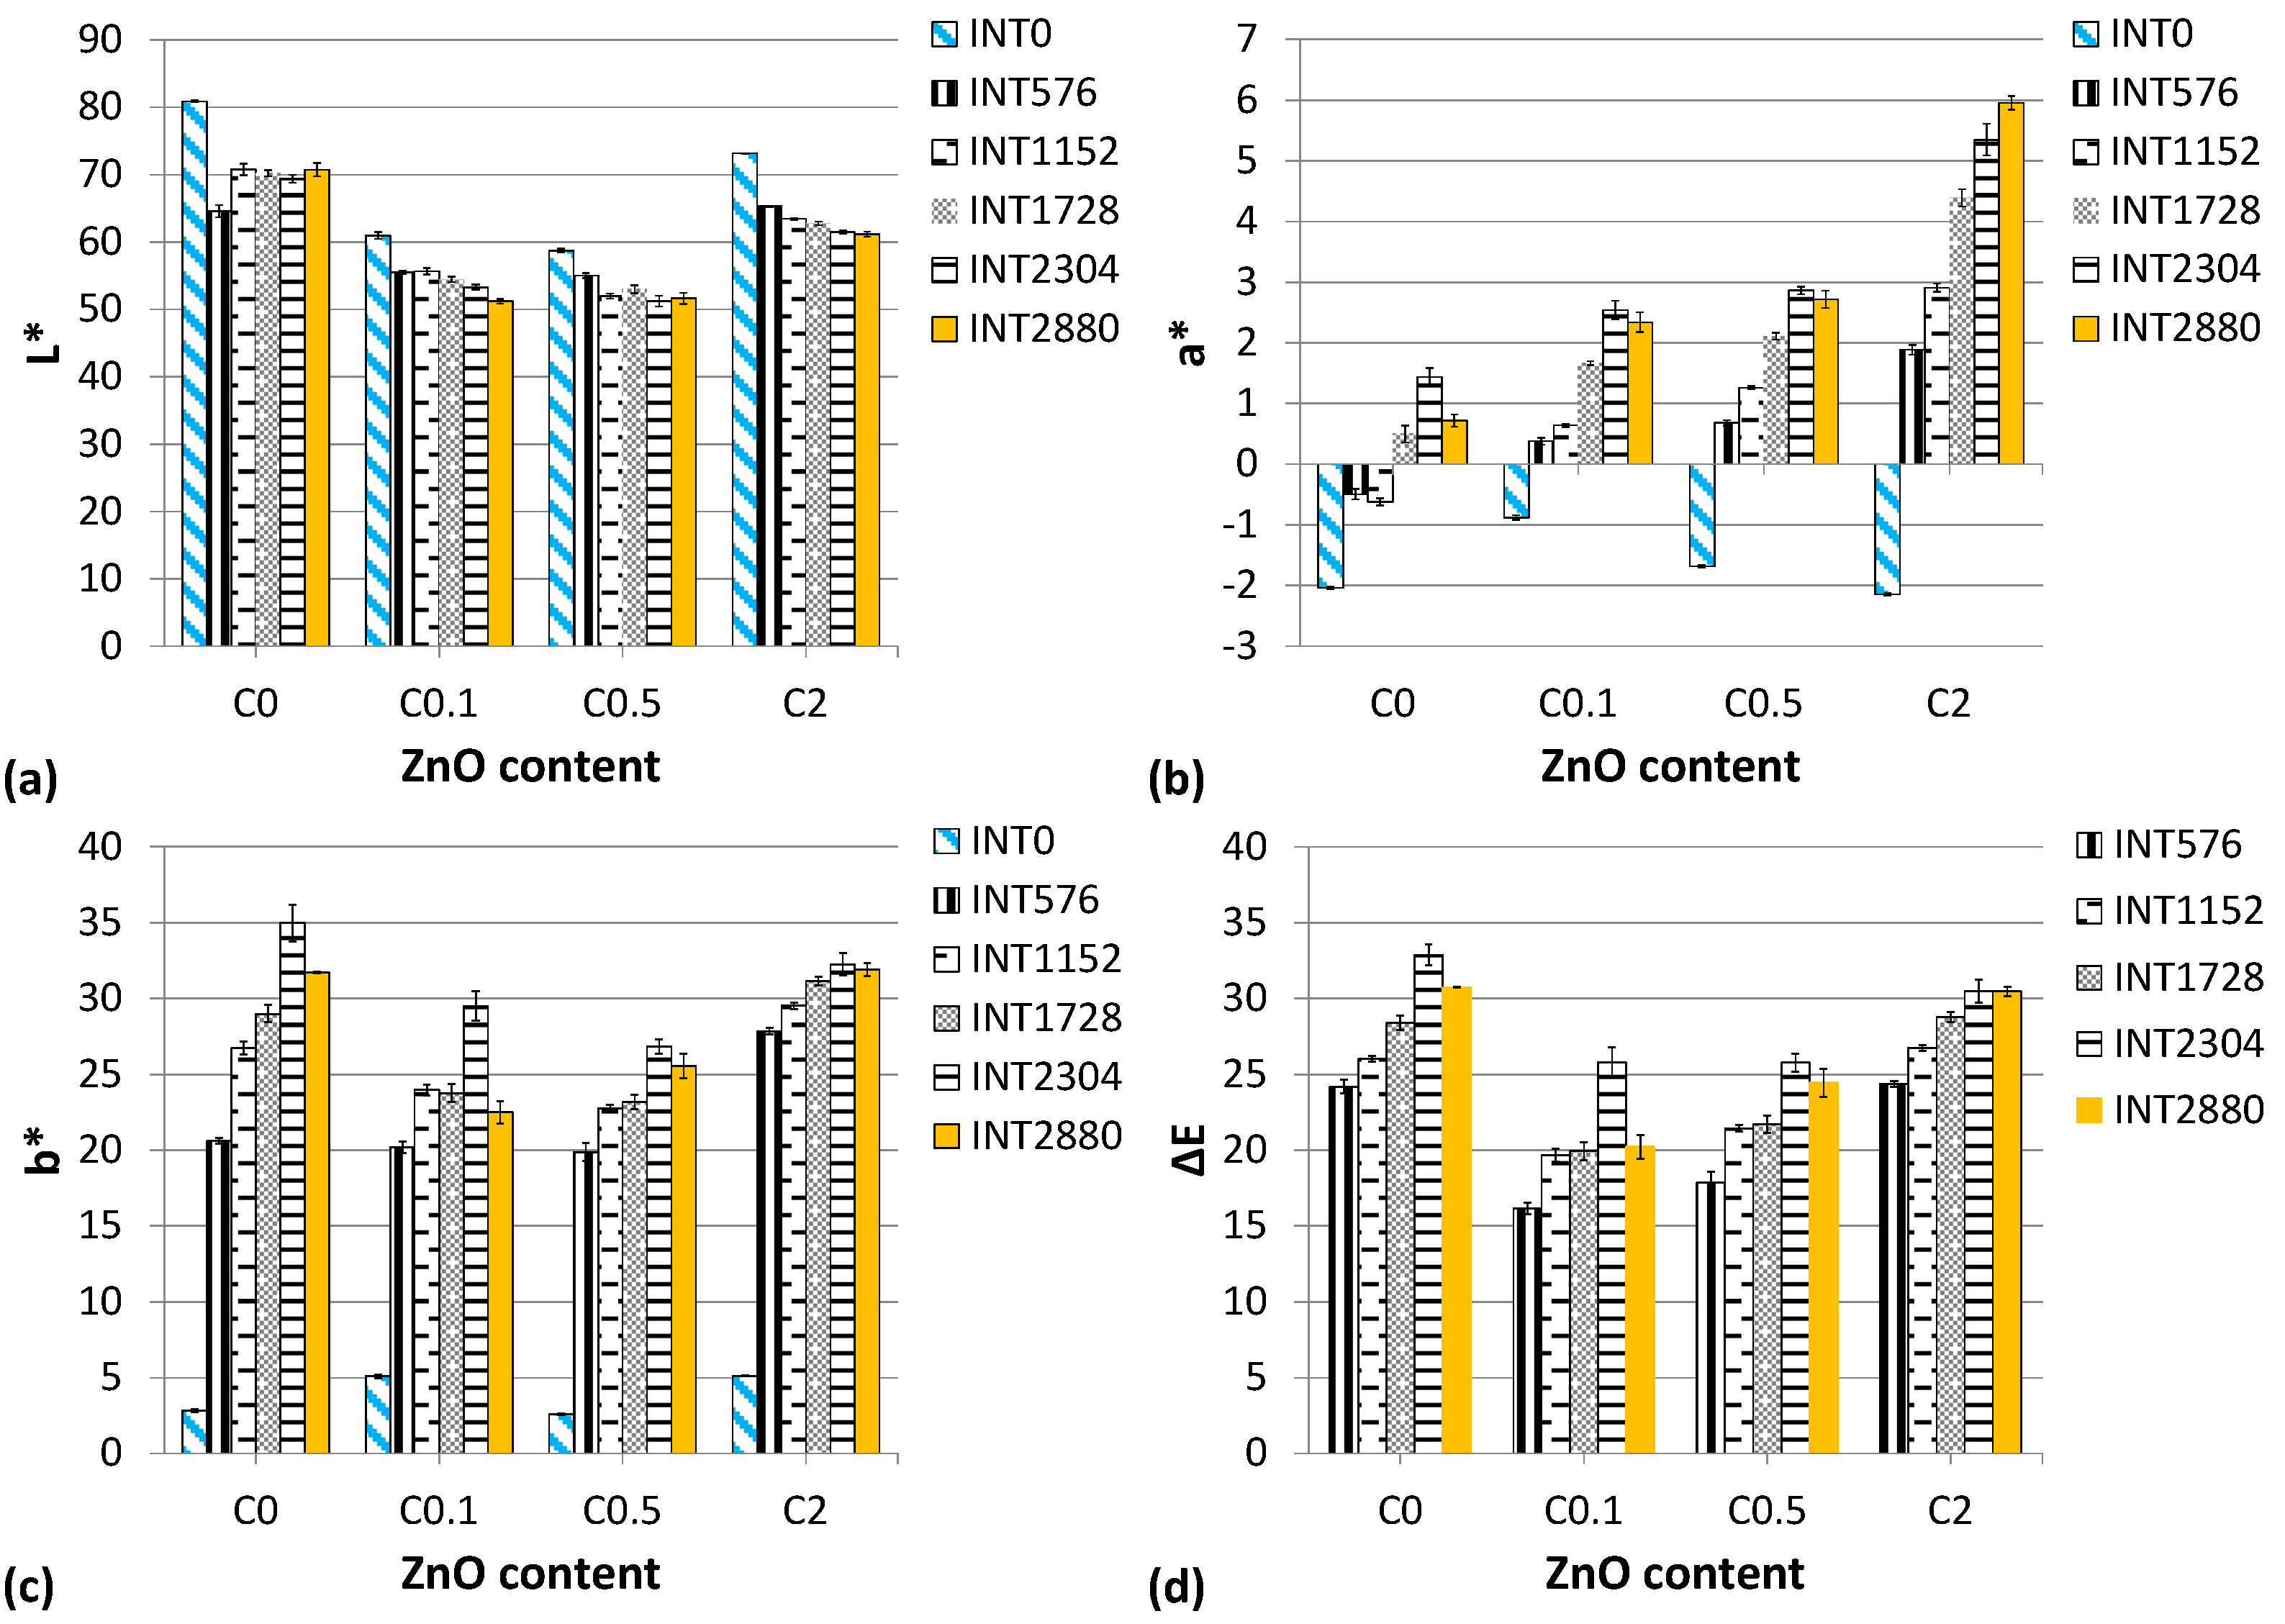
Based on
Figure 11a–c, unirradiated (INT0) bare epoxy resin (C0) was transparent and exhibited high L*, since measurements were conducted over a white background. Colour parameter a* was on the green scale (a* = −2), possibly due to a reaction between molecular oxygen and unreacted amine groups of the hardener [
50]. The same samples exhibited low values of colour parameter b* (yellowness) [
51], due to the presence of chromophore groups (i.e., nitrogen groups, conjugated bonds, etc.) also affected by auxochromic groups of the epoxy resin (i.e., –OH), even at low light conditions [
52]. Incorporation of ZnO filler into the epoxy matrix (INT0) caused lightness parameter L* to increase as the ZnO concentration increased. In the same manner as in bare samples, ZnO-loaded ones exhibited greenness (a* < 0) due to the hardener, as stated above, and to possible defects in ZnO crystal structure [
53]. Yellowness parameter b* did not undergo significant changes.
Furthermore, it is evident that, with the onset of AWE treatment (INT576), oxidation was induced on the C0 sample surfaces, resulting in a more yellowish hue. Treatment also caused parameter a* to increase and L* to decrease. The yellow colour grew more intense (increasing b* values) as the irradiation period progressed up to INT2304. This can be designated as a border AWE treatment interval, after which reduction in b* value at INT2880 is observed, denoting the initiating decomposition of –OH groups, as observed in FTIR measurements.
Moreover, colour parameter L* remained almost unaltered after INT576 for ZnO-loaded samples. Parameter a* continued to increase into the red region as AWE treatment progressed and as ZnO content increased. The latter may be attributed to ZnO crystal defects, namely oxygen vacancies (V
O) and oxygen interstitials (O
i), while –OH group defects contribute to yellowing [
54]. Regarding parameter b*, by increasing the ZnO content, smoother increases in b* values were observed. C0.1 and C0.5 samples exhibited the lowest yellowing during AWE treatment. C0 samples sustained the most abrupt increases as AWE treatment progresses, exhibiting the highest values at INT2304 compared to all samples. In the case of C2 samples, colour parameter b* underwent the smoothest changes as aging continues, indicating stabilization of the yellowing discoloration and thus, the aging of the composite, due to the protecting properties of the increased ZnO content. Finally, as a whole, ΔΕ of C0.1 and C0.5 samples was the lowest among all samples (
Figure 11d).
3.8. Dielectric Spectroscopy
The dielectric properties of the ZnO composite material of this study have been studied for the frequency range 10 MHz–1 GHz, which fully covers the VHF (30–300 MHz) and partially covers the UHF (300 MHz–1 GHz) frequency spectrum.
Both tan
δ and k’ of composite samples were higher in low frequencies, namely in the range 1 to 10 MHz, and they decayed by increasing frequency, but in a different manner. Decay of tan
δ was exponential, while decay of k’ was linear (
Figure S3.1a,b and S3.2a,b Addendum), regardless of filler loading and AWE treatment interval. Decay of tan
δ is attributed to reduction in electrical conductivity [
27]. The reason for k’ decay is the inability of the dipoles to maintain polarization as the frequency of the applied field increased [
27,
46]. The untreated and treated composites exhibited the same aforementioned behaviour as untreated C0 samples. Thus, dielectric properties of the composite were dominated by those of the epoxy material.
As observed in
Figure S3a Addendum, where the examined frequency range is 2 MHz–1 GHz, the most visually distinct dielectric relaxation phenomenon was observed at a frequency of 8 × 10
7 Hz and, to a lesser extent, at frequencies of 1 × 10
7 and 8 × 10
8 Hz. Moreover, at the end of the AWE treatment at INT2880, these relaxations shifted to lower frequencies, namely by 10 MHz, 1 MHz and 100 MHz, respectively, due to the aging of epoxy resin (
Figure S3a, Addendum). The main dielectric relaxation mechanisms in epoxy resin are defined as
α,
β and
γ relaxations; however, their discrimination requires a specialized study of these properties under temperature variations [
55]. While
α relaxation is prominent at lower frequencies,
β and
γ relaxations dominate at higher frequencies, mainly due to motions of dipolar groups like hydroxyl (–OH groups, tertiary amines), unreacted dipoles in resin (epoxy groups) and ZnO dipoles when present [
31,
55]. All these functional groups affect polarization and, consequently, dielectric permittivity of the composite. Additionally, ZnO electronic polarization decreases as the frequency of the applied field increases, significantly influenced by crystal defects. ZnO particle size affects the k’ values, which increase as the particle size increases [
31].
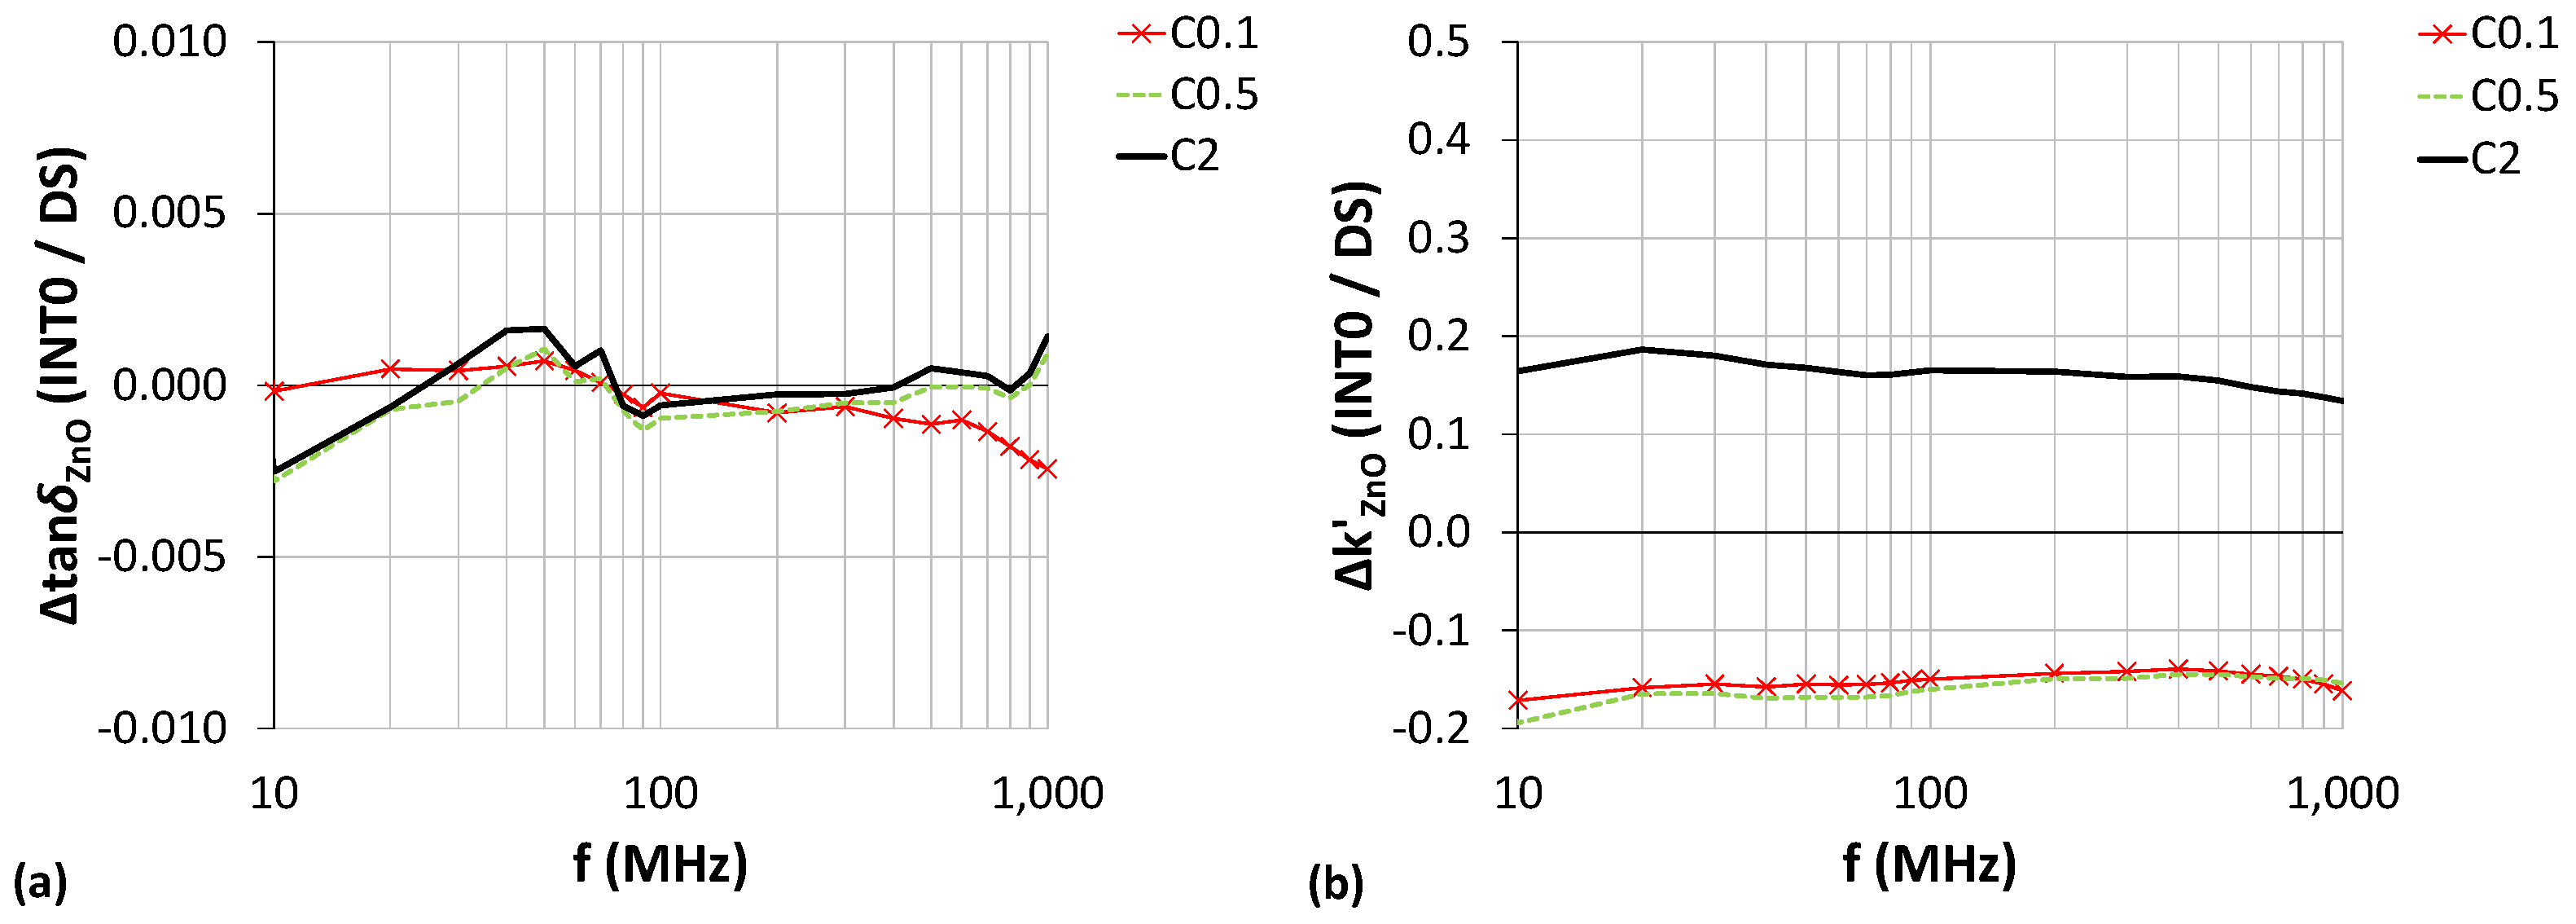
3.8.1. Impact of ZnO Filler on Dielectric Properties of Untreated Samples (INT0)
The impact of the ZnO filler on tan
δ was evaluated by comparing the tan
δ of untreated C0.1/C0.5/C2 reconditioned (DS) samples, at INT0, with the tan
δ of untreated bare (C0) samples. It was found that tan
δ is minimally affected by ZnO incorporation, especially at the low content C0.1 and C0.5 (
Figure 12a). In the same manner, k’ was increased in C2 samples and decreased in C0.1 and C0.5 (
Figure 12b). This phenomenon has been reported in the literature for the 1 × 10
7–1 × 10
9 frequency range [
27] and in lower frequencies as well [
23].
3.8.2. Impact of ZnO Filler on Dielectric Properties of Samples during AWE Treatment
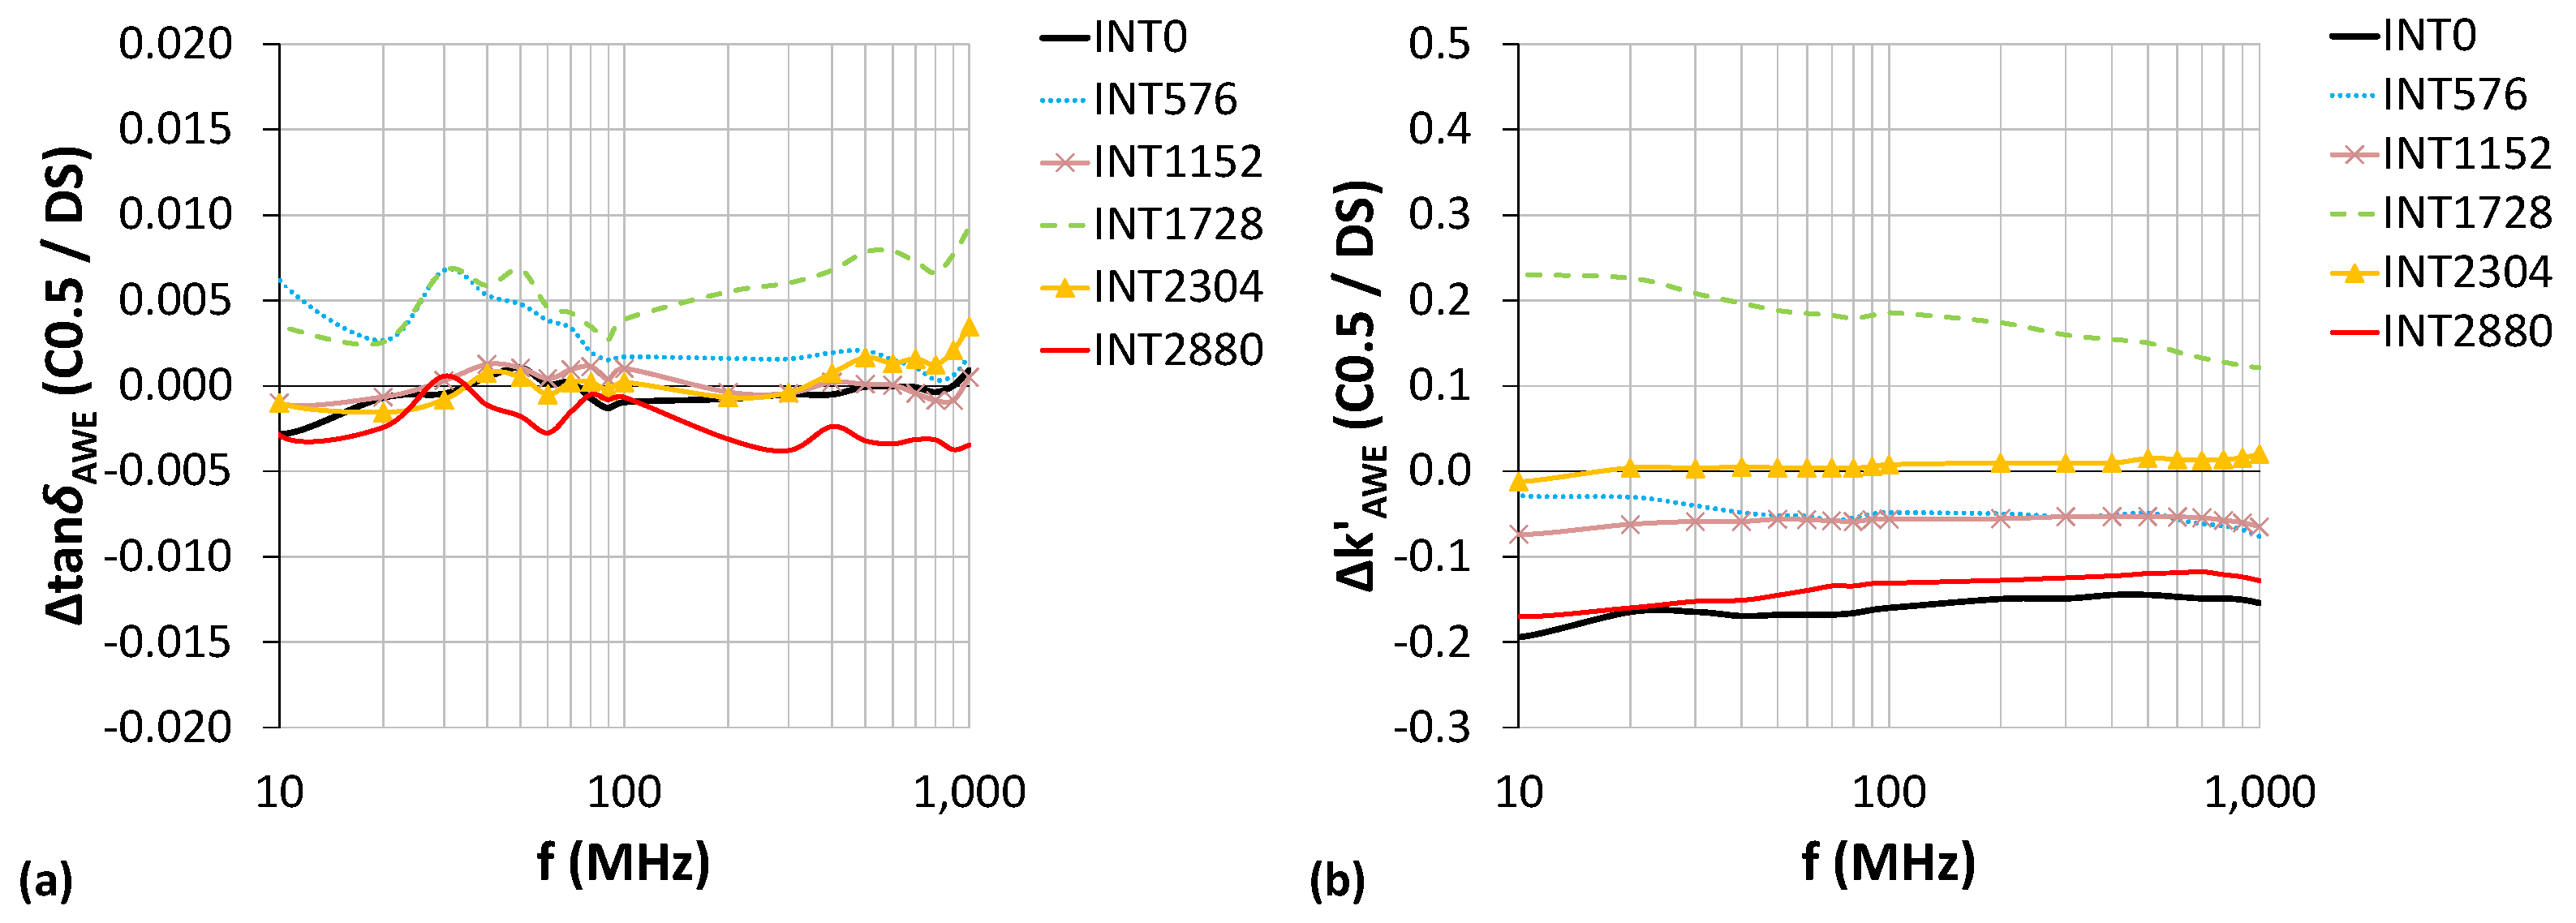
As AWE treatment progressed, Δtan
δ of ZnO-loaded samples compared to bare untreated samples (C0/INT0) was mostly unaffected, excluding an increase at INT576 (1 × 10
7–1 × 10
8 Hz) and at INT1728 in the whole range, both attributed to high moisture content (maximum at INT1728). In the end of the treatment (INT2880), tan
δ was reduced compared to INT0/C0, due to the stabilization effect of ZnO on epoxy resin photodegradation (
Figure 13a and
Figure S3.3a,c Addendum). On the other hand, Δk’ also underwent maximum increase during AWE treatment at INT1728, but in the end, it returned to the initial INT0 levels, which is also indicative of the stabilization of the material (
Figure 13b and
Figure S3.3b,d Addendum).
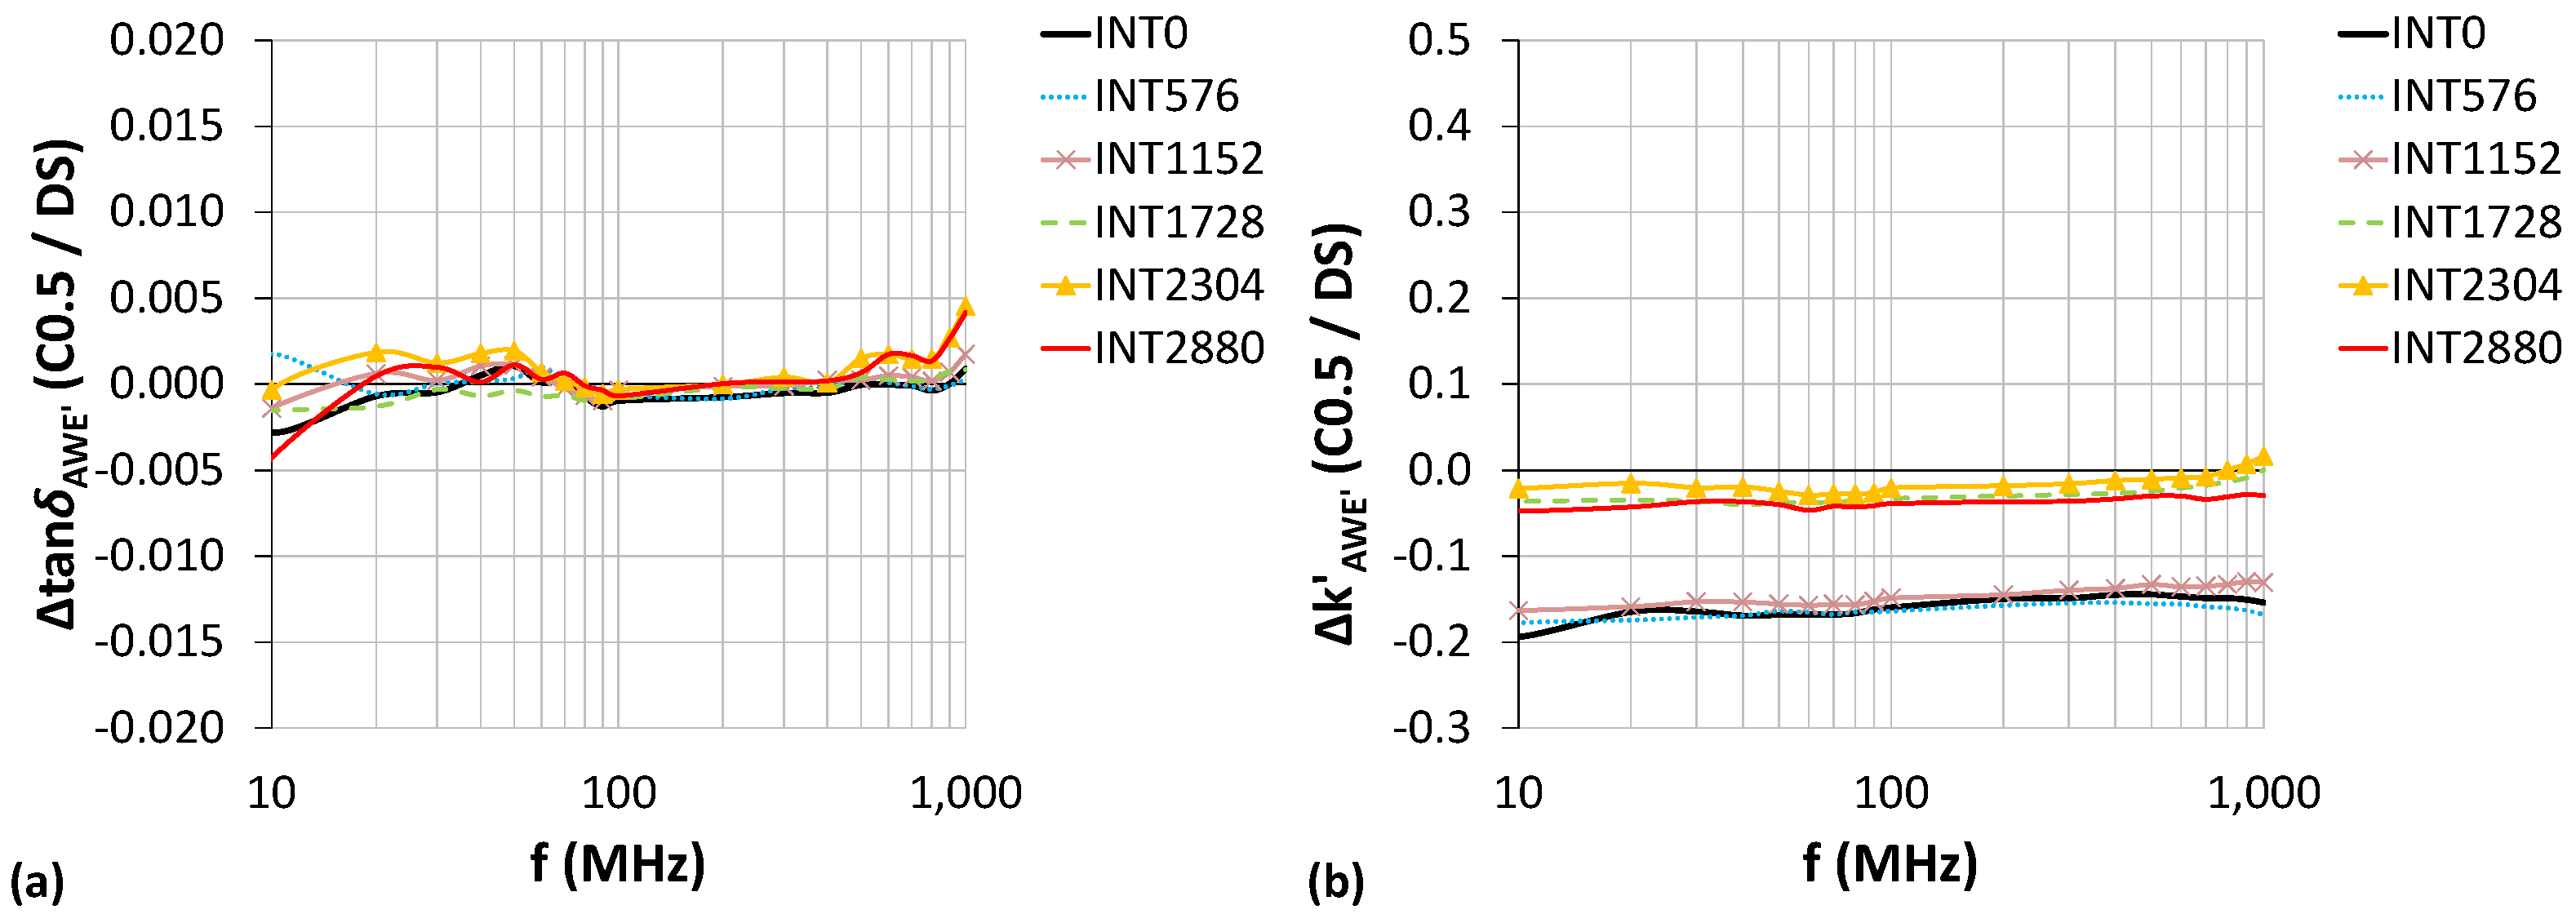
Figure 14a,b indicate the impact of ZnO on the epoxy resin loaded with 0.5 wt% ZnO during each AWE treatment interval (Δtan
δAWE’ and Δk’
AWE’ values of C0.5 samples were compared to C0 samples of the same interval). According to
Figure 14a, ZnO presence did not significantly affect Δtan
δAWE’ of the composite, which is also true for C0.1 and C2 samples (
Figure S3.4a,c Addendum). Regarding Δk’
AWE’ values, the presence of ZnO was responsible for maintaining the initial C0.5 low k’ values up to INT1152, after which an increase was observed at INT1728 that persisted until INT2880 (
Figure 14b). Despite this increase, INT2880 k’ values were still lower than the bare resin’s values, which is explained by the remaining moisture inside the samples’ bodies after maximum SM at INT1728 (
Figure 7b). C0.1 samples exhibited the same dielectric behaviour (
Figure S3.4b Addendum) in contrast to C2 samples, whose Δk’
AWE’ values remained positive since INT0 (
Figure S3.4d Addendum), indicating k’ increases due to the increased content of ZnO.
4. Discussion
Maximum WL (weight loss) was reported for all samples at INT1152, while maximum SM (sorbed moisture) was observed at INT1728. At INT2880, the ZnO-loaded composites exhibited the lowest WL, reaching a state of stabilization. SEM images complemented by EDS analyses revealed that the higher the ZnO loadings, the higher the protection against AWE treatment. This is evident in SEM images where ZnO-loaded samples did not contain surface pores and crack canals were shallower. These images, complemented with X-Ray diffraction patterns, revealed that effective ZnO dispersion was achieved. FTIR analysis showed that the decomposition of the composite’s surface was less as the ZnO filler content increased. C0.5 and C2 samples exhibited better stability of–C-O-C groups, together with the increase of –OH groups. On the other hand, C0 samples exhibited a high reduction in –OH and –C-O-C groups, denoting increased decomposition as corroborated by the presence of pores in SEM images. The wettability measurements revealed mild hydrophilicity that turned to hydrophobicity as ZnO content increased, due to the increasing surface roughness. In addition, AWE treatment only affected wettability of C2 samples by further increasing their hydrophobicity. In the same manner, only C2 samples underwent distinct gloss reduction due to filler incorporation and, consequently, due to AWE treatment. Additionally, C0.5 samples exhibited the lowest gloss reduction due to AWE treatment. UV-Vis measurements revealed that ZnO presence enhanced UV blocking capability as filler content increased up to 0.5 wt%, above which no significant changes were observed. Additionally, 2880 h aging only slightly reduced transmittance, most prominently at the 400–500 nm range for the ZnO-loaded samples. Colorimetric measurements showed that bare samples (C0) suffered significant yellowing at INT2304 due to AWE treatment, while C0.1 and C0.5 were the least affected. This constituted a border AWE treatment interval, after which reduction in b* value at INT2880 was observed only for low ZnO loadings (C0, C0.1), denoting the initiating decomposition of –OH groups, as observed in FTIR measurements. Additionally, the ΔE parameter revealed that the least colour change occurred to C0.1 and C0.5 samples.
A very interesting phenomenon is the ‘self-healing’ process of the epoxy matrix. Although the epoxy resin of the present study is thermosetting with an irreversible network structure, the ‘self-healing’ phenomena would occur at a very low degree [
56]. Indeed, the presence of residual thermoplastic epoxy resin would facilitate the crosslinking of unreacted epoxy groups in the presence of free OH functionalities and UV radiation impact. Based on the FTIR measurements, ether/epoxy linkages are present even after 2880 h of AWE treatment, and the presence of OH functionalities are also evident. Additionally, radial induced scissions, by the presence of the aforementioned functionalities, are certainly possible.
It should be noted that, although mechanical properties were not part of this study, according to the literature [
18], improved mechanical strength is also expected for our high content samples, namely for the C0.5 and C2 ones. This assumption can be substantiated by the interaction between ZnO filler and epoxy resin, where hydrogen bonding is expected between free OH groups on the nanoparticle surface and epoxide groups of the resin [
27].
Finally, dielectric properties were dominated by epoxy resin. Particularly, tanδ was unaffected by ZnO incorporation during all stages of AWE treatment. Interestingly, the relative permittivity, compared to that of bare epoxy, underwent significant reduction in C0.1 and C0.5 samples that was maintained up to INT1152; it suffered a small increase from INT1728 up to INT2880, but was still lower than the bare resin. On the other hand, k’ of C2 samples remained increased, compared to C0/INT0 samples, throughout the full AWE treatment period. Sorbed moisture, in general, caused an increase in tanδ and k’, both of which reached maximum levels at INT1728.
5. Conclusions
In this paper, a fully as-produced epoxy material reinforced with ZnO (nano)rods was conceptualized for the purpose of enclosing VHF/early UHF transceiving equipment for outdoor use. To that end, 20 samples of DGEBF epoxy resin were constructed, into which three different ZnO (nano)rod percentages were dispersed (0.1 wt%, 0.5 wt% and 2 wt%). In consequence, all samples, excluding control ones, were exposed to an artificial weathering environment (AWE) for a total period of 2880 h. Gravimetric, colorimetric and dielectric measurements were conducted every 576-h AWE treatment interval and were complemented by FTIR, UV-Vis, contact angle and gloss measurements that revealed the status change between the initial and final experimental phases. Of course, SEM and XRD characterizations of used materials complemented the entire experimental procedure.
The as-produced composite exhibited interesting dielectric behaviour, corroborated by multiple samples and multiple measurement points inside each sample. Specifically, although epoxy resin dominated overall dielectric behaviour, ZnO presence inflicted minimal impact to the composites’ loss tangent and a double effect to dielectric permittivity; k’ was reduced for C0.1 and C0.5 samples until INT1152, while it suffered an increase for C2 samples that was maintained from INT0 up to INT2880. At the same time, the composite was capable of withstanding the damaging effects of AWE treatment, especially as ZnO content increased (C0.5, C2). Hence, the low-k (4–5.2) constructed material attained not only moderate loss tangent levels (0.55–0.7) in the VHF/early UHF spectrum that were virtually unaltered by AWE treatment, but also reduced dielectric permittivity when compared to bare samples, thus exhibiting moderate radio frequency (RF) transparency.
The composite choice for potting electronic assemblies would be the C0.5, due to its overall stability of dielectric loss and its reduced dielectric permittivity. What is more, it exhibited excellent UV-blocking capabilities only slightly inferior to the C2 samples, one of the lowest colour changes, adequate ZnO dispersion and favourable stability of surface wettability and gloss. It should also be noted that, although similar dielectric behaviour is observed for C0.1 samples, it unfortunately comes together with a lower resistance to AWE treatment damage. Since the present study conforms to Technology Readiness Level 4, field testing would be the next phase of this research.
Supplementary Materials
The following supporting information can be downloaded at:
https://www.mdpi.com/article/10.3390/app13031375/s1, Figure S1: ZnO dispersion in C0.5 sample surfaces at INT2880, Figure S2: Weight loss (%) including initial 144-hour measurement intervals, Figure S3.1: Graphic representation of reconditioned samples’ dielectric behavior at INT0 in the full measurement range 2 × 10
6–1 × 10
9 Hz together with dielectric relaxation occurrence (
a) tan
δ, (
b) k’, Figure S3.2: Graphic representation of reconditioned samples’ dielectric behavior at INT2880 in the full measurement range 2 × 10
6–1 × 10
9 Hz together with dielectric relaxation occurrence (
a) tan
δ, (
b) k’, Figure S3.3: Dielectric properties of C0.1 & C2 samples during AWE treatment compared to C0/INT0 in DS (
a) Δtan
δAWE = tan
δC0.1/INTx − tan
δC0/INT0 (
b) Δk’
AWE = k’
C0.1/INTx − k’
C0/INT0 (
c) Δtan
δAWE = tan
δC2/INTx − tan
δC0/INT0 (
d) Δk’
AWE = k’
C2/INTx − k’
C0/INT0, Figure S3.4: Dielectric properties of C0.1 & C2 samples during AWE treatment compared to C0/INTx in DS (
a) Δtan
δAWE’ = tan
δC0.1/INTx − tan
δC0/INTx (
b) Δk’
AWE’ = k’
C0.1/INTx − k’
C0/INTx (
c) Δtan
δAWE’ = tan
δC2/INTx − tan
δC0/INTx (
d) Δk’
AWE’ = k’
C2/INTx − k’
C0/INTx.
Author Contributions
Conceptualization, G.P. and P.V.; methodology, G.P., P.V. and P.G.; validation, P.V. and E.H.; formal analysis, P.G., E.H. and P.V.; investigation, G.P.; writing—original draft preparation, G.P.; writing—review and editing, G.P., P.G., T.A., E.H. and P.V.; visualization, G.P.; supervision, P.V. and E.H.; project administration, P.V., E.H. and P.G. All authors have read and agreed to the published version of the manuscript.
Funding
This research received no external funding.
Institutional Review Board Statement
Not applicable.
Informed Consent Statement
Not applicable.
Data Availability Statement
Acknowledgments
Gratitude is expressed to Constantine T. Dervos for his invaluable guidance at the beginning of this study and Ioannis E. Markodimitrakis for the conduction of wettability measurements. Special thanks to Nikolaos P. Roussos (PPC S.A./Innovation Hub) for providing access to SEM equipment.
Conflicts of Interest
The authors declare no conflict of interest.
References
- Baig, Z.; Mamat, O.; Mustapha, M. Recent Progress on the Dispersion and the Strengthening Effect of Carbon Nanotubes and Graphene-Reinforced Metal Nanocomposites: A Review. Crit. Rev. Solid State Mater. Sci. 2018, 43, 1–46. [Google Scholar] [CrossRef]
- Cassidy, P.; Mores, M.; Kerwick, D.; Koeck, D.; Verschoor, K.; White, D. Chemical resistance of geosynthetic materials. Geotext. Geomembr. 1992, 11, 61–98. [Google Scholar] [CrossRef]
- Ahmad, D.; van den Boogaert, I.; Miller, J.; Presswell, R.; Jouhara, H. Hydrophilic and hydrophobic materials and their applications. Energy Sources Part A Recover. Util. Environ. Eff. 2018, 40, 2686–2725. [Google Scholar] [CrossRef]
- Orlova, L.A.; Chainikova, A.S.; Alekseeva, L.A.; Voropaeva, M.V. Recent advances in radio transparent glass-ceramic materials based on high-temperature aluminosilicate systems. Russ. J. Inorg. Chem. 2015, 60, 1692–1707. [Google Scholar] [CrossRef]
- Patel, M.; Pardhi, B.; Chopara, S.; Pal, M. Lightweight composite materials for automotive—A review. Carbon 2018, 1, 151. [Google Scholar]
- Brebu, M. Environmental Degradation of Plastic Composites with Natural Fillers—A Review. Polymers 2020, 12, 166. [Google Scholar] [CrossRef] [PubMed] [Green Version]
- Yousif, E.; Haddad, R. Photodegradation and photostabilization of polymers, especially polystyrene: Review. SpringerPlus 2013, 2, 398. [Google Scholar] [CrossRef] [Green Version]
- Gu, X.; Michaels, C.A.; Drzal, P.L.; Jasmin, J.; Martin, D.; Nguyen, T.; Martin, J.W. Probing photodegradation beneath the surface: A depth profiling study of UV-degraded polymeric coatings with microchemical imaging and nanoindentation. J. Coat. Technol. Res. 2007, 4, 389–399. [Google Scholar] [CrossRef]
- Powers, D. Interaction of Water with Epoxy; Sandia National Laboratories (SNL): Albuquerque, NM, USA; Livermore, CA, USA, 2009. [Google Scholar]
- Taghavi, S.G. Moisture Effects on High Performance Polymer Composites. Ph.D. Thesis, University of Toronto, Toronto, ON, Canada, 2000. [Google Scholar]
- Hassoon, N.; Almuradi, S. An Experimental Investigation of Moisture Effect on Fatigue Behavior of Composite Materials. Eur. J. Mech. Eng. Res. 2016, 3, 1–18. [Google Scholar]
- Krauklis, A.; Gagani, A.I.; Echtermeyer, A.T. Hygrothermal Aging of Amine Epoxy: Reversible Static and Fatigue Properties. Open Eng. 2018, 8, 447–454. [Google Scholar] [CrossRef]
- Startsev, V.; Lebedev, M.; Khrulev, K.; Molokov, M.; Frolov, A.; Nizina, T. Effect of outdoor exposure on the moisture diffusion and mechanical properties of epoxy polymers. Polym. Test. 2018, 65, 281–296. [Google Scholar] [CrossRef]
- Saba, N.; Jawaid, M.; Alothman, O.Y.; Paridah, M.; Hassan, A. Recent advances in epoxy resin, natural fiber-reinforced epoxy composites and their applications. J. Reinf. Plast. Compos. 2015, 35, 447–470. [Google Scholar] [CrossRef]
- Ramadan, N.; Taha, M.; La Rosa, A.; Elsabbagh, A. Towards Selection Charts for Epoxy Resin, Unsaturated Polyester Resin and Their Fibre-Fabric Composites with Flame Retardants. Materials 2021, 14, 1181. [Google Scholar] [CrossRef] [PubMed]
- Pham, H.Q.; Marks, M.J. Epoxy Resins. In Ullmann’s Encyclopedia of Industrial Chemistry; Wiley-VCH Verlag: Weinheim, Germany, 2005. [Google Scholar]
- Jin, F.-L.; Li, X.; Park, S.-J. Synthesis and application of epoxy resins: A review. J. Ind. Eng. Chem. 2015, 29, 1–11. [Google Scholar] [CrossRef]
- Ding, K.H.; Wang, G.L.; Zhang, M. Characterization of mechanical properties of epoxy resin reinforced with submicron-sized ZnO prepared via in situ synthesis method. Mater. Des. 2011, 32, 3986–3991. [Google Scholar] [CrossRef]
- Baghdadi, Y.N.; Youssef, L.; Bouhadir, K.; Harb, M.; Mustapha, S.; Patra, D.; Tehrani-Bagha, A.R. The effects of modified zinc oxide nanoparticles on the mechanical/thermal properties of epoxy resin. J. Appl. Polym. Sci. 2020, 137, 49330. [Google Scholar] [CrossRef]
- Georgiou, P.; Kolokotronis, K.; Simitzis, J. Synthesis of ZnO Nanostructures by Hydrothermal Method. J. Nano Res. 2009, 6, 157–168. [Google Scholar] [CrossRef] [Green Version]
- Hardoň, Š.; Kúdelčík, J.; Hornak, J.; Trnka, P.; Tamus, Z.A.; Koltunowicz, T. Effect of ZnO nanoparticles on the dielectric properties of polyurethane and epoxy resins. AIP Conf. Proc. 2021, 2411, 040004. [Google Scholar]
- Patel, R.R.; Gupta, N. Dielectric spectroscopy of epoxy-based nanodielectrics with metal oxide fillers. In Proceedings of the 2010 Annual Report Conference on Electrical Insulation and Dielectic Phenomena, West Lafayette, IN, USA, 17–20 October 2010; pp. 1–4. [Google Scholar]
- Singha, S.; Thomas, M.J. Dielectric properties of epoxy nanocomposites. IEEE Trans. Dielectr. Electr. Insul. 2008, 15, 12–23. [Google Scholar] [CrossRef]
- Singh, S.K.; Akhtar, M.; Kar, K.K. Impact of Al2O3, TiO2, ZnO and BaTiO3 on the microwave absorption properties of exfoliated graphite/epoxy composites at X-band frequencies. Compos. Part B Eng. 2019, 167, 135–146. [Google Scholar] [CrossRef]
- Wei, P.; Zhu, D.; Huang, S.; Zhou, W.; Luo, F. Effects of the annealing temperature and atmosphere on the microstructures and dielectric properties of ZnO/Al2O3 composite coatings. Appl. Surf. Sci. 2013, 285, 577–582. [Google Scholar] [CrossRef]
- Martin, P.M.; Good, M.S.; Johnston, J.W.; Posakony, G.J.; Bond, L.J.; Crawford, S.L. Piezoelectric films for 100-MHz ultrasonic transducers. Thin Solid Film. 2000, 379, 253–258. [Google Scholar] [CrossRef]
- Singha, S.; Thomas, M.J. Influence of filler loading on dielectric properties of epoxy-ZnO nanocomposites. IEEE Trans. Dielectr. Electr. Insul. 2009, 16, 531–542. [Google Scholar] [CrossRef]
- Wang, X.; Chen, Q.; Yang, H.; Zhou, K.; Ning, X. Electrical properties of epoxy/ZnO nano-composite. J. Mater. Sci. Mater. Electron. 2018, 29, 12765–12770. [Google Scholar] [CrossRef]
- Dervos, C.T.; Glenis, G.X.; Georgiou, P.; Argyropoulos, T.G. The energetically confined traps on a semiconductor surface as a potent energy harvester: Case study for the ZnO nano-flowers. Mater. Res. Express 2015, 2, 045501. [Google Scholar] [CrossRef]
- Ponnamma, D.; Cabibihan, J.-J.; Rajan, M.; Pethaiah, S.S.; Deshmukh, K.; Gogoi, J.P.; Pasha, S.K.K.; Ahamed, M.B.; Krishnegowda, J.; Chandrashekar, B.N.; et al. Synthesis, optimization and applications of ZnO/polymer nanocomposites. Mater. Sci. Eng. C 2019, 98, 1210–1240. [Google Scholar] [CrossRef]
- Kaur, D.; Bharti, A.; Sharma, T.; Madhu, C. Dielectric Properties of ZnO-Based Nanocomposites and Their Potential Applications. Int. J. Opt. 2021, 2021, 9950202. [Google Scholar] [CrossRef]
- Duncan, B.; Broughton, W. Absorption and Diffusion of Moisture in Polymeric Materials; National Physical Laboratory: Teddington, UK.
- Oliveira, M.S.; da Luz, F.S.; Pereira, A.C.; Costa, U.O.; Bezerra, W.B.A.; Cunha, J.d.S.C.d.; Lopera, H.A.C.; Monteiro, S.N. Water Immersion Aging of Epoxy Resin and Fique Fabric Composites: Dynamic–Mechanical and Morphological Analysis. Polymers 2022, 14, 3650. [Google Scholar] [CrossRef]
- Shinagawa, T.; Shibata, K.; Shimomura, O.; Chigane, M.; Nomura, R.; Izaki, M. Solution-processed high-haze ZnO pyramidal textures directly grown on a TCO substrate and the light-trapping effect in Cu2O solar cells. J. Mater. Chem. C 2014, 2, 2908–2917. [Google Scholar] [CrossRef]
- Katiyar, A.; Kumar, N.; Shukla, R.K.; Srivastava, A. Substrate free ultrasonic-assisted hydrothermal growth of ZnO nanoflowers at low temperature. SN Appl. Sci. 2020, 2, 1386. [Google Scholar] [CrossRef]
- Urs, K.; Kamble, V. Surface Photovoltage Response of Zinc Oxide Microrods on prismatic planes: Effect of UV, Temperature and Oxygen ambience. J. Mater. Sci. Mater. Electron. 2021, 32, 6414–6424. [Google Scholar] [CrossRef]
- Mote, V.; Purushotham, Y.; Dole, B. Williamson-Hall analysis in estimation of lattice strain in nanometer-sized ZnO particles. J. Theor. Appl. Phys. 2012, 6, 6. [Google Scholar] [CrossRef] [Green Version]
- Ben Moussa, S.; Namouchi, F.; Guermazi, H. Elaboration, structural and optical investigations of ZnO/epoxy nanocomposites. Eur. Phys. J. Plus 2015, 130, 152. [Google Scholar] [CrossRef]
- Butt, S.U.; Khattak, A.; Ali, A.; Faiza; Imran, K.; Ullah, N.; Alahmadi, A.A.; Khan, A. Investigation of epoxy composites for outdoor insulation under accelerated ultraviolet exposure. Mater. Res. Express 2021, 8, 085303. [Google Scholar] [CrossRef]
- Nundy, S.; Ghosh, A.; Mallick, T.K. Hydrophilic and Superhydrophilic Self-Cleaning Coatings by Morphologically Varying ZnO Microstructures for Photovoltaic and Glazing Applications. ACS Omega 2020, 5, 1033–1039. [Google Scholar] [CrossRef] [Green Version]
- Myint, M.T.Z.; Kumar, N.S.; Hornyak, G.L.; Dutta, J. Hydrophobic/hydrophilic switching on zinc oxide micro-textured surface. Appl. Surf. Sci. 2013, 264, 344–348. [Google Scholar] [CrossRef]
- Darband, G.B.; Aliofkhazraei, M.; Khorsand, S.; Sokhanvar, S.; Kaboli, A. Science and Engineering of Superhydrophobic Surfaces: Review of Corrosion Resistance, Chemical and Mechanical Stability. Arab. J. Chem. 2020, 13, 1763–1802. [Google Scholar] [CrossRef]
- Nguyen, T.V.; Dao, P.H.; Duong, K.L.; Duong, Q.H.; Vu, Q.T.; Nguyen, A.H.; Mac, V.P.; Le, T.L. Effect of R-TiO2 and ZnO nanoparticles on the UV-shielding efficiency of water-borne acrylic coating. Prog. Org. Coat. 2017, 110, 114–121. [Google Scholar] [CrossRef]
- Huang, J.; Ye, Y.; Lei, Z.; Ye, X.; Rong, M.; Zhang, M. Highly luminescent and transparent ZnO quantum dots-epoxy composite used for white light emitting diodes. Phys. Chem. Chem. Phys. PCCP 2014, 16, 5480–5484. [Google Scholar] [CrossRef]
- Lowry, M.; Hubble, D.; Wressell, A.; Vratsanos, M.; Pepe, F.; Hegedus, C. Assessment of UV-permeability in nano-ZnO filled coatings via high throughput experimentation. J. Coat. Technol. Res. 2008, 5, 233–239. [Google Scholar] [CrossRef]
- Jilani, W.; Fourati, N.; Zerrouki, C.; Gallot-Lavallée, O.; Guermazi, H. Optical, Dielectric Properties and Energy Storage Efficiency of ZnO/Epoxy Nanocomposites. J. Inorg. Organomet. Polym. Mater. 2019, 29, 456–464. [Google Scholar] [CrossRef]
- CRamírez-Herrera, A.; Cruz-Cruz, I.; Jiménez-Cedeño, I.H.; Martínez-Romero, O.; Elías-Zúñiga, A. Influence of the Epoxy Resin Process Parameters on the Mechanical Properties of Produced Bidirectional [±45°] Carbon/Epoxy Woven Composites. Polymers 2021, 13, 1273. [Google Scholar] [CrossRef] [PubMed]
- Nikolic, G.; Zlatkovic, S.; Cakic, M.; Cakic, S.; Lacnjevac, C.; Rajic, Z. Fast Fourier Transform IR Characterization of Epoxy GY Systems Crosslinked with Aliphatic and Cycloaliphatic EH Polyamine Adducts. Sensors 2010, 10, 684–696. [Google Scholar] [CrossRef]
- Viñes, F.; Iglesias-Juez, A.; Illas, F.; Fernández-García, M. Hydroxyl Identification on ZnO by Infrared Spectroscopies: Theory and Experiments. J. Phys. Chem. C 2014, 118, 1492–1505. [Google Scholar] [CrossRef]
- Atherton, N.M.; Banks, L.G.; Ellis, B. Development of green and dark blue colors in epoxy resins cured with 4,4′-diaminodiphenylmethane. J. Appl. Polym. Sci. 1982, 27, 2015–2023. [Google Scholar] [CrossRef]
- Krauklis, A.E.; Echtermeyer, A.T. Mechanism of Yellowing: Carbonyl Formation during Hygrothermal Aging in a Common Amine Epoxy. Polymers 2018, 10, 1017. [Google Scholar] [CrossRef] [PubMed] [Green Version]
- Down, J.L. The Yellowing of Epoxy Resin Adhesives: Report on High-Intensity Light Aging. Stud. Conserv. 1986, 31, 159. [Google Scholar] [CrossRef]
- Thomas, D.; Sadasivuni, K.K.; Waseem, S.; Kumar, B.; Cabibihan, J.-J. Synthesis, green emission and photosensitivity of Al-doped ZnO film. Microsyst. Technol. 2018, 24, 3069–3073. [Google Scholar] [CrossRef]
- Kobayashi, R.; Kishi, T.; Katayanagi, Y.; Yano, T.; Matsushita, N. Fabrication of nitrogen-doped ZnO nanorod arrays by hydrothermal synthesis and ambient annealing. RSC Adv. 2018, 8, 23599–23605. [Google Scholar] [CrossRef] [Green Version]
- Singha, S.; Thomas, M.J. Permittivity and tan delta characteristics of epoxy nanocomposites in the frequency range of 1 MHz-1 GHz. IEEE Trans. Dielectr. Electr. Insul. 2008, 15, 2–11. [Google Scholar] [CrossRef] [Green Version]
- Zhang, F.; Zhang, L.; Yaseen, M.; Huang, K. A review on the self-healing ability of epoxy polymers. J. Appl. Polym. Sci. 2021, 138, 50260. [Google Scholar] [CrossRef]
Figure 1.
(a,b) SEM images of ZnO powder at various magnifications.
Figure 1.
(a,b) SEM images of ZnO powder at various magnifications.
Figure 2.
(a–d) SEM images of INT2880 sample surfaces at ZnO loadings (a) C0, (b) C0.1, (c) C0.5, (d) C2. The white arrow indicates a zoomed-in pore area and black arrows point to cracks of the corresponding surfaces.
Figure 2.
(a–d) SEM images of INT2880 sample surfaces at ZnO loadings (a) C0, (b) C0.1, (c) C0.5, (d) C2. The white arrow indicates a zoomed-in pore area and black arrows point to cracks of the corresponding surfaces.
Figure 3.
Energy dispersive spectroscopy on the scanning electron microscope for C2 samples. Green, orange and blue embedded images indicate the presence of carbon (C), oxygen (O) and zinc (Zn), respectively.
Figure 3.
Energy dispersive spectroscopy on the scanning electron microscope for C2 samples. Green, orange and blue embedded images indicate the presence of carbon (C), oxygen (O) and zinc (Zn), respectively.
Figure 4.
(a,b) X-Ray diffraction peaks of (a) lab-produced ZnO powder, (b) samples containing ZnO filler at 0 wt%, 0.1 wt%, 0.5 wt% and 2 wt%.
Figure 4.
(a,b) X-Ray diffraction peaks of (a) lab-produced ZnO powder, (b) samples containing ZnO filler at 0 wt%, 0.1 wt%, 0.5 wt% and 2 wt%.
Figure 5.
Sample surface gloss changes due to AWE treatment.
Figure 5.
Sample surface gloss changes due to AWE treatment.
Figure 6.
Contact angle change due to AWE treatment.
Figure 6.
Contact angle change due to AWE treatment.
Figure 7.
(a,b) Percentages of (a) weight loss of reconditioned samples relative to previous interval, (b) sorbed moisture relative to the average sample group average weight.
Figure 7.
(a,b) Percentages of (a) weight loss of reconditioned samples relative to previous interval, (b) sorbed moisture relative to the average sample group average weight.
Figure 8.
(a,b). Transmittance of reconditioned samples (DS) at (a) INT0 and (b) INT2880.
Figure 8.
(a,b). Transmittance of reconditioned samples (DS) at (a) INT0 and (b) INT2880.
Figure 9.
FTIR spectra of bare and ZnO composite samples.
Figure 9.
FTIR spectra of bare and ZnO composite samples.
Figure 10.
(
a–
c) Ratios of (
a) I
OH(3400)/I
CH(2920), (
b) I
COC(1245)/I
CH(2920), (
c) I
COC(1035)/I
CH(2920) (based on
Figure 9).
Figure 10.
(
a–
c) Ratios of (
a) I
OH(3400)/I
CH(2920), (
b) I
COC(1245)/I
CH(2920), (
c) I
COC(1035)/I
CH(2920) (based on
Figure 9).
Figure 11.
(a–d) CIELAB colour parameters (a) L*, (b) a*, (c) b* and (d) ΔE of sample surfaces during AWE treatment.
Figure 11.
(a–d) CIELAB colour parameters (a) L*, (b) a*, (c) b* and (d) ΔE of sample surfaces during AWE treatment.
Figure 12.
(a,b) Dielectric properties due to incorporation of ZnO (nano)rods. (a) ΔtanδZnO = tanδCx − tanδC0 at INT0/DS, (b) Δk’ZnO = k’Cx − k’C0 at INT0/DS.
Figure 12.
(a,b) Dielectric properties due to incorporation of ZnO (nano)rods. (a) ΔtanδZnO = tanδCx − tanδC0 at INT0/DS, (b) Δk’ZnO = k’Cx − k’C0 at INT0/DS.
Figure 13.
(a,b) Dielectric properties of C0.5 samples during AWE treatment compared to C0/INT0 in DS. (a) ΔtanδAWE = tanδC0.5/INTx − tanδC0/INT0, (b) Δk’AWE = k’C0.5/INTx − k’ C0/INT0.
Figure 13.
(a,b) Dielectric properties of C0.5 samples during AWE treatment compared to C0/INT0 in DS. (a) ΔtanδAWE = tanδC0.5/INTx − tanδC0/INT0, (b) Δk’AWE = k’C0.5/INTx − k’ C0/INT0.
Figure 14.
(a,b) Dielectric properties of C0.5 samples during AWE treatment compared to C0 in DS. (a) ΔtanδAWE’ = tanδC0.5/INTx − tanδC0/INTx (b) Δk’AWE’ = k’C0.5/INTx − k’ C0/INTx.
Figure 14.
(a,b) Dielectric properties of C0.5 samples during AWE treatment compared to C0 in DS. (a) ΔtanδAWE’ = tanδC0.5/INTx − tanδC0/INTx (b) Δk’AWE’ = k’C0.5/INTx − k’ C0/INTx.
Table 1.
Band assignments of FTIR spectrum with common functional groups.
Table 1.
Band assignments of FTIR spectrum with common functional groups.
| Wave Number (cm−1) | Functional Groups |
|---|
| 3415 | O–H stretching and symmetric stretching of primary amine |
| 2960, 2920, 2872 | C–H stretching of CH2 and CH3 aromatic and aliphatic |
| 1610 | C=C stretching vibration of aromatic ring, N–H bending of primary amine |
| 1512 | C–C stretching vibration of aromatic ring |
| 1384 | C–N stretching vibration of imide |
| 1245 | C–C–O–C stretching vibration of ether linkage |
| 1180 | C–O stretching vibration of aromatic ring |
| 1110 | Aromatic stretching, C–N |
| 1038 | C–O–C stretching vibration of ether linkage |
| 831 | H–C= out-of-plane bending |
| - | Zn–O stretching vibration |
| Disclaimer/Publisher’s Note: The statements, opinions and data contained in all publications are solely those of the individual author(s) and contributor(s) and not of MDPI and/or the editor(s). MDPI and/or the editor(s) disclaim responsibility for any injury to people or property resulting from any ideas, methods, instructions or products referred to in the content. |
© 2023 by the authors. Licensee MDPI, Basel, Switzerland. This article is an open access article distributed under the terms and conditions of the Creative Commons Attribution (CC BY) license (https://creativecommons.org/licenses/by/4.0/).


 ,
, 


