
Fatigue Crack Propagation under Christmas Tree Load Pattern

 , ,
, ,
Abstract
:1. Introduction
2. Numerical Model
2.1. Specimen
2.2. Material
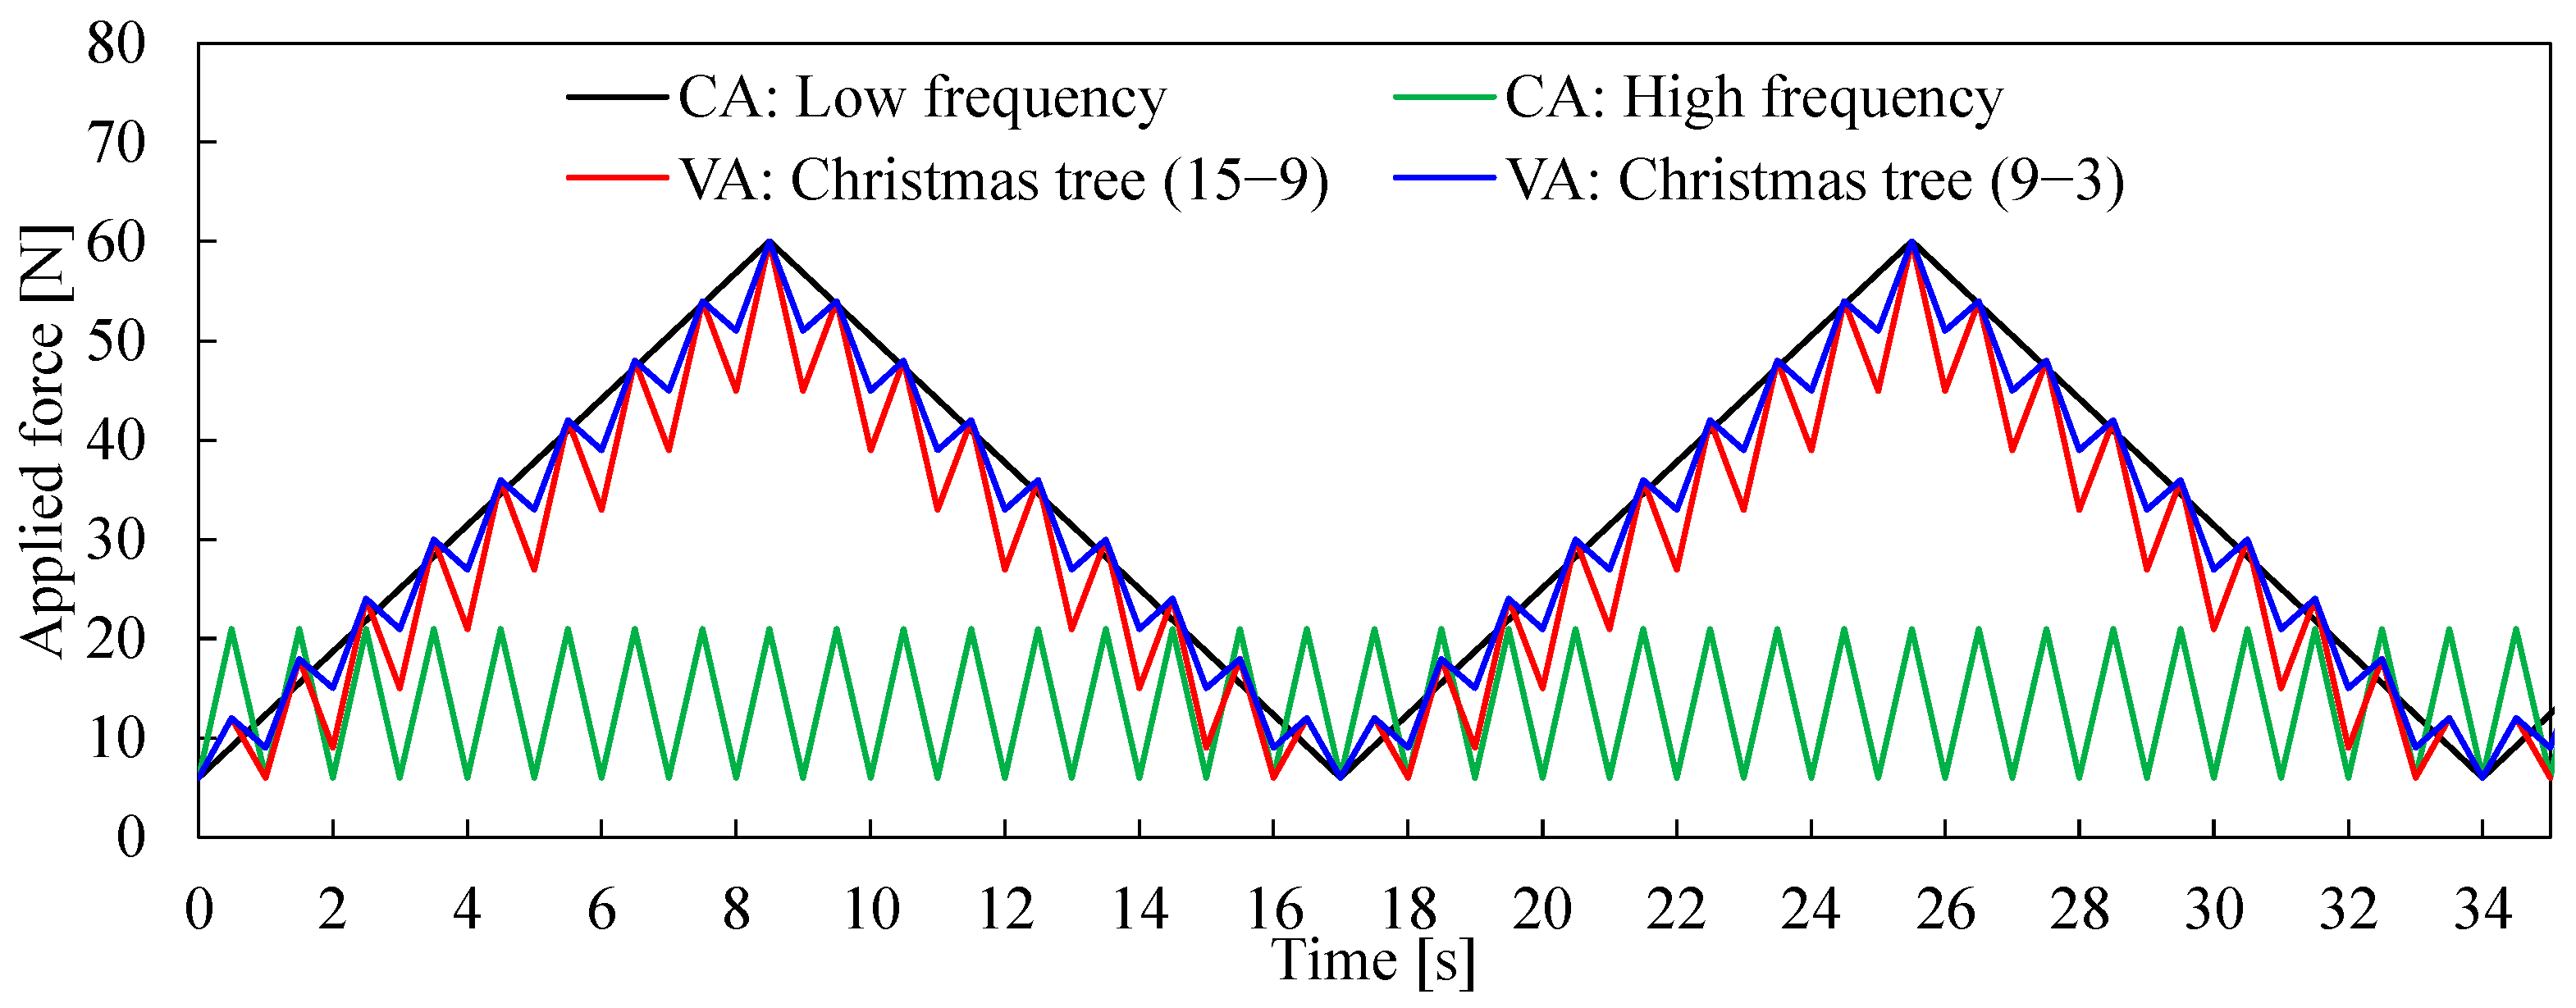
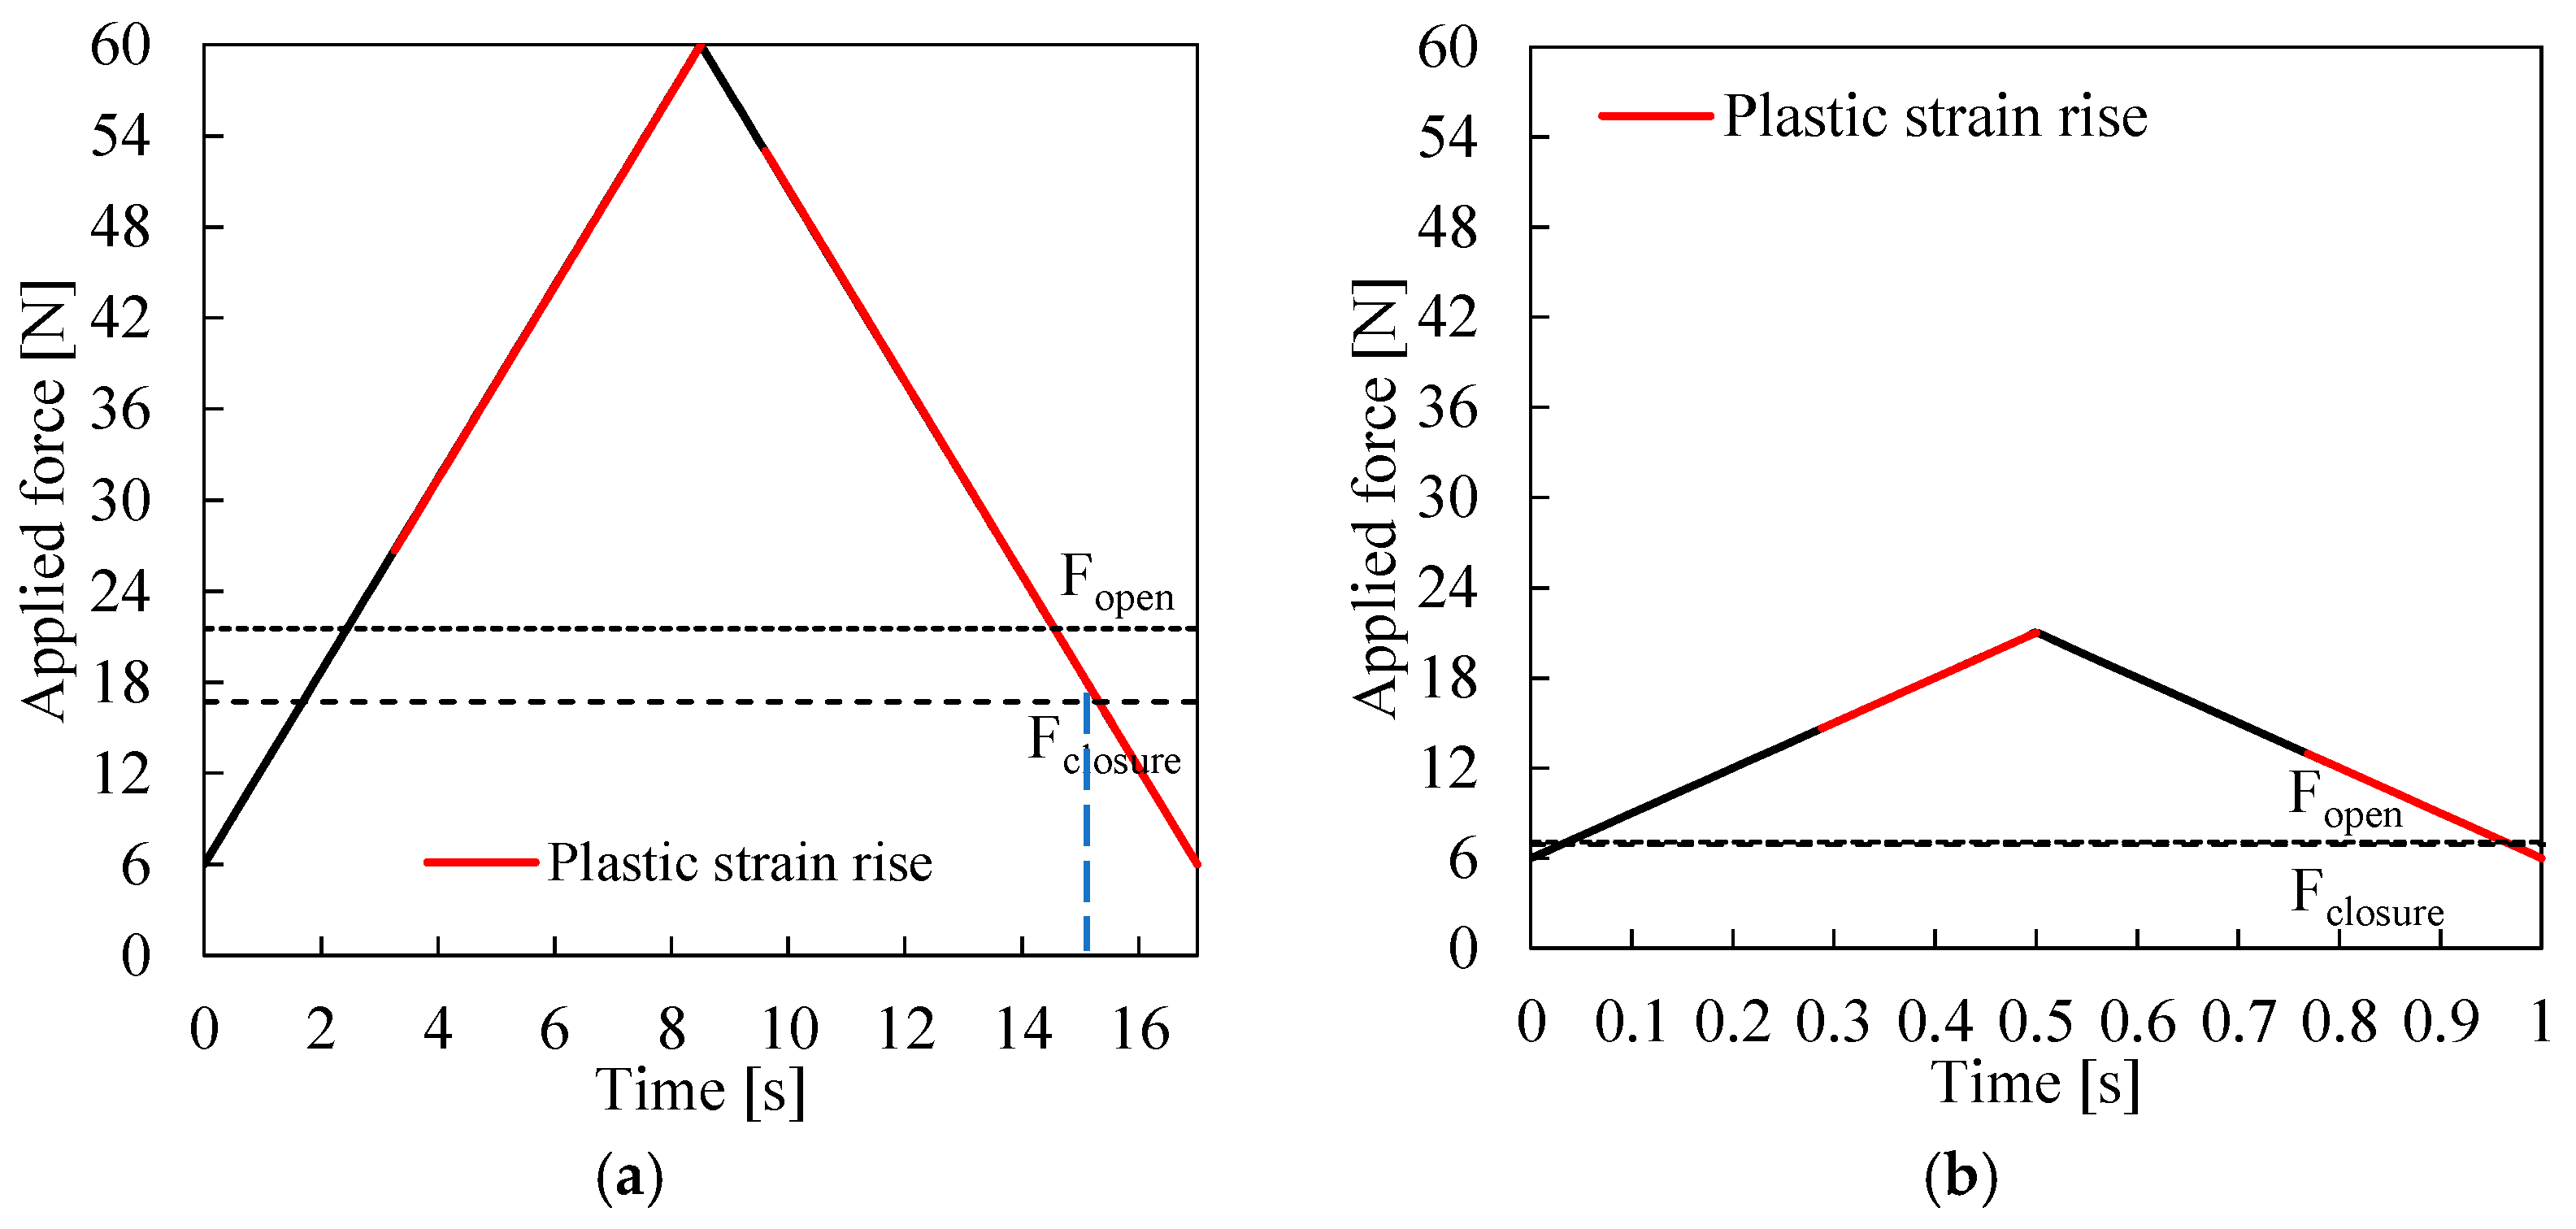
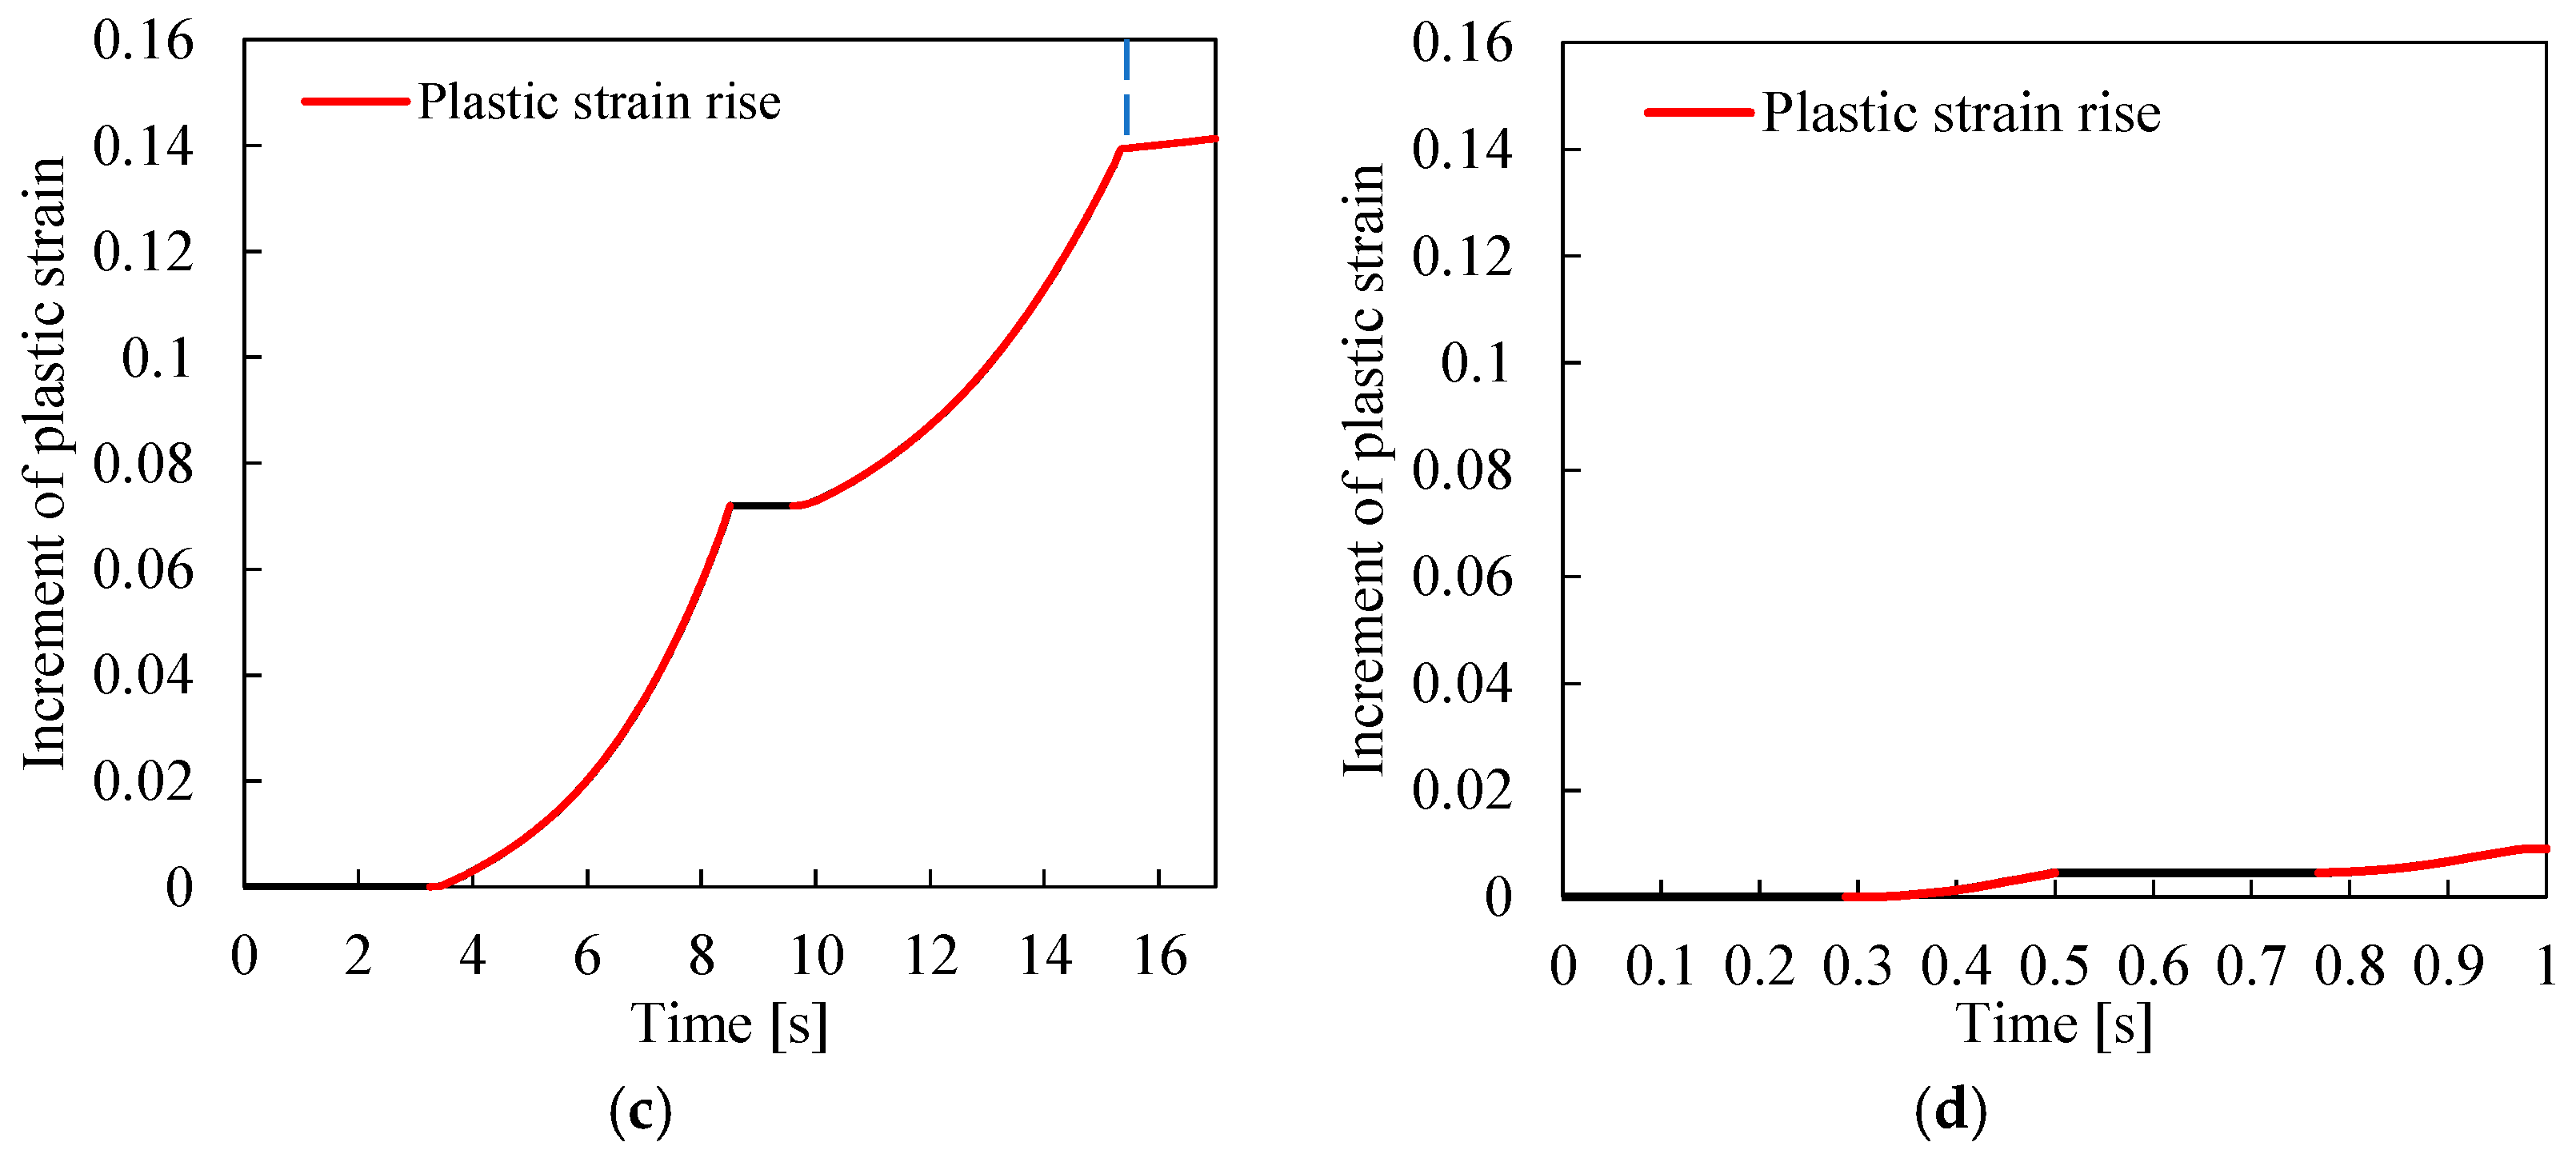
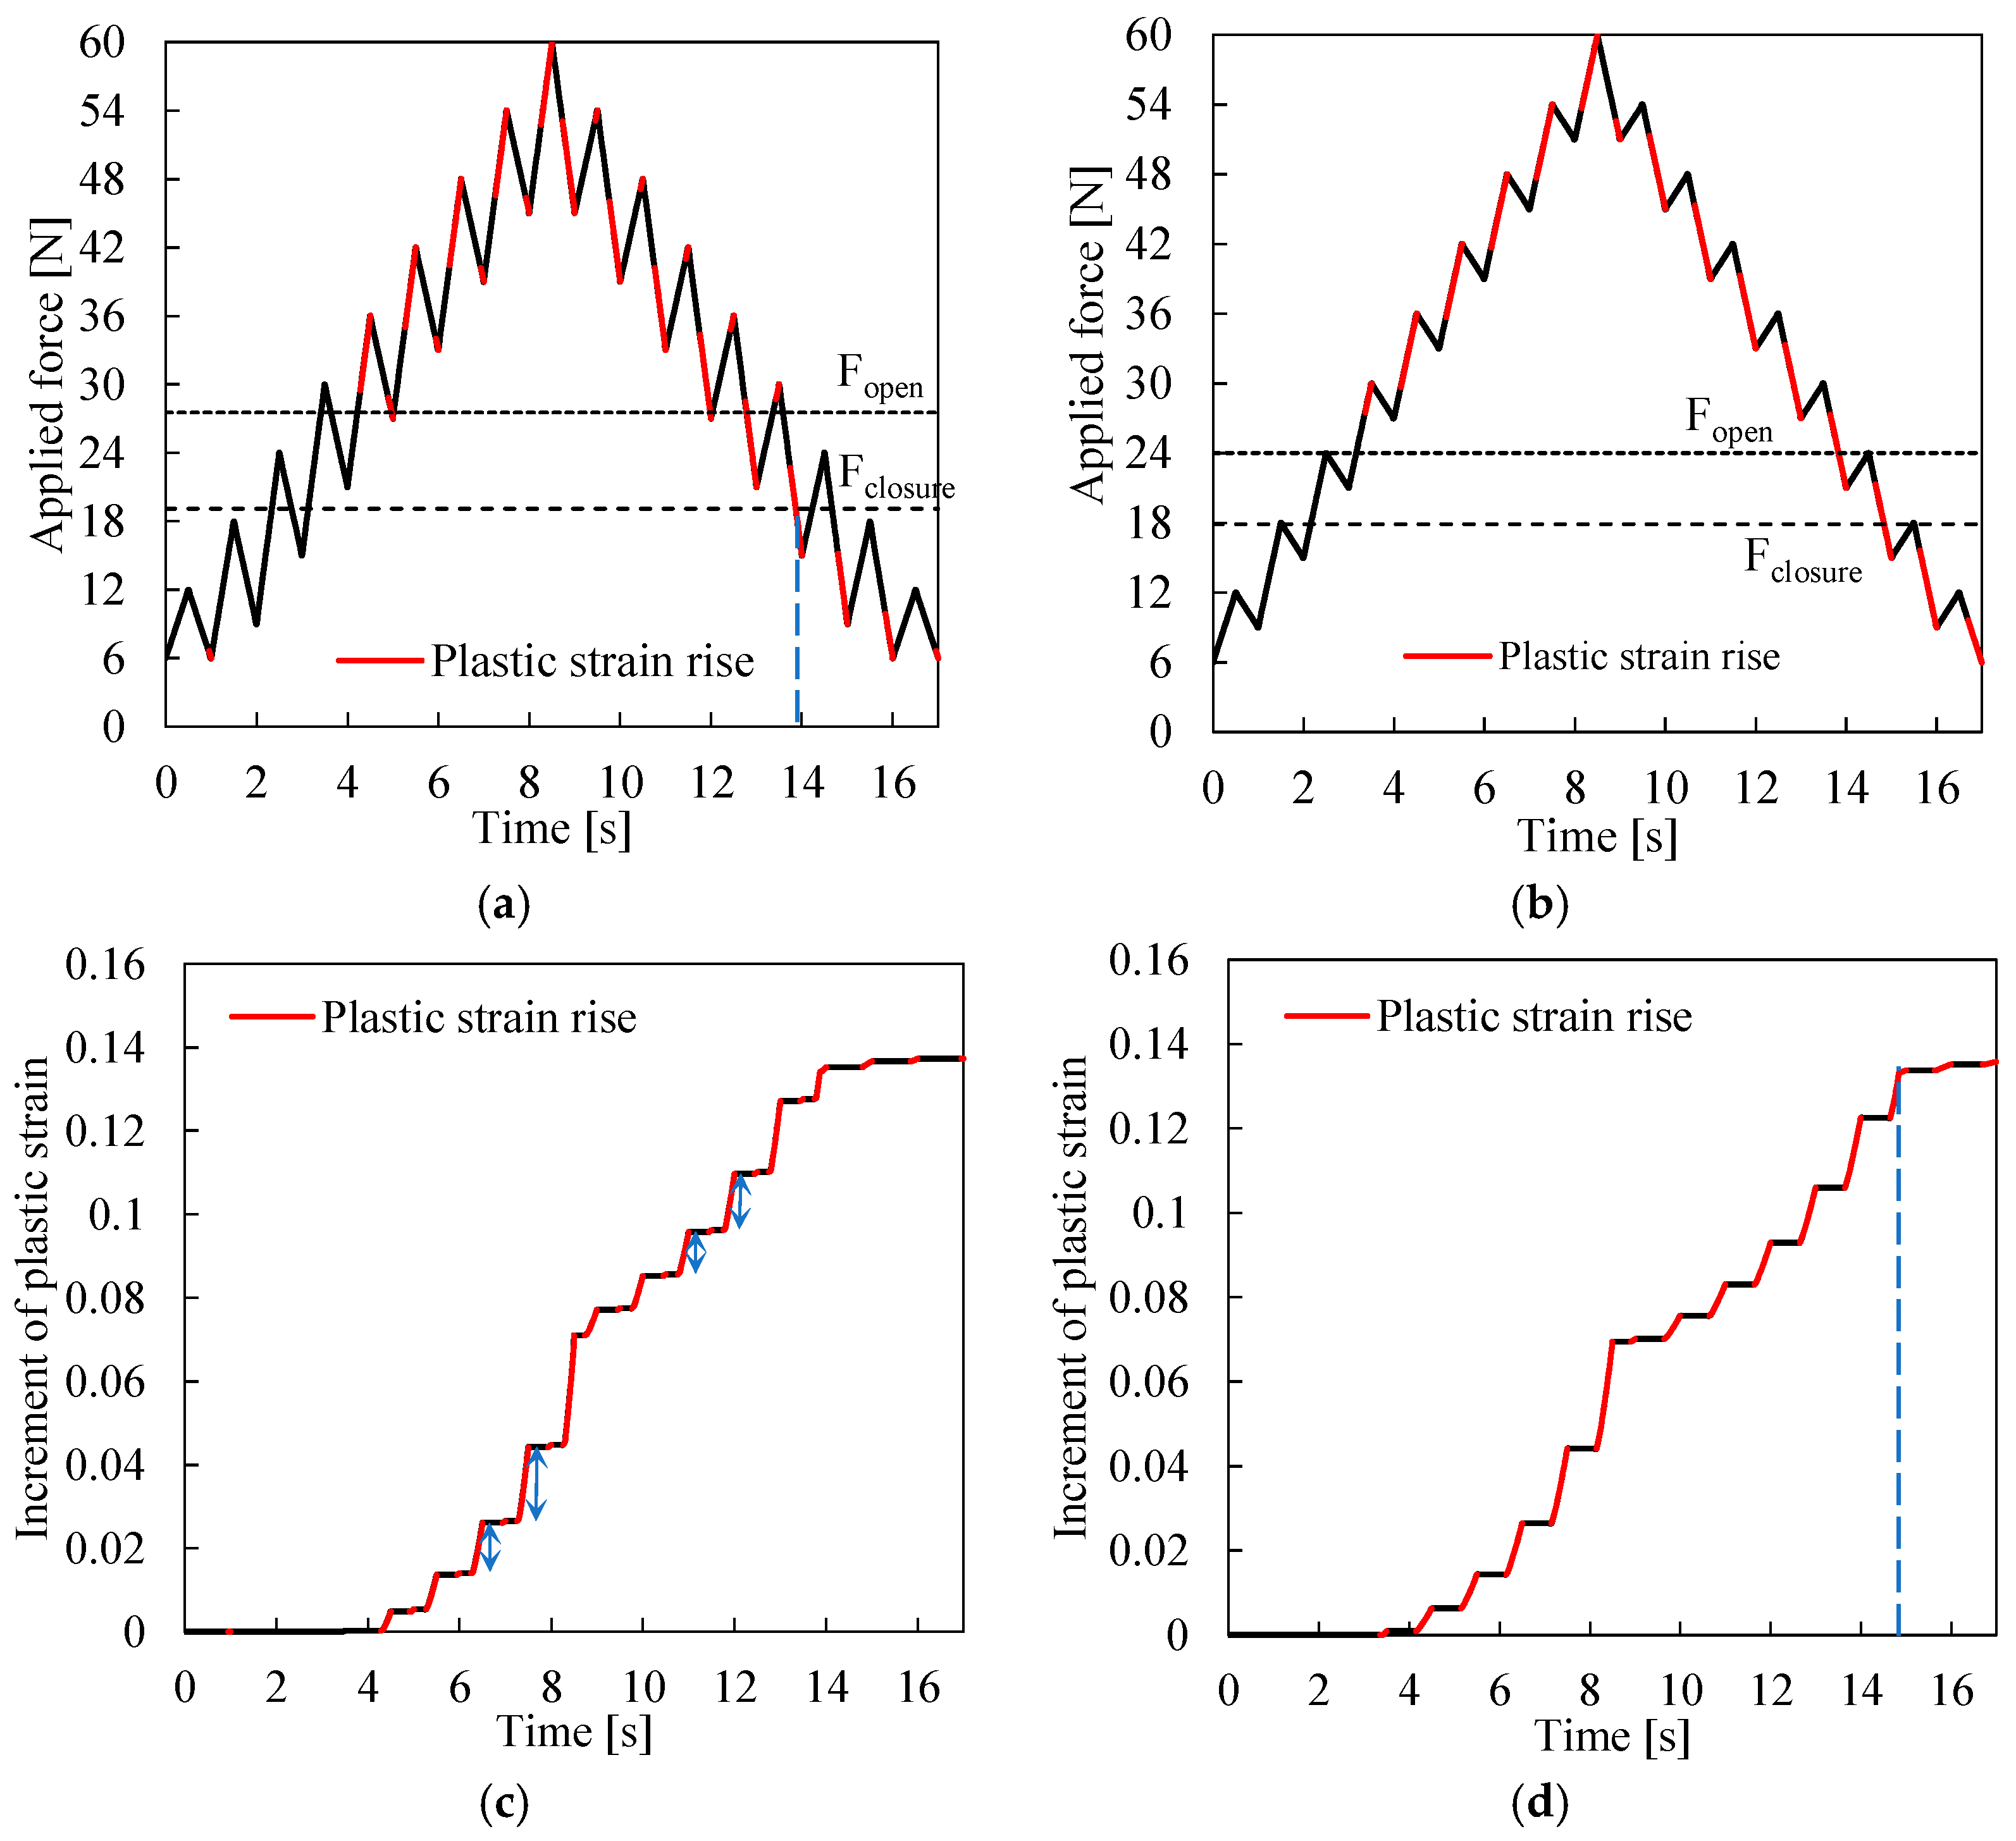
2.3. Load Patterns
3. Results
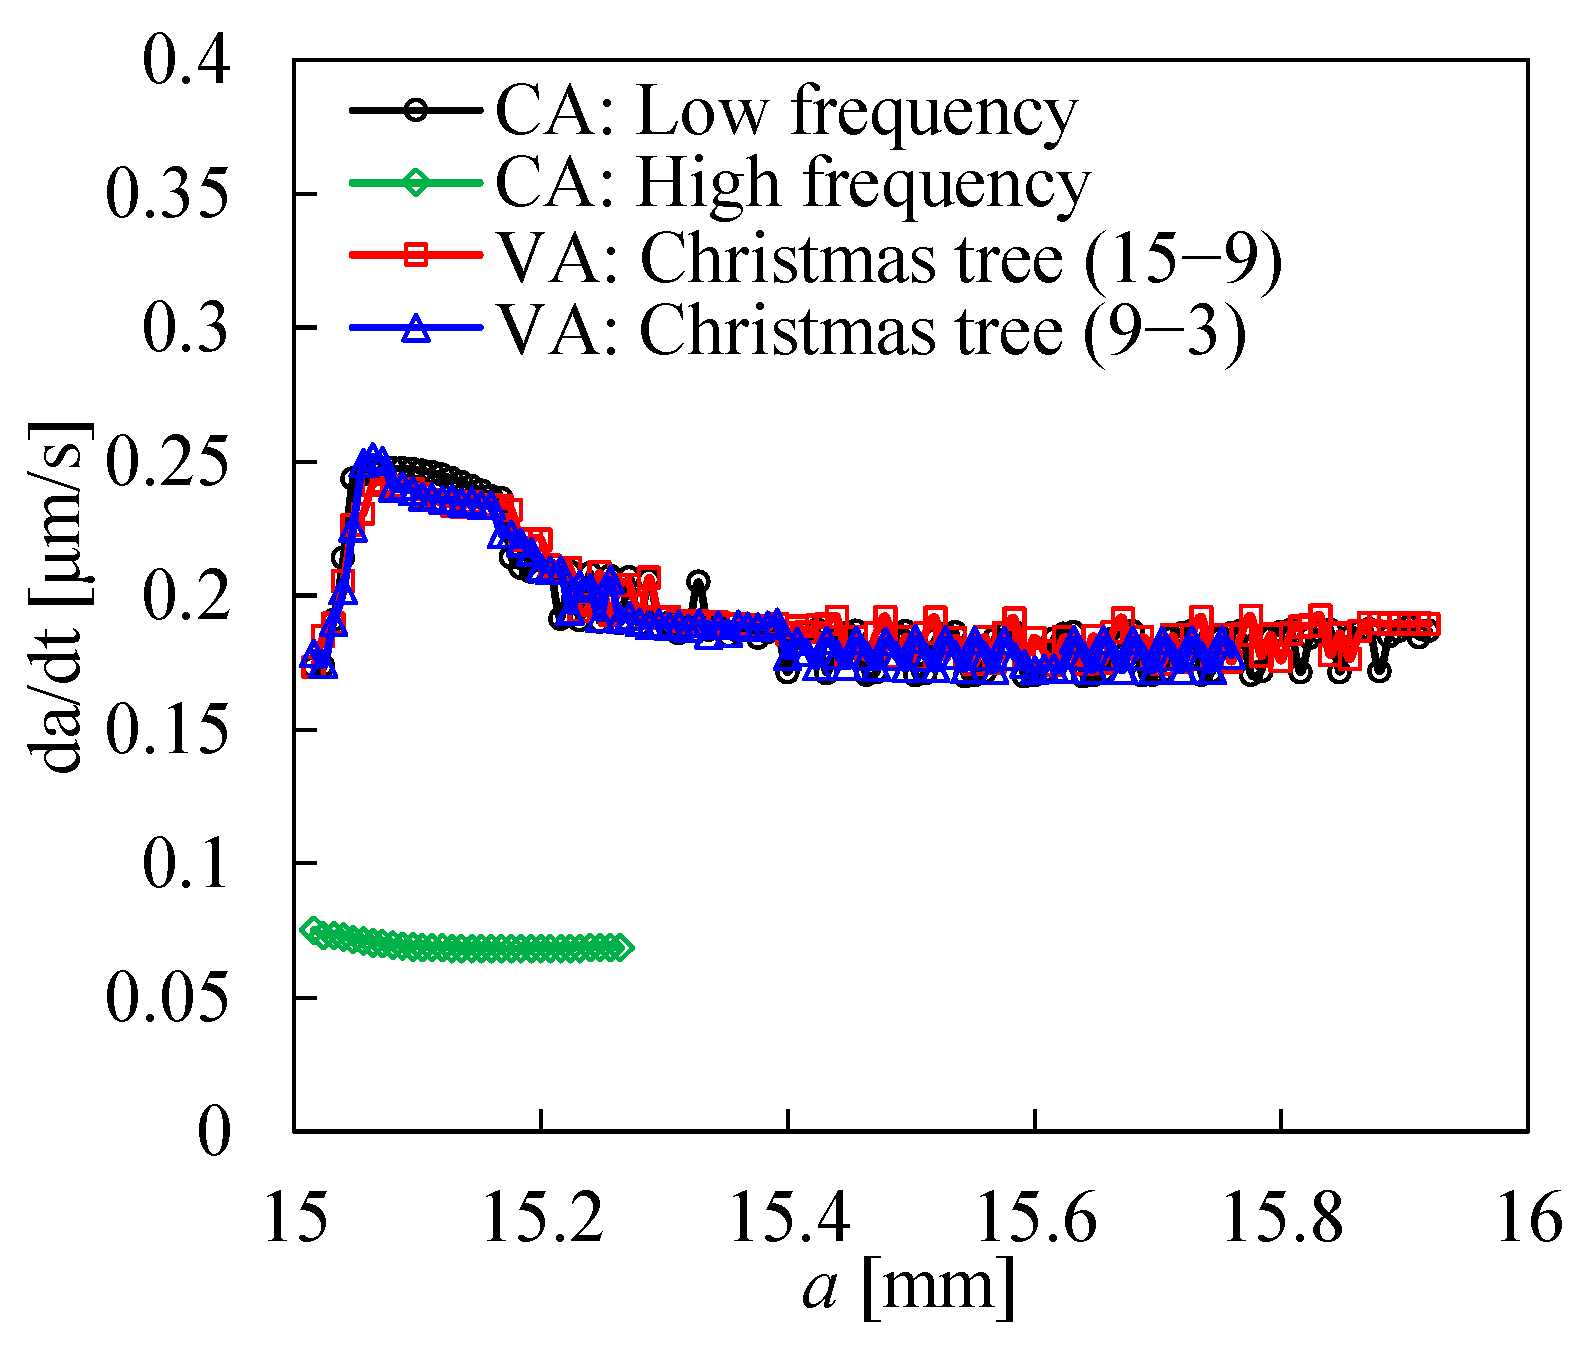
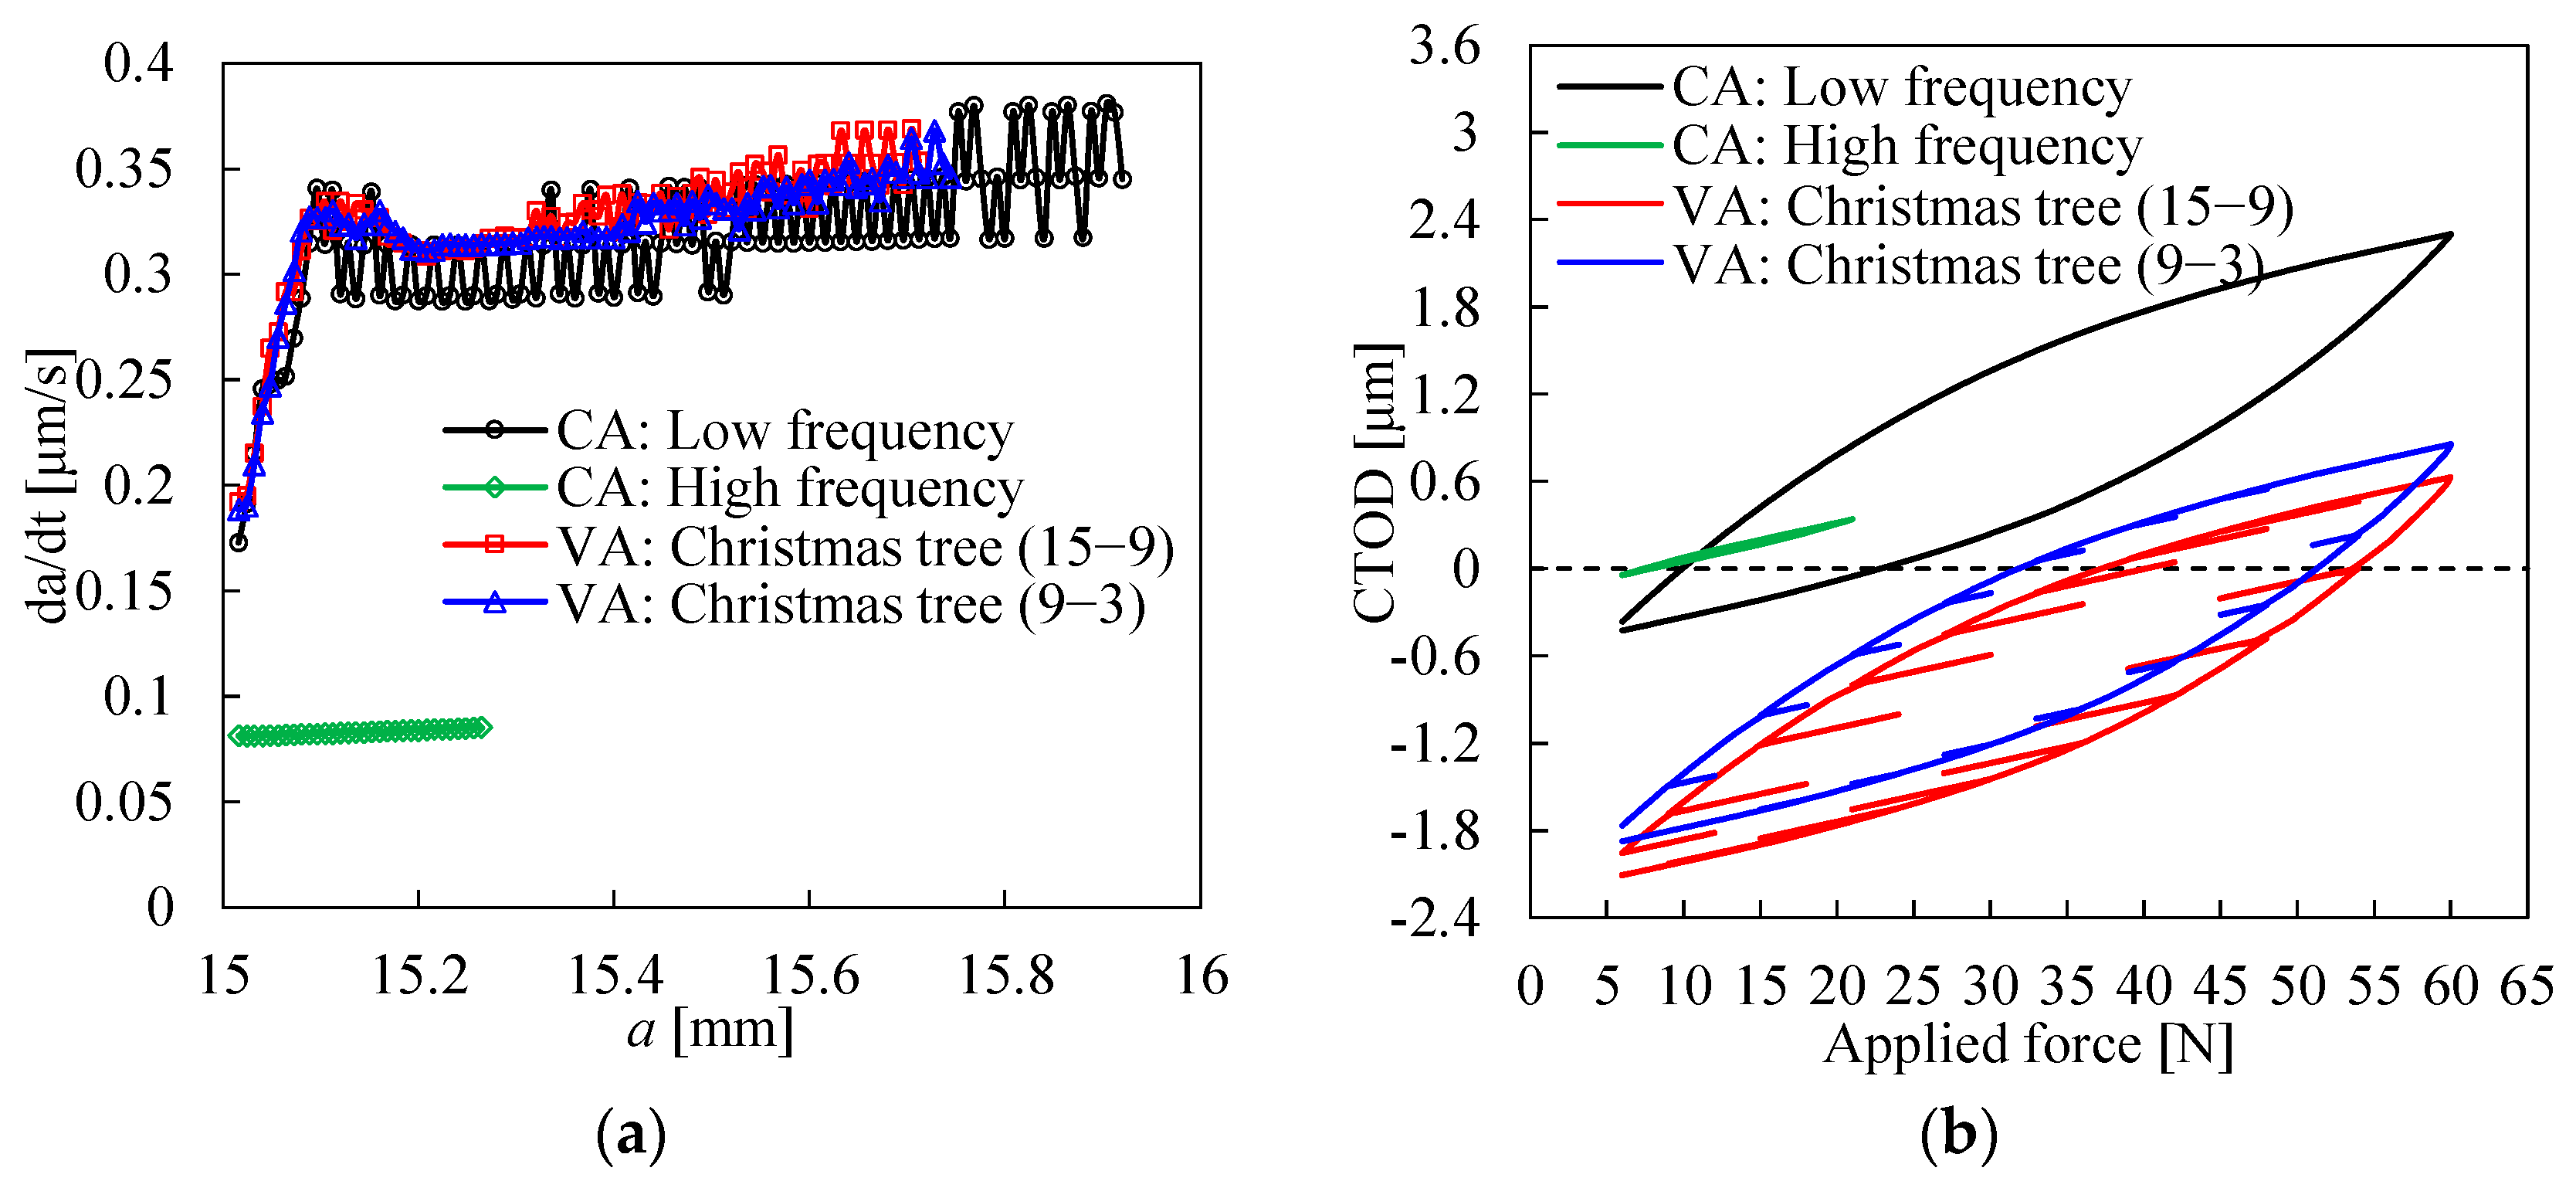
3.1. FCG Rate
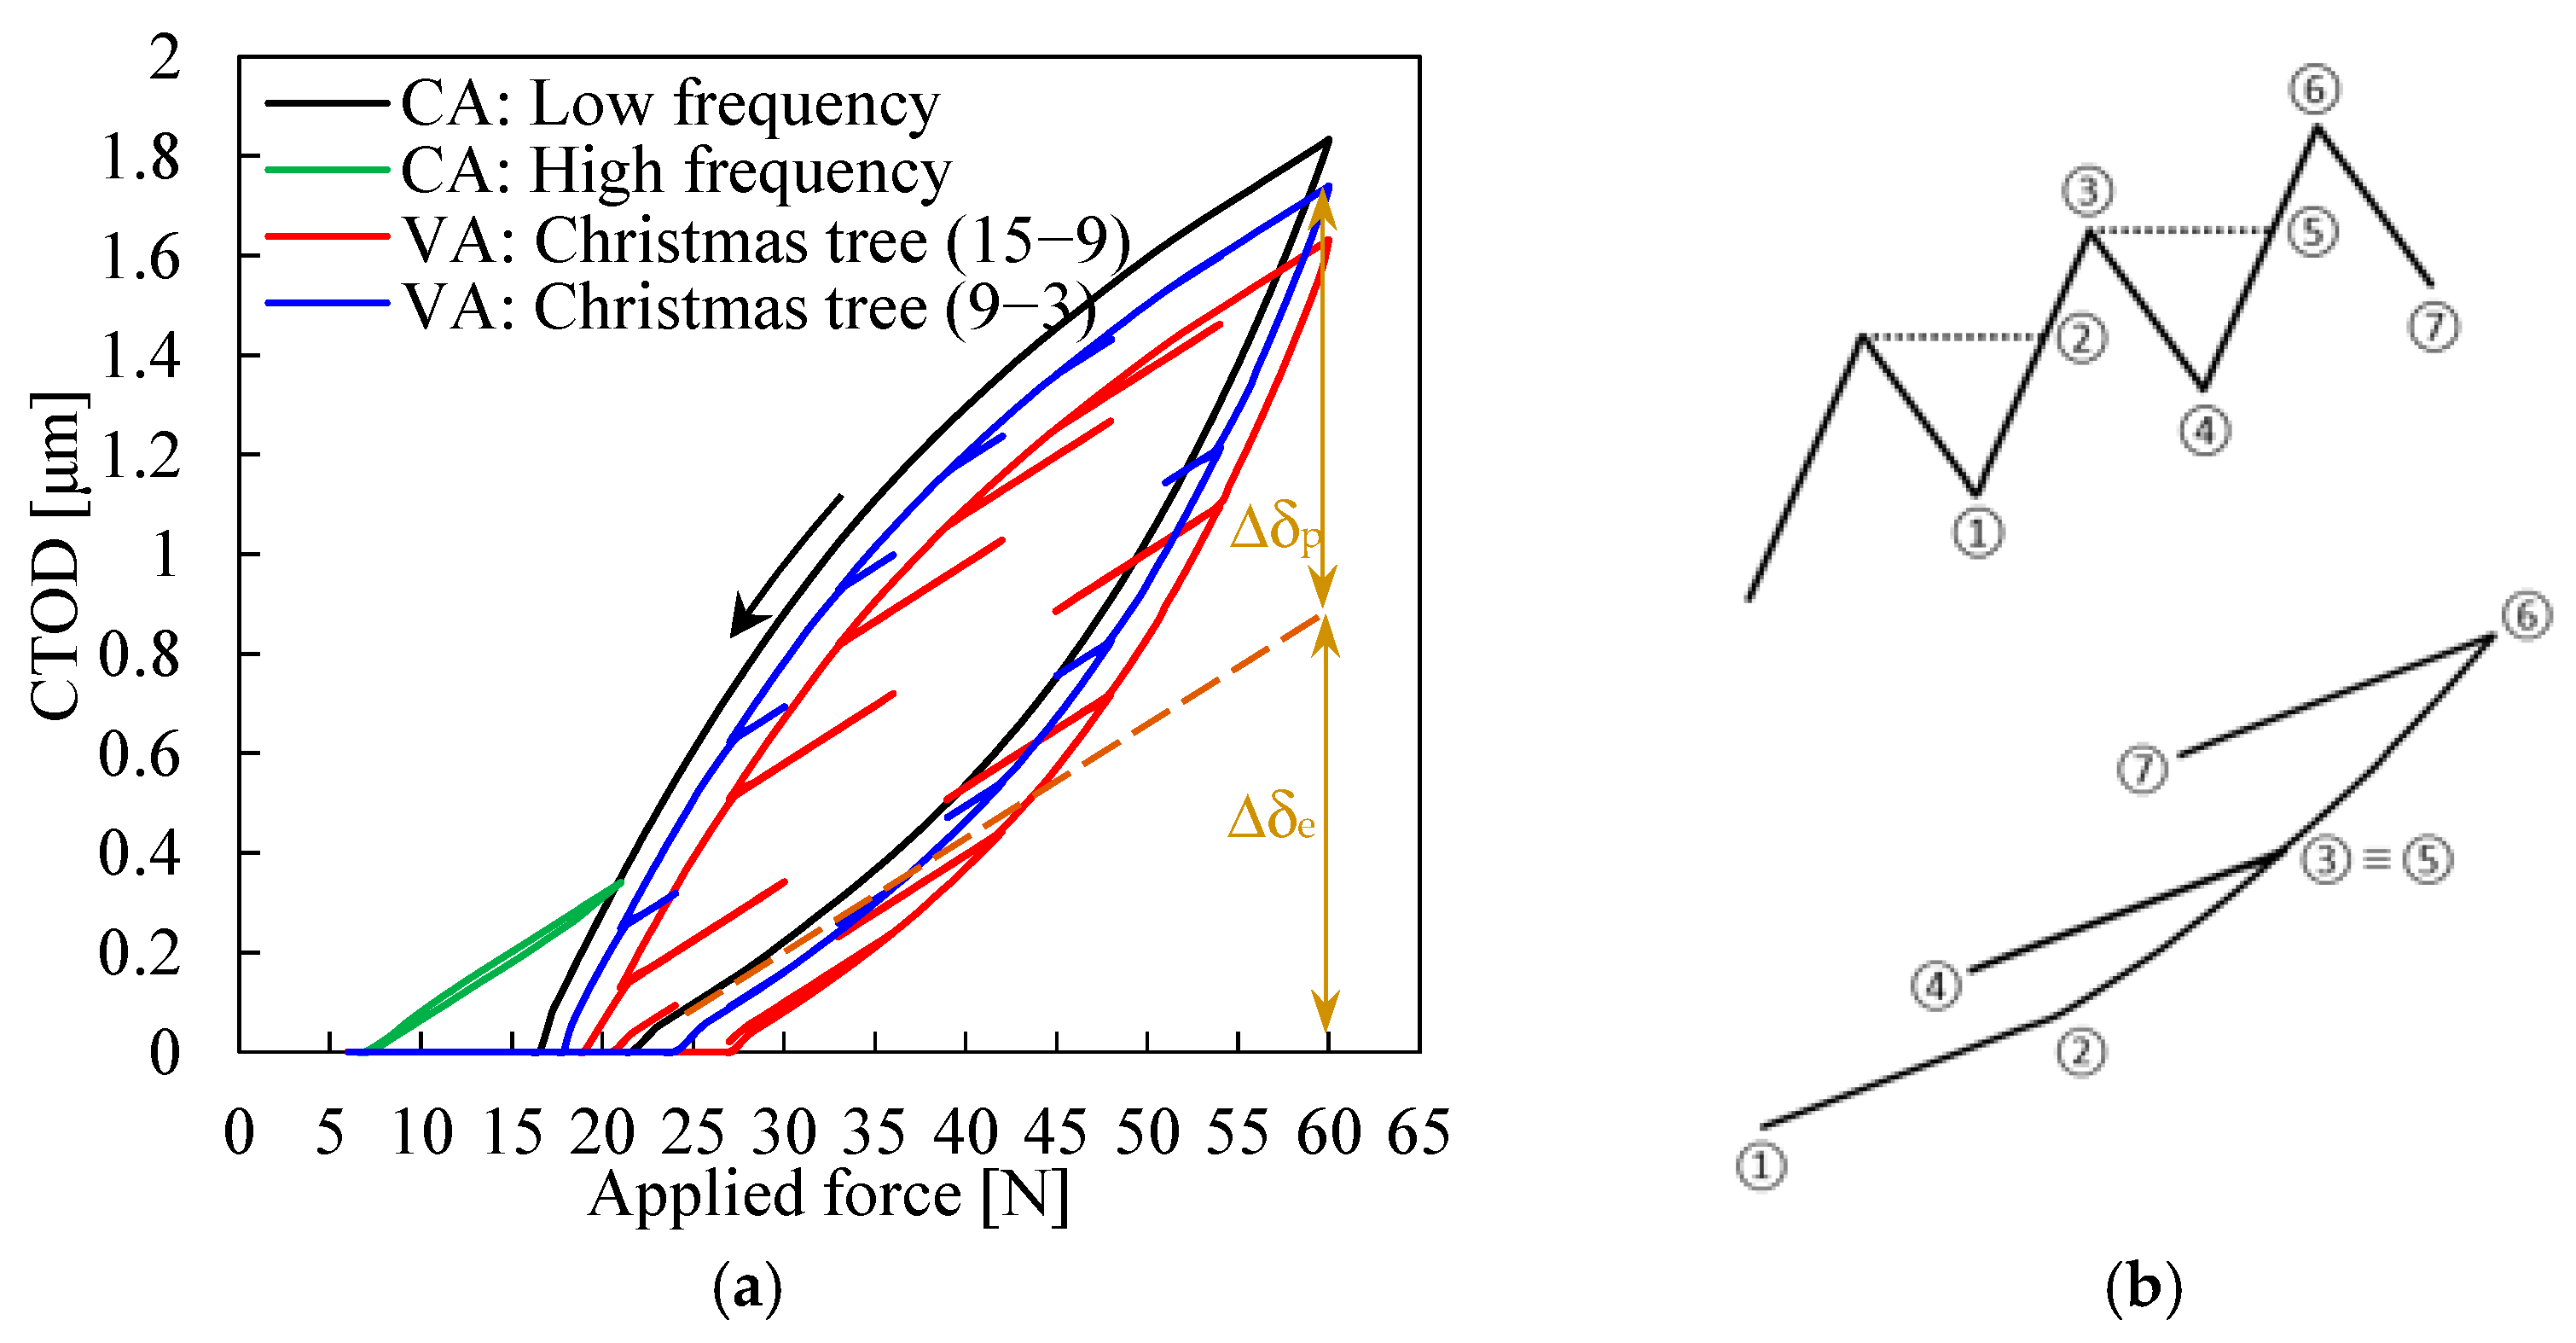
3.2. CTOD Plots
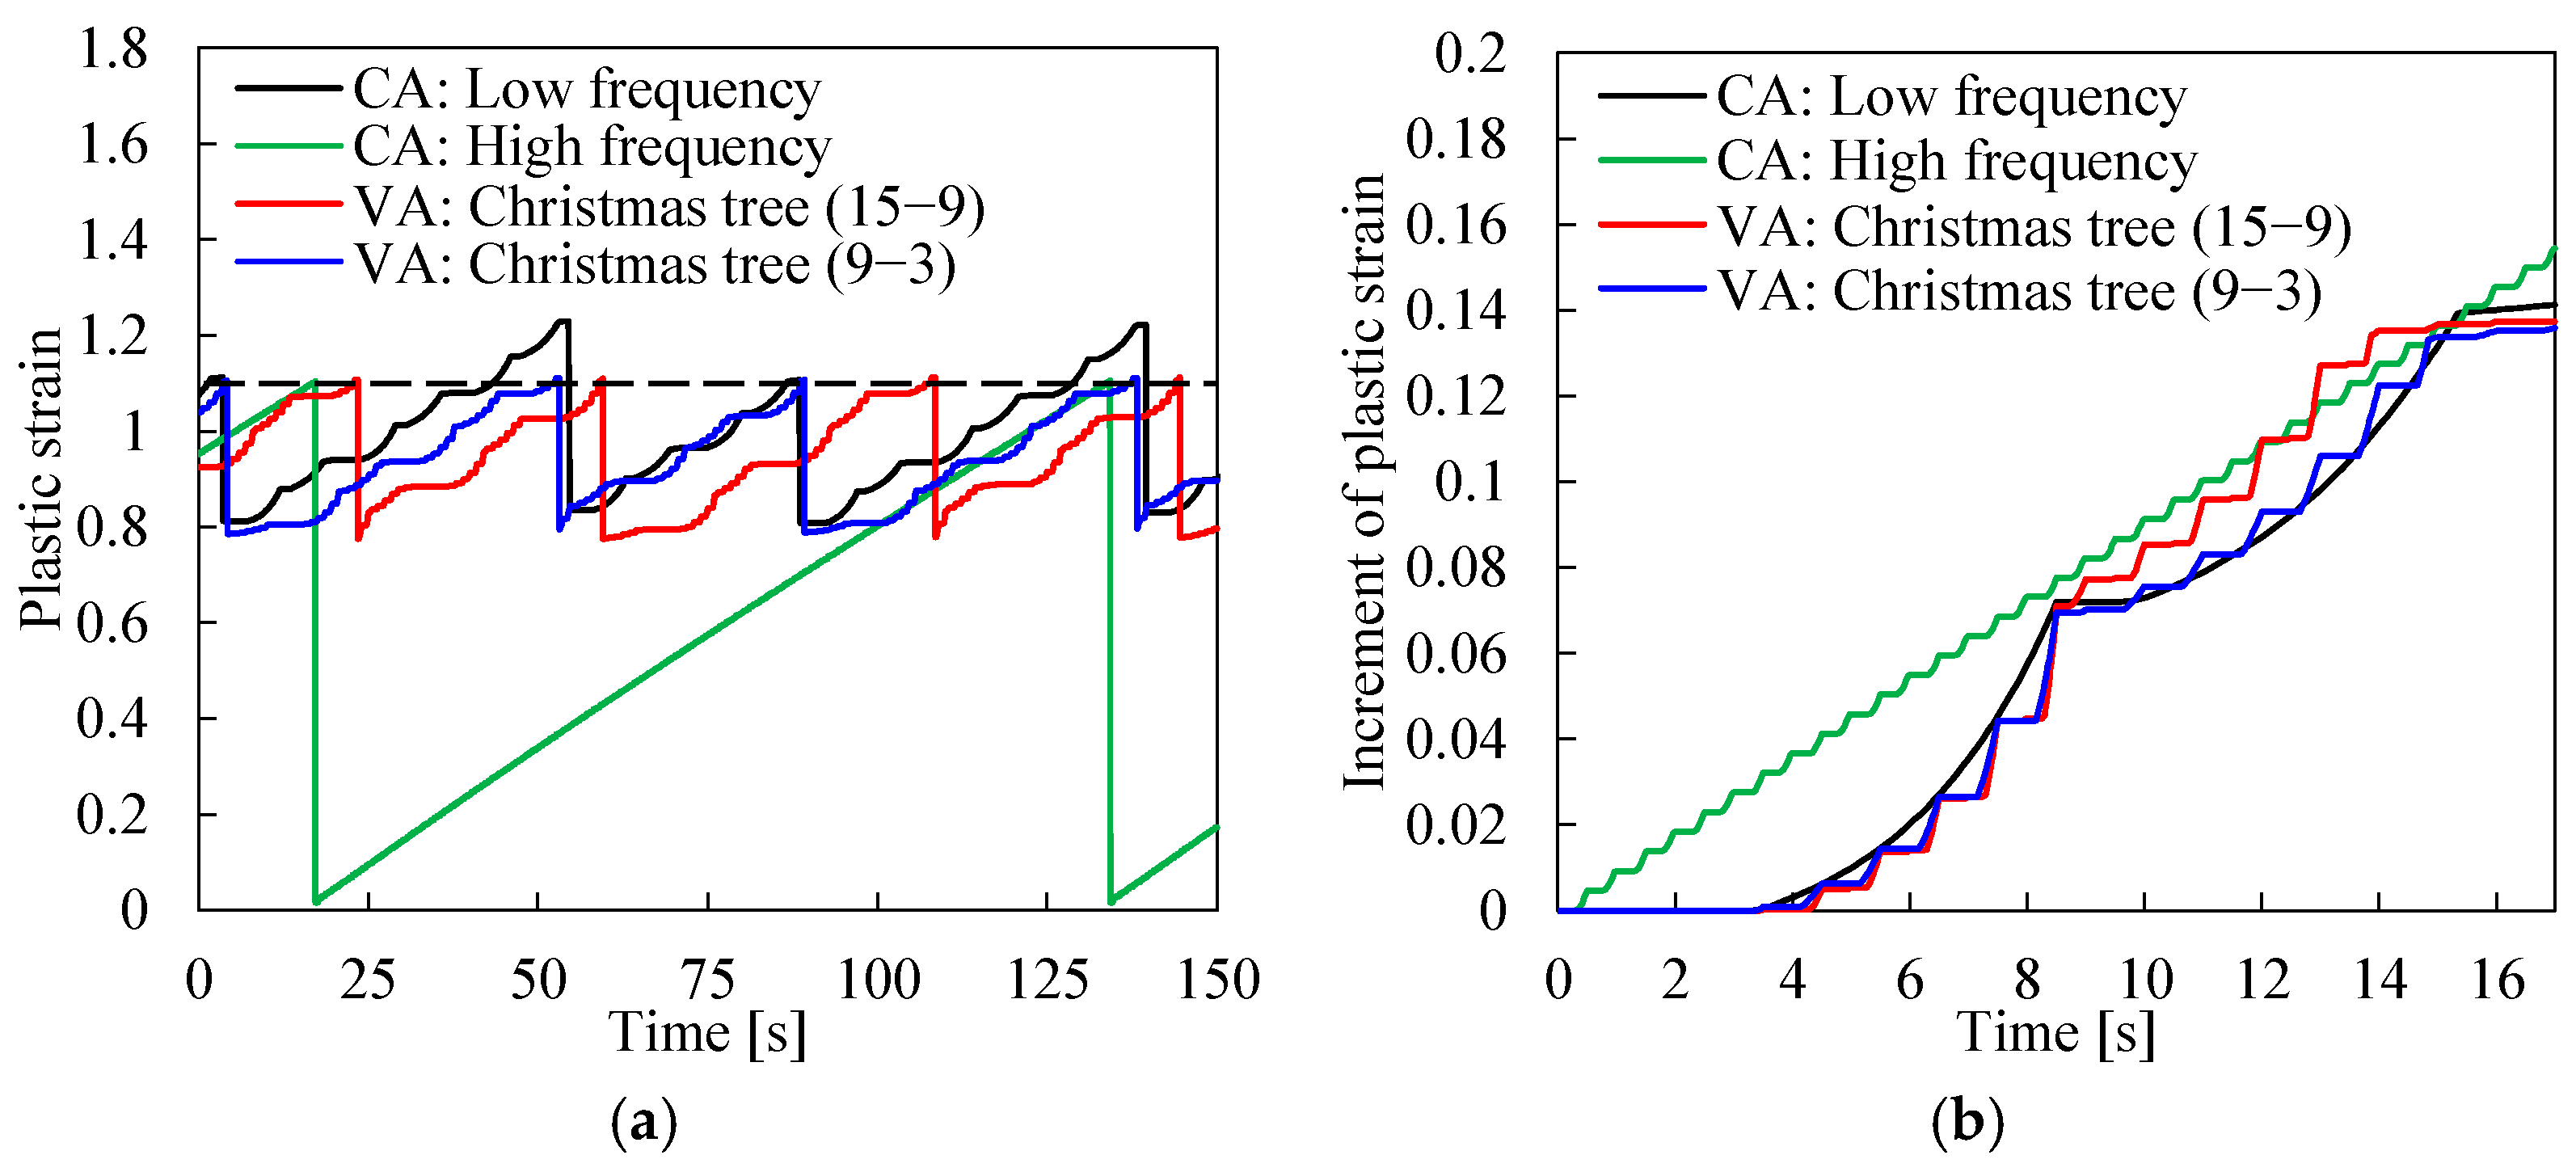
3.3. Plastic Strain
3.4. Without Contact of Crack Flanks
4. Discussion
5. Conclusions
- -
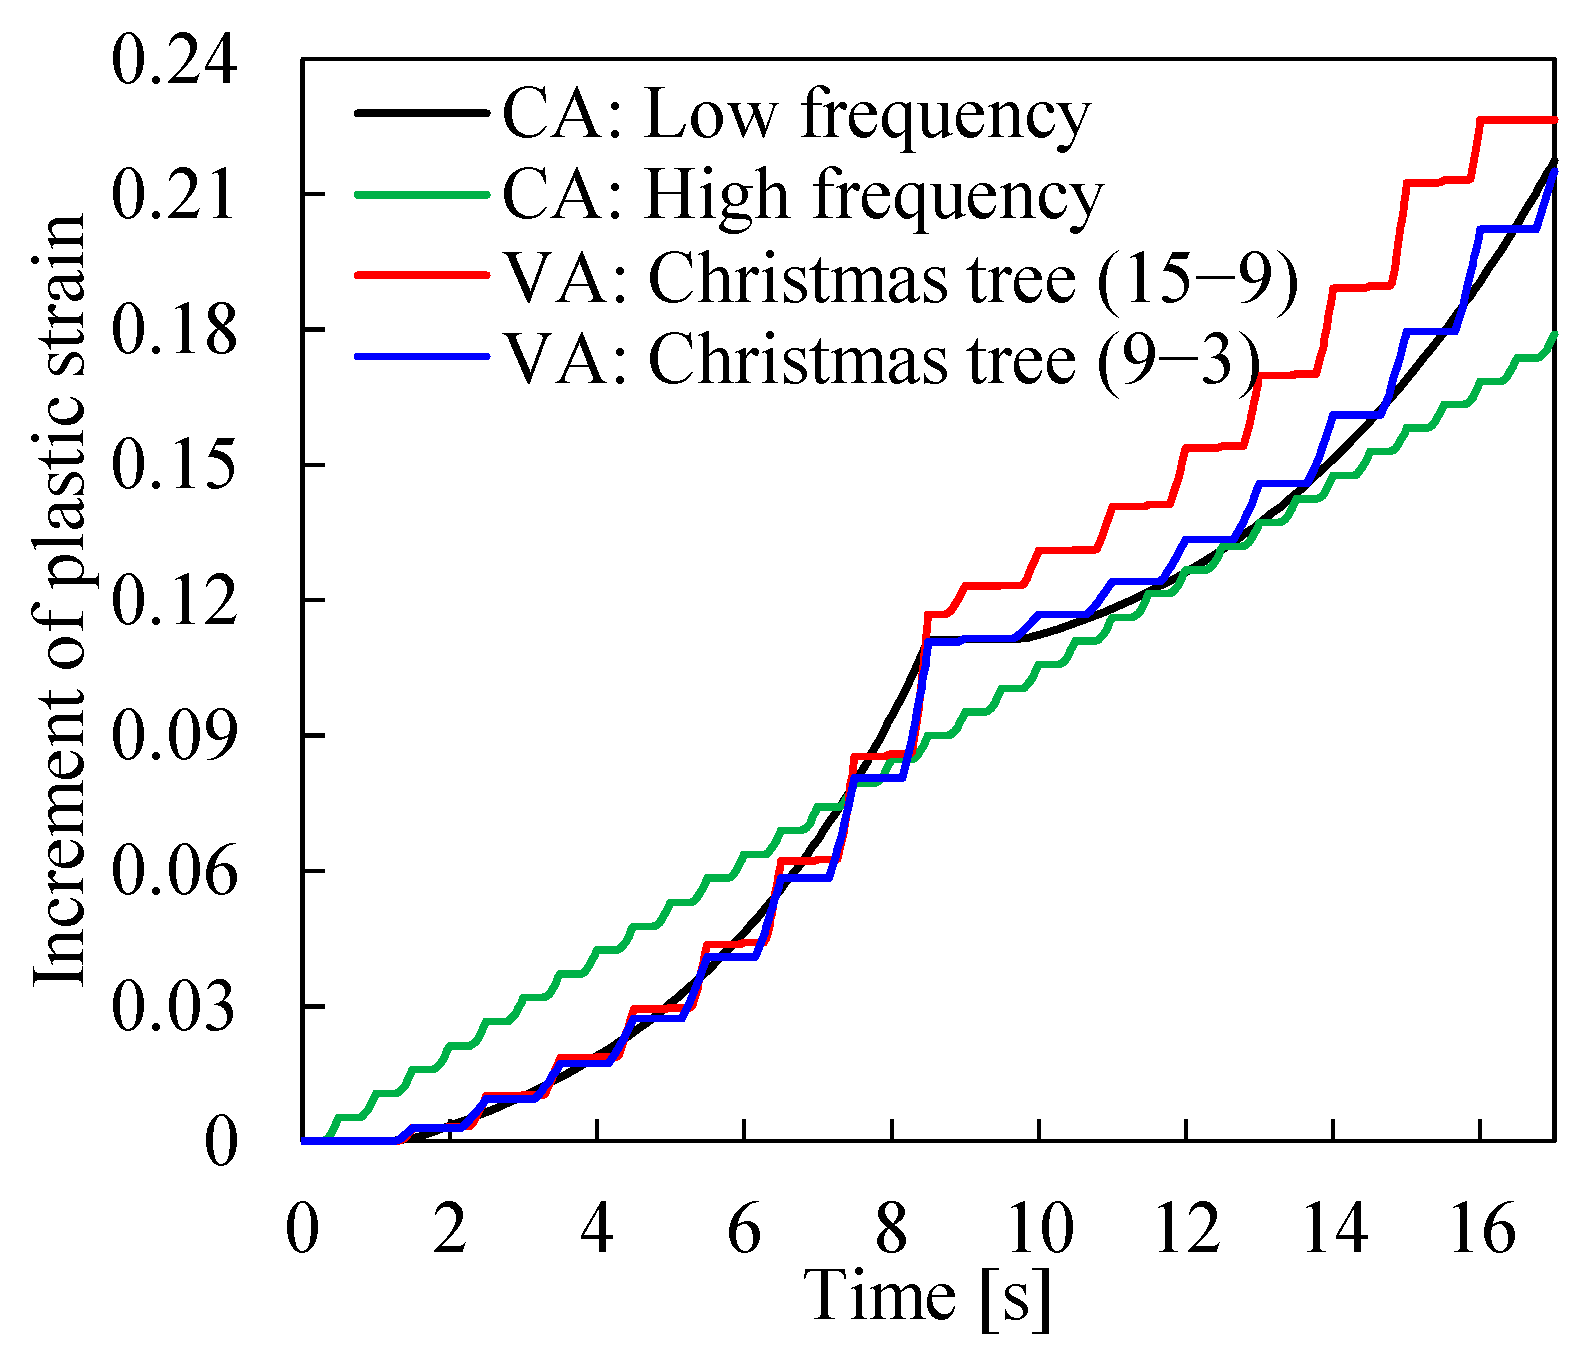
- Considering the same value of minimum and maximum load values, the 15–9 Christmas Tree loading case produced an increase in cumulative plastic strain in comparison with the constant-amplitude loading, particularly during the unloading part of the load block. This effect is more evident without the contact of crack flanks, i.e., without crack closure. The 9–3 Christmas Tree loading case did not show a significant effect, which indicates that the range of small cycles is relevant.
- -
- The effect of the Christmas Tree loading pattern is due to small changes in material hardening. Crack closure is usually used to explain the effect of loading parameters, with the Christmas Tree loading pattern being an exception.
- -
- Damage accumulation was observed after closure, which destroys the purity of the crack closure concept. Crack opening occurred at 21.6 N for the low-frequency load pattern; therefore, the portion of load range during which the crack was closed was 29%. This closure reduced the crack growth rate from 0.33 µm/s, obtained without the contact of crack flanks, to 0.19 µm/s.
Author Contributions
Funding
Conflicts of Interest
References
- Heuler, P.; Klatschke, H. Generation and use of standardised load spectra and load–time histories, Int. J. Fatigue 2005, 27, 974–990. [Google Scholar] [CrossRef]
- de Jonge, J.B.; Schutz, D.; Lowak, H.; Schijve, J. A Standardized Load Sequence for Flight Simulation Tests on Transport Aircraft Wing Structures, NLR TR 73029U; National Aerospace Laboratory (NLR): Amsterdam, The Netherlands, 1973. [Google Scholar]
- Elber, W. The significance of fatigue crack closure. In Damage Tolerance in Aircraft Structures; ASTM STP 486; ASTM International: West Conshohocken, PA, USA, 1971; pp. 230–242. [Google Scholar]
- Sadananda, K.; Babu, M.N.; Vasudevan, A.K. The unified approach to subcritical crack growth and fracture. Eng. Fract. Mech. 2019, 212, 238–257. [Google Scholar] [CrossRef]
- Noroozi, A.H.; Glinka, G.; Lambert, S. A two parameter driving force for fatigue crack growth analysis. Int. J. Fatigue 2005, 27, 1277–1296. [Google Scholar] [CrossRef]
- Borrego, L.P.; Ferreira, J.M.; da Cruz, J.M.P.; Costa, J.M. Evaluation of overload effects on fatigue crack growth and closure. Eng. Fract. Mech. 2003, 70, 1379–1397. [Google Scholar] [CrossRef] [Green Version]
- Vasco-Olmo, J.M.; Díaz, F.A.; James, M.N.; Yang, B. Crack tip plastic zone evolution during an overload cycle and the contribution of plasticity-induced shielding to crack growth rate changes. Fat. Fract. Eng. Mater. Struct. 2018, 41, 2172–2186. [Google Scholar] [CrossRef]
- Neto, D.M.; Borges, M.F.; Antunes, F.V.; Jesus, J. Mechanisms of fatigue crack growth in Ti-6Al-4V alloy subjected to single overloads. Theor. Appl. Fract. Mech. 2021, 114, 103024. [Google Scholar] [CrossRef]
- Tvergaard, V. Effect of underloads or overloads in fatigue crack growth by crack-tip blunting. Eng. Fract. Mech. 2006, 73, 869–879. [Google Scholar] [CrossRef]
- Schijve, J.; Broek, D. The result of a test program based on a gust spectrum with variable amplitude loading. Aircr. Eng. 1962, 34, 314–316. [Google Scholar] [CrossRef]
- Xiao, L.; Ye, D.; Chen, C.; Liu, J.; Zhang, L. Instrumented indentation measurements of residual stresses around a crack tip under single tensile overloads. Int. J. Mech. Sci. 2014, 78, 44–51. [Google Scholar] [CrossRef]
- Jones, R.E. Fatigue crack growth retardation after single-cycle peak overload in Ti–6Al–4V titanium alloy. Eng. Fract. Mech. 1973, 5, 585–604. [Google Scholar] [CrossRef]
- Kermanidis, A.T.; Pantelakis, S.G. Prediction of crack growth following a single overload in aluminum alloy with sheet and plate microstructure. Eng. Fract. Mech. 2011, 78, 2325–2337. [Google Scholar] [CrossRef]
- Suresh, S. Micromechanisms of fatigue crack growth retardation following overloads. Eng. Fract. Mech. 1983, 18, 577–593. [Google Scholar] [CrossRef] [Green Version]
- Neto, D.M.; Sérgio, E.R.; Borges, M.F.; Borrego, L.P.; Antunes, F.V. Effect of load blocks on fatigue crack growth. Int. J. Fatigue 2022, 162, 107001. [Google Scholar] [CrossRef]
- Sunder, R.; Raut, D.; Jayaram, V.; Kumar, P.; Shastri, V. Near-Tip Residual Stress as an Independent Load Interaction Mechanism. Int. J. Fatigue 2021, 151, 106364. [Google Scholar] [CrossRef]
- Neto, D.M.; Borges, M.F.; Antunes, F.V.; Sunder, R. Numerical analysis of SuperBlock2020 loading sequence. Eng. Fract. Mech. 2022, 260, 108178. [Google Scholar] [CrossRef]
- Newman, J.C., Jr. Fatigue of Engineered Metallic Materials using Small-Crack Theory under Constant- and Variable-Amplitude Loading. Fat. Fract. Eng. Mat. Struct. 2021, 44, 2858–2870. [Google Scholar] [CrossRef]
- Newman, J.C., Jr. FASTRAN—A Fatigue Crack Growth Life Prediction Code Based on the Crack-Closure Concept; Version 5.4 User Guide; Fatigue and Fracture Associates, LLC: Eupora, MS, USA, 2013. [Google Scholar]
- Borges, M.F.; Neto, D.M.; Antunes, F.V. Numerical simulation of fatigue crack growth based on accumulated plastic strain. Theor. Appl. Fract. Mech. 2020, 108, 102676. [Google Scholar] [CrossRef]
- Menezes, L.F.; Teodosiu, C. Three-dimensional numerical simulation of the deep-drawing process using solid finite elements. J. Mater. Process. Tech. 2000, 97, 100–106. [Google Scholar] [CrossRef] [Green Version]
- Borges, M.F.; Lopez-Crespo, P.; Antunes, F.V.; Moreno, B.; Prates, P.; Camas, D.; Neto, D.M. Fatigue crack propagation analysis in 2024-T351 aluminium alloy using nonlinear parameters. Int. J. Fatigue 2021, 153, 106478. [Google Scholar] [CrossRef]
- Neto, D.M.; Pedro, J.; Borges, M.F.; Borrego, L.F.P.; Sérgio, E.R.; Antunes, F.V. Numerical prediction of fatigue crack growth based on cumulative plastic strain versus experimental results for AA6082-T6. Int. J. Fract. 2022. [CrossRef]
- Swift, H.W. Plastic instability under plane stress. J. Mech. Phys. Solids 1952, 1, 1–18. [Google Scholar] [CrossRef]
- Lemaitre, J.; Chaboche, J.-L. Mechanics of Solid Materials; Cambridge University Press: Cambridge, UK, 1990. [Google Scholar] [CrossRef]
- Liu, Y.; Venkatesan, K.R.; Zhang, W. Time-based subcycle formulation for fatigue crack growth under arbitrary random variable loadings. Eng. Fract. Mech. 2017, 182, 1–18. [Google Scholar] [CrossRef]
- Newman, J.C., Jr. Rainflow-on-the-Fly Methodology: Fatigue-Crack Growth under Aircraft Spectrum Loading. In Advanced Materials Research; Trans Tech Publications: Zurich, Switzerland, 2014; Volume 891–892, pp. 771–776. [Google Scholar]
- Suresh, S.; Ritchie, R.O. On the influence of fatigue underloads on cyclic crack growth at low stress intensities. Mater. Sci. Eng. 1981, 51, 61–69. [Google Scholar] [CrossRef] [Green Version]
- Mayer, H.; Ede, C.; Allison, J.E. Influence of cyclic loads below endurance limit or threshold stress intensity on fatigue damage in cast aluminium alloy 319-T7. Int. J. Fatigue 2005, 27, 129–141. [Google Scholar] [CrossRef]
- Pokorný, P.; Vojtek, T.; Jambor, M.; Náhlík, L.; Hutař, P. Effect of Underload Cycles on Oxide-Induced Crack Closure Development in Cr-Mo Low-Alloy Steel. Materials 2021, 14, 2530. [Google Scholar] [CrossRef]


| E (GPa) | ν | Y0 (MPa) | K (MPa) | n | XSat (MPa) | CX |
|---|---|---|---|---|---|---|
| 72.26 | 0.29 | 288.96 | 389.0 | 0.056 | 111.84 | 138.80 |
Disclaimer/Publisher’s Note: The statements, opinions and data contained in all publications are solely those of the individual author(s) and contributor(s) and not of MDPI and/or the editor(s). MDPI and/or the editor(s) disclaim responsibility for any injury to people or property resulting from any ideas, methods, instructions or products referred to in the content. |
© 2023 by the authors. Licensee MDPI, Basel, Switzerland. This article is an open access article distributed under the terms and conditions of the Creative Commons Attribution (CC BY) license (https://creativecommons.org/licenses/by/4.0/).
Share and Cite
Neto, D.M.; Sérgio, E.R.; Jesus, F.; Newman, J.C., Jr.; Antunes, F.V. Fatigue Crack Propagation under Christmas Tree Load Pattern. Appl. Sci. 2023, 13, 1284. https://doi.org/10.3390/app13031284
Neto DM, Sérgio ER, Jesus F, Newman JC Jr., Antunes FV. Fatigue Crack Propagation under Christmas Tree Load Pattern. Applied Sciences. 2023; 13(3):1284. https://doi.org/10.3390/app13031284
Chicago/Turabian StyleNeto, Diogo M., Edmundo R. Sérgio, Francisco Jesus, James C. Newman, Jr., and Fernando V. Antunes. 2023. "Fatigue Crack Propagation under Christmas Tree Load Pattern" Applied Sciences 13, no. 3: 1284. https://doi.org/10.3390/app13031284