


A Holistic Approach for Design and Assessment of Building-Integrated Photovoltaics Systems
 , , and
Abstract
:1. Introduction
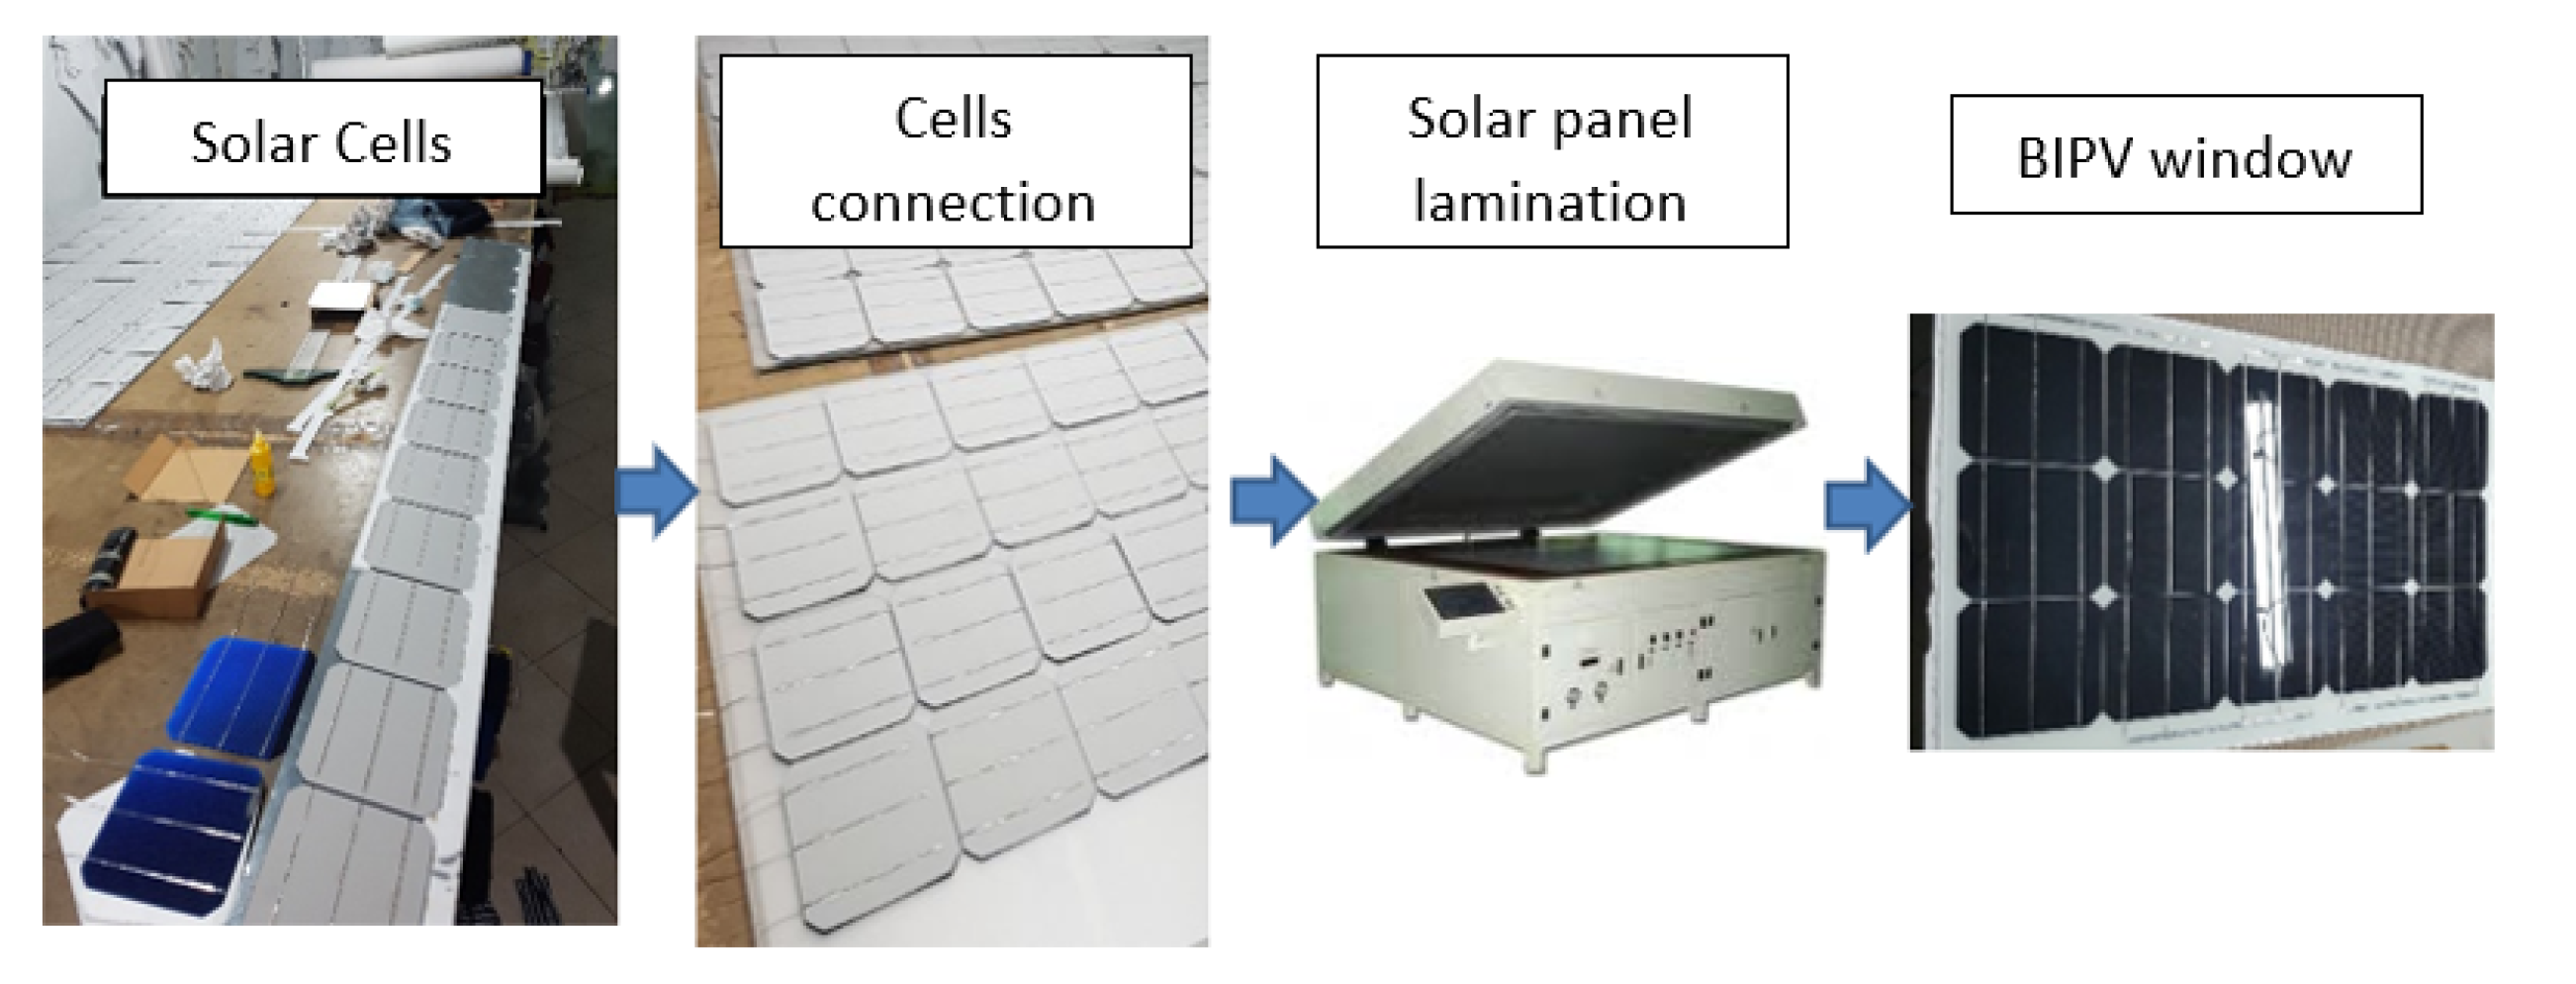
- A detailed description of the design of the PV components used in the BIPV system which can be adopted in other cases.
- An assesment procedure to define the technical and economic feasibility of the BIPV system.
- An analysis of the factors to consider in the early stage of design that can increase the potential of BIPV systems under different operating conditions.
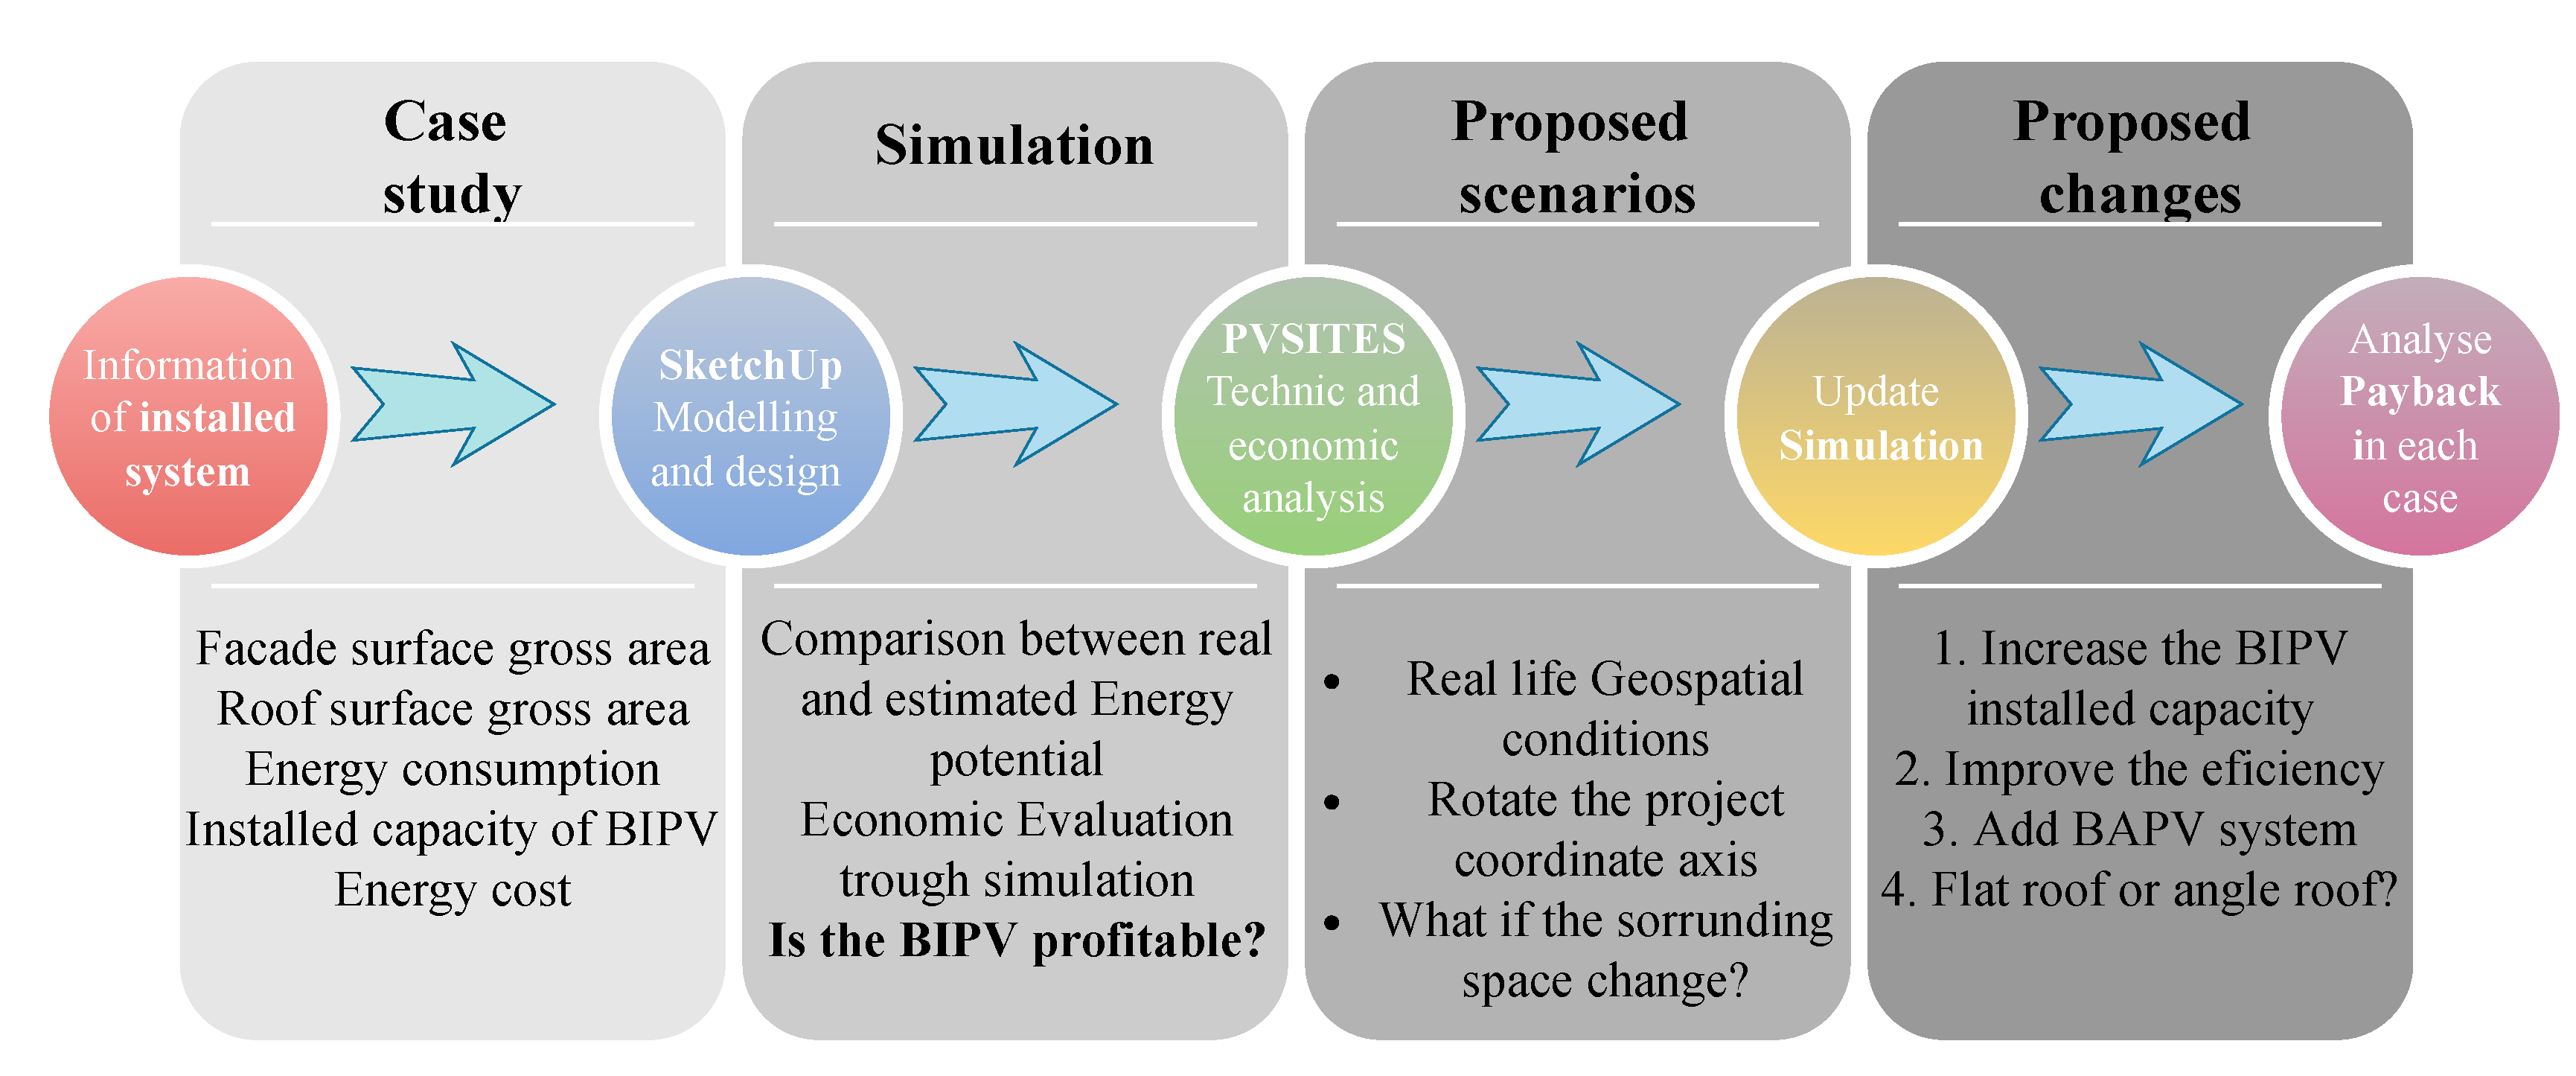
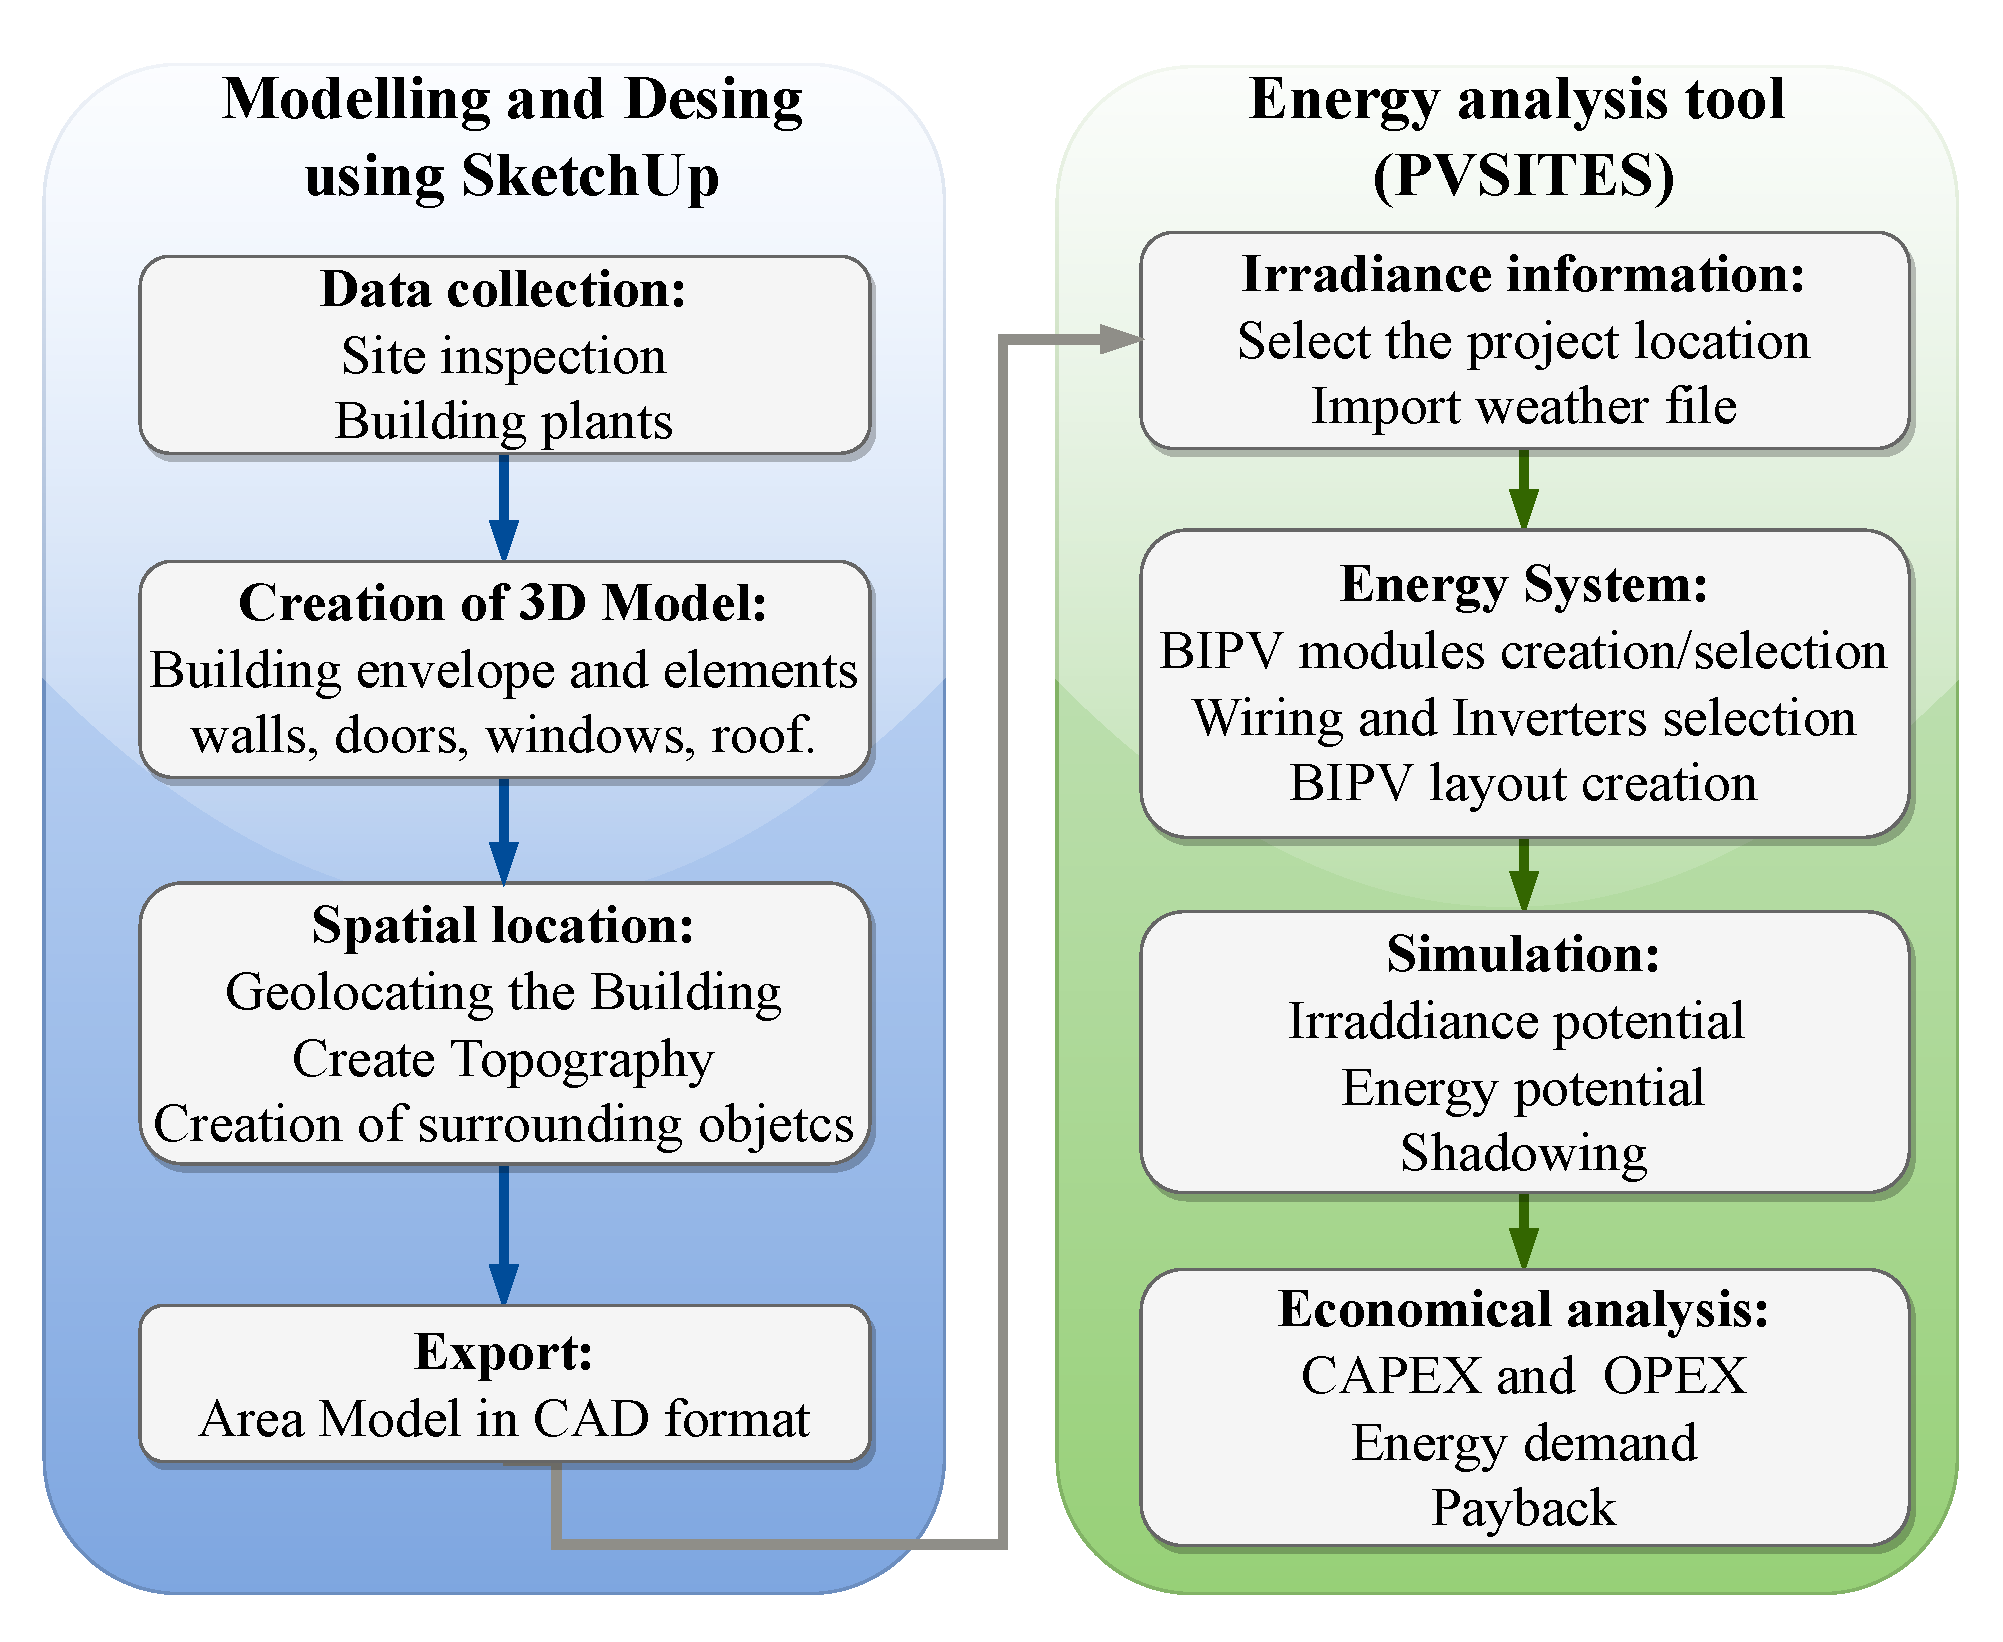
2. Methodology
3. Customized PV Modules Software Analysis
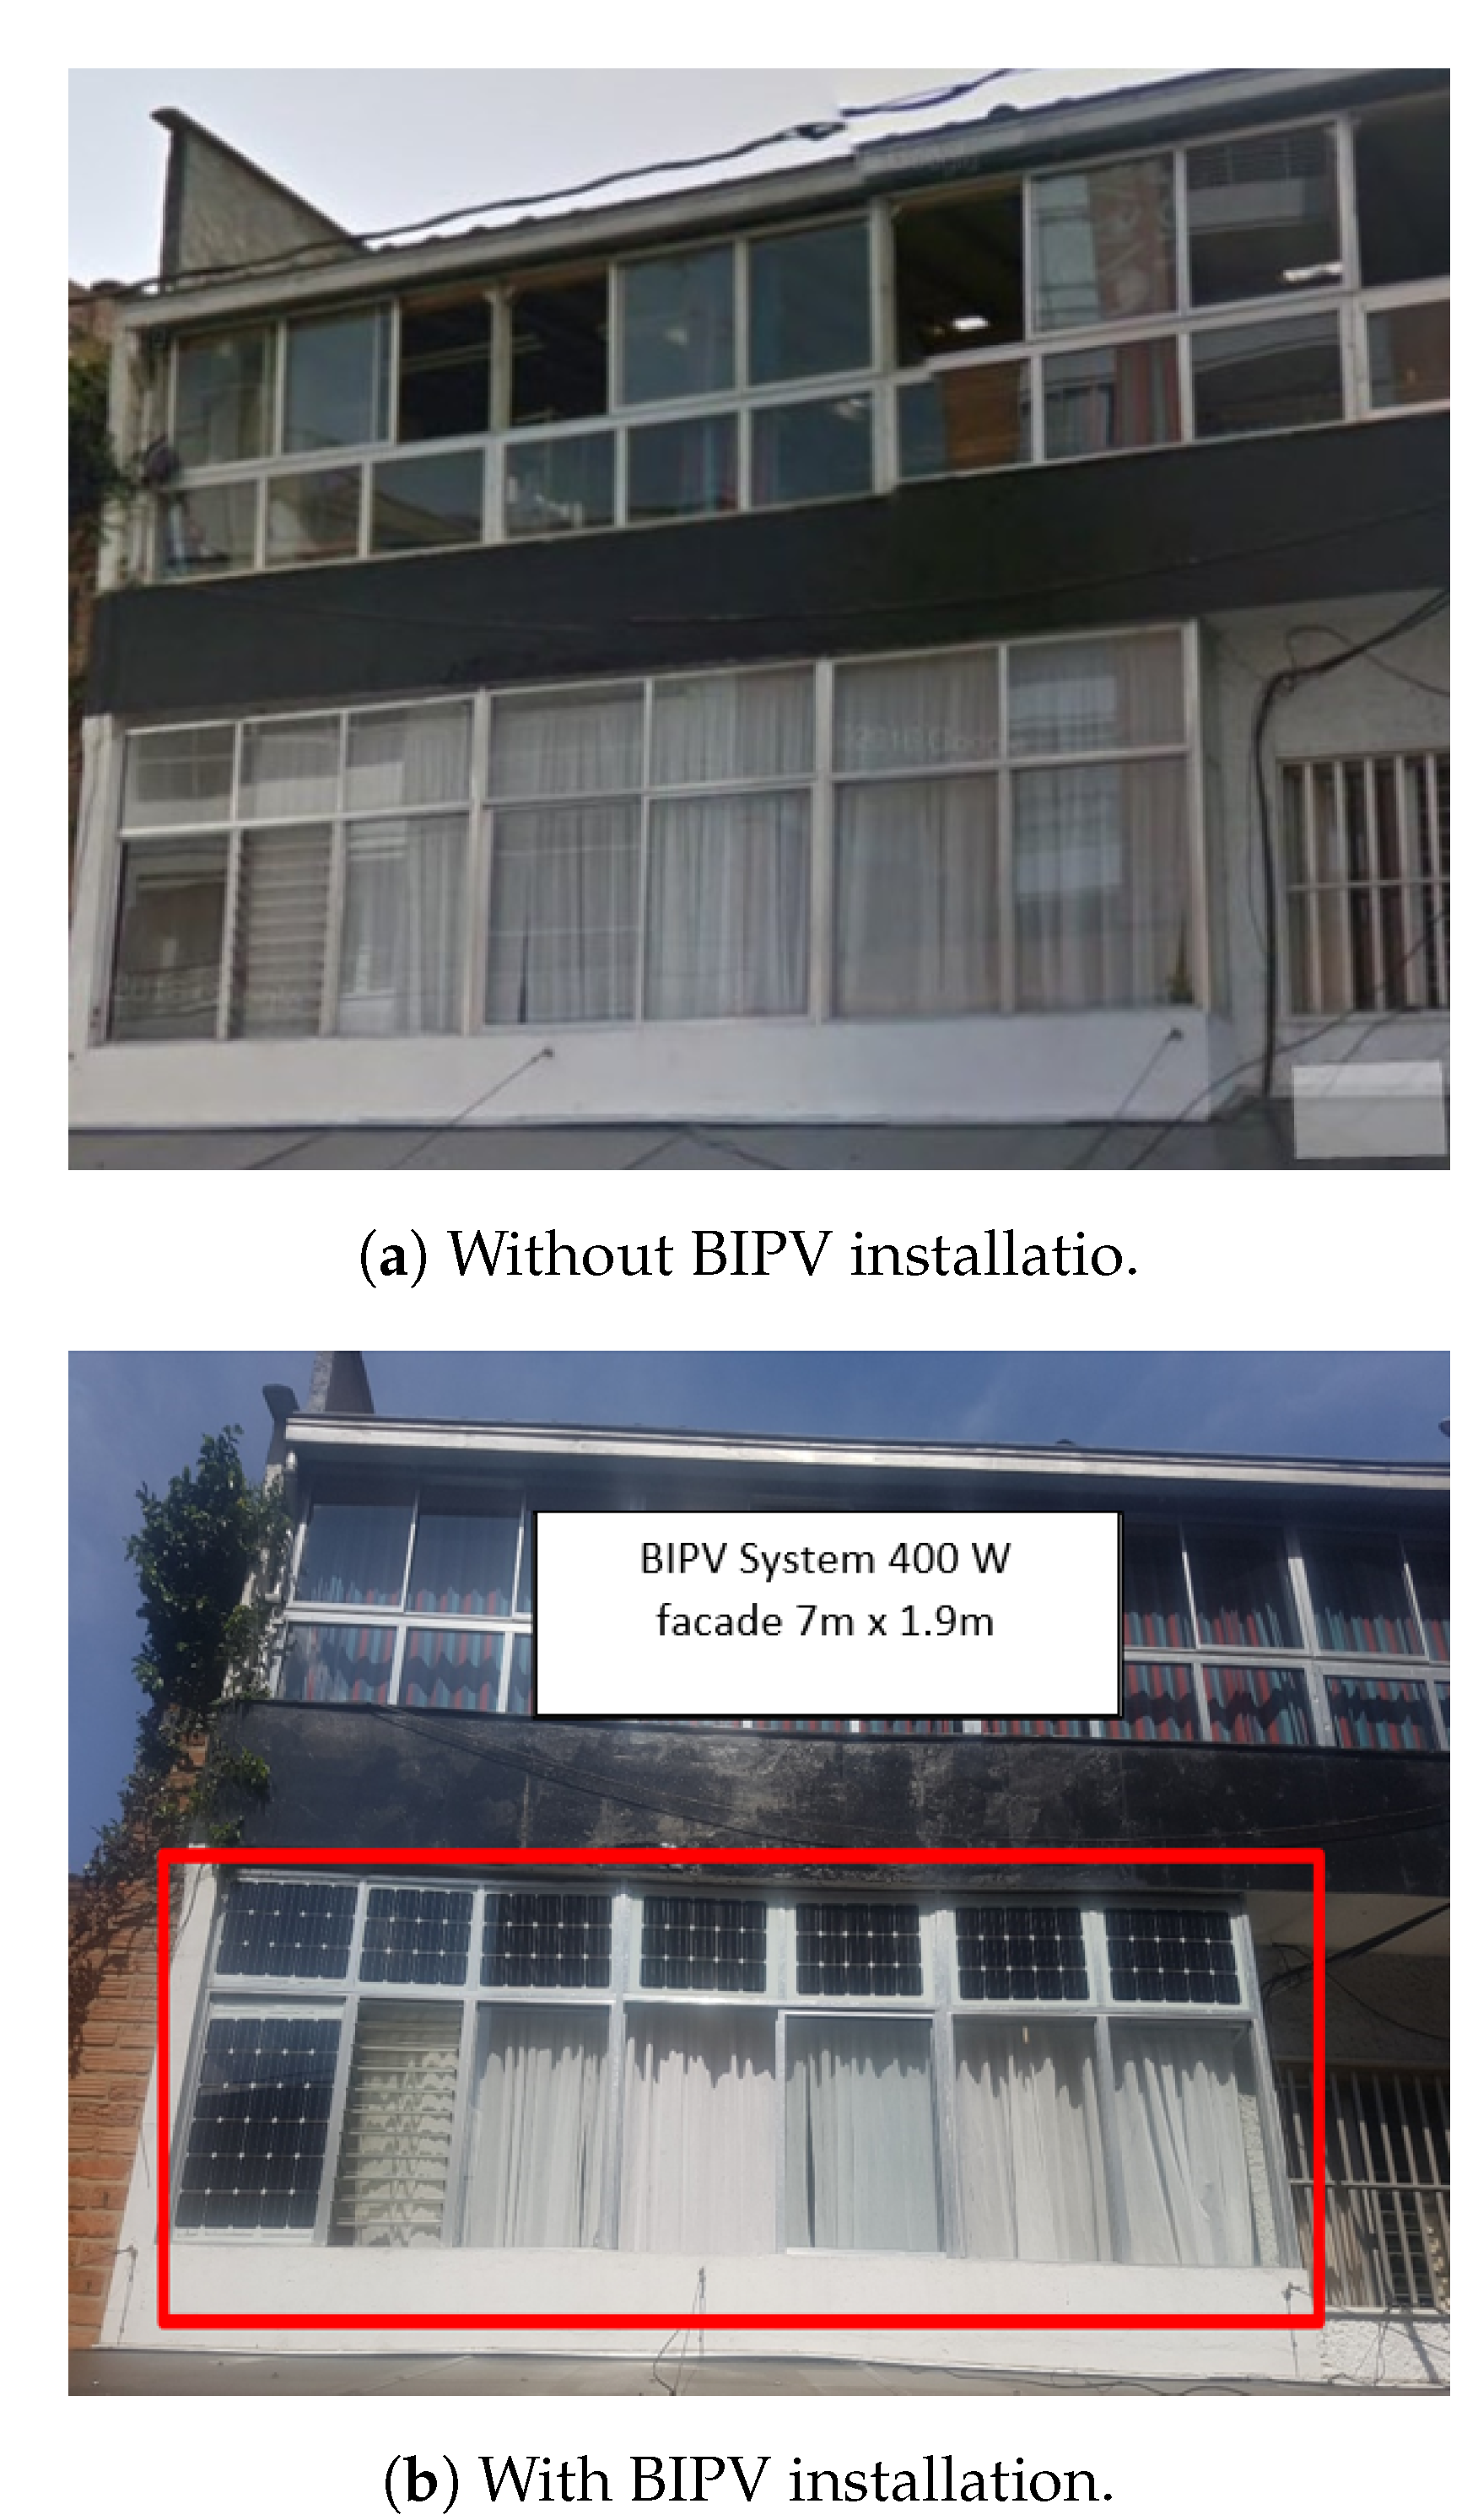
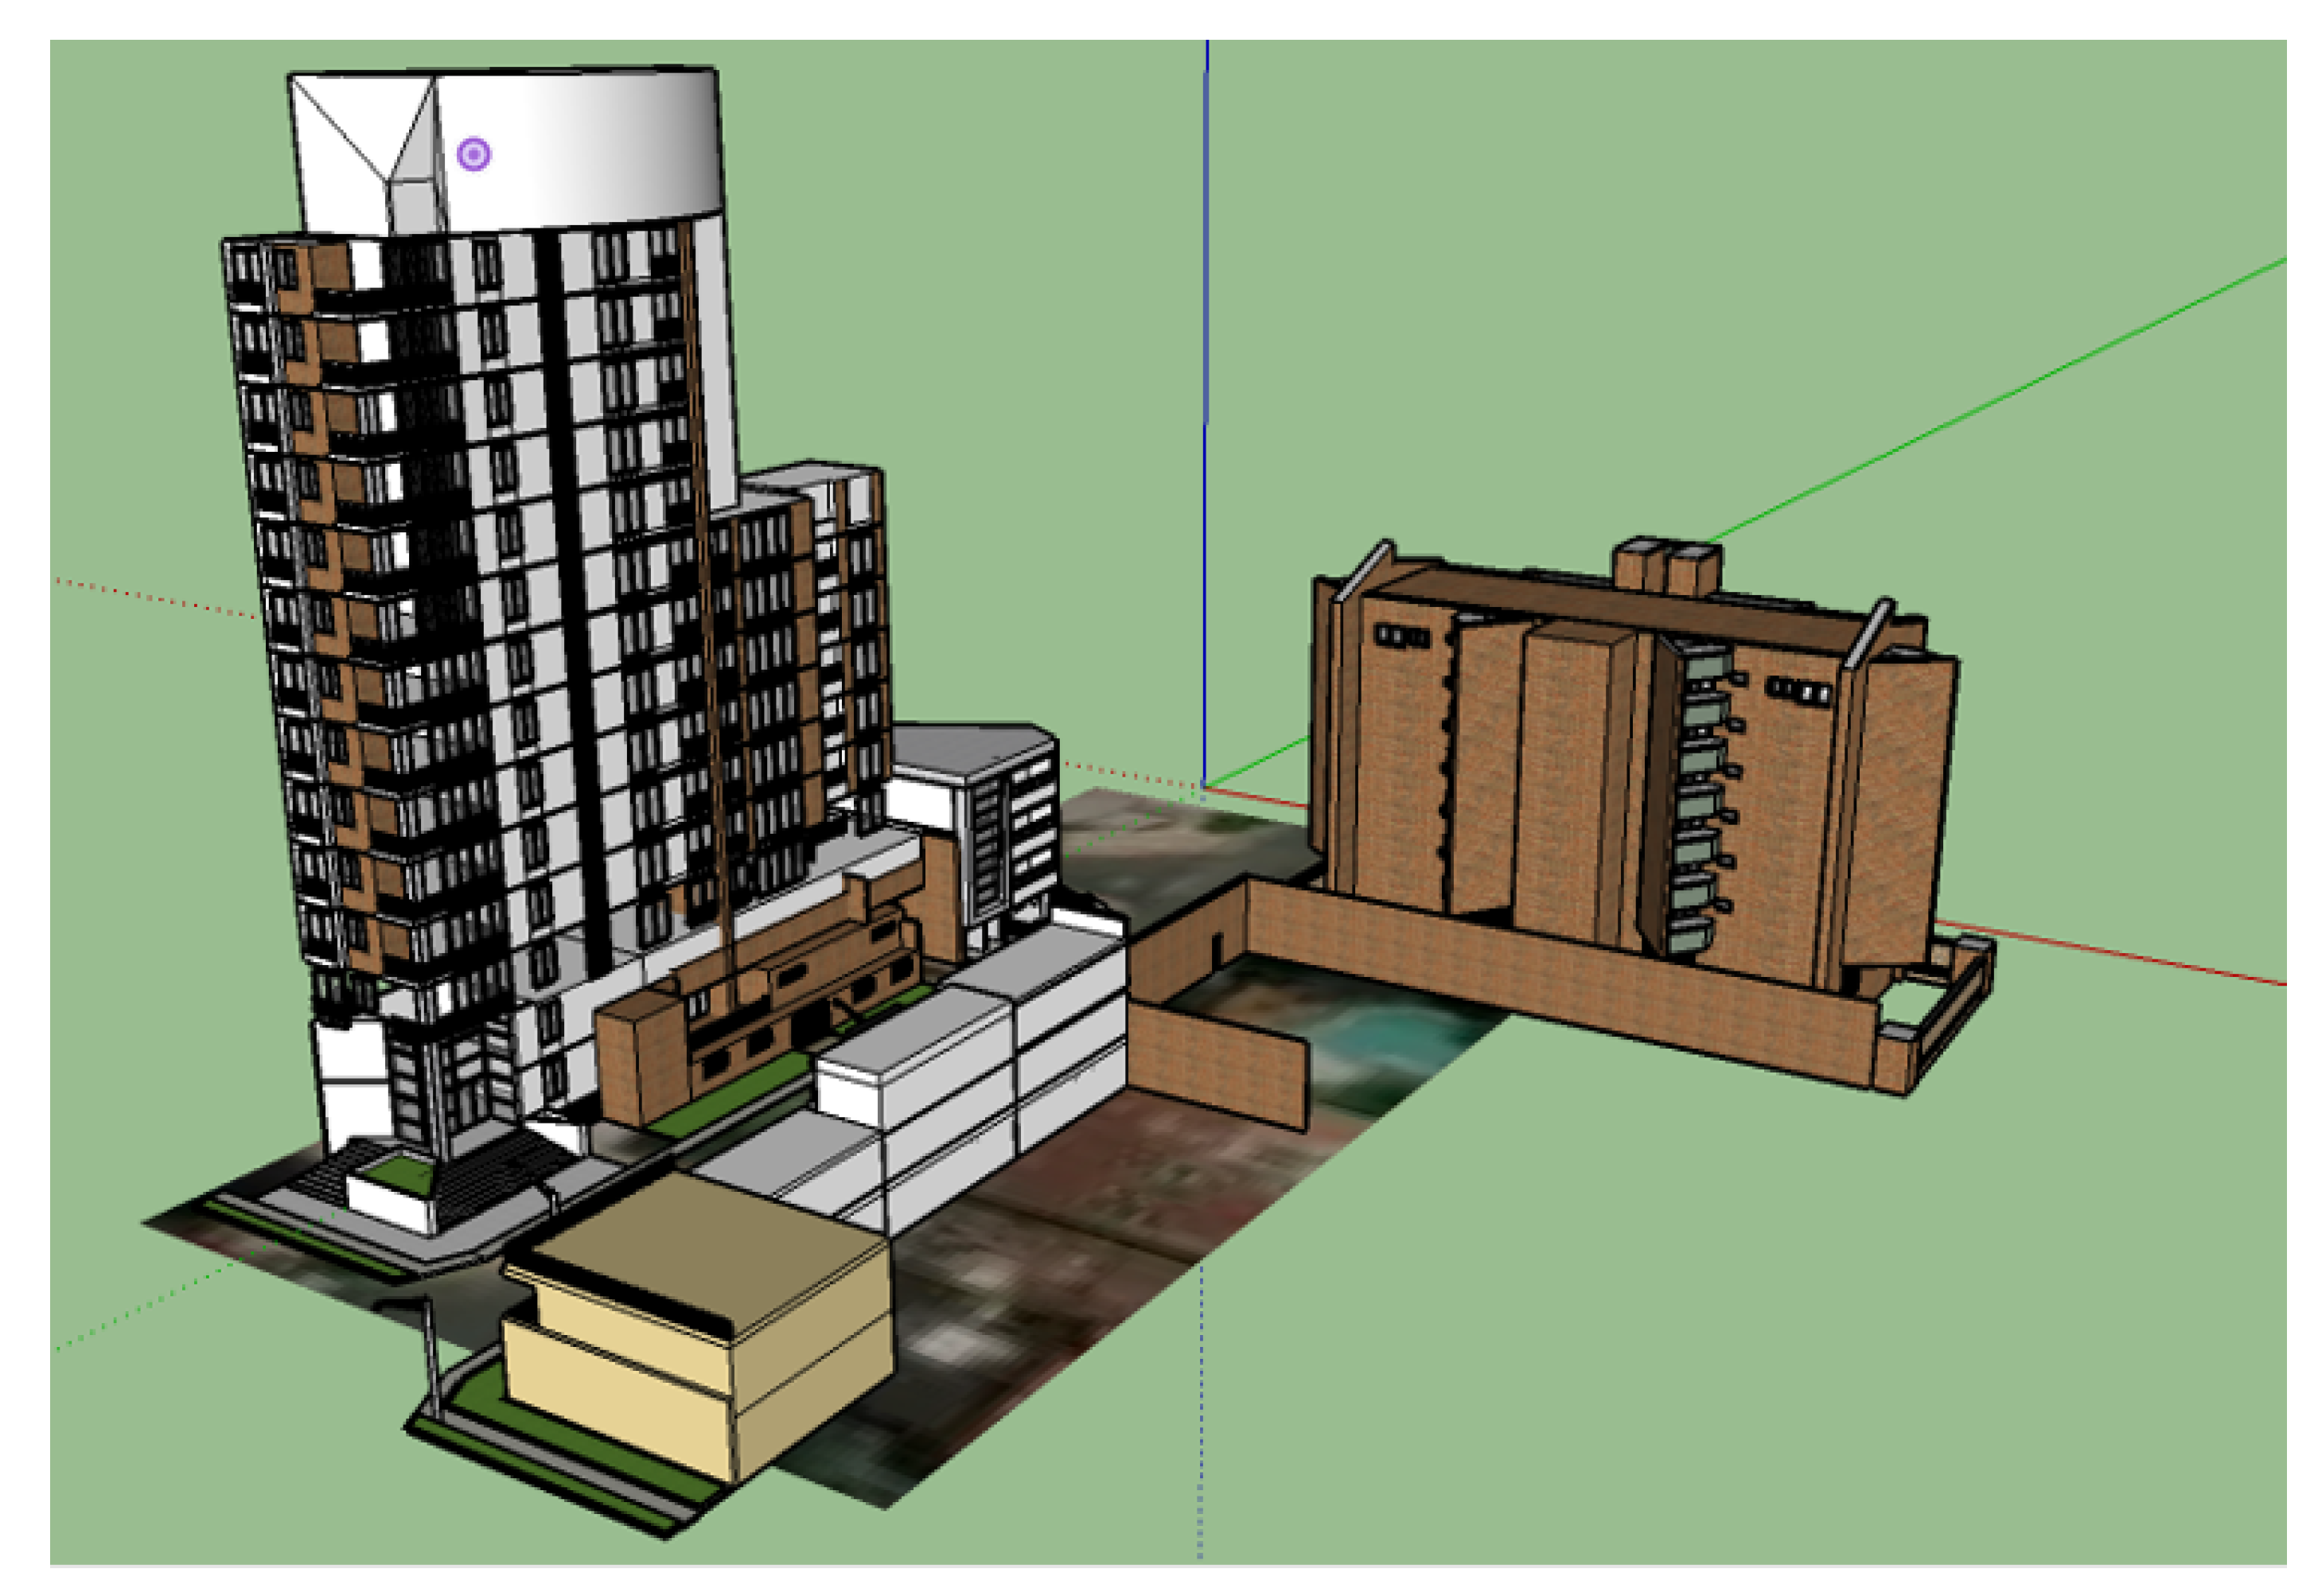
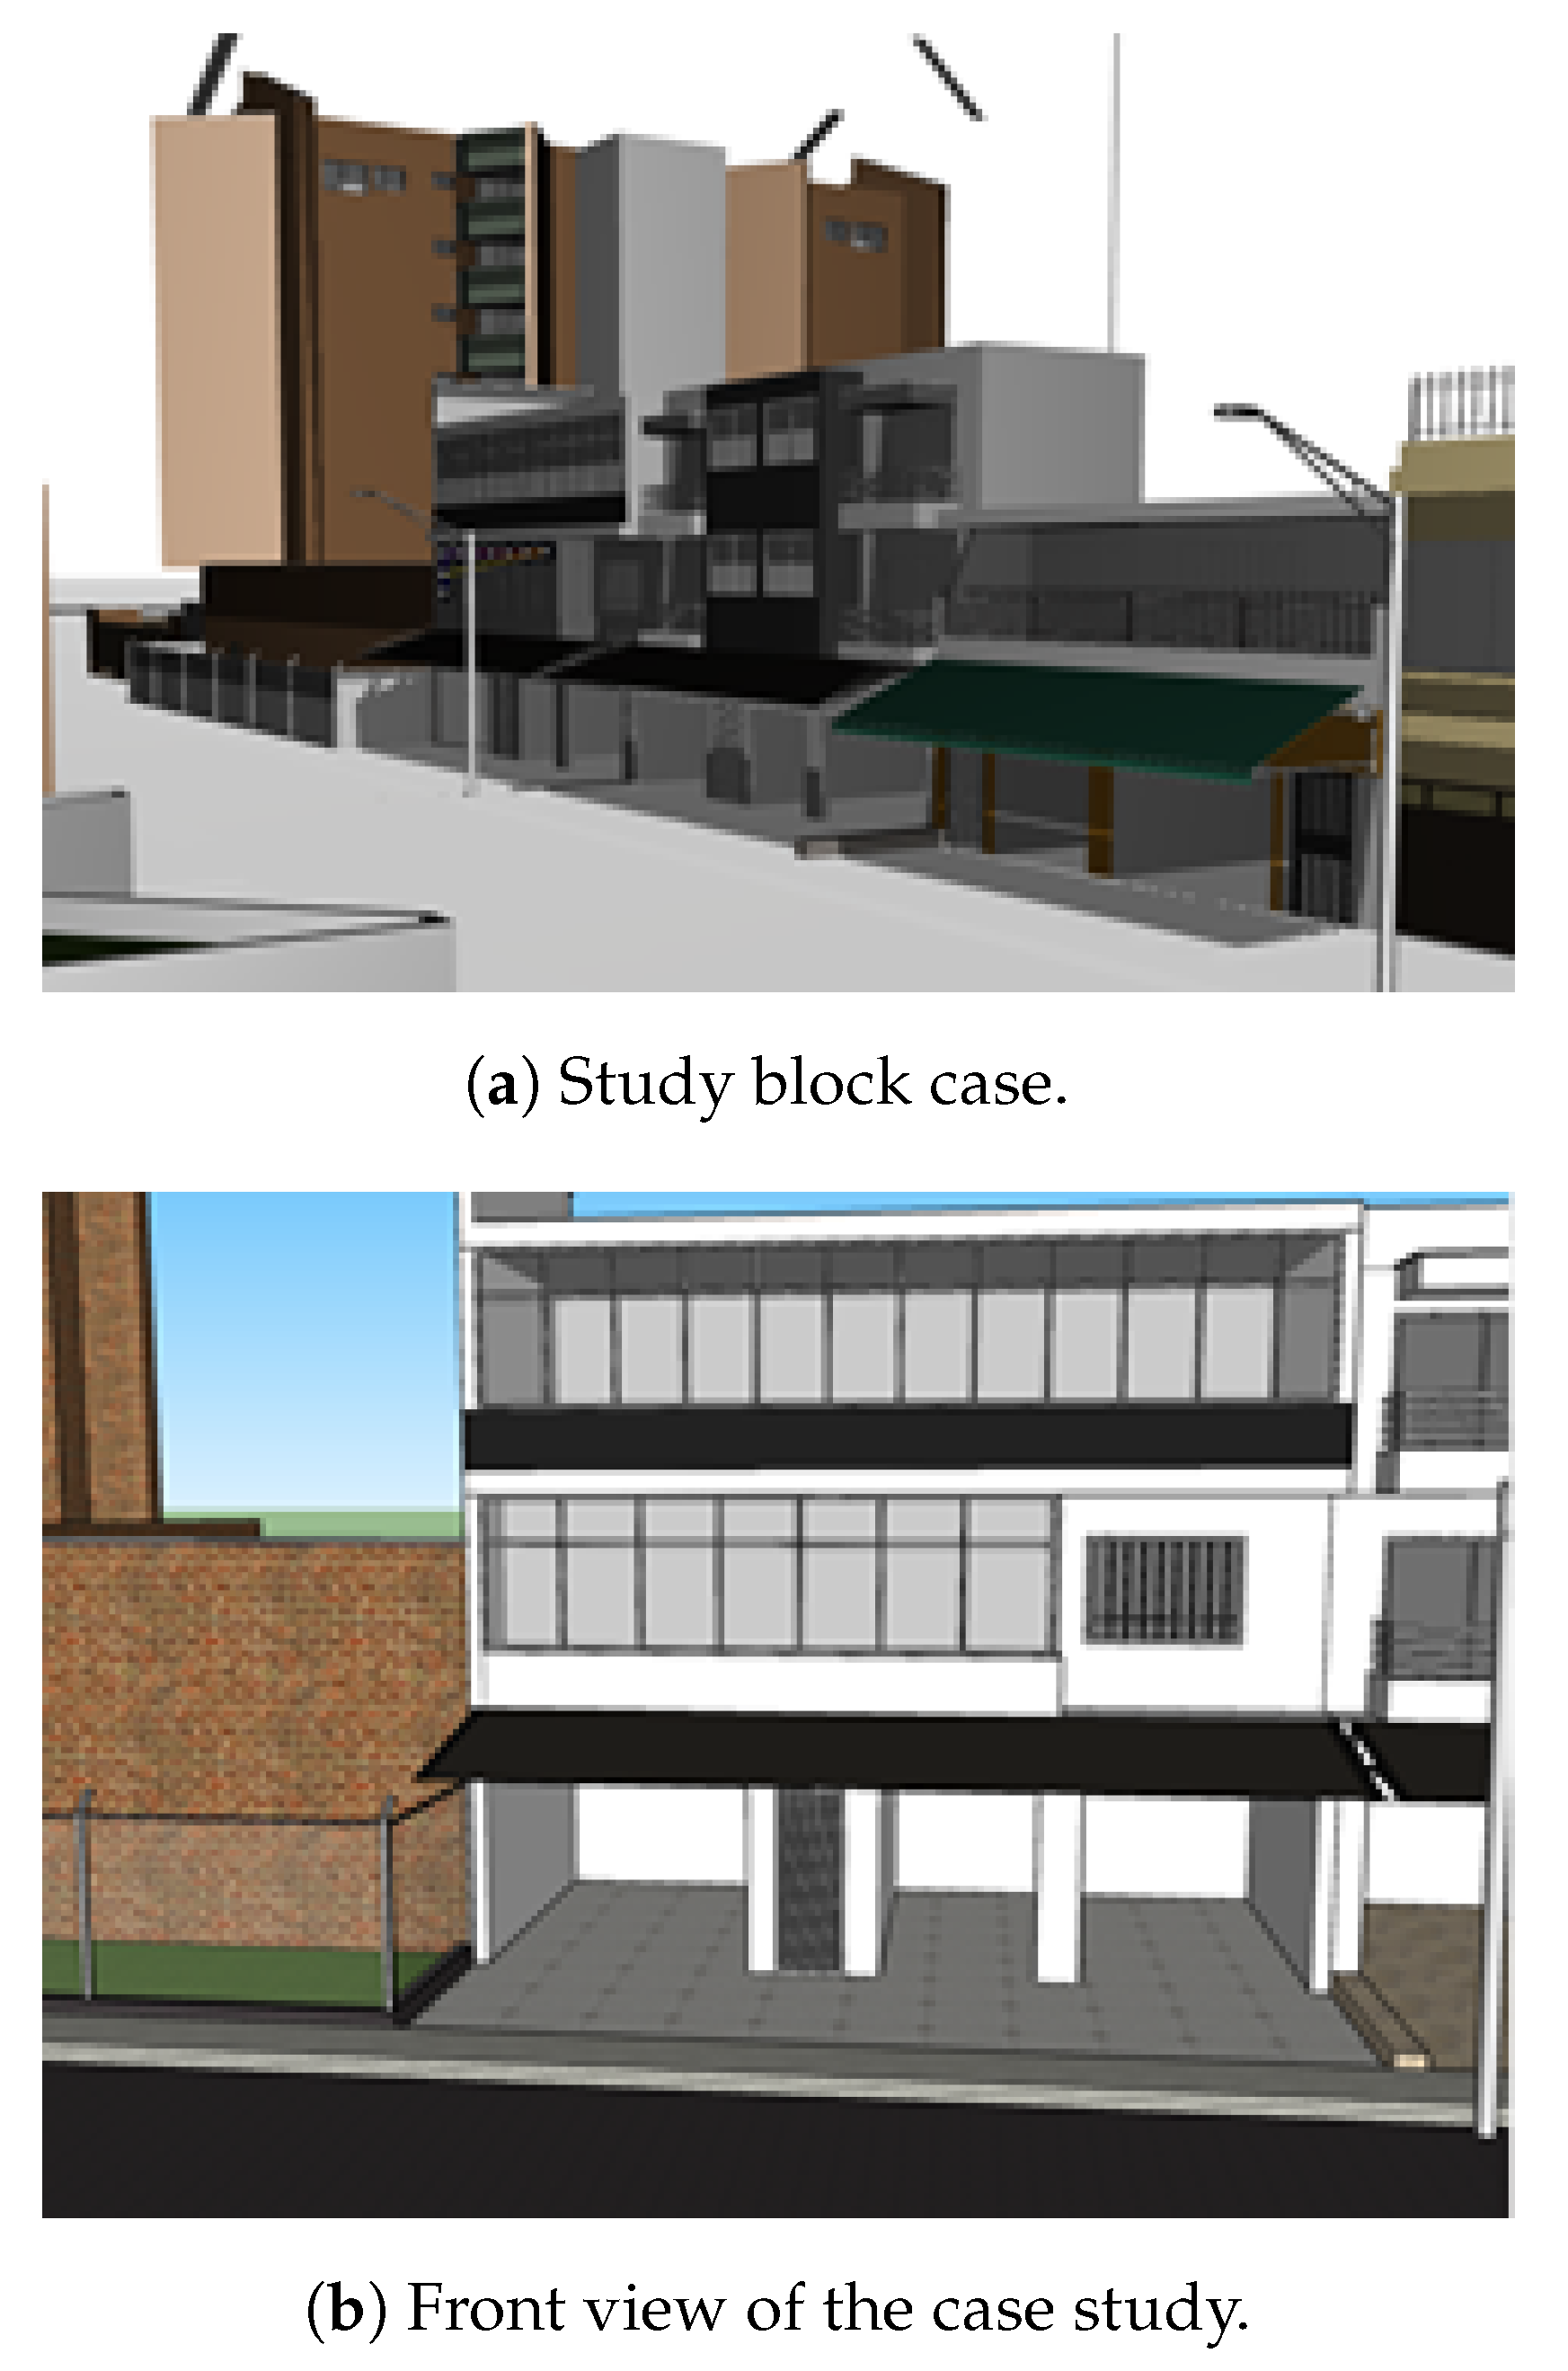
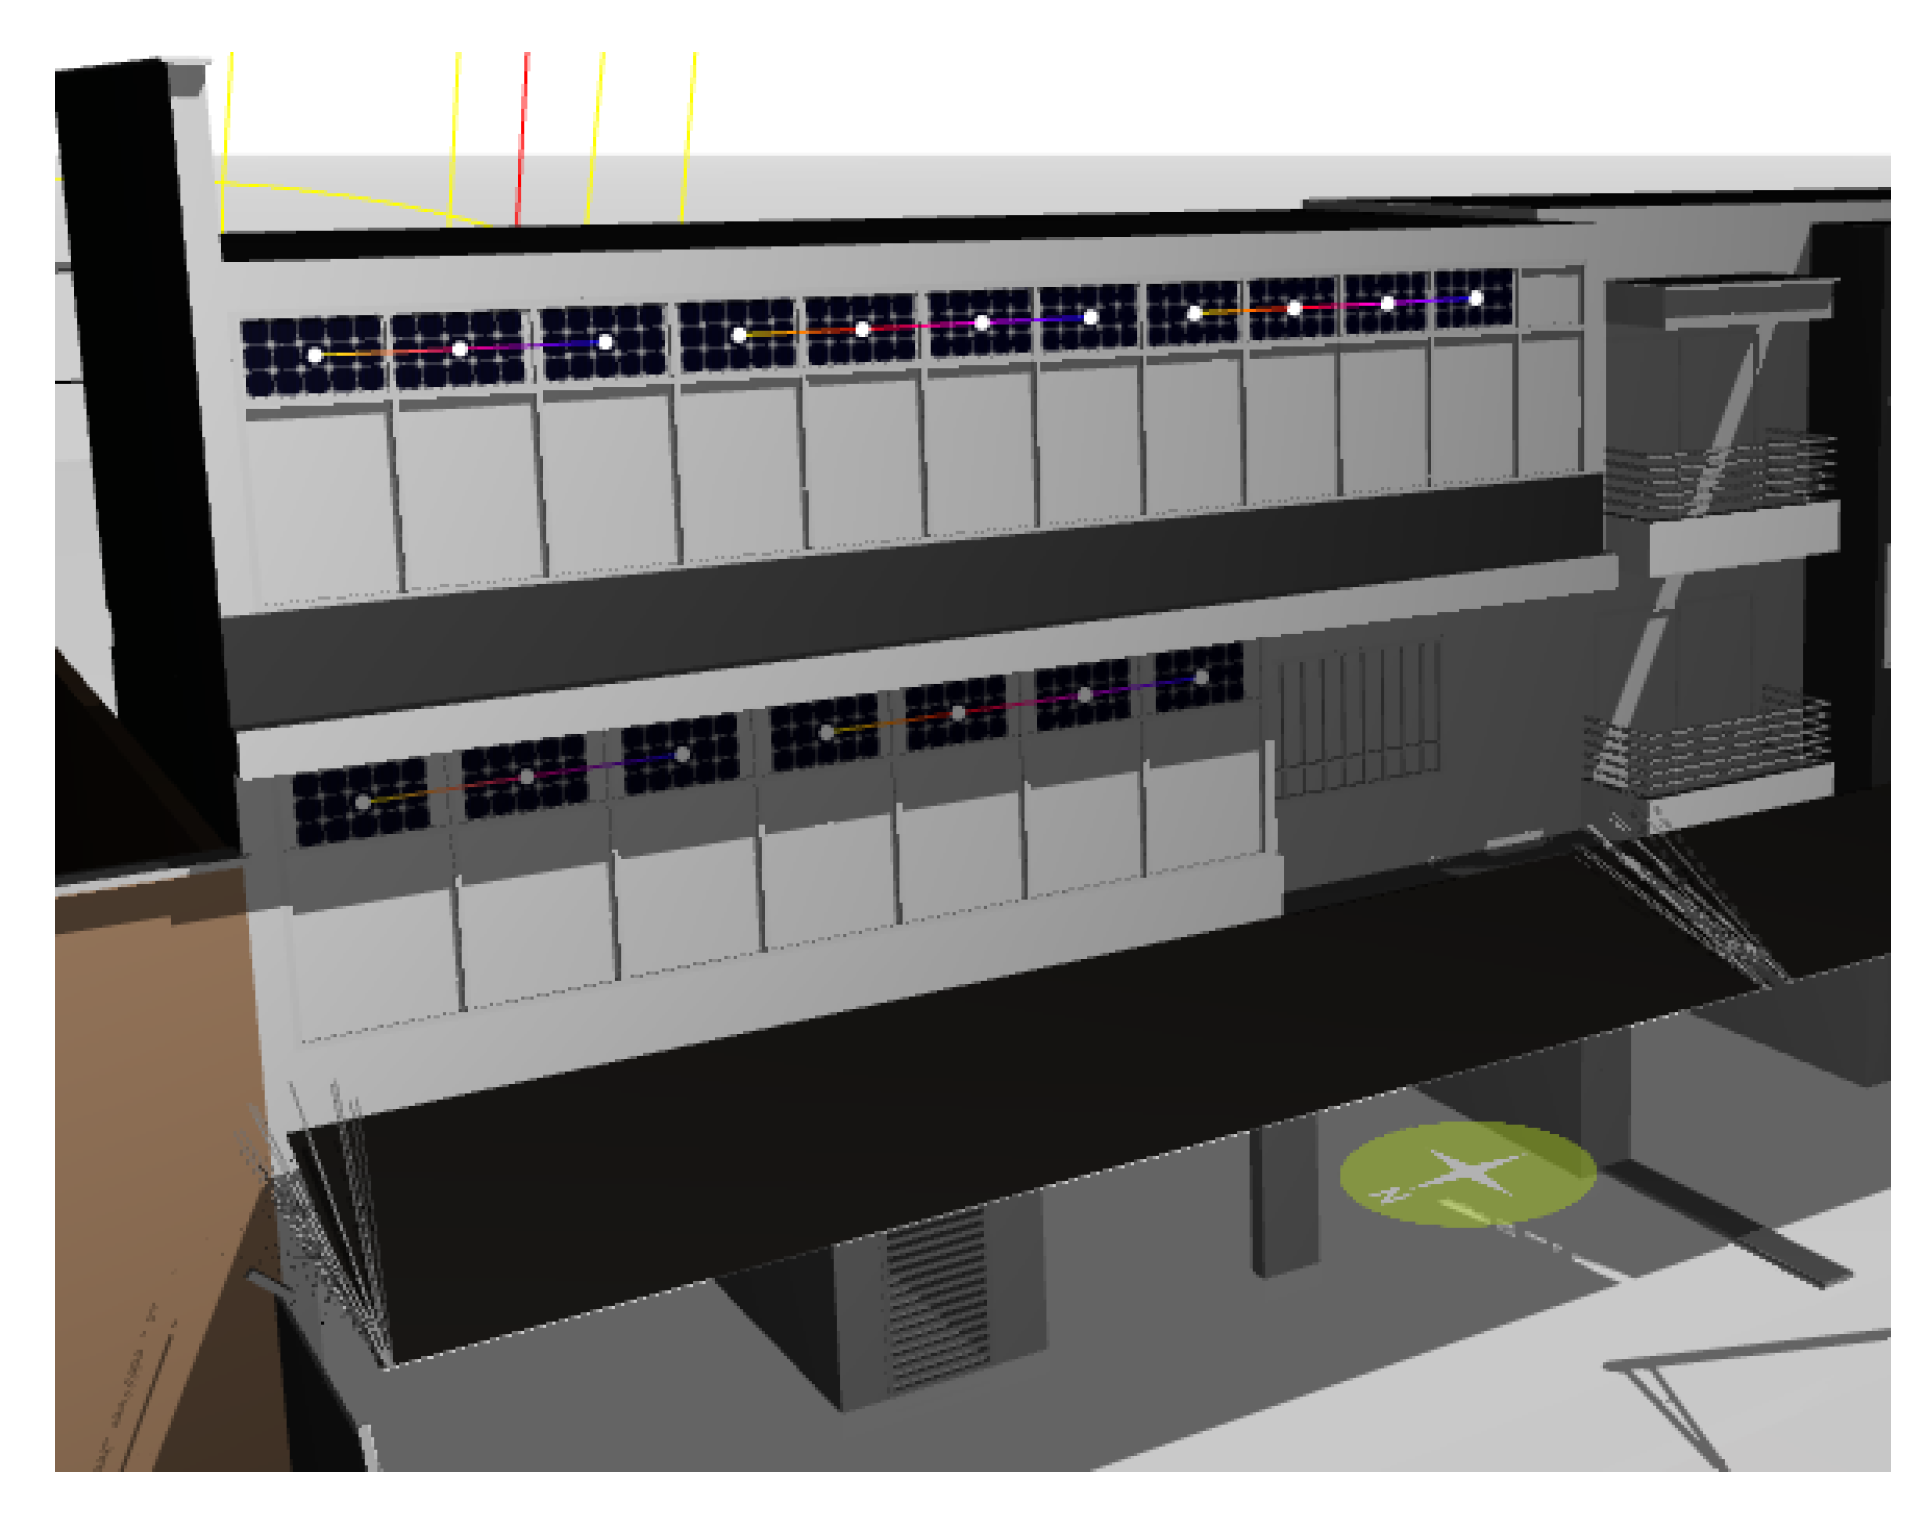
3.1. Case Study
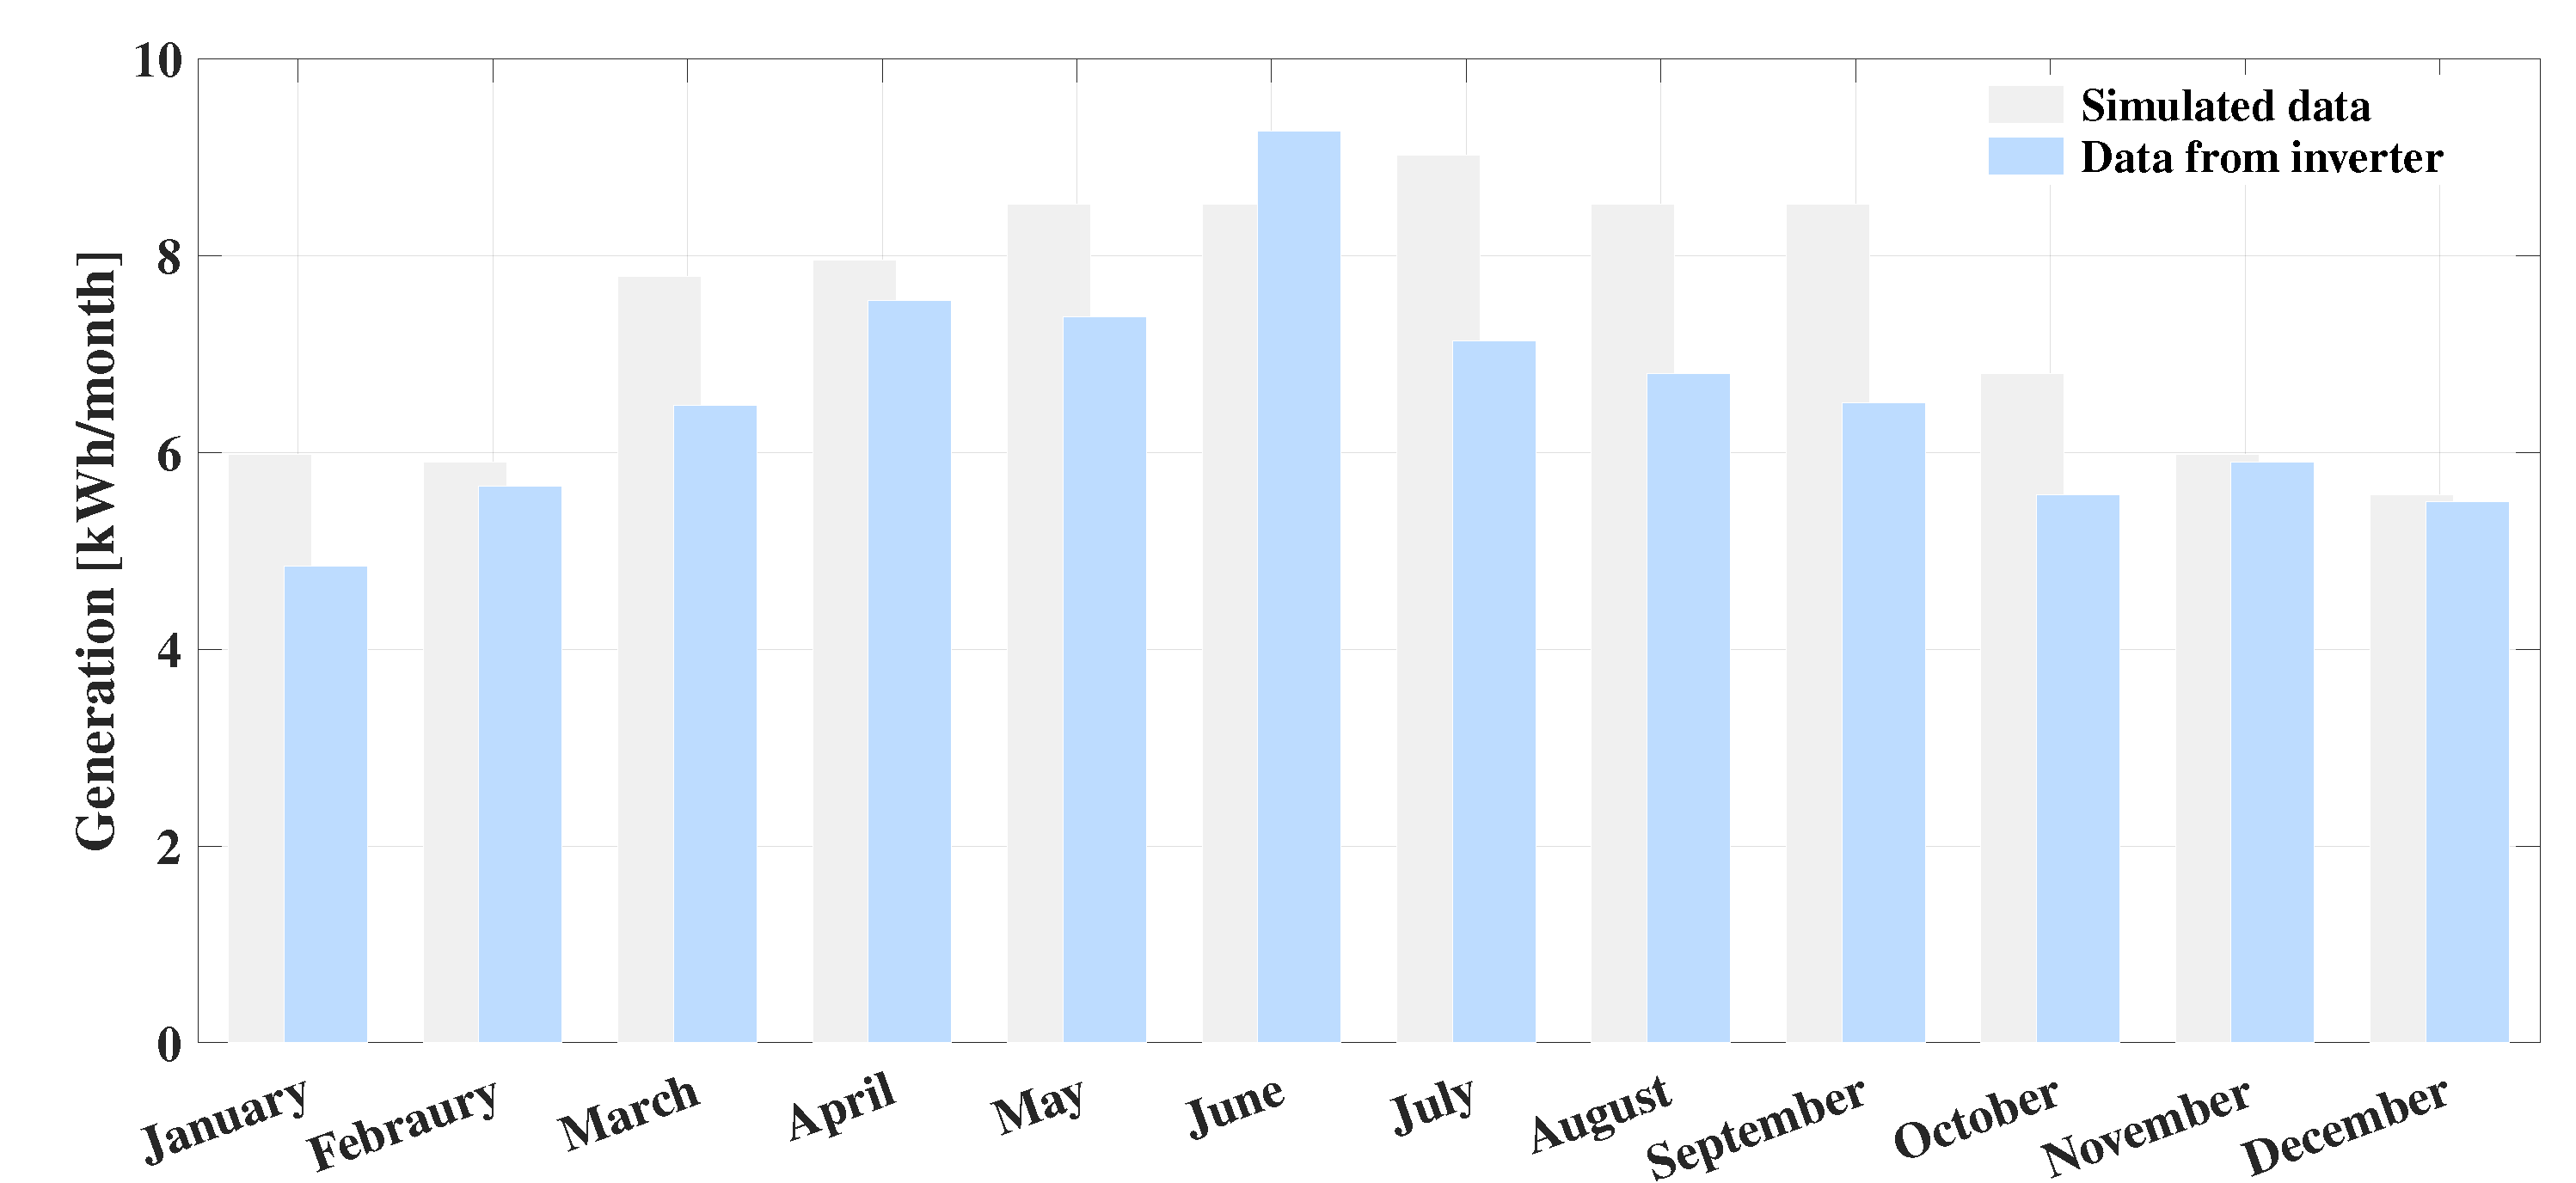
3.2. Case Study Simulation
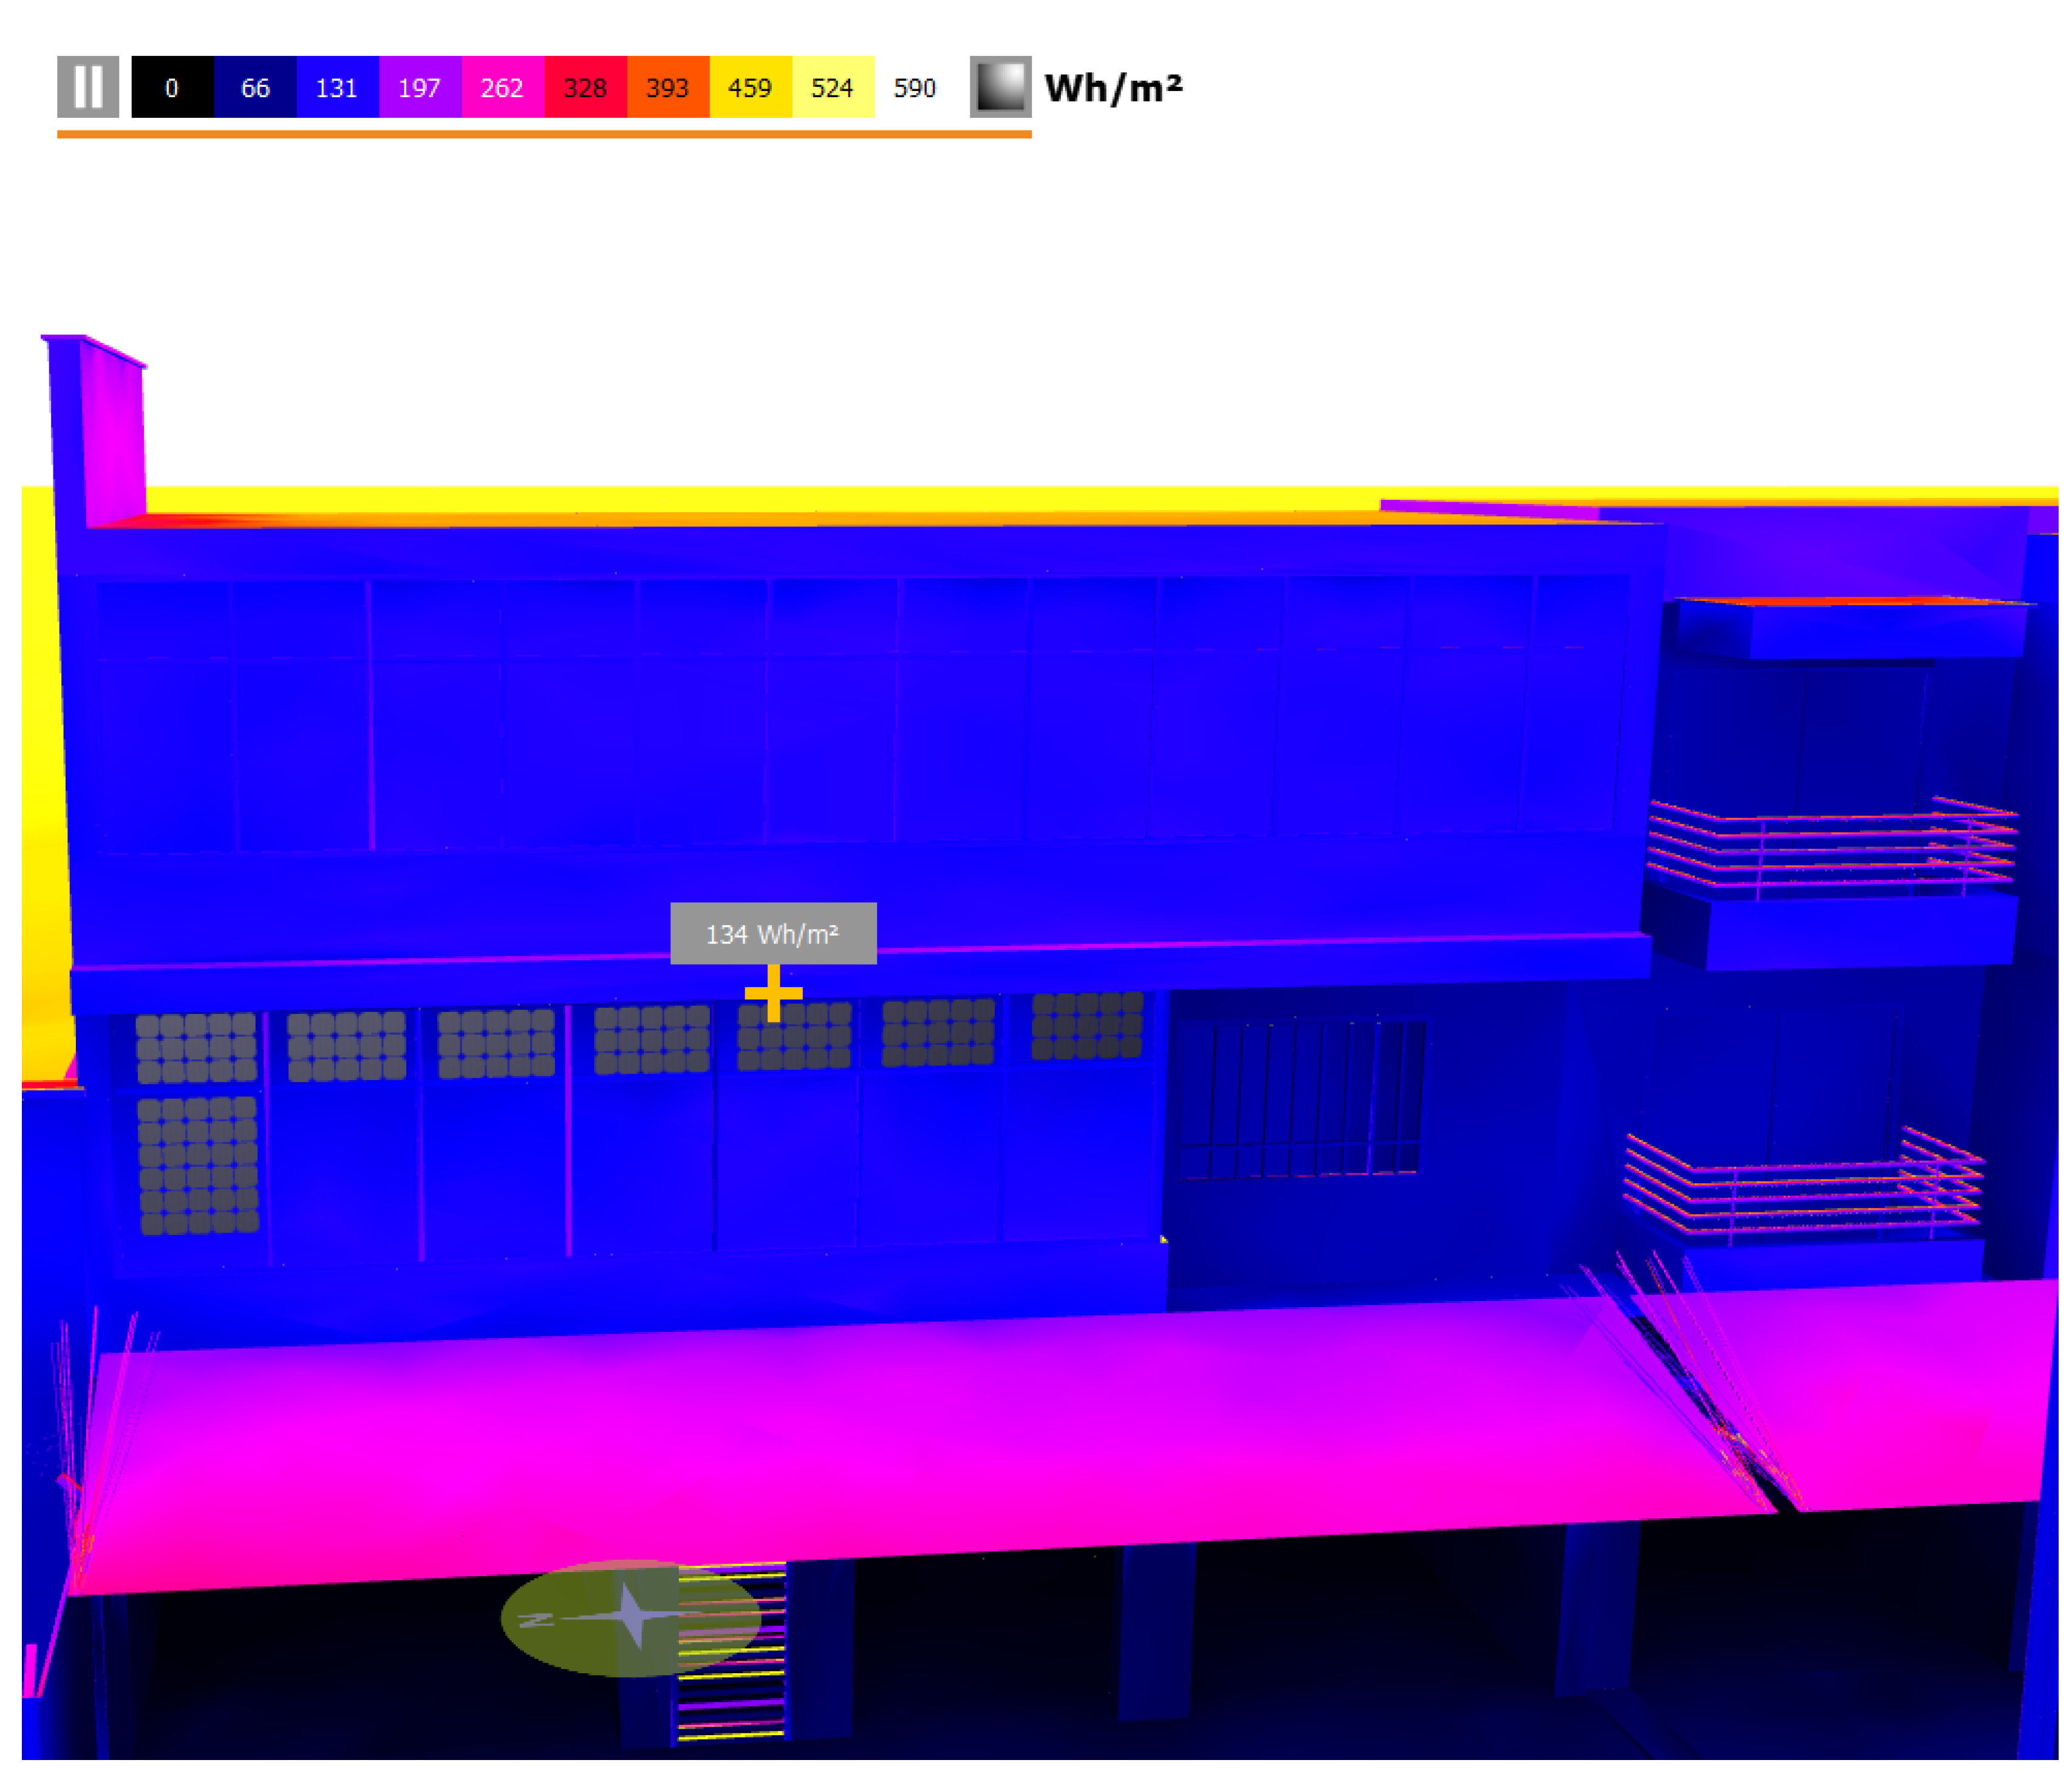
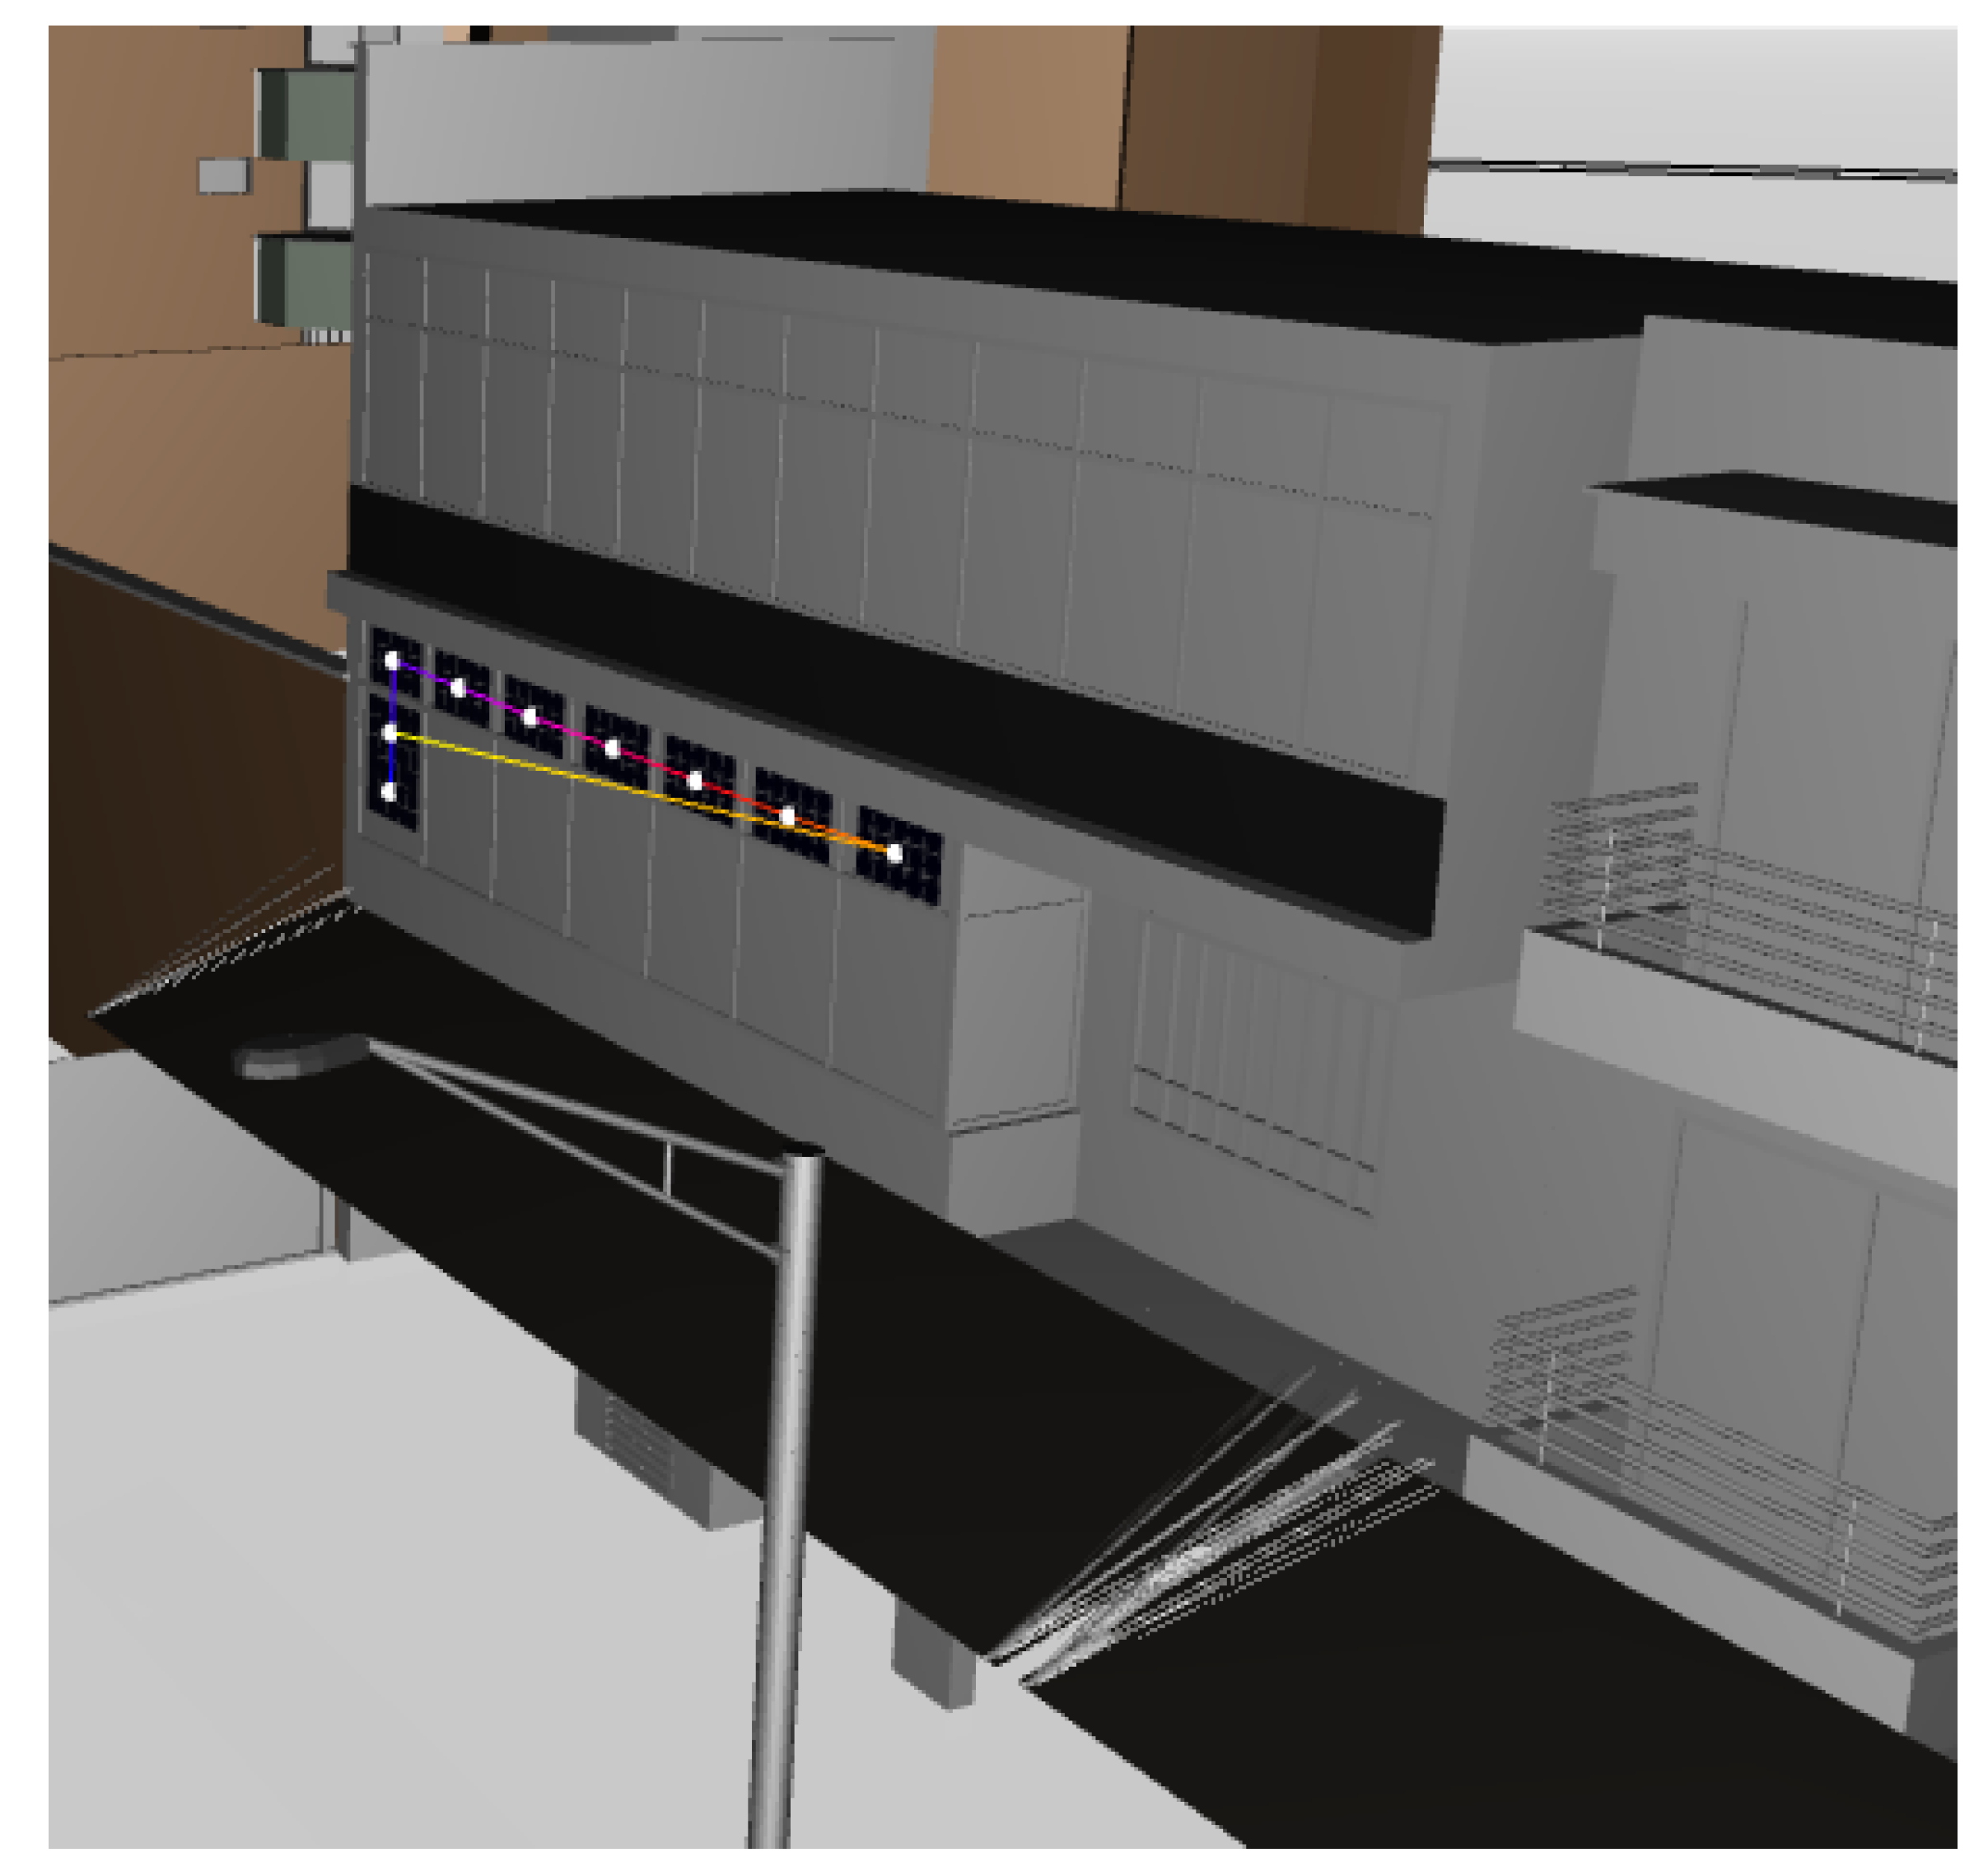
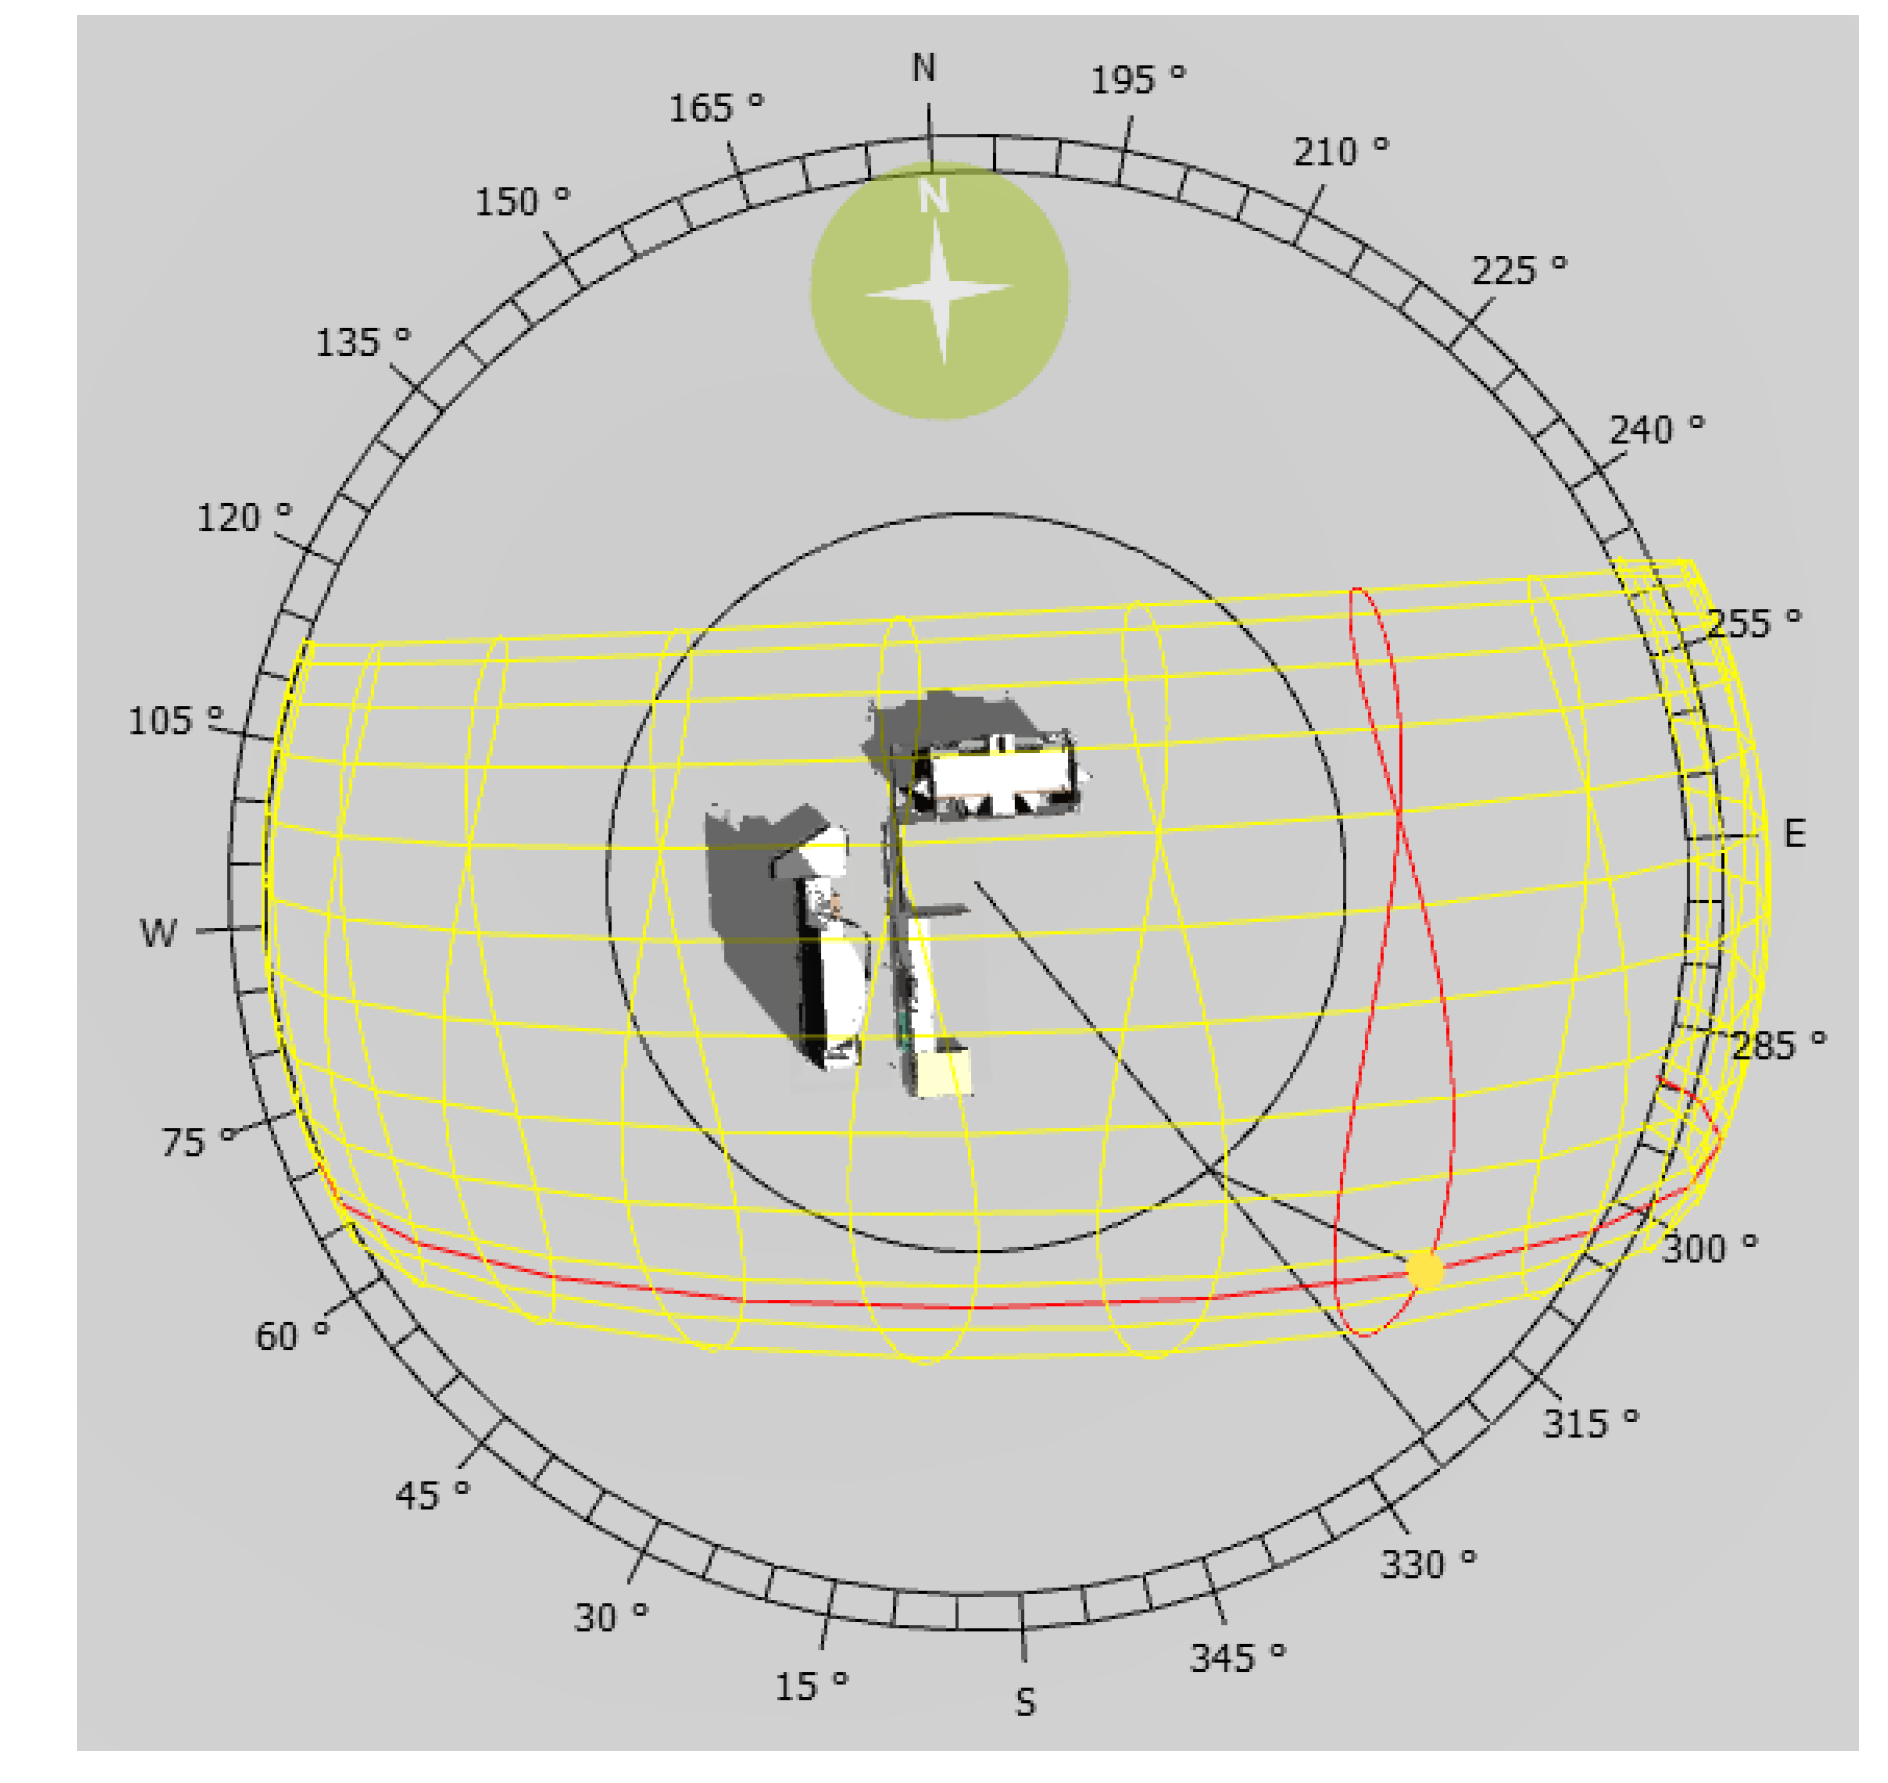
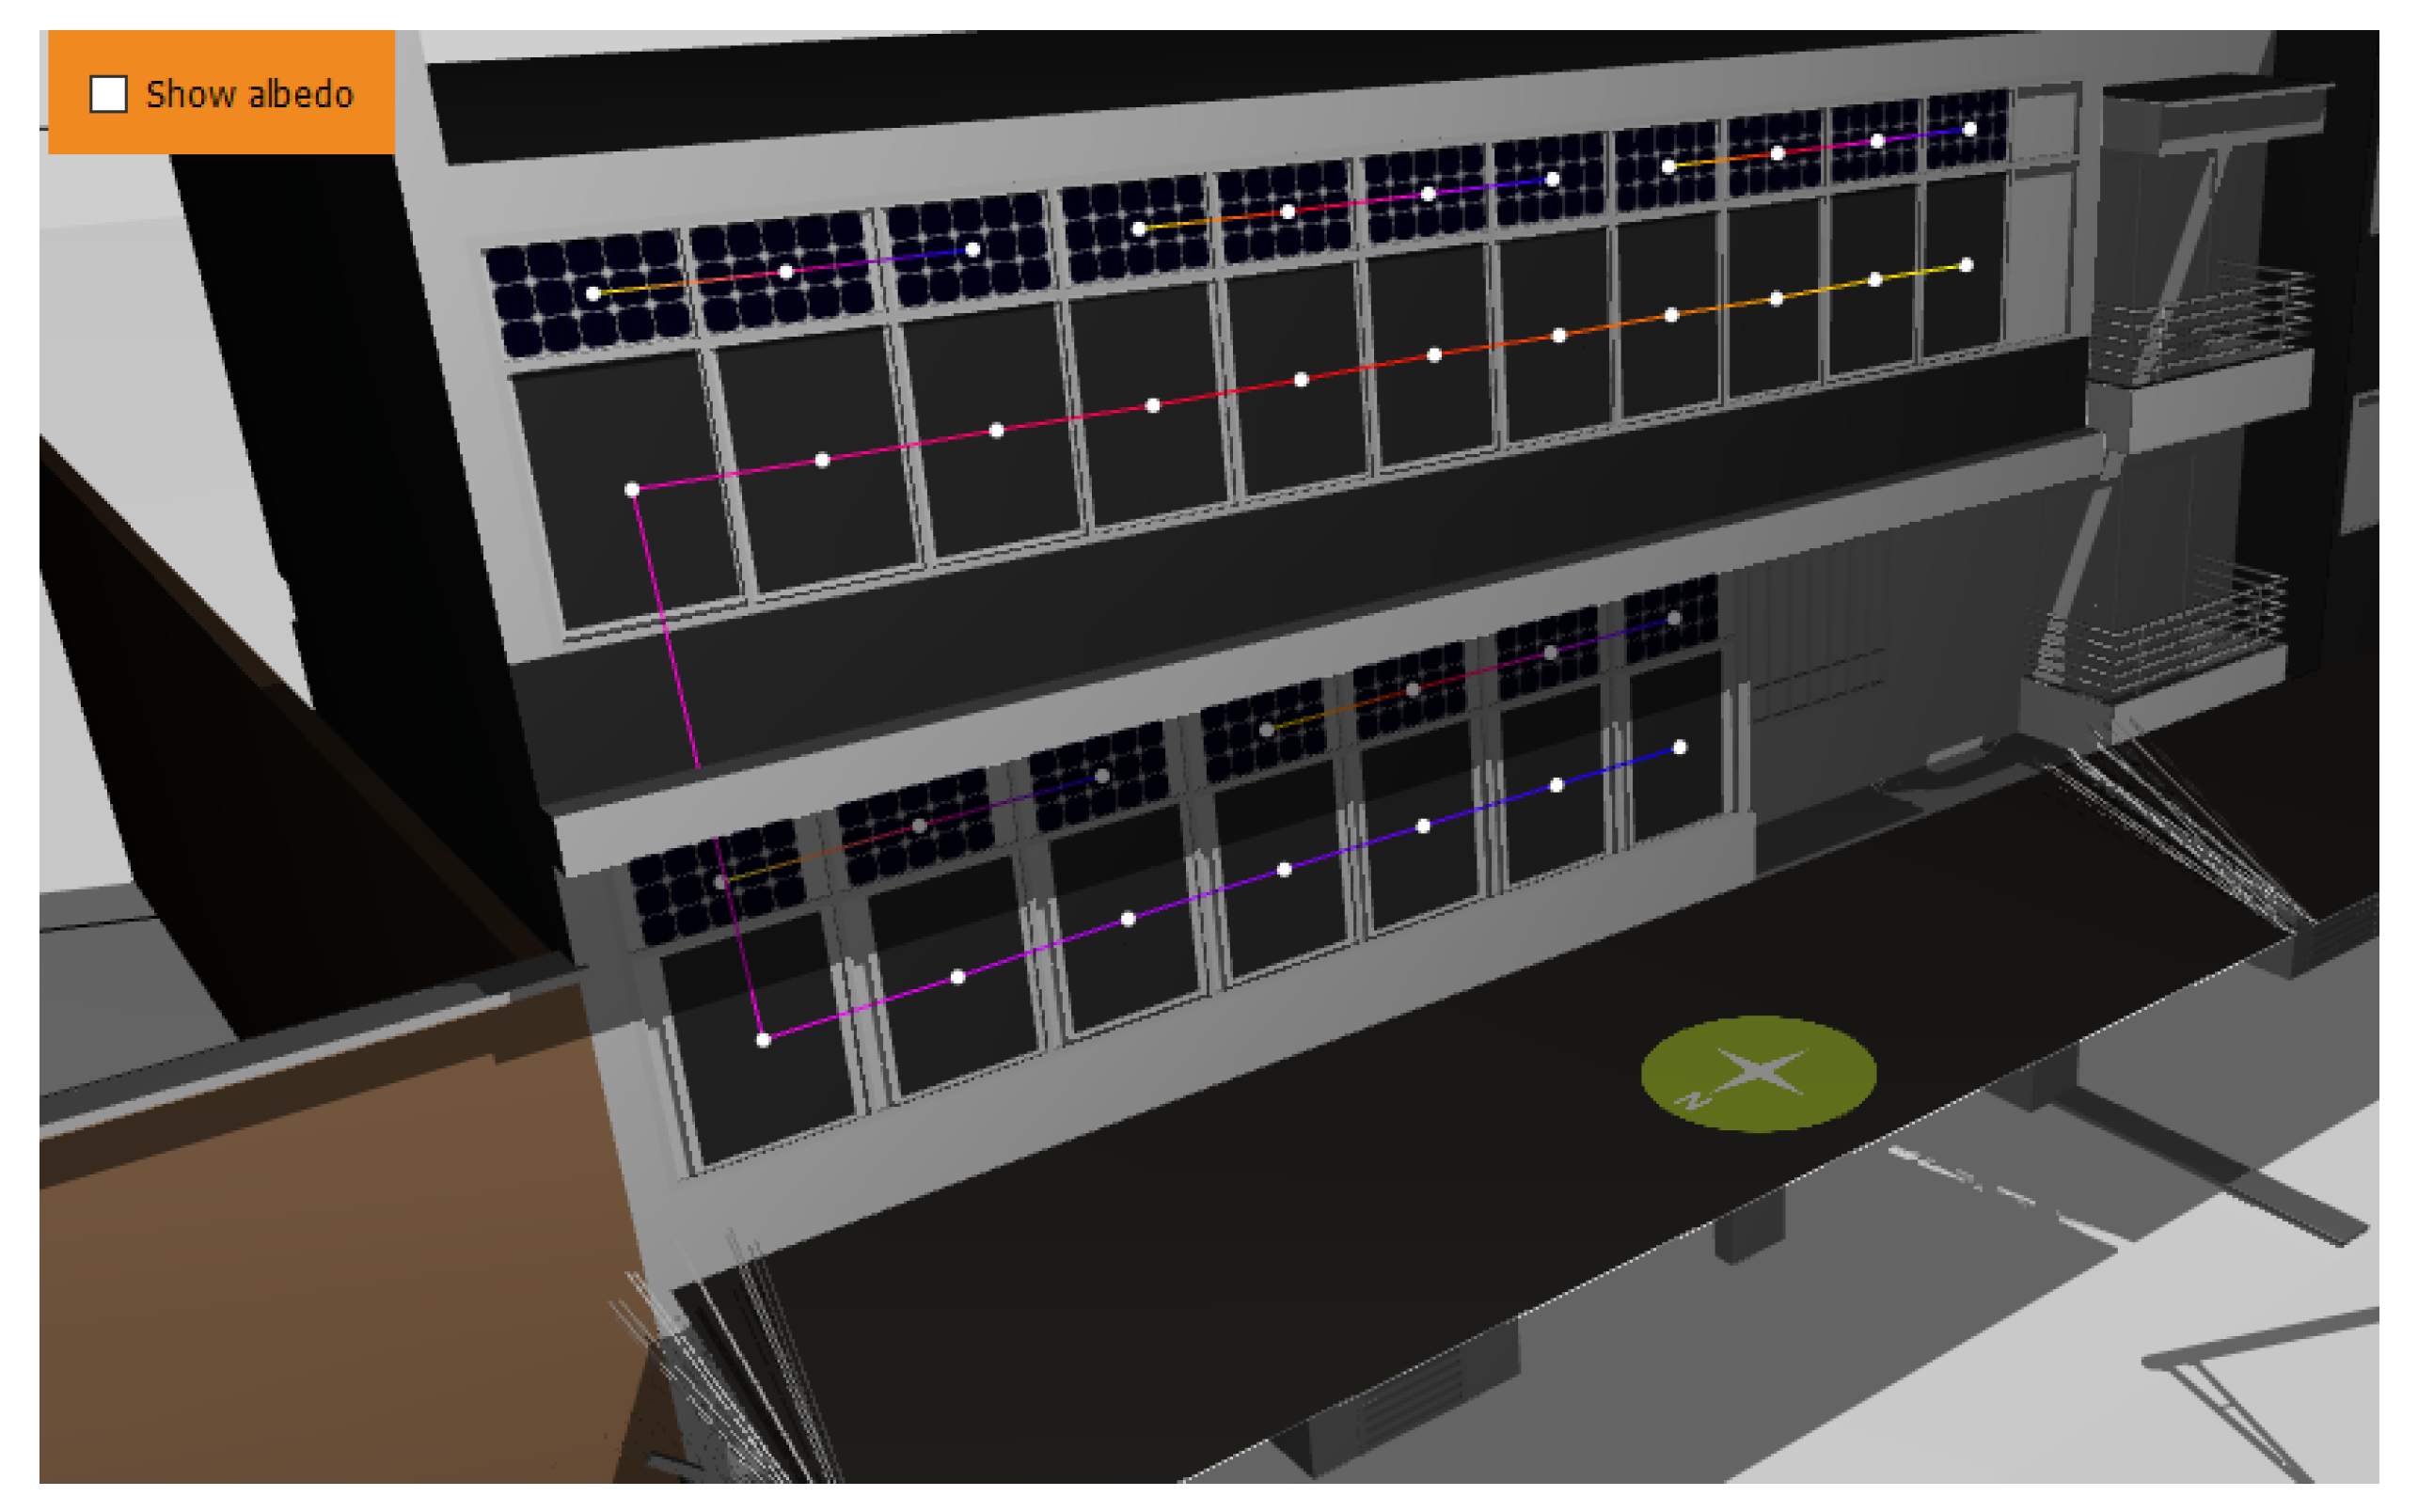
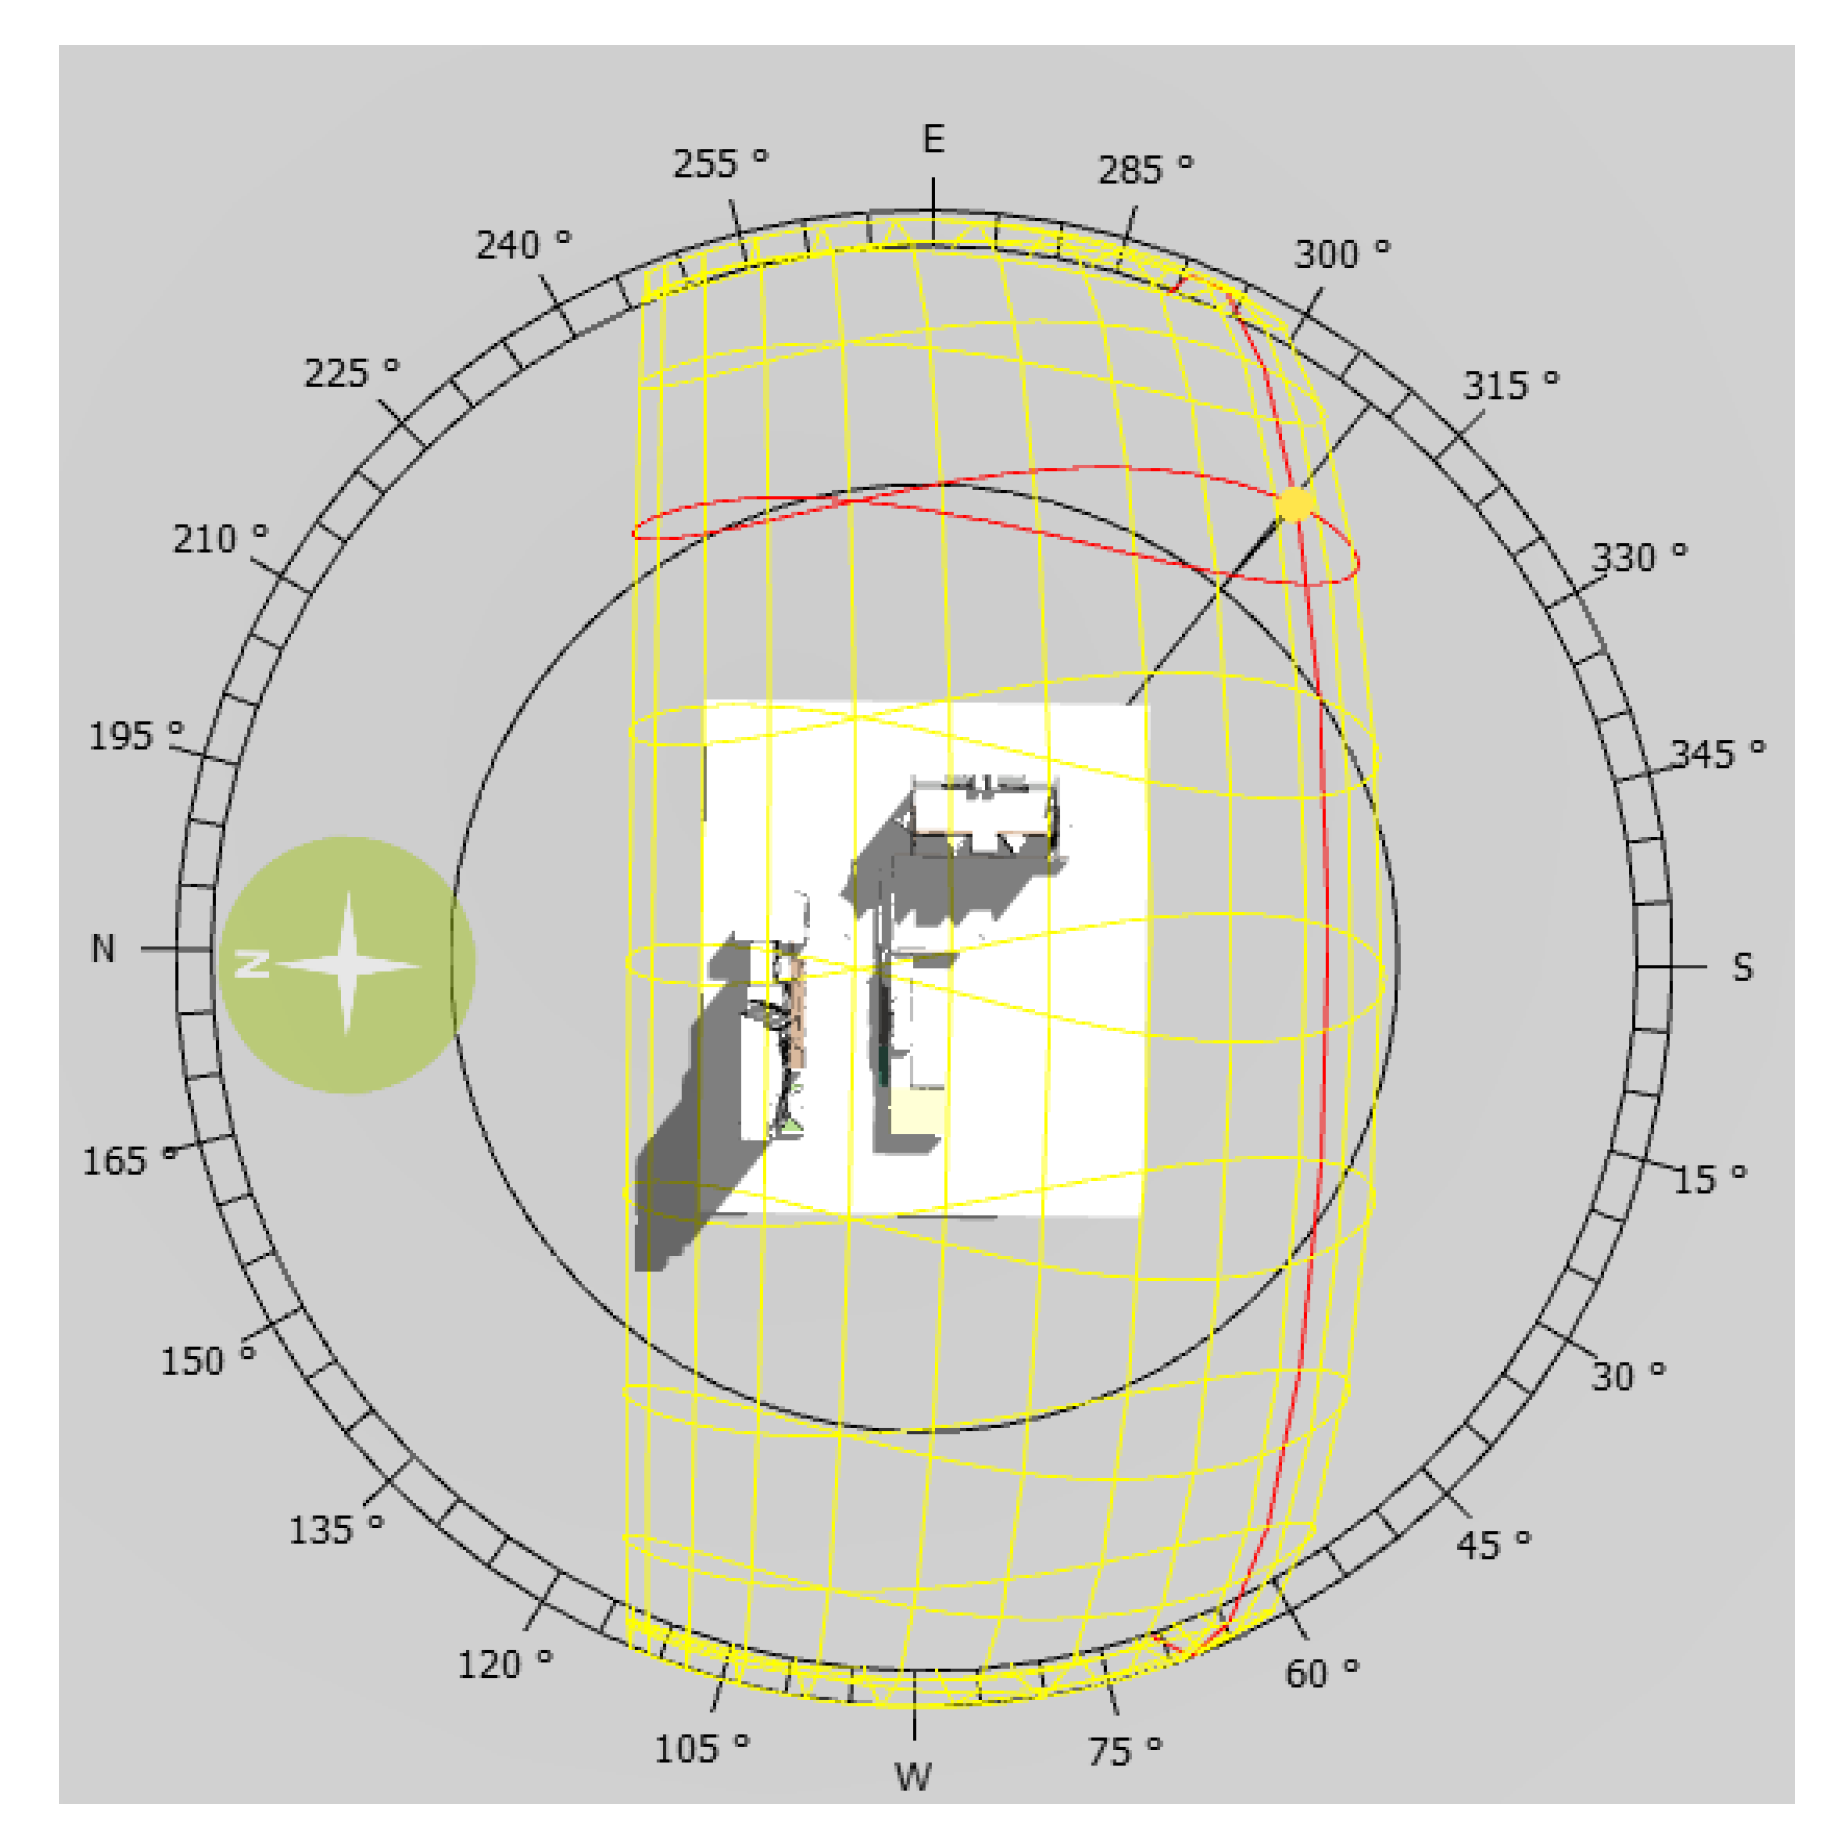
3.3. Irradiance on the Window Surfaces
3.4. Return on Investment
- System capacity: the experimental system of 8 panels installed in the building with a generating capacity of 400 Wp.
- Cost per Wp installed: the cost of each Wp installed is USD. This cost was taken from Table 1 where the unit installation prices of different photovoltaic generation technologies were compared, both for roofs and facades. In this case, the unit price of the monocrystalline silicon technology with facade installation was chosen.
- Exchange rate: an average value of 3400 COP/USD (TRM of 27 January 2020) was taken due to the constant variation of the TRM in the market.
- Total CAPEX: the total cost of the project. The value is obtained from the product of the total capacity of the system, the cost per Wp installed, and the chosen exchange rate. The total CAPEX of the installation used was USD 640.
- Average generation per year: this value was obtained from the simulation stage of the BIPV system (87,600 Wh/year).
- Energy price: the value is USD/kWh. This price was obtained from energy utility bills and is influenced by socioeconomic factors and the location of the property.
3.5. Improvements
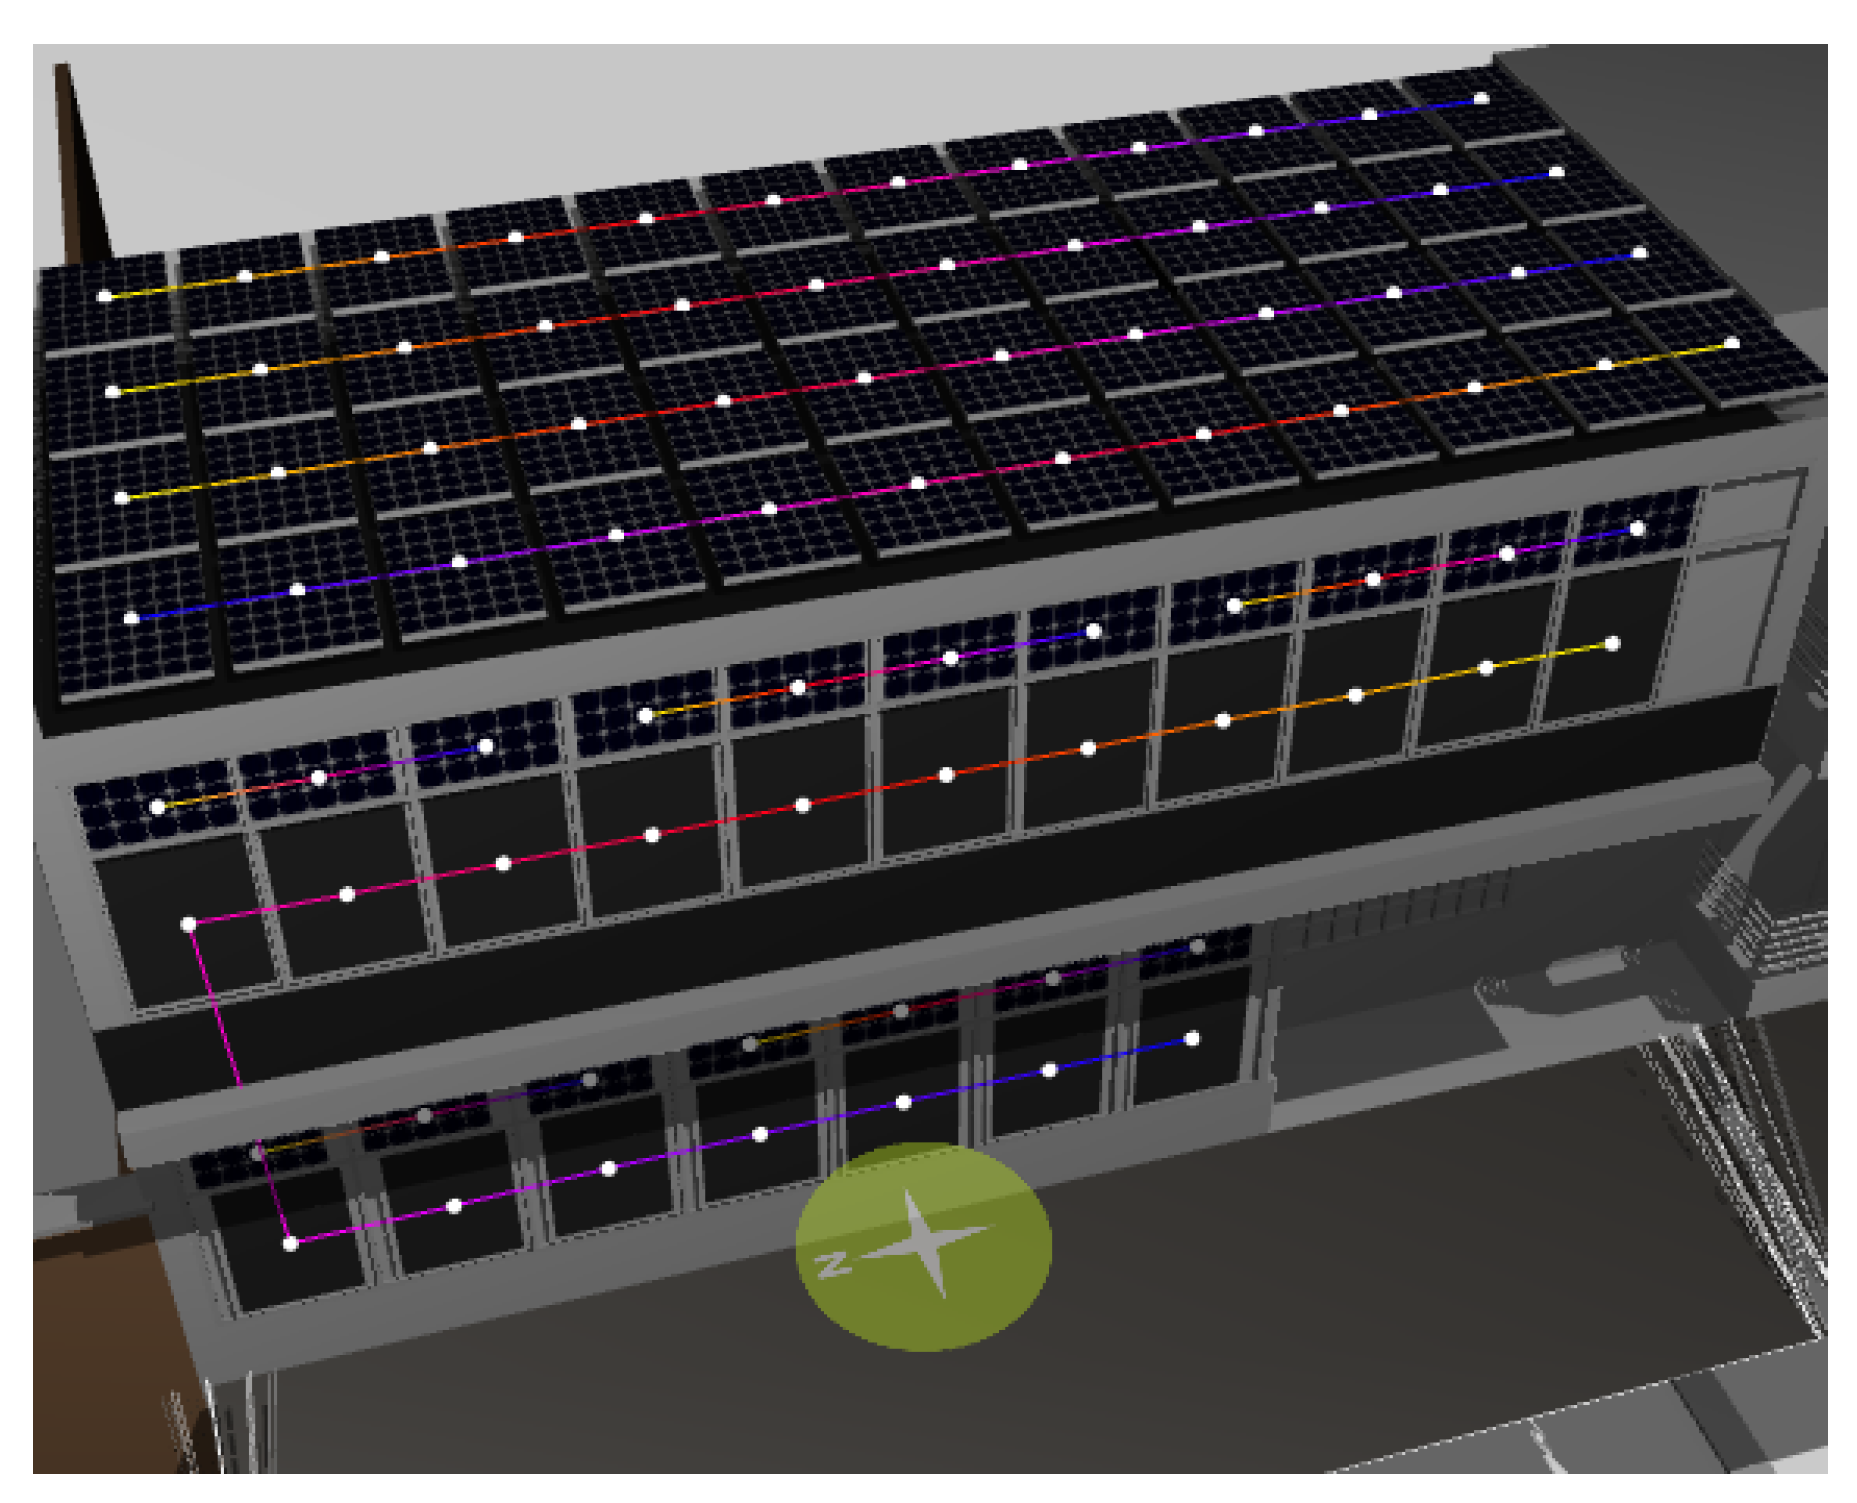
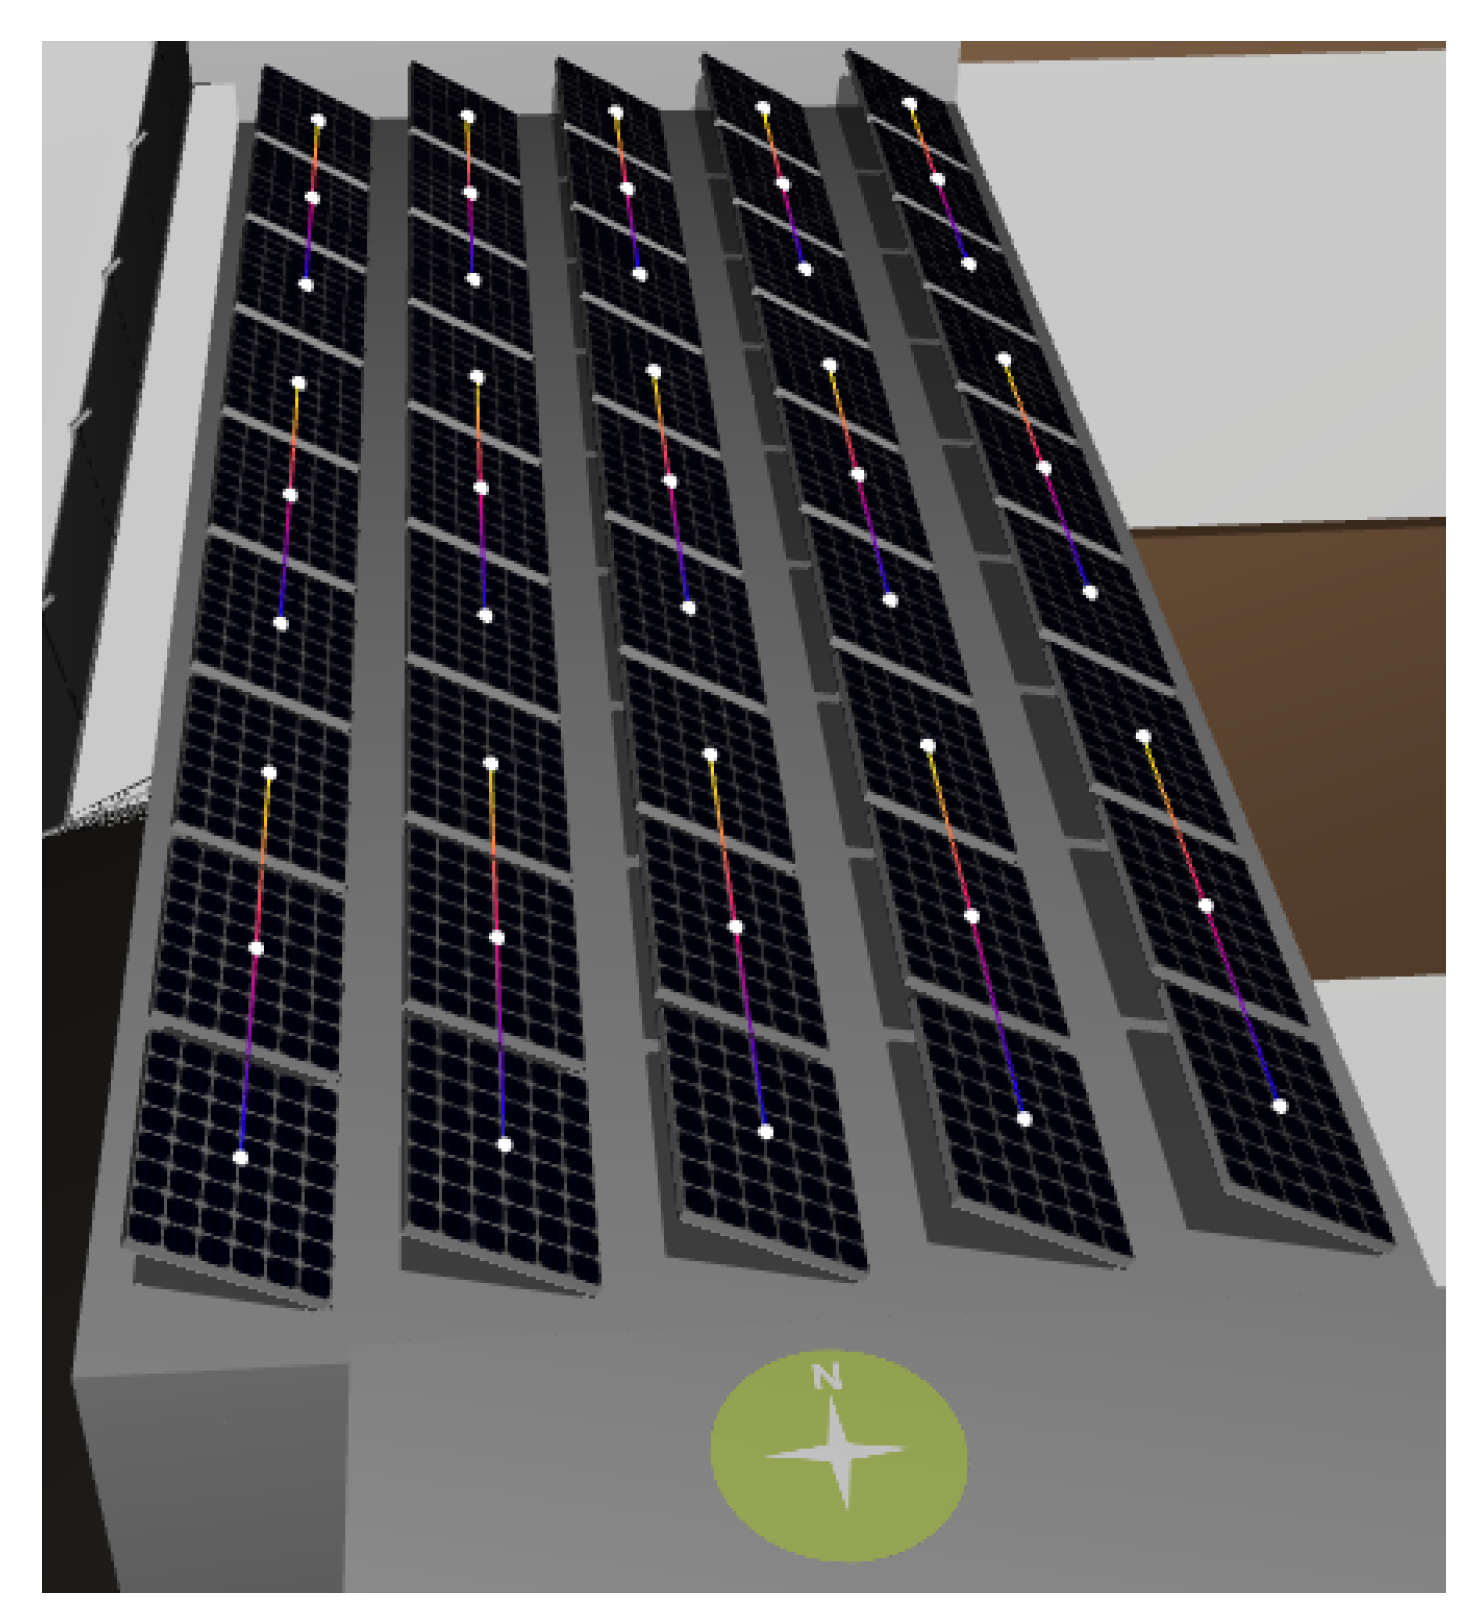
- Real-life geospatial conditions with BIPV and BAPV integrations.
- A 90° rotation of the coordinate axis to evaluate the impact of the sun angle through the day all year.
- Real-life geospatial conditions without the front building of the house.
4. Scenarios Results
4.1. Scenario 1: Real-Life Geospatial Conditions with BIPV and BAPV Integrations
4.1.1. IC
4.1.2. IC + UppW
4.1.3. IC + TRA
4.1.4. IC + TRA + RF
4.1.5. IC + TRA + RA
4.1.6. Results
4.2. Scenario 2: 90° Rotation of the Coordinate Axis
4.3. Scenario 3: Real-Life Geospatial Conditions without the Front Building of the House
5. Discussion
6. Conclusions
- Both the area (installed capacity) and the irradiance conditions (partial shading) were identified as the most relevant factors in the design of a BIPV system. These factors were not considered in the design stage of the real system, which is reflected in the payback, which exceeds the lifetime of the elements that make up the PV system.
- Several factors directly impact BIPV and BAPV projects. In the cases presented in this work, using only BIPV technologies is not attractive for payback values. Office buildings or houses with significant numbers of windows integrated with BIPV would not generate as much needed power as roof installations.
- PVSITES is flexible, sizing the desired PV modules to use in a project. It also contains a large library of technologies to install on a project, giving the software an advantage over others available. This tool is definitely a complete tool to simulate BIPV and BAPV projects.
- As future work, an additional planning stage could consider including aspects, such as energy storage and connection to the grid.
- The construction of photovoltaic panels of specific measurements was identified as an interesting area to strengthen the development of BIPV systems. In the same way, it is important to propose clear methodologies for the planning and design of BIPV systems which allow making the best technical and economic decisions. Finally, more reductions in taxes or other governmental programs that incentivize the use of renewable energy are needed. This could attract more investment and therefore more development for the BIPV market.
Author Contributions
Funding
Conflicts of Interest
Abbreviations
| a-Si | Amorphous Silicon |
| BAPV | Building Applied Photovoltaics |
| BIPV | Building-integrated photovoltaics |
| BIPVT | Building-integrated photovoltaics-thermal |
| CAD | Computer-aided design |
| CAPEX | Capital Expenditures |
| CdTe | Cadmium telluride |
| CIGS | Copper indium gallium diselenide |
| CIS | Copper indium sulfide |
| DSF | Double-skin facade |
| GHI | Global Horizontal Irradiation |
| IC | Initial case |
| MPPT | Maximum Power Point Tracker |
| NREL | National Renewable Energy Laboratory |
| NZEB | Net Zero Energy Buildings |
| OPEX | Operational Expenditures |
| PSH | Peak Sun Hours |
| PV | Photovoltaic |
| RF | Roof flat |
| TF | Thin-film |
| TOTEX | Total expenditures |
| TRA | Translucid modules |
| TRM | Technical Reference Model |
| UppW | Upper Windows |
| VAT | Value-Added Tax |
| WB | Without Front Building |
| WTs | Wind Turbines |
References
- Efurosibina Attoye, D.; Tabet Aoul, K.; Hassan, A. Mandatory Policy, Innovations and the Renewable Energy Debate: A Case Study on Building Integrated Photovoltaics. Buildings 2022, 12, 931. [Google Scholar] [CrossRef]
- Chen, T.; An, Y.; Kiang Heng, C. A Review of Building-Integrated Photovoltaics in Singapore: Status, Barriers, and Prospects. Sustainanility 2022, 14, 10160. [Google Scholar] [CrossRef]
- International Renewable Energy Agency. Renewable Power Generation Costs in 2021; Technical Report; International Renewable Energy Agency: Abu Dhabi, United Arab Emirates, 2022. [Google Scholar]
- REN 21. Renewables 2020 Global Status Report; REN21 Secretariat: Paris, France, 2020; pp. 120–130. Available online: https://www.ren21.net/wp-content/uploads/2019/05/gsr_2020_full_report_en.pdf (accessed on 1 September 2022)ISBN 978-3-948393-00-7.
- REN 21. Renewables 2019 Global Status Report; REN21 Secretariat: Paris, France, 2019; ISBN 978-3-9818911-7-1. Available online: https://www.ren21.net/wp-content/uploads/2019/05/gsr_2019_full_report_en.pdf (accessed on 15 August 2022).
- Jäger-Waldau, A. Snapshot of photovoltaics—February 2020. Energies 2020, 13, 930. [Google Scholar] [CrossRef] [Green Version]
- Martín-Chivelet, N.; Kapsis, K.; Rose Wilson, H.; Delisle, V.; Yang, R.; Olivieri, L.; Polo, J.; Eisenlohr, J.; Roy, B.; Maturi, L.; et al. Building-Integrated Photovoltaic (BIPV) products and systems: A review of energy-related behavior. Energy Build. 2022, 262, 111998. [Google Scholar] [CrossRef]
- Pagliaro, M.; Ciriminna, R.; Palmisano, G. BIPV: Merging the photovoltaic with the construction industry. Prog. Photovolt. Res. Appl. 2010, 18, 61–72. [Google Scholar] [CrossRef]
- Verberne, G.; Bonomo, P.; Frontini, F.; Van Den Donker, M.; Chatzipanagi, A.; Sinapis, K.; Folkerts, W. BIPV products for facades and roofs: A market analysis. In Proceedings of the 29th European Photovoltaic Solar Energy Conference and Exhibition, Amsterdam, The Netherlands, 22–26 September 2014; pp. 3630–3636. [Google Scholar]
- Shukla, A.K.; Sudhakar, K.; Baredar, P. Recent advancement in BIPV product technologies: A review. Energy Build. 2017, 140, 188–195. [Google Scholar] [CrossRef]
- Tripathy, M.; Sadhu, P.; Panda, S. A critical review on building integrated photovoltaic products and their applications. Renew. Sustain. Energy Rev. 2016, 61, 451–465. [Google Scholar] [CrossRef]
- Members of the PVSITES Consortium. BIPV Market and Stakeholder Analysis and Needs. 2016. Available online: https://www.pvsites.eu/downloads/download/report-bipv-market-and-stakeholder-analysis-and-ne (accessed on 7 September 2022).
- IDEAM. Atlas de Radiaciǿn Solar, Ultravioleta y Ozono de Colombia. 2015. Available online: https://www.atlas.ideam.gov.co/visorAtlasRadiacion.html (accessed on 8 October 2022).
- Ministerio de Minas y Energía. Energías Renovables No Convencionales. 2015. Available online: https://www.minenergia.gov.co/energias-renovables-no-convencionales (accessed on 13 September 2022).
- Fathi, M.; Aissat, A.; Ayad, M. Design of Building Integrated Photovoltaic (BIPV) and integration of photons converters. Energy Procedia 2012, 18, 377–383. [Google Scholar] [CrossRef] [Green Version]
- Khan, M.; Zeb, K.; Uddin, W.; Sathishkumar, P.; Umair Ali, M.; Hussain, S.; Ishfaq, M.; Himanshu; Subramanian, A. Design of a Building-Integrated Photovoltaic System with a Novel Bi-Reflector PV System (BRPVS) and Optimal Control Mechanism: An Experimental Study. Electronics 2018, 7, 119. [Google Scholar] [CrossRef] [Green Version]
- Lovati, M.; Salvalai, G.; Fratus, G.; Maturi, L.; Albatici, R.; Moser, D. New method for the early design of BIPV with electric storage: A case study in northern Italy. Sustain. Cities Soc. 2019, 48, 101400. [Google Scholar] [CrossRef]
- Singh, D.; Akram, S.V.; Singh, R.; Gehlot, A.; Buddhi, D.; Priyadarshi, N.; Sharma, G.; Bokoro, P. Building Integrated Photovoltaics 4.0: Digitization of the Photovoltaic Integration in Buildings for a Resilient Infra at Large Scale. Electronics 2022, 11, 2700. [Google Scholar] [CrossRef]
- Rababah, H.; Ghazali, A.; Mohd Isa, M. Building Integrated Photovoltaic (BIPV) in Southeast Asian Countries: Review of Effects and Challenges. Sustainability 2021, 13, 12952. [Google Scholar] [CrossRef]
- Ahmed-Dahmane, M.; Malek, A.; Zitoun, T. Design and analysis of a BIPV/T system with two applications controlled by an air handling unit. Energy Convers. Manag. 2018, 175, 49–66. [Google Scholar] [CrossRef]
- Abdalgadir, Y.; Qian, H.; Zhao, D.; Adam, A.; Liang, W. Daily and annual performance analyses of the BIPV/T system in typical cities of Sudan. Energy Built Environ. 2022. [Google Scholar] [CrossRef]
- Abdelrazik, A.S.; Shboul, B.; Elwardany, M.; Zohny, R.N.; Osama, A. The recent advancements in the building integrated photovoltaic/thermal (BIPV/T) systems: An updated review. Renew. Sustain. Energy Rev. 2022, 170, 112988. [Google Scholar] [CrossRef]
- Robinson, D.; Stone, A. Irradiation modelling made simple: The cumulative sky approach and its applications. In Proceedings of the PLEA Conference, Eindhoven, The Netherlands, 19–21 September 2004; pp. 19–22. [Google Scholar]
- Compagnon, R.; Raydan, D. Irradiance and illuminance distributions in urban areas. In Proceedings of the PLEA, Cambridge, UK, 2–5 July 2000; pp. 436–441. [Google Scholar]
- Marion, B.; Anderberg, M.; Gray-Hann, P.; Heimiller, D. PVWATTS Version 2–Enhanced Spatial Resolution for Calculating Grid-Connected PV Performance; Technical Report; National Renewable Energy Laboratory: Golden, CO, USA, 2001. [Google Scholar]
- Kim, D.W.; Park, C.S. Difficulties and limitations in performance simulation of a double skin façade with EnergyPlus. Energy Build. 2011, 43, 3635–3645. [Google Scholar] [CrossRef]
- Calise, F.; Cappiello, F.L.; d’Accadia, M.D.; Vicidomini, M. Dynamic simulation, energy and economic comparison between BIPV and BIPVT collectors coupled with micro-wind turbines. Energy 2020, 191, 116439. [Google Scholar] [CrossRef]
- Jakica, N. State-of-the-art review of solar design tools and methods for assessing daylighting and solar potential for building-integrated photovoltaics. Renew. Sustain. Energy Rev. 2018, 81, 1296–1328. [Google Scholar] [CrossRef]
- International Energy Agency. BIPV Design and Performance Modelling: Tools and Methods; Technical Report; International Energy Agency: Paris, France, 2019. [Google Scholar]
- Martínez Gómez, W.F. Metodología de Diseño, Montaje y Evaluación de Sistemas Fotovoltaicos Integrados a la Estructura de Edificaciones; Maestría en Gestión Energética Industrial; Instituto Tecnológico Metropolitano: Medellín, Colombia, 2020. [Google Scholar]
- PVSITES. Software and Catalogues. 2022. Available online: https://www.pvsites.eu/software/ (accessed on 5 November 2022).
- Members of the PVSITES Consortium. D7.2 Second Prototype of BIPV Simulation Tool. Technical Report; PVSITES: 2016. Available online: https://ec.europa.eu/research/participants/documents/downloadPublic?documentIds=080166e5af1fd17d&appId=PPGMS (accessed on 3 July 2022).
- EPM. Tarifas, Solicitud del Servicio, Usos Inteligente del Servicio Público de Generación, Transmisión y Distribución de Energía y Electricidad de EPM por Parte de Usuarios de Hogares. 2019. Available online: https://www.epm.com.co/site/clientesusuarios/clientesyusuarios/empresas/energia/grandesempresas/tipsparaelusointeligente (accessed on 3 October 2022).
- EPM. Empresa de Servicios Públicos de Medellín y Colombia. 2019. Available online: https://www.epm.com.co/site/ (accessed on 23 June 2022).
- UPME. Calculadora de Emisiones CO2. 2021. Available online: http://www.upme.gov.co/calculadora_emisiones/aplicacion/calculadora.html (accessed on 27 June 2022).
- Guerra Posada, F. Manual Para Personas Interesadas en ser Prosumidores de Energía a Partir de Paneles Solares en Colombia; Facultad de Ingenierías, Universidad EIA: Envigado, Colombia, 2017; Available online: https://repository.eia.edu.co/handle/11190/1848 (accessed on 15 September 2022).
- Lindao Suárez, W.E. Propuesta de Diseño de un Sistema de Energía Solar Fotovoltaica. Caso de Aplicación en Casa Comunal de Cooperativa Los Paracaidistas en la Ciudad de Guayaquil; Facultad de Ingenierías, Universidad Católica de Santiago de Guayaquil: Guayaquil, Ecuador, 2020; Available online: http://repositorio.ucsg.edu.ec/handle/3317/14365 (accessed on 30 September 2022).
- Azimut. Reporte de Generación. 2019. Available online: https://www.azimutenergia.co/casos-de-exito/ (accessed on 3 March 2022).
- DamiaSolar. Cuál es la Vida úTil de los Paneles Solares. 2021. Available online: https://www.damiasolar.com/actualidad/blog/articulos-sobre-la-energia-solar-y-sus-componentes/cual-es-la-vida-util-de-los-paneles-solares_1 (accessed on 3 June 2022).


| System | Cost per | Exchange | Total | Average Yearly | Energy |
|---|---|---|---|---|---|
| Capacity | Wp Installed | Rate | CAPEX | Generation | Price |
| (Wp) | (USD/Wp) | (COP/USD) | (USD) | (Wh/year) | (USD/kWh) |
| 400 | 3400 | 640 | 87,600 |
| IC | IC + UppW | IC + TRA | IC + TRA + RF | IC + TRA + RA | |
|---|---|---|---|---|---|
| CAPEX (USD) | |||||
| OPEX (USD) | |||||
| Total Power (kWp) | 2 | ||||
| Feed-in prod. (kWh) | 77 | 114 | 569 | 8230 | 7766 |
| Self consumed prod. (kWp) | 18 | 27 | 48 | 53 | 53 |
| Lost prod. (kWh) | 59 | 86 | 521 | 8267 | 7713 |
| Payback (years) | +20 | +20 | +20 | 15 | 16 |
| IC 90° | IC 90° + UppW | IC 90° + TRA | IC 90° + TRA + RF | IC 90° + TRA + RA | |
|---|---|---|---|---|---|
| CAPEX (USD) | |||||
| OPEX (USD) | |||||
| Total Power (kWp) | 2 | ||||
| Feed-in prod. (kWh) | 56 | 141 | 884 | 9874 | 8341 |
| Self consumed prod. (kWp) | 17 | 41 | 53 | 53 | 53 |
| Lost prod. (kWp) | 39 | 100 | 831 | 9818 | 8288 |
| Payback (years) | +20 | +20 | +20 | 11 | 14 |
| IC WB | IC WB + UppW | IC WB + TRA | IC WB + TRA + RF | IC WB + TRA + RA | |
|---|---|---|---|---|---|
| CAPEX (USD) | |||||
| OPEX (USD) | |||||
| Total Power (kWp) | 2 | ||||
| Feed-in prod. (kWh) | 64 | 124 | 8774 | ||
| Self consumed prod. (kWh) | 41 | 43 | 53 | 53 | 53 |
| Lost prod. (kWh) | 23 | 81 | 1125 | 8721 | |
| Payback (years) | +20 | +20 | +20 | 10 | 12 |
Disclaimer/Publisher’s Note: The statements, opinions and data contained in all publications are solely those of the individual author(s) and contributor(s) and not of MDPI and/or the editor(s). MDPI and/or the editor(s) disclaim responsibility for any injury to people or property resulting from any ideas, methods, instructions or products referred to in the content. |
© 2023 by the authors. Licensee MDPI, Basel, Switzerland. This article is an open access article distributed under the terms and conditions of the Creative Commons Attribution (CC BY) license (https://creativecommons.org/licenses/by/4.0/).
Share and Cite
Restrepo-Herrera, D.; Martinez, W.; Trejos-Grisales, L.A.; Restrepo-Cuestas, B.J. A Holistic Approach for Design and Assessment of Building-Integrated Photovoltaics Systems. Appl. Sci. 2023, 13, 746. https://doi.org/10.3390/app13020746
Restrepo-Herrera D, Martinez W, Trejos-Grisales LA, Restrepo-Cuestas BJ. A Holistic Approach for Design and Assessment of Building-Integrated Photovoltaics Systems. Applied Sciences. 2023; 13(2):746. https://doi.org/10.3390/app13020746
Chicago/Turabian StyleRestrepo-Herrera, David, Walter Martinez, Luz Adriana Trejos-Grisales, and Bonie Johana Restrepo-Cuestas. 2023. "A Holistic Approach for Design and Assessment of Building-Integrated Photovoltaics Systems" Applied Sciences 13, no. 2: 746. https://doi.org/10.3390/app13020746