Article

An Analysis of the Reaction of Frogbit (Hydrocharis morsus-ranae L.) to Cadmium Contamination with a View to Its Use in the Phytoremediation of Water Bodies

by
Małgorzata Gałczyńska
1,*,
Renata Gamrat
2 and
Artur Ciemniak
3
1
Department of Bioengineering, West Pomeranian University of Technology in Szczecin, Słowackiego 17 Street, 71-434 Szczecin, Poland
2
Department of Environmental Management, West Pomeranian University of Technology in Szczecin, Słowackiego 17 Street, 71-434 Szczecin, Poland
3
Department of Toxicology, Dairy Technology and Food Storage, West Pomeranian University of Technology in Szczecin, Papieża Pawła VI Street 3, 71-459 Szczecin, Poland
*
Author to whom correspondence should be addressed.
Appl. Sci. 2023, 13(2), 1197; https://doi.org/10.3390/app13021197
Submission received: 25 November 2022 / Revised: 21 December 2022 / Accepted: 9 January 2023 / Published: 16 January 2023
(This article belongs to the Special Issue Advances in Heavy Metal Pollution in the Environment)

Abstract

:
Macrophytes play an important role in assessing the condition of aquatic ecosystems. The aim of the study was to assess the effectiveness of cadmium uptake by frogbit (Hydrocharis morsus-ranae) for the phytoremediation of aquatic ecosystems. The study examined cadmium (Cd) uptake by frogbit grown under conditions of low and high fertilizer dose and three cadmium dose levels over three- and six-week exposure times. Cadmium uptake was found to be influenced by water reactivity, mineral nutrient abundance, and exposure time. Its accumulation in frogbit is hence a good bioindicator of cadmium pollution in water bodies. Where the plant had greater access to phosphorus, nitrogen, potassium (PNK) compounds, i.e., high fertilizer level, a higher pH level (7.6) was associated with increased cadmium uptake and decreased plant biomass. A higher PNK level was also associated with greater tolerance to cadmium, while at lower PNK levels, more efficient cadmium uptake was noted after three weeks. Hydrocharis morsus-ranae can be used for water and wastewater treatment in the final stage of phytoremediation, but in combination with other species of pleustophytes that represent different biosorption sites.

1. Introduction

Macrophytes play an important role in assessing the condition of aquatic ecosystems [1,2,3]. Indeed, in European countries, various macrophyte indices are often used to determine surface water quality: the Macrophyte Index (lake), Trophic Index of Macrophytes (river), the Mean Trophic Rank (river), Indice biologique macrophytique en riviére (river), the Ecological State Macrophyte Index (lake), and the Macrophyte River Index (river) [4]. One particularly well-known pleustophyte species whose presence in water is known to influence these indicators is Hydrocharis morsus-ranae, or frogbit [5,6].
Hydrocharis morsus-ranae ranges from Europe to Northern Asia [7,8]. The plant inhabits stagnant eutrophic and mesotrophic waters and is most often present in communities with Stratiotes aloides (Hydrocharitetum morsus-ranae Langendonck 1935) and Lemna minor (Lemno minoris-Hydrocharitetum morsus-ranae Passarge 1978) [9,10]. It is believed to play an important role in maintaining the biodiversity of aquatic biotopes [11,12]. However, it continues to spread in North America and India, where it is treated as an invasive plant, despite numerous attempts to limit its presence [13,14,15,16,17]. Its expansion has also been noticed in Poland and Romania [18,19].
Various studies indicate that the species demonstrates considerable adaptability to changing environmental conditions and high resistance to habitat pollution with heavy metals (HMs) [20,21,22,23,24,25]. Elevated HM levels are often observed in river and lake catchments as a result of anthropopressure [26,27], particularly that associated with industry, agriculture, and road transport [28]. Heavy metals are highly persistent and non-degradable, and tend to bioaccumulate, making them difficult to remove. One of the most toxic heavy metals is cadmium [29]. It is an active non-redox element without any known biological function and is toxic to aquatic plants [30].
The ability of plants to accumulate metals in their mass makes it possible to use them for the purpose of purification of a contaminated environment [31]. Conventional methods of removing HMs from aquatic ecosystems, such as chemical precipitation, microfiltration, adsorption, or ion exchange, are very expensive and technologically difficult to apply and also have a negative impact on aquatic organisms [32,33]. Therefore, phytoremediation, which is an alternative and environmentally friendly method, is of great interest to researchers. This method, like any other, has its opportunities, but also its limitations [22,23]. Aquatic plants whose phytoremediation functions are best known include: Phragmites australis, Typha latifolia, Potamogeton pectinatus, Ceratophyllum demersum, Myriophyllum spicatum, and Eichhornia crassipes or Lemna minor [34,35,36]. Depending on the three major growth forms of aquatic plants (free-floating, sediment rooted with emerged, and/or floating leaves and submerged), various phytoremediation techniques (phytoextraction, rhizofiltration, phytostablization, phytotransformation/phytodegradation) play a greater or lesser role in the effective removal HMs from the aquatic ecosystem [33,37]. One of the most effective phytoremediation technologies is phytoextraction, especially when we use HMs hyperaccumulators that have the ability to accumulate metals in water bodies in a very high concentration, without the phytotoxic effect [38].
Little is known of frogbit, apart from its distribution and physicochemical environment, although in some studies have assessed its phytoremediation potential regarding some metals. As such, there is a need to determine its growth potential in environments contaminated with cadmium under the influence of various biogenic compounds [39,40,41,42]. This species is a particularly interesting subject for study with regard to its cadmium accumulation and its potential as a bioindicator [9,21,22,43,44] and a component in complex hydrophyte wastewater treatment systems (i.e., field studies of aquatic ecosystems and greenhouse studies) [45,46,47].
It is hypothesized that the reaction of frogbit to water contamination with cadmium is related to the pH of the water, its abundance in mineral nutrients, and the length of exposure of the plants to cadmium. The findings will enrich our understanding of the effect of selected chemical and physicochemical indicators of water quality on the development of Hydrocharis morsus-ranae, as well as its cadmium uptake and accumulation.
The utilitarian goal of assessing its cadmium uptake was to evaluate its potential use in the phytoremediation of aquatic ecosystems.

2. Materials and Methods

2.1. Experimental Materials

To verify the hypothesis given above, a vegetation experiment was conducted using the containers method over three consecutive years in the vegetation hall of the West Pomeranian University of Technology in Szczecin (53.447838; 14.530589). Containers with frogbit grown in hydroponic conditions during the plant growing season (18 June–7 August 2006, 1st growing season (gs); 17 June–6 August 2007, 2nd gs; 22 June–11 August 2008, 3rd gs) were placed in the open air under a roof (3 m high) made of transparent plastic cover sheets.
The plant material for the study was obtained from the water reservoir at Lake Głębokie in Szczecin. The collected frogbit rosettes had five developed leaves with a diameter of about 5 ± 1 cm and leafless stolons (2 pieces).
As frogbit occurs in clay-pit and on riverbanks, a soil with a granulometric composition corresponding to sandy loam, and a similar composition to river bottom sediments was chosen as the substrate [48]. The soil was composed predominantly of 60.4% by mass sand (0.05–2 mm), 35.6% dust (0.002–0.05 mm), and 4.0% colloidal clay (<0.002 mm). It was characterized by a slightly acid reaction (5.6 < pH ≤ 6.5) and low levels of assimilable forms of phosphorus (23–44 mgP·kg−1), potassium (63–104 mgK·kg−1), and magnesium (21–30 mgMg·kg−1) [49]. It can be considered fertile soil (C:N = 8), indicated by a carbon-to-nitrogen ratio of 12.8, i.e., a pHKCl reaction of 5.9; Corg 9.6 g·kg−1, humus 16.6 g·kg−1, organic substance 37.6 g·kg−1, and Ngen 0.75 g·kg−1; the concentrations of assimilable forms (mg·kg−1) were 28 P, 83 K, 24 Mg, and saline 0.37g NaCl dm−3. The salt content in the soil was within natural limits [50]. The total content of selected metals in the soil used in the study corresponded to that of the bottom sediments of lakes and rivers [51,52], i.e., 185 Mn, 64.5 Zn, 15.4 Cu, 24.2 Pb, and 0.3 Cd (all values µg·g−1 d.w. soil); in addition, there was 11.6 Fe mg·g−1 d.w. soil.
Three phosphorus, nitrogen, and potassium (PNK) compounds, viz. K2HPO4, NH4NO3, and KNO3, were added to diversify the trophic properties of the water environment; of these, P and N have the greatest impact on the water eutrophication process. The K2HPO4 (low level of NKP: 0.98 g in 1 dm3 distilled water; high level of NKP: 4.95 g in 1 dm3 distilled water), NH4NO3 (low level of NKP: 0.98 g in 1 dm3 distilled water; high level of NKP: 4.98 g in 1 dm3 distilled water), and KNO3 (low level of NKP: 10.65 g in 1 dm3 distilled water; high level of NKP: 53.21 g in 1 dm3 distilled water) solutions were introduced into the water at two concentrations characteristic of water purity classes: a low concentration (mg dm−3) PO43−: 0.54 (water purity class III), NO3: 7.14 (II), NH4+: 0.22 (I), and K+: 4.56 (−); and a high concentration (mg dm−3) PO43−: 2.73 (V), NO3: 36.7 (IV), NH4+: 1.12 (III), and K+: 22.8 (−).
The water in the containers was adjusted to a cadmium concentration of 0.1 mg Cd·dm−3, corresponding to class V water purity, by the addition of a cadmium salt solution (3CdSO4·8H2O: 0.43 g in 1 dm3 distilled water) [53].
Szczecin and its surroundings are characterized by high variability of meteorological conditions during the summer. The mean annual air temperature in Szczecin in the years 1991–2021 was about 9.4 °C, and the hottest month is July, with a mean long-term (1991–2021 years) temperature of 18.5 °C [54].
The meteorological conditions in subsequent research seasons (Table S1 in Supplementary Materials) differed from previous mean data. In the first research season, the mean air temperature for the research period was 19.3 °C, i.e., 1.2 °C higher than the long-term average. The hottest month was July. In the first research season (1), the mean insolation was higher than that noted in the multi-year period. The highest number of sunny hours were recorded in July (336.2 h). August was characterized by low insolation (55% of the norm). In the second research season (2), the mean air temperature for the research period was 18.3 °C, i.e., 0.2 °C higher than the long-term average; however, no differences in temperature were noted between the study years. In addition, the mean insolation in the second research period was slightly higher than the multi-year insolation. June was characterized by greater sunshine than the multi-year period (114% of the norm), but July demonstrated relatively low insolation (62% of the norm). In turn, in the third year of research (3), the mean air temperature for the research period was 18.4 °C, which was 0.3 °C higher than the long-term average. The hottest month was July, with a mean temperature of 19.2 °C, i.e., approx. 0.4 °C higher than the long-term values. This period was also characterized by a slightly lower insolation than the average (749 h; 98% of the norm). June (294 h) and July (286.6 h) were particularly sunny months. August (58%) was characterized by much less insolation than in the previous period.

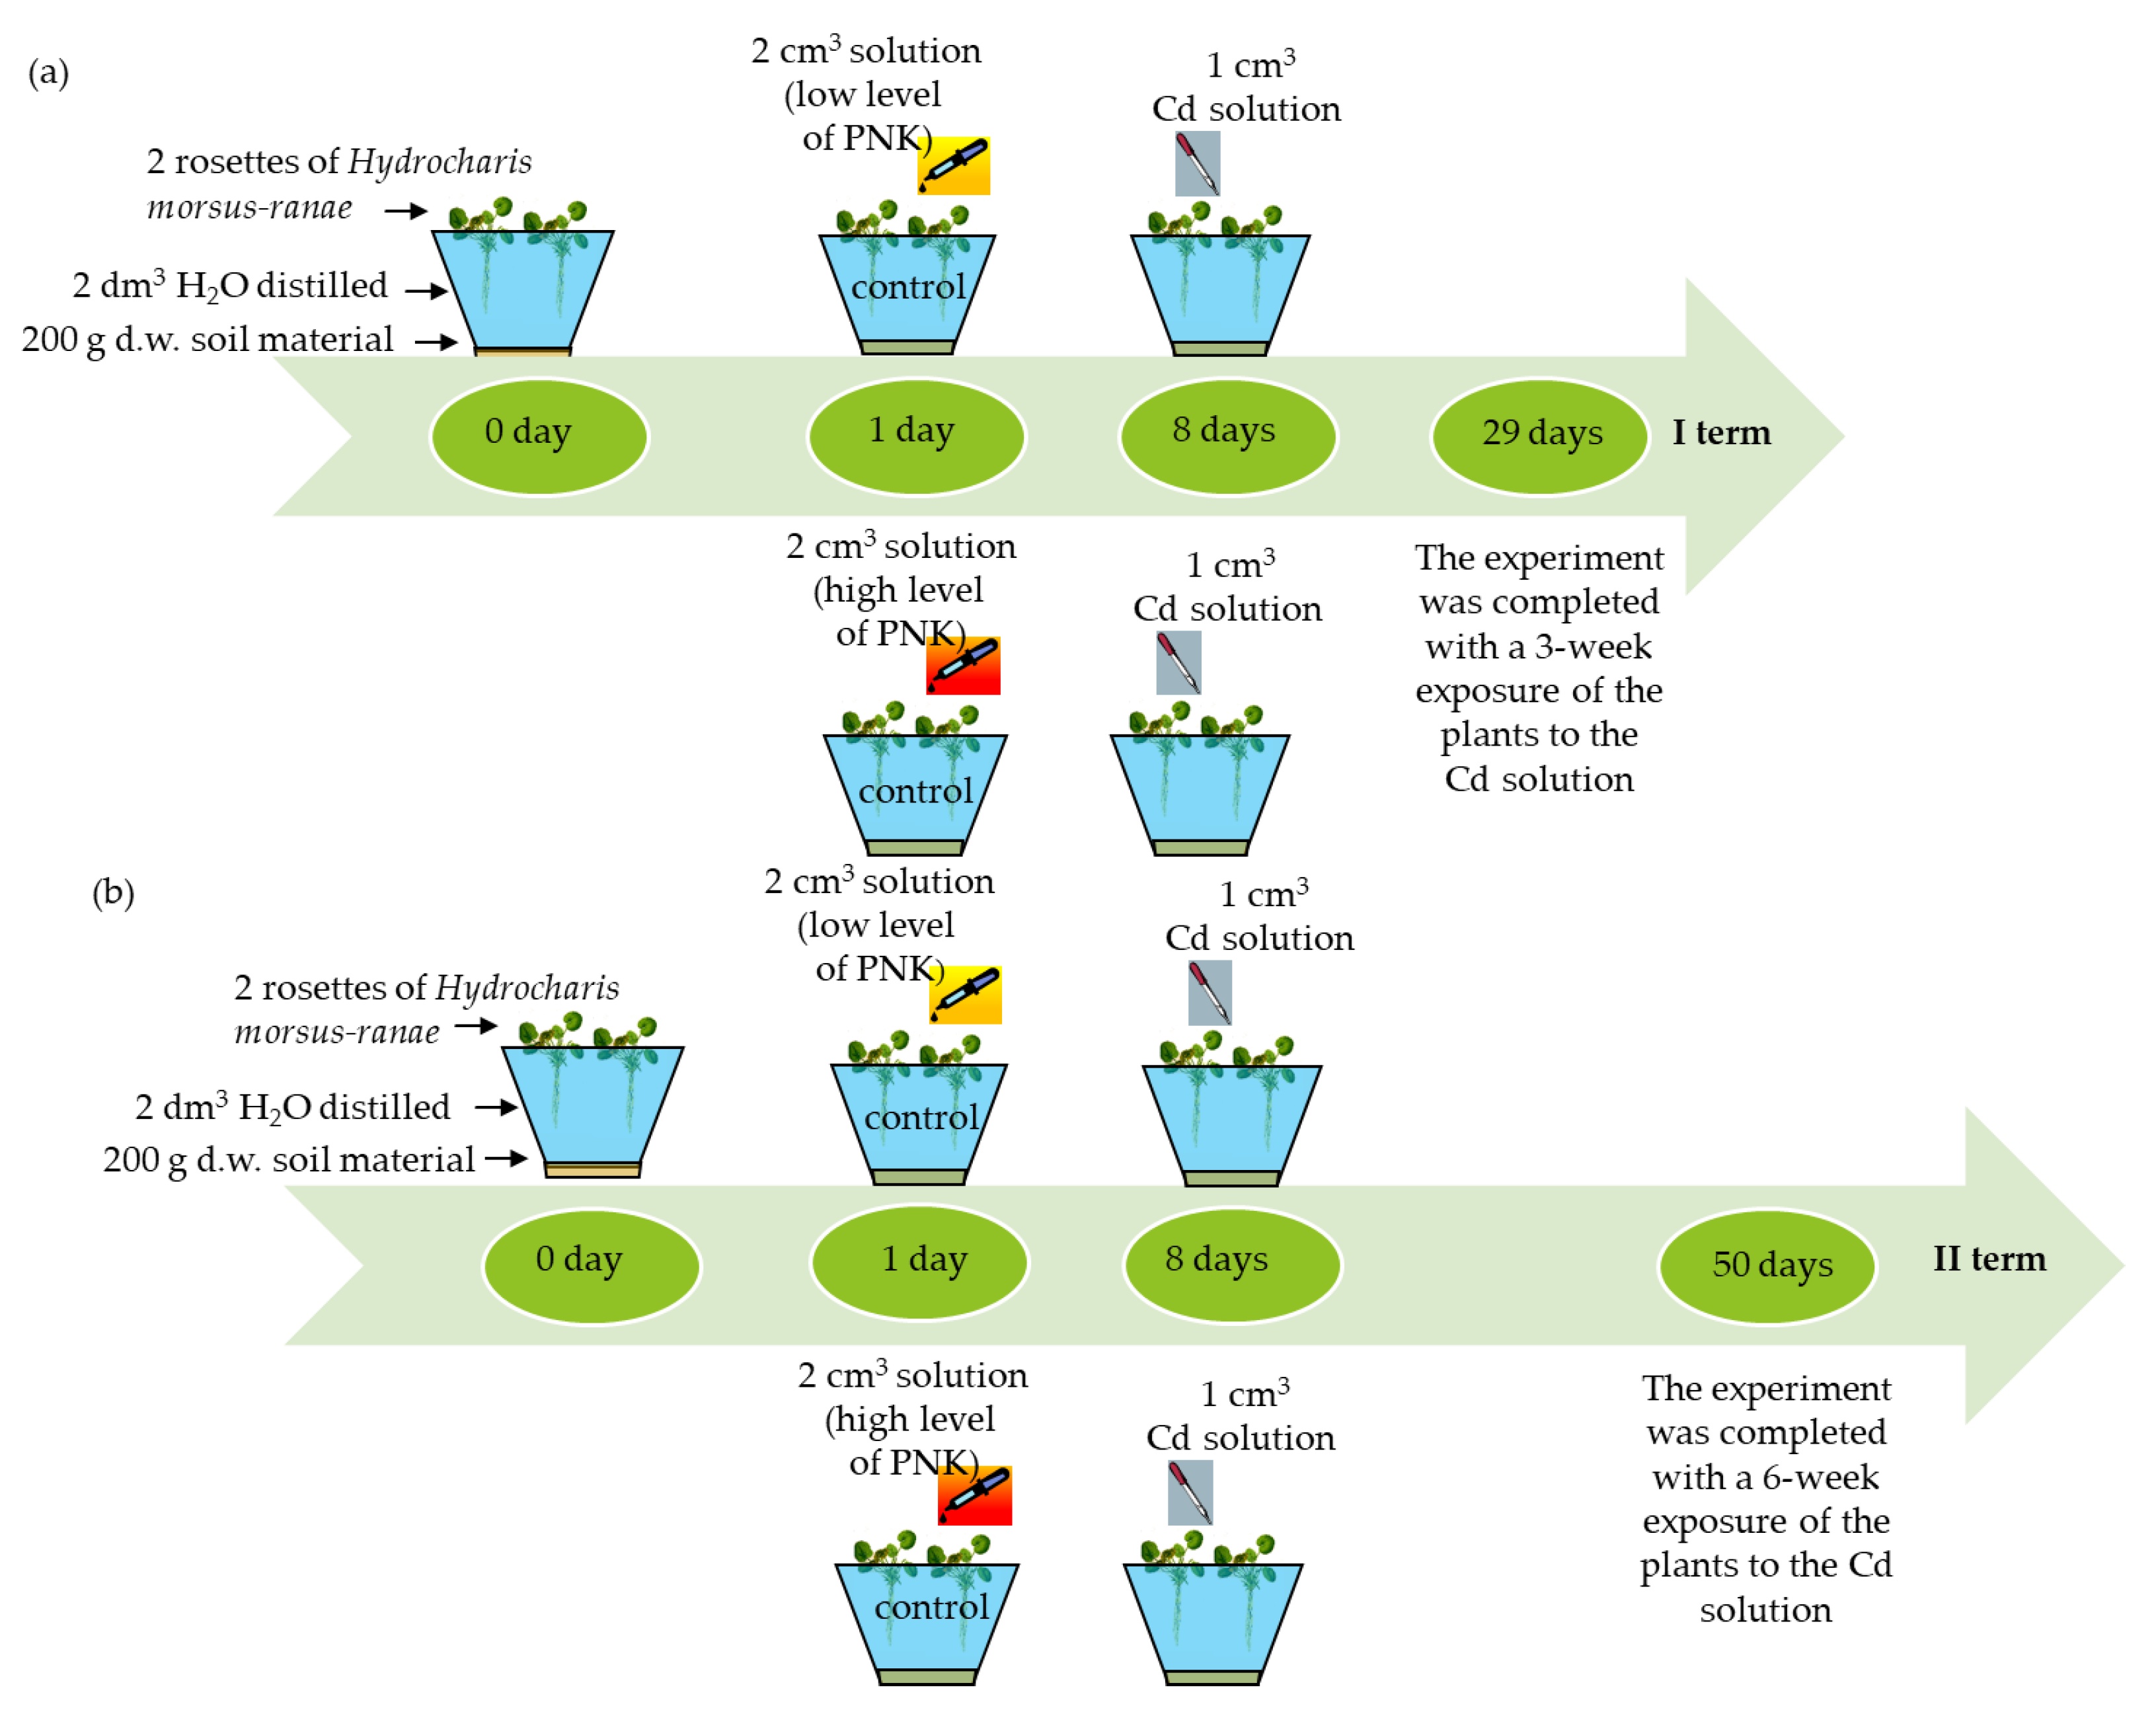
2.2. Experimental Designe

The frogbit experiment was established in the second half of June each year (18 June in the 1st gs, 17 June in the 2nd gs, and 22 June in the 3rd gs). Homogeneous rosettes were selected from the Hydrocharis morsus-ranae seedlings; these were cleaned and rinsed with distilled water. Following this, two rosettes were placed random in each of 32 containers (2.5 dm3), each of which contained 200 g d.w. soil (sandy clay grain size) flooded with 2 dm3 of distilled water. The next day, the PNK compounds were introduced into the water at two concentrations: one half of the object randomly received the low concentration (16 containers), and the other half received the high concentration (16 containers). After a week, the water was contaminated with the cadmium salt solution (0.1 mg Cd·dm−3) in 16 containers differed in the level of PNK concentration. The other containers were control objects.
This arrangement allowed for eight research variants, differing with regard to PNK concentration and cadmium exposure time, to be tested as four replicates each. Any water losses from the containers, mainly due to evaporation, were replaced by adding distilled water to the initial volume. In the first sampling round, four variants were liquidated in four repetitions. After three weeks, i.e., on the second sampling, all samples were collected from four variants that had been liquidated, again in four repetitions (Figure 1).
The plants subjected to cadmium, together with the water and soil material of the substrate, were sampled on two terms with a three-week interval between them, i.e. I term was taken on 17 July in the 1st growing season (gs), 16 July in the 2nd gs, and 21 July in the 3rd gs; II term was taken on 7 August in the 1st gs, 6 August in the 2nd gs and 11 August in the 3rd gs.

2.3. Analytic Methods

The frogbit plants were taken from the containers and rinsed with distilled water. The number of rosettes (one developed leaf and one not developed leaf) were counted. The plant material was then dried in a dryer to a constant weight at 105 °C and weighed on a Radwag analytical balance with an accuracy of 0.001 g d.w.
The dried plant material was ground and weighed, and its level of mineralization was determined by wet combustion. Briefly, powdered plant samples weighing 0.250–1.000 g were placed in 100 cm3 Kiejdahl flasks and flooded with a mixture of 69–70% nitric (V) and 65% chloric (VII) acids in a ratio of 3:1 by volume. Cold mineralization was carried out for about 12 h, and then at 200–220 °C until a colorless clear solution was obtained. The mineralized samples were diluted with distilled water (purified on an ion exchange bed and by reverse osmosis) and transferred to 50 cm3 volumetric flasks, with a blank sample prepared for each measurement series [55]. The cadmium content was determined by flame atomic absorption spectrometry (FAAS). The analyses were carried out using a Solaar AA Series Spectrometer (Thermo Element, Thermo Scientific, Waltham, MA, USA).
The accuracy was verified by comparison with certified reference material (BCR-670). The metal content was expressed as µg·g−1 plant dry weight (d.w).
Before the tests, the soil was subjected to the following tests: granulometric composition [56], soil reaction (pH in 1 M KCl) [57], available phosphorus content [58], available potassium content [59], available magnesium content [60], organic carbon content [61], organic matter content [62], total nitrogen content [63], and salinity [64]; in addition, the total metal content (lead, copper, zinc, manganese, and iron) was determined after mineralization in a mixture of 69–70% nitric (V) and 65% chloric (VII) acids by FAAS [65].
After the tests were completed, samples of soil material taken from the containers were dried at a temperature of approx. 60 °C to a constant weight, ground in a mortar, and passed through a sieve with a mesh diameter of 1 mm. The samples were mineralized by wet combustion (0.250–1.000 g d.w.) using the 69–70% nitric (V) and 65% chloric (VII) acid mix. A blank sample was prepared for each measurement series. The metal content was determined by FAAS [55]. The determinations were validated by comparison with a standard sample of known chemical composition. The content is expressed as µg g−1 d.w. plants.
After the tests, water samples were taken from the containers. Cadmium concentration was determined after mineralization by FAAS; dissolved oxygen, reaction (pH), and electrical conductivity (EC) were determined in by using standard method for examination of water and wastewater [66]. The detection limit of Cd is 2.0 µg·dm−3 [67].
The degree of cadmium contamination of the aquatic ecosystem was determined based on the cadmium sensitivity index of frogbit (the degree of cadmium contamination − Cp Cd; tolerance index − Ti), the water pollution index (Cw Cd), and the soil material of the substrate (Csm Cd), as well as the index of cadmium uptake efficiency by the plant (Ep).
The analyzed indicators were calculated as follows:
-
an indicator of the degree of plant contamination with cadmium:
C p   Cd   =   c Cd   p   c c Cd   p   control .
where: cCd p c is the cadmium content in the plant after water contamination with cadmium salt (μg Cd·g−1 d.w.); cCd p control is the cadmium content in the plant in the control object (μg Cd·g−1 d.w.);
-
an indicator of the degree of cadmium contamination of water in which plants grew:
C w   Cd   =   c Cd   w   c c Cd   w   control
where: cCd w c is the concentration of cadmium in water after water contamination with cadmium salt (μg Cd·dm−3 d.w.); cCd w control is the concentration of cadmium in water in the control object (μg Cd·dm−3 d.w.);
-
indicator of the degree of soil material contamination with cadmium:
C sm   Cd   =   c Cd   sm   c c Cd   sm   control
where: cCd sm c is the content of cadmium in soil material after water contamination with cadmium salt (μg Cd·g−1 d.w.); cCd sm control is the content of cadmium in soil material in the control object (μg Cd·g−1 d.w.);
-
tolerance index:
T i   =   p c p control
where: pc is the dry weight of the plant in an environment contaminated with cadmium (g); pcontrol is the dry weight of the plant in the control object (g);
-
cadmium uptake efficiency index by the plant:
E p   =   a Cd   c     a Cd   control   d Cd  
where: aCd c is the accumulation of cadmium in dry weight yield of contaminated plants (mg); aCd control is the accumulation of cadmium in the dry weight yield of plants of the control object (mg); dCd is the dose of cadmium introduced into the environment (mg).

2.4. Statistical Analysis
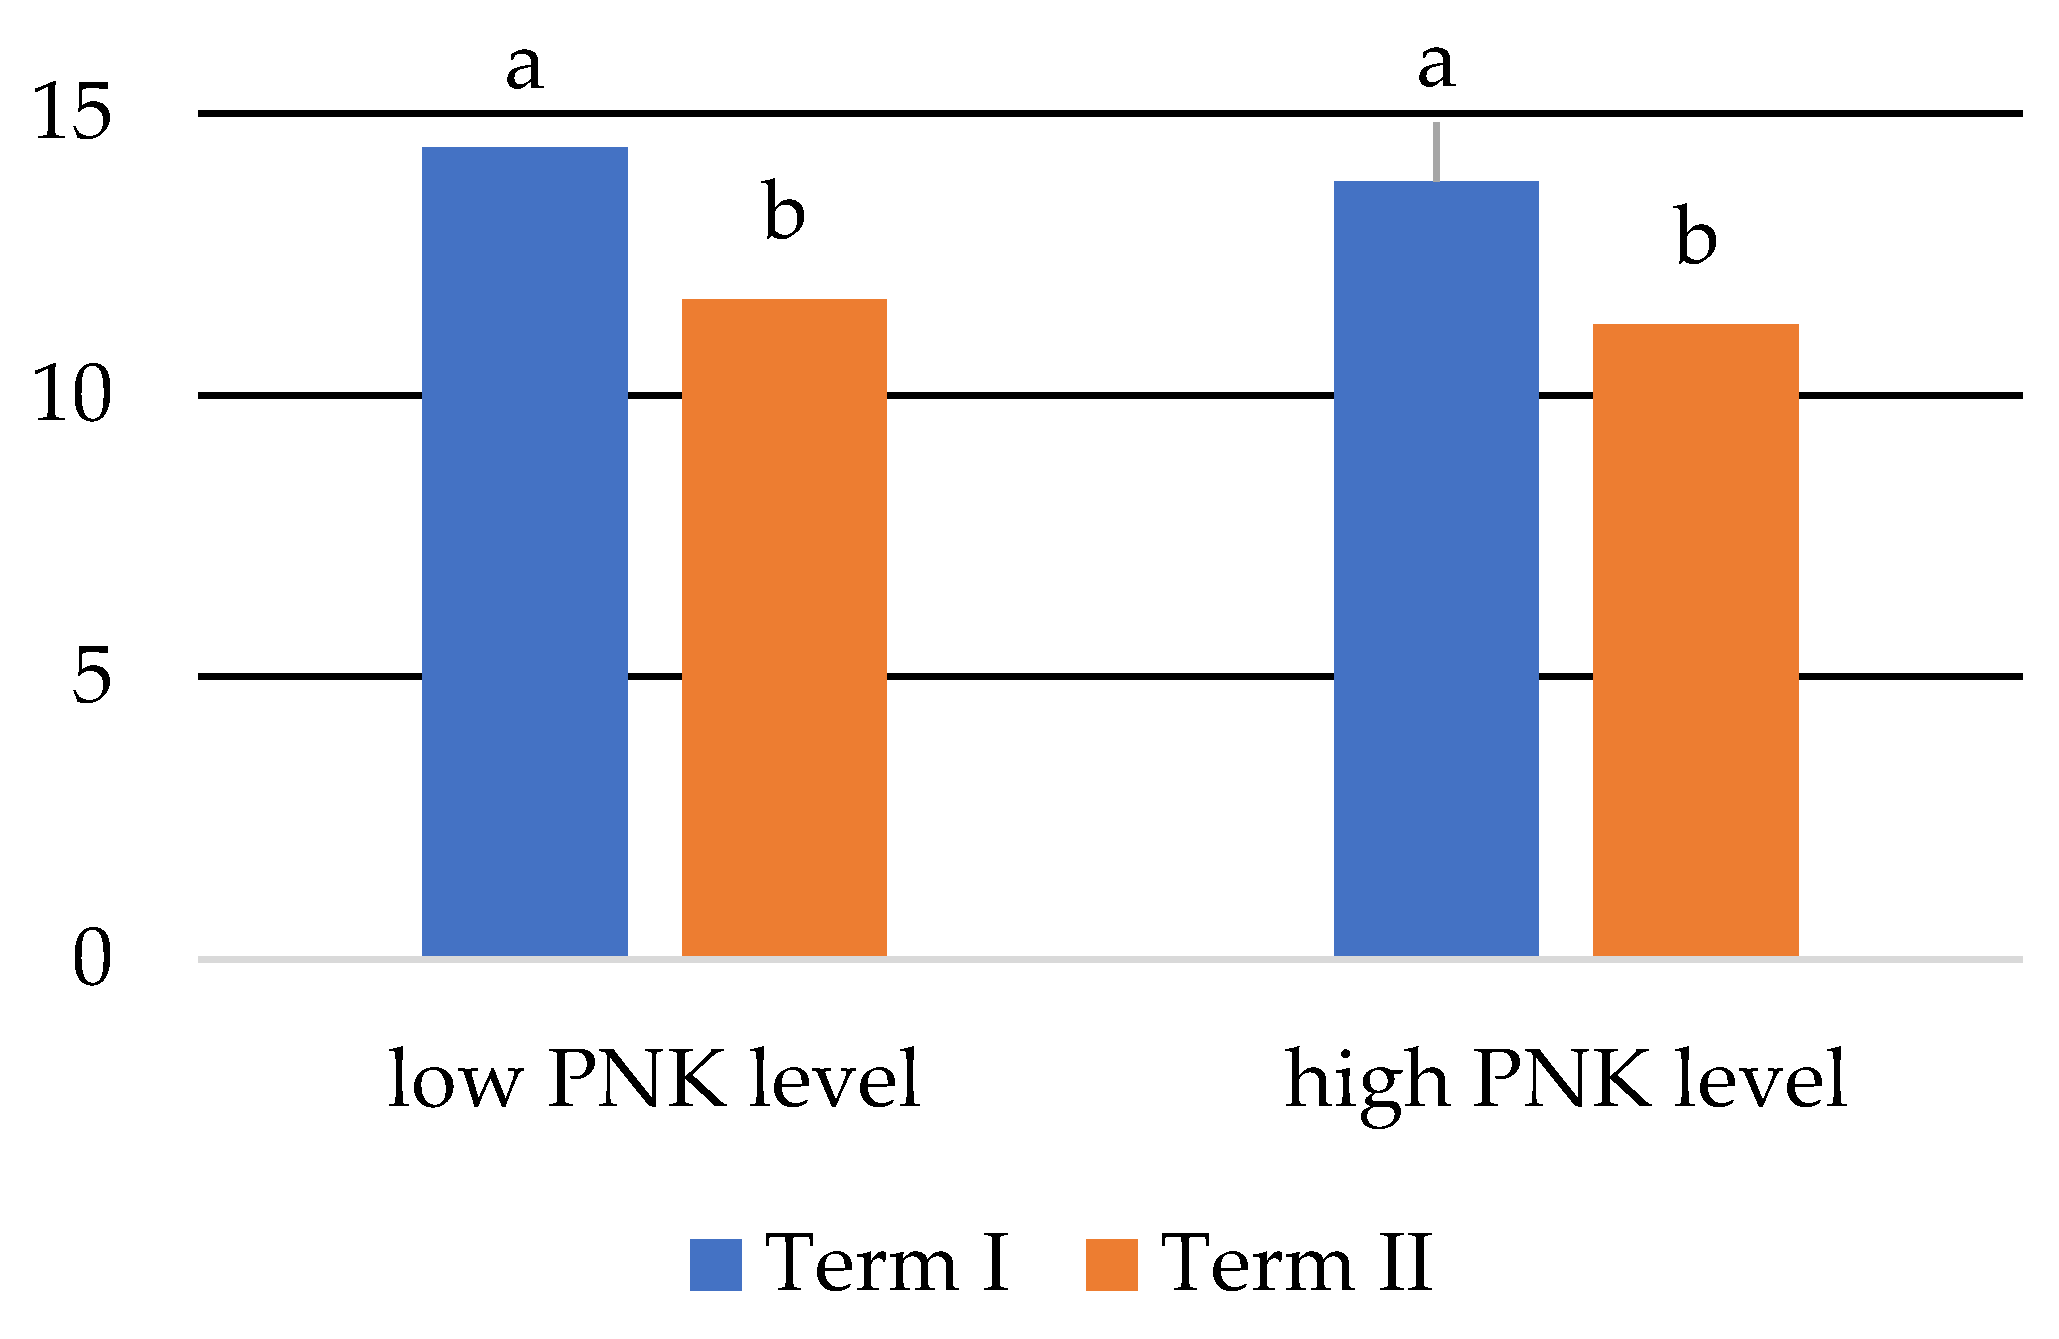
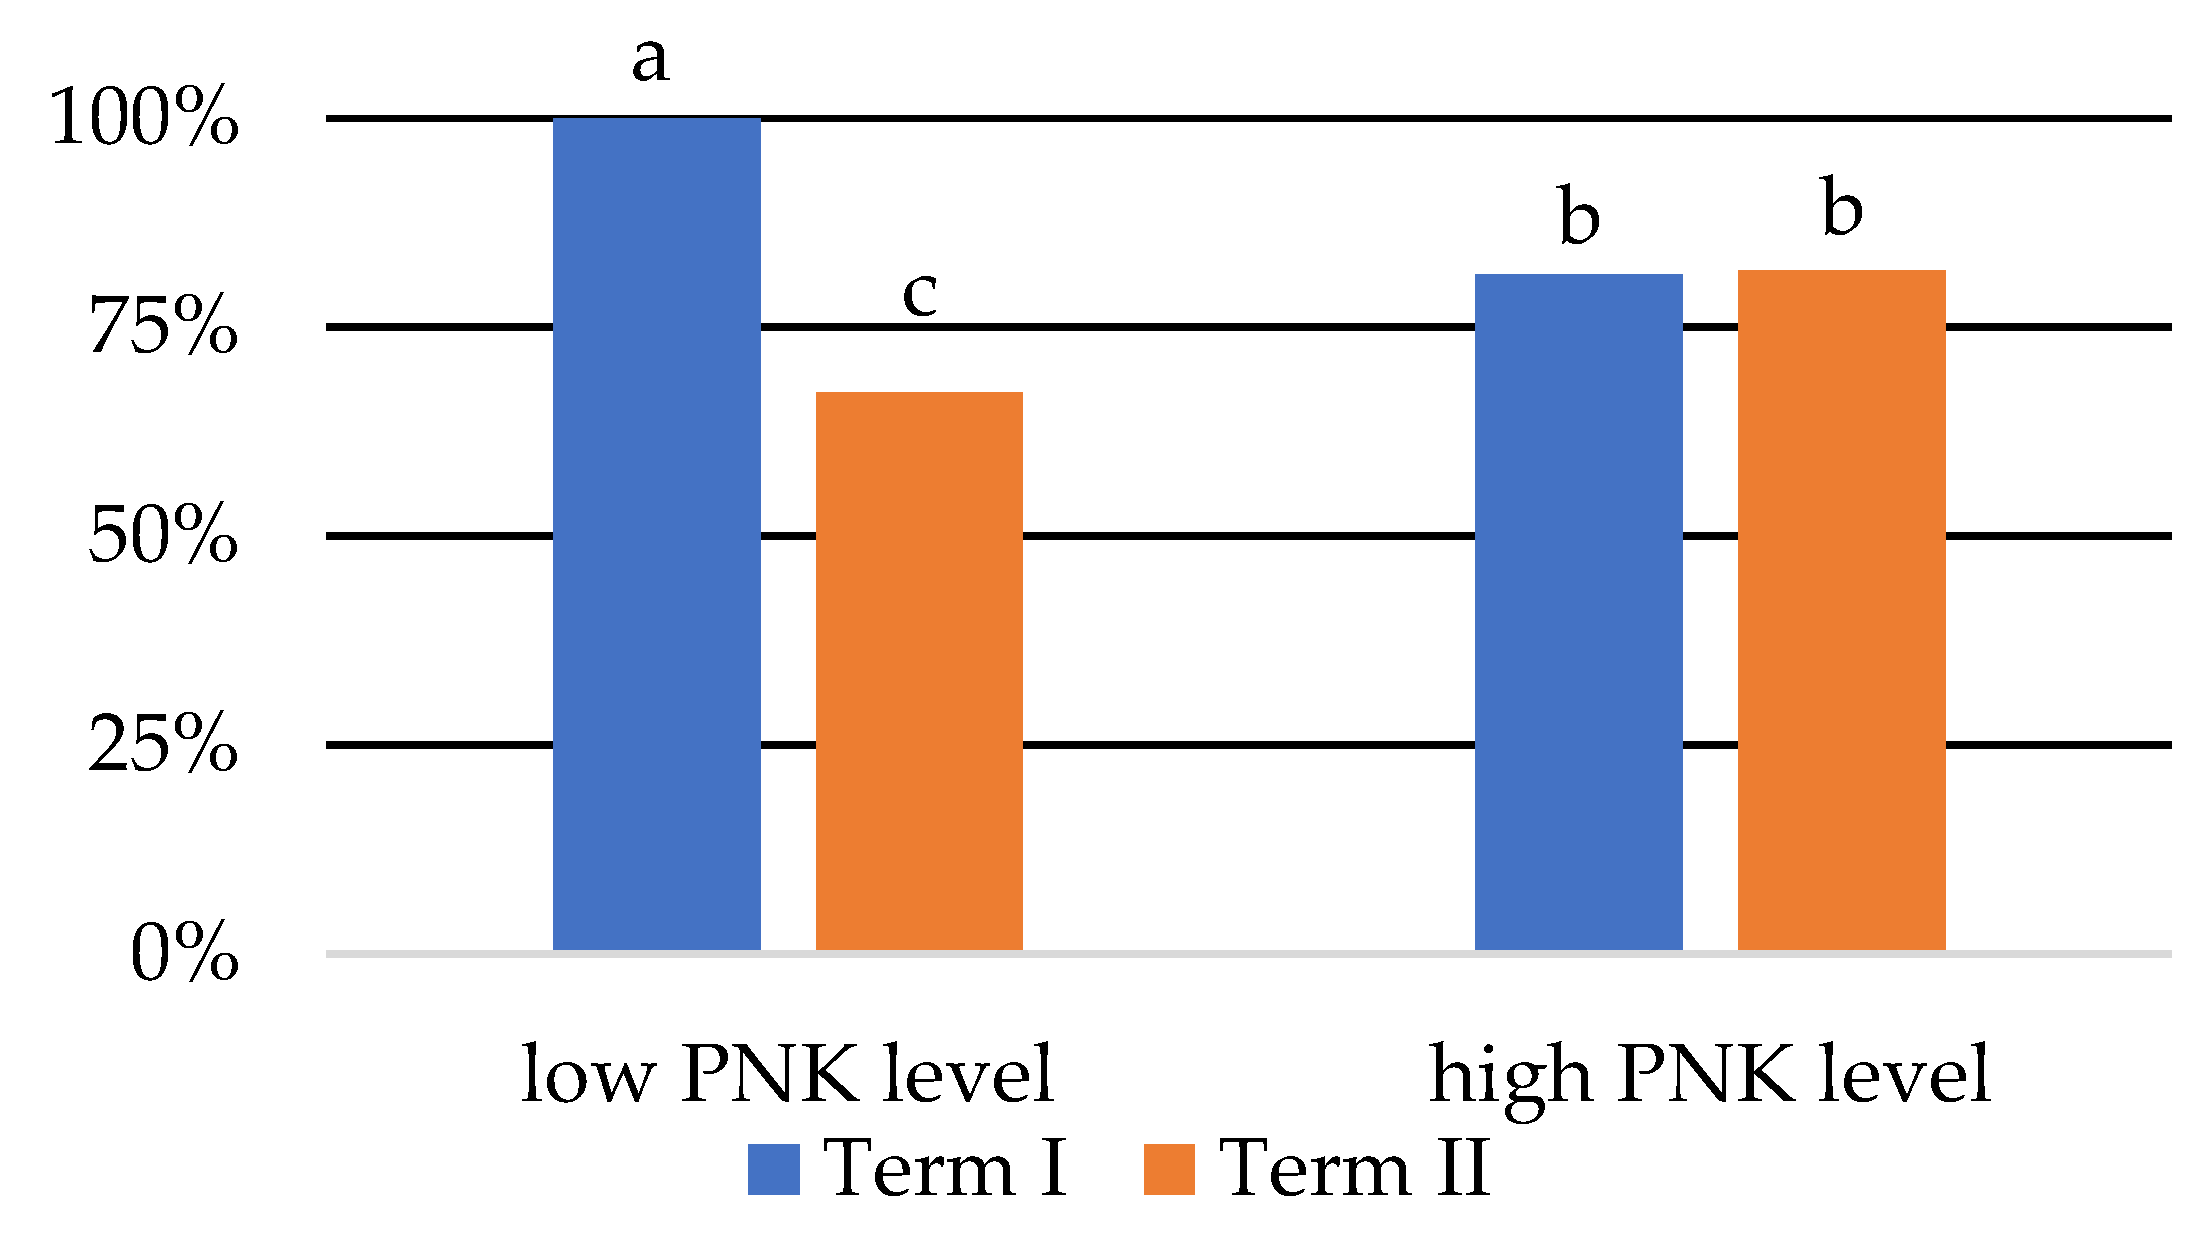
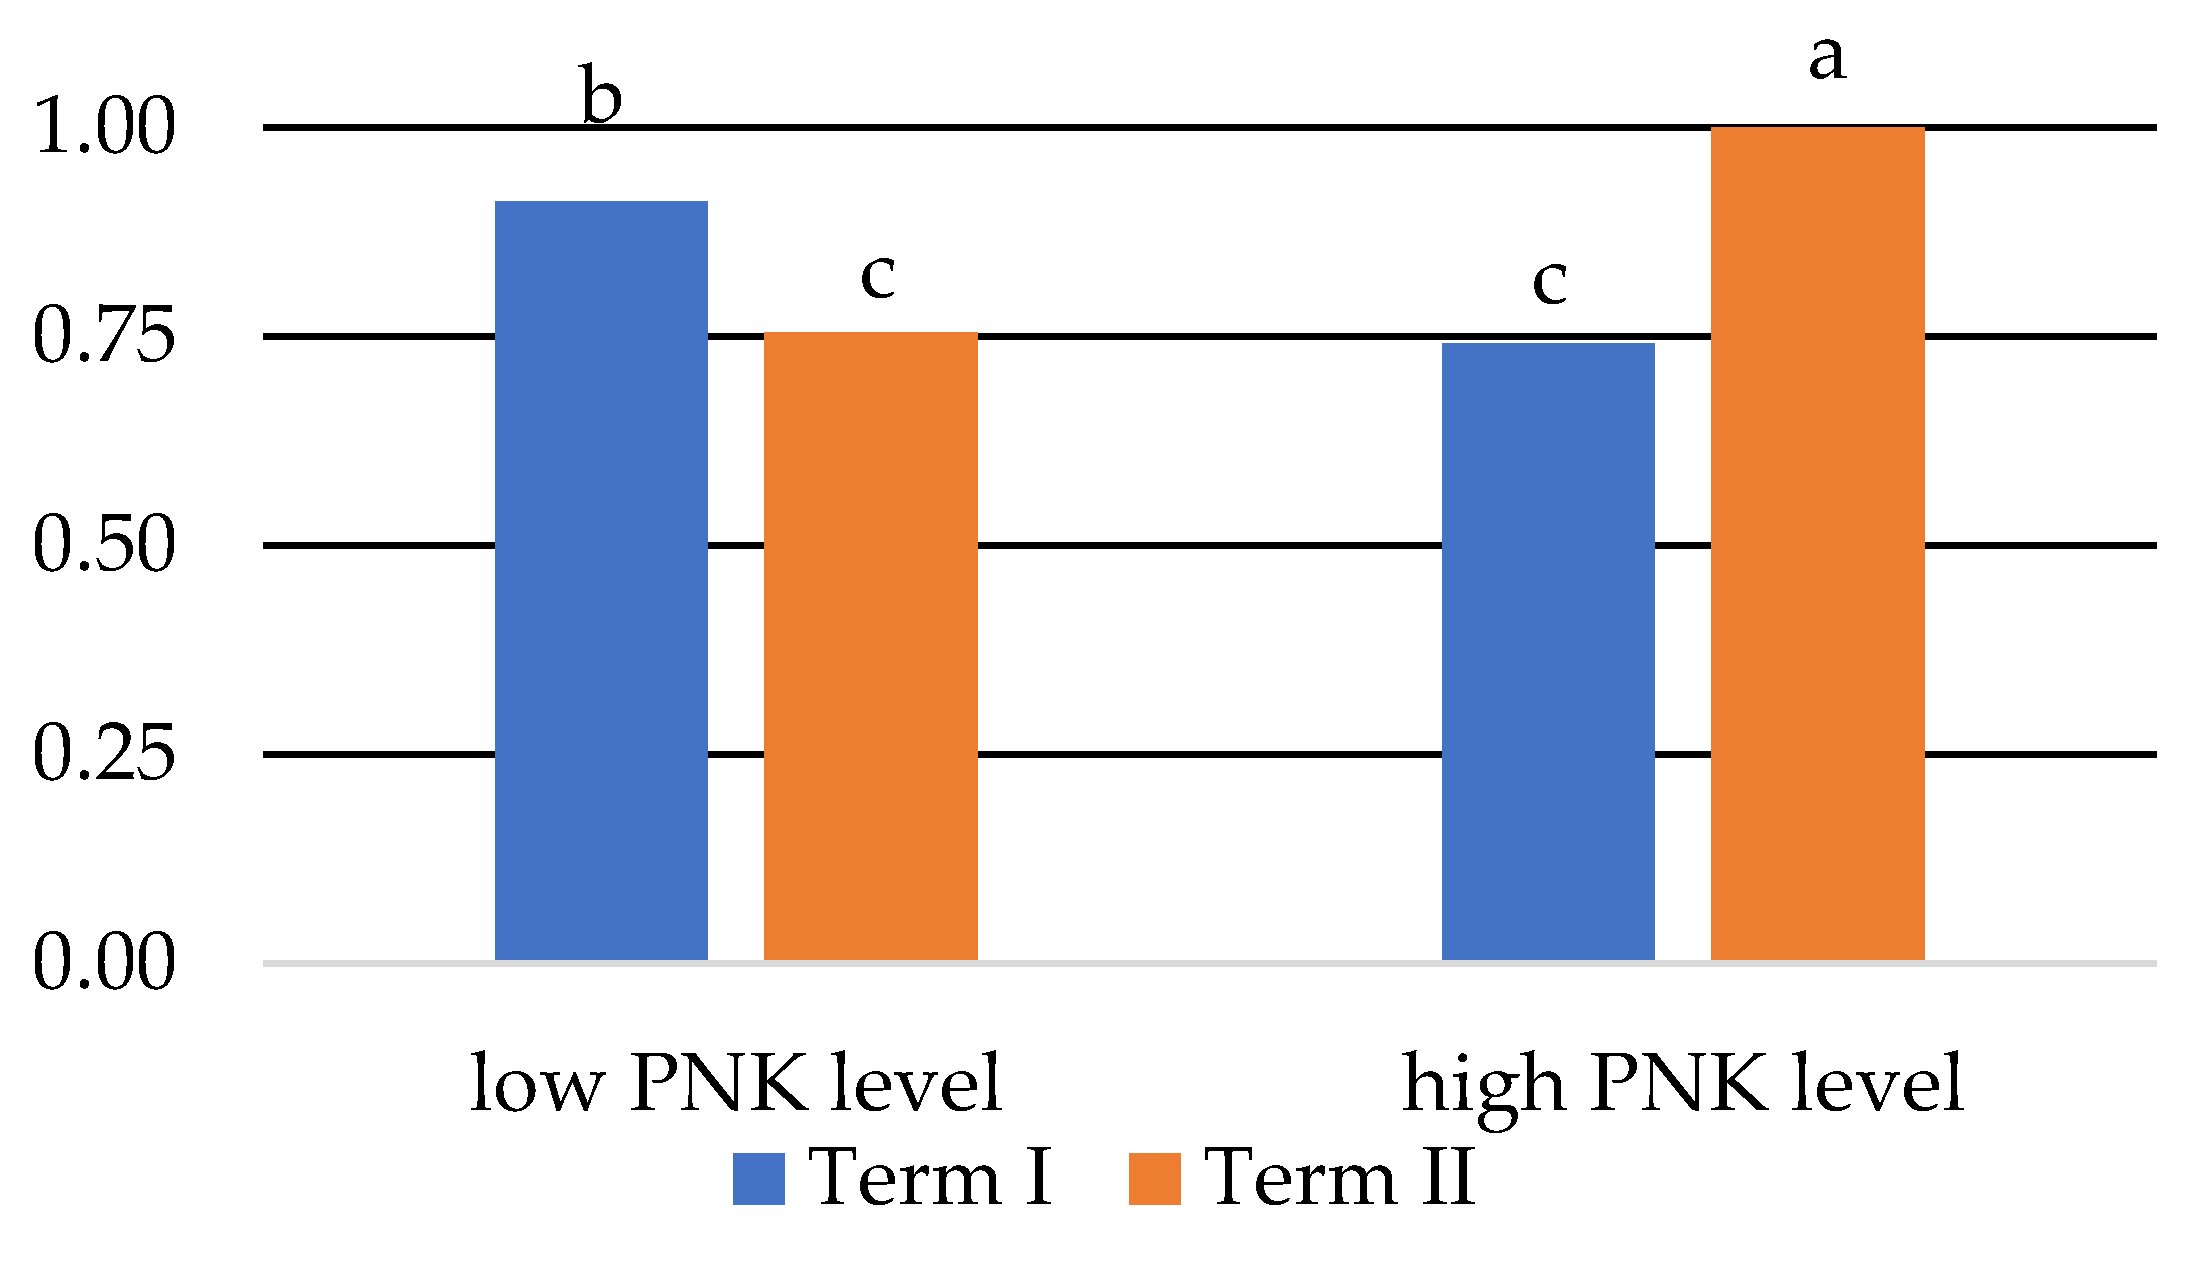
The biometric measurements of the plants and chemical samples from the frogbit and the physicochemical data of water and soil material were subjected to statistical analysis. A four-factor analysis of variance was used: factor I—factor contaminating the growth environment of the frogbit effluent (two levels), factor II—exposure time of the frog effluent to water contamination with cadmium (two levels), factor III—concentration of PNK compounds introduced into the water (two levels), and factor IV—growing season (three levels). The calculated indices regarding the cadmium pollution of the created aquatic ecosystem were analyzed by a two-factor analysis of variance: factor I—time of exposure of the frogbit to water contaminated with cadmium; factor II—the concentration of PNK compounds introduced into the water. The significance of the differences between the mean measurement values were evaluated using Tukey’s confidence intervals at a significance level of α = 0.05 (NIR0.05). The normality of distribution and homogeneity of variance (Levene’s test) were checked.
Based on the data from the three growing seasons, the relationship between the cadmium content in the water and in the plant was determined using Pearson’s linear correlation coefficient. Linear correlation analysis was also performed to compare the dissolved oxygen content in water, plant fresh weight, electrolytic conductivity, water pH, dry weight of plant, plant cadmium content in plant, and pH. The scale of Pearson’s Correlation Coefficient was determined by the following [68]: value 0 < r ≤ 0.19—very low correlation; 0.2 ≤ r ≤ 0.39—low correlation; 0.4 ≤ r ≤ 0.59—moderate correlation; 0.6 ≤ r ≤ 0.79—high correlation; and 0.8 ≤ r ≤ 1.0—very high correlation. The results of the research were processed using the program Statistica 13.3.

3. Results

The concentration of cadmium in water and in frogbit and its accumulation in the dry weight of the plant depended on the time of exposure and the level of plant feeding. However, the growing season did not appear to have any effect.
The addition of cadmium salts to water caused a significant increase in its concentration (Table 1). The lowest water cadmium concentration was observed at the low supplementation level after three weeks of plant exposure. Significantly higher concentrations were noted with higher levels of supplementation and after six weeks.
At the lower plant nutrient level (PNK), the level of cadmium contamination was almost 13-fold higher after six weeks compared to three weeks; however, this value decreased by 24% at the higher nutrient level (Figure 2).
The addition of cadmium salt to water resulted in a significant increase in cadmium content in the plant. The mean cadmium content in frogbit was almost 13 times higher in the cadmium treated sample than in the untreated sample (Table 2). In the treated samples, the lowest plant cadmium content was noted after three and six weeks at the higher nutrient level, and the highest cadmium content was found after three weeks at the lower nutrient level.
The cadmium contamination index of the frogbit fell over the course of cadmium exposure, regardless of the level of plant nutrition (Figure 3).
The cadmium content in the soil was very low in all samples (Table S2 in Supplementary Materials). No statistically significant trends were found, either in terms of the level of nutritional supplementation or the length of plant exposure (Figure S1 in Supplementary Materials).
Positive correlations were noted between the water and plant cadmium levels. In addition, very strong and highly significant linear relationships were found between these levels at the lower nutrient level after six weeks, and at the higher nutrient level after three weeks (Table 3).
The introduction of cadmium salts into the water resulted in a statistically significant increase in its accumulation in the plant. The highest plant accumulation of cadmium was recorded after three weeks at the lower level of supplementation (Table 4); these conditions were found to favor the greatest efficiency of metal accumulation (100%) (Figure 4). In turn, the lowest cadmium accumulation was observed after three weeks, but at the higher nutrient level. At both nutrient levels, longer exposure to cadmium resulted in lower plant cadmium accumulation (Table 4). The least efficient cadmium uptake (67%) was observed after six weeks at the lower nutrient level; after this time, cadmium uptake increased to 81% at the higher nutrient level (Figure 4).
The addition of cadmium salt to water had a significant effect on the fresh weight and the number of rosettes of the frogbit. After cadmium supplementation, but only at a higher nutrient level, a slight increase in fresh weight rosette number was found after six weeks (Table 5 and Table 6). In the other cases, cadmium had a negative effect on plant growth and development (Table 5 and Table 6), as confirmed by a tolerance index lower than one (Figure 5).
The introduction of cadmium salts into the water diversified the physicochemical conditions of the growth environment of the frogbit, i.e., dissolved oxygen content in the water, pH, and electrolytic conductivity (Table 7, Table 8 and Table 9).
The greatest dissolved oxygen content was found after three weeks of exposure to cadmium, with these values decreasing over time. Increased nutrient supplementation (PNK) influenced the growth and development of the plant (Table 5 and Table 6) but resulted in a decrease in dissolved oxygen content due to leaf decomposition (Table 7). No statistically significant linear correlation was observed between dissolved O2 (mg dm−3) and plant dry weight (g) in the three tested growing seasons in any variant, because the growth and development of Hydrocharis morsus-ranae coincided with its decomposition (Table S3 in Supplementary Materials).
In all experimental variants, the pH value of the water influenced plant development and cadmium absorption (Table 8). A higher pH value increased the metal content in the plant (Table 10), which reduced the rate of its development (Table 11) and the distribution of leaves in the rosettes (Table 7).
The availability of plant nutrients, i.e., various metal cations and nitrogen (V) and orthophosphate (V) anions, allowed the plant to develop and grow irrespective of cadmium supplementation (Table 9). At the lower nutrient level, a significant negative correlation was found between plant dry weight and electrolytic conductivity after three weeks (Table 12).

4. Discussion

4.1. Cadmium Toxicity in Aquatic Ecosystems

Dojlido [69] reports a strong relationship between the cadmium concentrations in water and aquatic plant tissue, ranging from 0.15 to 342 mg·kg−1 d.w. As such, aquatic plants are often referred to as metal bioaccumulators [2,3,4]. The content of metals in plants is influenced by their availability in the environment, exposure time, presence of other nutrients, physicochemical conditions of the water and sediment, and the defense mechanisms employed by the plants [24,70,71,72,73,74,75,76,77,78,79]. Although cadmium is taken up just as readily as other heavy metals, its role in plant development remains unclear.
Although cadmium can enter the plant through the leaves, it is primarily taken up through the root system up by a transmembrane transporter; however, it has to compete with other ions, such as potassium, calcium, magnesium, iron, manganese, zinc, and copper. Following successful uptake, the cadmium is then moved between cells, and then slowly, but permanently, bound in the cell [80,81]. The cadmium content in plants varies greatly.
Its toxicity results from the fact it demonstrated high affinity for many chemical groups of significant biological importance. Cadmium forms covalent and ionic bonds with oxygen, hydrogen, and sulfur atoms, which are form parts of many compounds in plant cells. Toxicity symptoms generally occur at 5–30 ppm and are not specific. Chlorotic and brown spots can be seen on the leaf blades, accompanied by reddening of the veins, twisted leaves, and thicker and shorter roots [82,83]. Cadmium stress is associated with disturbances in photosynthesis, transpiration, and nitrogen uptake, as well as with changes in cell membrane permeability and DNA structure [84,85,86,87]. There are two types of heavy metal protein chelators in plant cells: metallothioneins, i.e., proteins that transport cadmium through the plasmolemma to the cytosol, and phytochelatins, which are believed to detoxify heavy metal ions during “acute stress” caused by short exposure to high concentrations of metals [80].

4.2. Factors Affecting Cadmium Uptake by Hydrocharis morsus-ranae

The most important factor affecting the availability of cadmium is considered to be pH [88]. At a pH value around 7, this element exists as a free ion (Cd2+). This form is easily taken up by living cells and is hence the most toxic. For pH values above 7, the metal forms complexes (oxides and hydroxides) that are inaccessible to cells [89]. Field studies of aquatic ecosystems [9,24,43,44,90,91] have found Hydrocharis morsus-ranae in waters where the pH ranged from 6.44 to 8.27. In the present study, the water pH ranged from 7.03 to 7.40 (Table 8), which ensured that Cd2+ was available for the plant, especially for the samples at the lower nutrient level after three weeks of cadmium exposure (pH = 7.03).
In natural aquatic ecosystems, frogbit occurs in waters with varying concentrations of biogenic compounds. In Poland, the plant was recorded in stagnant and stagnant waters with the following parameters: Nmin: 0.054–1.086 mg dm−3 and NKjeh: 1.12–2.10 mg dm−3, PO43−: 0.009–0.919 mg dm−3, and K: 0.70–7.63 mg dm−3 [9,90]. It was also found in a lake in New York under the following conditions: total phosphorus 19–36 μg/L in the coastal zone with frogbit, PO43−: 0.24–0.324 mg/L, and NO3− 2.712–15.147 mg/L [16,92].
Unfortunately, the results of field studies of aquatic ecosystems do not confirm whether these concentrations of mineral nutrients promote or inhibit the development of frogbit. In the present study, in the samples with a lower level of plant nutrition, the initial concentrations of the elements were Nmin (NNO3 + NNH4+): 1.8 mg dm−3, PO43−: 0.54 mg dm−3, and K+: 4.56 mg dm−3; these levels are similar to those in the natural environment. At a higher level of supplementation (Nmin: 9.3 mg dm−3, PO43−: 2.73 mg dm−3, and K+: 22.8 mg dm−3), higher concentrations of biogenic compounds were observed compared to those in natural water reservoirs. Three weeks after the introduction of mineral nutrients into the water, a significant increase in the fresh weight of plants was noted (from 19.9 to 25.8) due to the plant having greater access to these compounds (Table 5). However, after six weeks, a decrease in the fresh weight was observed in the samples with the high nutrient content; this was probably due to the significant decomposition of leaves of older rosettes and the depletion of oxygen dissolved in the water (Table 7).
The availability of water-soluble metal cations and anions of acid residues affects the EC value. In natural aquatic ecosystems, the frogbit inhabits waters with EC values ranging from 70 to 996 µg·cm−1 [9,24,43,44,90,91]. In our present findings, these values depend on the time of exposure to cadmium and the level of plant nutrition. Its value was not affected by the introduction of cadmium salts into the water. The total EC score ranged from 168.2 to 202.0 µg·cm−1, slightly lower than the typical value observed in natural water bodies (467 µg cm−1).
The concentration of cadmium in natural waters in Poland, where the frogbit is present, ranges from 0.0 to 22.0 µg dm−3 [9,91]. In the present mesocosm experiment, cadmium was introduced into the water at a concentration of 100 µg dm−3. The effect of cadmium pollution is well illustrated by the pollution index, which depends on the level of plant nutrients and the length of exposure to cadmium (Figure 1). Regardless of the level of plant nutrition, after three and six weeks, the concentration of cadmium in the water steadily fell, ranging from 2.9 to 37.6 µg·dm−3 (Table 1).
In natural water bodies, the cadmium content of frogbit ranged from 0.0 to 2.08 mg kg−1 [9,43,87,91,93,94,95,96]. However, cadmium levels dozens of times higher were recorded by Maleva et al. [70] after five days of exposure to cadmium at a concentration of 0.25 mg/L. In the present study, the cadmium content in the plants depended on the level of supplementation and the length of exposure to cadmium, but only at the lower level of supplementation (Table 2). It is possible that at the higher level of supplementation, the high phosphorus concentration could have limited the efficiency of cadmium uptake (Figure 3).
Interestingly, the plant cadmium contamination index did not appear to be affected by the level of cadmium supplementation. This effect may result from the method of calculation, where cadmium uptake in variable trophic conditions is compared with uptake in cadmium-free conditions. This may influence the use of the plant in the phytoremediation of cadmium-polluted waters.
Polechońska and Samecka-Cymerman [43,96] report that, while cadmium was not found in the water, based on the employed research methods, it was nevertheless present in frogbit. Other field studies of aquatic ecosystems have also confirmed higher plant cadmium levels in contaminated water than in clean waters; this is reflected in a high bioconcentration factor (BCF) of up to 30,000, calculated as the ratio of plant cadmium concentration to water cadmium concentration [91]. For comparison, an unpolluted environment with frogbit typically has a BCF value of 5000 [97]. In the present study, the highest BCF value (12,655) was obtained at the low nutrient supplementation level after three weeks of exposure; this value was 10 times higher than in the remaining variants, suggesting that the plant reduces its metal uptake in the presence of higher nutrient content. Kabata-Pendias [98] indicates that phosphorus has a varied influence on the uptake of cadmium by the plant: it can increase or decrease cadmium content in the plant depending on the species and the physical and chemical properties of the soil. In contrast, in studies conducted in natural aquatic ecosystems, Polechońska and Samecka-Cymerman [96] report a positive correlation between the weight of frogbit and the concentration of inter alia phosphorus.
A similar measure to BCF is the correlation between the concentrations of cadmium in water and in the plant. However, only half of the experimental variants in the present study demonstrated a positive relationship in this regard (Table 3). In turn, Gałczyńska and Bednarz [9] did not report any such linear correlation in field studies of aquatic ecosystems. These findings may be due the influence of many factors that could limit the uptake of metal by the plant, and their possible antagonistic and synergistic effects [98].
Polechońska and Klink [44] determined that frogbit, similar to Ceratophyllum demersum, can be considered a bioindicator of water pollution with trace metals. The Nemerow Pollution Index (NPI) values for frogbit exceeded 3 at some points of a polluted river, indicating strong contamination of the aquatic ecosystem with these metals. Polechońska and Samecka-Cymerman [43,96] found the cadmium content of the Odra River sediment to range from 0.01 to 2.86 mg kg−1. These findings indicate that the presence of smaller amounts of cadmium in the aquatic ecosystem creates better conditions for the growth and development of the plant. In the present study, cadmium was found to be present at 0.3 mg kg−1 in the soil material. Part of the added cadmium (100 µg dm−3) was taken up by the frogbit, and the rest remained in the water. This fact is confirmed by the high cadmium uptake rate by the plant (Figure 3).
No statistically significant increase in cadmium content was observed in the sludge of any experimental variant (Table S2). Hence, the cadmium contamination index remained neutral (Figure S1 in Supplementary Materials). Hence, in these experimental conditions, it is possible that cadmium uptake could be affected by the introduction of cadmium salts into the water, and not by its presence in the sediment.
Many researchers indicate that physicochemical water parameters influence the occurrence of aquatic plants [39,99]. Gałczyńska [39] report a negative linear correlation between frogbit dry weight and EC in the case of Pb, Cu, Zn, Mn, or Fe water pollution, as well as at lower available nutrient levels after three and six weeks of exposure. In our study, a similar strong linear correlation occurred under the same feeding conditions, but only after three weeks of exposure to cadmium (Table 11 and Table 12). In contrast, no such correlation was observed in field studies of aquatic ecosystems [99]; however, the same researchers noted a positive correlation between the presence of the plant, water pH, and dissolved oxygen content.
In the present study, no significant correlations were found between the fresh weight of frogbit and dissolved oxygen content in any of the experimental variants (Table S3). However, strong negative linear correlations were found between pH and plant dry weight (Table 11) after six weeks of exposure at the lower nutrition level, and after three and six weeks at the higher level; this was mainly related to leaf decomposition and a decrease in dissolved oxygen content (Table 7). Both positive and negative relationships have been described between water or soil pH and plant cadmium content [24,39,90,91]. In the present study, a decrease in plant cadmium content was only found to be associated with an increase in pH at the lower nutrient level after three weeks (Table 10). This probably coincided with the greatest availability of the metal at that time.

4.3. Phytoremediation Properties of Hydrocharis morsus-ranae

4.3.1. Growth of Hydrocharis morsus-ranae in an Environment Polluted with Cadmium and the Efficiency of Cadmium Uptake

For effective phytoremediation, it is important that the plant can accumulate as much metal as possible in the shortest possible time and can remain sediment at high concentrations in water or sediment [100]. Since polluted waters are generally characterized by high levels of biogenic compounds, this is also an important consideration when choosing a given hydrophyte species for water purification [40]. In our research, the highest plant accumulation of cadmium was achieved after three weeks at a lower nutrient level; significantly lower cadmium accumulation was observed at higher nutrient levels. Extending the exposure time did not increase metal accumulation (Table 4).
The addition of cadmium salts to the nutrient solution limited the development and growth of the plant. Maleva et al. [70] highlights the fact that the intake of significant amounts of heavy metal ions disturbs key main life processes in frogbit, including photosynthesis. This phytotoxicity is manifested by a decrease in biomass, together with reduced photosynthetic pigment concentration, net CO2 assimilation, and disturbances in the functioning of the stomatal apparatus [83]. Gałczyńska et al. [87] report no phytotoxic effects in Hydrocharis morsus-ranae following seven-day exposure to cadmium (0.012, 0.025, 0.050 mg Cd dm−3); no decrease in chlorophyll a and b was noted, nor was any reduction in leaf carotenoid concentrations or weight loss.
In the present study, the variants at the higher nutrient levels demonstrated significantly greater numbers of frogbit rosettes and lower cadmium content (dry weight) than at the lower nutrient level (Table 2). Such decreases in vegetative development are not desirable factors for cadmium removal (Table 6).
Although the tolerance index was found to be 1 after six weeks of exposure at the higher nutrient level, 100% cadmium uptake was recorded after three weeks at the lower nutrient level. This high efficiency of metal removal, observed after a short exposure time, indicates that the plant is a promising candidate for the phytoremediation of aquatic ecosystems polluted with cadmium (Figure 4 and Figure 5).

4.3.2. Comparison of Potential Cadmium Uptake by Hydrocharis morsus-ranae with Other Pleustophytes

In the present study, the highest plant cadmium content (36.7 µg·g−1 d.w.) in the frogbit was recorded after 21 days (Table 2). Lower values have been noted in Wolffia arrhiza for the same exposure time and comparable cadmium levels [72] (Table 13). In addition, at a similar cadmium concentration (130 µg/L), Eichhornia crassipes absorbed 31 mg Cd·kg−1 d.w. after five days [101].
In the case of lemnids, the length of exposure to cadmium pollution in the aquatic environment ranged from 2 to 31 days. Despite their high metal uptake capacity, these plants only have a short time to function in a polluted ecosystem due to the short lifespan of their leaves (Table 14).
Eichornia crassipes (water hyacinth) is the most commonly-used aquatic plant for water and wastewater treatment in Asia. It demonstrates high potential for accumulating both biogenic compounds and metals. Its efficiency index (Ep) values for cadmium uptake vary depending on the length of exposure and the cadmium dose (Table 14). The highest Ep index values were calculated for wastewater from anaerobic reactors (98%), followed by industrial wastewater (97.5%), and wastewater from steel production (82.8%) [102,103,104]. The exposure time of the plant ranged from 21 to 130 days. In these studies, cadmium content was found to fall in the plant as exposure time increased, resulting in a higher tolerance index. In the present study, at the initial concentration of 0.1 mg Cd/L in water, the Ep of frogbit was found to be 83.5%, regardless of nutrient level. Elsewhere water hyacinth was found to demonstrate higher cadmium uptake at 2.5 times the water cadmium level compared to frogbit [103].
Another species from Asia used in the phytoremediation of aquatic ecosystems is Pistia stratiotes. As reported by Lu et al. [105], this plant removes around 50% of cadmium from rainwater with varying levels of mineral nutrients after two months (Table 14). While the plant was found to absorb similar amounts of cadmium, a higher dry weight yield was observed at the lower EC level. Therefore, more cadmium could be removed from a pond with a slightly higher concentration of PNK. In the present study, Ep was typically slightly lower at higher plant nutrient levels (81–82%) than at lower levels (67–100%), regardless of the time of exposure to cadmium. Aurangzeb et al. [102] showed that under the same environmental conditions, water hyacinth (83%) was more effective than Pistia rosettes (50%) (Table 14).
Lemna spp. also demonstrate fairly significant cadmium uptake, amounting to about 95% from mine, municipal and industrial wastewater after 31 days [108] (Table 14). Unlike our present findings on frogbit, the level of mineral nutrition was not found to influence the effectiveness of cadmium uptake. These differences may be due to differences in the cadmium concentration at the beginning of the phytoremediation process. In other studies based on prepared cadmium solutions, frogbit demonstrated lower removal efficiency, ranging from 42 to 84.8% [108], and shorter exposure, ranging from 2 to 22 days [107,109] (Table 14). However, in both works, it can be seen that higher concentrations of the toxic element are associated with less efficient removal.
Salvinia spp. are characterized by an above-normative ability to take up heavy metals, thanks to their rapid growth and tolerance to toxic metals. Lacra et al. [106] found it to demonstrate almost 81% efficiency at removing cadmium from mine waters after 10 days (Table 14).

4.3.3. The Advantages and Disadvantages of Using Hydrocharis morsus-ranae in the Phytoremediation of Cadmium-Polluted Waters

When assessing phytoremediation capabilities, it is important to consider the biological factors and habitat conditions of a given plant species [22,100]. Since Hydrocharis morsus-ranae is a floating plant, bearing short roots with long hairs immersed in the water, it is better suited for the treatment of waters contaminated with cadmium than bottom sediments. The rosettes of the plant have dense leaf cover and also accumulate metals, although to a lesser extent than the roots (leaves to roots = 0.18) [44]. In natural conditions, the plant is only available for phytoremediation during the growing season, i.e., between May and September; however, under artificial conditions, with good insolation and optimal temperature, metal uptake can take place in any required period. The limitation in the use of frogbit is the short life of the leaves (14–17 days). As such, it must soon be removed from the polluted environment, preferably after two to three weeks. Although frogbit is characterized by low biomass, our findings confirm that it demonstrates highly efficient cadmium removal from water (Figure 4) under conditions of neutral water pH and low nutrient availability.

4.3.4. Proposal for the Use of Hydrocharis morsus-ranae Together with Other Pleustophyte Species for the Treatment of Cadmium-Polluted Waters

Pleustophytes are well suited for phytoremediation of waters contaminated with cadmium, including municipal and industrial sewage. All species demonstrated different tolerances to toxic elements (Table 13 and Table 14). This fact can be used to construct a technological line based on various types of sorption sites [22]. Frogbit is highly efficient at removing metals, including cadmium; however, it requires a longer time for vegetative development compared to other limnids in Europe and Asia, which limits its phytoremediation potential. In addition, the optimal growth environment for this species is associated with low concentrations of biogenic compounds, limiting its use in the treatment of municipal and mine wastewater. This species appears to be particularly suitable for use in the final stage of phytoremediation, under which conditions it demonstrates very high cadmium removal efficiency and can thoroughly clean the water or sewage treated in stages (Table 15). The process would have to run for three weeks and remove the biomass from the containers. This effect results from the plant’s development cycle. Extending the time of exposure of the frogbit effluent to dissolved cadmium in the aquatic environment will be accompanied by the decomposition of organic matter and the release of metals accumulated in biomass, including toxic cadmium. The number of rosettes of this pleustophyte should be adjusted to the volume of sewage and the concentration of biogenic compounds (2 rosettes per 2 dm3, for example, in the present study).
Phytoremediation in natural water reservoirs involves the use of a net limiting the uncontrolled movement of plants, e.g., as a result of a gust of wind and the formation of waves. The plant harvest time must be respected.
Regardless of where this technology is used, biomass must be disposed of, which is often associated with high costs. However, if the cadmium-enriched plant material is processed, e.g., in existing facilities together with municipal waste, the costs of this operation will be negligible. During the composting of plants, the by-product will be the collected leachate, which, depending on their chemical composition, may be subjected to further processing. After drying, aquatic plants are characterized by a several dozen percent weight loss. The obtained biomass can be disposed of so that it does not pose a threat to the environment.
There are many technologies that, additionally, through energy benefits (thermochemical, and energy conversion) or metal recovery from bio-ore, can also make the phytoremediation process profitable at an appropriate scale of the project.

5. Conclusions

Cadmium uptake in frogbit was found to be influenced by water reactivity, the abundance of mineral nutrients, and the time of exposure. Hydrocharis morsus-ranae is hence a good bioindicator of cadmium pollution in water bodies based on its accumulation. In addition, longer contact time with cadmium resulted in a decrease in the plant contamination index, irrespective of the level of supplementation. Where there was greater access to PNK compounds, i.e., high fertilizer level, higher pH (7.6) was associated with increased cadmium uptake and decreased plant biomass.
A higher plant nutrient level was associated with greater tolerance to cadmium; however, at lower levels, more efficient cadmium uptake was noted at three weeks. This is of practical importance when using frogbit in the phytoremediation of aquatic ecosystems, as full removal of cadmium was achieved from the contaminated solution under these conditions. Hydrocharis morsus-ranae can be used for water and wastewater treatment in the final stage of phytoremediation in combination with other species of pleustophytes, which can be used as separate biosorption sites.

Supplementary Materials

The following supporting information can be downloaded at: https://www.mdpi.com/article/10.3390/app13021197/s1, Figure S1: The indicator of cadmium contamination in sediment in the three tested growing seasons, Table S1: Meteorological conditions in three consecutive research seasons against the background of long-term averages for the Meteorological Station in Szczecin, Table S2: The concentration of sediment (µg·g−1 d.w.) in the three tested growing seasons, Table S3: The linear correlation between CO2 in water (mg·dm−3) and dry weight of Hydrocharis morsus-ranae (g) in the three tested growing seasons.

Author Contributions

Conceptualization, M.G.; methodology, M.G.; validation, M.G.; formal analysis, M.G. and R.G.; investigation, M.G.; resources, M.G; data curation, M.G.; writing—original draft preparation, M.G. and R.G.; writing—review and editing, A.C., M.G., and R.G; visualization, A.C., M.G. and R.G; supervision, M.G. and R.G.; project administration, M.G.; funding acquisition, M.G. All authors have read and agreed to the published version of the manuscript.

Funding

The research in pot experiment was supported by the West Pomeranian University of Technology in Szczecin under the UPB grant (Maintaining the Research Potential) and Financing postdoctoral staff, 2010.

Institutional Review Board Statement

Not applicable.

Informed Consent Statement

Informed consent was obtained from all subjects involved in the study.

Data Availability Statement

Not applicable.

Conflicts of Interest

The authors declare no conflict of interest.

References

  1. Szczerbińska, N.; Gałczyńska, M. Biological methods used to assess surface water quality. Arch. Pol. Fish. 2015, 23, 185–196. [Google Scholar] [CrossRef] [Green Version]
  2. Szpakowska, B.; Świerk, D.; Pajchrowska, M.; Gołdyn, R. Verifying the usefulness of macrophytes as an indicator of the status of small waterbodies. Sci. Total Environ. 2021, 798, 149279. [Google Scholar] [CrossRef] [PubMed]
  3. Thiemer, K.; Schneider, S.C.; Demars, B.O.L. Mechanical removal of macrophytes in freshwater ecosystems: Implications for ecosystem structure and function. Sci. Total Environ. 2021, 782, 146671. [Google Scholar] [CrossRef] [PubMed]
  4. Szoszkiewicz, K.; Jusik, S.; Pietruczuk, K.; Gebler, D. The Macrophyte Index for Rivers (MIR) as an advantageous approach to running water assessment in local geographical conditions. Water 2020, 12, 108. [Google Scholar] [CrossRef] [Green Version]
  5. Croft, M.V.; Chow-Fraser, P. Use and development of the wetland macrophyte index to detect water quality impairment in fish habitat of great lakes coastal marshes. J. Great Lakes Res. 2007, 33, 172–197. [Google Scholar] [CrossRef]
  6. Laketić, D.; Radulović, S.; Živković, M.; Jurca, T.; Alford, M.H. Lake Macrophyte Nutrient Index of standing waters in Serbia (LIMNIS). Ecol. Indic. 2013, 25, 200–204. [Google Scholar] [CrossRef]
  7. Hegi, G. Ilustrierte Flora von Mittel-Europa, Band I, Teil 2: Gymnospermae, Angiospermae, Monocotyledoneae 1; Verlag Paul Parey: Berlin/Hamburg, Germany, 1981; p. 269. (In German) [Google Scholar]
  8. Kim, T.-H.; Yoon, C.Y.; Kim, J.-H. The report on the taxonomic characters, ecological risk and weed risk assessment of putative invasive alien plants which are designated in law by the Ministry of Environment in Korea as Environmentally Harmful Species (III) Korean. J. Plant Res. 2021, 34, 223–248. [Google Scholar] [CrossRef]
  9. Gałczyńska, M.; Bednarz, K. Influence of water contamination on the accumulation of some metals in Hydrocharis morsus-ranae L. J. Elem. 2012, 17, 31–41. [Google Scholar] [CrossRef]
  10. Benavent-González, A.; Lumbreras, A.; Molina, J.A. Plant communities as a tool for setting priorities in biodiversity conservation: A novel approach to Iberian aquatic vegetation. Biodivers. Conserv. 2014, 23, 2135–2154. [Google Scholar] [CrossRef]
  11. Spampinato, G.; Sciandrello, S.; del Galdo, G.G.; Puglisi, M.; Tomaselli, V.; Cannavò, S.; Musarella, C.M. Contribution to the knowledge of Mediterranean wetland biodiversity: Plant communities of the Aquila Lake (Calabria, Southern Italy). Plant Sociol. 2019, 56, 53–68. [Google Scholar] [CrossRef]
  12. Stefanidis, K.; Sarika, M.; Papastegiadou, E. Exploring environmental predictors of aquatic macrophytes in water—dependent Natura 2000 sites of high conservation value: Results from a long-term study of macrophytes in Greek lakes. Aquatic Conserv. Mar. Freshw. Ecosyst. 2019, 1–16. [Google Scholar] [CrossRef]
  13. Catling, P.M.; Mitrow, G.; Haber, E.; Posluszny, U.; Charlton, W.A. The biology of Canadian weeds. 124. Hydrocharis morsus-ranae L. Can. J. Plant Sci. 2003, 83, 1001–1016. [Google Scholar] [CrossRef]
  14. Zhu, B.; Ellis, M.S.; Fancher, K.L.; Rudstam, L.G. Shading as a control method for invasive european frogbit (Hydrocharis morsus-ranae L.). PLoS ONE 2014, 9, e98488. [Google Scholar] [CrossRef]
  15. Ganie, A.H.; Bashir, A.; Khuroo, A.A.; Tali, B.A.; Reshi, Z.A.; Shah, M.A.; Wafai, B.A. A new record of an invasive aquatic plant Hydrocharis morsus-ranae (Hydrocharitaceae), reaching to the Kashmir Himalaya. J. Jpn. Bot. 2016, 91, 100–104. Available online: http://www.jjbotany.com/pdf/JJB_091_100_104.pdf (accessed on 3 November 2022).
  16. Zhu, B.; Ottaviani, C.C.; Naddafi, R.; Dai, Z.; Du, D. Invasive european frogbit (Hydrocharis morsus-ranae L.) in North America: An updated review 2003–16. J. Plant Ecol. 2018, 11, 17–25. [Google Scholar] [CrossRef] [Green Version]
  17. Monks, A.M.; Lishawa, S.C.; Wellons, K.C.; Albert, D.A.; Mudrzynski, B.; Wilcox, D.A. European frogbit (Hydrocharis morsus-ranae) invasion facilitated by non-native cattails (Typha) in the Laurentian Great Lakes. J. Great Lakes Res. 2019, 45, 912–920. [Google Scholar] [CrossRef]
  18. Gołdyn, H. Changes in plant species diversity of aquatic ecosystems in the agricultural landscape in West Poland in the last 30 years. Biodivers. Conserv. 2010, 19, 61–80. [Google Scholar] [CrossRef]
  19. Schneider-Binder, E. Aquatic macrophytes and their use as ecological status indicators in restoration projects in the Danube Delta (Romania). Rom. J. Aquat. Ecol. 2011, 1, 45–62. [Google Scholar]
  20. Toma, C. Reproduction of Hydrocharis morsus-ranae taxa in an oxbow lake of the River Vistula. Limnol. Rev. 2013, 13, 171–179. [Google Scholar] [CrossRef] [Green Version]
  21. Polechońska, L.; Dambiec, M. Heavy metal accumulation in leaves of Hydrocharis morsus-ranae L. and biomonitoring applications. Civ. Environ. Eng. Rep. 2014, 12, 95–105. [Google Scholar] [CrossRef] [Green Version]
  22. Gałczyńska, M.; Mańkowska, N.; Milke, J.; Buśko, M. Possibilities and limitations of using Lemna minor, Hydrocharis morsus-ranae and Ceratophyllum demersum in removing metals with contaminated water. J. Water Land Dev. 2019, 40, 161–173. [Google Scholar] [CrossRef]
  23. Parikh, P.; Unadkat, K. Potential of Free Floating Macrophytes for Bioremediation of Heavy Metals—A Conceptual Review. In Strategies and Tools for Pollutant Mitigation; Aravind, J., Kamaraj, M., Prashanthi Devi, M., Rajakumar, S., Eds.; Springer: Cham, Switzerland, 2021. [Google Scholar] [CrossRef]
  24. Shiryaev, G.I.; Borisova, G.G.; Shchukina, D.A.; Chukina, N.V.; Sobenin, A.V.; Maleva, M.G. Redox reactions in Hydrocharis morsus-ranae L. under industrial impacts. J. Sib. Fed. Univ. Biol. 2021, 14, 296–305. [Google Scholar] [CrossRef]
  25. Kumar, S.; Thakur, N.; Singh, A.K.; Gudade, B.A.; Ghimire, D.; Das, S. 14—Aquatic macrophytes for environmental pollution control. In Phytoremediation Technology for the Removal of Heavy Metals and Other Contaminants from Soil and Water; Kumar, V., Shah, M.P., Shahi, S.K., Eds.; Elsevier: Amsterdam, The Netherlands, 2022; pp. 291–308. [Google Scholar] [CrossRef]
  26. Elznicová, J.; Kiss, T.; Sipos, G.; Faměra, M.; Štojdl, J.; Váchová, V.; Grygar, M.T. A central European alluvial river under anthropogenic pressure: The Ohře River, Czechia. CATENA 2021, 201, 105218. [Google Scholar] [CrossRef]
  27. Rozemeijer, J.; Noordhuis, R.; Ouwerkerk, K.; Pires, M.D.; Blauw, A.; Hooijboer, A.; van Oldenborgh, G.J. Climate variability effects on eutrophication of groundwater, lakes, rivers, and coastal waters in the Netherlands. Sci. Total Environ. 2021, 771, 145366. [Google Scholar] [CrossRef] [PubMed]
  28. Harguinteguy, C.A.; Gudińo, G.L.; Arán, D.S.; Pignata, M.L.; Fernandez-Cirelli, A. Comparison between two submerged macrophytes as biomonitors of trace elements related to anthropogenic activities in the Ctalamochita river, Argentina. Bull. Environ. Contam. Toxicol. 2019, 102, 105–114. [Google Scholar] [CrossRef] [PubMed]
  29. Bai, L.; Liu, X.-L.; Hu, J.; Li, J.; Wang, Z.-L.; Han, G.; Li, S.-L.; Liu, C.-Q. Heavy metal accumulation in common aquatic plants in rivers and lakes in the Taihu Basin. Int. J. Environ. Res. Publ. Health 2018, 15, 2857. [Google Scholar] [CrossRef] [Green Version]
  30. John, R.; Ahmad, P.; Gadgil, K.; Sharma, S. Effect of cadmium and lead on growth, biochemical parameters and uptake in Lemna polyrrhiza L. Plant Soil Environ. 2008, 54, 262–270. Available online: https://www.agriculturejournals.cz/publicFiles/01591.pdf. (accessed on 18 October 2022). [CrossRef] [Green Version]
  31. Ghosh, M.; Singh, S.P. A review on phytoremediation of heavy metals and utilization of its by products. Appl. Ecol. Environ. Res. 2005, 3, 1–18. [Google Scholar] [CrossRef]
  32. Volesky, B. Detoxification of metal-bearing effluents: Biosorption for the next century. Hydrometallurgy 2001, 59, 203–216. [Google Scholar] [CrossRef]
  33. Rai, P.K. Heavy metal phytoremediation from aquatic ecosystems with special reference to macrophytes. Crit. Rev. Environ. Sci. Technol. 2009, 39, 697–753. [Google Scholar] [CrossRef]
  34. Milke, J.; Gałczyńska, M.; Wróbel, J. The importance of biological and ecological properties of Phragmites australis (Cav.) Trin. ex Steud., in phytoremendiation of aquatic ecosystems—The review. Water 2020, 12, 1770. [Google Scholar] [CrossRef]
  35. Saleh, H.M.; Moussa, H.R.; Mahmoud, H.H.; El-Saied, F.A.; Dawoud, M.; Wahed, R.S.A. Potential of the submerged plant Myriophyllum spicatum for treatment of aquatic environments contaminated with stable or radioactive cobalt and cesium. Prog. Nucl. Energy 2020, 118, 103147. [Google Scholar] [CrossRef]
  36. Singh, M.; Rai, U.; Nadeem, U.; David, A. Role of Potamogeton pectinatus in phytoremediation of metals. Chem. Sci. Rev. Lett. 2014, 3, CS16204407. [Google Scholar]
  37. Hussner, A.I.; Stiers, M.J.J.M.; Verhofstad, E.S.; Bakker, B.M.C.; Grutters, J.; Haury, J.L.; van Valkenburg, C.H.; Brundu, G.; Newman, J.; Clayton, J.S.; et al. Management and control methods of invasive alien aquatic plants: A review. Aquat. Bot. 2017, 136, 113–137. [Google Scholar] [CrossRef]
  38. Fasani, E. Plants that hyperaccumulate heavy metals. In Plants and Heavy Metals; Furini, A., Ed.; Springer: Cham, Switzerland, 2012; pp. 55–74. [Google Scholar]
  39. Gałczyńska, M. The Response of Mare’s-Tail (Hippuris vulgaris L.) and Common Frogbit (Hydrocharis morsus-ranae L.) to the Pollution of Water with Selected Heavy Metals, and the Possibility to Use this Plant in Phytoremediation of Water; Wydaw. ZUT w Szczecinie: Szczecin, Poland, 2012; p. 138. ISBN 978-83-7663-137-0. (In Polish) [Google Scholar]
  40. Adomako, M.O.; Alpert, P.; Du, D.-L.; Yu, F.-H. Effects of clonal integration, nutrients, and cadmium on growth of the aquatic macrophyte Pistia stratiotes L. J. Plant Ecol. 2020, 13, 765–772. [Google Scholar] [CrossRef]
  41. Dubey, D.; Kumar, S.; Dutta, V. In-situ anatomical and elemental response of aquatic macrophytes against nutrient enrichment in freshwater tropical lakes. Appl. Water Sci. 2022, 12, 163. [Google Scholar] [CrossRef]
  42. Zhang, P.; Wang, T.; Zhang, H.; Wang, H.; Hilt, S.; Shi, P.; Cheng, H.; Feng, M.; Pan, M.; Guo, Y.; et al. Heat waves rather than continuous warming exacerbate impacts of nutrient loading and herbicides on aquatic ecosystems. Environ. Int. 2022, 168, 107478. [Google Scholar] [CrossRef]
  43. Polechońska, L.; Samecka-Cymerman, A. Bioaccumulation of macro- and trace elements by european frog-bit (Hydrocharis morsus-ranae L.) in relation to environmental pollution. Environ. Sci. Pollut. Res. 2016, 23, 3469–3480. [Google Scholar] [CrossRef]
  44. Polechońska, L.; Klink, A. Validation of Hydrocharis morsus-ranae as a possible bioindicator of trace element pollution in freshwaters using Ceratophyllum demersum as a reference species. Environ. Pollut. 2021, 269, 116–145. [Google Scholar] [CrossRef]
  45. Almuktar, S.A.A.A.N.; Abed, S.N.; Scholz, M. Wetlands for wastewater treatment and subsequent recycling of treated effluent: A review. Environ. Sci. Pollut. Res. 2018, 25, 23595–23623. [Google Scholar] [CrossRef] [Green Version]
  46. Sandoval, L.; Zamora-Castro, S.; Vidal-Álvarez, M.; Marín-Muñiz, J. Role of wetland plants and use of ornamental flowering plants in constructed wetlands for wastewater treatment: A review. Appl. Sci. 2019, 9, 685. [Google Scholar] [CrossRef]
  47. Hasport, N.; Krahe, D.; Kuchendorf, C.M.; Beier, S.; Theilen, U. The potential impact of an implementation of microalgae-based wastewater treatment on the energy balance of a municipal wastewater treatment plant in Central Europe. Bioresour. Technol. 2022, 347, 126695. [Google Scholar] [CrossRef] [PubMed]
  48. Kasperek, R.; Rosik-Dulewska, C.; Wiatkowski, M. Studies of bottom sediments in the border meanders of upper Odra river. Environ. Protec. Yearbook 2007, 9, 293–302. Available online: https://yadda.icm.edu.pl/baztech/element/bwmeta1.element.baztech-article-BPW8-0009-0072 (accessed on 26 October 2022). (In Polish).
  49. Obojski, J.; Strączyński, S. Reaction and Richness of Polish Soils in Macro- and Microelements; Wydaw. IUNG: Puławy, Poland, 1995; p. 48. (In Polish) [Google Scholar]
  50. Gołda, T. Reclamation, Uczelniane Wydawnictwa Naukowo-Techniczne; AGH: Kraków, Poland, 2005; p. 107. ISSN 0239-6114. (In Polish) [Google Scholar]
  51. Loska, K.; Wiechuła, D.; Peciak, G. Speciation in the investigation of metals biovailability in bottom sediments in the Rybnik Reservoir. Prob. Ekol. 2003, 7, 69–74. (In Polish) [Google Scholar]
  52. PIOŚ, Report on the Condition of the Environment in the Małopolskie Voivodship in 2009: Water. 2009. Available online: www.krakow.pios.gov.pl/publikacje/raporty/raport09/3_wody.pdf (accessed on 26 October 2022). (In Polish)
  53. RMI. Regulation of the Minister of Infrastructure of June 25, 2021 on the Classification of Ecological Status, Ecological Potential and Chemical Status and the Method of Classifying the Status of Surface Water Bodies, as Well as Environmental Quality Standards for Priority Substances. 2021. Available online: https://isap.sejm.gov.pl/isap.nsf/DocDetails.xsp?id=WDU20210001475 (accessed on 26 October 2022). (In Polish)
  54. Meteoblue. Available online: https://www.meteoblue.com/pl/climate-change/szczecin_polska_3083829 (accessed on 18 October 2022).
  55. Kisku, G.C.; Barman, S.C.; Bhargava, S.K. Contamination of soil and plants with potentially toxic elements irrigated with mixed industrial effluent and its impact on the environment. Water Air Soil Pollut. 2000, 120, 121–137. [Google Scholar] [CrossRef]
  56. Warzyński, H.; Sosnowska, A.; Harasimiuk, A. Effect of variable content of organic matter and carbonates on results of determination of granulometric composition by means of Casagrande’s areometric method in modification by Prószyñski. Soil Sci. Ann. 2018, 69, 39–48. [Google Scholar] [CrossRef]
  57. Wang, A.Q.; Li, D.C.; Huang, B.; Lu, Y. A Brief study on using to predict pHKCl for acid soils. Agric. Sci. 2019, 10, 142–149. [Google Scholar] [CrossRef] [Green Version]
  58. Huo, S.; Zan, F.B.; Li, Q.J. Phosphorus fractionation in different trophic sediments of lakes from different regions, China. J. Environ. Monit. 2011, 13, 1088–1095. [Google Scholar] [CrossRef]
  59. Knudsen, D.; Peterson, G.A.; Pratt, P.F. Methods of Soil Analysis, Part 2, Lithium, Sodium, and Potassium; Chemical and Microbiological Properties; Agronomy Monographs; Page, A.L., Ed.; American Society of Agronomy, Inc.: Madison, WI, USA; Soil Science Society of America, Inc.: Madison, WI, USA, 1983. [Google Scholar] [CrossRef]
  60. Chan, K.Y.; Davey, B.G.; Geering, H.R. Adsorption of magnesium and calcium by a soil with variable charge. Soil Sci. Soc. Amer. J. 1979, 43, 301–304. [Google Scholar] [CrossRef]
  61. Schumacher, B.A. Methods for the Determination of Total Organic Carbon (TOC) in Soils and Sediments: Ecological Risk Assessment Support Center; United States Environmental Protection Agency: Washington, DC, USA, 2002; pp. 1–23. [Google Scholar]
  62. Tabatabai, M.A. Soil organic matter testing: An overview. In Soil Organic Matter: Analysis and Interpretation; Chapter 1, Soil organic matter: Analysis and interpretation; Magdoff, F.R., Tabatabai, M.A., Hanlon, E.A., Eds.; American Society of Agronomy: Madison, WI, USA, 1996; Volume 46. [Google Scholar] [CrossRef]
  63. Nelson, D.W.; Sommers, L.E. Total nitrogen analysis of soil and plant tissues. J. Associ. Off. Analyt. Chem. 1980, 63, 770–778. [Google Scholar] [CrossRef]
  64. Jung, W.K.; Kitchen, N.R.; Sudduth, K.A.; Kremer, R.J.; Motavalli, P.P. Relationship of apparent soil electrical conductivity to claypan soil properties. Soil Sci. Soc. Am. J. 2005, 69, 883–892. [Google Scholar] [CrossRef]
  65. Dung, T.T.T.; Cappuyns, V.; Swennen, R.; Phung, N.K. From geochemical background determination to pollution assessment of heavy metals in sediments and soils. Rev. Environ. Sci. Biotechnol. 2013, 12, 335–353. [Google Scholar] [CrossRef]
  66. Clesceri, L.S.; Greenberg, A.E.; Eaton, A.D. Standard Methods for the Examination of Water and Wastewater, 20th ed.; American Public Health Association: Washington DC, USA, 1998. [Google Scholar]
  67. Flame Atomic Absorption Spectrometry, Analytical Methods, Varian Manual Book, Australia. 1989. Available online: https://chemistry.unt.edu/~tgolden/courses/AAS%20cookbook.pdf (accessed on 2 December 2022).
  68. EP. 2022. Available online: https://www.researchgate.net/publication/345693737_EmployeeProductivity_in_Malaysian_Private_Higher_Educational_Institutions (accessed on 26 October 2022).
  69. Dojlido, J. Surface Water Chemistry; Economy and Environment: Białystok, Poland, 1995; p. 342. (In Polish) [Google Scholar]
  70. Maleva, M.G.; Nekrasova, G.F.; Bezel’, V.S. The response of hydrophytes to environmental pollution with heavy metals. Russ. J. Ecol. 2004, 35, 230–235. [Google Scholar] [CrossRef]
  71. Tkalec, M.; Prebeg, T.; Roje, V.; Pevalek-Kozlina, B.; Ljubesic, N. Cadmium-induced responses in duckweed Lemna minor L. Acta Physiol. Plant. 2008, 30, 881–890. [Google Scholar] [CrossRef]
  72. Piotrowska, A.; Bajguz, A.; Godlewska-Zyłkiewicz, B.; Zambrzycka, E. Changes in growth, biochemical components, and antioxidant activity in aquatic plant Wolffia arrhiza (Lemnaceae) exposed to cadmium and lead. Arch. Environ. Contam. Toxicol. 2010, 58, 594604. [Google Scholar] [CrossRef]
  73. Balen, B.; Tkalec, M.; Šikić, S.; Tolić, S.; Cvjetko, P.; Pavlica, M.; Vidaković-Cifrek, Ž. Biochemical responses of Lemna minor experimentally exposed to cadmium and zinc. Ecotoxicology 2011, 20, 815–826. [Google Scholar] [CrossRef]
  74. Bianconi, D.; Pietrini, F.; Massacci, A.; Iannelli, M.A. Uptake of Cadmium by Lemna minor, a (hyper?) accumulator plant involved in phytoremediation applications. In Proceedings of the 16th International Conference on Heavy Metals in the Environment, Rome, Italy, 23–27 September 2012; Volume 1, pp. 1–4. [Google Scholar] [CrossRef]
  75. Dhir, B.; Srivastava, S. Heavy metal tolerance in metal hyperaccumulator plant, Salvinia natans. Bull. Environ. Contam. Toxicol. 2013, 1–5. [Google Scholar] [CrossRef]
  76. Pietrini, F.; Bianconi, D.; Massacci, A.; Iannelli, M.A. Combined effects of elevated CO2 and Cd contaminated water on growth, photosynthetic response, Cd accumulation and thiolic components status in Lemna minor L. J. Hazard. Materials 2016, 309, 77–86. [Google Scholar] [CrossRef]
  77. Lu, Q.; Zhang, T.; Zhang, W.; Su, C.; Yang, Y.; Hu, D.; Xu, Q. Alleviation of cadmium toxicity in Lemna minor by exogenous salicylic acid. Ecotoxicol. Environ. Saf. 2018, 147, 500–508. [Google Scholar] [CrossRef]
  78. Ozyigit, I.; Arda, L.; Yalcin, B.; Yalcin, I.E.; Ucar, B.; Hocaoglu-Ozyigit, A. Lemna minor, a hyperaccumulator shows elevated levels of Cd accumulation and genomic template stability in binary application of Cd and Ni: A physiological and genetic approach. Inter. J. Phytoremed. 2021, 1–17. [Google Scholar] [CrossRef]
  79. Nguyen, T.Q.; Sesin, V.; Kisiala, A.; Emery, R.N. Phytohormonal roles in plant responses to heavy metal stress: Implications for using macrophytes in phytoremediation of aquatic ecosystems. Environ. Toxicol. Chem. 2021, 40, 7–22. [Google Scholar] [CrossRef] [PubMed]
  80. Luo, J.-S.; Zhang, Z. Mechanisms of cadmium phytoremediation and detoxification in plants. J. Crop. Prod. 2021, 9, 521–529. [Google Scholar] [CrossRef]
  81. Rasafi, T.E.; Oukarroum, A.; Haddioui, A.; Song, H.; Kwon, E.E.; Nanthi, F.M.; Tack, G.; Sebastian, A.; Prasad, M.N.V.; Rinklebe, J. Cadmium stress in plants: A critical review of the effects, mechanisms, and tolerance strategies. Crit. Rev. Environ. Sci. Technol. 2022, 52, 675–726. [Google Scholar] [CrossRef]
  82. Tran, T.A.; Popova, O.P. Functions and toxicity of cadmium in plants: Recent advances and future prospects. Turk. J. Bot. 2013, 37, 1. [Google Scholar] [CrossRef]
  83. Zahoor, A.; Ahmad, F.; Hameed, M.; Basra, S.M.A. Structural and functional aspects of photosynthetic response in Eichhornia crassipes (Mart.) Solms under cadmium stress. Pak. J. Bot. 2018, 50, 489–493. [Google Scholar]
  84. Kabata-Pendias, A.; Szteka, A. Trace Elements in Abiotic and Biotic Environments; CRC Press: Boca Raton, FL, USA, 2015; ISBN -13. [Google Scholar] [CrossRef]
  85. Mohammed, D.A. Comparative study of the toxicity and phytoextraction capacity of Lemna minor and L. gibba in polluted water by cadmium. Int. J. Plant Animal Env. Sci. 2016, 6, 6–17. [Google Scholar] [CrossRef]
  86. Haider, F.U.; Liqun, C.; Coulter, J.A.; Cheema, S.A.; Wu, J.; Zhang, R.I.; Wenjun, M.; Farooq, M. Cadmium toxicity in plants: Impacts and remediation strategies. Ecotoxicol. Environ. Safety 2021, 211, 111887. [Google Scholar] [CrossRef]
  87. Gałczyńska, M.; Wróbel, J.; Bednarz, K. Sensitivity of Hydrocharis morus-ranae L. to selected metals and its suitability for phytoremediation of waters contaminated with metals. A mesocosm study. J. Water Land Dev. 2022, 55, 1–13. [Google Scholar] [CrossRef]
  88. Jung, M.C. Heavy metal concentration in soils and factors affecting metal uptake by plants in the vicinity of a Korean Cu–W mine. Sensors 2008, 8, 2413–2423. [Google Scholar] [CrossRef] [Green Version]
  89. Kaczyńska, A.; Zajączkowski, M.; Grzybiak, M. Toxicity influence of Cd on plants and humans. Ann. Acad. Med. Gedan. 2015, 45, 65–70. Available online: https://www.researchgate.net/profile/Agata-Kaczynska/publication/295549037_TOKSYCZNY_WPLYW_KADMU_NA_ROSLINY_I_CZLOWIEKA_CADMIUM_TOXICITY_IN_PLANTS_AND_HUMANS/links/56cb549a08ae1106370b854e/TOKSYCZNY-WPLYW-KADMU-NA-ROSLINY-I-CZLOWIEKA-CADMIUM-TOXICITY-IN-PLANTS-AND-HUMANS.pdf (accessed on 28 November 2022). (In Polish).
  90. Skwierawski, A.; Skwierawska, M. The role of Hydrocharitetum morsus-ranae in shaping the chemical composition of surface waters. Pol. J. Environ. Stud. 2013, 22, 1825–1833. [Google Scholar]
  91. Polechońska, L.; Samecka-Cymerman, A.; Dambiec, M. Changes in growth rate and macroelement and trace element accumulation in Hydrocharis morsus-ranae L. during the growing season in relation to environmental contamination. Environ. Sci. Pollut. Res. 2017, 24, 5439–5451. [Google Scholar] [CrossRef] [PubMed]
  92. Badra, R.; Panda, J.; Sahoo, S. A study on water quality and macrophyte diversity in three wetlands of Sambalpur District, Odisha from ecosystem management perspective. Eco. Env. Cons. 2022, 28, 1395–1403. [Google Scholar] [CrossRef]
  93. Borišev, M.; Pajević, S.; Stanković, Ž.; Krstić, B. Macrophytes as phytoindicators and Potential Phytoremediators in Aquatic Ecosystems. In Proceedings of the 36th International Conference of IAD, Austrian Committee Danube Research/IAD, Vienna, Austria, 4–8 September 2006; pp. 76–80. Available online: https://www.oen-iad.org/conference/docs/3_macrophytes/borisev_et_al.pdf (accessed on 18 October 2022).
  94. Babovic, N.; Drazic, G.; Djordjevic, A.; Mihailovic, N. Heavy and Toxic metal Accumulation in Six Macrophyte Species from Fish pond Ecka, Republic of Serbita, BALWOIS Ohrid, Republic of Macedonia. 2010. Available online: https://balwois.com/wp-content/uploads/old_proc/ffp-1452.pdf. (accessed on 18 October 2022).
  95. Bilyk, T.; Shylo, O.; Karpova, G.; Chumanova, O. Accumulation of heavy metals by higher aquatic vegetation of artificial canals. Proc. Natl. Aviat. Univ. 2014, 59, 125–130. Available online: https://jrnl.nau.edu.ua/index.php/visnik/article/view/6821/7634 (accessed on 18 October 2022). [CrossRef]
  96. Polechońska, L.; Samecka-Cymerman, A. The effect of environmental contamination on the decomposition of european frog-bit (Hydrocharis morsus-ranae L.) in natural conditions. Aquatic Bot. 2015, 127, 35–43. [Google Scholar] [CrossRef]
  97. Brooks, R.R.; Robinson, B.H. Aquatic phytoremediation by accumulator plants. In In Plants that Hyperaccumulate Heavy Metals: Their Roles in Phytoremediation, Microbiology, Archaeology, Mineral Exploration and Phytomining; Brooks, R.R., Ed.; CAB International: New York, NY, USA, 1998; pp. 203–226. [Google Scholar]
  98. Kabata-Pendias, A. Trace Elements in Soils and Plants, 4th ed.; CRC Press: Boca Raton, NY, USA, 2011; p. 528. [Google Scholar] [CrossRef]
  99. Lewin, I.; Szoszkiewicz, K. Drivers of macrophyte development in rivers in an agricultural area: Indicative species reactions. Cent. Eur. J. Biol. 2012, 7, 731–740. [Google Scholar] [CrossRef] [Green Version]
  100. Shafaqat, A.; Abbas, Z.; Rizwan, M.; Zaheer, I.E.; Yava¸s, I.; Ünay, A.; Abdel-Daim, M.M.; Bin-Jumah, M.; Hasanuzzaman, M.; Kalderis, D. Application of floating aquatic plants in phytoremediation of heavy metals polluted water: A review. Sustainability 2020, 12, 1927. [Google Scholar] [CrossRef] [Green Version]
  101. Shuvaeva, O.V.; Belchenko, L.A.; Romanova, T.E. Studies on cadmium accumulation by some selected floating macrophytes. Int. J. Phytoremediat. 2013, 15, 979–990. [Google Scholar] [CrossRef]
  102. Aurangzeb, N.; Nisa, S.; Bibi, Y.; Javed, F.; Hussain, F. Phytoremediation potential of aquatic herbs from steel foundry effluent. Braz. J. Chem. Eng. 2014, 31, 881–886. [Google Scholar] [CrossRef] [Green Version]
  103. Fazal, S.; Zhang, B.; Mehmood, Q. Biological treatment of combined industrial wastewater. Ecol. Eng. 2015, 84, 551–558. [Google Scholar] [CrossRef]
  104. Sekomo, C.B.; Kagisha, V.; Rousseau, D.; Lens, P. Heavy metal removal by combining anaerobic upflow packed bed reactors with water hyacinth ponds. Environ. Technol. 2012, 33, 1455–1464. [Google Scholar] [CrossRef] [PubMed]
  105. Lu, Q.; He, Z.L.; Graetz, D.A.; Stoffella, P.J.; Yang, X. Uptake and distribution of metals by water lettuce (Pistia stratiotes L.). Environ. Sci. Pollut. Res. 2011, 18, 978–986. [Google Scholar] [CrossRef] [PubMed]
  106. Lakra, K.C.; Lal, B.; Banerjee, T. Decontamination of coal mine effluent generated at the Rajrappa coal mine using phytoremediation technology. Int. J. Phytoremediat. 2017, 19, 530–536. [Google Scholar] [CrossRef] [PubMed]
  107. Chaudhuri, D.; Majumder, A.; Misra, A.K.; Bandyopadhyay, K. Cadmium removal by Lemna minor and Spirodela polyrhiza. Int. J. Phytoremediat. 2014, 16, 1119–1132. [Google Scholar] [CrossRef] [PubMed]
  108. Bokhari, S.H.; Ahmad, I.; Mahmood-Ul-Hassan, M.; Mohammad, A. Phytoremediation potential of Lemna minor L. for heavy metals. Int. J. Phytoremediat. 2016, 18, 25–32. [Google Scholar] [CrossRef] [PubMed]
  109. Verma, R.; Suthar, S. Lead and cadmium removal from water using duckweed—Lemna gibba L.: Impact of pH and initial metal load. Alexander Eng. J. 2015, 54, 1297–1304. [Google Scholar] [CrossRef]
Figure 1. Scheme of the experiment with a European frogbit (a) a 3-week exposure of the plants to the Cd solution (I term); (b) a 6-week exposure of the plants to the Cd solution (II term); four replications in each from three growing seasons, Σ12 replications.
Applsci 13 01197 g001
Figure 2. The indicator of cadmium contamination in water in the three tested growing seasons. Similar letter indicates no significant difference (p ≤ 0.05).
Applsci 13 01197 g002
Figure 3. The indicator of cadmium contamination in Hydrocharis morsus-ranae in the three tested growing seasons. Similar letter indicates no significant difference (p ≤ 0.05).
Applsci 13 01197 g003
Figure 4. The cadmium uptake efficiency index by Hydrocharis morsus-ranae in the three tested growing seasons. Similar letter indicates no significant difference (p ≤ 0.05).
Applsci 13 01197 g004
Figure 5. The tolerance index of Hydrocharis morsus-ranae in the three tested growing seasons. Similar letter indicates no significant difference (p ≤ 0.05).
Applsci 13 01197 g005
Table 1. The concentration of cadmium in water [µgCd·dm−3] in the three tested growing seasons.
ConditionsHeavy Metal (HM)
PNK LevelTerm0Cd
AverageStandard ErrorAverageStandard Error
lowI2.7 d0.052.9 d0.07
II2.8 d0.0837.6 a0.84
highI2.4 d0.1123.5 c0.26
II3.5 d0.1225.7 b0.62
HM, PNK level, Term—statistically significant; Growing season—statistically insignificant; LSD0.05 (Least Significant Difference) for interaction HM and PNK level and Term = 1.6 (F = 975.42; p = 0.000000). Similar letter indicates no significant difference (p ≤ 0.05).
Table 2. The content of cadmium in Hydrocharis morsus-ranae (µg Cd·g−1 d.w.) in the three tested growing seasons.
ConditionsHeavy Metal (HM)
PNK LevelTerm0Cd
AverageStandard ErrorAverageStandard Error
lowI2.6 d0.0636.7 a0.74
II2.7 d0.0731.8 b0.63
highI2.0 d0.0228.2 c0.74
II2.6 d0.0629.3 c0.54
HM, PNK level, Term—statistically significant; Growing season—statistically insignificant; LSD0.05 (Least Significant Difference) for interaction PNK level and Term and HM = 1.8 (F = 25.72; p = 0.000003). Similar letter indicates no significant difference (p ≤ 0.05).
Table 3. The linear correlation between the cadmium concentration in water (µg Cd·dm−3) and the cadmium content in Hydrocharis morsus-ranae (µg Cd·g−1 d.w.) in the three tested growing seasons.
ConditionsLinear Correlation
PNK LevelTermEquationRegression Coefficient IProbability (p)Value of Correlation
lowICp = 18.58 + 6233.1 × Cwr = 0.5536p = 0.0619-
IICp = 6.28 + 678.1 × Cwr = 0.9013p = 6 × 10⁻⁵very high
highICp = −18.22 + 1977.7 × Cwr = 0.6876p = 0.0135high
IICp = 22.13 + 279.9 × Cwr = 0.3168p = 0.3158-
Cw = Cd concentration in water; Cp = Cd content in Hydrocharis morsus-ranae.
Table 4. The accumulation of cadmium n Hydrocharis morsus-ranae (µg Cd) in the three tested growing seasons.
ConditionsHeavy Metal (HM)
PNK LevelTerm0Cd
AverageStandard ErrorAverageStandard Error
lowI17.2 d0.23222.8a1.08
II17.3 d0.15151.7c1.42
highI17.7 d0.14180.4b1.03
II15.1 d0.19178.7b1.34
HM, PNK level, Term—statistically significant; Growing season—statistically insignificant; LSD0.05 (Least Significant Difference) for interaction PNK level and Term and HM = 3.06 (F = 1394.8; p = 0.000000). Similar letter indicates no significant difference (p ≤ 0.05).
Table 5. The fresh weigh of Hydrocharis morsus-ranae (g) in the three tested growing seasons.
ConditionsHeavy Metal (HM)
PNK LevelTerm0Cd
AverageStandard ErrorAverageStandard Error
lowI19.9 b0.3818.1 cd0.34
II18.9 bc0.4314.3 e0.37
highI25.8 a0.3519.1 bc0.43
II17.3 d0.4618.2 cd0.38
HM, PNK level, Term, Growing season—statistically significant; LSD0.05 (Least Significant Difference) for interaction PNK level and Term and HM = 1.53 (F = 116.32; p = 0.000000). Similar letter indicates no significant difference (p ≤ 0.05).
Table 6. The numer of Hydrocharis morsus-ranae rosette in the three tested growing seasons.
ConditionsHeavy Metal (HM)
PNK LevelTerm0Cd
AverageStandard ErrorAverageStandard Error
lowI15.0 b0.613.3 cd0.7
II14.3 bc0.410.0 e1.0
highI20.6 a0.815.4 b1.3
II12.1 d1.313.8 bcd0.6
HM, PNK level, Term, Growing season—statistically significant; LSD0.05 (Least Significant Difference) for interaction PNK level and Term and HM = 1.70 (F = 76.77; p = 0.000000). Similar letter indicates no significant difference (p ≤ 0.05).
Table 7. The content of dissolved oxygen in water (mg·dm−3) in the three tested growing seasons.
ConditionsHeavy Metal (HM)
PNK LevelTerm0Cd
AverageStandard ErrorAverageStandard Error
lowI4.14 b0.164.71 a0.09
II2.83 f0.213.40 de0.29
highI3.68 c0.063.55 cd0.06
II3.00 f0.353.29 e0.34
HM, PNK level, Term, Growing season—statistically significant; LSD0.05 (Least Significant Difference) for interaction PNK level and Term and HM = 0.18 (F = 13.0; p = 0.000570). Similar letter indicates no significant difference (p ≤ 0.05).
Table 8. The reaction (pH) of water in the three tested growing seasons.
ConditionsHeavy Metal (HM)
PNK LevelTerm0Cd
AverageStandard ErrorAverageStandard Error
lowI7.11 d0.057.03 e0.03
II7.34 bc0.027.40 a0.02
highI7.10 d0.027.39 ab0.07
II7.36 abc0.057.31 c0.03
HM, PNK level, Term, Growing season—statistically significant; LSD0.05 (Least Significant Difference) for interaction PNK level and Term and HM = 0.05 (F = 127.0; p = 0.000000). Similar letter indicates no significant difference (p ≤ 0.05).
Table 9. The electrolytic conductivity in water (µg·cm−1) in the three tested growing seasons.
ConditionsHeavy Metal (HM)
PNK LevelTerm0Cd
AverageStandard ErrorAverageStandard Error
lowI168.2 f1.1169.9 e1.0
II193.9 b0.6195.1 b0.5
highI176.8 c0.5174.7 d0.7
II202.0 a0.8201.7 a0.6
PNK level, Term, and Growing season—statistically significant; HM—statistically insignificant; LSD0.05 (Least Significant Difference) for interaction PNK level and Term and HM = 1.33 (F = 9.0; p = 0.004324). Similar letter indicates no significant difference (p ≤ 0.05).
Table 10. The linear correlation between pH in water and content of cadmium (µg Cd·g−1 d.w.) in Hydrocharis morsus-ranae (g) in the three tested growing seasons.
ConditionsLinear Correlation
PNK LevelTermEquationRegression Coefficient (r)Probability (p)Value of Correlation
lowICp = 128.6 − 13.1 × pHr = -0.5888p = 0.0440moderate
IICp = −74.1 + 14.3 × pHr = 0.5589p = 0.0589-
highICp = −24.5 + 7.1 × pHr = 0.6670p = 0.0178high
IICp = −61.1 + 12.4 × pHr = 0.6486p = 0.0225high
Cp = Cd content in Hydrocharis morsus-ranae.
Table 11. The linear correlation between pH in water and dry weight of Hydrocharis morsus-ranae (g) in the three tested growing seasons.
ConditionsLinear Correlation
PNK LevelTermEquation
Regression Coefficient (r)Probability (p)Value of Correlation
lowId.w. = −4.7 − 1.53 × pHr = 0.4507p = 0.1414-
IId.w. = 29.7 − 3.4 × pHr = −0.6621p = 0.0190high
highId.w. = 16.3 − 1.3 × pHr = −0.6293p = 0.0283high
IId.w. = 31.3 − 12.4 × pHr = −0.7621p = 0.0040high
d.w. = dry weight.
Table 12. The linear correlation between EC (µg·dm−3) in water and dry weight of Hydrocharis morsus-ranae (g) in the three tested growing seasons.
ConditionsLinear Correlation
PNK LevelTermEquationRegression Coefficient (r)Probability (p)Value of Correlation
lowId.w. = 19.98 − 0.08 × ECr = −0.7339p = 0.0066high
IId.w. = 27.48 − 0.13 × ECr = −0.4767p = 0.1171-
highId.w. = 27.02 − 0.12 × ECr = −0.5280p = 0.0777-
IId.w. = 20.62 − 0.07 × ECr = −0.3426p = 0.2757-
d.w. = dry weigh; EC = electrolytic conductivity.
Table 13. Cadmium accumulation potential of various pleustofity.
Plant SpeciesCd FormCd LevelDuration
(Days)
NutrientContent of Cd in PlantsReference
Wolffia arrhizaCd(NO3)21; 10; 100; 1000 μM7; 14medium—dilution to 1/50 Hutner’s media7 days: 1.0 Cd level = 0.004 mg·g−1 fresh weight; 10.0 = 0.038; 100.0 = 0.055; 1000.0 = 0.083;
14 days: 1.0 Cd level = 0.004 mg·g−1 fresh weight; 10.0 = 0.046; 100.0 = 0.076; 1000.0 = 0.107
[72]
Eichhornia crassipesCd(NO3)20; 130
μg dm−3
5medium5 days: 0.0 Cd level = 0.3 mg·kg−1 of d.w.; 130 = 31[101]
Hydrocharis morsus-ranae3CdSO4·8H2O0.0; 0.1 mg dm−321; 42low NPK
PO43−: 0.54 mg·dm−3, NO3: 7.14, NH4+: 0.22, K+: 4.56;
high NKP
PO43−: 2.73 mg·dm−3, NO3: 36.7, NH4+: 1.12, K+: 22.8
low NPK
21 days: 0.0 Cd level = 2.6 µg·g−1 d.w.; 0.1 = 36.7; 42 days: 0.0 = 2.7; 0.1 = 31.8;
high NKP
21 days: 0.0 Cd level = 2.0 µg·g−1 d.w.; 0.1 = 28.2; 42 days: 0.0 = 2.6; 0.1 = 29.3
Present study
Table 14. Cadmium efficiency of removal of various lemnides.
Plant SpeciesCd FormCd LevelDuration
(Days)
NutrientEfficiency of Removal (%)Reference
Eichhornia crassipesno information (n.i.)0.0279 ± 0.02330n.i.82.8[102]
n.i.0.25 mg dm−32156.2 mg PO4 dm−3, 27.2 mg NO3 dm−3, 52.6 mg NH4 mg dm−3, 8.6 mg K dm−397.5[103]
Cd(NO3)2·4H2O5, 10 mg dm−31300.5 K2HPO4 g L−1, 0.2 NH4Cl97.3[104]
Pistia stratioidesn.i.<LOD60I pond: 0.29 P-PO43− mg dm−3
0.06 N-NO3; 0.25 N-NH4+; 7.8 K
II pond: 0.66 P-PO43− mg/l
0.18 N-NO3; 0.51 N-NH4+; 3.9 K
50[105]
n.i.0.0279 ± 0.02330n.i.about 50[102]
Salvinia molestan.i1.2 ± 0.072a mg dm−310K 31.43 mg dm−380.99[106]
Lemna minorCdCl2·H2O0,5; 1.0; 1.5; 2.0; 2.5; 3.0 mg dm−32, 5, 10, 15, 22PO4 < 0.05 mg dm−3
NO3 2.53 mg dm−3
K 39.0 mg dm−3
42–78[107]
n.iIndustrial sewage
0.038 mg dm−3
Municipal sewage
0.054 mg dm−3
3, 10, 17, 24, 31industrial sewage: PO4 5.5 mg dm−3, NO3 2.3 mg dm−3, K 24 mg dm−3
municipal sewage: PO4 10 mg dm−3, NO3 10 mg dm−3, K 24 mg dm−3
94.7–94.3[108]
Lemna gibba3CdSO4
8H2O
2; 5; 10
mg dm−3
10mg dm−3: KNO3: 1515.0-, KH2PO4: 680.0, Ca(NO3)2·4H2O: 1180.041.6–84.8[109]
Spirodela polyrhizaCdCl2·H2O0,5; 1.0; 1.5; 2.0; 2.5; 3.0 mg dm−32, 5, 10, 15, 22PO4 < 0.05 mg dm−3
NO3 2.53 mg dm−3
K 39.0 mg dm−3
52–75[107]
LOD—limit of detection.
Table 15. Cadmium removal in sequential biosorption stations of various pleusophyte species.
Initial Concentration of Cd (mg dm−3)Aquatic PlantsDuration DaysEfficiency of Removal Cd (%)Final Concentration of Cd
(mg dm−3)
5.00Eichhornia crassipes13097.50.25
0.25Lemna minor15–2242–780.10
0.10Hydrocharis morsus-ranae2180–1000.00–0.02
Disclaimer/Publisher’s Note: The statements, opinions and data contained in all publications are solely those of the individual author(s) and contributor(s) and not of MDPI and/or the editor(s). MDPI and/or the editor(s) disclaim responsibility for any injury to people or property resulting from any ideas, methods, instructions or products referred to in the content.

