Article

Air Quality Versus Perceived Comfort and Health in Office Buildings at Western Macedonia Area, Greece during the Pandemic Period

1
Department of Mechanical Engineering, Polytechnic School Campus, University of Western Macedonia, Active Urban Planning Zone (ZEP), 50100 Kozani, Greece
2
Atmospheric Chemistry & Innovative Technologies Laboratory, Institute of Nuclear & Radiological Sciences & Technology, Energy & Safety, National Centre for Scientific Research “Demokritos”, 15310 Agia Paraskevi, Greece
*
Author to whom correspondence should be addressed.
Appl. Sci. 2023, 13(2), 1137; https://doi.org/10.3390/app13021137
Submission received: 20 December 2022 / Revised: 4 January 2023 / Accepted: 12 January 2023 / Published: 14 January 2023
(This article belongs to the Special Issue Indoor Environment Quality and Environmental Comfort)

Abstract

:
This study investigated the indoor environment quality (IEQ) of eight office buildings of interest due to: (a) their location at the region of Western Macedonia, Greece, which is an area characterized by aggravated air quality and is currently in a transition phase because of changes in the energy production strategy to reduce the use of lignite as an energy fuel; and (b) the survey’s timing, characterized by new working conditions implemented during the COVID-19 pandemic period. In-site measurements were performed to identify the indoor air pollutants to which the occupants were exposed, while questionnaires were collected regarding the participants’ perception of the working environment conditions, indoor air quality, and health symptoms. The statistical analysis results showed that the most-reported health symptoms were headache, dry eyes, and sneezing. The acceptance of new working conditions showed a significant correlation with their overall comfort and health perception. Occupants in offices with higher pollutant concentrations, such as NO2, benzene and toluene, were more likely to report health symptoms. The evaluation of the plausible health risks for the occupants of the buildings with carcinogenic and no-cancer models showed that health problems could exist despite low pollutant concentration levels.

1. Introduction

Due to the economic growth of the last decades and the industrialization of goods production, more and more new occupations, mainly associated with office-type activities, have been created. The percentage of people who work in office buildings, and also the amounts of time spent indoors, have increased. Nowadays, more than 90% of people’s lifetime is spent indoors (residential and working environment, public buildings etc.) [1]. As a consequence, the reported health problems and symptoms associated with indoor air quality (IAQ) [2], have attracted attention worldwide, especially since the COVID-19 outbreak [3]. Thus, there has been an increasing interest in understanding the impact of the built environment on the human occupants in terms of their health and well-being [4].
The quality of the indoor environment is determined by a set of factors such as temperature, humidity, levels of air pollutants, noise, lighting and ventilation conditions [5,6,7]. The way that the occupants of a building perceive this set of factors i.e., perceived air quality, is linked to their sense of comfort in the workplace and productivity as well as to the way that these factors affect their health. Mujan et al., reported, through a literature review study, that the four key factors influencing occupant comfort in an indoor built environment (i.e., thermal comfort, indoor air quality and ventilation, visual comfort and acoustic comfort) have the greatest impact on the health, comfort, and productivity of occupants in office and residential buildings [8]. Yet, the establishment of this connection remains complex and difficult to determine [9,10], especially now that office occupants face new commuting and working conditions, such as adopting to work at home, during and after the COVID-19 pandemic. As Awada et al. highlighted, it is important to understand how parameters that drive indoor environment quality (IEQ) can be designed appropriately and how buildings can be operated to provide ideal IEQ for safe health, especially during the pandemic period [11]. After the COVID-19 outbreak [12], and due to the highly contagious nature of the disease [13], governments decided to implement “social distancing” measures, by closing businesses and enacting stay-at-home. Furthermore, several occupational health problems started to be reported by “working-from-home workers” [14] and as a result, more and more people have preferred to return to office building environments.
The recent pandemic has underlined the imperative need for characterizing air quality in any indoor microenvironment, especially that of office spaces, where people gradually return to work, in order to estimate human exposure to hazardous air pollutants. IAQ is immensely determined by the exchange of the air between indoor and outdoor environment as well as the contribution of outdoor (e.g., traffic, combustion) and indoor air pollution sources (e.g., emissions from occupant activities, building construction materials, consumer products and electronic devices). Exposure to indoor air pollutants in office environments, even in low concentrations, can affect occupants’ health [15]. Furthermore, there is an increasing concern regarding the use of both consumer products and electronic devices (e.g., cleaning products, computers, printing equipment), which might substantially contribute as emission sources to the accumulation of contaminants in office environments [16]. Furthermore, as reported in a large European study in offices (On the reduction of health eFFects from Combined exposure to Indoor AIr pollutants in modeRn offices, the OFFICAIR project [17]), the dominant source of pollutants was attributed to the ingress of outdoor air into indoor environments. The other most relevant sources for variance were directly or indirectly associated with building materials, such as flooring materials (mainly carpets), wood-based products and various types of paint [18]. Hence, outdoor air may be accountable for indoor air quality and indoor air pollutant concentrations may be attributable by up to 80% from the outdoor environment, following the trend of outdoor concentrations to a lesser extent [19,20]. Other parameters, such as location, activities in the wider area and the way the building is ventilated, can be quite important factors influencing indoor pollution.
Moreover, exposure to volatile organic compounds (VOCs) and particulate matter (PM) can contribute to the appearance of health symptoms [21]. Consumer products are known to be a source of air pollutants, and several studies have shown that airway effects (e.g., asthma, rhinitis) can be associated with the use of household cleaning products both in cleaning personnel and non-professional users [22,23]. Furthermore, ozone-initiated reactions of VOCs, such as terpenes and terpenoids included in the cleaning product composition [24], can lead to secondary air pollutants generation indoors [25]. According to the indoor quality and occurrence of health symptoms study by Takigawa et al., the onset of health symptoms for building users can be attributed in part to concentrations of aldehydes and benzene [26]. Furthermore, exposure to high concentrations of PM2.5 can lead to cardiovascular and respiratory health problems [27]. In addition to the above, occupancy is also a crucial parameter affecting IAQ. High occupancy can lead to high levels of CO2 concentration [28] as well as to the increase of VOCs due to secondary reactions between ozone and constituents of skin lipids [29,30].
Given the fact that the outdoor environment affects indoor air pollutants levels, investigations of buildings located in areas with aggravated air quality, are of particular interest. As reported in the Guide to Indoor Air Quality for Office Building Occupants (EPA, 2021), the outdoor air quality is relevant since outdoor air pollutants (such as carbon monoxide, pollen, and dust) may affect indoor conditions when outside air is taken into the building’s ventilation system. For many years, the western Macedonia region, located in northern Greece, has been considered to be the main energy production area, characterized by the presence of major coal-fired (lignite) electrical power production units. Inconsequence, the outdoor air quality has been affected by this activity [31] and could be a crucial factor for buildings occupants’ perception of both IEQ and health symptoms. Several studies have been carried out demonstrating the levels of atmospheric pollution in the area of the Kozani-Ptolemais basin and the impact of power plants on the environment [32,33]. Recently, the whole area is in a transition phase due to changes in the energy production strategy aimed at reducing the use of lignite as energy fuel and setting off the operation of several electricity plants.
This study aimed to investigate the perceived IEQ and comfort, as well as the perceived health symptoms, of occupants working in eight offices located in western Macedonia, Greece. Moreover, it attempted to identify the underlying connection between occupants’ perception with IAQ and estimate the health risk for a long period exposure. For the scope of the study, measurements of major indoor air pollutants and recording of occupants’ IEQ and health perception on questionnaires were simultaneously performed. To the best of our knowledge, this is the first study to focus on the aspects of (a) the region of western Macedonia, characterized by aggravated air quality while in a transition phase due to changes in energy production strategy aimed at reducing the use of lignite as energy fuel; and (b) the survey’s timing, characterized by new working conditions during the COVID-19 pandemic period.

2. Materials and Methods

2.1. Sampling Sites

In the present study, eight office buildings located in western Macedonia area were selected for investigation. western Macedonia region (northern Greece) is a large intensively exploited area where the most Greek lignite deposits are located at Florina-Ptolemais-Kozani basin (Figure 1), along with open-cast mines feeding the nearby lignite-fired power stations. The aggravated air pollution in the area comprises a crucial factor affecting indoor air quality and office occupants’ wellbeing. Therefore, specific office buildings located in two major cities in the area were selected, six in Kozani and two in Ptolemaida (Figure 1), covering a variety of characteristics such as: year of construction, location (city center/suburban), activities (university, public sector, construction company), and types of ventilation (natural vs. mechanical).
The monitoring period was from 1 September to 30 October 2021, on a rolling weekly schedule. The investigation per building lasted five weekdays from Monday morning to Friday afternoon. Taking into consideration that in Greece, the first lockdown periods started in early 2020 and that teleworking was widely applied until mid-2021, the selected period was the most suitable for this study where employees were back in their offices while COVID-19 countermeasures still applied.

2.2. Questionnaire Study

A questionnaire was delivered online to the occupants who were working in the investigated part of the buildings during the monitoring week, and included personal data, work data, psychosocial environment/characteristics, physical effects (IAQ perception, comfort and health related symptoms). The questionnaire was also used in our previous studies [6,21,34] and the detailed description is mentioned elsewhere [35]. More specifically, occupants were asked to evaluate aspects of IEQ, such as the overall comfort, temperature (overall, too hot/cold, variation), air movement, air quality (overall air quality satisfaction, humid or dry air, stuffy or fresh air, odor), light (overall light satisfaction, natural, artificial, glare), noise (overall noise satisfaction, outside noise, noise from building systems, noise within the building), vibration, amount of privacy, office layout, office decoration, and view from the windows in a 7-point scale from “1, dissatisfied” to “7, satisfied”). Regarding their control perception of the IEQ, occupants were asked to evaluate five controlling parameters: temperature, ventilation, shade from the sun, light and noise from “1, not at all” to “7, full control”, and then they reported the “exercise control” [36,37] to determine how many times they had the ability to use the available control types that were installed in their offices (if applicable). The questionnaire asked for the following symptom groups: eye irritation (dry eyes, watering or itchy eyes, burning or irritated eyes), respiratory (runny nose, blocked or stuffy nose, dry/irritated throat, cough, sneezing, wheezing, chest tightness, phlegm/mucus or breathing difficulty), heart (tachycardia, irregular heartbeats, bradycardia), skin (dry skin, rash, or irritated skin), and general symptoms (headache, lethargy, unusual tiredness, flu-like symptoms). An extra, final, part consisted of a set of questions related to the occupant’s opinion on the COVID-19 pandemic countermeasures which were implemented in office environments. Furthermore, occupants were asked to evaluate their perception concerning the IEQ before the lock-down period.
The study was anonymous, and the participants gave their consent prior to participation. The study was approved by the UOWM’s (University of Western Macedonia) ethics committee. Occupants in offices, in which IAQ measurements were in progress, were invited to complete the questionnaire. When answering the questionnaire, occupants were not informed about the results of the measurements.

2.3. IAQ Measurements

Chemical and physical measurements at two locations per building (one indoor and one outdoor) were carried out continuously for five working days (Monday to Friday) in a representative office room. The indoor air pollutants measured in the buildings were chosen based on their potential association with health effects [15], and were: ozone (O3), nitrogen dioxide (NO2), sodium dioxide (SO2), aldehydes (formaldehyde, acetaldehyde, acetone, propionaldehyde, 2-butanone, benzaldehyde, and hexaldehyde), and VOCs (benzene, toluene, ethylbenzene, p,m-xylene, o-xylene, 1,2,4-TBM, a-pinene and d-limonene). The indoor sampling sites were selected according to ISO 16000-1 [38]. In all cases, the samplers and equipment did not disturb the normal use of the office rooms and were tampered with by occupants. The air diffusive samplers were placed in the center of each room, at least 1 m away from the wall, at the height of the breathing zone of seated occupants. Ventilation channels and heating sources, including the sun, were avoided. Any material that may have emitted any chemical pollutants was also strictly avoided during the placement of the samplers. Outdoor passive sampling units and monitors were mounted in a protective shelter in order to be protected by direct sunlight, precipitation, and human interactions. Before and after sampling, the passive samplers were stored in a refrigerator (<4 °C). For each pollutant sample, one non-exposed and non-transported on-site sampler per purchased package (i.e., a lot blank) was analyzed. In addition, one field blank per chemical parameter was used in each office room. The monitoring of VOCs, aldehydes, O3, NO2, was carried out with the use of Radiello passive samplers. VOCs were chemically desorbed by the passive samplers with CS2. Analysis of the VOCs follow the ISO 16017-2 [39] and was performed at GC-FID Agilent Technology 6890N using 2-fluorotoluene as the internal standard. Aldehydes were desorbed with HPLC grade acetonitrile by the passive samplers and analysis was performed at Agilent HLPC 1100 Series under the ISO 16000-4 [40]. For the chromatographic analysis methods of VOCs and aldehydes, the limits of detection (LODs) were defined as three times the signal-to-noise ratio (3:1). The limits of quantification (LOQs) were defined as 10 times the signal-to-noise ratio (10:1). The aqueous extracts of NO2 and the 3-methyl-2-benzothiazolinone hydrazone hydrocloride (MBTH) extracts of O3 from the passive samplers were analyzed with UV-VIS spectrophotometry, using a RAYLEIGH UV-1601 spectrophotometer. The VOC, aldehyde, O3, and NO2 concentrations were all expressed in μg/m3 after adjustment of the sampling rates on temperature and subtraction of the corresponding field blank value. An optical light scattering spectrometer (Grimm1.108) was used for measuring simultaneously PM2.5 and PM10 fractions.

2.4. Statistical Analysis

In this study, the statistical analysis of the measured data was performed by using IBM SPSSv.22. A combined database was created from the collected questionnaire data and the IAQ measurements, by assigning each occupant’s questionnaire to the respective indoor concentrations data (using the building and office code). As a first step, descriptive results about the survey, symptom prevalence, and pollutant concentrations were obtained. For identifying the potential associations between the IEQ parameters and the overall comfort, proportional odds ordinal logistic regression analysis was used, and results were expressed in odds ratios (OR). The Spearman correlation coefficient, a non-parametric measure of statistical dependence, was used to identify relations between the rankings of two variables. The Wilcoxon test, a non-parametric statistical hypothesis test, was used to compare the populations of two paired samples and Mann–Whitney U test was used to reveal the pollutant concentration variations among several Sick Building Syndrome (SBS) groups.

2.5. Health Risk Assessment (Methodological Approach)

The aim of chronic health risk assessment is to evaluate chronic effects of known hazardous compounds. In this work, two approaches were applied with the scope of estimating the impact of IAQ on the staff’s health: (a) the non-carcinogenic health risk assessment model, and (b) the cancer-risk assessment model.
The non-carcinogenic health risk was assessed utilizing the hazard quotient (HQ) for formaldehyde and benzene according to the Office of Environmental Health Hazard Assessment (OEHHA) [41] and the following equation was applied:
H Q = C A R E L
where CA is the contaminant’s concentration and REL is the inhalation chronic reference limit (RELHCHO = 9 μg/m3 according to the International Agency for Research on Cancer and RELbenzene = 3 μg/m3 [42]. Acceptable values for HQ are lower than unity, while the greater the HQ value the higher the probability of developing non-cancer effects on humans.
For the cancer risk assessment due to inhalation exposure, the lifetime cancer risk (LCR) value was calculated taking into consideration the cancer potency factor (CPF) and the chronic daily air intake (CDI) by the formula:
and L C R = C D I * C P F
The general approach of EPA [43] concerning the computation of chronic daily air Intake (CDI) in mg∙kg−1∙day−1 was used for the inhalation exposure estimation, by applying the following equation:
C D I = C A · IR · ET · EF · ED B W · AT
where CA is the chemical’s concentration in the air (mg/m3), IR is the inhalation rate (m3/h), BW is the average participants’ body weight, calculated per building (kg), ET is the exposure time (h/day), EF is the exposure frequency (days/year), ED is the exposure duration (years) and AT is the averaging time (period over which exposure is averaged) in days. ET factor was set to 8 h/day, the EF was set to 236 days considering only working days within the week and 25 days for vacation and ED was set to 30 years, average working years in Greece. AT is assumed to be 70 years for a lifetime risk assessment. EPA recommended values for inhalation rates concerning adults aged 30 to 60 years for light intensity activity were assumed. Cancer risk attributed to a specific pollutant is computed by multiplying the CDI with the pollutant’s relevant potency factor. In this study, cancer risk was estimated for benzene and formaldehyde, two compounds classified as human carcinogens according to [1]. The potency factor was set to 0.029 mg∙kg−1∙day−1 and 0.045 mg∙kg−1∙day−1 for benzene [44,45] and formaldehyde [43] respectively. The cancer risk (LCR) value below 10−6–10−4 is considered acceptable [46,47,48,49], whereas 10−6 is considered the most tolerable risk. As a final step, the cancer risk of each pollutant was converted to “chances per million”
(Total Cancer Risk) (1 × 10⁶) = Total Cancer Risk in chances per million

3. Results and Discussion

3.1. Participation, Characteristics of the Study Population

The total number of submitted questionnaires was 134 out of the approximately 265 invited occupants (response rate 51%). The response rate per building ranged from 33% to 73%. Table 1 presents the type of activities in each building and the corresponding response rate. Twenty-five percent of the buildings were located in urban areas, 50% in suburban and 25% in the city center. Regarding the ventilation method, 25% were mechanically ventilated and the rest of them were naturally ventilated.
From the total sample, 37% and 63% of the occupants were men and women, respectively. The mean age of respondents was 44.5 (±9.8) years old (range 21–64) and up to 96% had a graduate or postgraduate education. Concerning lifestyle, 27% were smokers, 49% consumed alcohol, and respondents worked out 2.1 h per week on average. Regarding the medical history of the participants, the most frequent reported responses were allergy (23%), anxiety (19%) and high lipids in the blood (19%) (Figure 2). Most of the office occupants described their work type as “Clerical-secretarial” (68.2%), followed by the “professional” (22.7%) and the “managerial” group (9.1%).

3.2. Questionnaire Results

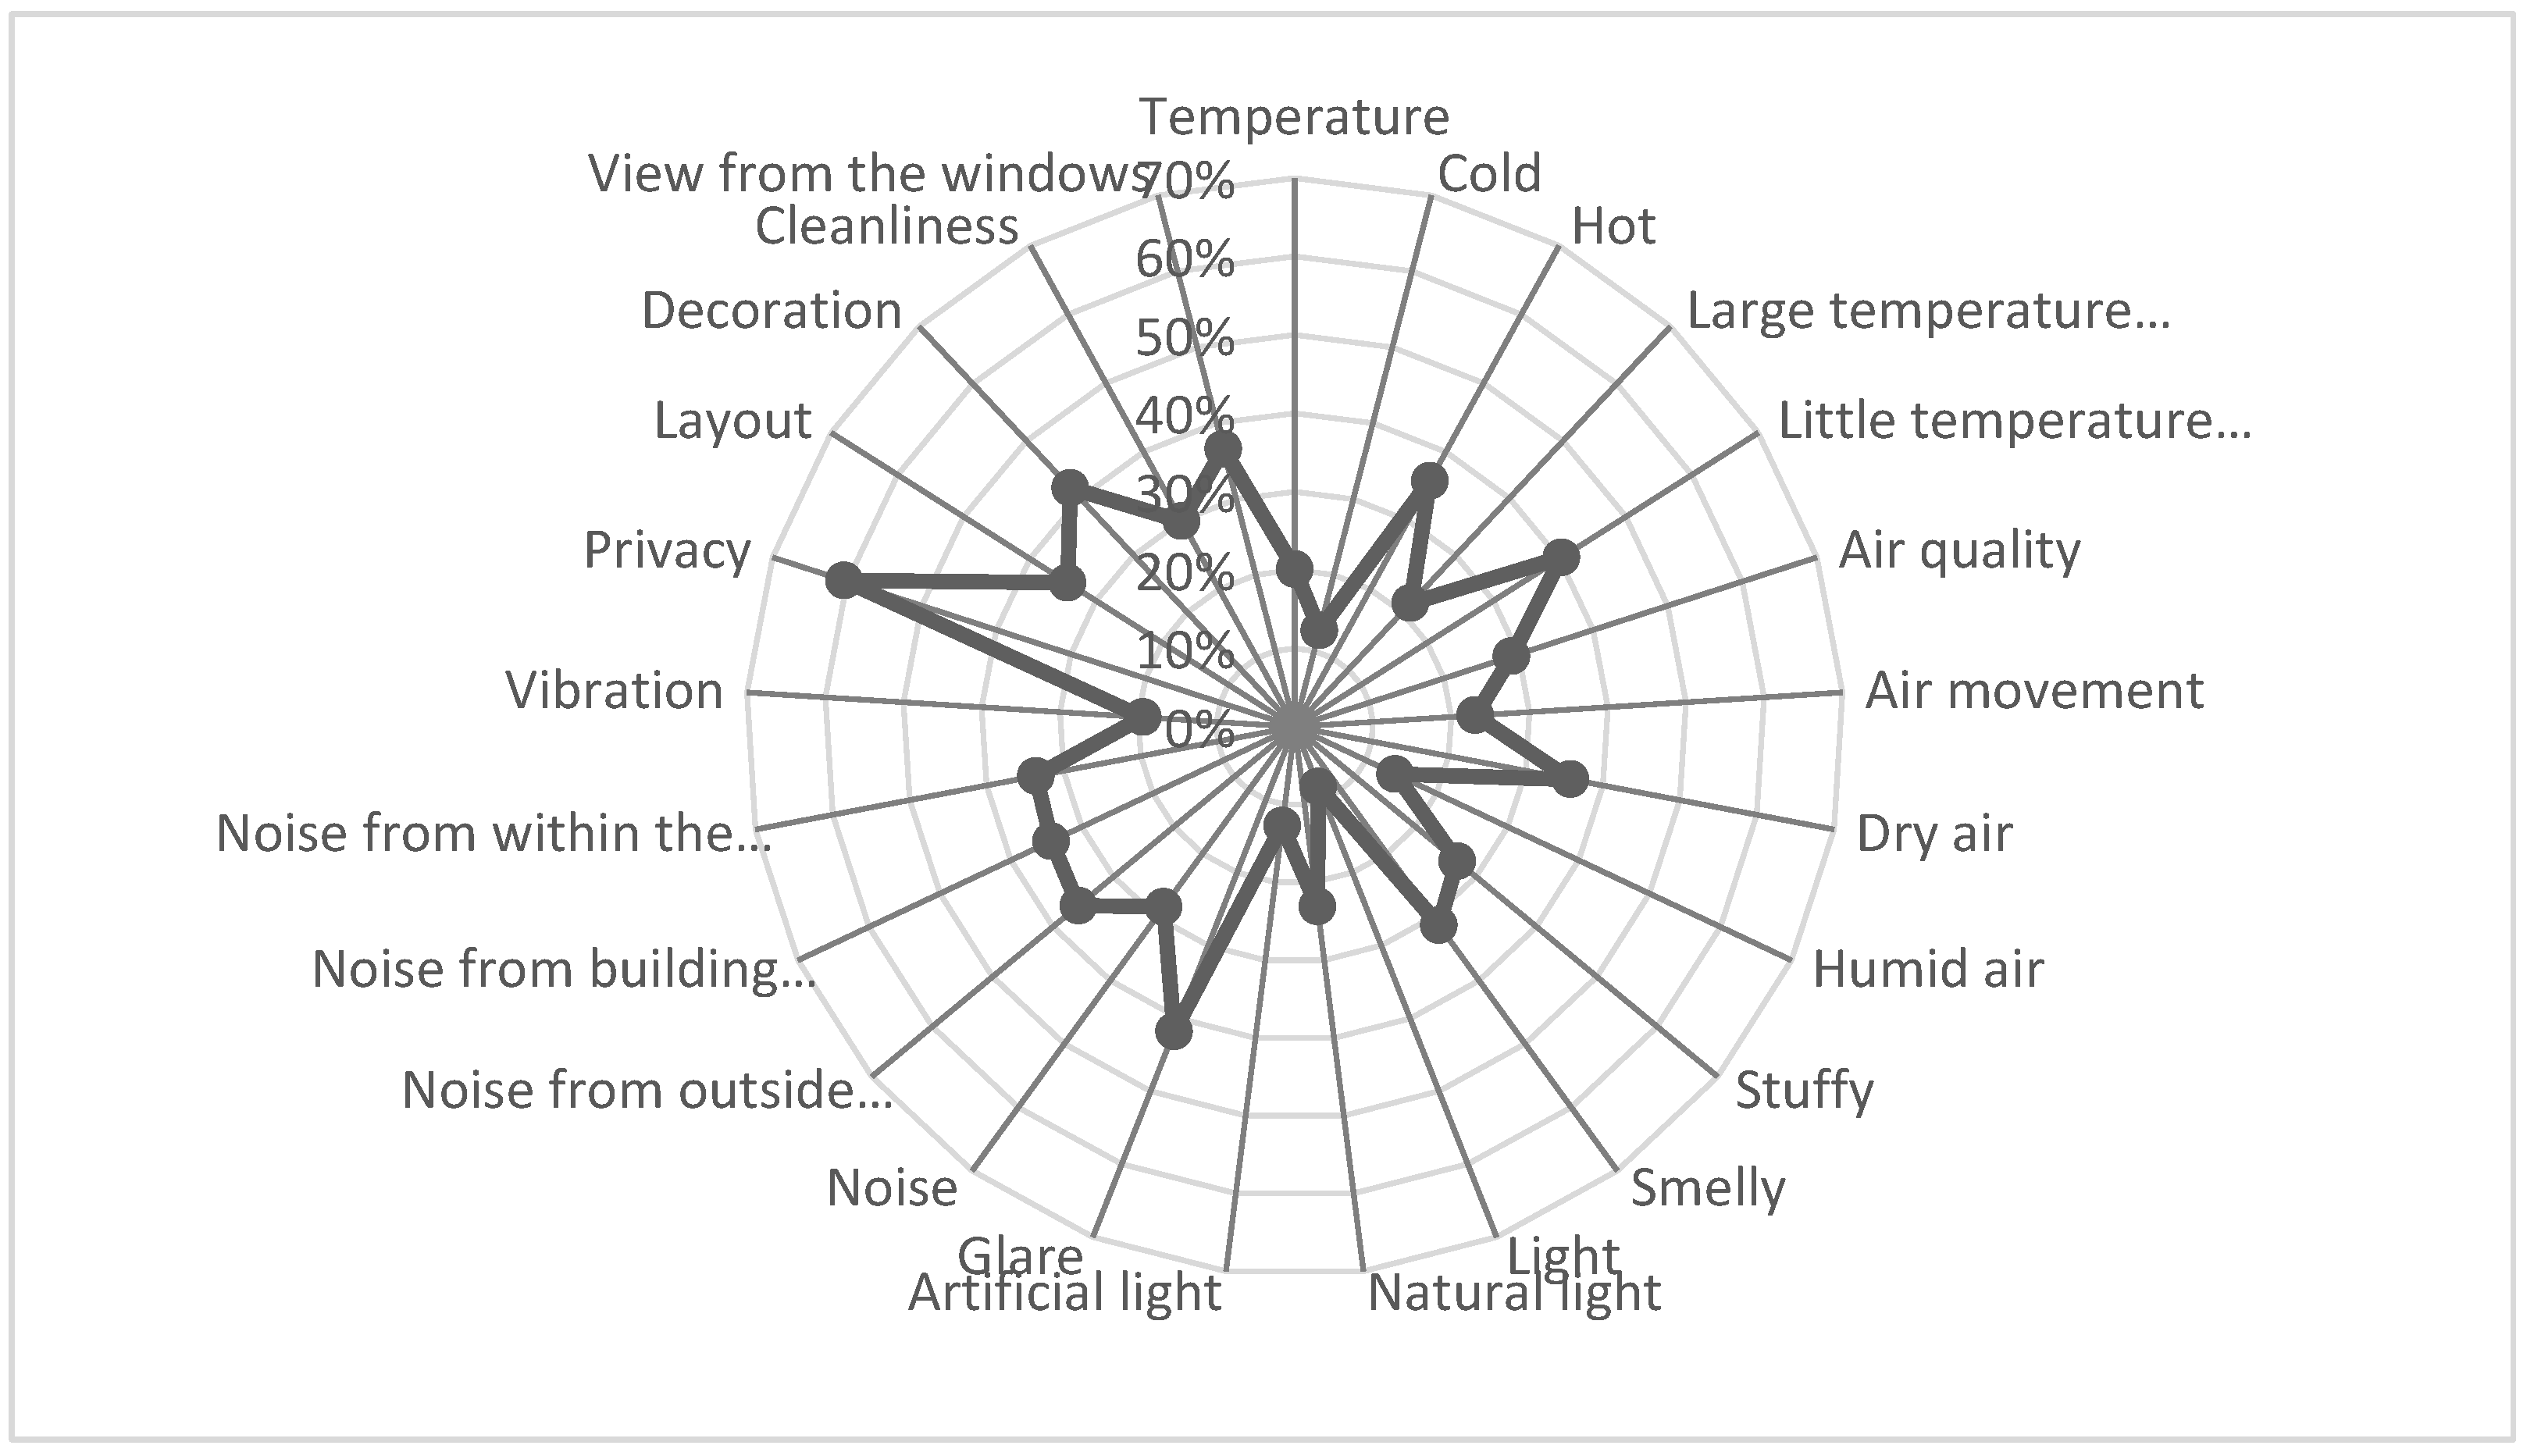
In general, occupants were slightly satisfied with the overall comfort in their offices (mean: 4.96). The most satisfying rated parameter was Light (mean: 5.57) followed by thermal (mean: 4.78), noise (mean: 4.54) and air quality (mean: 4.43) comfort. More specifically, occupants reported general moderate overall comfort (~44%) while only 15% were fully satisfied. Privacy (60%), decoration (42%) and glare (42%) were revealed to be the most dissatisfying parameters (values 1–3 from the 7-point scale). Furthermore, occupants reported complaints about very high temperatures (36%), dry and smelly air (36% and 31%) and noise inside the building (Figure 3).
In order to identify the association between IEQ parameters and overall comfort, proportional odds ordinal logistic regression analysis was applied. Results showed that the greatest OR value (OR: 2.10, p < 0.05) was found for overall temperature comfort. Similar studies also reveal that thermal environment that the most influential environmental aspect [50,51]. The second main parameter associated with overall comfort was overall noise (OR: 1.39, p < 0.05). The importance of noise satisfaction was also raised in a study conducted in public and private buildings focusing on open-plan offices [52]. Then follow the satisfaction with air quality (OR: 1.17, p < 0.1) and light without statistical significance (OR: 1.03, p > 0.1).
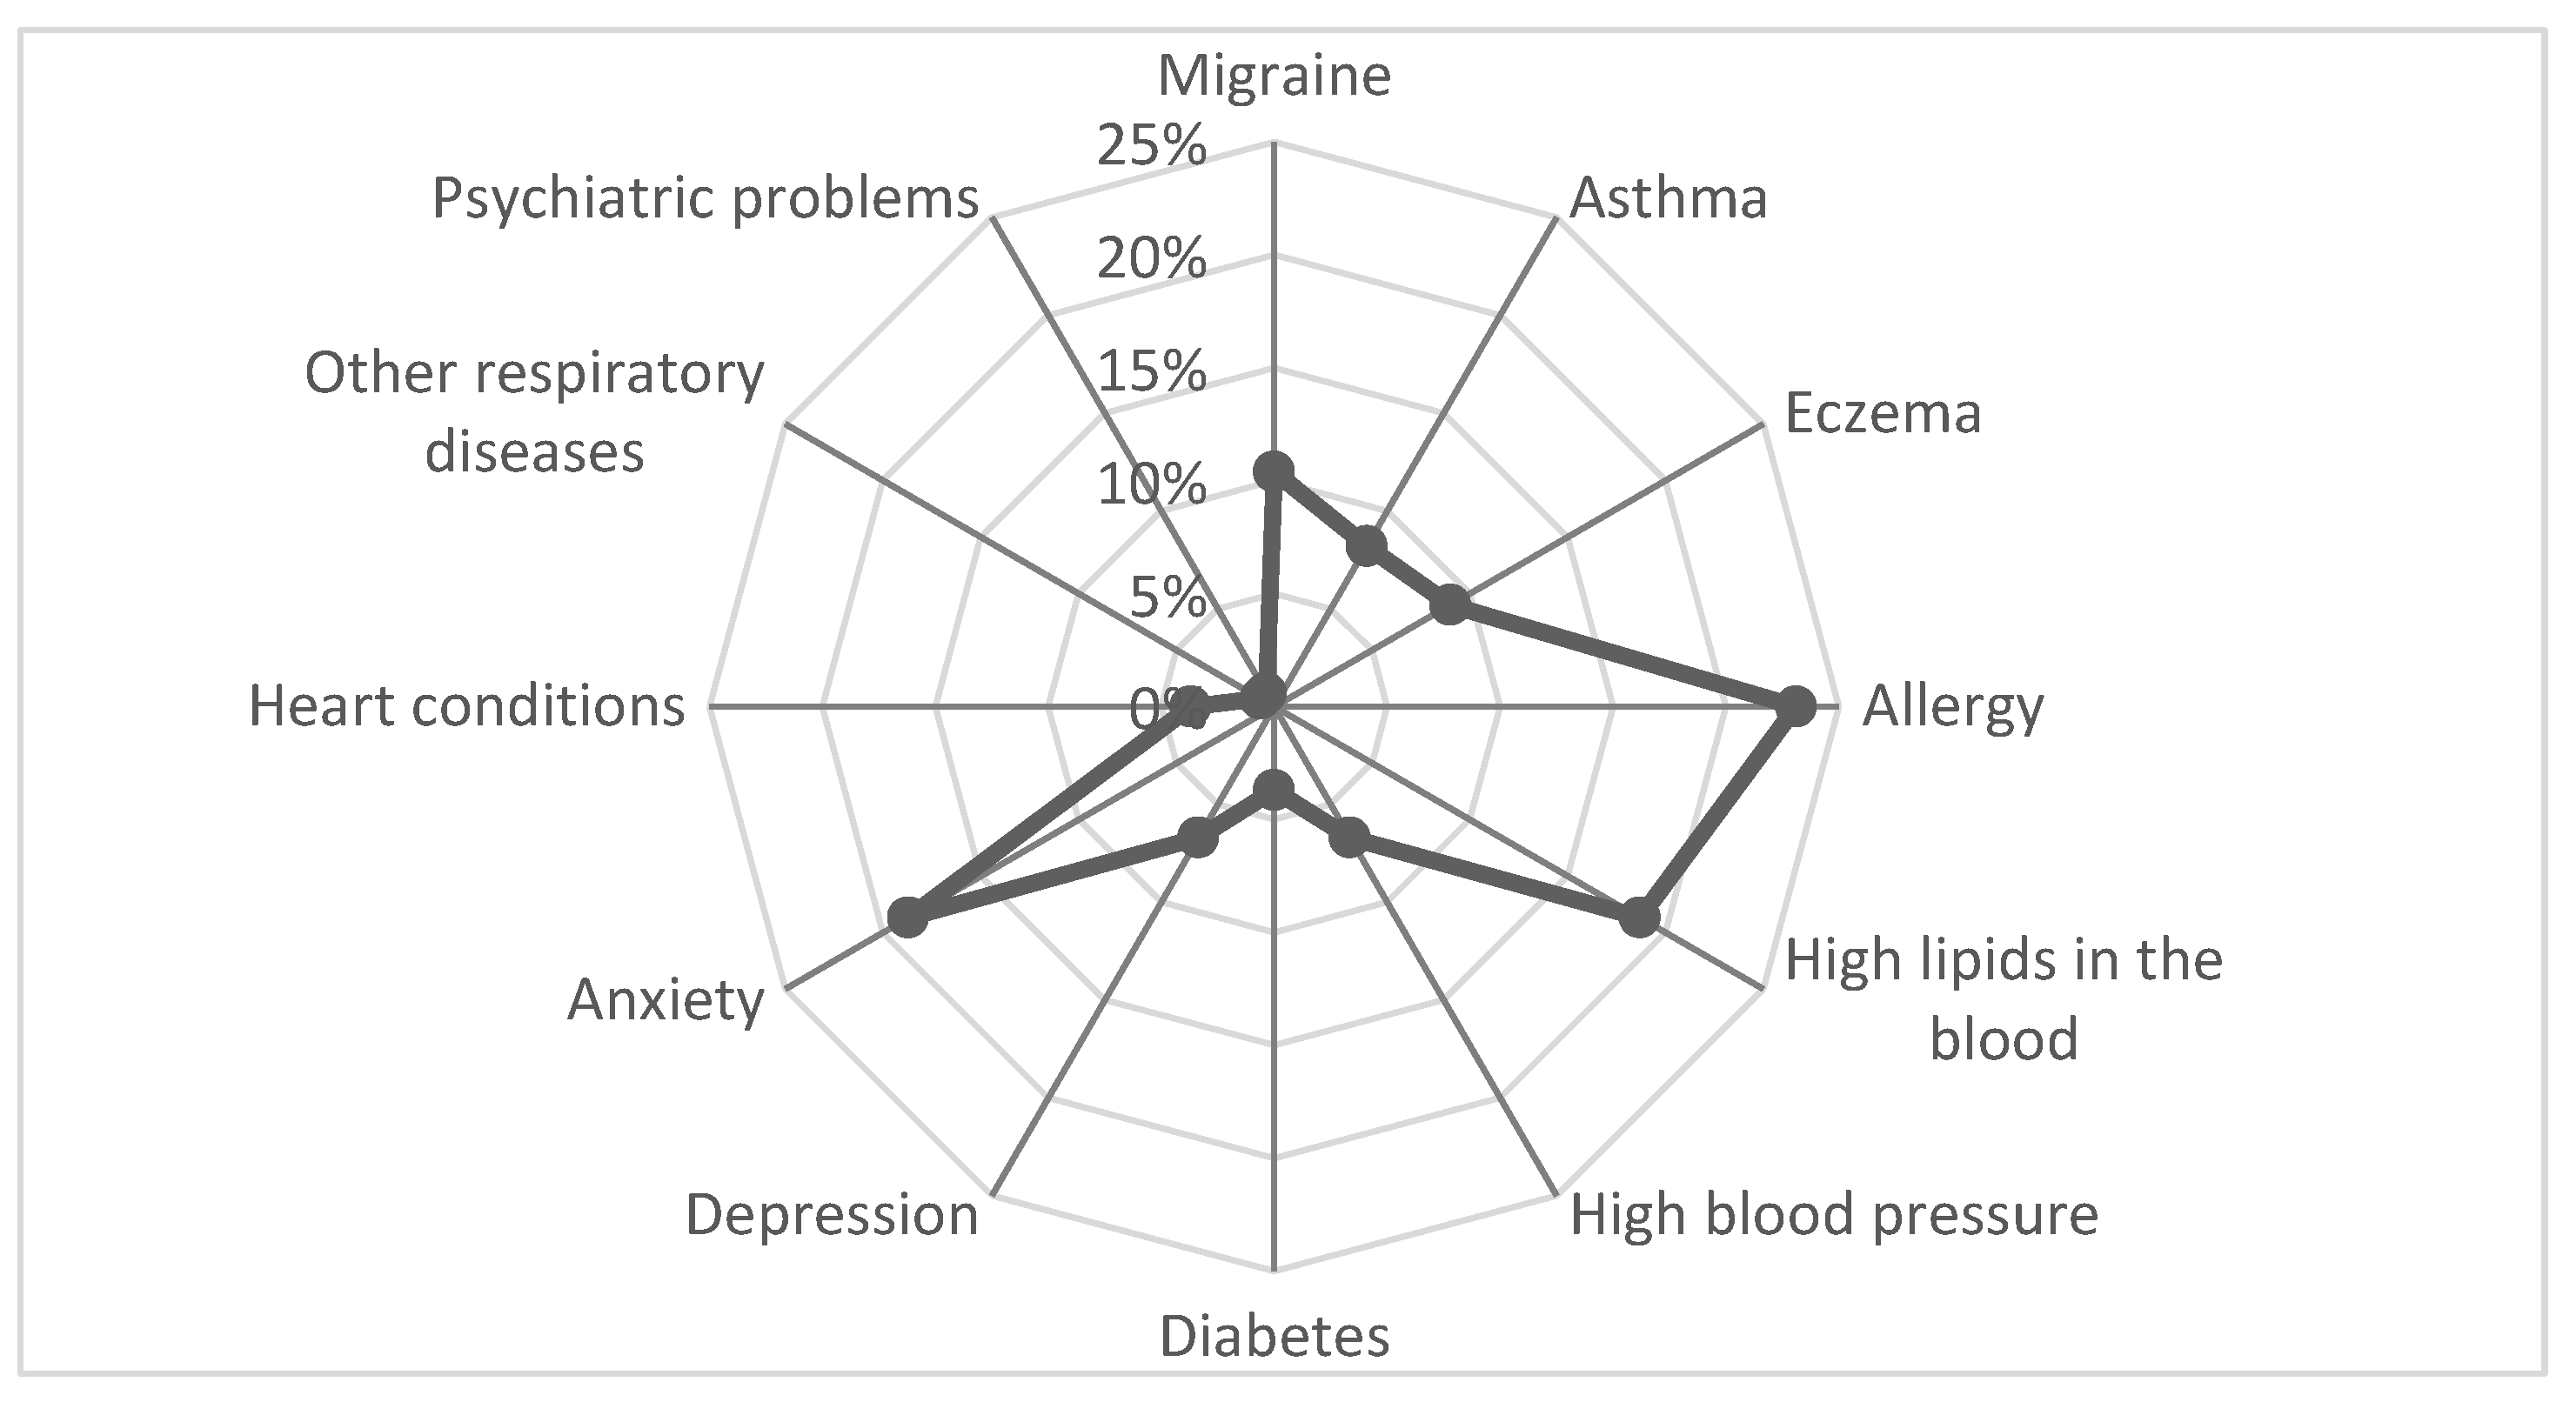
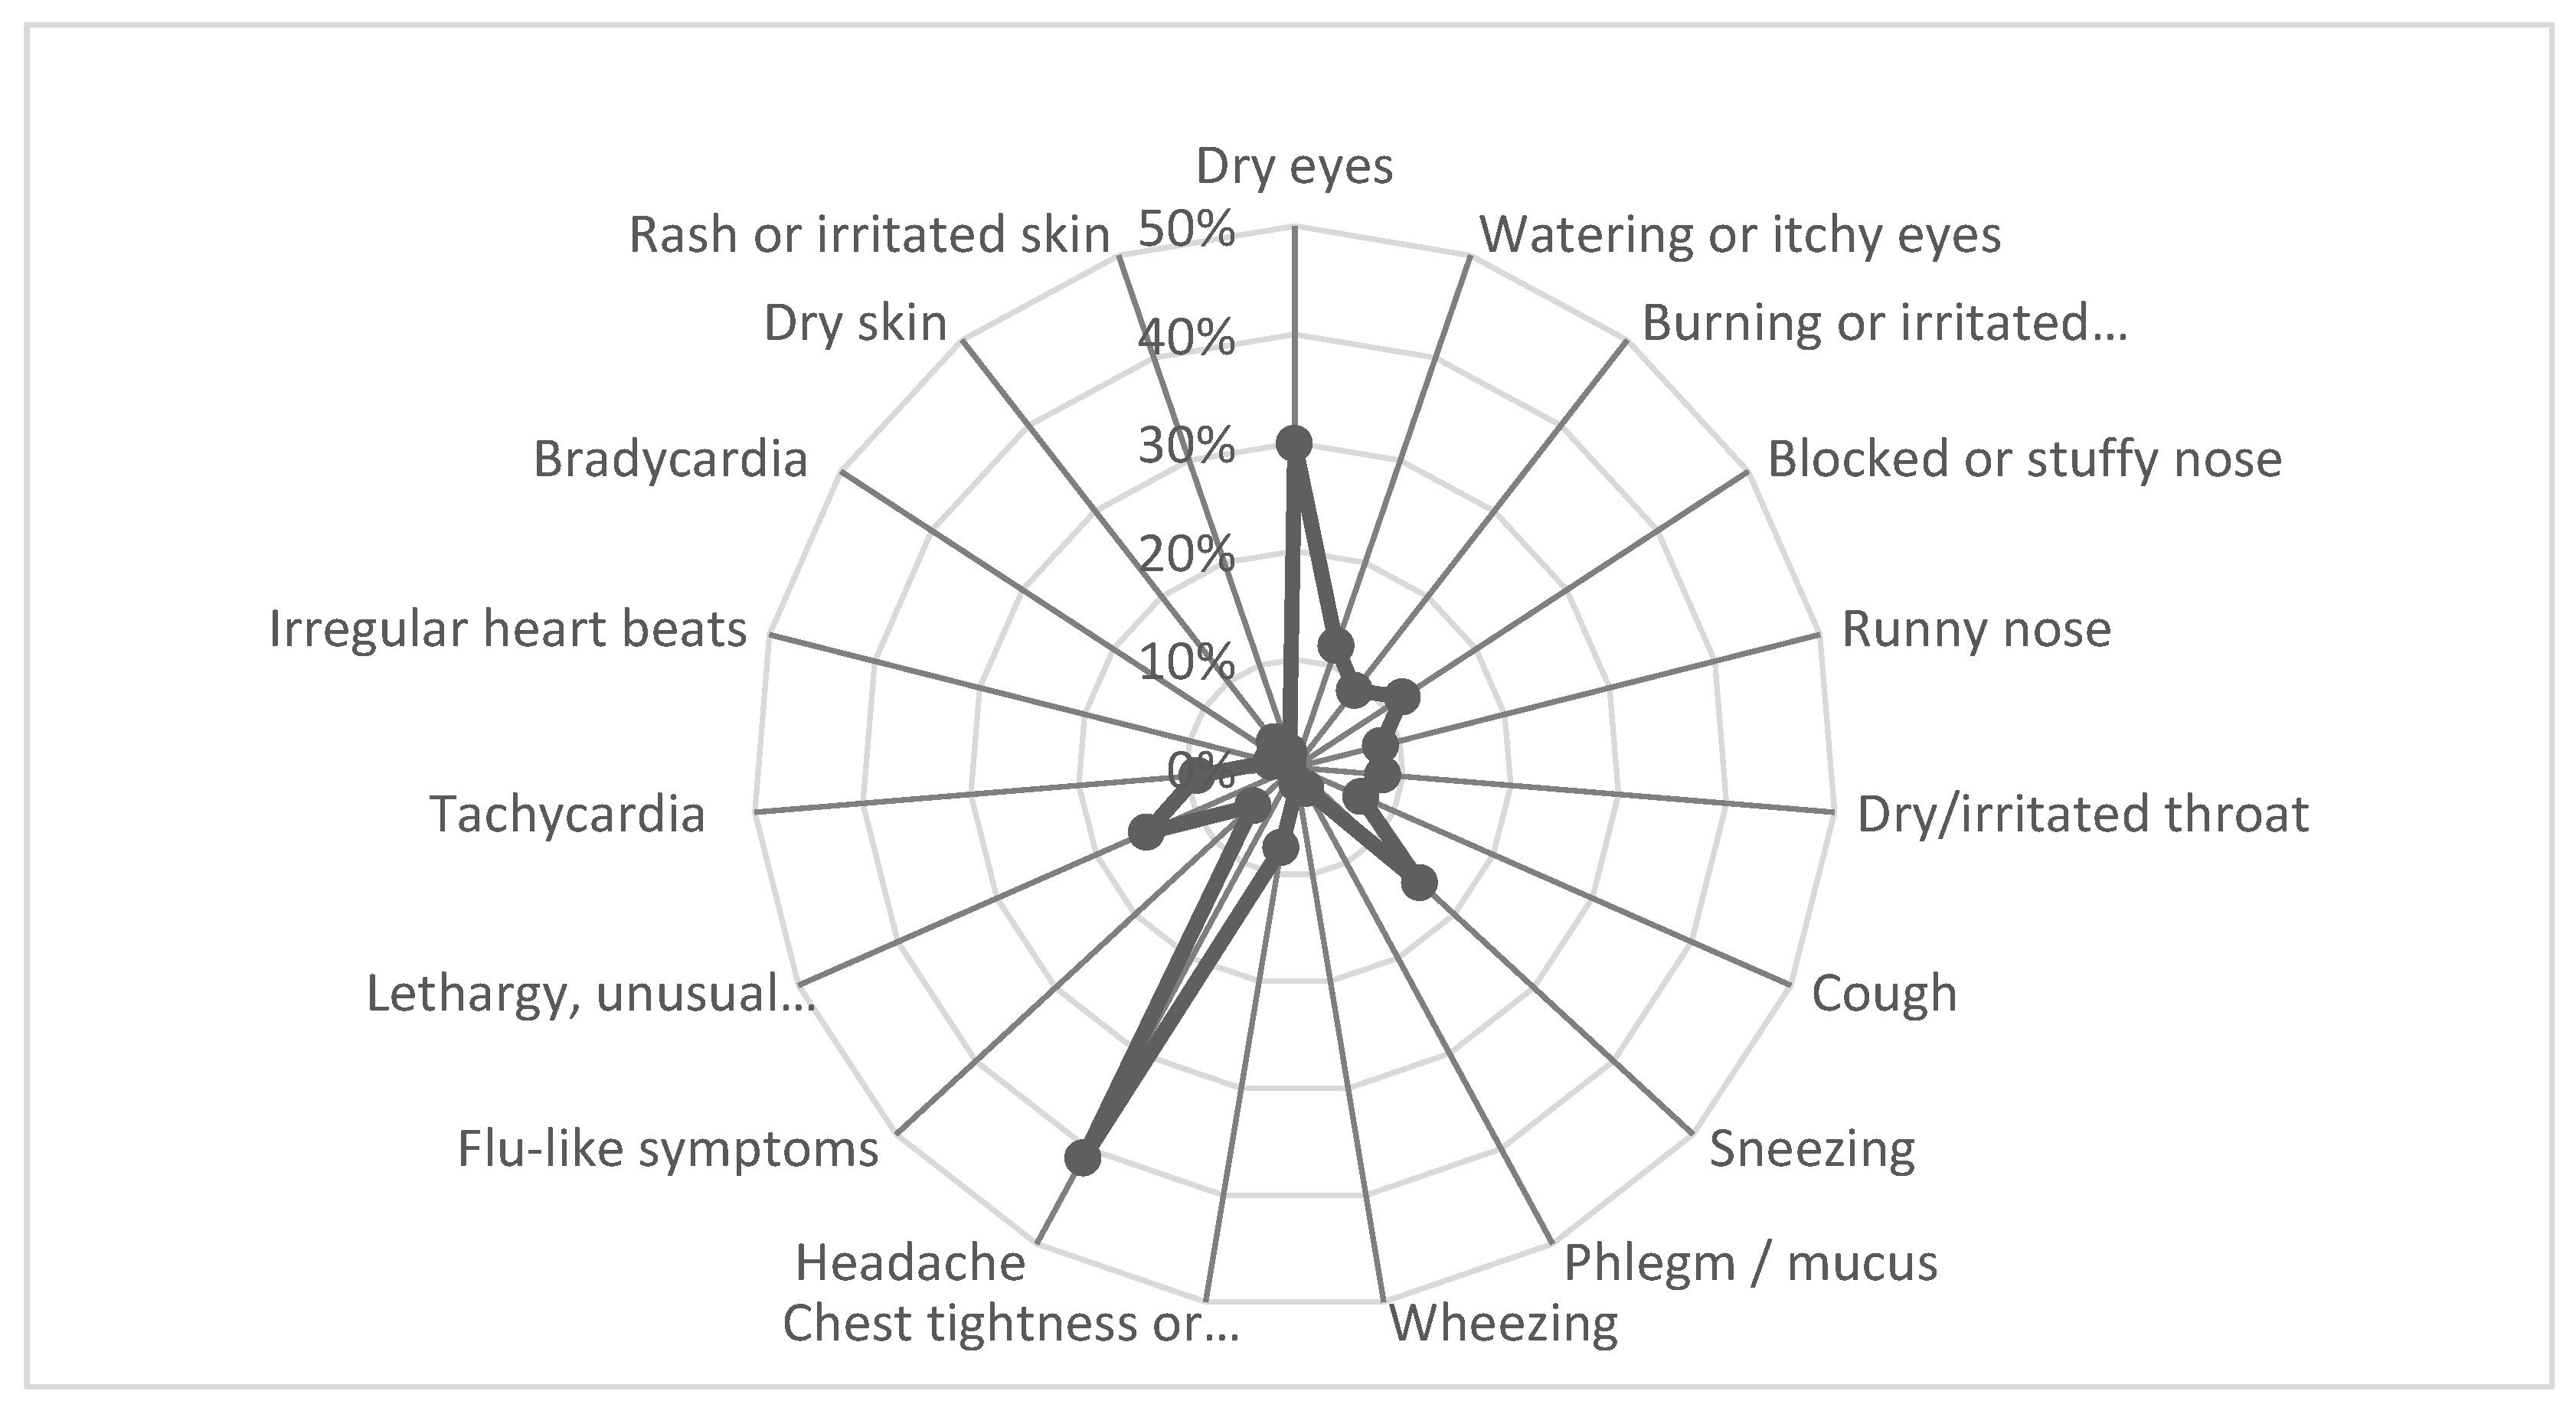
Figure 4 shows the prevalence of the SBS symptoms. In general, 63% reported at least one health symptom, while the most reported heath symptoms were headache (41%), dry eyes (30%) and sneezing, lethargy (16%, 15%). The least frequent were related to heart symptoms such as bradycardia (1%) and irregular heartbeats (2%); respiratory phlegm/mucus (2%); wheezing (2%); and rash or irritated skin (2%). Furthermore, if any participant reported at least one symptom that was classified in SBS group, the IAQ perception was examined for these two groups by the Mann–Whitney test. The IAQ perception of the SBS group (mean: 4.24) was significantly lower at p-value level <0.1 than in the non-SBS group (mean: 4.76).
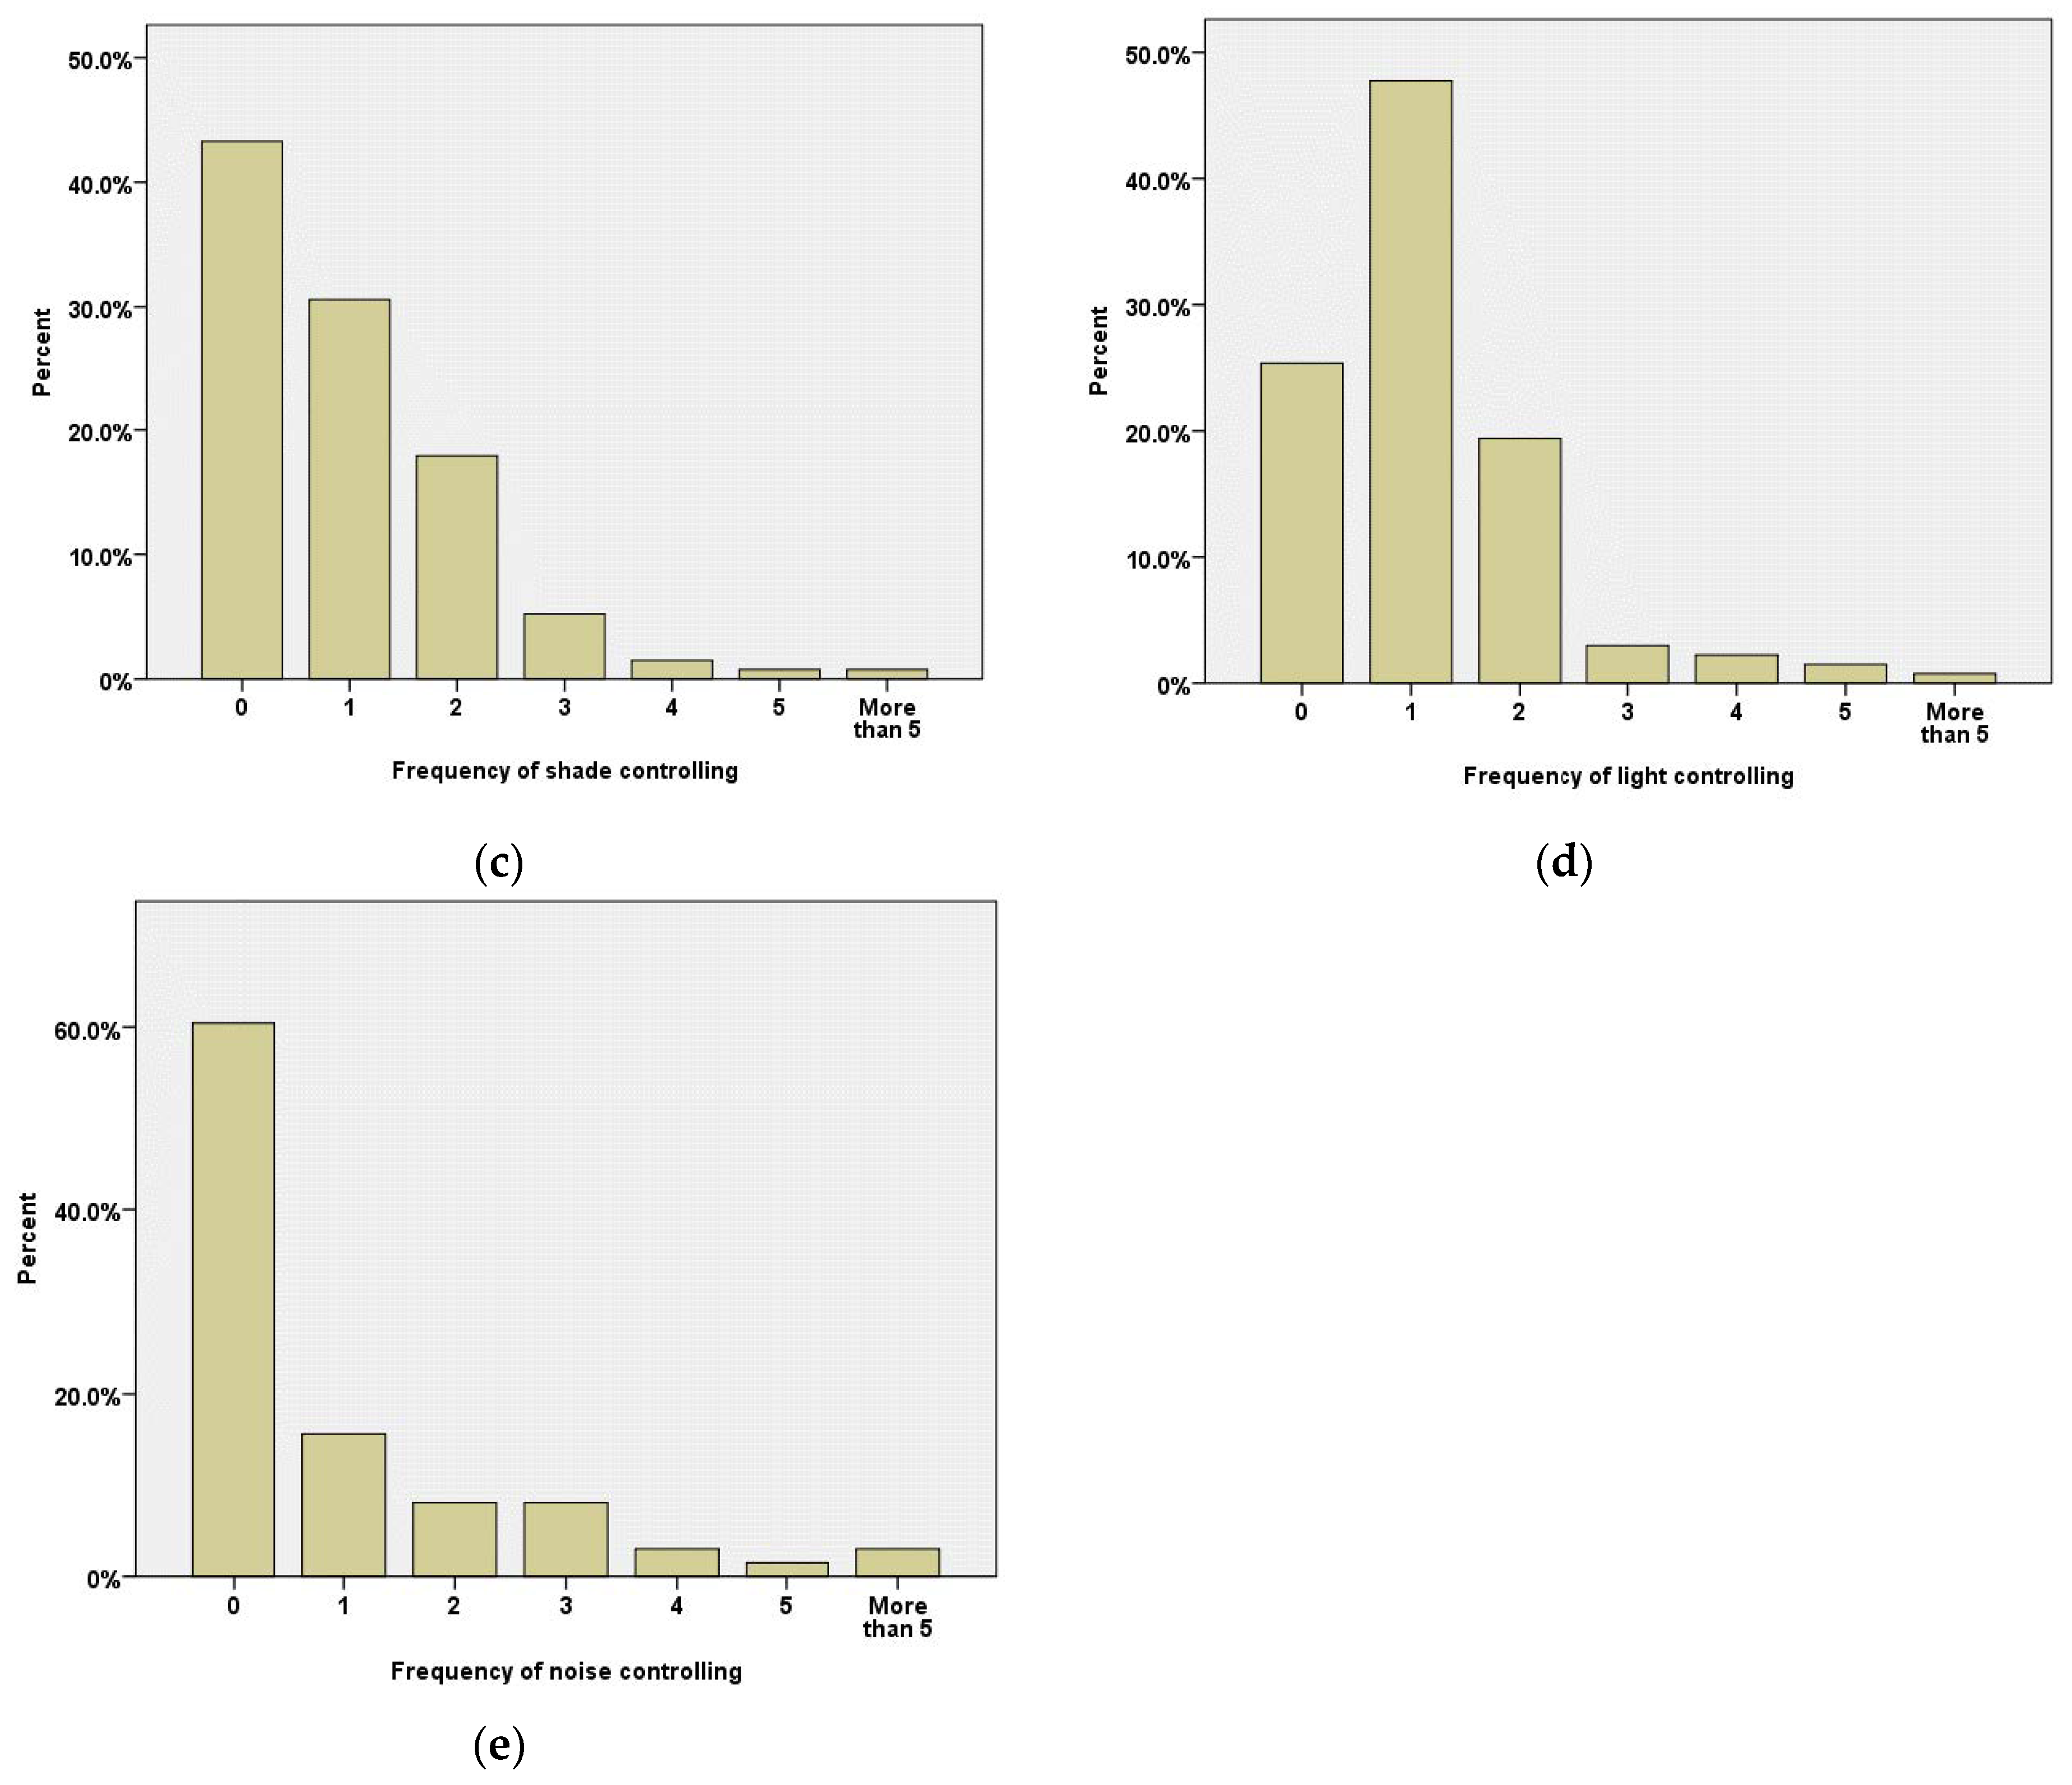
Occupants were asked to evaluate the satisfaction level of the perceived control of the IEQ parameters in their offices and then how many times per day they took an action to adjust these parameters. Perceived control of noise (mean = 3) exhibited the lowest score. On the other hand, the perceived control of light (mean = 5.3) was the highest, followed by the perceived control of shade (mean = 4.52), ventilation (mean = 4.51), and temperature (mean = 4.16). Regarding the exercise of control, there was an identifiable number of occupants who reported that they did not control the IEQ parameters. More specifically, during a working day, a percentage of up to 60% and 43% of occupants were not able to adjust the noise and shade, respectively, in their offices. In general, once per day they controlled the light levels (48%) and in the case of temperature and ventilation parameters, they preferred to adjust them several times during the day (Figure 5).
In Table 2, the correlations between the exercise control and occupants’ perception of control over the IEQ parameters and with their comfort satisfaction as a result of them are presented. The frequency with which employees used available controlling devices in their offices showed to have a moderate association with their control perception of ventilation and noise (Spearman cor. 0.424 and 0.430, respectively), while a weaker correlation appeared in shading control (Spearman cor. 0.248). Perceived overall comfort correlated significantly and positively with perceived control parameters and temperature control appeared to have the highest correlation (Spearman cor. 0.474). Controlling noise in offices remained the least affecting parameter both in noise comfort (Spearman cor. 0.252) as well as in overall comfort (Spearman cor. 0.242). These findings reinforced the idea that occupants prefer interaction with the building and to have some personal autonomy to reach their desired comfort level [53]. Improved personal control of the IEQ by applying more available controls to the occupants could further satisfy their thermal comfort and IAQ needs, and also reduce the energy consumption by centralized HVAC systems, especially in open space offices [54,55]. These results are also enforce the findings in a recent study in which Hong et al. revealed the link between occupant and their behaviors of sharing energy and environment control systems and interactions with their colleagues [56].
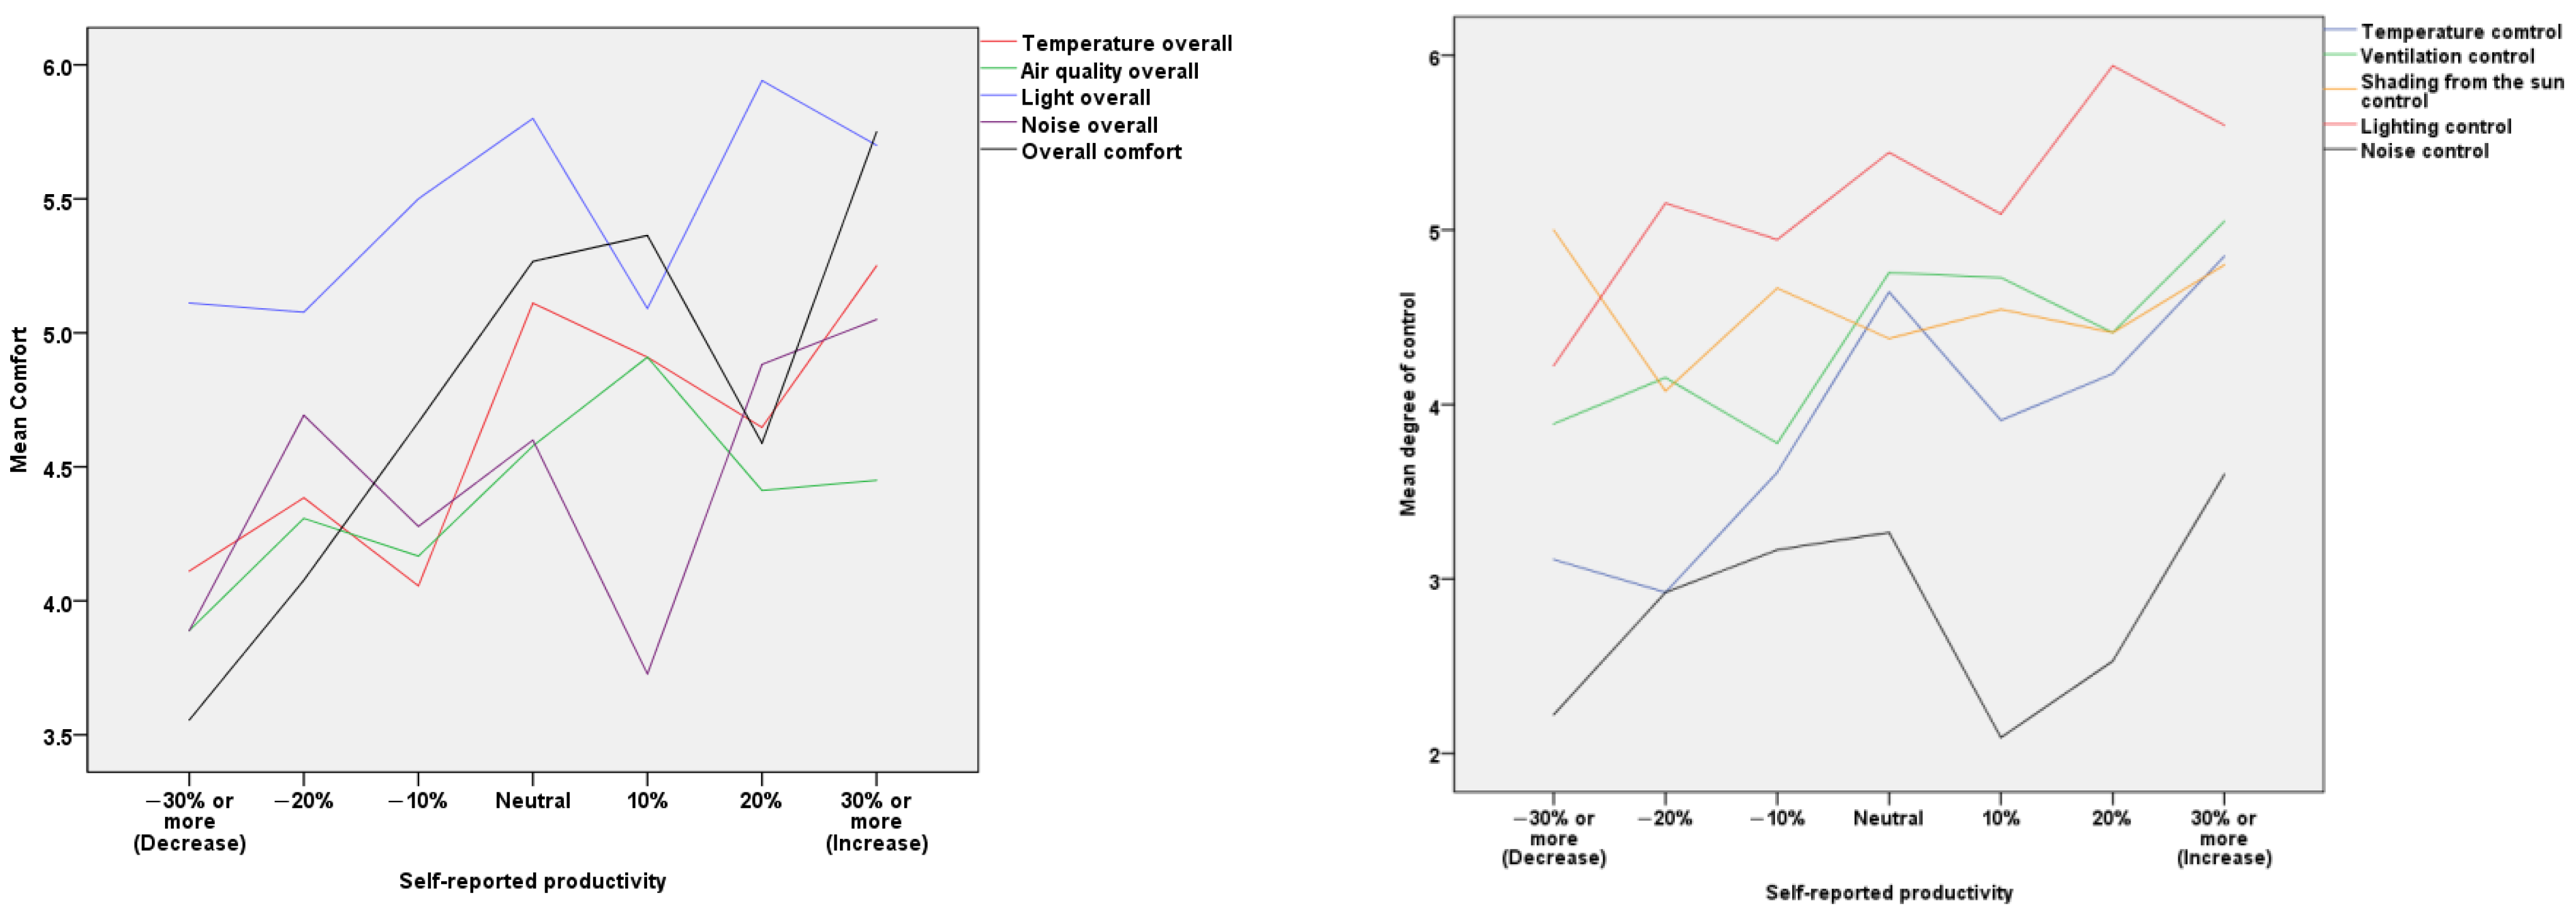
The questionnaire also gathered information about the occupants’ self-reported productivity ranging from −30% up to +30%. Figure 6 shows that tself-reported productivity at workplace presents an increasing trend when the perception of comfort and control of the IEQ parameters is higher. More specifically, while occupants reported greater levels of overall comfort satisfaction, from 3.5 to 5, a remarkable increase in their productivity was noticed, i.e., from −30% to +10%. The same pattern is also revealed for the controlling parameters, especially that of temperature, while on the other hand noise control seems to be the least affecting parameter on productivity. The significance of perceived control in productivity was highlighted in another study conducted at 37 European offices, where a small increase in the low control area resulted in a clear increase in productivity [34]. Also, a UK study discovered that the comfort, health, and productivity of workers were all related to their perceived personal thermal control [57].
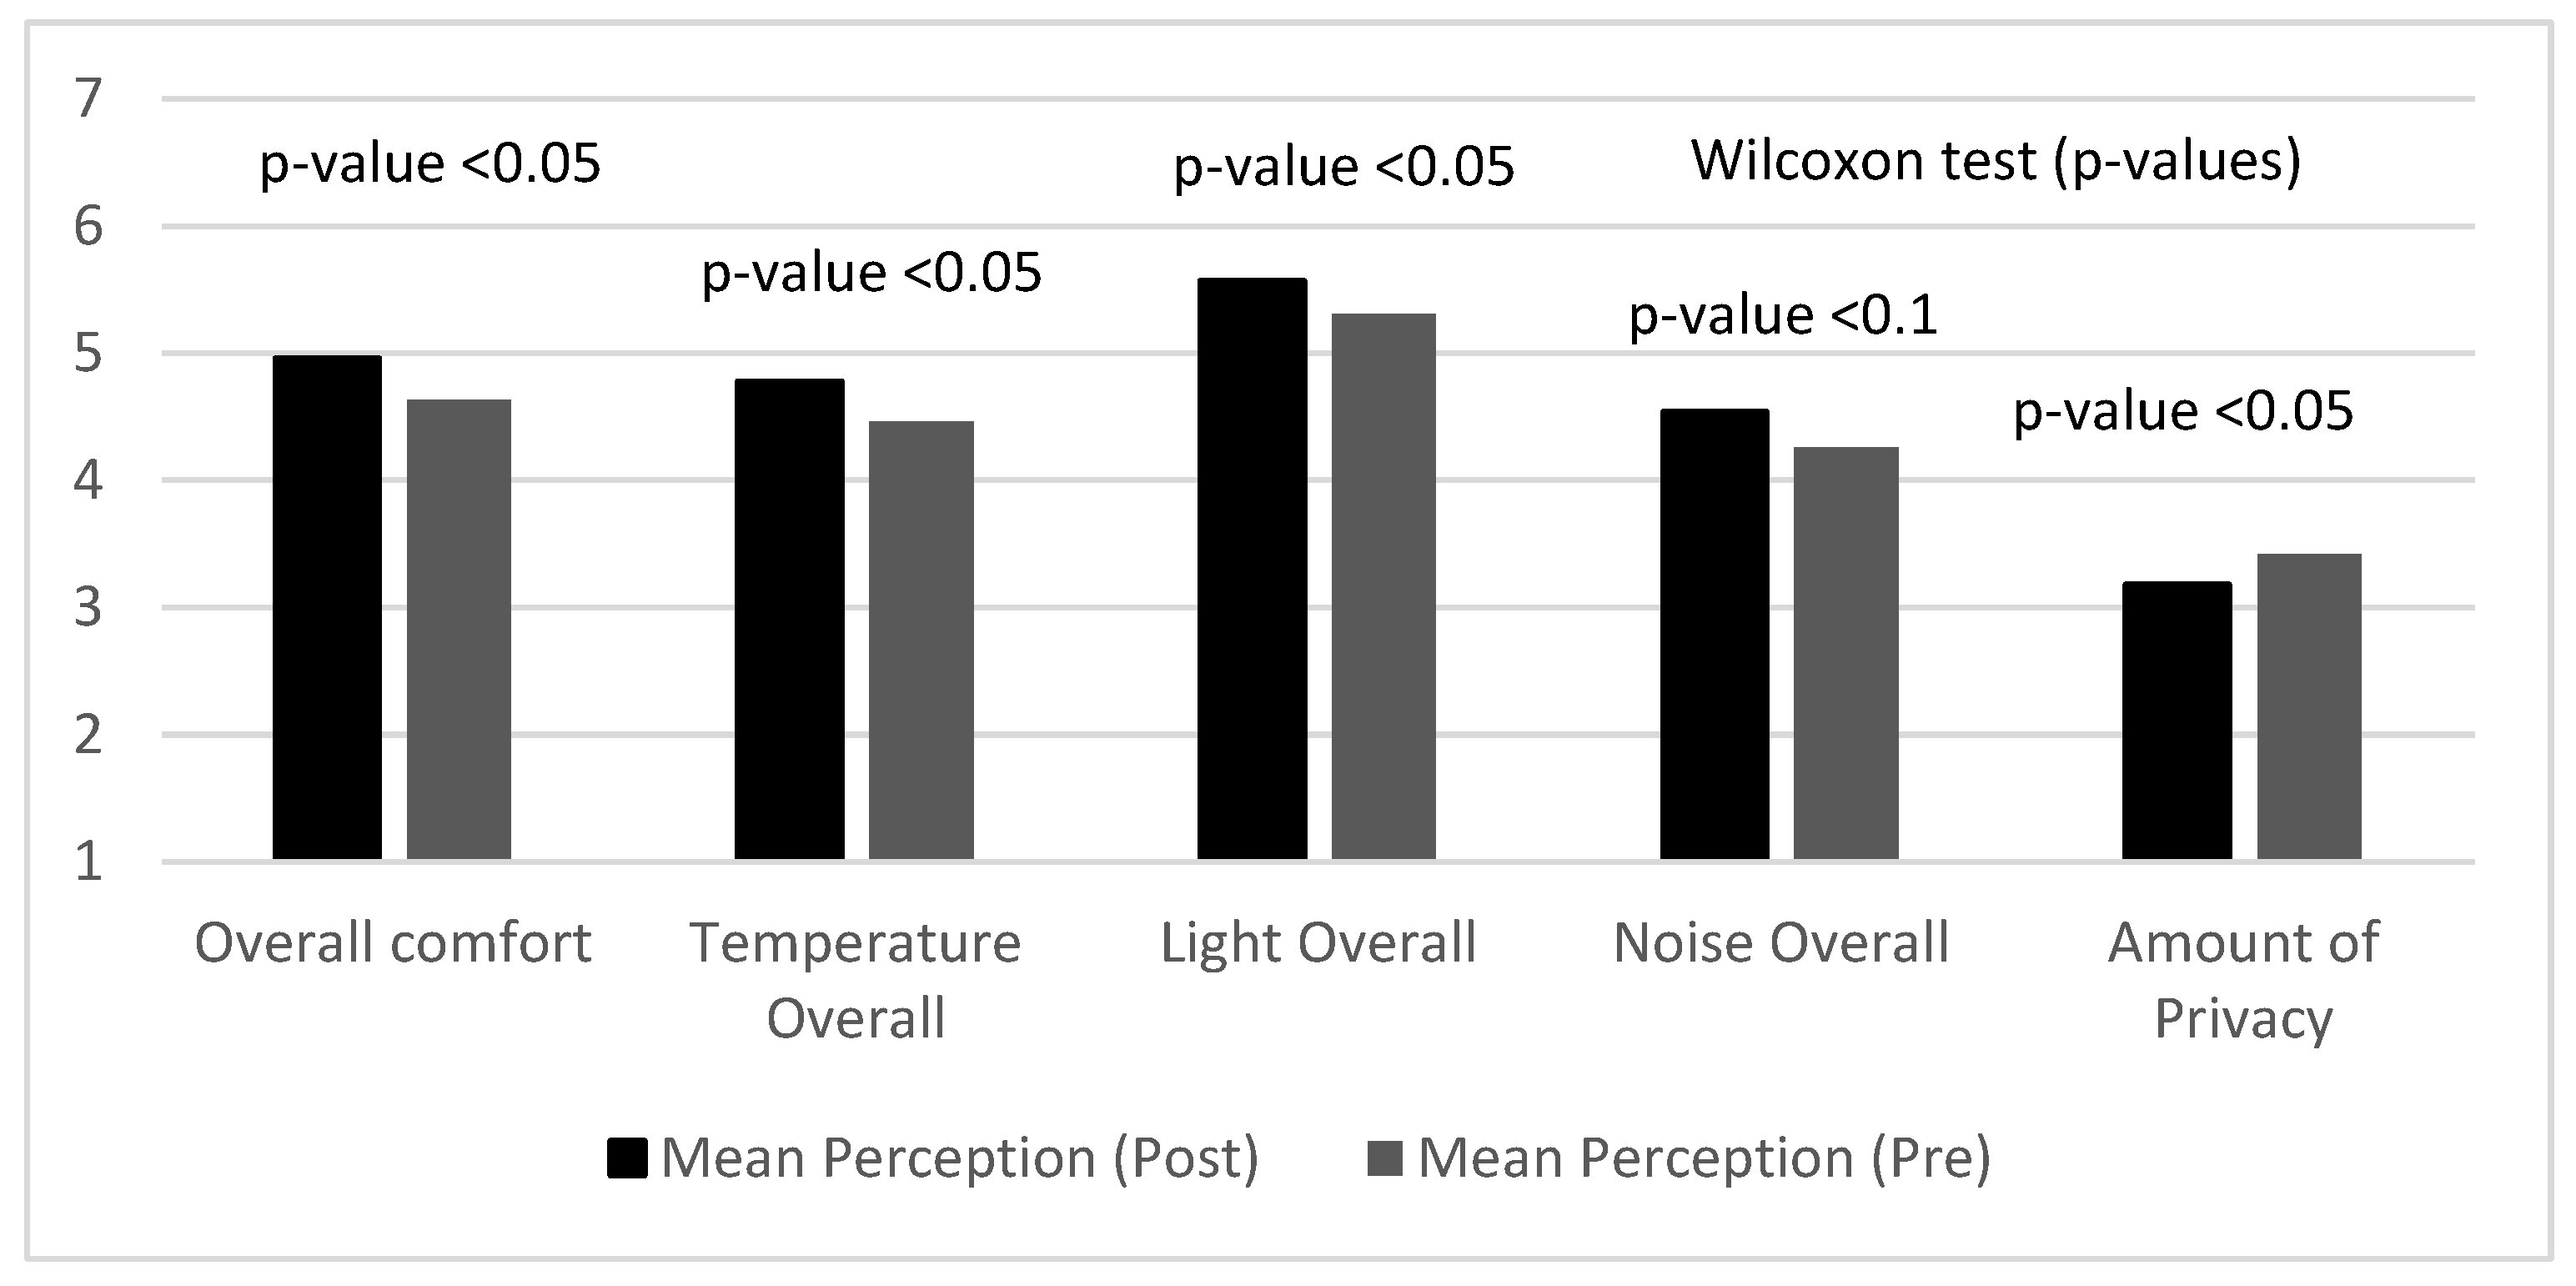
The participants, after completing the evaluation of the current IEQ perception in their offices, were asked to reevaluate their perception during the working hours before the lock-down period. The Wilcoxon statistical test was used to compare the pre- and post-lockdown period satisfaction scores. Figure 7 presents the IEQ parameters that appeared to be statistically significant. The perception of overall comfort, temperature, light and noise was significantly higher during the time of the study. On the contrary, regarding privacy, the occupants’ perception was evaluated as significantly lower after returning to offices.
In the last part of the questionnaire, participants expressed their degree of acceptance of the lockdown aspects due to the pandemic, and the results are presented in Table 3. In general, office occupants agreed to the applied polices and they seemed to accept the new conditions in their offices (mean score above the neutral score 3). On the other hand, at the time of the survey, they reported that they do not prefer to work from their homes anymore (score 2.54). The acceptance of new working conditions and the aspect of how the rest of the occupants in their office accept them, showed significant statistical correlation with their overall comfort (Spearman cor. 0.185, p < 0.01 and 0.370 
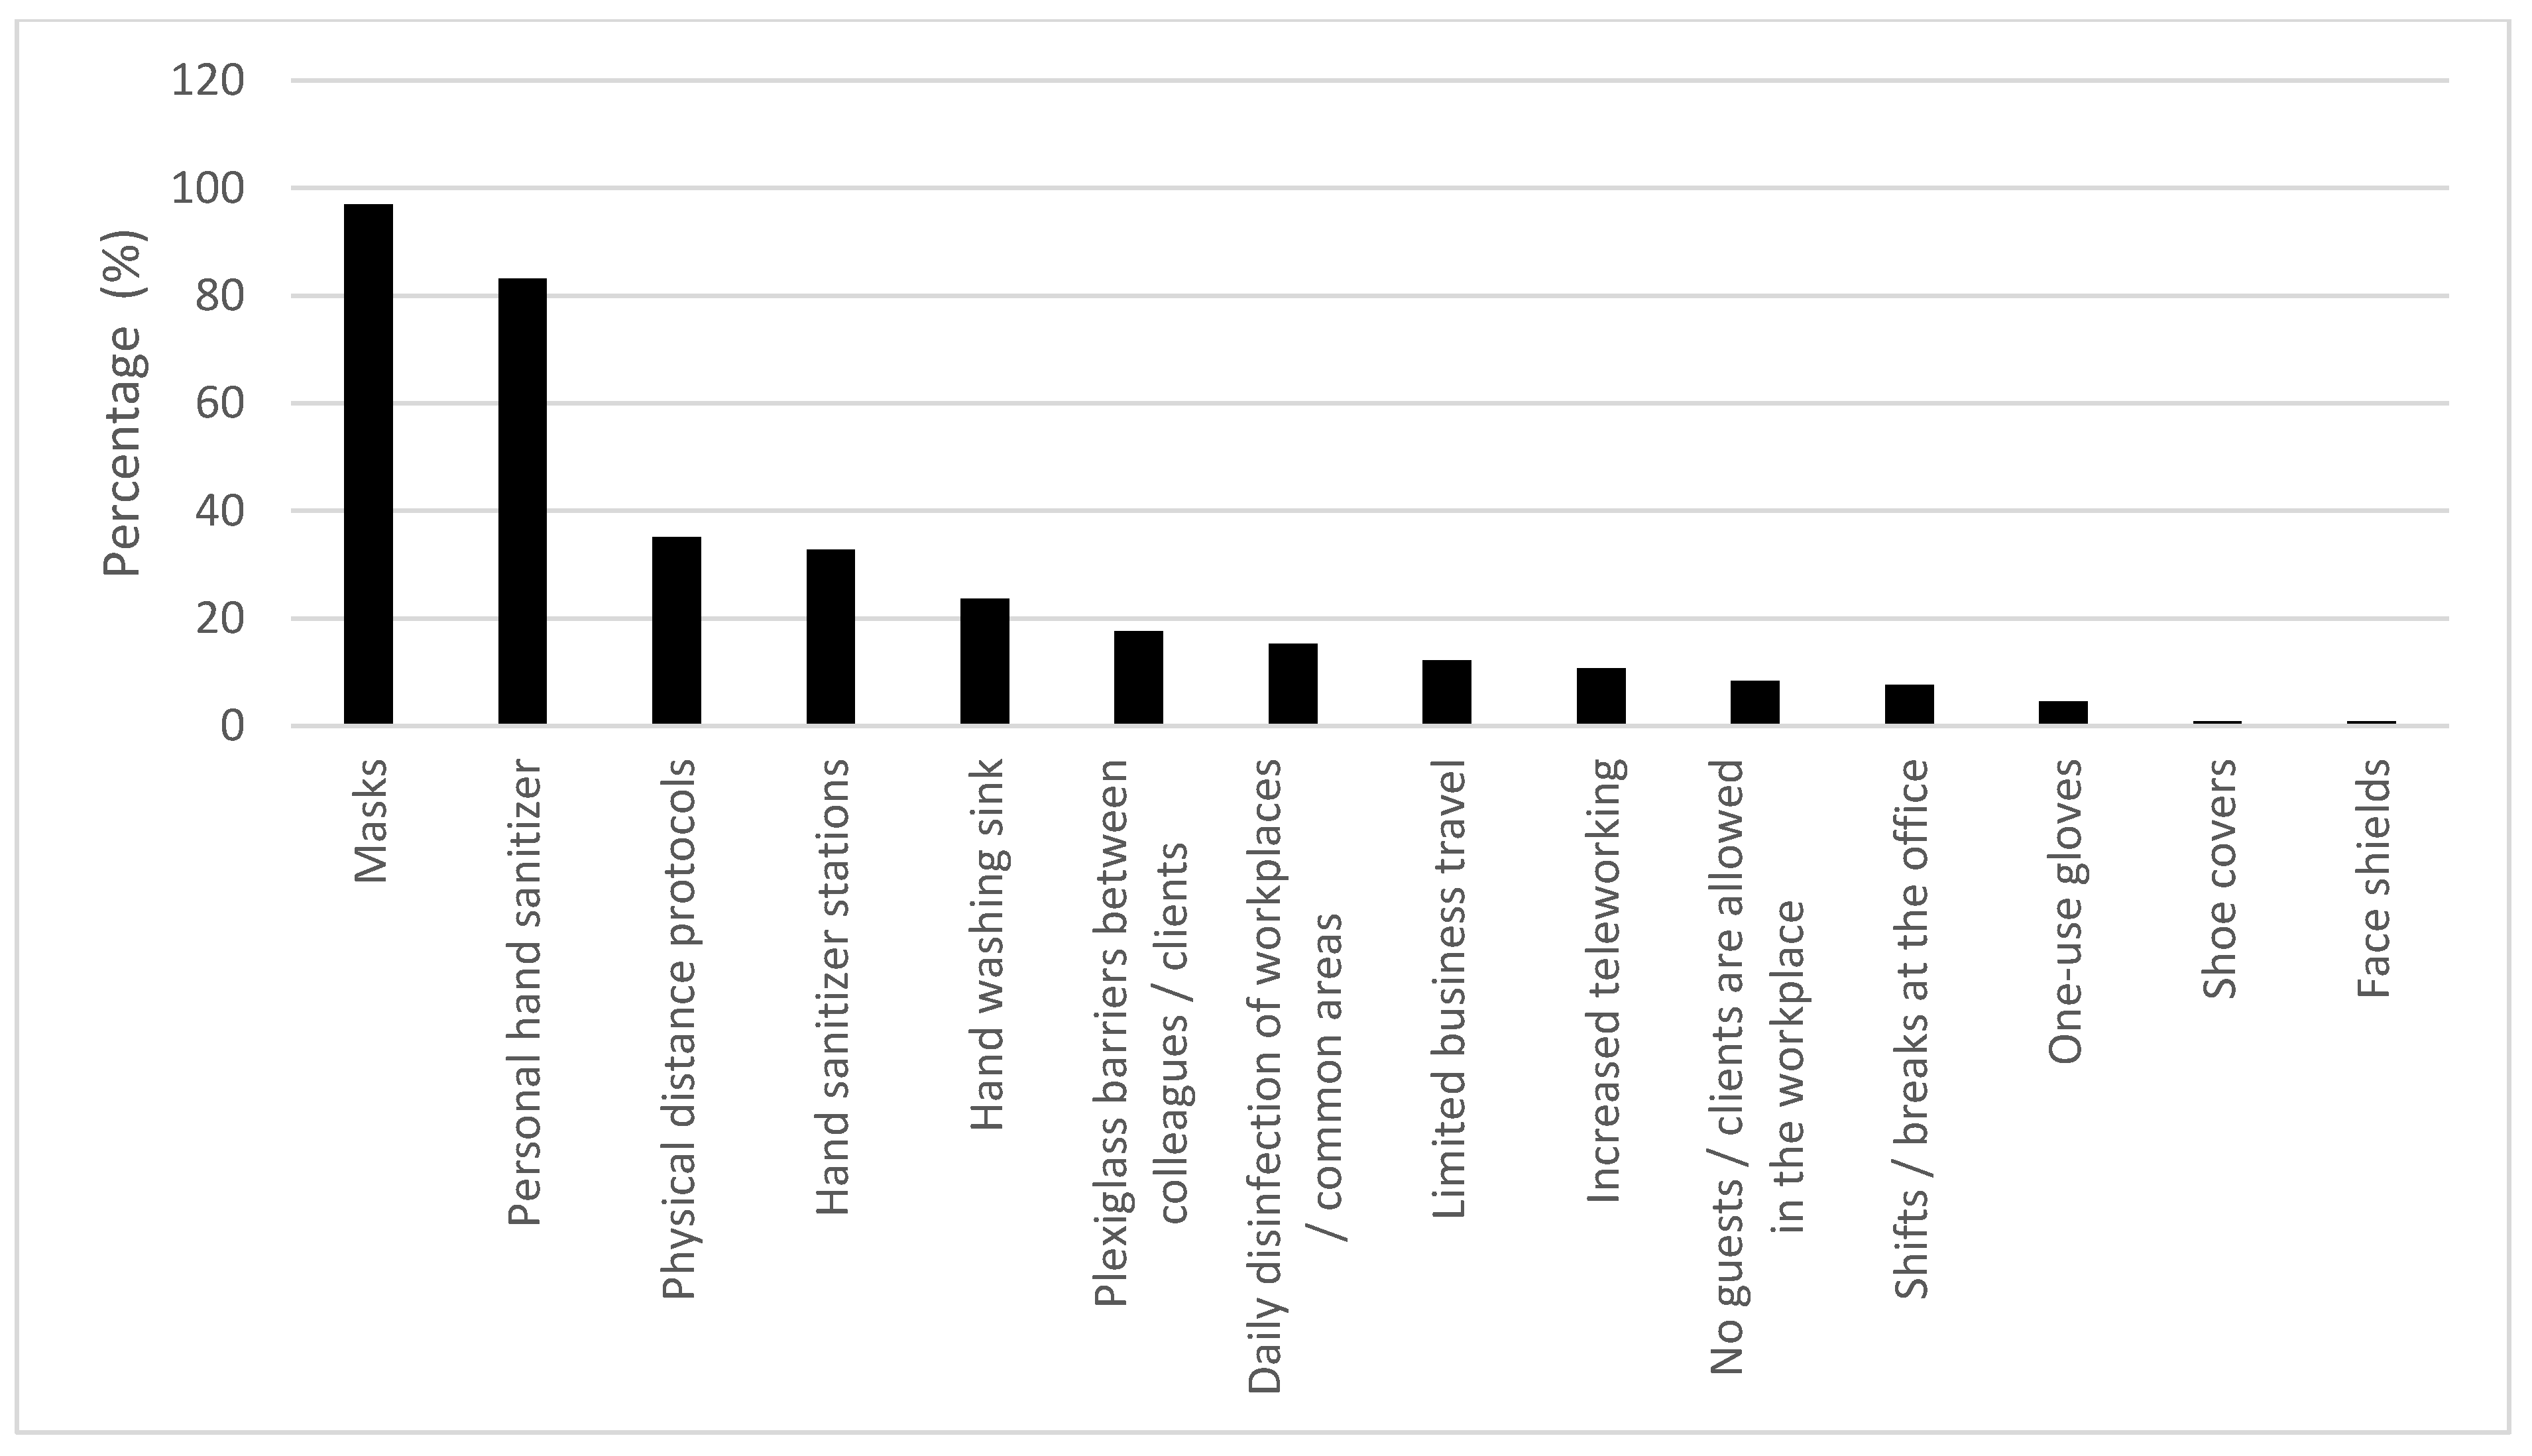
p < 0.01). The occupants’ acceptance of the COVID-19 countermeasures application, in order to ensure a healthy and safe environment at work, was significantly correlated to all overall IEQ parameters. Similar results were revealed as to whether participants believed that their colleagues considered the COVID-19 situation to be serious. These new findings were also reported in a study conducted in offices in Japan during the pandemic period, where it was highlighted that increasing satisfaction with COVID-19 countermeasures may increase occupants’ performance in the offices [7]. Higher acceptance levels of the parameters, such as feeling comfortable in returning to workplace and the application of systems for social distancing and COVID-19 protection, resulted in fewer health complaints (Spearman cor. −0.246 p < 0.01 and −0.180 p < 0.01, respectively). As is depicted in Figure 8, the social distancing protocol, use of masks and sanitizers (personal or stations) and the installation of barriers between the occupants were three of the most commonly applied protocols in the offices.

3.3. Indoor Air Pollutants Concentration in Offices

Descriptive data of indoor VOCs, aldehydes, O3, NO2 and SO2 concentrations are presented in Figure 9, Figure 10 and 
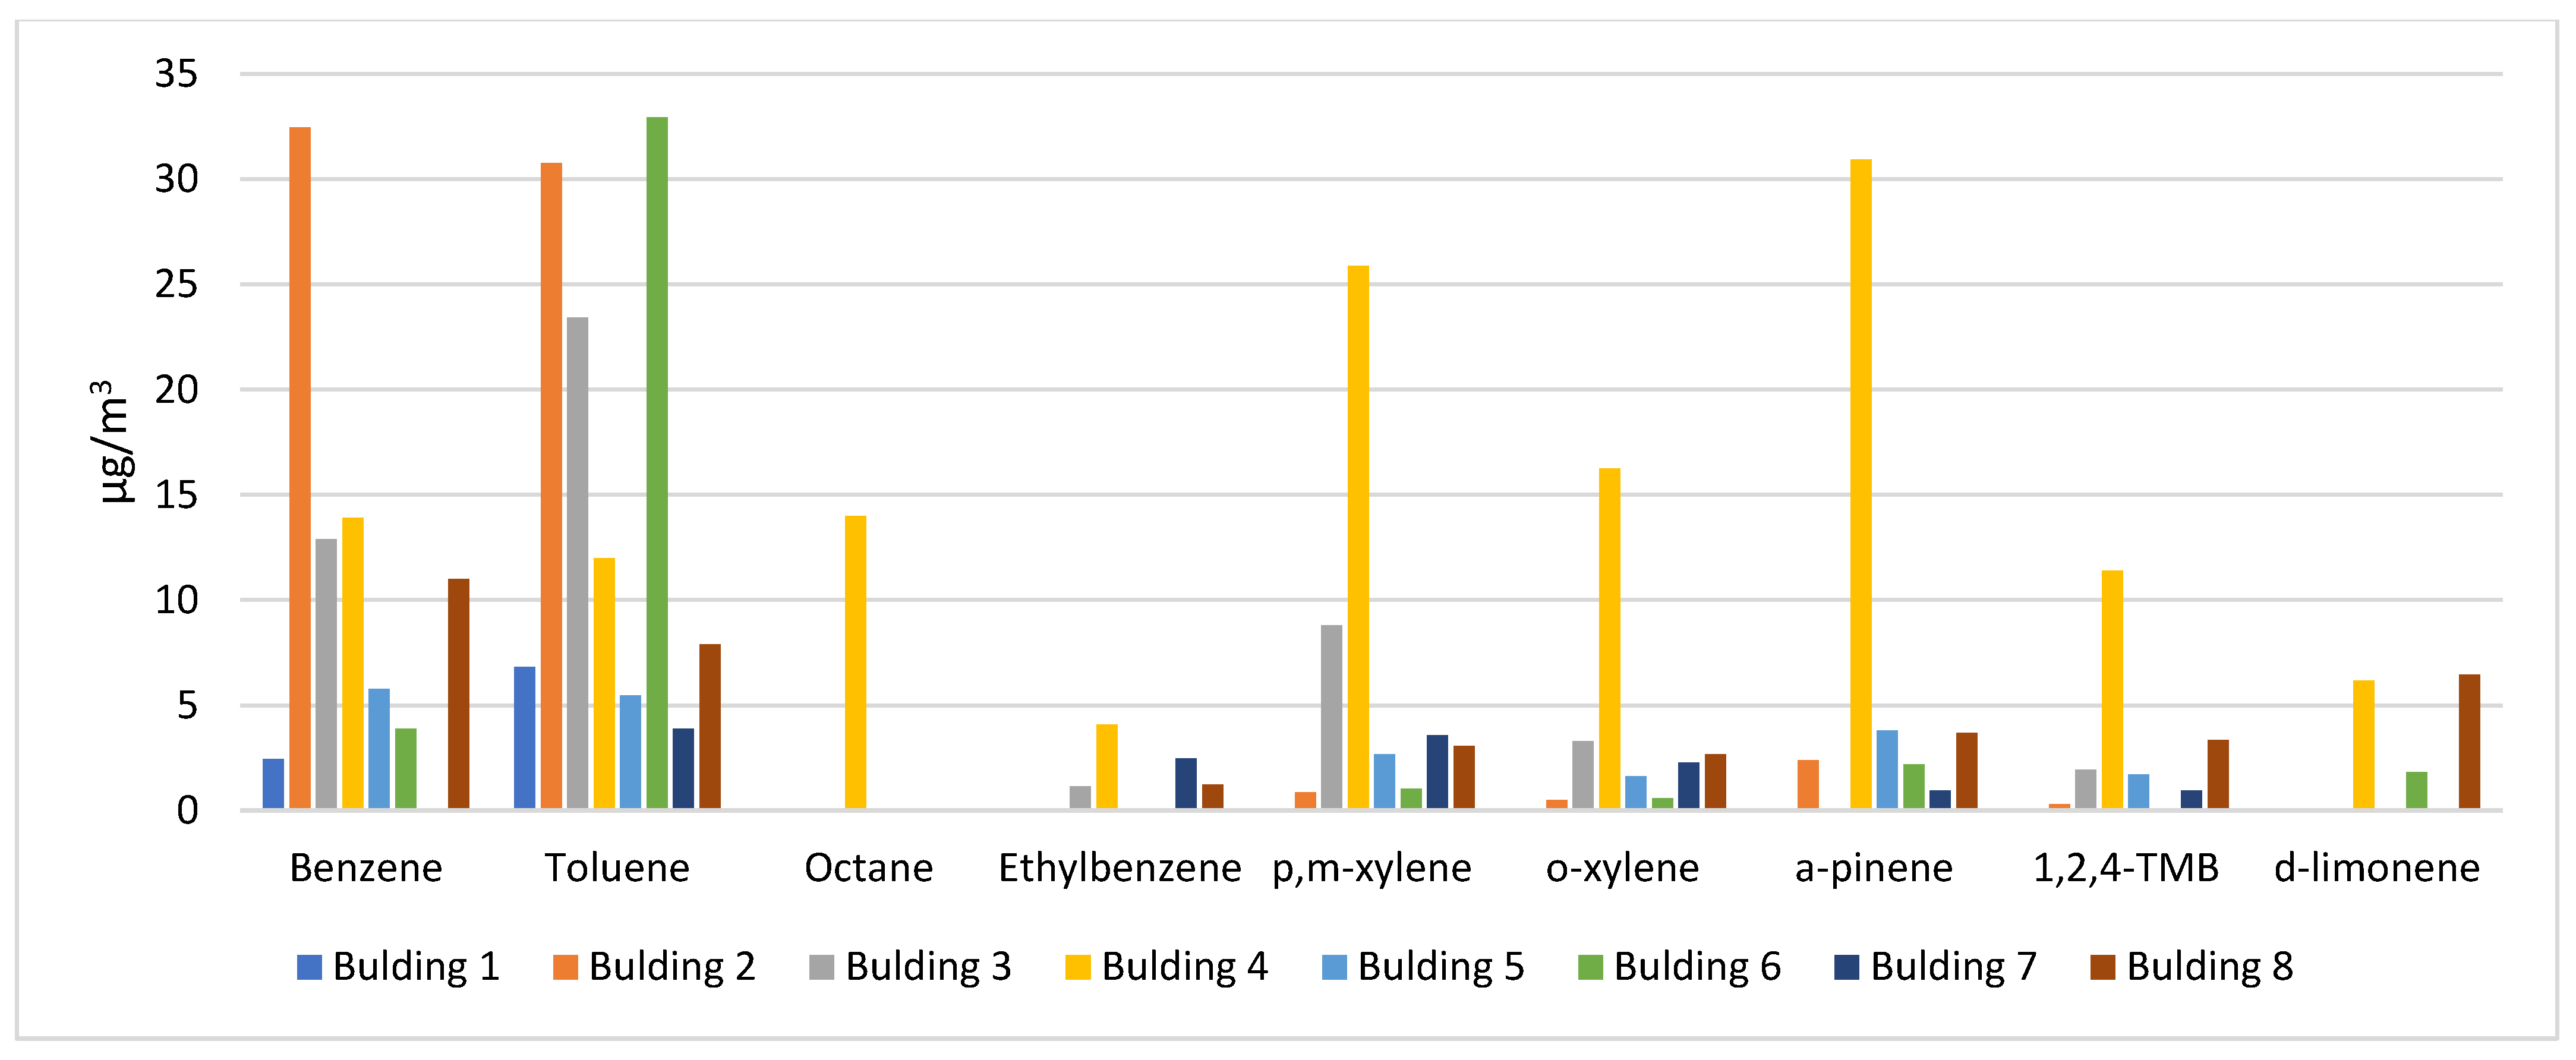
Figure 11. Among the measured VOCs, the highest median concentrations were found for benzene 11.0 μg m−3 (max: 32.5 μg m−3) and toluene 9.9 μg m−3 (max: 32.9 μg m
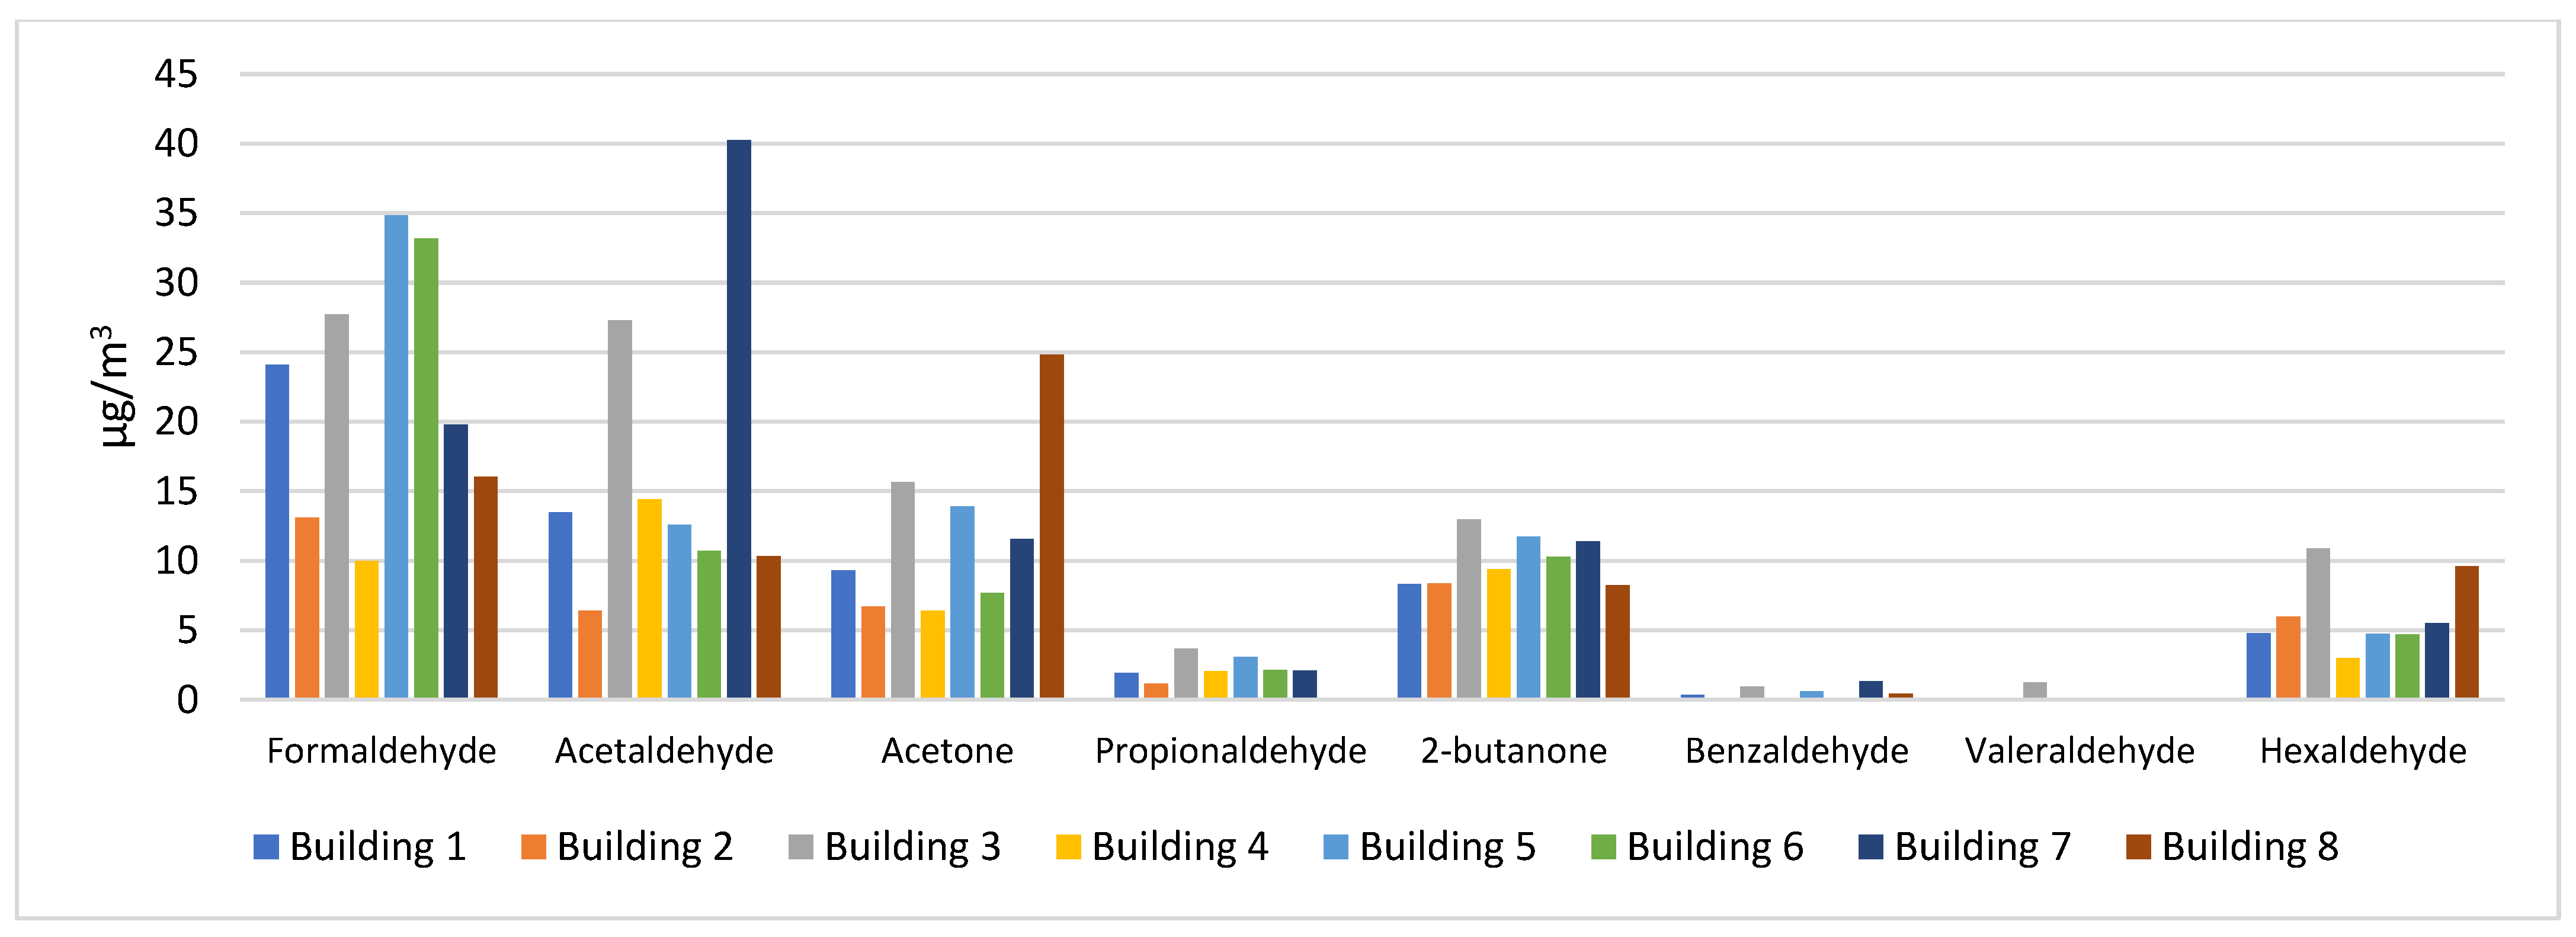
−3), while formaldehyde and acetaldehyde showed the highest indoor concentrations of the investigated aldehydes, with median values 21.9 μg m−3 (max: 34.8 μg m−3) and 13.0 μg m−3 (max: 40.3 μg m
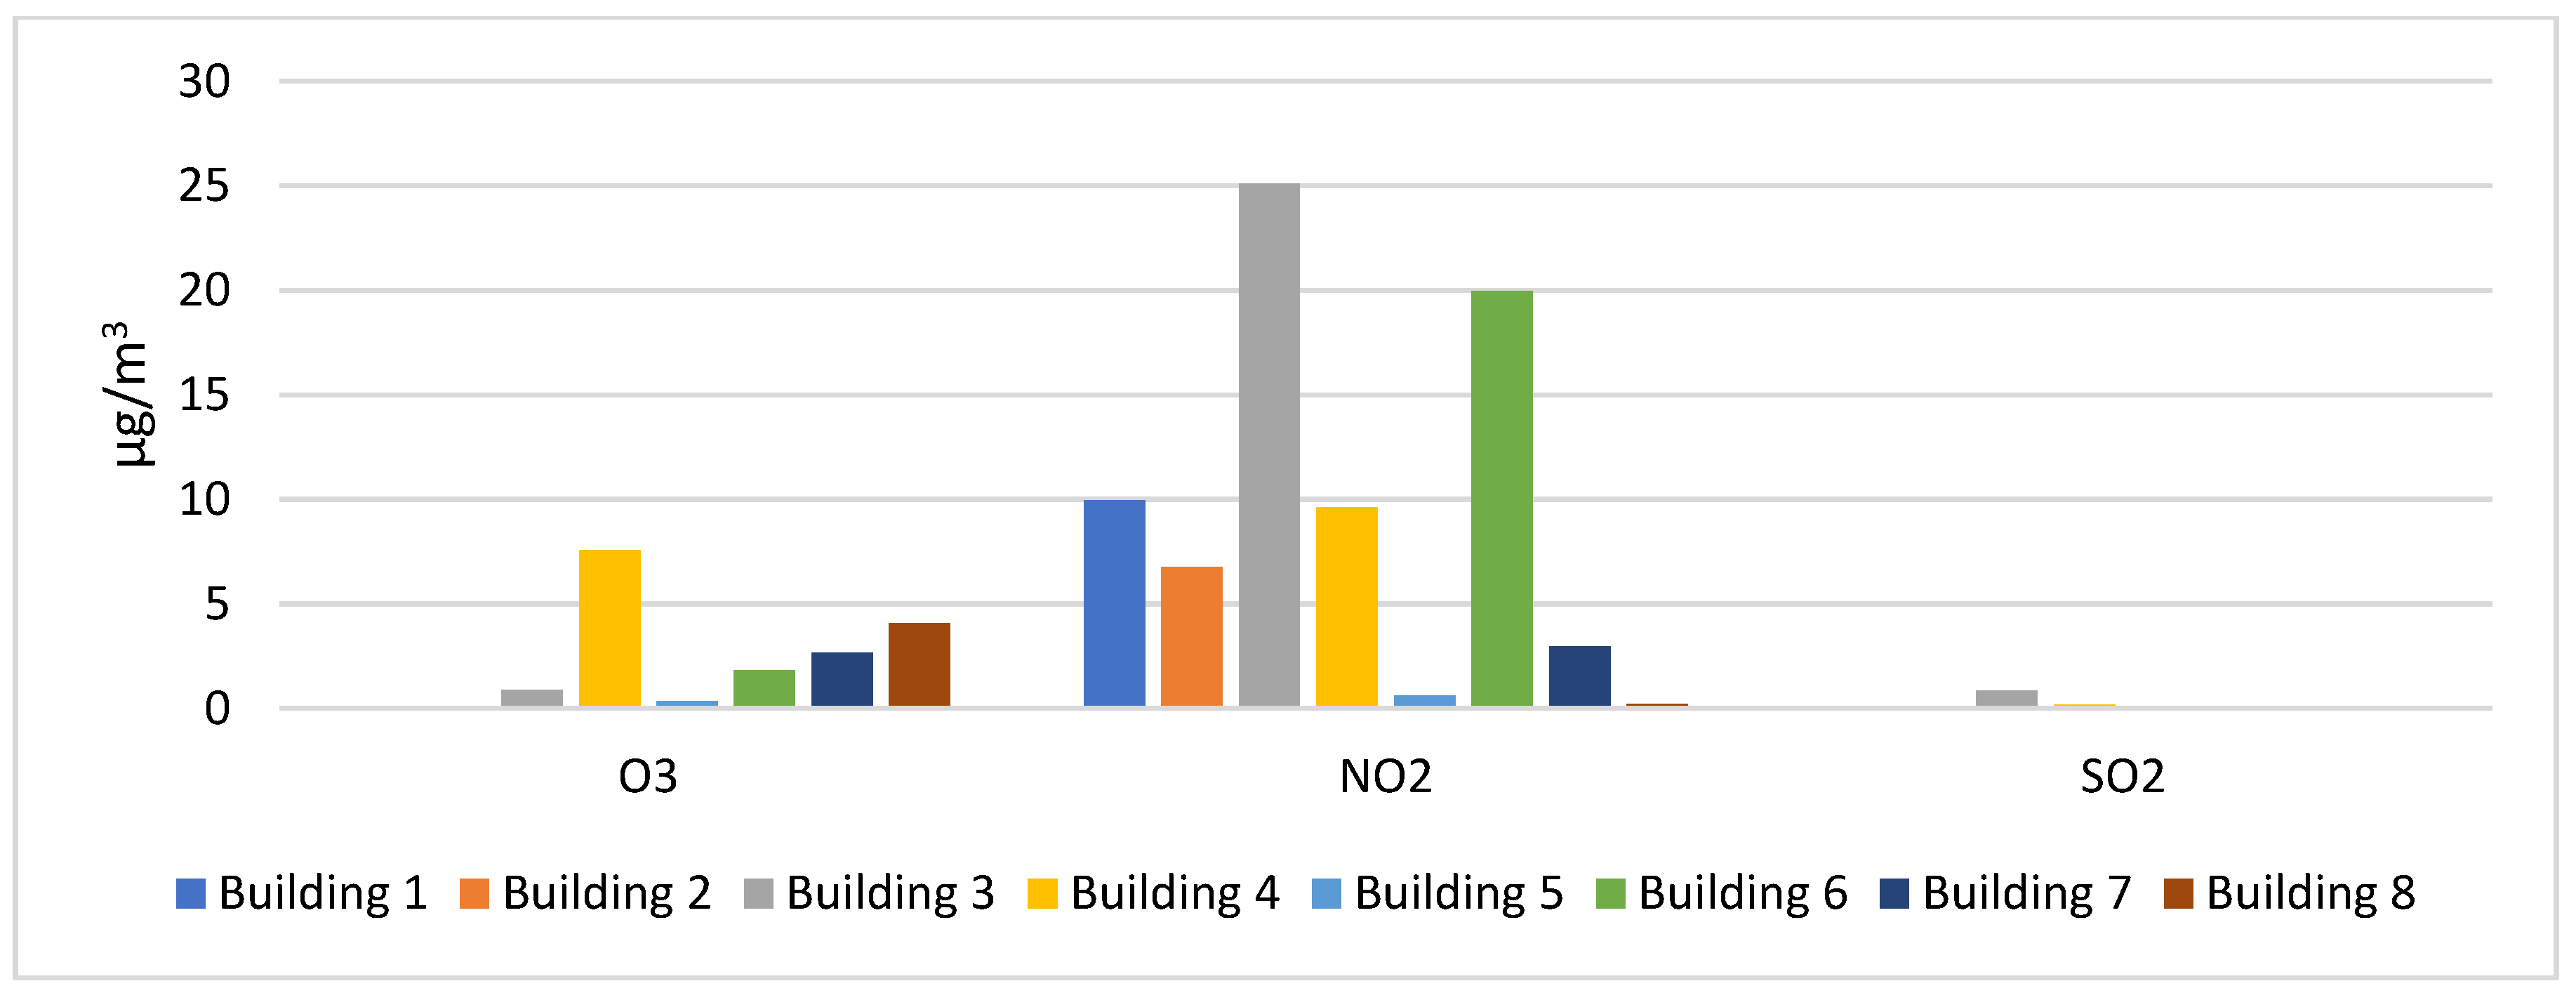
−3) respectively. Median concentration for O3 was 2.3 μg m−3 (max: 7.6 μg m−3), for NO2 was 8.2 μg m−3 (max: 25.1 μg m−3) and for SO2 was 0.1 μg m−3 (max: 0.9 μg m−3). Acrolein, crotonaldehyde, methacrolein and m-tolualdehyde were not detected in any building. Finally, in the majority of the buildings, octane, d -limonene and SO2 concentrations were below the limit of detection values.
As a first evaluation, the computed median and mean values of pollutant concentrations of this study were compared with the relevant seasonal (summer) values reported in the OFFICAIR project [17], a European project in which a wide scale of indoor air pollutants measurements in 37 office buildings were performed [58]. Overall, among the VOCs, benzene, toluene, and d-limonene concentrations were higher in the investigated buildings compared to OFFICAIR corresponding values (1.4, 8.1 and 4.7 μg m−3 respectively) while ethylbenzene (1.8 μg m−3), a-pinene (4.2 μg m−3) were of the same level. Aldehydes, formaldehyde, and acetaldehyde concentrations were higher, benzaldehyde was of the same order of magnitude while propionaldehyde, hexaldehyde and acrolein were present in lower levels. In addition, lower concentrations were observed for ozone and nitrogen dioxide. In another large-scale study in European countries, VOC measurements took place in 56 offices buildings [59]. The reported concentrations of benzene (14.6 μg m−3), toluene (35.1 μg m−3), d-limonene (34.6 μg m−3), Benzaldehyde (4.1 μg m−3), o-xylene (10.2 μg m−3) and p,m-xylene (22.2 μg m−3) were much higher than the present results. Regarding the concentrations levels of ethylbenzene, o-xylene and p,m-xylene were of the same magnitude as a recent study conducted in office rooms in Poland; on the other hand, benzene concentrations were higher [60].
Benzene, toluene and xylenes (BTEX) are volatile compounds related to outdoor sources, i.e., traffic, industrial emissions, combustions [61,62,63,64,65]. Buildings B3, B4 and B6 exhibited elevated levels of these compounds, possibly because of their vicinity to high traffic roads, crossroads, industrial units or areas of tracks maneuvering. This assumption was verified by the lower or close to unity values of indoor to outdoor ratios (I/O), characteristically for benzene: 1.1 (B3), 0.5 (B4), 0.7 (B6). However, VOCs are associated with indoor sources, as well. Specifically, toluene has been characteristically associated with environmental tobacco smoke [66]. Indeed, B1, B2, B3 present high levels of toluene likely due to smoking activity which was taking place either inside the office room (B1, I/O = 8) or in an adjacent outdoor smoking permitted area (B2, B3: I/0 = 2), where smoke penetrated indoors. Another indoor source of toluene and xylenes (usually combined with the presence of aldehydes) is emissions from building materials, paints, adhesives etc. [18,67,68]. A typical case is the one of the recently renovated building B7 (toluene I/O = 2.1; m,p-xylene I/O = 22) as well as the offices of B1 (toluene I/O = 8) which is adjacent to a tiles and cement-based products unit. Last but not least, the measured concentrations inside a building are significantly influenced by the air renewal pattern of the building. Building 4, which is characterized by inadequate natural or mechanical ventilation conditions (B4 was rated as one of the lowest in perception for fresh air), presents comparatively higher concentrations of terpenes (limonene, a-pinene) and xylenes, probably due to pollutants accumulation inside the building. Measured d-limonene and a-pinene median concentrations were considerably below the short term critical exposure limit (CEL) of 45 mg m−3 and 90 mg m−3 respectively, developed within the EPHECT (Emissions, exposure patterns and health effects of consumer products in the EU), project based on sensory irritation as the critical effect [69].
Carbonyls and aldehydes can originate from a wide variety of sources (building materials, equipment, adhesives, paints, smoking etc.,), the strength of which may significantly depend on the season i.e., differences in temperature, relative humidity and other environmental conditions [18]. Aldehydes also originate from O3-initiated reactions with many common and reactive VOCs that contain unsaturated carbon-carbon bonds, which react with O3 much more rapidly than saturated organic compounds. In the present study, among the aldehydes, formaldehyde, acetaldehyde, and acetone showed a noticeable differentiation in the investigated buildings. For propionaldehyde, 2-butanone, benzaldehyde and hexaldehyde, values were almost similar among the office rooms. Remarkably, the indoor to outdoor ratio was significantly higher than unity in all buildings (I/O range for formaldehyde: 3.3–11.4, acetaldehyde: 2–20 and acetone: 2.5–11.3), indicating the prevalence of indoor sources inside the studied office buildings. Indeed, formaldehyde has been associated with emissions from electronic office equipment such as laser printers and photocopiers [70]. Formaldehyde and acetaldehyde are associated with emissions from wooden-pressed products and wall paints [71,72,73,74,75]. The median formaldehyde concentration (21.93 μgm−3) was below the WHO Indoor Air Quality Guideline (IAQG) of 100 μgm−3 derived in 2010 based on sensory irritation as the critical effect [1] The campaign findings are in agreement with the literature, since similar materials and equipment are largely used in office rooms.
Nitrogen dioxide originates mainly from anthropogenic outdoor sources i.e., combustion of fossil fuels (coal, gas and oil). In the present study, indoor NO2 is observed to be higher inside buildings attached to high traffic roads (Buildings 3,4 and 6). The same findings were also revealed in a recent study in schools and offices where indoor exposure to NO2 from the infiltration of ambient air can be significant in urban areas, and in areas with high traffic volumes [76]. However, in the cases of B2 and B4, the ΝO2 I/O ratio was significantly higher than unity (3.8), implying the contribution of indoor sources and particularly combustion sources such as smoking, which is an activity that occasionally occurs inside the buildings. Regarding the O3, I/O ratio, the values ranged from 0.01 to 0.13. Ozone is very reactive with high oxidizing potential and thus there are many possible scenarios for ozone decay indoors. Concerning O3, there was an indication of strong sinks indoors as was also reported in office and school environments with similar values [77,78]. Building materials in offices and various types of design decorations can be considerable sinks for indoor ozone due to the irreversible heterogeneous reactions between ozone and material surfaces [79,80].
Concentrations of PM1, PM2.5 and PM10 during the working hours are presented in Table 4 (available for B3, B4, B5, B6). The highest mean values of fine and coarse fractions (PM2.5, PM10) were observed in B4 and B6 (though not important differences for PM2.5) possibly because of their location (close to traffic roads and industrial units). The mean values of PM2.5 and PM10 for all buildings were below the EU annual limits (25 μg/m3) and (40 μg/m3) respectively [81]. These results are similar to those of OFFICAIR project for Greece, where mean concentrations of PM2.5 was 13.3 μg/m3 and 14.3 μg/m3 during summer and winter [82] respectively, while being higher compared to mechanical ventilated offices [83]. Maximum values of all fractions can be attributed to penetration events caused during building cleaning activities or instant high occupancy. The highest maximum values were noticed for B4 (the building with the poorest ventilation), indirectly implying pollutants accumulation.

3.4. Associations between Indoor Concentrations and SBS Symptoms/IEQ Comfort Perception

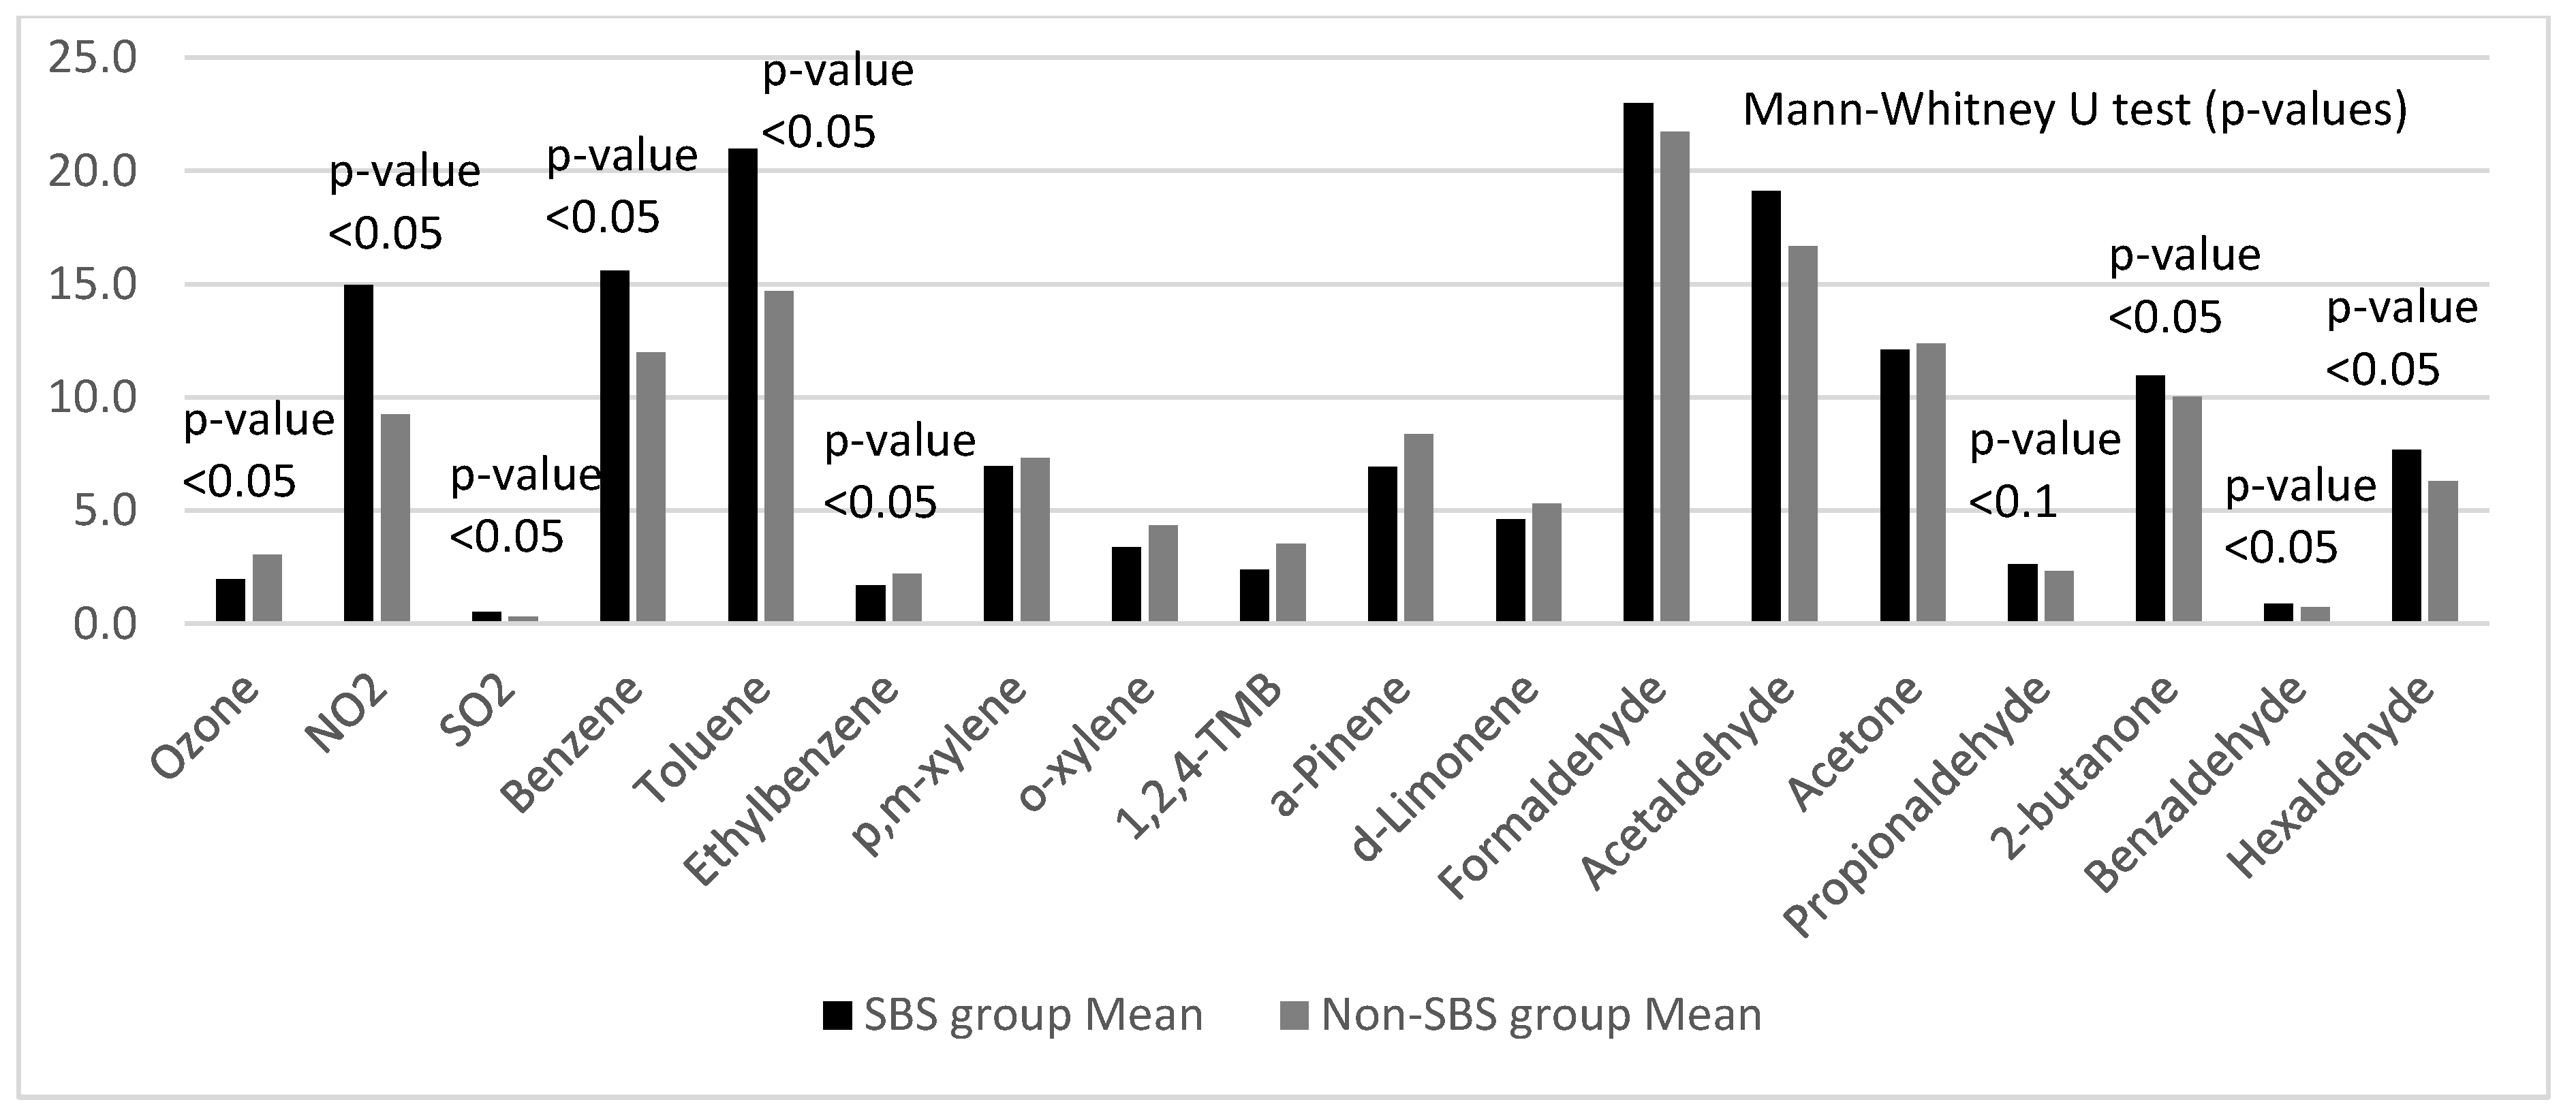
The variations in concentrations between the occupants belonging to the SBS group and the non-SBS group are shown in Figure 12. By applying the Mann–Whitney U test between groups of reporting SBS versus number of occupants who reported SBS symptoms were exposed to higher values with significant (p < 0.05) difference in NO2, benzene, toluene, Propionaldehyde, 2-butanone, benzaldehyde, and hexaldehyde.
As a next step and for exploring indoor concentration variations in greater depth, tests were performed for each SBS symptom subgroup (Table 5). For occupants who reported eye irritation, NO2 (p < 0.1), benzene and toluene, benzaldehyde and hexaldehyde (p < 0.05), concentrations were higher in their offices than in those of occupants without symptoms. In offices where occupants with reported respiratory symptoms, NO2 and toluene (p < 0.05), 2-butanone (p < 0.05) were also measured in higher levels. For the heart and skin symptoms groups, fewer compounds were revealed to be significantly higher (NO2, Hexaldehyde (p < 0.05) and toluene (p < 0.1), respectively). For offices where occupants reported general symptoms, mean concentration values of NO2, benzene and hexaldehyde (p < 0.05) were found in higher concentrations.
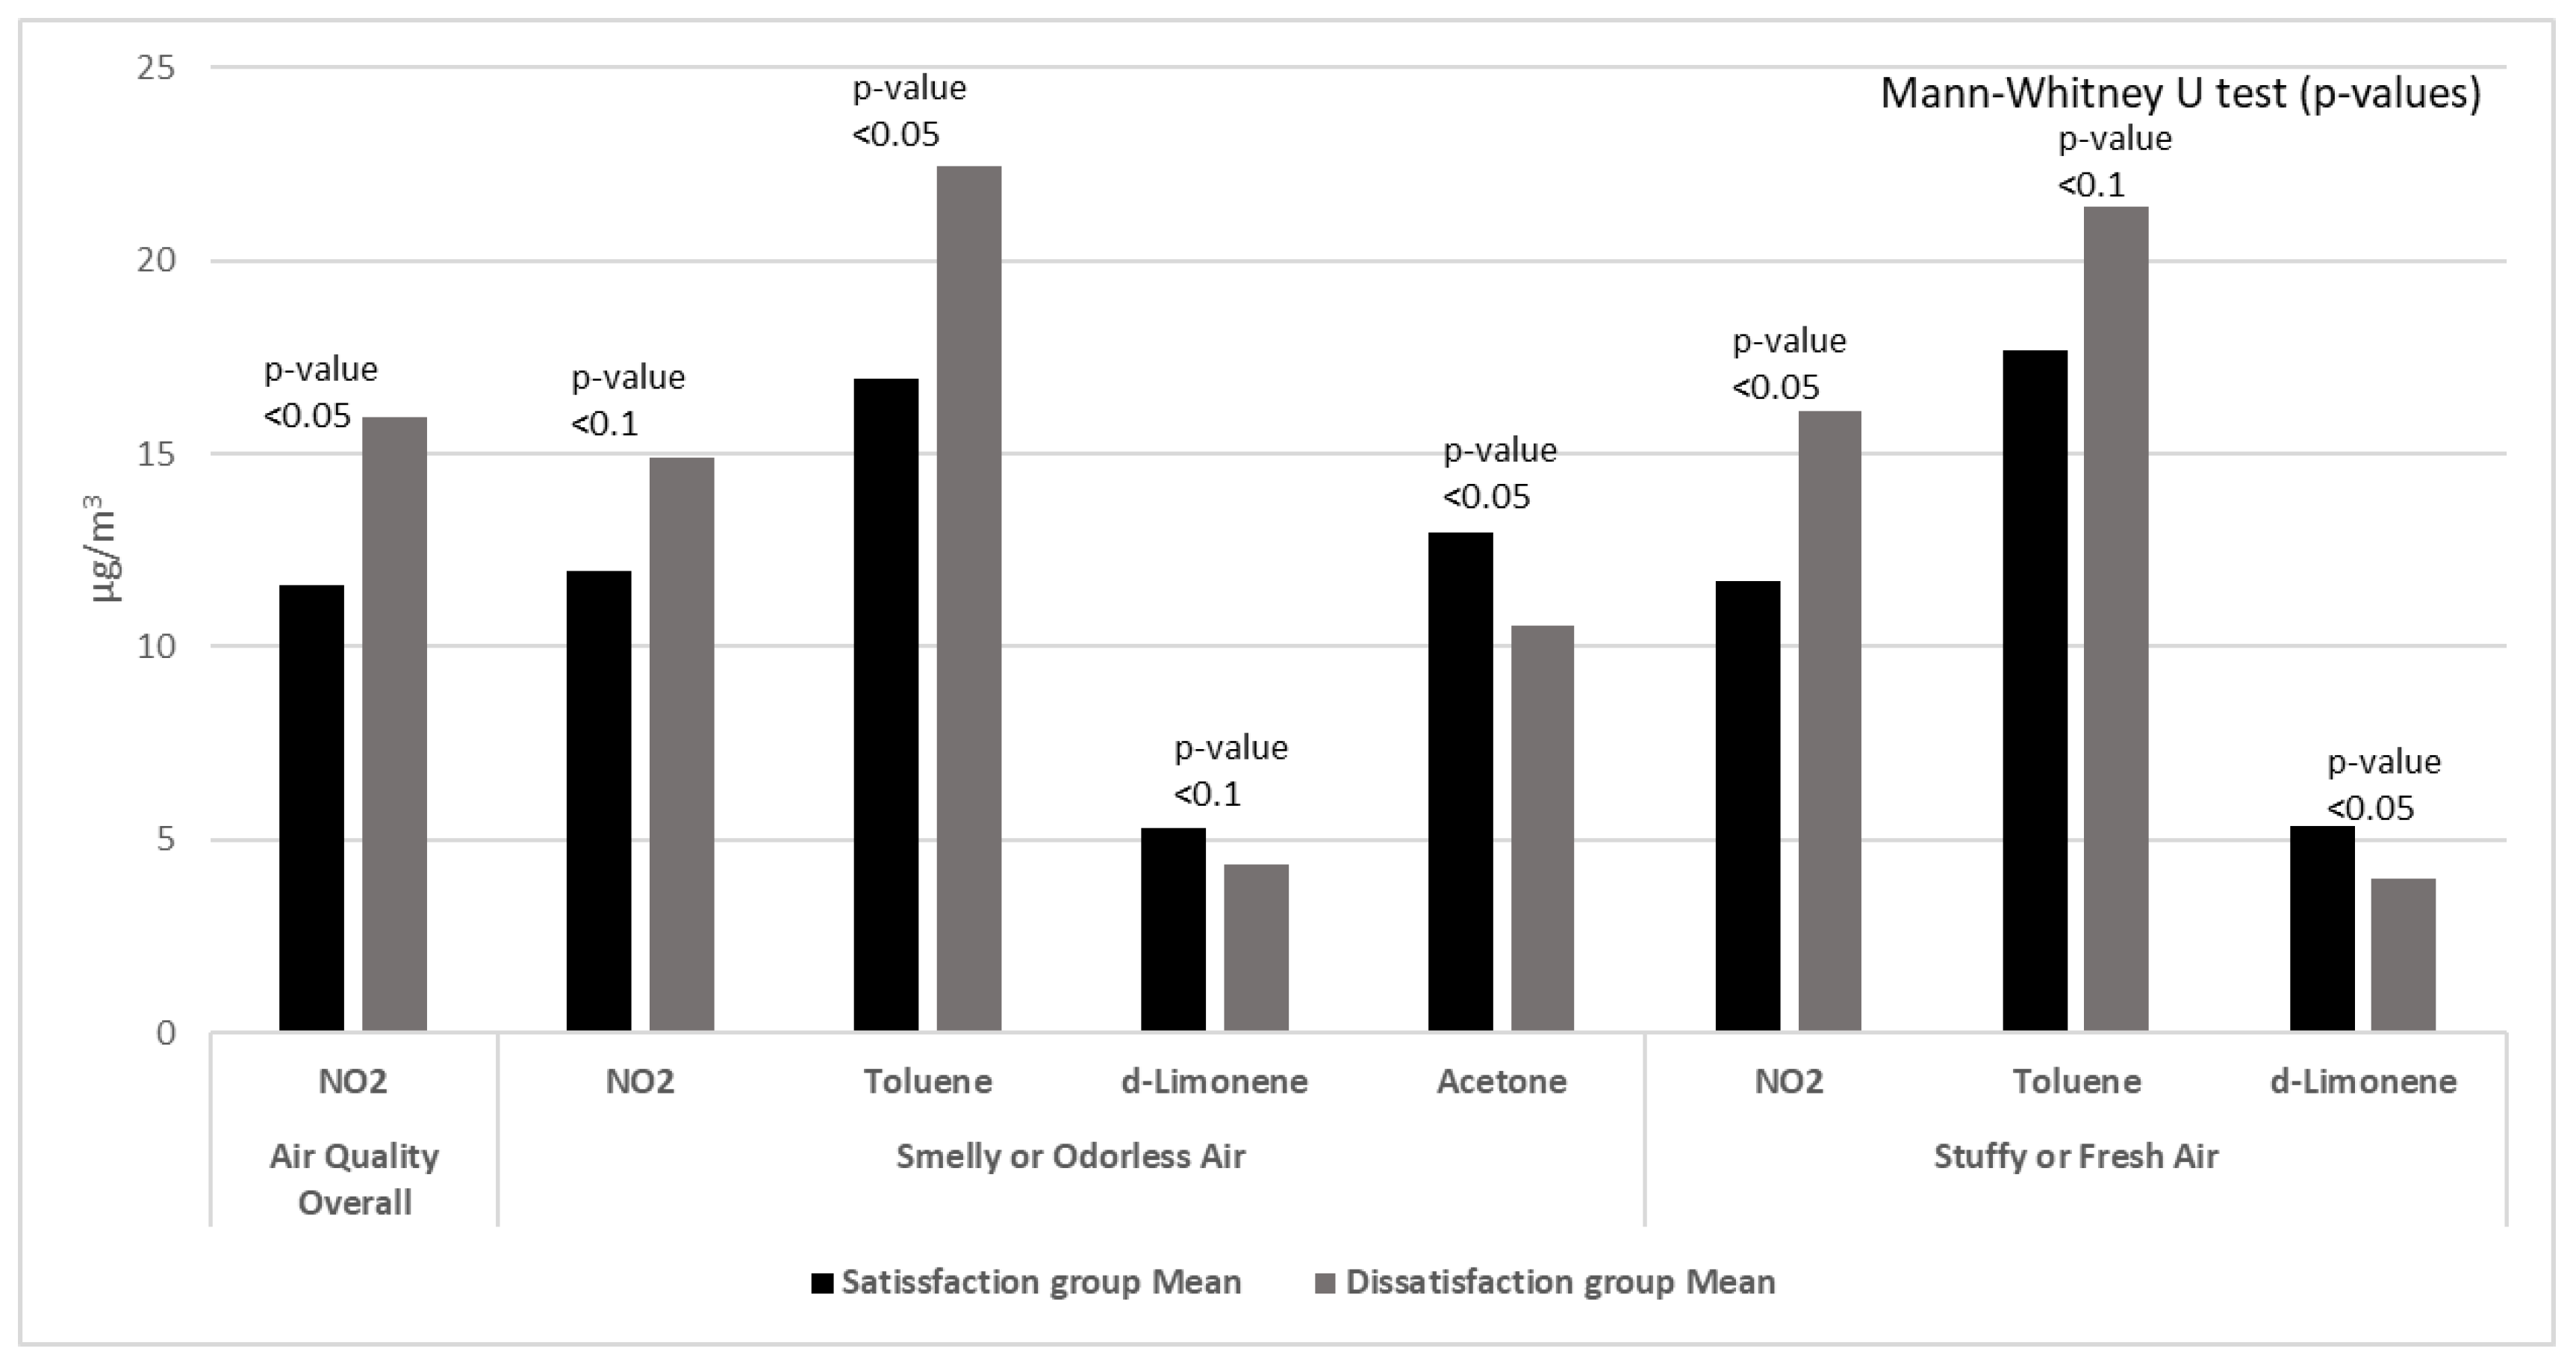
Further to the SBS subgrouping, the analysis was expanded by separating occupants into two groups of satisfied and unsatisfied occupants, regarding the perception of IAQ. Figure 13 presents the values for parameters related to IAQ, such as fresh air, odor, and overall perception. In general, the workplace of the IAQ-dissatisfied group appeared to be located in offices with higher pollutants concentrations. NO2 appeared to be statistically significant (p <0.05) for all IAQ parameters. In the case of odor or stuffy air, toluene and d-limonene were significantly higher.

3.5. Chronic Health Risk Assessment

Health risks due to inhalation exposures to benzene and formaldehyde for the staff in all investigated buildings were considered by applying both models, i.e., non-carcinogenic health risk and cancer risk assessment, using the methodologies described in Section 2.5. The computed HQ for the non-carcinogenic health risks and LCR values are depicted in Table 6 and Table 7, respectively.
As shown in Figure 9 and Figure 10, in all monitored office buildings, the concentrations of formaldehyde were below the limit (CAHCHO < 100 μg/m3) set by WHO [1]. On the other hand, concerning the benzene concentrations are concerned, only buildings 1 and 6 were within the acceptable range, building 5 was marginally above the permissible limits and all other buildings exceeded the recommended value of 5 μg/m3 [84] with a maximum value of 32.5 μg/m3. In particular, WHO considers benzene as a pollutant without a safe level [1].
The HQ value computed for the study of the non-carcinogenic health risk was higher than unity in all buildings for the pollutants under consideration, suggesting that workers in those particular office buildings might experience health problems. Such problems could include eyes and upper airways sensory irritation, along with lung effects involving asthma and allergies [1].
The cancer risk assessment revealed that for both pollutants, LCR values were higher than 1.0 × 10⁻⁶; however, values did not exceed the acceptable limits of cancer risk (10−6–10−4), for all investigated buildings. In addition, the highest LCR value for formaldehyde was observed in building 4, even though the highest formaldehyde concentration was measured in building 5. The same scenario appeared for the benzene study, where the maximum LCR value was computed for building 4 while building 2 benzene concentrations were the highest. This observation illustrates that pollutant concentrations should not be considered as the only factor affecting the quality of indoor environment. The risk assessment results in the case of formaldehyde showed that health problems could exist even though the pollutant concentration levels in the indoor environment were in low concentrations, as was also revealed in a recent study conducted in offices in China [85].

3.6. Strengths and Limitations

This study reports the current status of IAQ in offices in an area with high interest due to outdoor air pollution conditions. The simultaneous measurements and questionnaire collection, in the specific time of the pandemic period, provided a unique opportunity to provide new insights to the literature. Furthermore, it follows our previous large-scale study in Europe through the OFFICAIR project [17], and it attempts to expand further our understanding of indoor pollutant concentrations and the possible relationships with commonly reported health complaints. Also, it is the first study in this region that tries to reveal the impact of the COVID-19 pandemic’s countermeasures in the work environment.
Some limitations, however, should be noted. Interpretation of the results should be done with caution because data on IEQ were self-reported. Results reveal associations between SBS symptoms and chemical pollutants, but it is difficult to verify these associations until further toxicological tests in labs are performed. It is noted that the statistical correlations found in this study should be interpreted with caution. The possibility that an association was found by chance should not be excluded. Despite the limited samples collected from office buildings and the questionnaire completed by participants, the analysis provides essential information. Further large-scale studies should be conducted to focus on the above-mentioned limitations. Furthermore, the fact that air pollutant concentrations were measured passively for five workdays provides an objective, representative picture of IAQ levels but limits the possibility of performing a more detailed source apportionment study.

4. Conclusions

The present study revealed that good environment quality inside office buildings is still a crucial issue in Western Macedonia, Greece area. We expect that the findings of this study will help improve the office environments, in terms of air quality and comfort, in the “New normal era” after the COVID-19 pandemic. The main conclusions are summarized in the following:
-
The analysis revealed that thermal comfort has the biggest effect on their overall comfort. The most satisfying rated parameter was Light and was followed by Thermal, Noise and Air Quality comfort. Occupants with a higher level of personal control and comfort reported to be more productive within their working environment. The interaction with the available control types of the IEQ parameters and the frequency of utilizing them proved to contribute to their desired comfort achievement;
-
Focusing on the current post-pandemic period, it was quite interesting to find that employees clearly prefer to work in office buildings (no teleworking from home). In general, employees agree with the proposed measures (social distance, masks etc.). It was revealed that the occupants’ overall comfort for the IEQ and privacy perception parameters have substantially changed due to the COVID-19 pandemic;
-
Air pollutants measurements revealed the influence of both outdoor (traffic, industry) and indoor sources (smoking, cleaning, building materials, equipment emissions), which in combination with building location, ventilation pattern and occupancy characterize IAQ. In all buildings, formaldehyde, acetaldehyde, and acetone were significantly higher indoors, indicating the prevalence of indoor sources;
-
The results indicated that there is an identifiable population of occupants who reported SBS symptoms, as well as that occupants in offices with higher concentrations were more likely to report health complaints. Air pollutants, such as NO2, benzene and toluene, were associated with self-reported health symptoms despite their low concentration levels. Air quality was revealed to still play a crucial role especially in occupants’ perceived health at offices located in areas with extensive industrial activities regardless of their gradual reduction in recent years;
-
According to the exposure risk analysis, the computed HQ values imply the appearance of health problems in all cases. In addition, the calculated LCR values indicated that staying for long hours in the investigated office buildings poses cancer risks attributed to both pollutants under consideration, even in the case of formaldehyde, where the concentrations levels remained within acceptable limits.

Author Contributions

Conceptualization, I.S. and D.S.; Methodology, I.S. and D.S.; Validation, D.S., G.P. (Giorgos Panaras) and J.B.; Formal analysis, I.S.; Investigation, I.S. and G.P. (Giannis Papadopoulos); Resources, E.T., G.P. (Giorgos Panaras) and J.B.; Data curation, I.S., G.P. (Giannis Papadopoulos), T.X. and E.T.; Writing—original draft, I.S.; Writing—review & editing, G.P. (Giannis Papadopoulos), D.S., T.X., E.T., G.P. (Giorgos Panaras) and J.B.; Visualization, I.S.; Supervision, J.B.; Project administration, J.B.; Funding acquisition, I.S. and J.B. All authors have read and agreed to the published version of the manuscript.

Funding

This work was funded by the National Strategic Reference Framework (NSRF) project “EDBM103—entitled: Support for researchers in emphasis on young researchers—part B”.

Institutional Review Board Statement

The study was approved by the Ethics Committee of University of Western Macedonia—UOWM (protocol code 23/2021 and date of approval 21 December 2020).

Informed Consent Statement

Informed consent was obtained from all subjects involved in the study.

Data Availability Statement

Data available on request due to privacy restrictions.

Acknowledgments

This work was supported by National Strategic Reference Framework (NSRF) projects (a) EDBM103—entitled: Support for researchers in emphasis on young researchers—part B and (b) Development of New Innovative Low Carbon Energy Technologies to Enhance Excellence in the Region of Western Macedonia.

Conflicts of Interest

The authors declare no conflict of interest.

References

  1. WHO. WHO Guidelines for Indoor Air Quality: Selected Pollutants; WHO: Geneve, Switzerland, 2010. [Google Scholar]
  2. Carrer, P.; Wolkoff, P. Assessment of Indoor Air Quality Problems in Office-Like Environments: Role of Occupational Health Services. Int. J. Environ. Res. Public Health 2018, 15, 741. [Google Scholar] [CrossRef] [PubMed] [Green Version]
  3. Roh, T.; Moreno-Rangel, A.; Baek, J.; Obeng, A.; Hasan, N.T.; Carrillo, G. Indoor Air Quality and Health Outcomes in Employees Working from Home during the COVID-19 Pandemic: A Pilot Study. Atmosphere 2021, 12, 1665. [Google Scholar] [CrossRef]
  4. Ghaffarianhoseini, A.; AlWaer, H.; Omrany, H.; Ghaffarianhoseini, A.; Alalouch, C.; Clements-Croome, D.; Tookey, J. Sick Building Syndrome: Are We Doing Enough? Archit. Sci. Rev. 2018, 61, 99–121. [Google Scholar] [CrossRef] [Green Version]
  5. Papadopoulos, G.; Tolis, E.I.; Panaras, G. IEQ Assessment in Free-Running University Classrooms. Sci. Technol. Built Environ. 2022, 28, 823–842. [Google Scholar] [CrossRef]
  6. Sakellaris, I.; Saraga, D.; Mandin, C.; Roda, C.; Fossati, S.; de Kluizenaar, Y.; Carrer, P.; Dimitroulopoulou, S.; Mihucz, V.; Szigeti, T.; et al. Perceived Indoor Environment and Occupants’ Comfort in European “Modern” Office Buildings: The OFFICAIR Study. Int. J. Environ. Res. Public Health 2016, 13, 444. [Google Scholar] [CrossRef] [Green Version]
  7. Umishio, W.; Kagi, N.; Asaoka, R.; Hayashi, M.; Sawachi, T.; Ueno, T. Work Productivity in the Office and at Home during the COVID-19 Pandemic: A Cross-Sectional Analysis of Office Workers in Japan. Indoor Air 2022, 32, e12913. [Google Scholar] [CrossRef]
  8. Mujan, I.; Anđelković, A.S.; Munćan, V.; Kljajić, M.; Ružić, D. Influence of Indoor Environmental Quality on Human Health and Productivity—A Review. J. Clean. Prod. 2019, 217, 646–657. [Google Scholar] [CrossRef]
  9. Royal College of Physicians of London (Ed.) Every Breath We Take: The Lifelong Impact of Air Pollution: Report of a Working Party; Royal College of Physicians of London: London, UK, 2016; ISBN 978-1-86016-567-2. [Google Scholar]
  10. Sundell, J.; Anderson, B.; Anderson, K.; Lindvall, T. Volatile Organic Compounds in Ventilating Air in Buildings at Different Sampling Points in the Buildings and Their Relationship with the Prevalence of Occupant Symptoms. Indoor Air 1993, 3, 82–93. [Google Scholar] [CrossRef]
  11. Awada, M.; Becerik-Gerber, B.; Hoque, S.; O’Neill, Z.; Pedrielli, G.; Wen, J.; Wu, T. Ten Questions Concerning Occupant Health in Buildings during Normal Operations and Extreme Events Including the COVID-19 Pandemic. Build. Environ. 2021, 188, 107480. [Google Scholar] [CrossRef]
  12. Hui, D.S.; Azhar, E.I.; Madani, T.A.; Ntoumi, F.; Kock, R.; Dar, O.; Ippolito, G.; Mchugh, T.D.; Memish, Z.A.; Drosten, C.; et al. The Continuing 2019-NCoV Epidemic Threat of Novel Coronaviruses to Global Health—The Latest 2019 Novel Coronavirus Outbreak in Wuhan, China. Int. J. Infect. Dis. 2020, 91, 264–266. [Google Scholar] [CrossRef]
  13. Thompson, R. Pandemic Potential of 2019-NCoV. Lancet Infect. Dis. 2020, 20, 280. [Google Scholar] [CrossRef] [Green Version]
  14. Ekpanyaskul, C.; Padungtod, C. Occupational Health Problems and Lifestyle Changes Among Novice Working-From-Home Workers Amid the COVID-19 Pandemic. Saf. Health Work 2021, 12, 384–389. [Google Scholar] [CrossRef]
  15. Wolkoff, P. Indoor Air Pollutants in Office Environments: Assessment of Comfort, Health, and Performance. Int. J. Hyg. Environ. Health 2013, 216, 371–394. [Google Scholar] [CrossRef]
  16. Cacho, C.; Ventura Silva, G.; Martins, A.; De Oliveira Fernandes, E.; Saraga, D.; Dimitroulopoulou, C.; Bartzis, J.G.; Rembges, D.; Barrero-Moreno, J.; Kotzias, D. Dimitrios Air Pollutants in Office Environments and Emissions from Electronic Equipment: A Review. Fresenius Environ. Bull. 2013, 22, 2488. [Google Scholar]
  17. OFFICAIR Project. Available online: https://cordis.europa.eu/project/id/265267 (accessed on 12 January 2023).
  18. Campagnolo, D.; Saraga, D.E.; Cattaneo, A.; Spinazzè, A.; Mandin, C.; Mabilia, R.; Perreca, E.; Sakellaris, I.; Canha, N.; Mihucz, V.G.; et al. VOCs and Aldehydes Source Identification in European Office Buildings—The OFFICAIR Study. Build. Environ. 2017, 115, 18–24. [Google Scholar] [CrossRef]
  19. Phillips, J.L.; Field, R.; Goldstone, M.; Reynolds, G.L.; Lester, J.N.; Perry, R. Relationships between Indoor and Outdoor Air Quality in Four Naturally Ventilated Offices in the United Kingdom. Atmos. Environ. Part A. Gen. Top. 1993, 27, 1743–1753. [Google Scholar] [CrossRef]
  20. Shrubsole, C.; Dimitroulopoulou, S.; Foxall, K.; Gadeberg, B.; Doutsi, A. IAQ Guidelines for Selected Volatile Organic Compounds (VOCs) in the UK. Build. Environ. 2019, 165, 106382. [Google Scholar] [CrossRef]
  21. Sakellaris, I.; Saraga, D.; Mandin, C.; Kluizenaar, Y.; Fossati, S.; Spinazzè, A.; Cattaneo, A.; Mihucz, V.; Szigeti, T.; Oliveira Fernandes, E.; et al. Association of Subjective Health Symptoms with Indoor Air Quality in European Office Buildings: The OFFICAIR Project. Indoor Air 2021, 31, 426–439. [Google Scholar] [CrossRef]
  22. Bédard, A.; Varraso, R.; Sanchez, M.; Clavel-Chapelon, F.; Zock, J.-P.; Kauffmann, F.; Le Moual, N. Cleaning Sprays, Household Help and Asthma among Elderly Women. Respir. Med. 2014, 108, 171–180. [Google Scholar] [CrossRef] [Green Version]
  23. Jaakkola, J.J.; Jaakkola, M.S. Professional Cleaning and Asthma. Curr. Opin. Allergy Clin. Immunol. 2006, 6, 85–90. [Google Scholar] [CrossRef]
  24. Nazaroff, W.W.; Weschler, C.J. Cleaning Products and Air Fresheners: Exposure to Primary and Secondary Air Pollutants. Atmos. Environ. 2004, 38, 2841–2865. [Google Scholar] [CrossRef]
  25. Saraga, D.E.; Maggos, T.; Missia, D.A.; Tolis, E.I.; Vasilakos, C.; Bartzis, J.G. Secondary Organic Particles Formation from Ozone-Terpenes Reaction: A Case Study in a Residence of a Mediterranean City. Fresenius Environ. Bull. 2010, 19, 7. [Google Scholar]
  26. Takigawa, T.; Wang, B.-L.; Sakano, N.; Wang, D.-H.; Ogino, K.; Kishi, R. A Longitudinal Study of Environmental Risk Factors for Subjective Symptoms Associated with Sick Building Syndrome in New Dwellings. Sci. Total Environ. 2009, 407, 5223–5228. [Google Scholar] [CrossRef] [PubMed]
  27. Jones, E.R.; Cedeño Laurent, J.G.; Young, A.S.; MacNaughton, P.; Coull, B.A.; Spengler, J.D.; Allen, J.G. The Effects of Ventilation and Filtration on Indoor PM2.5 in Office Buildings in Four Countries. Build. Environ. 2021, 200, 107975. [Google Scholar] [CrossRef] [PubMed]
  28. Papadopoulos, G.; Panaras, G.; Tolis, E. Thermal Comfort and Indoor Air Quality Assessment in University Classrooms. IOP Conf. Ser. Earth Environ. Sci. 2020, 410, 012095. [Google Scholar] [CrossRef]
  29. Dormont, L.; Bessière, J.-M.; Cohuet, A. Human Skin Volatiles: A Review. J. Chem. Ecol. 2013, 39, 569–578. [Google Scholar] [CrossRef]
  30. Wisthaler, A.; Weschler, C.J. Reactions of Ozone with Human Skin Lipids: Sources of Carbonyls, Dicarbonyls, and Hydroxycarbonyls in Indoor Air. Proc. Natl. Acad. Sci. USA 2010, 107, 6568–6575. [Google Scholar] [CrossRef] [Green Version]
  31. Tolis, E.; Saraga, D.; Ammari, G.; Gkanas, E.; Gougoulas, T.; Papaioannou, C.; Sarioglou, A.; Kougioumtzidis, E.; Skemperi, A.; Bartzis, J. Chemical Characterization of Particulate Matter (PM) and Source Apportionment Study during Winter and Summer Period for the City of Kozani, Greece. Open Chem. 2014, 12, 643–651. [Google Scholar] [CrossRef]
  32. Samara, C. Chemical Mass Balance Source Apportionment of TSP in a Lignite-Burning Area of Western Macedonia, Greece. Atmos. Environ. 2005, 39, 6430–6443. [Google Scholar] [CrossRef]
  33. Triantafyllou, A.G. PM10 Pollution Episodes as a Function of Synoptic Climatology in a Mountainous Industrial Area. Environ. Pollut. 2001, 112, 491–500. [Google Scholar] [CrossRef]
  34. Sakellaris, I.; Saraga, D.; Mandin, C.; de Kluizenaar, Y.; Fossati, S.; Spinazzè, A.; Cattaneo, A.; Szigeti, T.; Mihucz, V.; de Oliveira Fernandes, E.; et al. Personal Control of the Indoor Environment in Offices: Relations with Building Characteristics, Influence on Occupant Perception and Reported Symptoms Related to the Building—The Officair Project. Appl. Sci. 2019, 9, 3227. [Google Scholar] [CrossRef] [Green Version]
  35. Bluyssen, P.M.; Roda, C.; Mandin, C.; Fossati, S.; Carrer, P.; de Kluizenaar, Y.; Mihucz, V.G.; Fernandes, E.d.O.; Bartzis, J. Self-Reported Health and Comfort in ‘Modern’ Office Buildings: First Results from the European OFFICAIR Study. Indoor Air 2016, 26, 298–317. [Google Scholar] [CrossRef]
  36. Boerstra, A.; Beuker, T.; Loomans, M.; Hensen, J. Impact of Available and Perceived Control on Comfort and Health in European Offices. Archit. Sci. Rev. 2013, 56, 30–41. [Google Scholar] [CrossRef] [Green Version]
  37. Paciuk, M. The Role of Personal Control of the Environment in Thermal Comfort and Satisfaction at the Workplace; University of Wisconsin-Milwaukee: Milwaukee, WI, USA, 1989. [Google Scholar]
  38. ISO 16000-1:2004(En); Indoor Air—Part 1: General Aspects of Sampling Strategy. ISO: Geneva, Switzerland, 2004.
  39. ISO 16017-2:2003(En); Indoor, Ambient and Workplace Air—Sampling and Analysis of Volatile Organic Compounds by Sorbent Tube/Thermal Desorption/Capillary Gas Chromatography—Part 2: Diffusive Sampling. ISO: Geneva, Switzerland, 2003.
  40. ISO 16000-4:2004; Indoor Air—Part 4: Determination of Formaldehyde—Diffusive Sampling Method. ISO: Geneva, Switzerland, 2004.
  41. OEHHA. Notice of Adoption of Air Toxics Hot Spots Program Guidance Manual for the Preparation of Health Risk Assessments 2015; OEHHA: Oakland, CA, USA, 2015. [Google Scholar]
  42. IARC. Outdoor Air Pollution. IARC Monographs on the Evaluation of Carcinogenic Risks to Humans. International Agency for Research on Cancer; World Health Organization: Geneva, Switzerland, 2015; Volume 109, ISBN 978-92-832-0147-2. [Google Scholar]
  43. U.S. Environmental Protection Agency Office. Risk Assessment Guidance for Superfund (RAGS): Part A. Available online: https://www.epa.gov/risk/risk-assessment-guidance-superfund-rags-part (accessed on 9 November 2022).
  44. Demirel, G.; Özden, Ö.; Döğeroğlu, T.; Gaga, E.O. Personal Exposure of Primary School Children to BTEX, NO2 and Ozone in Eskişehir, Turkey: Relationship with Indoor/Outdoor Concentrations and Risk Assessment. Sci. Total Environ. 2014, 473–474, 537–548. [Google Scholar] [CrossRef]
  45. Guo, H.; Lee, S.C.; Chan, L.Y.; Li, W.M. Risk Assessment of Exposure to Volatile Organic Compounds in Different Indoor Environments. Environ. Res. 2004, 94, 57–66. [Google Scholar] [CrossRef]
  46. Chalvatzaki, E.; Chatoutsidou, S.E.; Lehtomäki, H.; Almeida, S.M.; Eleftheriadis, K.; Hänninen, O.; Lazaridis, M. Characterization of Human Health Risks from Particulate Air Pollution in Selected European Cities. Atmosphere 2019, 10, 96. [Google Scholar] [CrossRef] [Green Version]
  47. Maertens, R.M.; Bailey, J.; White, P.A. The Mutagenic Hazards of Settled House Dust: A Review. Mutat. Res. 2004, 567, 401–425. [Google Scholar] [CrossRef]
  48. Maertens, R.M.; Yang, X.; Zhu, J.; Gagne, R.W.; Douglas, G.R.; White, P.A. Mutagenic and Carcinogenic Hazards of Settled House Dust I: Polycyclic Aromatic Hydrocarbon Content and Excess Lifetime Cancer Risk from Preschool Exposure. Environ. Sci. Technol. 2008, 42, 1747–1753. [Google Scholar] [CrossRef] [Green Version]
  49. Pachoulis, M.; Maggos, T.; Panagopoulos, P.; Dasopoulou, M.; Balla, D.; Stamatelopoulou, A.; Manousakas, M.I.; Eleftheriadis, K.; Saraga, D. Population Health Risks Assessment from Air Pollution Exposure in an Industrialized Residential Area in Greece. Atmosphere 2022, 13, 615. [Google Scholar] [CrossRef]
  50. Cao, B.; Ouyang, Q.; Zhu, Y.; Huang, L.; Hu, H.; Deng, G. Development of a Multivariate Regression Model for Overall Satisfaction in Public Buildings Based on Field Studies in Beijing and Shanghai. Build. Environ. 2012, 47, 394–399. [Google Scholar] [CrossRef]
  51. Marino, C.; Nucara, A.; Pietrafesa, M. Proposal of Comfort Classification Indexes Suitable for Both Single Environments and Whole Buildings. Build. Environ. 2012, 57, 58–67. [Google Scholar] [CrossRef]
  52. Veitch, J.A.; Charles, K.E.; Farley, K.M.J.; Newsham, G.R. A Model of Satisfaction with Open-Plan Office Conditions: COPE Field Findings. J. Environ. Psychol. 2007, 27, 177–189. [Google Scholar] [CrossRef]
  53. Rijal, H.B.; Humphreys, M.A.; Nicol, J.F. Understanding Occupant Behaviour: The Use of Controls in Mixed-Mode Office Buildings. Build. Res. Inf. 2009, 37, 381–396. [Google Scholar] [CrossRef]
  54. de Dear, R.J.; Akimoto, T.; Arens, E.A.; Brager, G.; Candido, C.; Cheong, K.W.D.; Li, B.; Nishihara, N.; Sekhar, S.C.; Tanabe, S.; et al. Progress in Thermal Comfort Research over the Last Twenty Years. Indoor Air 2013, 23, 442–461. [Google Scholar] [CrossRef] [PubMed] [Green Version]
  55. Oh, M.S.; Ahn, J.H.; Kim, D.W.; Jang, D.S.; Kim, Y. Thermal Comfort and Energy Saving in a Vehicle Compartment Using a Localized Air-Conditioning System. Appl. Energy 2014, 133, 14–21. [Google Scholar] [CrossRef]
  56. Hong, T.; Chen, C.; Wang, Z.; Xu, X. Linking Human-Building Interactions in Shared Offices with Personality Traits. Build. Environ. 2020, 170, 106602. [Google Scholar] [CrossRef] [Green Version]
  57. Leaman, A.; Bordass, B. Assessing Building Performance in Use 4: The Probe Occupant Surveys and Their Implications. Build. Res. Inf. 2001, 29, 129–143. [Google Scholar] [CrossRef]
  58. Mandin, C.; Trantallidi, M.; Cattaneo, A.; Canha, N.; Mihucz, V.G.; Szigeti, T.; Mabilia, R.; Perreca, E.; Spinazzè, A.; Fossati, S.; et al. Assessment of Indoor Air Quality in Office Buildings across Europe—The OFFICAIR Study. Sci. Total Environ. 2017, 579, 169–178. [Google Scholar] [CrossRef] [Green Version]
  59. Zuraimi, M.S.; Roulet, C.-A.; Tham, K.W.; Sekhar, S.C.; David Cheong, K.W.; Wong, N.H.; Lee, K.H. A Comparative Study of VOCs in Singapore and European Office Buildings. Build. Environ. 2006, 41, 316–329. [Google Scholar] [CrossRef]
  60. Kozielska, B.; Kaleta, D. Assessment of Indoor Benzene and Its Alkyl Derivatives Concentrations in Offices Belonging to University of Technology (Poland). Atmosphere 2020, 12, 51. [Google Scholar] [CrossRef]
  61. Edwards, R.D.; Jurvelin, J.; Koistinen, K.; Saarela, K.; Jantunen, M. VOC Source Identification from Personal and Residential Indoor, Outdoor and Workplace Microenvironment Samples in EXPOLIS-Helsinki, Finland. Atmos. Environ. 2001, 35, 4829–4841. [Google Scholar] [CrossRef]
  62. Jia, C.; Batterman, S.; Godwin, C. VOCs in Industrial, Urban and Suburban Neighborhoods—Part 2: Factors Affecting Indoor and Outdoor Concentrations. Atmos. Environ. 2008, 42, 2101–2116. [Google Scholar] [CrossRef]
  63. Pekey, H.; Pekey, B.; Arslanbaş, D.; Bozkurt, Z.B.; Doğan, G.; Tuncel, G. Source Apportionment of Personal Exposure to Fine Particulate Matter and Volatile Organic Compounds Using Positive Matrix Factorization. Water Air Soil Pollut. 2012, 224, 1403. [Google Scholar] [CrossRef]
  64. Sakellaris, I.; Tolis, E.I.; Saraga, D.; Bartzis, J.G. VOCS, PAHS and IONS Measurements in an Office Environment in the Vicinity of a Small Industry. FEB—Fresenius Environ. Bull. 2017, 26, 292–300. [Google Scholar]
  65. Schneider, P.; Gebefügi, I.; Richter, K.; Wölke, G.; Schnelle, J.; Wichmann, H.-E.; Heinrich, J. Indoor and Outdoor BTX Levels in German Cities. Sci. Total Environ. 2001, 267, 41–51. [Google Scholar] [CrossRef]
  66. Yang, Y.; Liu, L.; Xu, C.; Li, N.; Liu, Z.; Wang, Q.; Xu, D. Source Apportionment and Influencing Factor Analysis of Residential Indoor PM2.5 in Beijing. Int. J. Environ. Res. Public Health 2018, 15, 686. [Google Scholar] [CrossRef] [Green Version]
  67. Namieśnik, J.; Górecki, T.; Kozdroń-Zabiega ła, B.; Łukasiak, J. Indoor Air Quality (IAQ), Pollutants, Their Sources and Concentration Levels. Build. Environ. 1992, 27, 339–356. [Google Scholar] [CrossRef]
  68. Sack, T.M.; Steele, D.H.; Hammerstrom, K.; Remmers, J. A Survey of Household Products for Volatile Organic Compounds. Atmos. Environ. Part A. Gen. Top. 1992, 26, 1063–1070. [Google Scholar] [CrossRef]
  69. Trantallidi, M.; Dimitroulopoulou, C.; Wolkoff, P.; Kephalopoulos, S.; Carrer, P. EPHECT III: Health Risk Assessment of Exposure to Household Consumer Products. Sci. Total Environ. 2015, 536, 903–913. [Google Scholar] [CrossRef]
  70. Spinazzè, A.; Campagnolo, D.; Cattaneo, A.; Urso, P.; Sakellaris, I.A.; Saraga, D.E.; Mandin, C.; Canha, N.; Mabilia, R.; Perreca, E.; et al. Indoor Gaseous Air Pollutants Determinants in Office Buildings—The OFFICAIR Project. Indoor Air 2020, 30, 76–87. [Google Scholar] [CrossRef]
  71. Clarisse, B.; Laurent, A.M.; Seta, N.; Le Moullec, Y.; El Hasnaoui, A.; Momas, I. Indoor Aldehydes: Measurement of Contamination Levels and Identification of Their Determinants in Paris Dwellings. Environ. Res. 2003, 92, 245–253. [Google Scholar] [CrossRef] [PubMed]
  72. Hodgson, A.T.; Beal, D.; McIlvaine, J.E.R. Sources of Formaldehyde, Other Aldehydes and Terpenes in a New Manufactured House. Indoor Air 2002, 12, 235–242. [Google Scholar] [CrossRef] [PubMed] [Green Version]
  73. Kim, J.-A.; Kim, S.; Kim, H.-J.; Kim, Y.-S. Evaluation of Formaldehyde and VOCs Emission Factors from Paints in a Small Chamber: The Effects of Preconditioning Time and Coating Weight. J. Hazard. Mater. 2011, 187, 52–57. [Google Scholar] [CrossRef] [PubMed]
  74. Kim, S.; Kim, H.-J. Comparison of Formaldehyde Emission from Building Finishing Materials at Various Temperatures in under Heating System; ONDOL. Indoor Air 2005, 15, 317–325. [Google Scholar] [CrossRef] [PubMed]
  75. Marchand, C.; Le Calvé, S.; Mirabel, P.; Glasser, N.; Casset, A.; Schneider, N.; de Blay, F. Concentrations and Determinants of Gaseous Aldehydes in 162 Homes in Strasbourg (France). Atmos. Environ. 2008, 42, 505–516. [Google Scholar] [CrossRef]
  76. Salonen, H.; Salthammer, T.; Morawska, L. Human Exposure to NO2 in School and Office Indoor Environments. Environ. Int. 2019, 130, 104887. [Google Scholar] [CrossRef]
  77. Kalimeri, K.K.; Bartzis, J.G.; Saraga, D.E. Commuters’ Personal Exposure to Ambient and Indoor Ozone in Athens, Greece. Environments 2017, 4, 53. [Google Scholar] [CrossRef] [Green Version]
  78. Kalimeri, K.K.; Bartzis, J.G.; Sakellaris, I.A.; de Oliveira Fernandes, E. Investigation of the PM2.5, NO2 and O3 I/O Ratios for Office and School Microenvironments. Environ. Res. 2019, 179, 108791. [Google Scholar] [CrossRef]
  79. Rim, D.; Gall, E.T.; Maddalena, R.L.; Nazaroff, W.W. Ozone Reaction with Interior Building Materials: Influence of Diurnal Ozone Variation, Temperature and Humidity. Atmos. Environ. 2016, 125, 15–23. [Google Scholar] [CrossRef] [Green Version]
  80. Shen, J.; Gao, Z. Ozone Removal on Building Material Surface: A Literature Review. Build. Environ. 2018, 134, 205–217. [Google Scholar] [CrossRef]
  81. WHO. WHO Air quality guidelines for particulate matter, ozone, nitrogen dioxide and sulfur dioxide: Global update 2005: Summary of risk assessment. In Lignes Directrices OMS Relatives à la Qualité de L’air: Particules, Ozone, Dioxyde D’azote et Dioxyde de Soufre: Mise à Jour Mondiale 2005: Synthèse de L’évaluation des Risques; WHO: Gweneva, Switzerland, 2006. [Google Scholar]
  82. Szigeti, T.; Dunster, C.; Cattaneo, A.; Cavallo, D.; Spinazzè, A.; Saraga, D.E.; Sakellaris, I.A.; de Kluizenaar, Y.; Cornelissen, E.J.M.; Hänninen, O.; et al. Oxidative Potential and Chemical Composition of PM2.5 in Office Buildings across Europe—The OFFICAIR Study. Environ. Int. 2016, 92–93, 324–333. [Google Scholar] [CrossRef] [Green Version]
  83. Chatoutsidou, S.E.; Ondráček, J.; Tesar, O.; Tørseth, K.; Ždímal, V.; Lazaridis, M. Indoor/Outdoor Particulate Matter Number and Mass Concentration in Modern Offices. Build. Environ. 2015, 92, 462–474. [Google Scholar] [CrossRef] [Green Version]
  84. European Parliament Directive 2008/50/EC, Air Quality—European Environment Agency. Available online: https://www.eea.europa.eu/policy-documents/directive-2008-50-ec-of (accessed on 14 November 2022).
  85. Cheng, Z.; Lei, N.; Bu, Z.; Sun, H.; Li, B.; Lin, B. Investigations of Indoor Air Quality for Office Buildings in Different Climate Zones of China by Subjective Survey and Field Measurement. Build. Environ. 2022, 214, 108899. [Google Scholar] [CrossRef]
Figure 1. Location of the investigated office buildings at Kozani (40°18′2.48″ N 21°47′20.26″ E) and in Ptolemaida (40°30′23.99″ N 21°40′24.59″ E).
Applsci 13 01137 g001
Figure 2. Occupants’ medical history.
Applsci 13 01137 g002
Figure 3. Dissatisfaction with IEQ-aspects (%).
Applsci 13 01137 g003
Figure 4. SBS Symptoms prevalence (%).
Applsci 13 01137 g004
Figure 5. Frequency of controling (a) temperature, (b) ventilation, (c) shade, (d) light and (e) noise.
Applsci 13 01137 g005aApplsci 13 01137 g005b
Figure 6. Self-reported productivity in comparison with perceived comfort and control of the IEQ parameters.
Applsci 13 01137 g006
Figure 7. Comparison of IEQ parameters perception in workplace before and after COVID-19 countermeasures.
Applsci 13 01137 g007
Figure 8. COVID-19 protocols applied on offices.
Applsci 13 01137 g008
Figure 9. Indoor concentrations (μg m−3) of VOCs.
Applsci 13 01137 g009
Figure 10. Indoor concentrations (μg m−3) of Aldehydes.
Applsci 13 01137 g010
Figure 11. Indoor concentrations (μg m−3) of O3, NO2 and SO2.
Applsci 13 01137 g011
Figure 12. Differences in indoor concentrations (μg/m3) between SBS and non-SBS group.
Applsci 13 01137 g012
Figure 13. Differences in indoor concentrations (μg/m3) between air quality parameters (satisfaction vs. dissatisfaction group).
Applsci 13 01137 g013
Table 1. Type of buildings and response rates.
BuildingType of Activity/LocationInvited (n)Responders (n)Response Rate (%)Floor of Selected Office RoomType of Ventilation
B1Construction/Suburban151173.31Mechanical
B2University offices/Suburban402460.03Natural
B3Public sector/City center804353.83Natural
B4Public-Municipal sector/Urban301446.71Mechanical
B5Public-Municipal sector/Suburban251248.03Natural
B6Public-Municipal sector/City center301033.31Natural
B7Research center/Suburban251040.01Natural
B8University offices/Urban201050.02Natural
Total26513450.6
Table 2. Correlations between perceived control with exercise control and perceived comfort.
Perceived Control [1: None at All–7: Full Control]Exercise Control [0: None at All–6: More than 5 Times]Perceived Comfort [1: Unsatisfactory–7: Satisfactory]
Frequency of Temperature ControllingFrequency of Ventilation ControllingFrequency of Shade ControllingFrequency of Light ControllingFrequency of Noise ControllingTemperature OverallAir Quality OverallLight OverallNoise OverallOverall Comfort
Temperature0.1200.136−0.0120.1160.0070.488 **0.208 *0.176 *0.1300.474 **
Ventilation−0.0520.424 **0.0150.0350.1540.489 **0.315 **0.302 **0.1350.416 **
Shading from the sun0.0490.0940.248 **0.0130.0300.290 **0.257 **0.1650.242 **0.204 *
Lighting0.169 *0.113−0.090−0.0080.0440.337 **0.1690.353 **0.245 **0.273 **
Noise0.0950.1380.1580.206 *0.430 **0.267 **0.0680.0850.252 **0.242 **
* Correlation is significant at the 0.05 level ** Correlation is significant at the 0.01 level.
Table 3. Correlations between IEQ comfort and degree of acceptance of the lockdown aspects.
Parameters of Lockdown Aspects (1: Fully Disagree to 5: Fully Agree)Mean ScoreOverall ComfortThermal ComfortAir quality OverallLight OverallNoise OverallSBS
I understand the recently updated organizational health and safety policies and procedures that have been put in place3.710.185 *0.236 **0.153 *0.1710.1120.002
I understand what is expected of me in maintaining a healthy and safe environment at work4.120.179 *0.247 **0.271 **0.281 **0.240 **−0.119
I am comfortable returning to my work site3.560.294 **0.320 **0.246 **0.302 **0.042−0.246 *
I am comfortable travelling for work if required3.780.280 **0.353 **0.229 *0.304 **0.137−0.205 *
I would prefer to work from home if that option was extended to me2.54−0.118−0.0370.0380.056−0.036−0.172
Systems are in place to enable social distancing at our organization3.050.0980.217 *0.1570.0930.136−0.180 *
My colleagues are taking the COVID-19 virus seriously3.560.370 **0.266 **0.233 **0.245 **0.146−0.102
* Correlation is significant at the 0.05 level ** Correlation is significant at the 0.01 level.
Table 4. PM indoor concentrations.
BuildingsPM1PM2.5PM10
MeanMinMaxMeanMinMaxMeanMinMax
B36.52.746.510.52.8156.620.92.8919.8
B44.70.8312.713.01.1506.136.91.13952.4
B56.12.516.77.92.720.811.82.796.9
B611.70.94815.11.286.623.41.2312.4
Table 5. Differences in indoor concentrations (μg/m3) between SBS and non-SBS among symptom subgroups.
Symptoms GroupCompoundsSBS GroupNon-SBS Groupp-Value
MeanMean
Eye irritationNO215.011.60.092 *
Benzene17.412.50.008 **
Toluene22.016.70.010 **
Ethylbenzene1.62.10.048 *
a-Pinene5.58.60.072 *
Benzaldehyde0.90.80.006 **
Hexaldehyde8.06.70.003 **
RespiratoryOzone1.82.70.029 **
NO215.311.60.044 **
Toluene21.417.20.055 *
Ethylbenzene1.711.950.037 **
d-Limonene4.005.270.038 **
Formaldehyde23.821.80.167
2-butanone11.110.40.017 **
HeartNO217.912.20.028 **
Ethylbenzene1.51.90.100
Acetaldehyde22.217.70.116
2-butanone11.410.50.074 *
Hexaldehyde8.67.00.023 **
GeneralOzone2.02.70.055 *
NO214.611.30.039 **
Benzene16.312.50.012 **
Toluene20.4717.020.148
Ethylbenzene1.761.980.039 **
1,2,4-TMB2.423.140.174
2-butanone10.9110.330.031 **
Hexaldehyde7.576.790.031 **
SkinToluene25.5518.350.082 *
Note: Mann-Whitney U test. p-values indicated with (**) are significant at 5% and with (*) are marginal significant at 10%.
Table 6. HQ values in all buildings under investigation for formaldehyde and benzene.
BuildingFormaldehydeBenzene
B12.70.8
B21.510.8
B33.14.3
B41.14.6
B53.91.9
B63.71.3
B72.2-
B81.83.7
Table 7. Average LCR values in all buildings under investigation for formaldehyde and benzene.
BuildingFormaldehydeBenzene
MaleFemaleMaleFemale
B11.77 × 10−52.07 × 10−51.16 × 10−61.35 × 10⁻⁶
B21.08 × 10−51.06 × 10−51.73 × 10−51.69 × 10⁻⁵
B32.18 × 10−52.21 × 10−56.54 × 10−66.61 × 10⁻⁶
B48.63 × 10−67.94 × 10−67.76 × 10−67.14 × 10⁻⁶
B53.02 × 10−53.22 × 10−53.23 × 10−63.43 × 10⁻⁶
B63.35 × 10−52.75 × 10−52.53 × 10−62.08 × 10⁻⁶
B71.62 × 10−51.68 × 10⁻⁵--
B81.58 × 10−51.33 × 10−56.98 × 10−065.88 × 10⁻⁶
Disclaimer/Publisher’s Note: The statements, opinions and data contained in all publications are solely those of the individual author(s) and contributor(s) and not of MDPI and/or the editor(s). MDPI and/or the editor(s) disclaim responsibility for any injury to people or property resulting from any ideas, methods, instructions or products referred to in the content.

