1. Introduction
Some historic buildings have miraculously been preserved to the present day, overcoming many adversities such as wars, fires and earthquakes. In addition, some historic buildings preserve wonderful artworks that amaze, comfort and delight people who can admire them. The conservation of artistic and cultural heritage is therefore a duty; moreover, due to the proximity of beauty, it is also an enjoyable commitment for professionals.
The aim of studying microclimate for cultural heritage is to investigate the environmental conditions around a work of art and to individuate critical and dangerous conditions [
1,
2]. In fact, works of art can be conserved over time if the surrounding environment does not favor the processes of degradation. Microclimatic monitoring is therefore essential to know the environmental situation and possibly to propose solutions or improvements in order to promote conservation.
In order to establish safe ranges in microclimatic variability, some standards have been proposed, such as UNI 10829 [
3] and EN 15757 [
4]. The UNI 10829 standard established the methodology to evaluate the microclimate and suggested the range of variability for microclimatic parameters in order to properly preserve artworks. This norm has the advantage of giving practical guidance in organizing a measurement campaign and in fixing the safe zone using threshold values for 33 classes of artworks; its disadvantage lies in the rigid safe ranges that are not applicable in every environment. The EN 15757 standard overcame this difficulty with the definition of the historic climate that considers the environment conditions where the works of art are acclimatized. In order to compare different microclimatic conditions, several indexes have been defined (such as [
5,
6,
7]); they are easily computed using more than one microclimatic parameter and provide comprehensive information about different sites. Despite the availability of these useful instruments, the debate around safe zones is still open.
Historical buildings and churches have conserved ancient artworks for centuries, and they are themselves cultural heritage. Their indoor microclimates are favorable to conservation mainly as the thermal inertia of their massive thick walls mitigates external fluctuations. In the last 30 years, many historic buildings have been monitored and studied (among others, [
8,
9,
10,
11,
12,
13]) with the aim to investigate the microclimatic conditions and to suggest improvements to restorers. Recently, the microclimate inside small and ancient churches preserving priceless heritage [
14,
15,
16] has been analyzed.
In this work, we present the monitoring campaign performed in the church of San Panfilo in Tornimparte (L’Aquila, Italy) with the aim of detecting the microclimatic situation and identifying any critical conditions for conservation.
The parish church of Tornimparte dates back to the second part of the XII century or the beginning of the XIII century, and during its long history, it underwent profound renovations as a consequence of earthquakes and fires. The church now presents four naves with some altars and a painted deep apse.
Saturnino Gatti depicted the cycle of frescoes in the apse from 1491 to 1494 [
17,
18]. The cycle includes a representation of the glory of God in the vault and scenes of the Christ’s passion and resurrection on the side walls. In the central part of the apse, it is likely that the crucifixion was represented, but the scene was lost in 1922 with the opening of a window [
18].
In lateral naves, some frescoes, paintings and statues are preserved; moreover, outside the church, part of the external portico is frescoed with medieval paintings on the external church walls and with a Madonna and Child in the lunette above the main door.
In this work, the monitoring activity is described, and the results are discussed. Monitored physical quantities were temperature and relative humidity inside and outside the church. The monitoring period lasted 15 months in order to identify hourly, daily and seasonal variability in measured data.
This paper contributes to the Special Issue “Results of the II National Research project of AIAr: archaeo-metric study of the frescoes by Saturnino Gatti and workshop at the church of San Panfilo in Tornimparte (L’Aquila, Italy)” in which the scientific results of II National Research Project conducted by members of the Italian Association of Archaeometry (AIAr) are discussed and collected. For in-depth details on the aims of the project, see the Introduction of the Special Issue [
19].
2. Materials and Methods
2.1. San Panfilo Church in Tornimparte
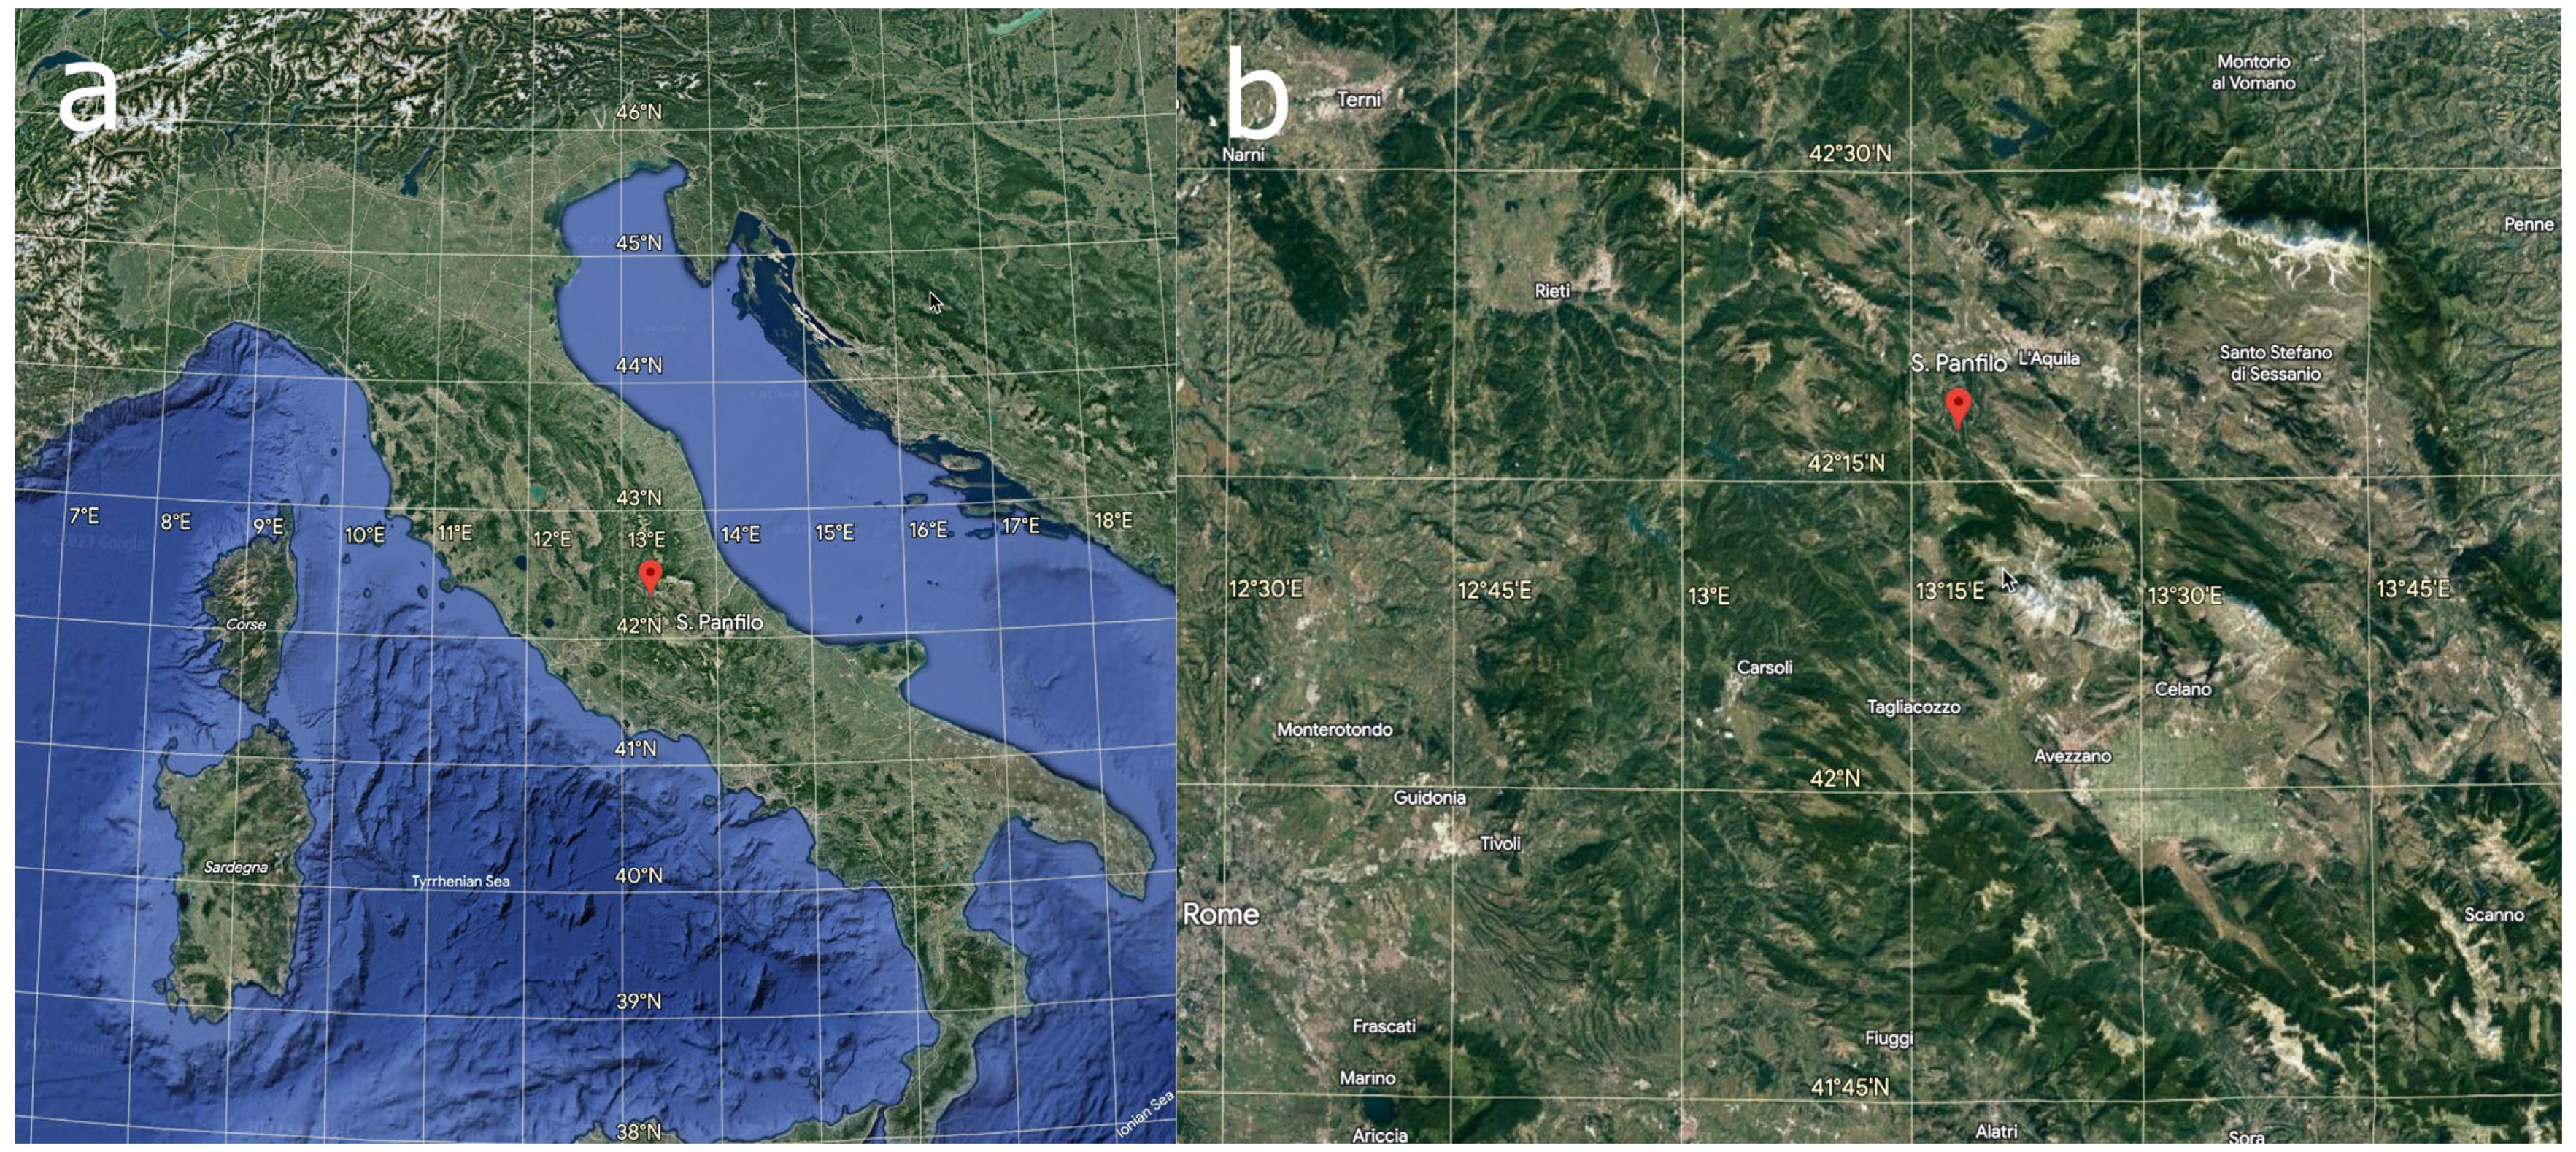
San Panfilo church (latitude: 42.28864° N, longitude: 13.30136° E) is located in the municipality of Tornimparte, province of L’Aquila, Abruzzo region, in central Italy (
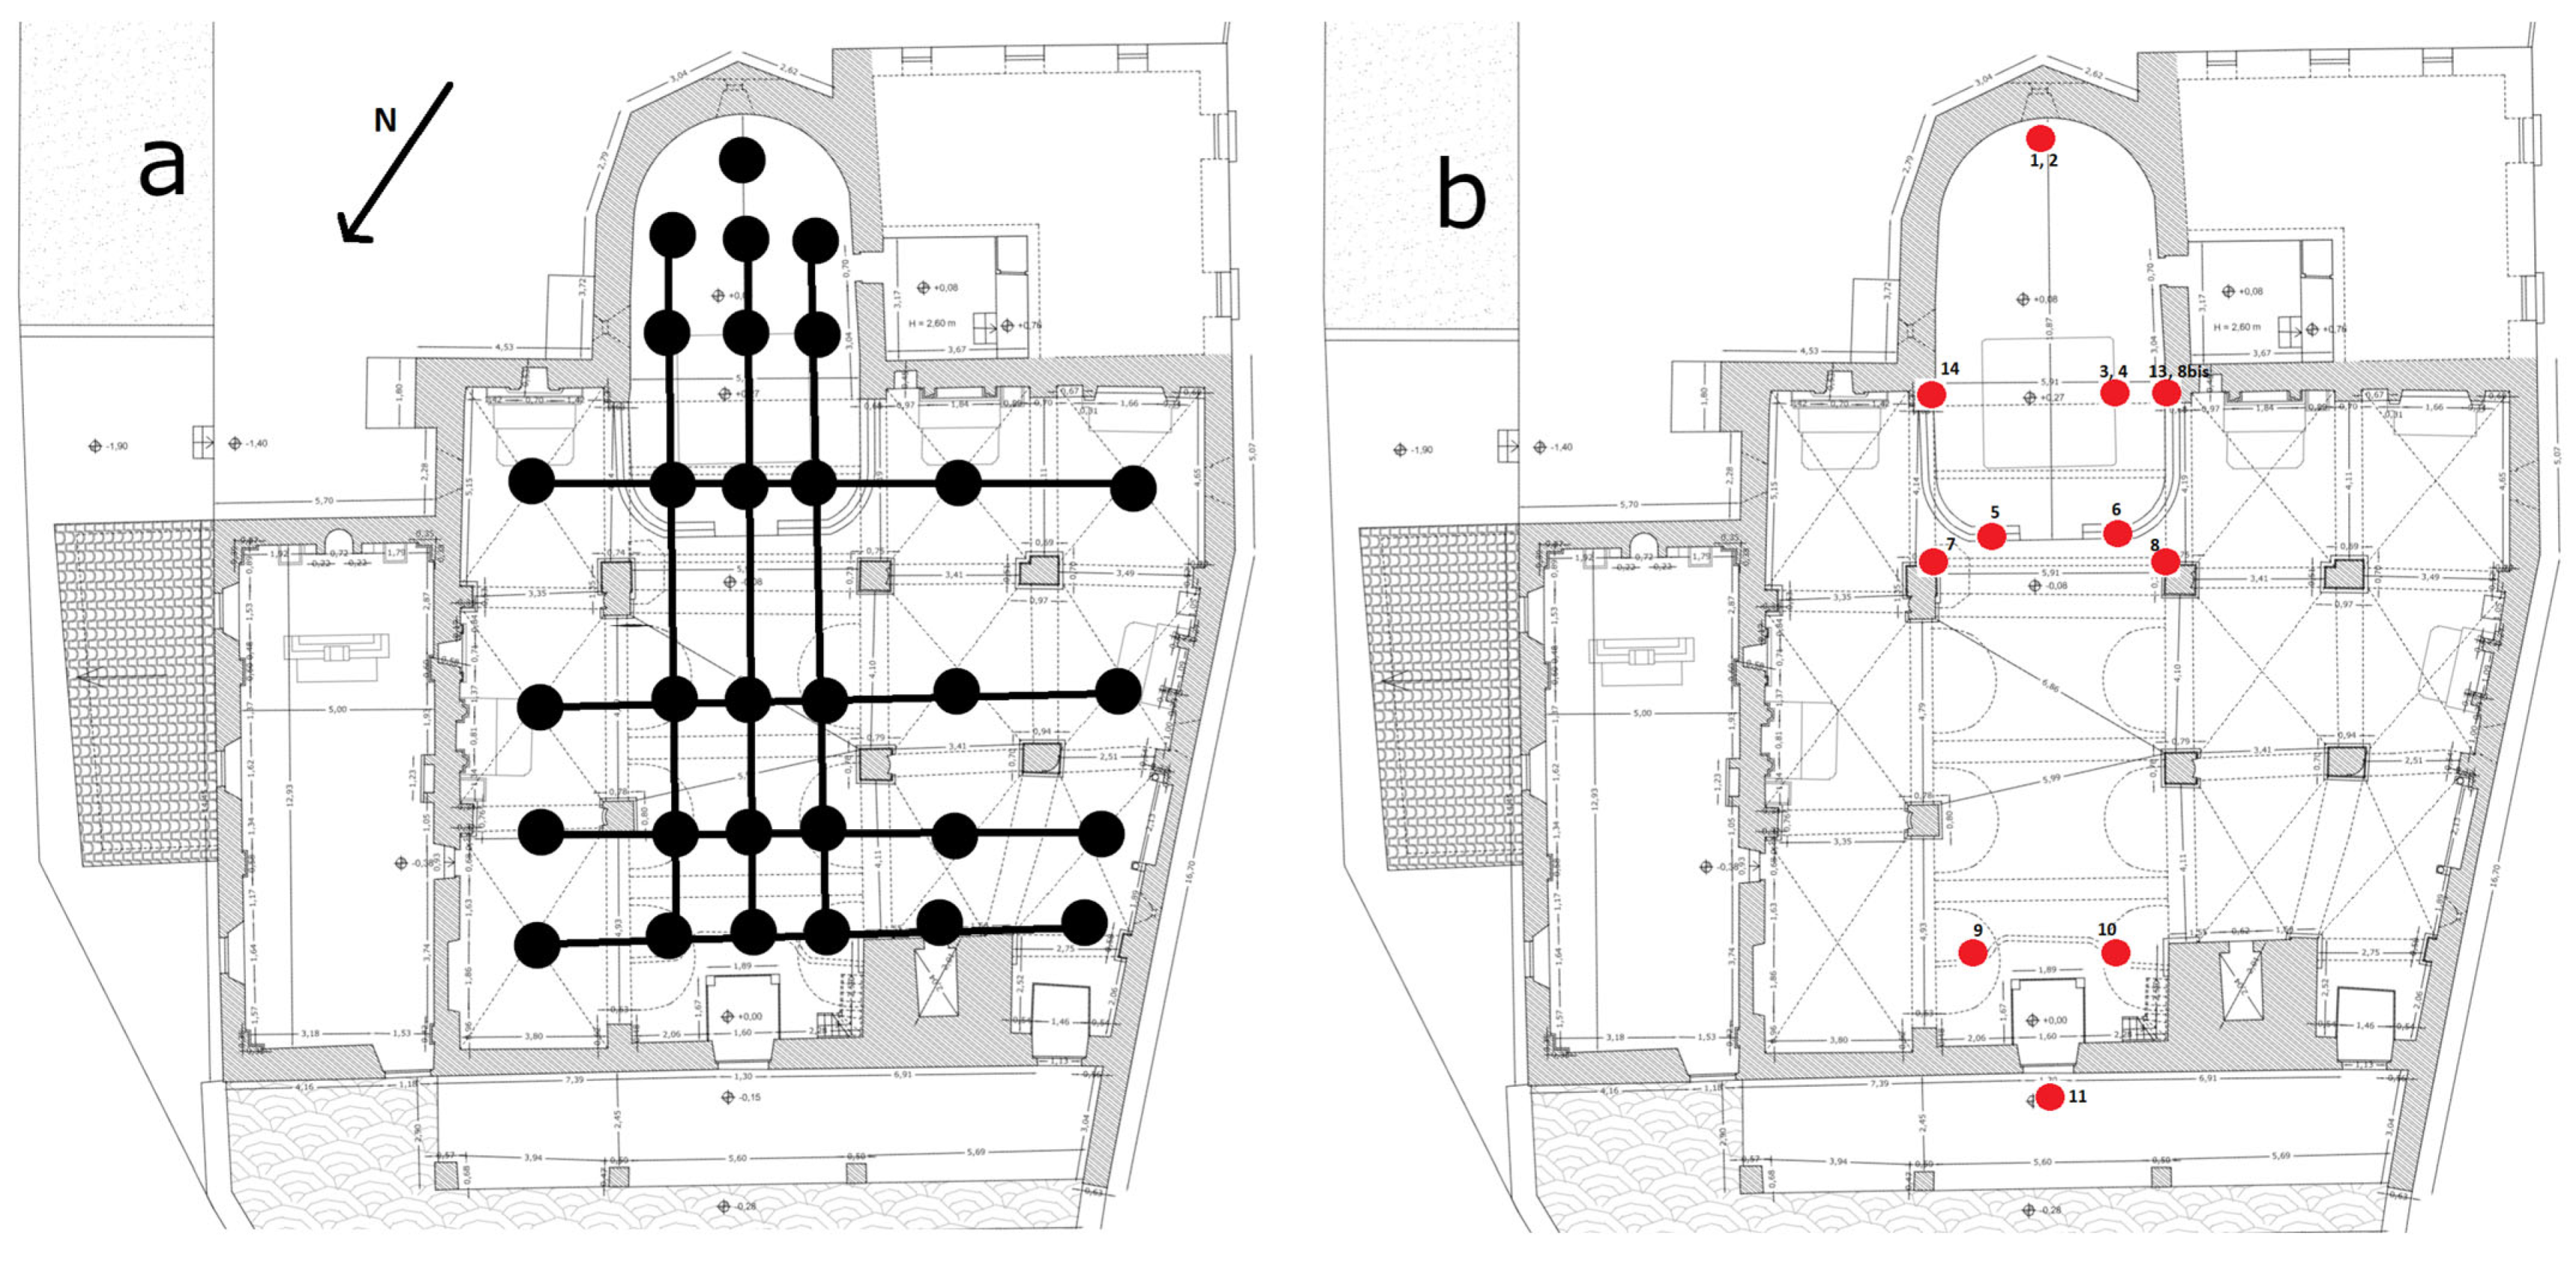
Figure 1). San Panfilo church is an isolated building arranged along the south–north direction with the main facade facing north and the apse facing south (
Figure 2). The church faces a large churchyard, is enclosed by a wall, and the facade is preceded by a portico. The building is not symmetric; in fact, it presents four naves with a main central nave aligned from the main door to the presbytery, a lateral nave on the left and two lateral naves on the right.
A wooden balustrade borders the presbytery, which is furnished with a stone altar, the seat of the celebrant and the concelebrants, a wooden crucifix on a wrought iron base and a glass showcase near the central window containing a silver processional cross from the 1600 s. The choir is located inside the church, above the main door.
Light through window glasses illuminates the church: a series of windows are in the upper walls of main nave, three windows in the lateral walls and two windows in the apse on the left side and in the center. An artificial lighting system was recently installed; it consists of a number of LED lights over the column capitals. In the church, the air exchange is guaranteed through the main door and through the opening of two lateral windows in the external walls.
The church is equipped with a heating system; nevertheless, it was turned off during the whole monitoring activity. Parishioners frequent San Panfilo: the church is used for Sunday liturgy and for services related to funerals and weddings.
2.2. Monitoring Campaign
Monitoring activity started in February 2021 and ended in April 2022. The two main microclimatic parameters, temperature and relative humidity, were measured inside and outside the church. The monitoring activity was organized into two main phases: intensive measurements and continuous measurements.
Intensive measurements were performed on specific days (18 February 2021, 6 July 2021, 22 November 2021, 22 April 2022) chosen along the year with the aim to inspect in detail the situation inside the church through the seasons. Temperature and relative humidity were measured two times a day (in the morning and early afternoon) at two vertical levels (1.2 m and 2.0 m from the floor) on a regular grid (
Figure 2a).
On 22 April 2022, some additional measures of temperature and relative humidity were performed at four levels from the floor (0.5, 1.2, 2.0, 3.0 m) in the apse. Moreover, on 22 November 2021 and 22 April 2022, the apse wall temperature was measured with an infrared thermometer.
Continuous measurements were performed from 20 February 2021 to 18 April 2022 in several sites in the church and two sites outside the church (
Figure 2b,
Table 1) at a monitoring frequency of one datum every 10, 15 or 60 min. The apse was monitored using two sensors placed on the glass showcase (positions 1 and 2), two sensors tied to the crucifix (positions 3 and 4) and three sensors placed near the walls on two little shelves (positions 8bis, 13, and 14). In the main nave the monitoring sites were at the balustrade (positions 5 and 6), on the pulpit (position 7), on the first column capital (position 8) and on the choir (positions 9 and 10). The outdoor environment was monitored using a sensor below the external portico (position 11) and near the meteorological station located at Colle San Vito (latitude: 42.290639° N, longitude: 13.289556° E) at a distance of about 1 km from San Panfilo church. This station is managed by the Centro Funzionale and Ufficio Idrografico of Regione Abruzzo.
Some microclimatic parameters such as specific humidity, dew point temperature and dew point spread were computed from temperature and relative humidity data.
2.3. Instrumentation
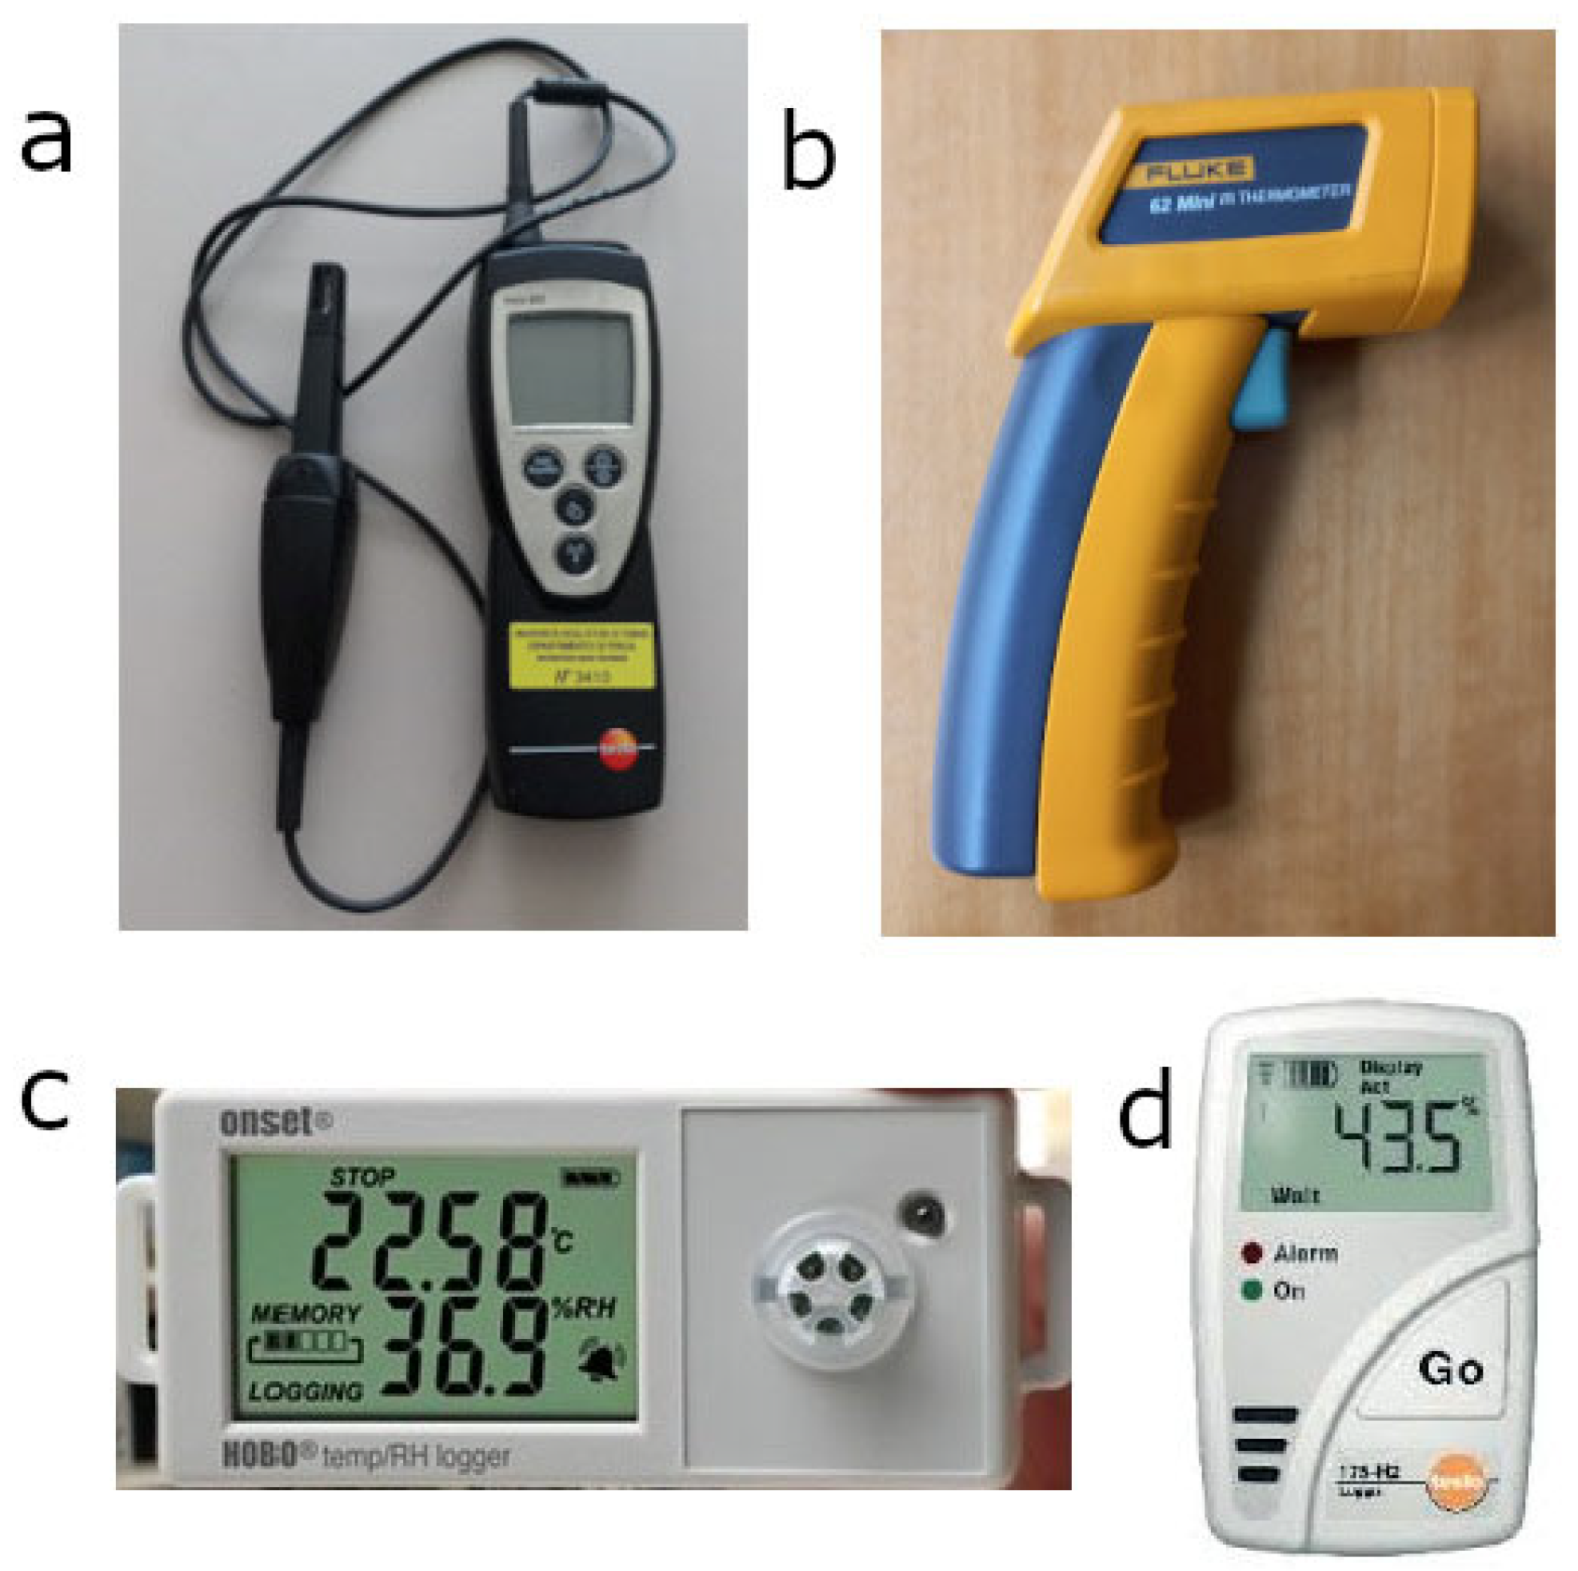
The intensive measurements of temperature and relative humidity were made using a portable thermo-hygrometer (manufactured by Testo Spa, model 625, Settimo Milanese, Milan, Italy,
Figure 3a), whereas the wall temperature was measured with a infrared thermometer (manufactured by Fluke, model 62 Mini, Everett, WA, USA,
Figure 3b). The continuous measurements were collected using eleven thermo-hygrometers (manufactured by Onset, model HOBO-UX100-011, Bourne, MA, USA,
Figure 3c) working at the frequency of one datum every 10 min and two thermo-hygrometers (manufactured by Testo Spa, models 177-H1 and 175-H2, Settimo Milanese, Milan, Italy,
Figure 3d) at the frequency of 1 datum every 60 min. The temperature and relative humidity accuracy, resolution and range of the used sensors are summarized in
Table 2.
2.4. Computation of Specific Humidity, Dew Point Temperature, and Dew Point Spread
Specific humidity is defined as the ratio between the mass of water vapor and the mass of moist air. In microclimatic analysis this physical quantity is useful to recognize the presence of evaporation, condensation, the path of an air mass, leakage, window openings and the presence of people [
1]. Specific humidity (
SH) was computed using the following formula:
where
is the vapor pressure and
p is the pressure at the altitude of Tornimparte. The vapor pressure
e was computed using the equation:
with
RH representing relative humidity and
representing the saturation vapor from Bolton parametrization [
20]:
where
T is the measured temperature (°C).
The dew point temperature is defined as the temperature to which a parcel of moist air must be cooled at constant atmospheric pressure and constant water vapor content in order for saturation to occur. Dew point temperature (
) was computed using the relation:
where
a = 7.5 and
b = 237.3 °C are the Magnus and Tetens coefficients for vapor in equilibrium with the liquid phase [
1].
Dew point spread is computed as the difference between the temperature and the dew point temperature. It shows how close or far the air temperature is from the dew point temperature. In conservation science, the dew point spread gives information about the possibility of condensation over the surfaces.
3. Results
3.1. Intensive Monitoring
The analysis of intensive monitoring data was carried out considering the horizontal fields of micrometeorological parameters at 1.2 m and 2.0 m from the floor (
Section 3.1.1) and the vertical profiles measured in the apse (
Section 3.1.2).
3.1.1. Analysis on a Horizontal Spatial Grid
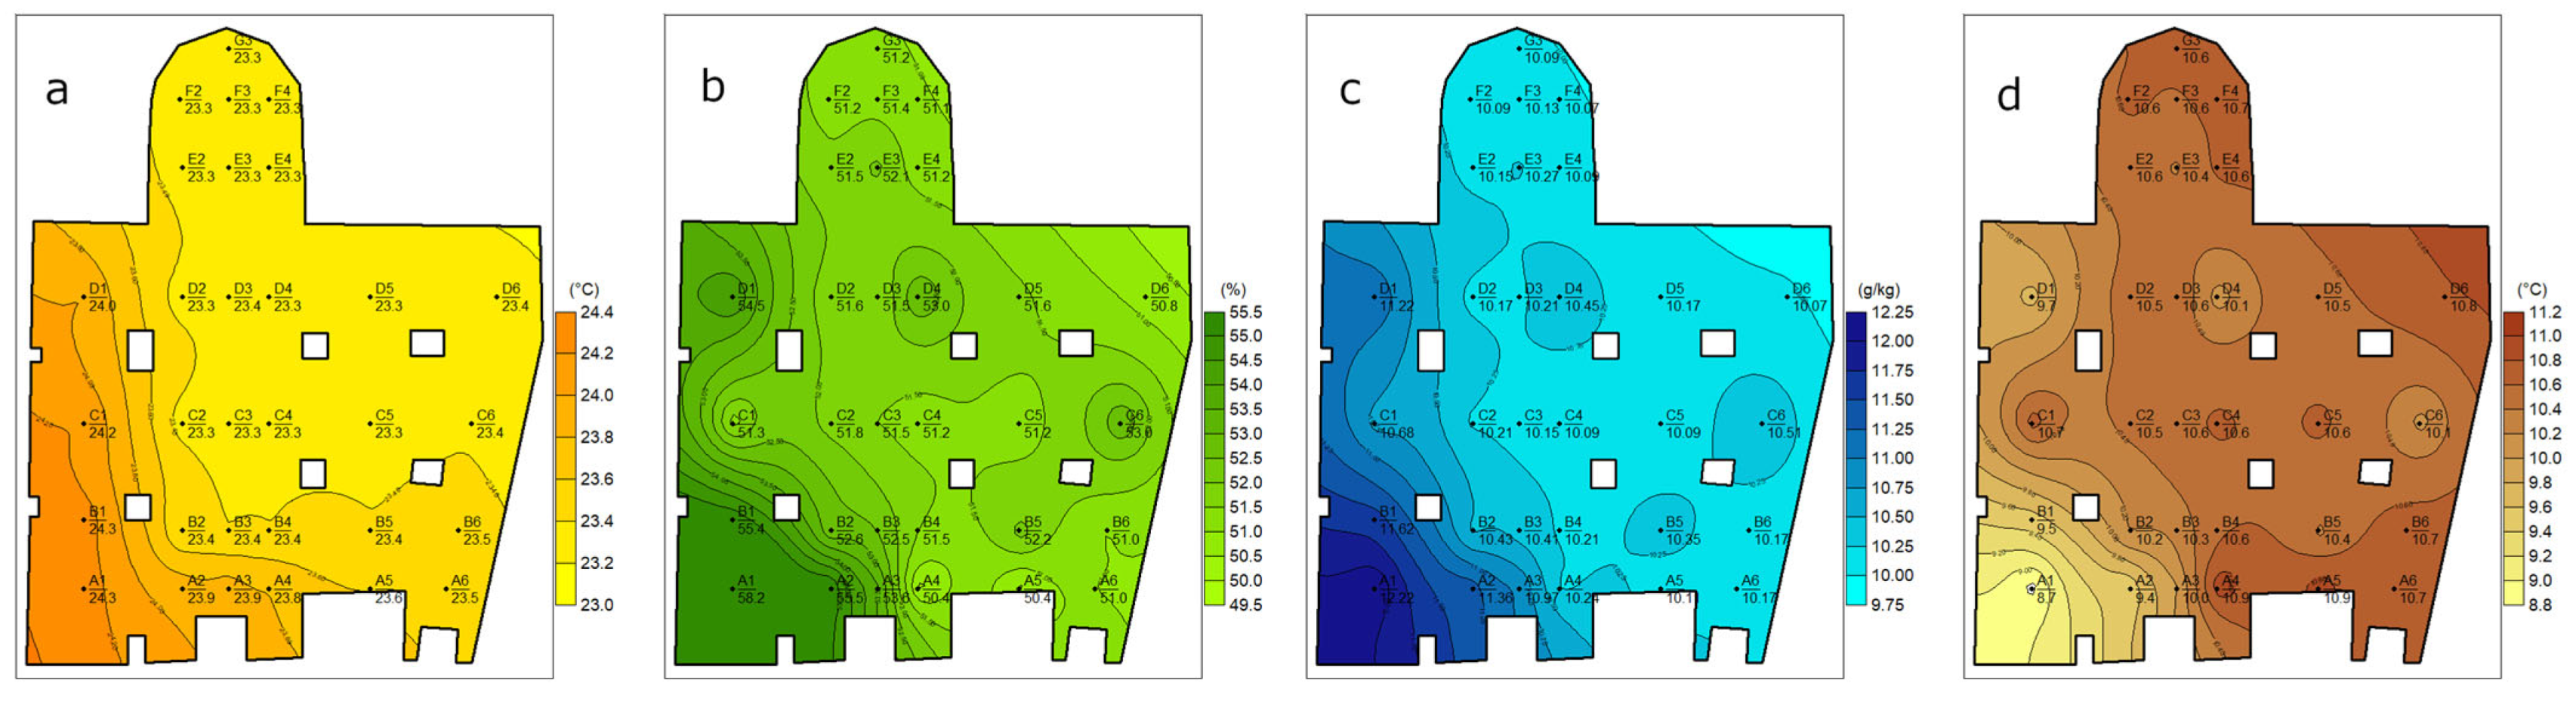
Measured data on temperature and relative humidity and computed values for specific humidity and dew point spread were used to obtain the horizontal fields. A total of 52 horizontal maps were examined. The results on 6 July 2021 and 22 November are representative, respectively, of the summer and winter seasons and are shown in
Figure 4 and
Figure 5.
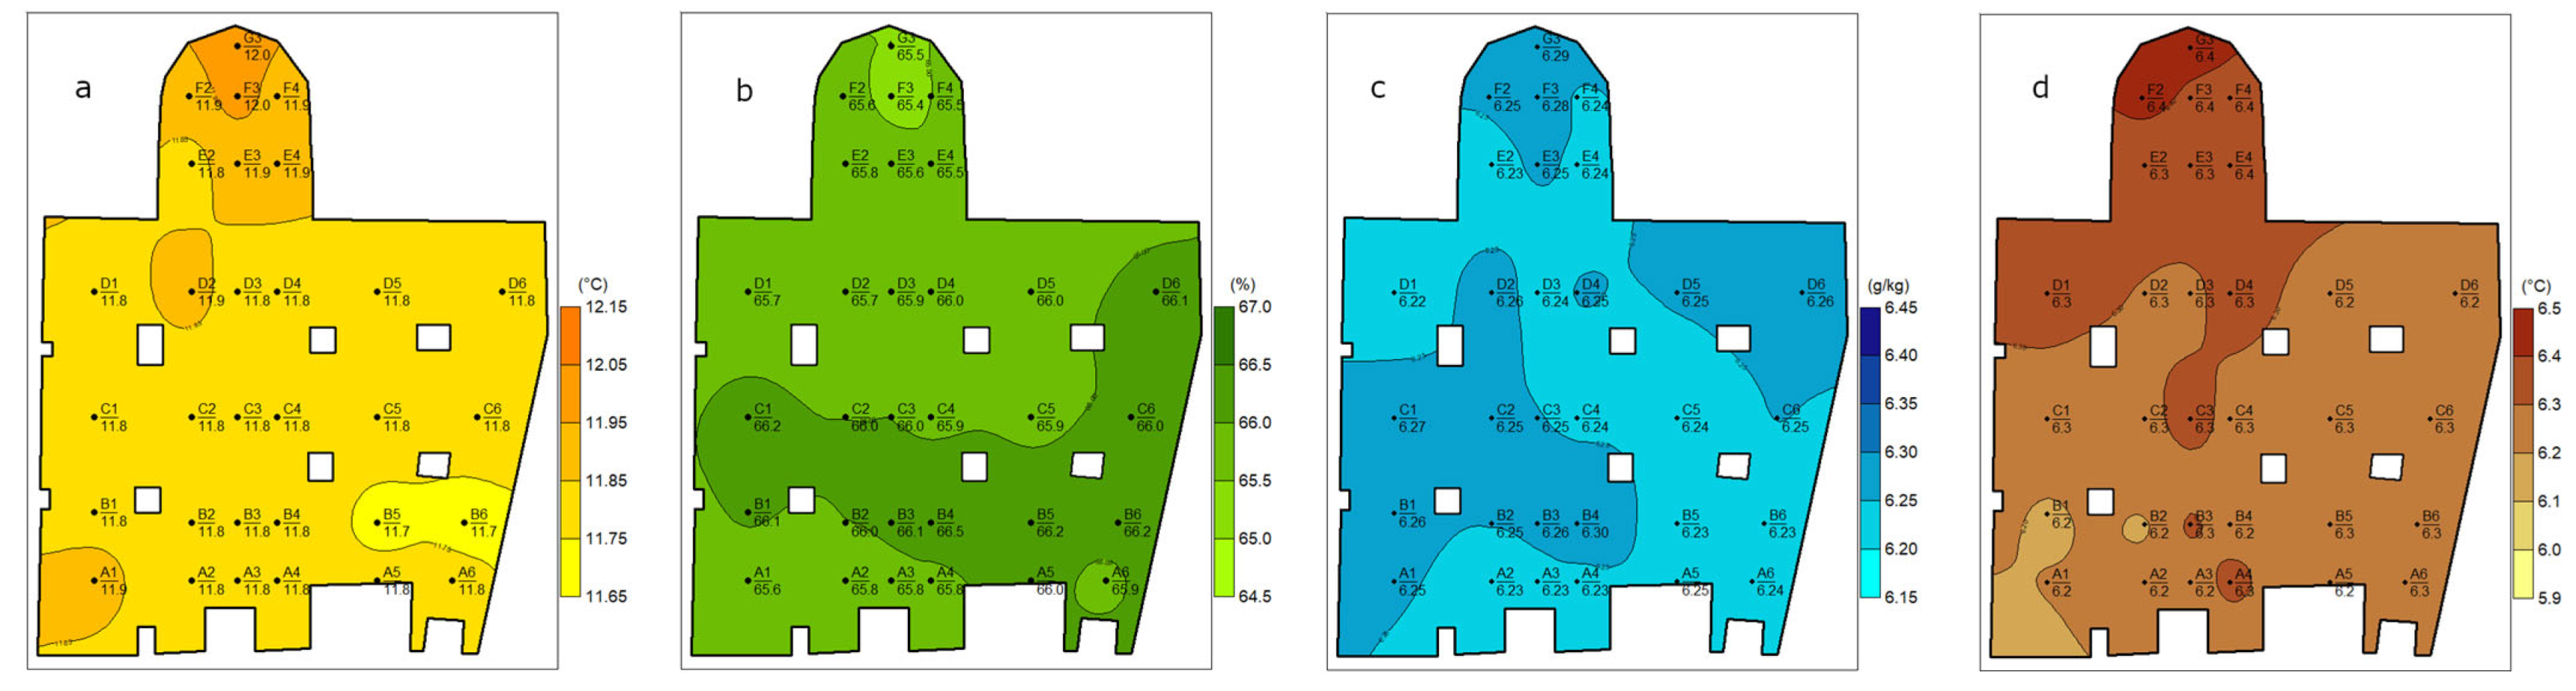
Results show that values of temperature, specific humidity and dew point spread inside the church are homogeneous and depend on seasonality. Relative humidity values belong to the same range (about 60–67%) in every season but not in summer, when the relative humidity values are lower than 55% (
Figure 4b and
Figure 5b).
In February, November and April, the horizontal variability for temperature is lower than 0.5 °C; for relative humidity, it is lower than 2.5%; for specific humidity, it is lower than 0.25 g/kg; for dew point spread, it is lower than 0.5 °C. Therefore, the horizontal maps show values depending on seasonality, but the amplitude of scale is the same. In July, the microclimatic horizontal variability is higher (1.1 °C for temperature, 7.8% for relative humidity, 2.2 g/kg for specific humidity and 2.1 °C for dew point distance) as a consequence of some values near the main church door on the left measured in the morning (
Figure 4). In this area, a review of instability has reported the presence of moisture infiltrations.
In the presbytery, the horizontal variability in microclimatic parameters is very low (0.3 °C for temperature, 1.8% for relative humidity, 0.4 g/kg for sensible humidity and 0.6 °C for dew point distance), close to instrument accuracy.
The comparison between morning and early afternoon data shows that the variability is higher in the morning and lower in the early afternoon.
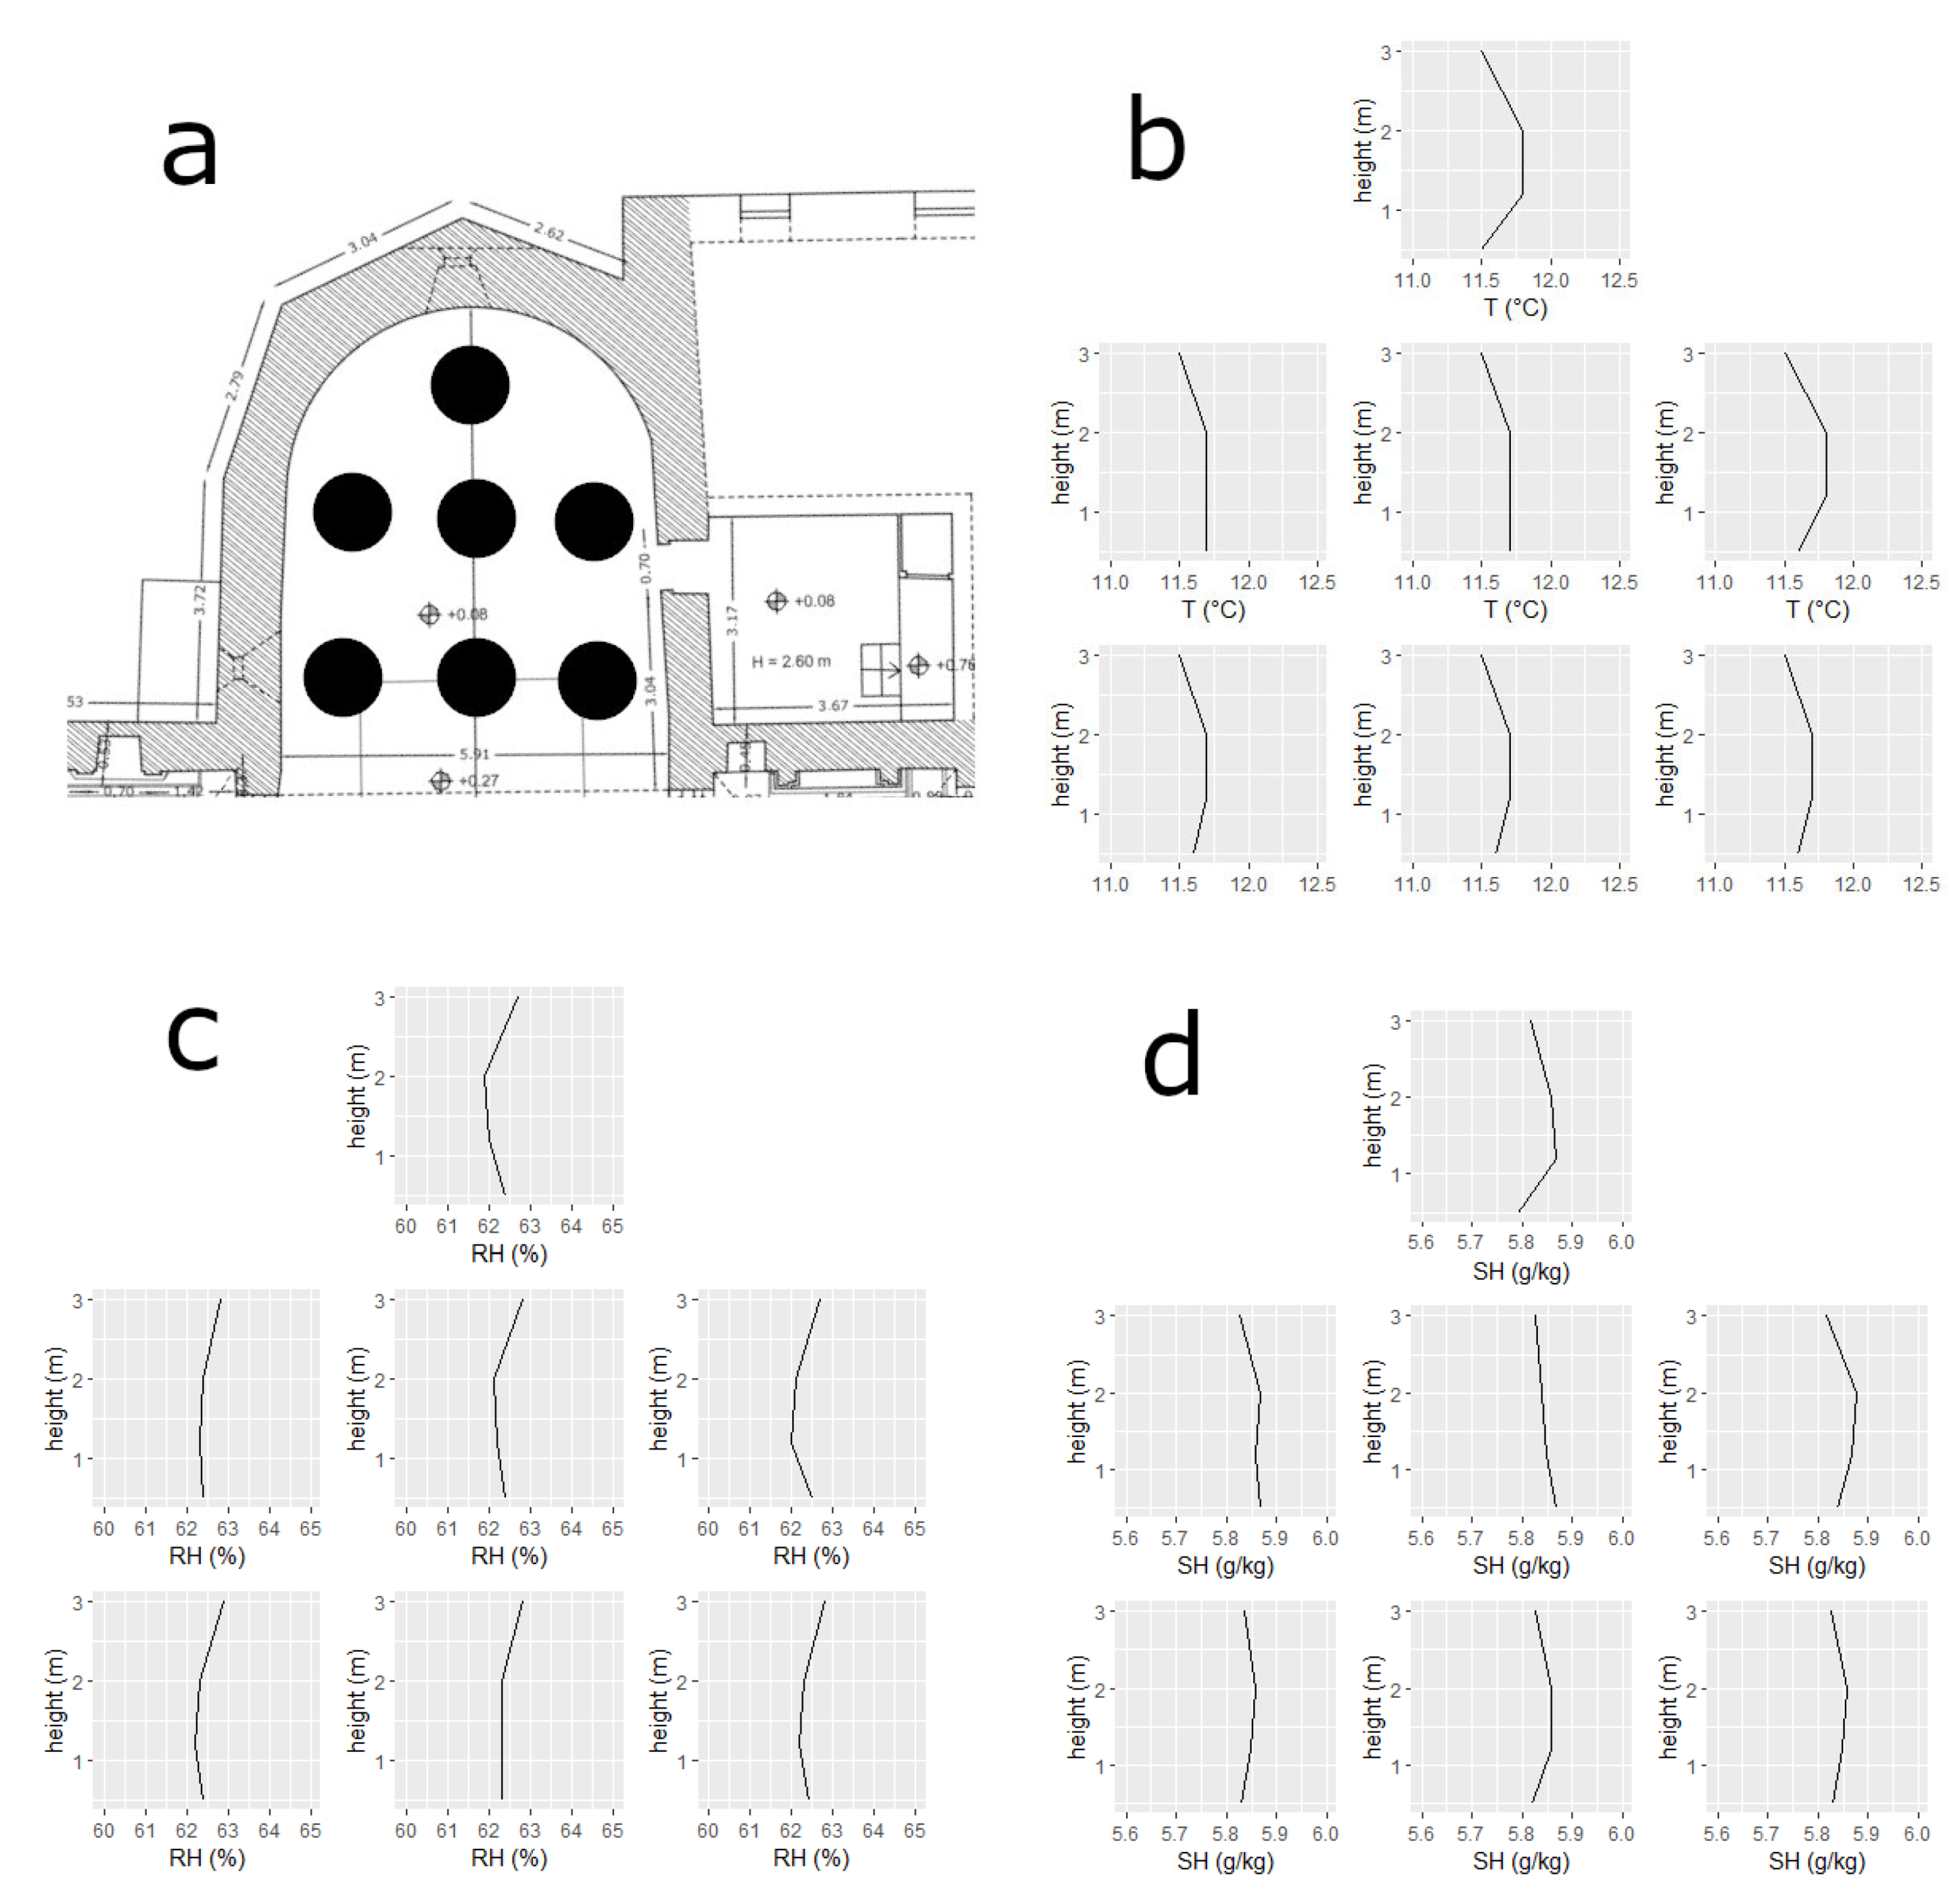
3.1.2. Vertical Profiles
Vertical profiles of temperature, relative humidity and specific humidity in the presbytery, as measured on 22 April 2022 (
Figure 6), show very low variability. In the seven positions in this area, the vertical profile is relatively constant. The vertical homogeneity in temperature, relative humidity and specific humidity is a consequence of air well mixing.
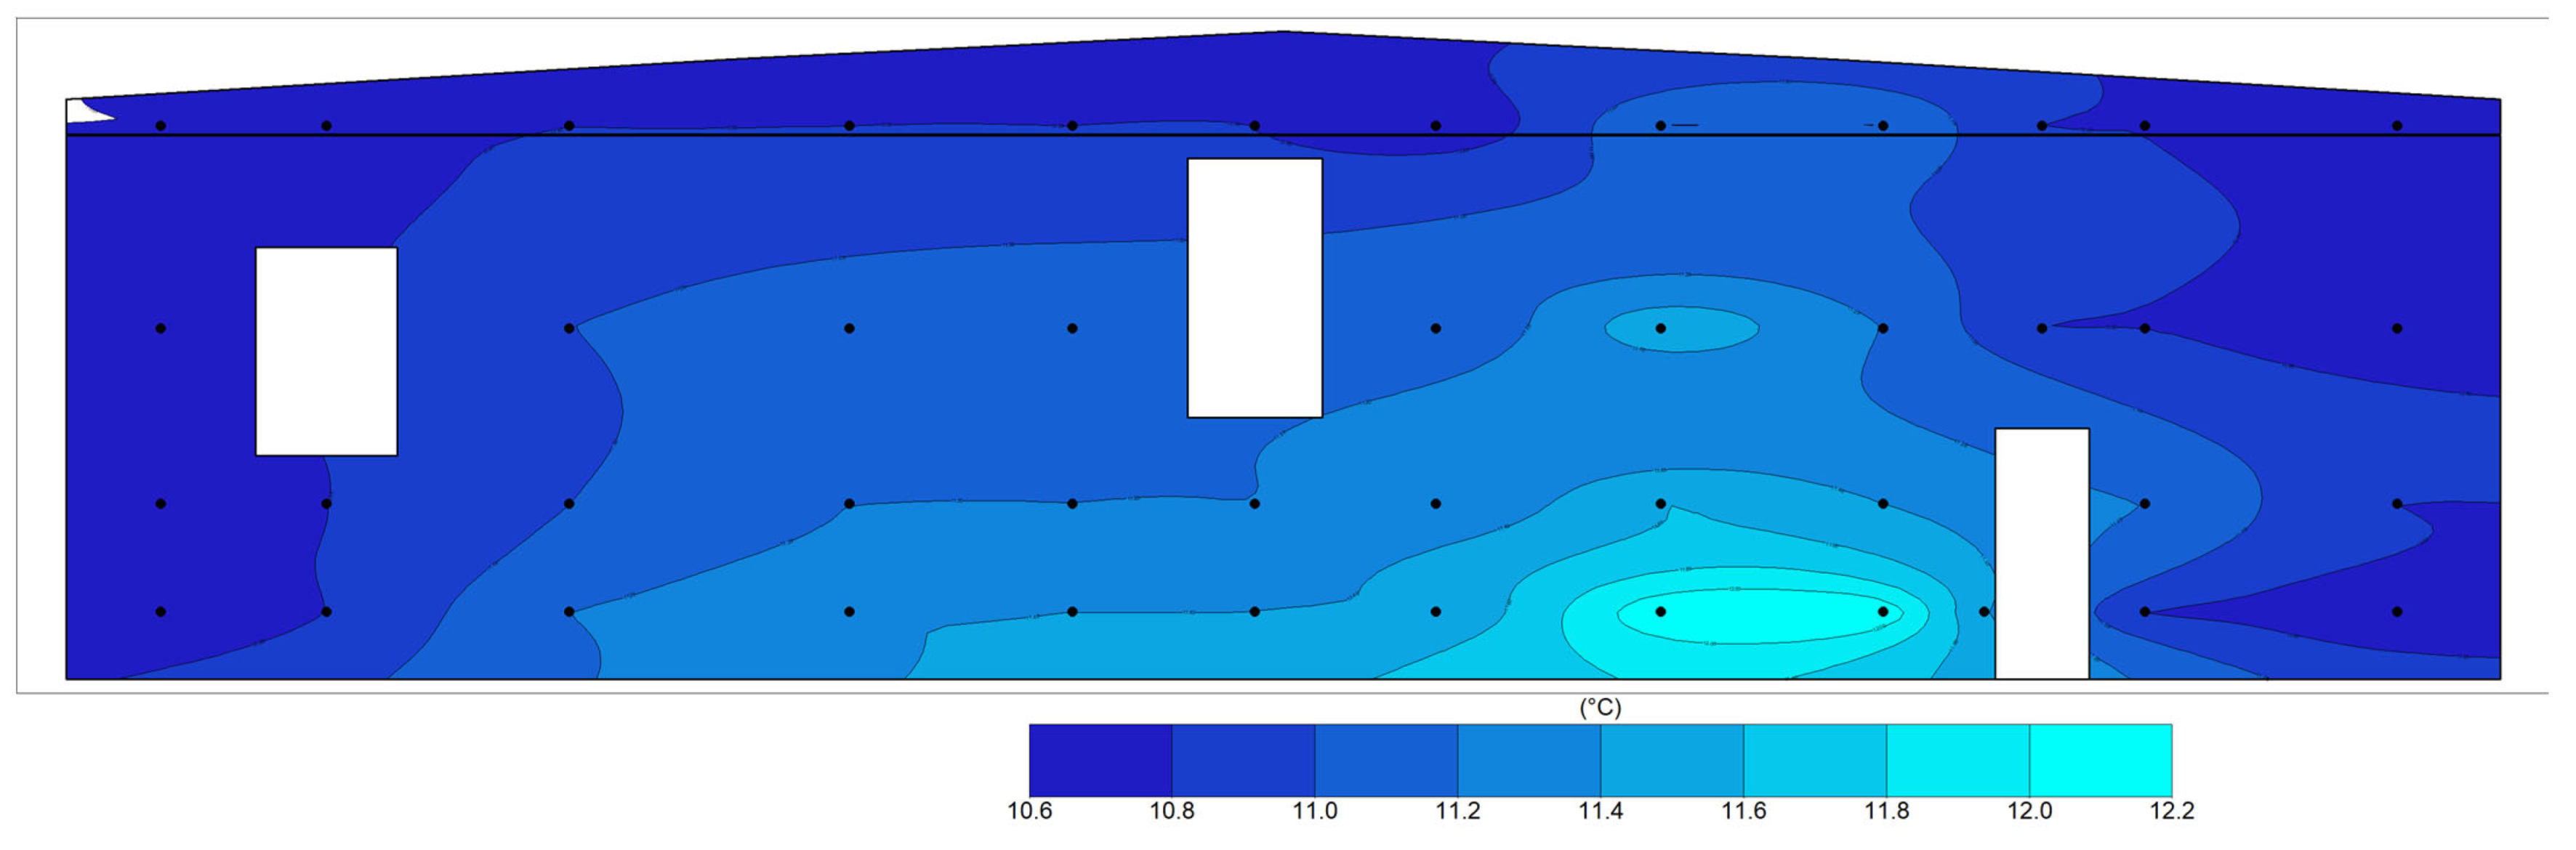
Fresco surface temperature was measured on 22 November 2021 and 22 April 2022 with an infrared thermometer. In both cases, the temperature values show a vertical profile with lower values at the ceiling and higher ones near the floor (
Figure 7). Moreover, the walls exposed to the outside (left side in
Figure 7) are characterized by lower temperature values in comparison with walls facing south or bordering the rectory (right side in
Figure 7).
3.2. Continuous Monitoring
The monitoring activity involved the analysis of data collected inside the church at twelve sites (
Figure 2b) and two sites outside the church, one below the portico and a second at the meteorological station of Colle San Vito.
3.2.1. Apse Data Overview
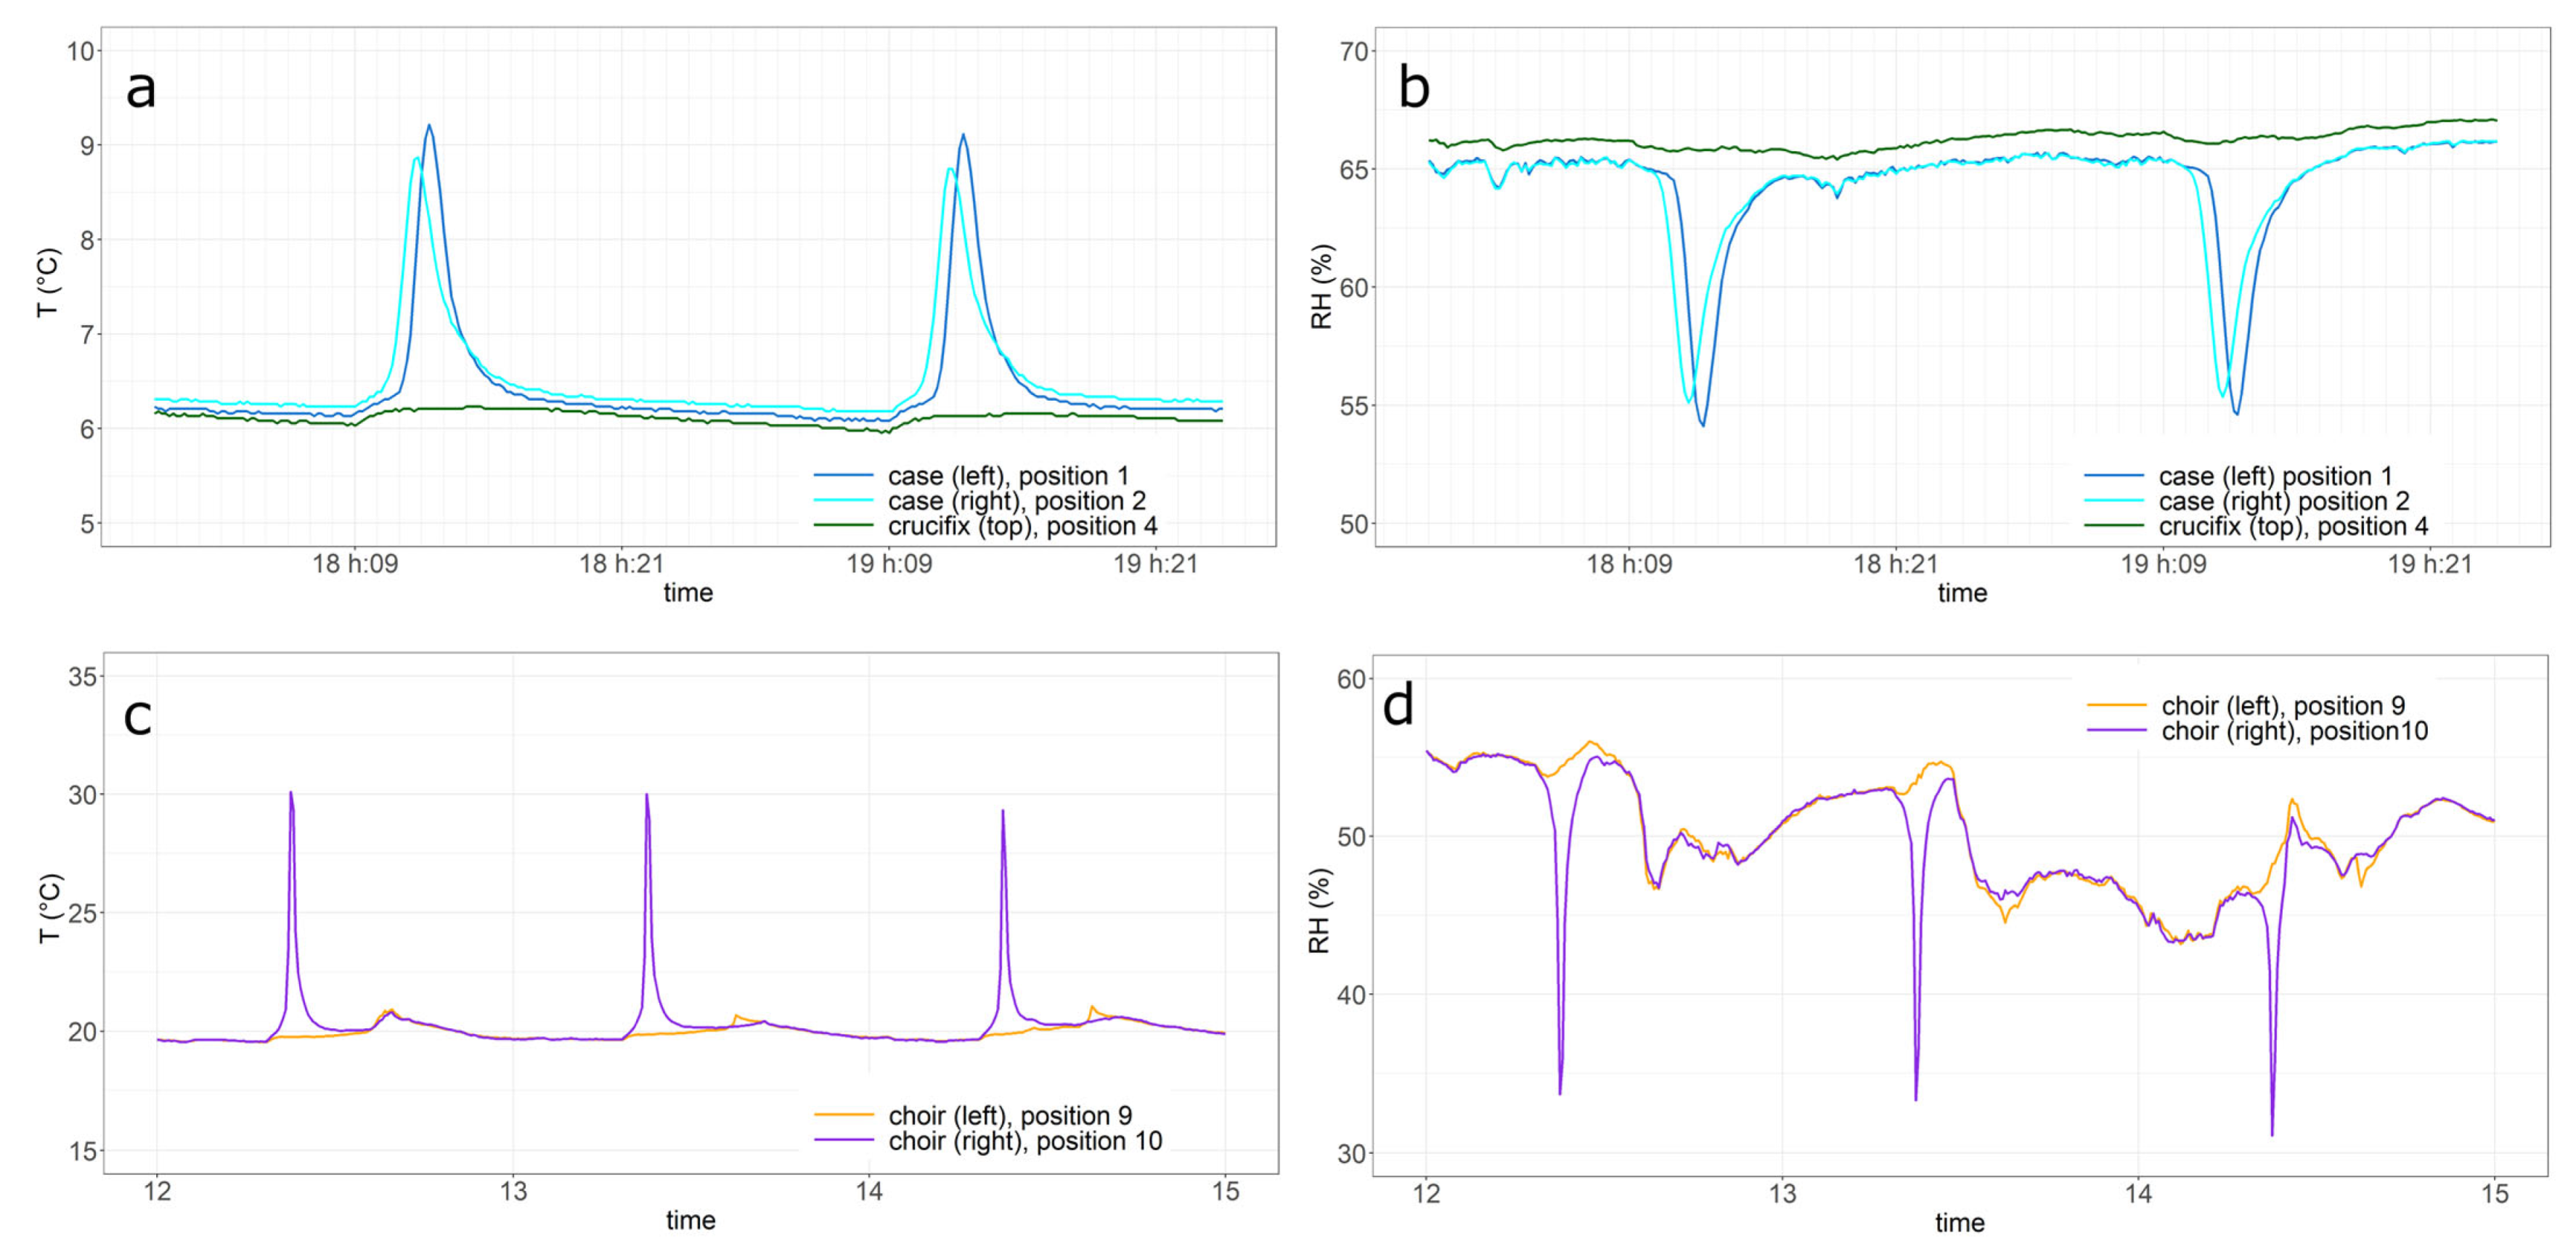
In the apse, the temperature is modulated by seasonality, with the highest values in August and the lowest in February. In addition, it is influenced by meteorological events and, inside the church, by the presence of people during the weekly Sunday service. The overlapping of seasonality (time scale of one year), meteorological events (time scale of one week) and people during the services (time scale of one hour) is recognizable in data collected in the apse near the walls and in the central side (
Figure 8a). The air in the central part of the apse (crucifix top, green line in
Figure 8a) shows more influence from people with respect to the air near the wall (orange line in
Figure 8a). In fact, air temperature near the wall is influenced by the wall temperature itself, which varies slowly as a consequence of the walls’ high thermal capacity.
The sensors over the glass showcase near the central window of the apse measure temperature values similar to those recorded near the crucifix with, in addition, a number of spikes from October to March (
Figure 8b).
Relative humidity can vary inside the church in the range of 30–80%. The sensors on the glass showcases recorded negative spikes of about 12% in conjunction with temperature peaks (
Figure 8c).
Specific humidity has been computed from temperature and relative humidity (
Figure 8d). The time series show, as expected, high values in summer and low values in winter due to seasonality. In addition, variations due to meteorological events and increased values during the weekly services are present. In fact, respiration and transpiration produce moisture whose quantity depends on the environmental temperature and the physical activity of people [
1]. In the specific humidity time series collected on the showcase, the spikes that appear in temperature and relative time series are not present.
3.2.2. Spikes Analysis
As mentioned in the previous section, some spikes in temperature and relative humidity were monitored at the showcase position. An inspection of data collected in the main nave reveals the presence of spikes in some positions during several periods in the year. In particular, abrupt variations in temperature and relative humidity were measured at the left balustrade and on the choir surface both on the left side and right side.
On the showcase, the spikes occurred during winter (from September to April) at the same day time (12:00–13:00 UTC+1) with a variation of temperature of about 3 °C and of relative humidity of about 12% and a time rising of more than 1 h (
Figure 9a,b). As mentioned before, the specific humidity did not vary.
Near the left balustrade, spikes in temperature and relative humidity are recorded during two periods: from 19 August to 10 September and from 3 to 15 April at about the same day time (from 07:30 to 07:50 UTC+1). The intensities of peaks were, respectively, in the range of 2.1 °C to 3.0 °C and 8% to 10% with a rising time of 20 min.
On the right and left side of the choir, the peaks in temperature and relative humidity were detected in four periods during the year that are not always overlapping. As shown in
Figure 9c,d, in the period 12–14 September, some peaks occurred in temperature and relative humidity on the right choir side but not on the left side. The daytime peak was always in the afternoon (from 14:00 to 15:10 UTC+1) on the choir’s left side and in the morning (from 09:00 to 09:50 UTC+1) on the choir’s right side with a rising time of 20 min. The intensity of these temperature peaks ranged from 6 °C to 12 °C, and the intensity of relative humidity peaks was from 15% to 30%. At the same time, the specific humidity values were subject to small positive peaks.
The timing in temperature and relative humidity peaks and the church window positions suggest that the peaks can be due to the presence of direct radiation on the surfaces. In particular, the glass showcase is exposed to solar radiation through the central apse window in the central day hours in winter when the sun is low on the horizon. The right size of balustrade and the choir are exposed to solar radiation in the morning or in the afternoon on different months of the year as a consequence of the different positions of windows on the lateral side of the apse and the main nave.
3.2.3. Psychrometric Diagrams
The microclimatic conditions at the different positions are summarized in psychrometric diagrams as shown in
Figure 10, where the point cloud represents the air conditions and the red perimeter identifies the values permitted by the UNI standard [
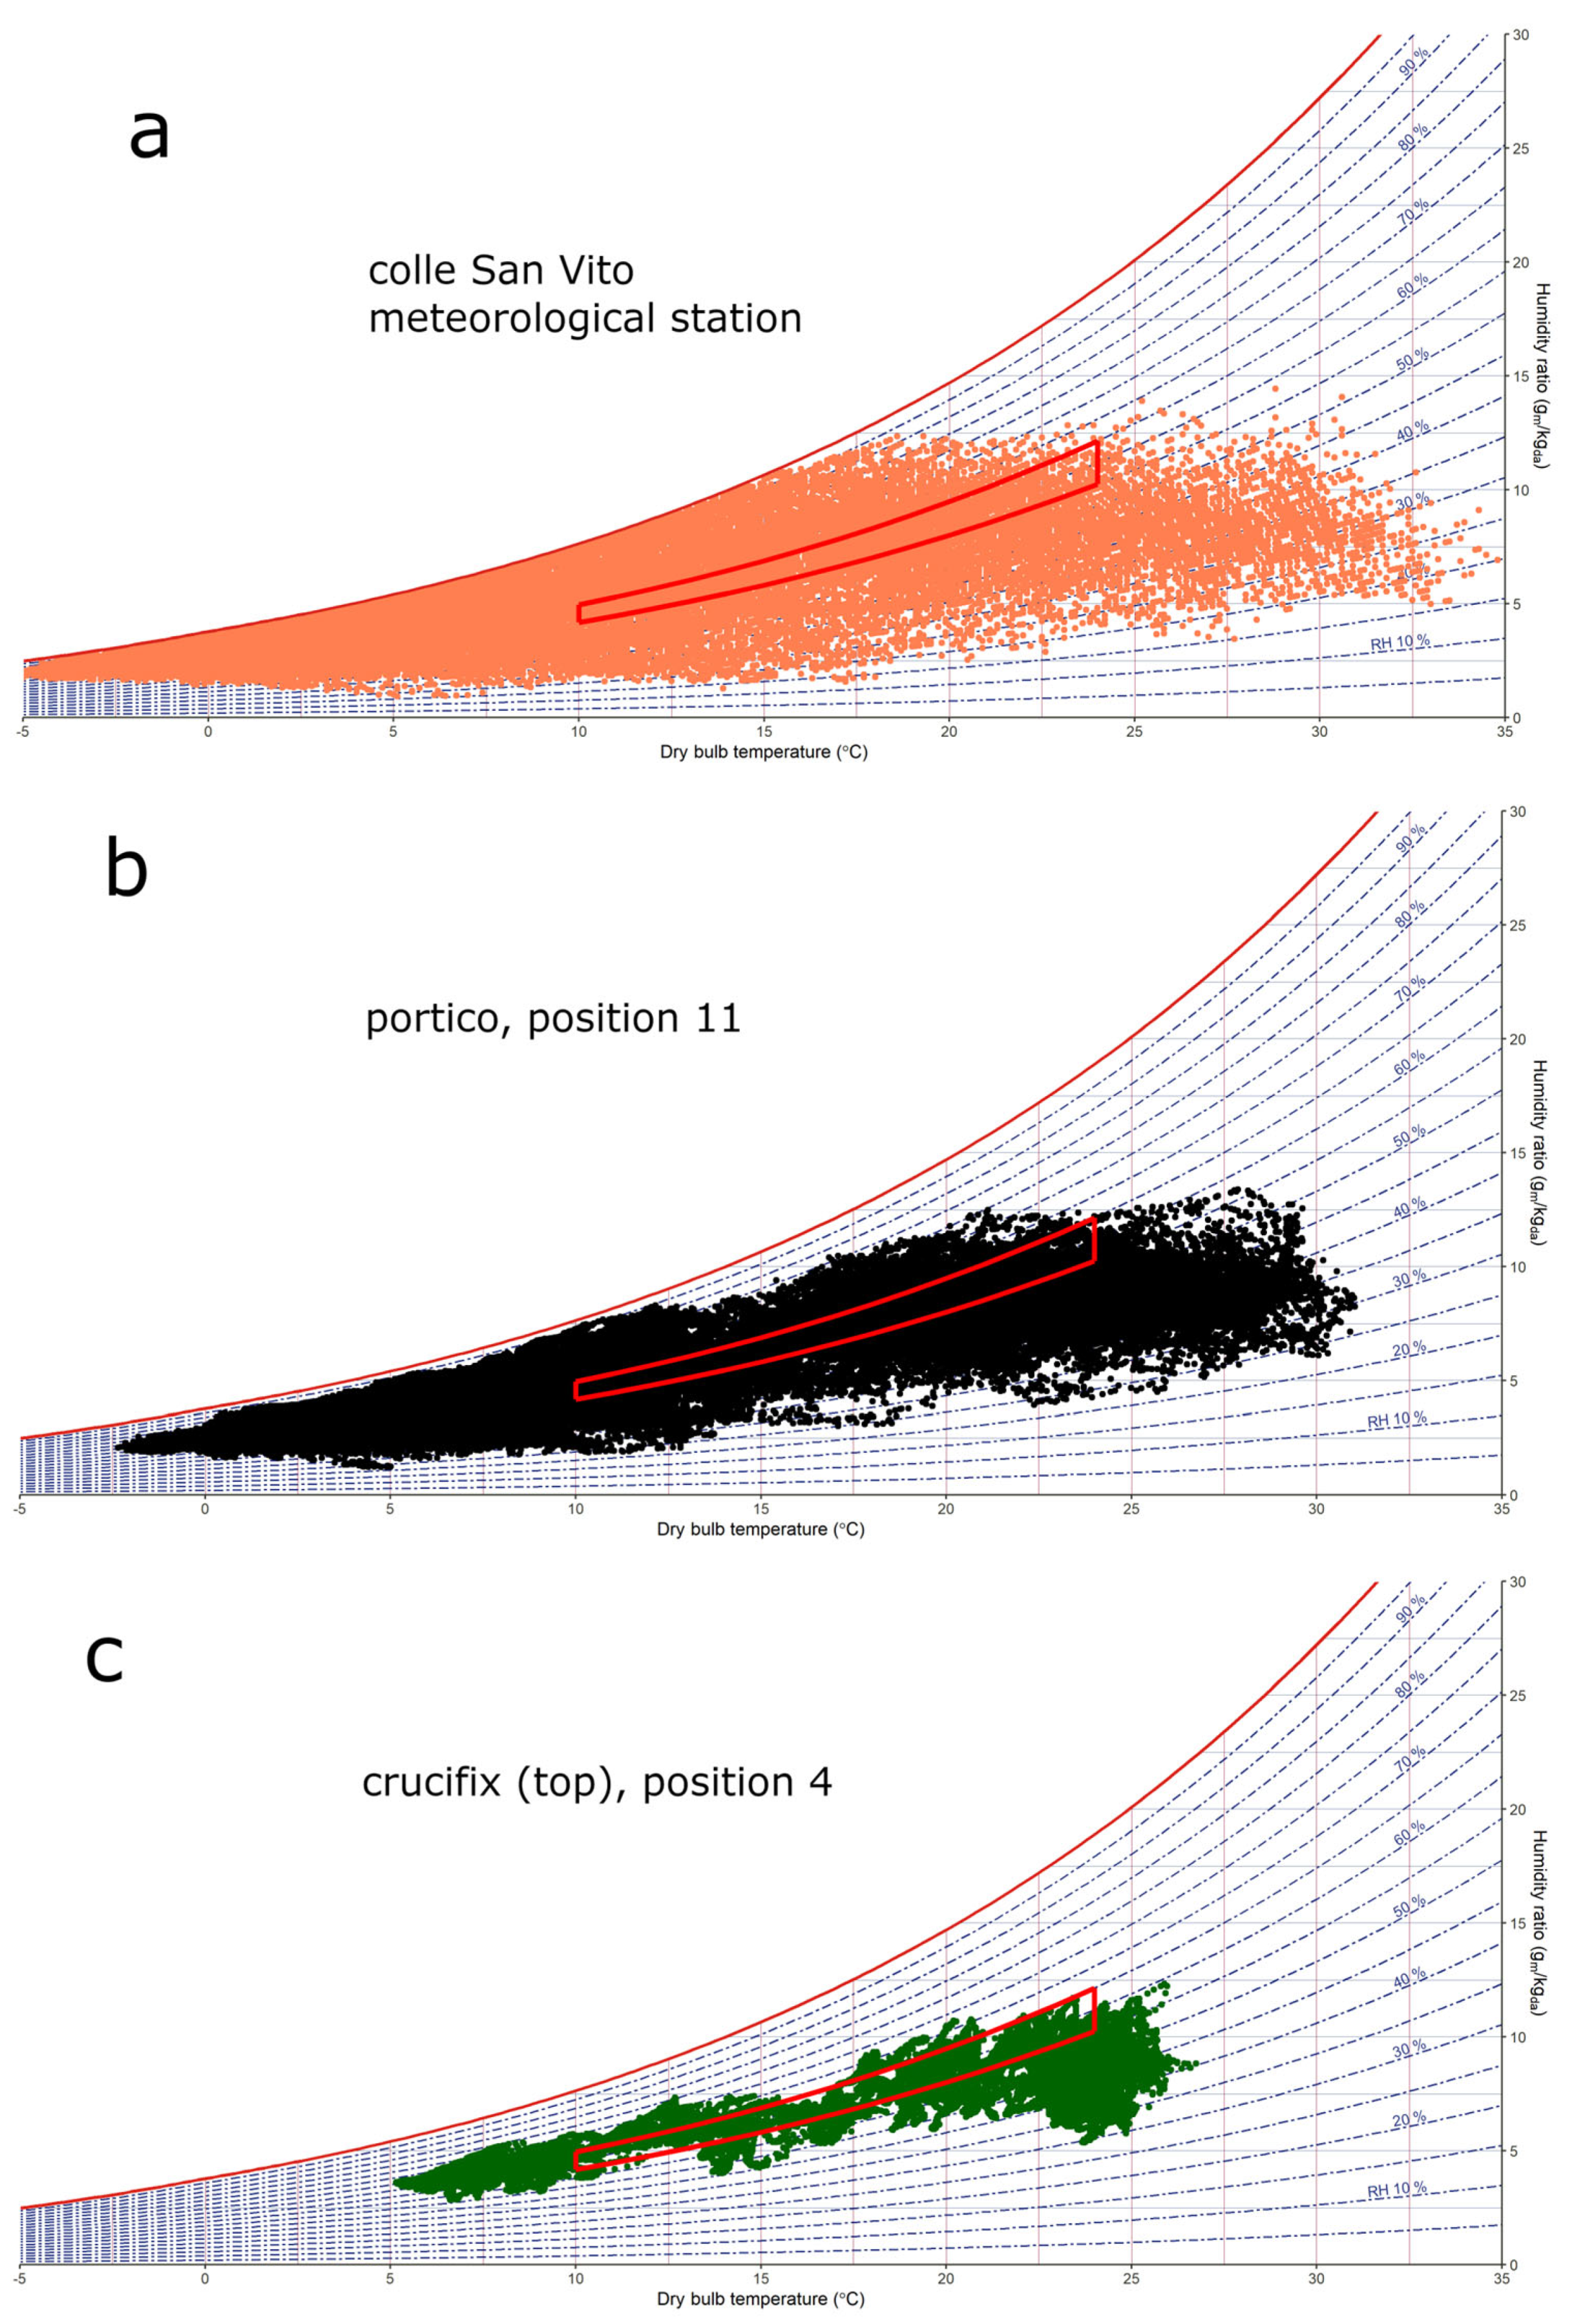
3] for frescoes (temperature ranges from 10 °C to 24 °C and relative humidity ranges from 55% to 65%). The comparison between the microclimatic conditions at the crucifix top (
Figure 10c) and the same physical quantities outside the church below the external portico and at the meteorological station of Colle San Vito (
Figure 10a,b) shows the church’s ability to limit extreme temperature values and prevent cases of air saturation.
The ancient stone walls, with their great thermal capacity, adsorb heat in the warm season and release it in the cold one, resulting in moderate excursions in temperature under the external portico with respect to ones at the meteorological station of Colle San Vito, and even more moderate temperature values inside the church.
Likewise, the church building limits the exchange of moisture. Under the portico, the saturation air condition never occurred, and inside the church, relative and specific humidity were, respectively, never greater than 80% and 12 g/kg. The frescoes under the portico and the Madonna and Child in the lunette on the main church door were therefore not affected by condensation events on the surfaces.
Moreover, the church building limits the microclimatic states close to the intervals recommended by the norms. In fact, in
Figure 10c, the points representing the microclimatic condition inside the church are concentrated close to the perimeter that identifies the conditions recommended by the UNI 10828 standard [
3].
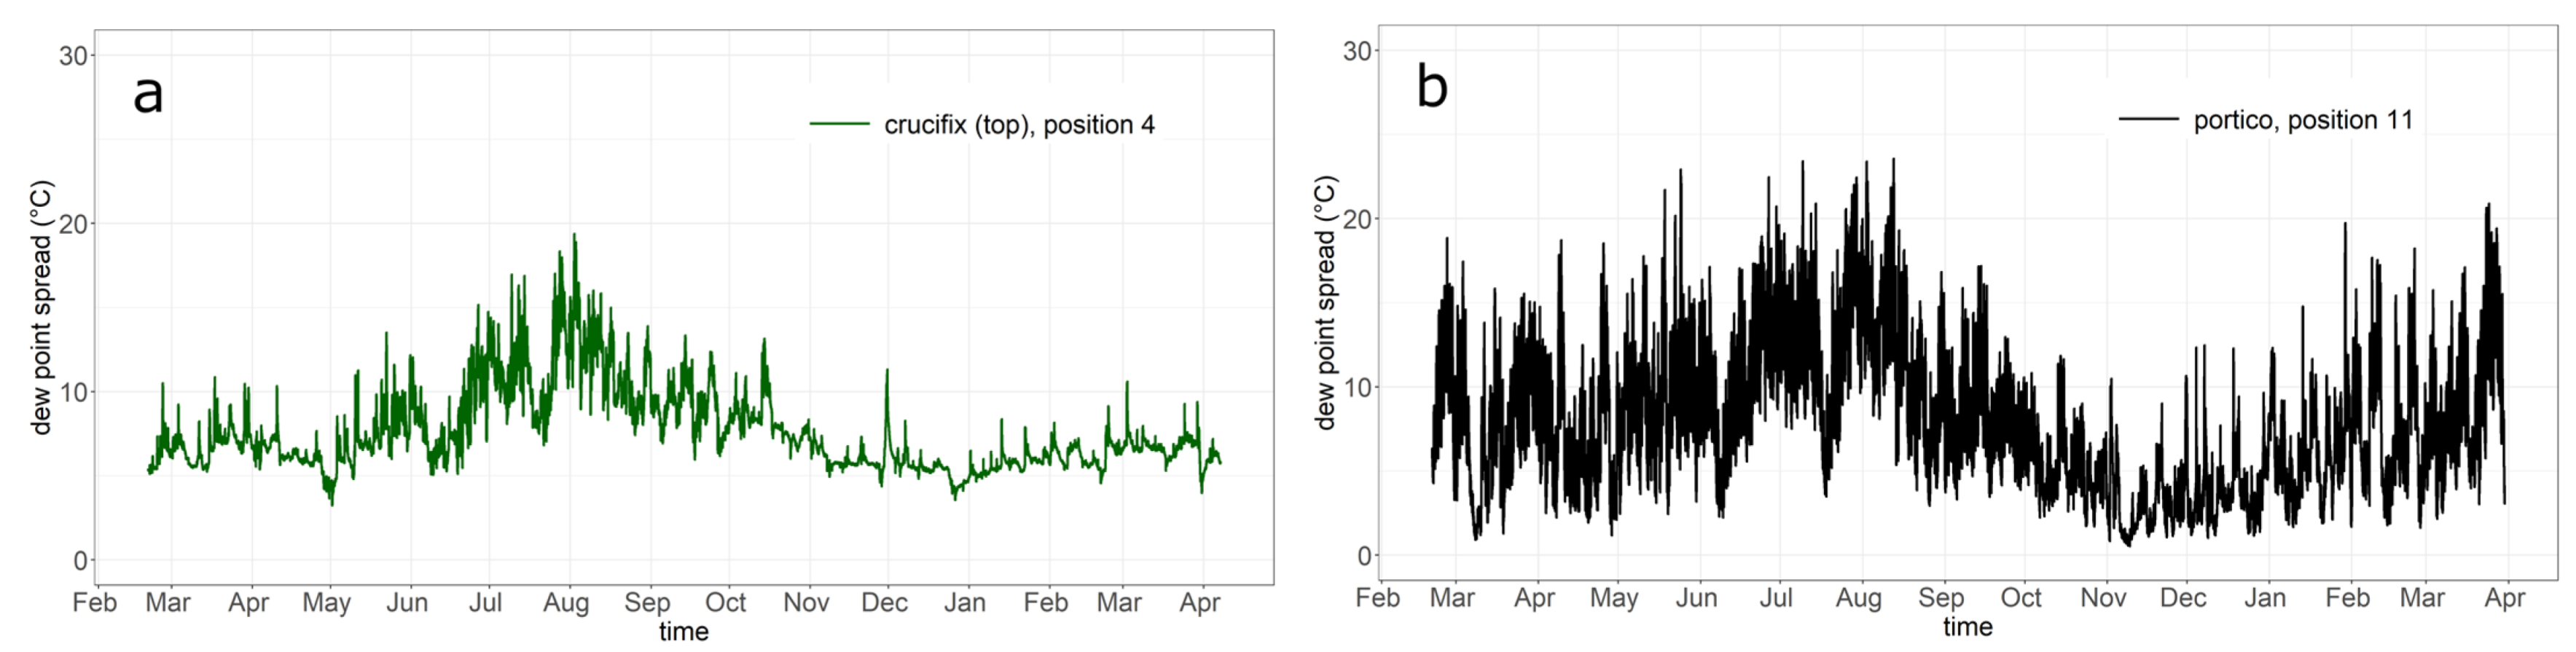
The dew point spread is defined as the difference between temperature and dew point temperature; it is an important physical quantity in microclimatic analysis as it gives information about saturation danger. If the dew point spread is close to 0 °C or lower, condensation can occur; otherwise, its value gives information about the distance from the saturation condition. In the presbytery, the air condition is always far from condensation (
Figure 11a), whereas under the portico (
Figure 11b), dew point spread is lower but it is always positive.
3.2.4. Daily Averages
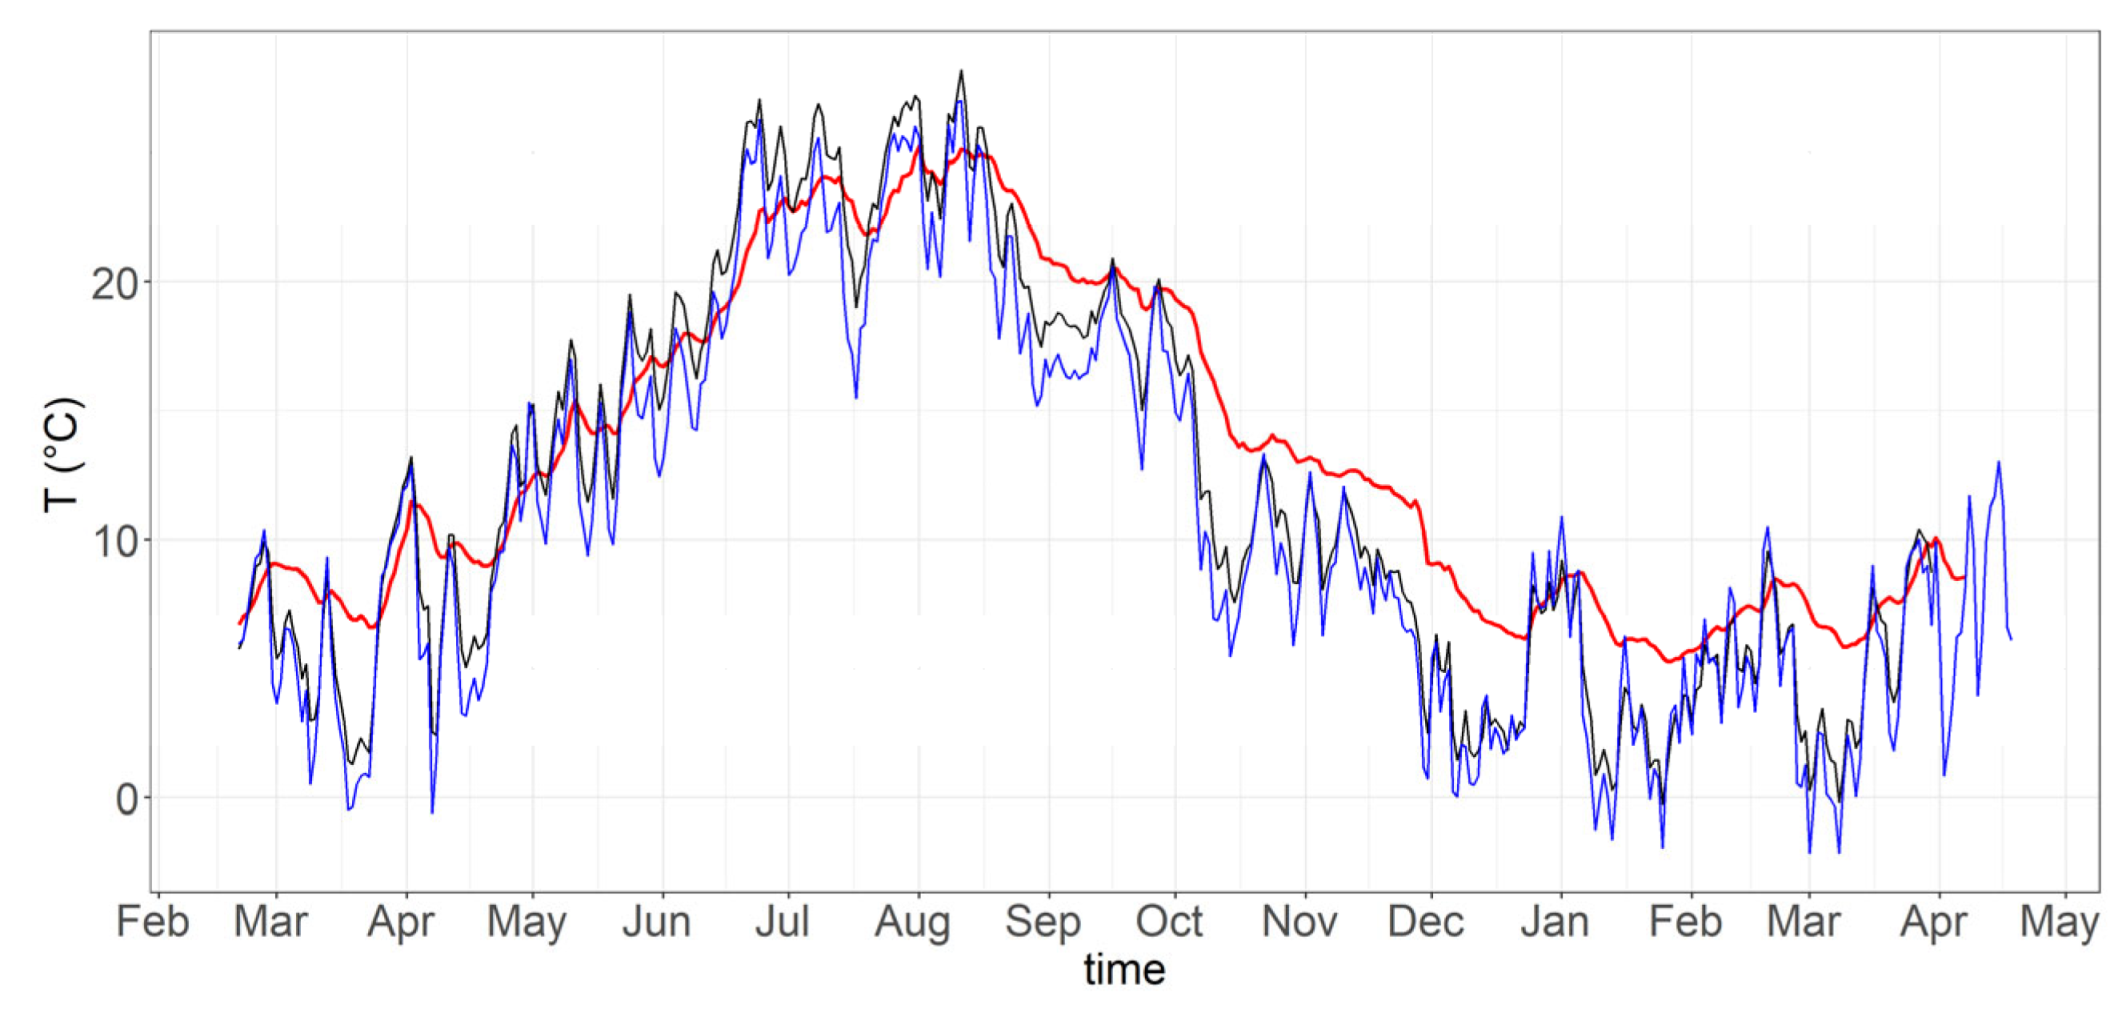
In order to compare indoor and outdoor temperature, the daily averages have been computed during the whole campaign period (
Figure 12). The measured data at the crucifix top are chosen as representative of the indoor conditions, measured data under the external portico represent the environment near the church building and the measurements at the meteorological station of Colle San Vito describe the outdoor conditions. The mean daily excursion in temperature at the meteorological station of Colle San Vito in unperturbed conditions is 10.5 ± 3.5 °C, near the church it is 5.2 ± 2.0 °C and inside the church it is reduced to 0.8 ± 0.6 °C. Outdoor daily temperatures near the church building and at the meteorological station have the same trend, and, as expected, the temperature values measured under the portico are slightly higher than the ones at the meteorological station. Daily averaged temperature in the apse has lower fluctuations as the thermal capacity of the building is able to filter temperature variations due to meteorological events. In summer, the temperature values inside the church represent the averaged state of outdoor temperature, whereas in the cold season, it has higher values as a consequence of adsorbed heat during the summer.
Cross-correlation between daily temperature under the portico and inside the church reveals that the maximum correlation (R = 0.97) is reached with a delay time of 3 days.
3.2.5. Monthly Averages
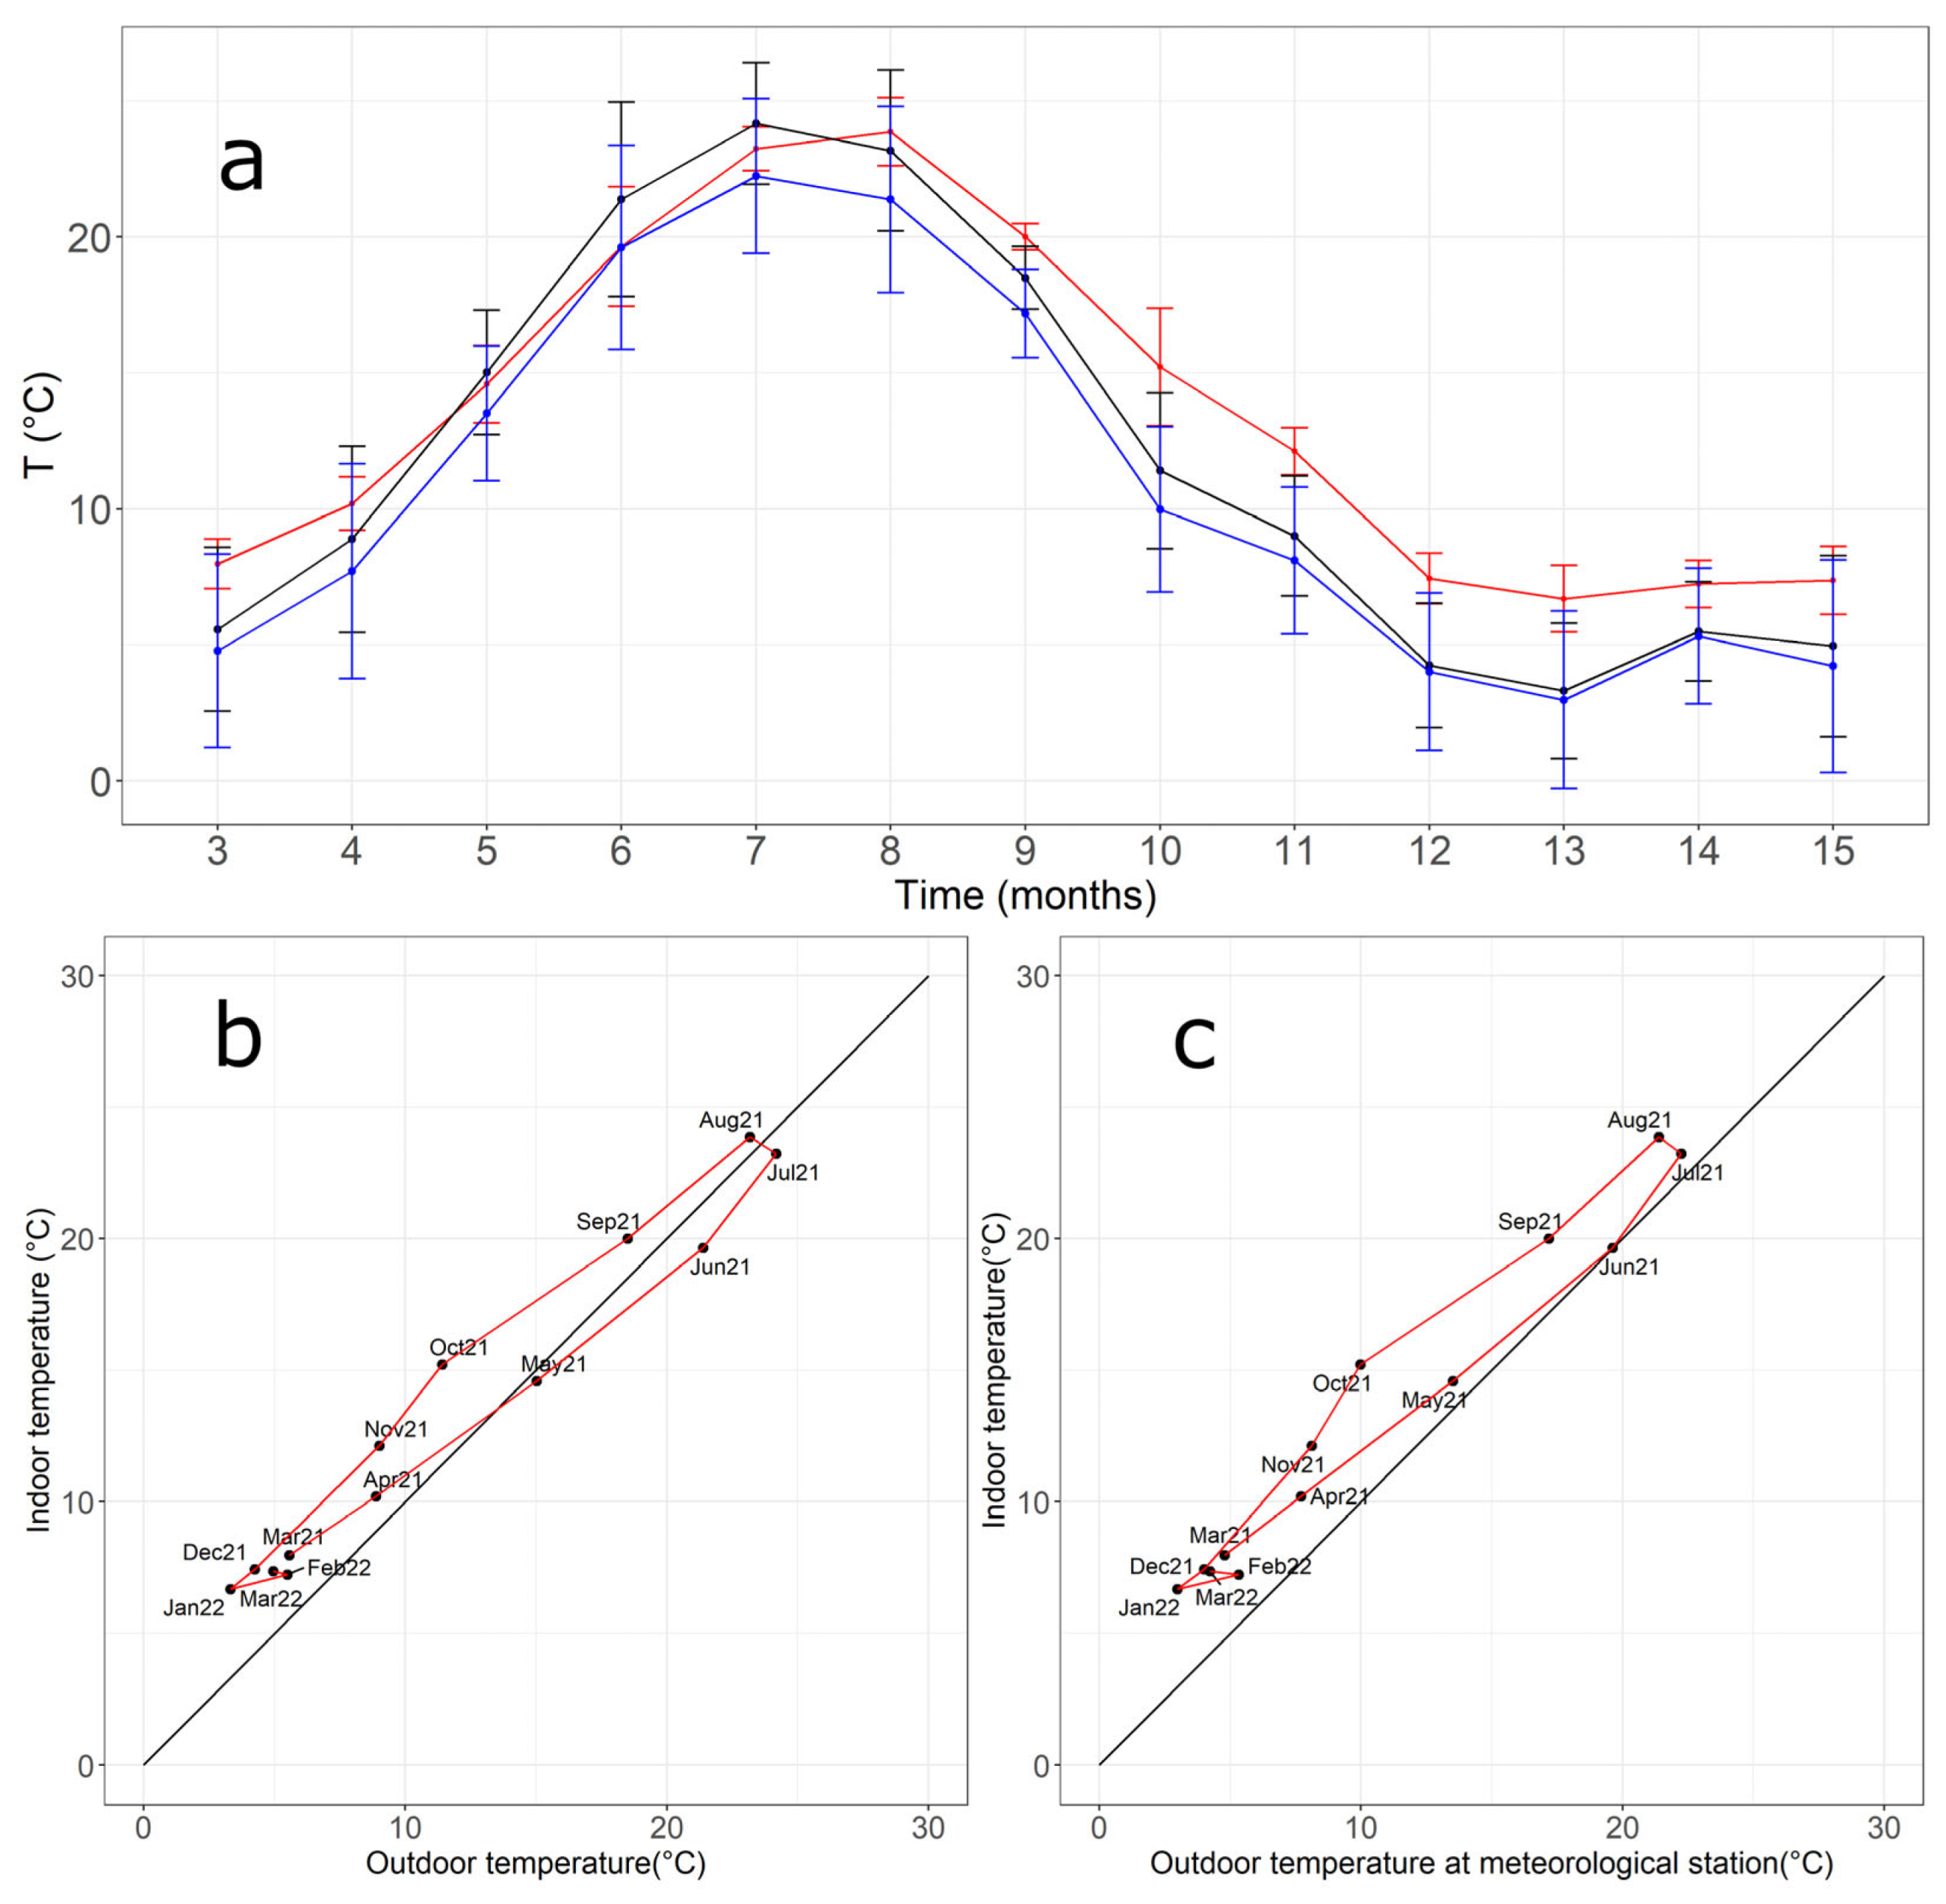
The average values of temperature were computed for each month as mean of daily data for both outdoor and indoor (
Figure 13). The annual trends show that, in general, the temperature below the portico is always higher than one at the meteorological station; moreover, in general, indoor temperature in the apse is higher than the temperature below the portico except during May, June and July. The scatter diagrams (
Figure 13b,c) between indoor and outdoor monthly temperatures show the typical behavior of ancient and thick walls [
8] absorbing heat during the summer and releasing it during the winter. In San Panfilo church, the internal heat sources are the people and the lighting system.
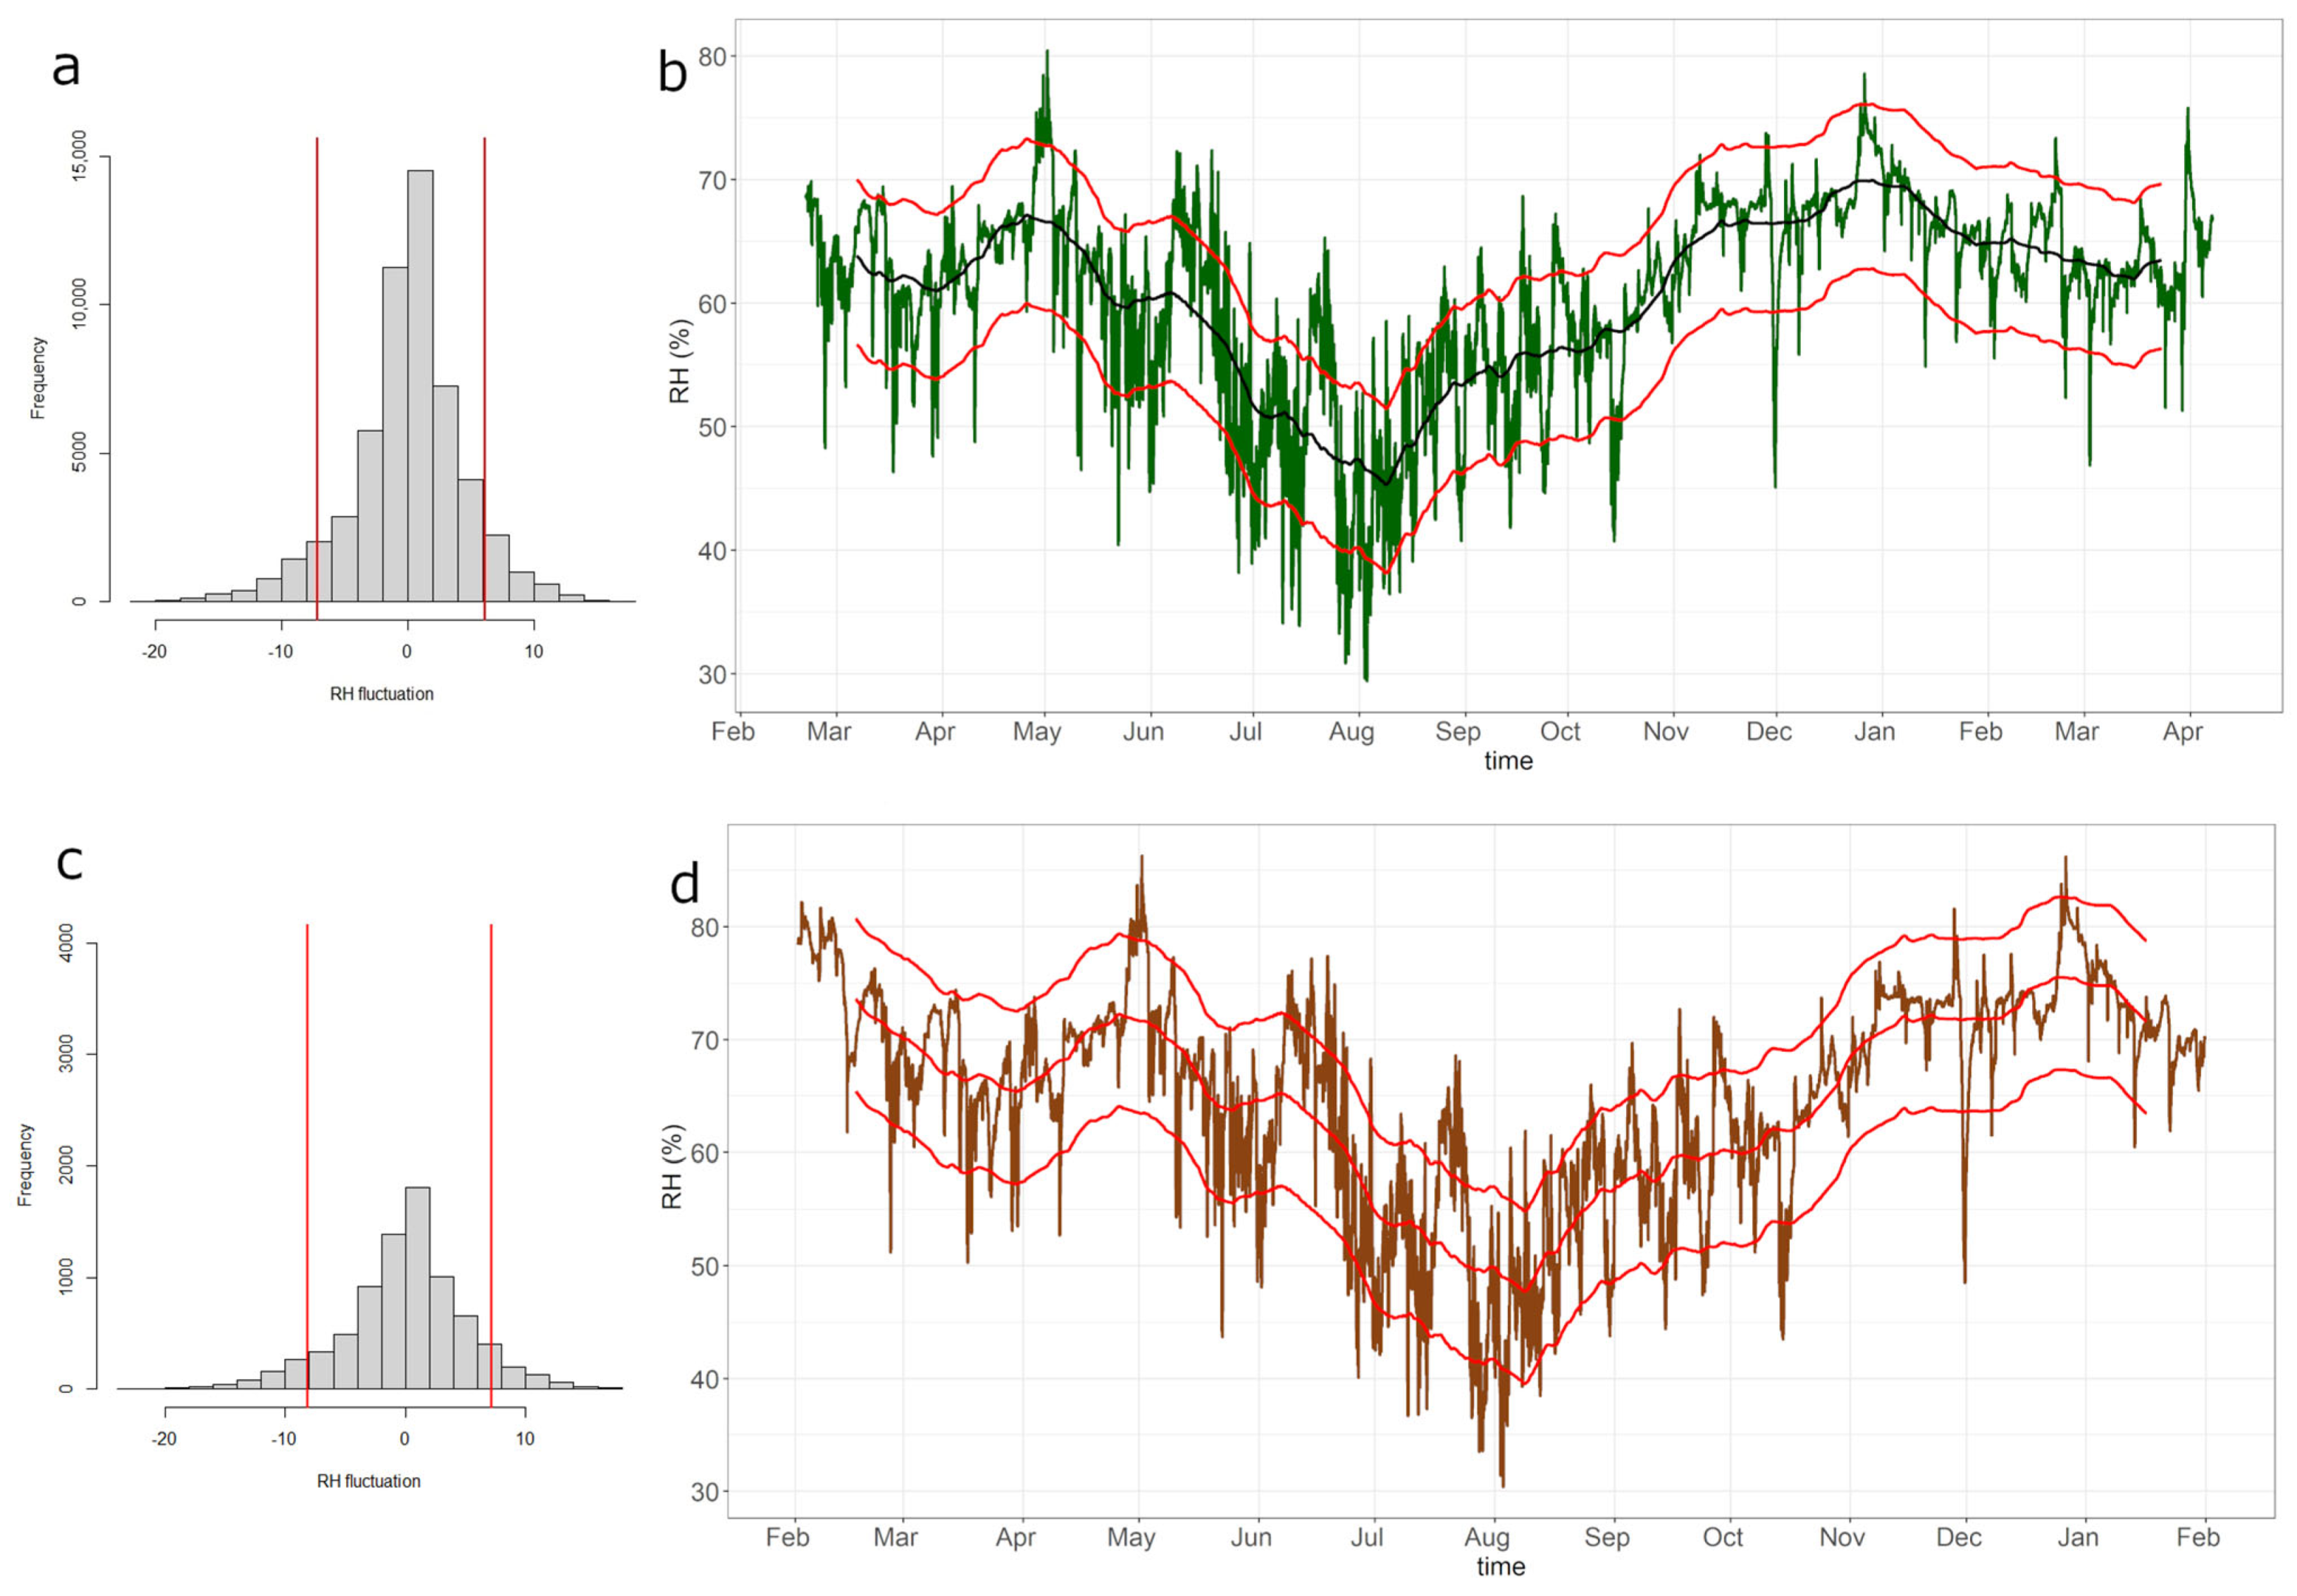
3.3. Historical Climate
The EN 15757 standard [
4] provides a methodology to individuate the historical climate of works of art and to identify the risky conditions. It considers a dataset of relative humidity collected at 15 min sampling time during a period of 13 months. The distribution of fluctuations of relative humidity data with respect to the centered moving average (30-day time window) are computed, and the 7th and 93rd percentile are individuated. The standard establishes a safe band between the 7th and 93rd percentiles and a risky area outside this interval.
The historical climate is useful information for maintaining works of art in favorable microclimatic conditions for conservation. In particular, the historical climate should be preserved during restoration projects, avoiding abrupt fluctuations.
In order to characterize the historical climate inside the church and, in particular, in the apse, the EN 15757 procedure was applied to the time series collected at the crucifix top (
Figure 14a,b). Unfortunately, the sensors near the walls (positions 13 and 14 in
Figure 2b and
Table 1), where Saturnino Gatti painted the frescoes, measured relative humidity for 12 months and at the sampling time of 60 min, so the methodology cannot be strictly applied. If the procedure is applied in these non-standard conditions, the results in
Figure 14b–d are obtained. The two trends in the center of the apse and near the walls are similar, with slightly more variable relative humidity data near the walls with respect to the center of apse, as a consequence of the exchange in humidity with the walls. The identified historical climate in the apse could be useful for restorers during the next restoration work.
4. Conclusions
The microclimate inside the church of San Panfilo in Tornimparte has been monitored in a measurement campaign that lasted 15 months from February 2021 to April 2022. The analysis was performed with intensive measurements on four days during the year and with continuous measurements at twelve sites inside the church and two sites outside during the whole period. Temperature and relative humidity were measured, whereas sensible humidity, dew point temperature and dew point spread were computed.
During the whole monitoring campaign, the church was routinely used by the people of Tornimparte for Sunday services and occasionally for funerals and weddings, so the environmental conditions were influenced by the presence of people, whereas the heating system did not modify them as it was turned off.
The intensive measurement data show horizontal homogeneity in temperature, relative and specific humidity, with one exception in summer, when more moisture is revealed near the main door on the left, likely due to moisture infiltrations in the wall. In the presbytery, the air is well mixed, and the wall temperature is lower near the roof and higher on the southern side in correspondence with the adjacent rectory.
The continuous data analysis provides evidence that direct solar radiation through windows on surfaces increases air temperature and decreases air relative humidity. The surfaces in the presbytery that are exposed to solar radiation through the central and lateral windows may increase their temperature; in particular, on the glass showcase on the presbytery, the temperature variation is about 3 °C in about one hour. Temperature variations inside the showcase (not measured), as a consequence of the greenhouse effect, are expected to be greater. The authors suggest to consider the eventuality of moving the glass showcase containing the silver processional crucifix to a protected position from direct solar radiation.
In the church, there is no danger of condensation as the dew point spread is always greater than 3 °C; below the external portico, condensation conditions are more likely, although they have never occurred throughout the year.
Church walls, as a consequence of their thermal capacity, reduce the variability in temperature, relative humidity and specific humidity. The measured values are close to the recommended ones by the UNI 10828 standard [
3] for frescoes. Thick and massive walls reduce daily temperature fluctuations and introduce a delay time of about three days.
The comparison between average monthly indoor and outdoor temperatures shows that air inside the church is warmer than outside in the months from August to April, while it is characterized by lower temperatures in the months of May, June and July. This behavior is typical of ancient buildings with thick walls and has been identified in massive historical churches [
8].
The application of the EN 15757 standard [
4] allows to supply to the restorers the range of historical variability of relative humidity that should be respected during the restoration project.
Author Contributions
Conceptualization, S.F., D.B., A.G., L.L., C.P. and A.R.; methodology, S.F., D.B. and A.G.; software, S.F.; formal analysis, S.F.; investigation, S.F., D.B., A.G. and C.P.; data curation, S.F., D.B. and C.P.; writing—original draft preparation, S.F.; writing—review and editing, S.F., D.B., A.G., L.L., C.P. and A.R.; visualization, S.F.; project administration, A.R.; funding acquisition, A.R. All authors have read and agreed to the published version of the manuscript.
Funding
This work was performed in the framework of the Project Tornimparte—“Archeometric investigation of the pictorial cycle of Saturnino Gatti in Tornimparte (AQ, Italy)” sponsored in 2021 by the Italian Association of Archeometry AIAR (
www.associazioneaiar.com).
Institutional Review Board Statement
Not applicable.
Informed Consent Statement
Not applicable.
Data Availability Statement
The data that support the findings of this study are not public; however, they are available for scientific purpose from the corresponding author.
Acknowledgments
The authors thank Domenico Fusari, President of Tornimparte Pro Loco, for his helpfulness and kindness; the parish priest and the deacon of the church of San Panfilo for the church availability and for their patience during the measurement campaign; Anna Galli, Letizia Bonizzoni and Simone Caglio for positioning the sensors during the COVID-19 lockdown; the Centro Funzionale and Ufficio Idrografico of Regione Abruzzo and the person of Giancarlo Boscaino for the availability of the dataset collected at the meteorological station of Colle San Vito.
Conflicts of Interest
The authors declare no conflict of interest.
References
- Camuffo, D. Microclimate for Cultural Heritage, 3rd ed.; Elsevier: Amsterdam, The Netherlands, 2019; pp. 1–552. [Google Scholar]
- Bernardi, A. Microclimate Inside Cultural Heritage Buildings; Ed il Prato: Padova, Italy, 2008; pp. 1–171. [Google Scholar]
- UNI 10829; Works of Art of Historical Importance–Ambient Conditions for the Conservation-Measurements and Analysis. UNI Standard Ente Nazionale Italiano di Unificazione: Milano, Italy, 1999.
- EN 15757; Conservation of Cultural Property-Specifications for Temperature and Relative Humidity to Limit Climate-induced Mechanical Damage in Organic Hygroscopic Materials. UNE-EN, AENOR: Madrid, Spain, 2010.
- Schito, E.; Testi, D.; Grassi, W. A Proposal for New Microclimate Indexes for the Evaluation of Indoor Air Quality in Museums. Buildings 2016, 6, 41. [Google Scholar] [CrossRef]
- Ferrarese, S.; Bertoni, D.; Dentis, V.; Gena, L.; Leone, M.; Rinaudo, M. Microclimatic analysis in the Museum of Physics, University of Turin, Italy: A case-study⋆. Eur. Phys. J. Plus 2018, 133, 538. [Google Scholar] [CrossRef]
- Ferrarese, S.; Bertoni, D.; Golzio, A. An index for the evaluation of microclimatic conditions inside museum showcases. Eur. Phys. J. Plus 2022, 137, 1376. [Google Scholar] [CrossRef]
- Camuffo, D.; Sturaro, G.; Valentino, A. Thermodinamic exchanges between the external boundary layer and the indoor microclimate at the Basilica of Santa Maria Maggiore, Rome, Italy: The problem of conservation of ancient works of art. Bound. Layer Meteorol. 1999, 92, 243–262. [Google Scholar] [CrossRef]
- Bernardi, A.; Todorov, V.; Hiristova, J. Microclimatic analysis in St. Stephan’s church, Nessebar, Bulgaria after interventions for the conservation of frescoes. J. Cult. Herit. 2000, 1, 281–286. [Google Scholar] [CrossRef]
- Baggio, P.; Bonacina, C.; Romagnoni, P.; Stevan, A.G. Microclimate analysis of the Scrovegni Chapel in Padua. Sud. Conserv. 2004, 49, 161–176. [Google Scholar]
- Andretta, M.; Coppola, F.; Seccia, L. Investigation on the interaction between the outdoor environment and the indoor microclimate of a historical library. J. Cult. Herit. 2016, 17, 75–86. [Google Scholar] [CrossRef]
- Aste, N.; Adhikari, R.; Buzzetti, M.; Della Torre, S.; Del Pero, C.; Leonforte, F. Microclimatic monitoring of the Duomo (Milan Cathedral): Risks-based analysis for the conservation of its cultural heritage. Build. Environ. 2018, 148, 240–257. [Google Scholar] [CrossRef]
- Lanteri, L.; Lo Monaco, A.; Pelosi, C. The relevance of monitoring the microclimate in museums. The case of Colle del Duomo in Viterbo. Eur. J. Sci. Theol. 2020, 16, 181–191. [Google Scholar]
- Cataldo, R.; De Donno, A.; De Nunzio, G.; Leucci, G.; Nuzzo, L.; Siviero, S. Integrated methods for analysis of deterioration of cultural heritage: The Crypt of “Cattedrale di Otranto”. J. Cult. Herit. 2005, 6, 29–38. [Google Scholar] [CrossRef]
- Varas-Muriel, M.; Fort, R.; Martínez-Garrido, M.; Zornoza-Indart, A.; López-Arce, P. Fluctuations in the indoor environment in Spanish rural churches and their effects on heritage conservation: Hygro-thermal and CO2 conditions monitoring. Build. Environ. 2014, 82, 97–109. [Google Scholar] [CrossRef] [Green Version]
- Sileo, M.; Gizzi, F.T.; Masini, N. Low cost monitoring approach for the conservation of frescoes: The crypt of St. Francesco d’Assisi in Irsina (Basilicata, Southern Italy). J. Cult. Herit. 2017, 23, 89–99. [Google Scholar] [CrossRef]
- Mannetti, T.R.; Chelli, N.; Vecchioli, G. Saturnino Gatti nella Chiesa di San Panfilo a Tornimparte; Edizioni del Gallo Cedrone: L’Aquila, Italy, 1992; pp. 1–72. [Google Scholar]
- Arbace, L.; Di Paolo, G. I Volti Dell’anima, Saturnino Gatti: Vita e Opere Di Un Artista Del Rinascimento; De Siena Editore, Ed.; De Siena: Pescara, Italy, 2012. [Google Scholar]
- Galli, A.; Alberghina, M.F.; Re, A.; Magrini, D.; Grifa, C.; Ponterio, R.C.; La Russa, M.F. Special Issue: Results of the II National Research project of AIAr: Archaeometric study of the frescoes by Saturnino Gatti and workshop at the church of San Panfilo in Tornimparte (AQ, Italy). Appl. Sci. 2023; to be submitted. [Google Scholar]
- Bolton, D. The Computation of Equivalent Potential Temperature. Mon. Weather Rev. 1980, 108, 1046–1053. [Google Scholar] [CrossRef]
Figure 1.
(a) Localization of San Panfilo church in Tornimparte in central Italy and (b) in Abruzzo region.
Figure 1.
(a) Localization of San Panfilo church in Tornimparte in central Italy and (b) in Abruzzo region.
Figure 2.
Church plan: (a) sites on spatial grid for intensive measurements (black points and lines); (b) positions of instruments for continuous monitoring (red points).
Figure 2.
Church plan: (a) sites on spatial grid for intensive measurements (black points and lines); (b) positions of instruments for continuous monitoring (red points).
Figure 3.
Instruments: (a) Testo 625 thermo-hygrometer, (b) Fluke 62 Mini infrared thermometer, (c) HOBO-UX100-011 thermo-hygrometer, and (d) Testo 175-H2 thermo-hygrometer.
Figure 3.
Instruments: (a) Testo 625 thermo-hygrometer, (b) Fluke 62 Mini infrared thermometer, (c) HOBO-UX100-011 thermo-hygrometer, and (d) Testo 175-H2 thermo-hygrometer.
Figure 4.
(a) Temperature, (b) relative humidity, (c) specific humidity and (d) dew point spread at 2.0 m from the floor on 6 July 2021 at 9:00 UTC+1.
Figure 4.
(a) Temperature, (b) relative humidity, (c) specific humidity and (d) dew point spread at 2.0 m from the floor on 6 July 2021 at 9:00 UTC+1.
Figure 5.
(a) Temperature, (b) relative humidity, (c) specific humidity and (d) dew point spread at 1.2 m from the floor on 22 November 2021 at 14:30 UTC+1.
Figure 5.
(a) Temperature, (b) relative humidity, (c) specific humidity and (d) dew point spread at 1.2 m from the floor on 22 November 2021 at 14:30 UTC+1.
Figure 6.
(a) Positions of the vertical profiles, (b) temperature profiles, (c) relative humidity profiles and (d) specific humidity profiles on 22 April 2022 at 14:30 UTC+1.
Figure 6.
(a) Positions of the vertical profiles, (b) temperature profiles, (c) relative humidity profiles and (d) specific humidity profiles on 22 April 2022 at 14:30 UTC+1.
Figure 7.
Apse wall temperature on 22 April 2022 at 14:30 UTC+1.
Figure 7.
Apse wall temperature on 22 April 2022 at 14:30 UTC+1.
Figure 8.
(a) Temperature at crucifix top (green line) and apse near wall right (orange line); (b) temperature on the case (blue line); (c) relative humidity at the crucifix top (green line) and on the case (blue line); (d) specific humidity at crucifix top.
Figure 8.
(a) Temperature at crucifix top (green line) and apse near wall right (orange line); (b) temperature on the case (blue line); (c) relative humidity at the crucifix top (green line) and on the case (blue line); (d) specific humidity at crucifix top.
Figure 9.
(a) Temperature on the case and at crucifix top on 18 and 19 January 2022; (b) relative humidity on the case and at crucifix top on 18 and 19 January 2022; (c) temperature at the choir from 12 to 14 September 2021; (d) relative humidity at the choir from 12 to 14 September 2021.
Figure 9.
(a) Temperature on the case and at crucifix top on 18 and 19 January 2022; (b) relative humidity on the case and at crucifix top on 18 and 19 January 2022; (c) temperature at the choir from 12 to 14 September 2021; (d) relative humidity at the choir from 12 to 14 September 2021.
Figure 10.
Psychrometric chart (a) at San Vito meteorological station, (b) outside San Panfilo church below the external portico and (c) inside the church at the crucifix top. The red perimeter identifies the conditions permitted by the UNI 10828 standard.
Figure 10.
Psychrometric chart (a) at San Vito meteorological station, (b) outside San Panfilo church below the external portico and (c) inside the church at the crucifix top. The red perimeter identifies the conditions permitted by the UNI 10828 standard.
Figure 11.
(a) Dew point spread at crucifix top and (b) dew point spread below the external portico.
Figure 11.
(a) Dew point spread at crucifix top and (b) dew point spread below the external portico.
Figure 12.
Daily temperature inside the church (red), outside below the external portico (black) and at the S. Vito meteorological station (blue).
Figure 12.
Daily temperature inside the church (red), outside below the external portico (black) and at the S. Vito meteorological station (blue).
Figure 13.
(a) Temperature monthly averages inside the church (red), below the external portico (black) and at the S. Vito meteorological station (blue); (b) scatter diagram with inside and outside (portico) monthly temperature; (c) scatter diagram between inside and outside (meteorological station) monthly temperature.
Figure 14.
Historical relative humidity variability according to EN 15757 standard, in the figures red lines and curves show the 7th and 93rd percentiles; (a) distribution of relative humidity fluctuations at crucifix top site; (b) relative humidity variability at the crucifix top side (green line); (c) distribution of relative humidity fluctuations in the left side of the apse; (d) relative humidity variability at the left side of the apse (brown line).
Table 1.
Positions of sensors during continuous monitoring.
Table 1.
Positions of sensors during continuous monitoring.
Positions
(Figure 2) | Site | Height from The Floor (cm) | Acquisition Time Intervals (Minutes) | Acquisition Time Period | Instrument |
|---|
| 1 | case (left) | 86 | 10 | 20 February 2021 to 18 April 2022 | HOBO-UX100-011 |
| 2 | case (right) | 86 | 10 | 20 February 2021 to 18 April 2022 | HOBO-UX100-011 |
| 3 | crucifix (bottom) | 110 | 10 | 20 February 2021 to 18 April 2022 | HOBO-UX100-011 |
| 4 | crucifix (top) | 207 | 10 | 20 February 2021 to 7 April 2022 | HOBO-UX100-011 |
| 5 | balustrade (left) | 56 | 10 | 20 February 2021 to 18 April 2022 | HOBO-UX100-011 |
| 6 | balustrade (right) | 56 | 10 | 20 February 2021 to 18 April 2022 | HOBO-UX100-011 |
| 7 | pulpit | 214 | 10 | 20 February 2021 to 18 April 2022 | HOBO-UX100-011 |
| 8 | column | 240 | 10 | 20 February 2021 to 22 November 2021 | HOBO-UX100-011 |
| 8bis | apse (right) | 328 | 10 | 22 November 2021to 18 April 2022 | HOBO-UX100-011 |
| 9 | choir (left) | 278 | 10 | 20 February 2021 to 18 April 2022 | HOBO-UX100-011 |
| 10 | choir(right) | 278 | 10 | 6 July 2021 to 18 April 2022 | HOBO-UX100-011 |
| 11 | portico | 268 | 10 | 20 February 2021 to 30 March 2022 | HOBO-UX100-011 |
| 12 | colle San Vito meteorological station | / | 15 | 20 February 2021 to 18 April 2022 | / |
| 13 | apse (right) | 328 | 60 | 1 February 2021 to 31 January 2022 | Testo 175-H2 |
| 14 | apse (left) | 315 | 60 | 1 February 2021 to 31 January 2022 | Testo 177-H1 |
Table 2.
Instruments description.
Table 2.
Instruments description.
| Instrument | Temperature Accuracy (°C) | Temperature Resolution (°C) | Temperature Range (°C) | Relative
Humidity
Accuracy (%) | Relative
Humidity
Resolution (%) | Relative
Humidity
Range (%) |
|---|
| HOBO-UX100-011 | 0.21 | 0.024 | −20 to 70 | 2.5 | 0.05 | 1 to 95 |
| Testo 625 | 0.5 | 0.1 | −10 to 60 | 2.5 | 0.1 | 0 to 100 |
| Fluke 62 Mini | 0.5 | 0.2 | −30 to 500 | - | - | - |
| Testo 177-H1/175-H2 | 0.5 | 0.1 | −20 to 70 | 3.0 | 0.1 | 0 to 100 |
| Disclaimer/Publisher’s Note: The statements, opinions and data contained in all publications are solely those of the individual author(s) and contributor(s) and not of MDPI and/or the editor(s). MDPI and/or the editor(s) disclaim responsibility for any injury to people or property resulting from any ideas, methods, instructions or products referred to in the content. |
© 2023 by the authors. Licensee MDPI, Basel, Switzerland. This article is an open access article distributed under the terms and conditions of the Creative Commons Attribution (CC BY) license (https://creativecommons.org/licenses/by/4.0/).


 ,
, 


