
Multi-Technique Characterization of Painting Drawings of the Pictorial Cycle at the San Panfilo Church in Tornimparte (AQ)


 , , , ,
  , ,
, ,  ,
,
Abstract
:1. Introduction
2. Materials and Methods
2.1. Materials
2.2. Methods
2.2.1. OM Measurements
2.2.2. SEM-EDS Measurements
2.2.3. XRD Measurements
2.2.4. Raman and µ-Raman Measurements
2.2.5. FT-IR Measurements
2.2.6. ICP-MS Measurements
2.2.7. TIMS Measurements
3. Results and Discussion
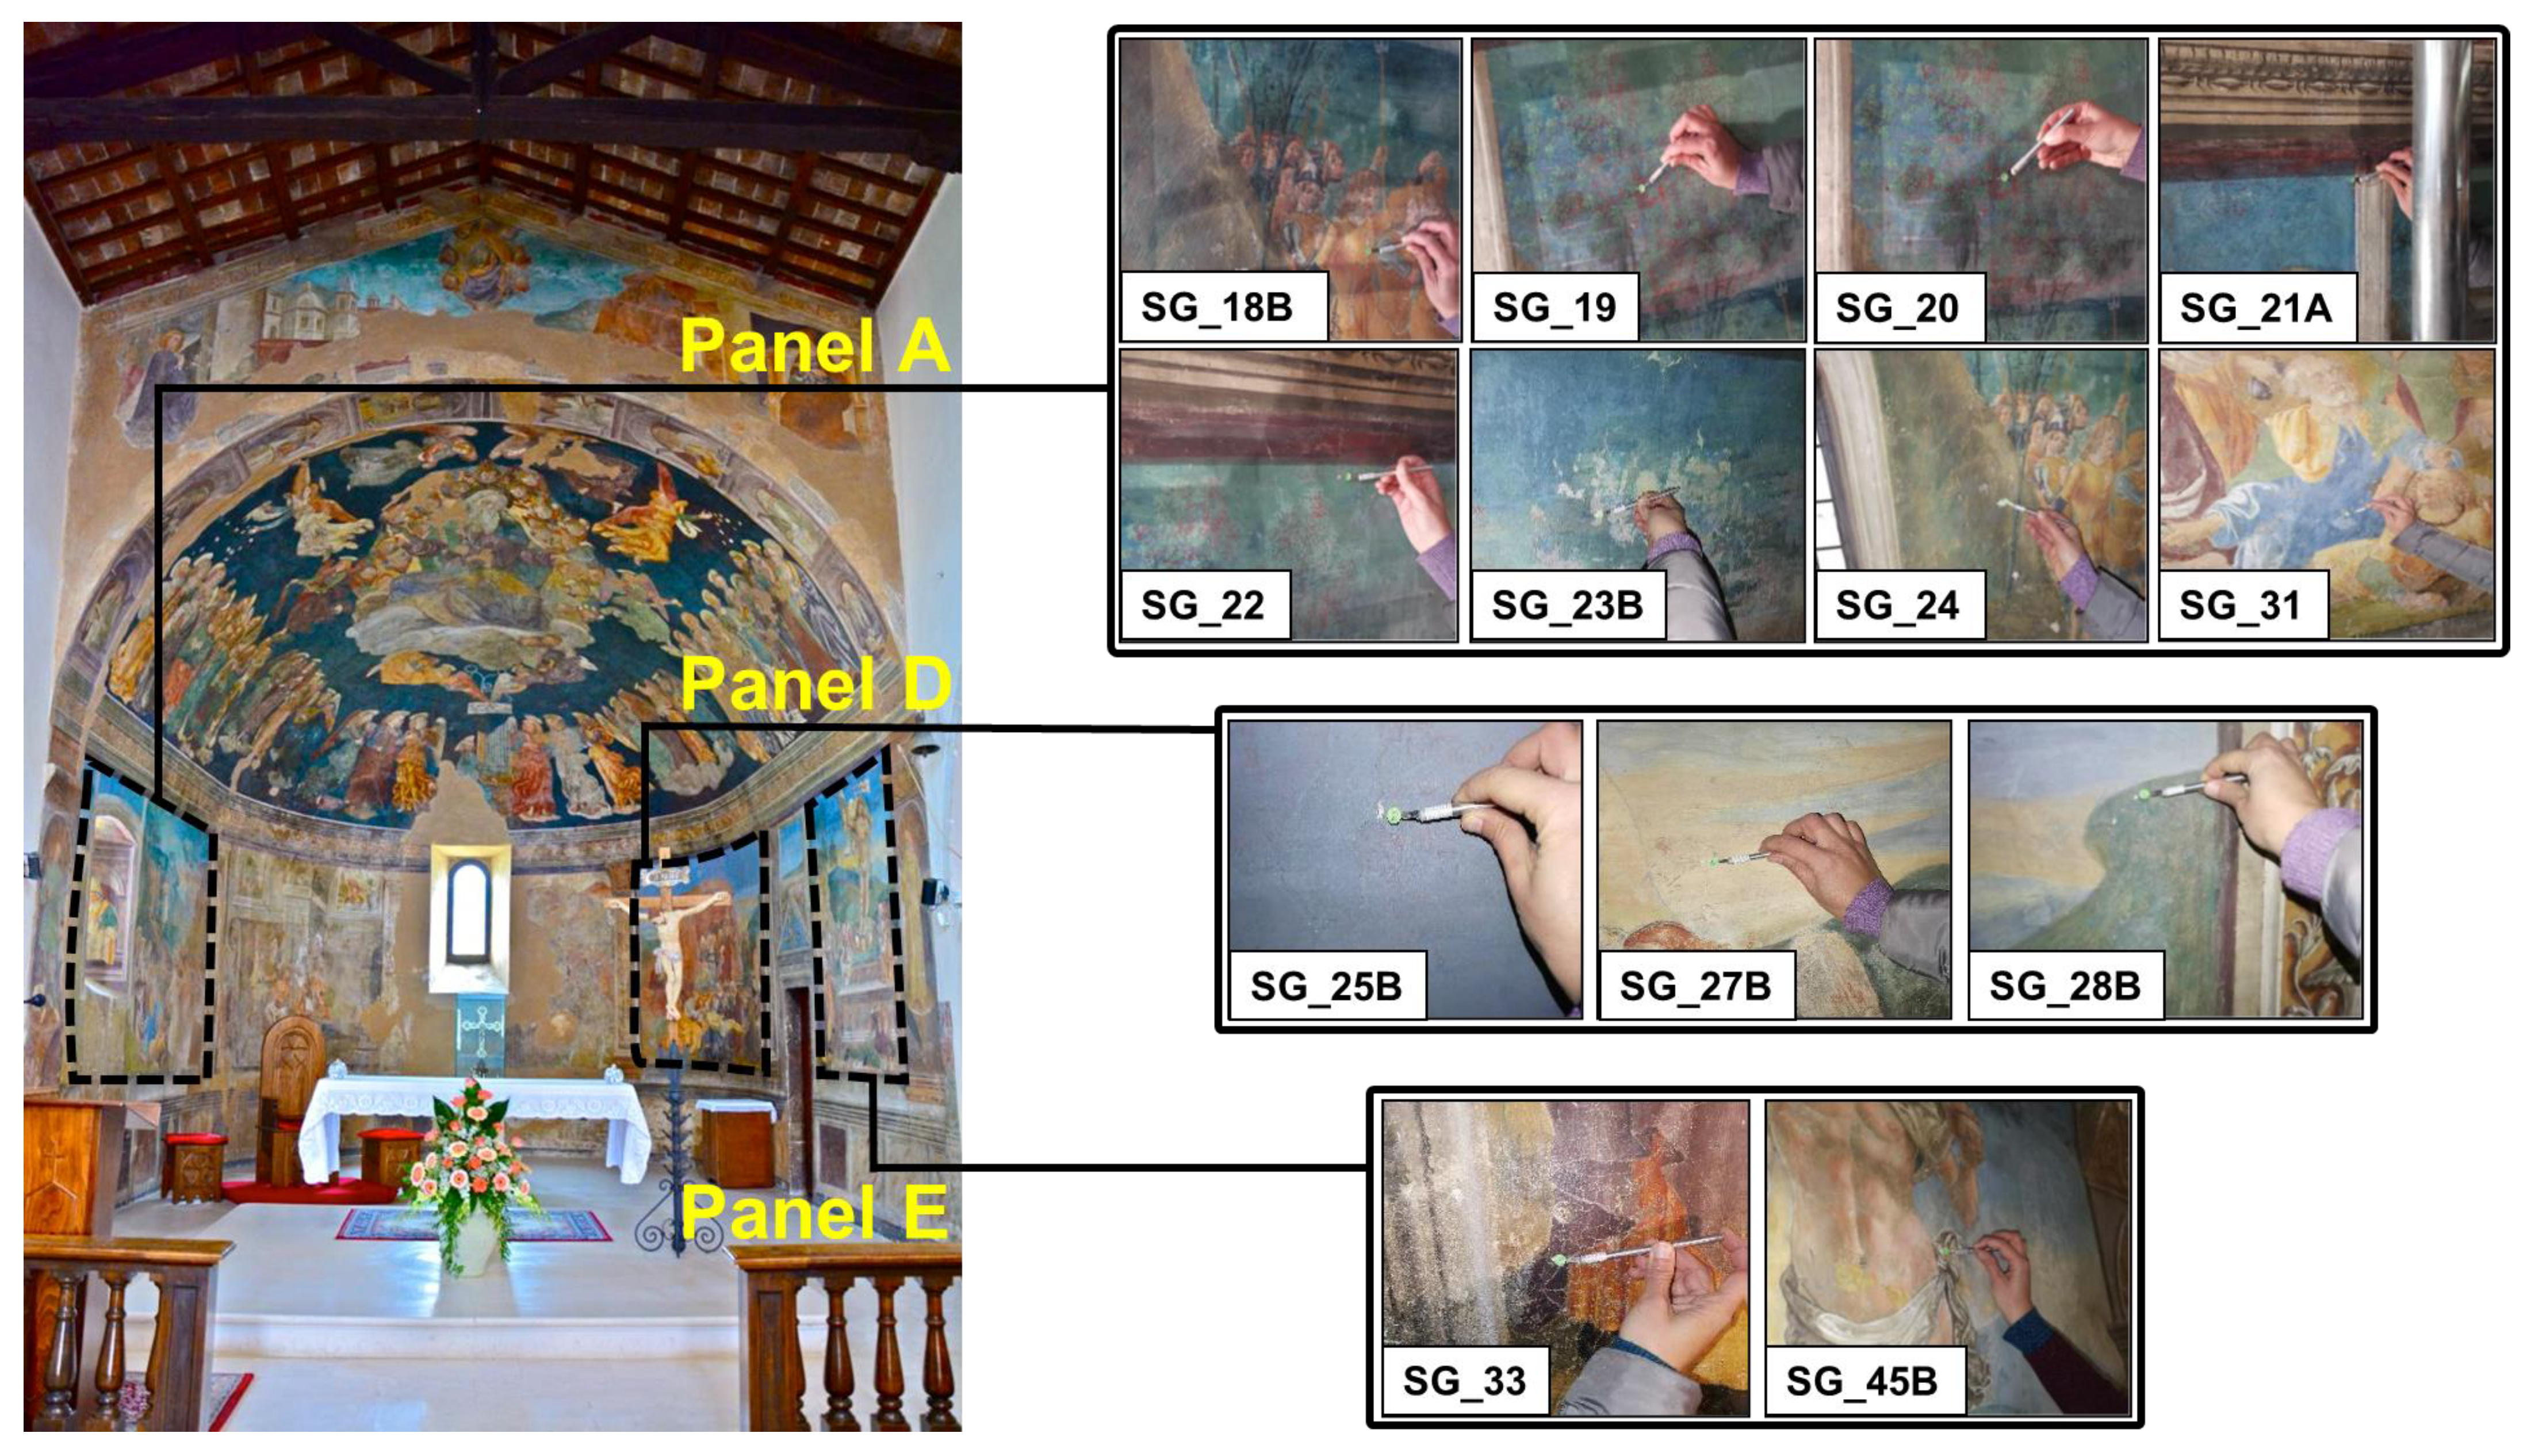
3.1. Panel A “Il Bacio di Giuda e la Cattura di Cristo”


| Sample ID | P2O5 | MgO | Al2O3 | SiO2 | SO3 | Cl | K2O | CaO | FeO | CuO | ZnO |
|---|---|---|---|---|---|---|---|---|---|---|---|
| SG_19 Greenish layer | - | 3.58 | 1.89 | 12.33 | 3.83 | - | - | 17.75 | 3.02 | 55.54 | - |
| SG_19 Blue layer | - | 1.84 | 1.29 | 13.27 | 1.96 | - | 1.38 | 41.76 | 3.24 | 34.50 | - |
| SG_20 Blue layer | - | 1.54 | - | 10.99 | 2.14 | - | 0.90 | 45.24 | - | 38.48 | - |
| SG_21A A blue layer | - | - | 2.01 | 20.10 | 3.44 | - | - | 5.70 | 2.06 | 7.49 | 58.43 |
| SG_21A A layer, black grains | 29.93 | - | - | - | 3.04 | - | - | 36.19 | - | - | 30.13 |
| SG_21A B layer, blue grains | - | - | - | - | - | - | - | 1.06 | - | 98.94 | - |
| SG_22 Greenish layer | - | 1.86 | 1.68 | 4.77 | - | 24.73 | 0.63 | 4.95 | - | 61.38 | - |
| Sample ID | Quartz | Calcite | Plagioclase | Mica | Malachite | Chlorite | Atacamite |
|---|---|---|---|---|---|---|---|
| SG_19 | tr | - | - | - | XXX | - | - |
| SG_22 | XX | X | X | tr | - | tr | tr |
3.2. Panel D “Compianto sul Cristo Morto”
3.3. Panel E “Resurrezione”
4. Conclusions
Author Contributions
Funding
Institutional Review Board Statement
Informed Consent Statement
Data Availability Statement
Conflicts of Interest
References
- Latini, M. Chiesa di San Panfilo—Villagrande di Tornimparte (AQ). In Guida alle Chiese d’Abruzzo; Carsa Edizioni: Pescara, Italy, 2016; pp. 139–140. ISBN 978-88-501-0354-6. [Google Scholar]
- Zuena, M.; Buemi, L.P.; Stringari, L.; Legnaioli, S.; Lorenzetti, G.; Palleschi, V.; Nodari, L.; Tomasin, P. An integrated diagnostic approach to Max Ernst’s painting materials in his Attirement of the Bride. J. Cult. Herit. 2020, 43, 329–337. [Google Scholar] [CrossRef]
- Venuti, V.; Fazzari, B.; Crupi, V.; Majolino, D.; Paladini, G.; Morabito, G.; Certo, G.; Lamberto, S.; Giacobbe, L. In situ diagnostic analysis of the XVIII century Madonna della Lettera panel painting (Messina, Italy). Spectrochim. Acta Part A Mol. Biomol. Spectrosc. 2020, 228, 117822. [Google Scholar] [CrossRef] [PubMed]
- Fermo, P.; Mearini, A.; Bonomi, R.; Arrighetti, E.; Comite, V. An integrated analytical approach for the characterization of repainted wooden statues dated to the fifteenth century. Microchem. J. 2020, 157, 105072. [Google Scholar] [CrossRef]
- Castro, K.; Benito, Á.; Martínez-Arkarazo, I.; Etxebarria, N.; Madariaga, J.M. Scientific examination of classic Spanish stamps with colour error, a non-invasive micro-Raman and micro-XRF approach: The King Alfonso XIII (1889–1901 “Pelón”) 15 cents definitive issue. J. Cult. Herit. 2008, 9, 189–195. [Google Scholar] [CrossRef]
- La Russa, M.F.; Ruffolo, S.A.; Belfiore, C.M.; Comite, V.; Casoli, A.; Berzioli, M.; Nava, G. A scientific approach to the characterisation of the painting technique of an author: The case of Raffaele Rinaldi. Appl. Phys. A 2014, 114, 733–740. [Google Scholar] [CrossRef]
- Edwards, H.G.M.; Jorge Villar, S.E.; Eremin, K.A. Raman spectroscopic analysis of pigments from dynastic Egyptian funerary artefacts. J. Raman Spectrosc. 2004, 35, 786–795. [Google Scholar] [CrossRef]
- Vizárová, K.; Reháková, M.; Kirschnerová, S.; Peller, A.; Šimon, P.; Mikulášik, R. Stability studies of materials applied in the restoration of a baroque oil painting. J. Cult. Herit. 2011, 12, 190–195. [Google Scholar] [CrossRef]
- Andreotti, A.; Izzo, F.C.; Bonaduce, I. Archaeometric Study of the Mural Paintings by Saturnino Gatti and Workshop in the Church of San Panfilo—Tornimparte (AQ). The Study of Organic Materials. Appl. Sci. 2023. submitted. [Google Scholar]
- Spoto, S.E.; Paladini, G.; Caridi, F.; Crupi, V.; D’Amico, S.; Majolino, D.; Venuti, V. Multi-Technique Diagnostic Analysis of Plasters and Mortars from the Church of the Annunciation (Tortorici, Sicily). Materials 2022, 15, 958. [Google Scholar] [CrossRef]
- Bonizzoni, L.; Caglio, S.; Galli, A.; Lanteri, L.; Pelosi, C. Materials and Technique: The First Look at Saturnino Gatti. Appl. Sci. 2023. submitted. [Google Scholar]
- Bonizzoni, L.; Caglio, S.; Galli, A.; Germinario, C.; Izzo, F.; Magrini, D. Identifying Original and Restoration Materials through Spectroscopic Analyses on Saturnino Gatti Mural Paintings: How Far a Non-Invasive Approach can Go. Appl. Sci. 2023. submitted. [Google Scholar]
- Armetta, F.; Giuffrida, D.; Ponterio, R.C.; Falcon Martinez, M.F.; Briani, F.; Pecchioni, E.; Santo, A.P.; Ciaramitaro, V.C.; Saladino, M.L. Looking for the Original Materials and Evidence of Restoration at the Vault of the San Panfilo Church in Tornimparte (AQ). Appl. Sci. 2023. submitted. [Google Scholar]
- Ricci, S. Tornimparte, a Mimesis of Florence in Abruzzo. New Insights into Saturnino Gatti’s Art. Appl. Sci. 2023. submitted. [Google Scholar]
- Germinario, L.; Giannossa, L.C.; Lezzerini, M.; Mangone, A.; Mazzoli, C.; Pagnotta, S.; Spampinato, M.; Zoleo, A.; Eramo, G. Petrographic and Chemical Characterization of the Frescoes by Saturnino Gatti (Central Italy, 15th Century): Microstratigraphic Analyses on Thin Sections. Appl. Sci. 2023. submitted. [Google Scholar]
- Comite, V.; Bergomi, A.; Lombardi, C.A.; Fermo, P. Characterization of Soluble Salts on the Frescoes by Saturnino Gatti in the Church of San Panfilo in Villagrande di Tornimparte (L’Aquila). Appl. Sci. 2023. submitted. [Google Scholar]
- Galli, A.; Alberghina, M.F.; Re, A.; Magrini, D.; Grifa, C.; Ponterio, R.C.; La Russa, M.F. Special Issue: Results of the II National Research Project of AIAr: Archaeometric Study of the Frescoes by Saturnino Gatti and Workshop at the Church of San Panfilo in Tornimparte (AQ, Italy). Appl. Sci. 2023. submitted. [Google Scholar]
- Pouchou, J.-L.; Pichoir, F. Quantitative Analysis of Homogeneous or Stratified Microvolumes Applying the Model “PAP.” In Electron Probe Quantitation; Springer US: Boston, MA, USA, 1991; pp. 31–75. [Google Scholar]
- Buzgar, N.; Apopei, A.I.; Buzatu, A. Romanian Database of Raman Spectroscopy. Available online: http://rdrs.uaic.ro (accessed on 9 March 2023).
- Lafuente, B.; Downs, R.T.; Yang, H.; Stone, N. The power of databases: The RRUFF project. In Highlights in Mineralogical Crystallography; Armbruster, T., Danisi, R.M., Eds.; W. De Gruyter: Berlin, Germany, 2015; pp. 1–30. ISBN 9783110417104. [Google Scholar]
- Caggiani, M.C.; Cosentino, A.; Mangone, A. Pigments Checker version 3.0, a handy set for conservation scientists: A free online Raman spectra database. Microchem. J. 2016, 129, 123–132. [Google Scholar] [CrossRef]
- Pigments Checker—Modern & Contemporary Art. Available online: http://chsopensource.org/tools-2/pigments-checker/ (accessed on 9 March 2023).
- De Benedetto, G.E.; Laviano, R.; Sabbatini, L.; Zambonin, P.G. Infrared spectroscopy in the mineralogical characterization of ancient pottery. J. Cult. Herit. 2002, 3, 177–186. [Google Scholar] [CrossRef]
- Sadtler Database for FT-IR. Available online: http://www.ir-spectra.com/sadtler/sadtler.htm (accessed on 7 March 2023).
- Giuntini, L.; Castelli, L.; Massi, M.; Fedi, M.; Czelusniak, C.; Gelli, N.; Liccioli, L.; Giambi, F.; Ruberto, C.; Mazzinghi, A.; et al. Detectors and Cultural Heritage: The INFN-CHNet Experience. Appl. Sci. 2021, 11, 3462. [Google Scholar] [CrossRef]
- Wegener, M.R.; Mathew, K.J.; Hasozbek, A. The direct total evaporation (DTE) method for TIMS analysis. J. Radioanal. Nucl. Chem. 2013, 296, 441–445. [Google Scholar] [CrossRef]
- Chukanov, N.V.; Vigasina, M.F.; Zubkova, N.V.; Pekov, I.V.; Schäfer, C.; Kasatkin, A.V.; Yapaskurt, V.O.; Pushcharovsky, D.Y. Extra-Framework Content in Sodalite-Group Minerals: Complexity and New Aspects of Its Study Using Infrared and Raman Spectroscopy. Minerals 2020, 10, 363. [Google Scholar] [CrossRef]
- Caggiani, M.C.; Acquafredda, P.; Colomban, P.; Mangone, A. The source of blue colour of archaeological glass and glazes: The Raman spectroscopy/SEM-EDS answers. J. Raman Spectrosc. 2014, 45, 1251–1259. [Google Scholar] [CrossRef]
- Crupi, V.; Fazio, B.; Fiocco, G.; Galli, G.; La Russa, M.F.; Licchelli, M.; Majolino, D.; Malagodi, M.; Ricca, M.; Ruffolo, S.A.; et al. Multi-analytical study of Roman frescoes from Villa dei Quintili (Rome, Italy). J. Archaeol. Sci. Rep. 2018, 21, 422–432. [Google Scholar] [CrossRef]


| Sample | Size (cm) | Sampling Area | Description | Methods of Analysis |
|---|---|---|---|---|
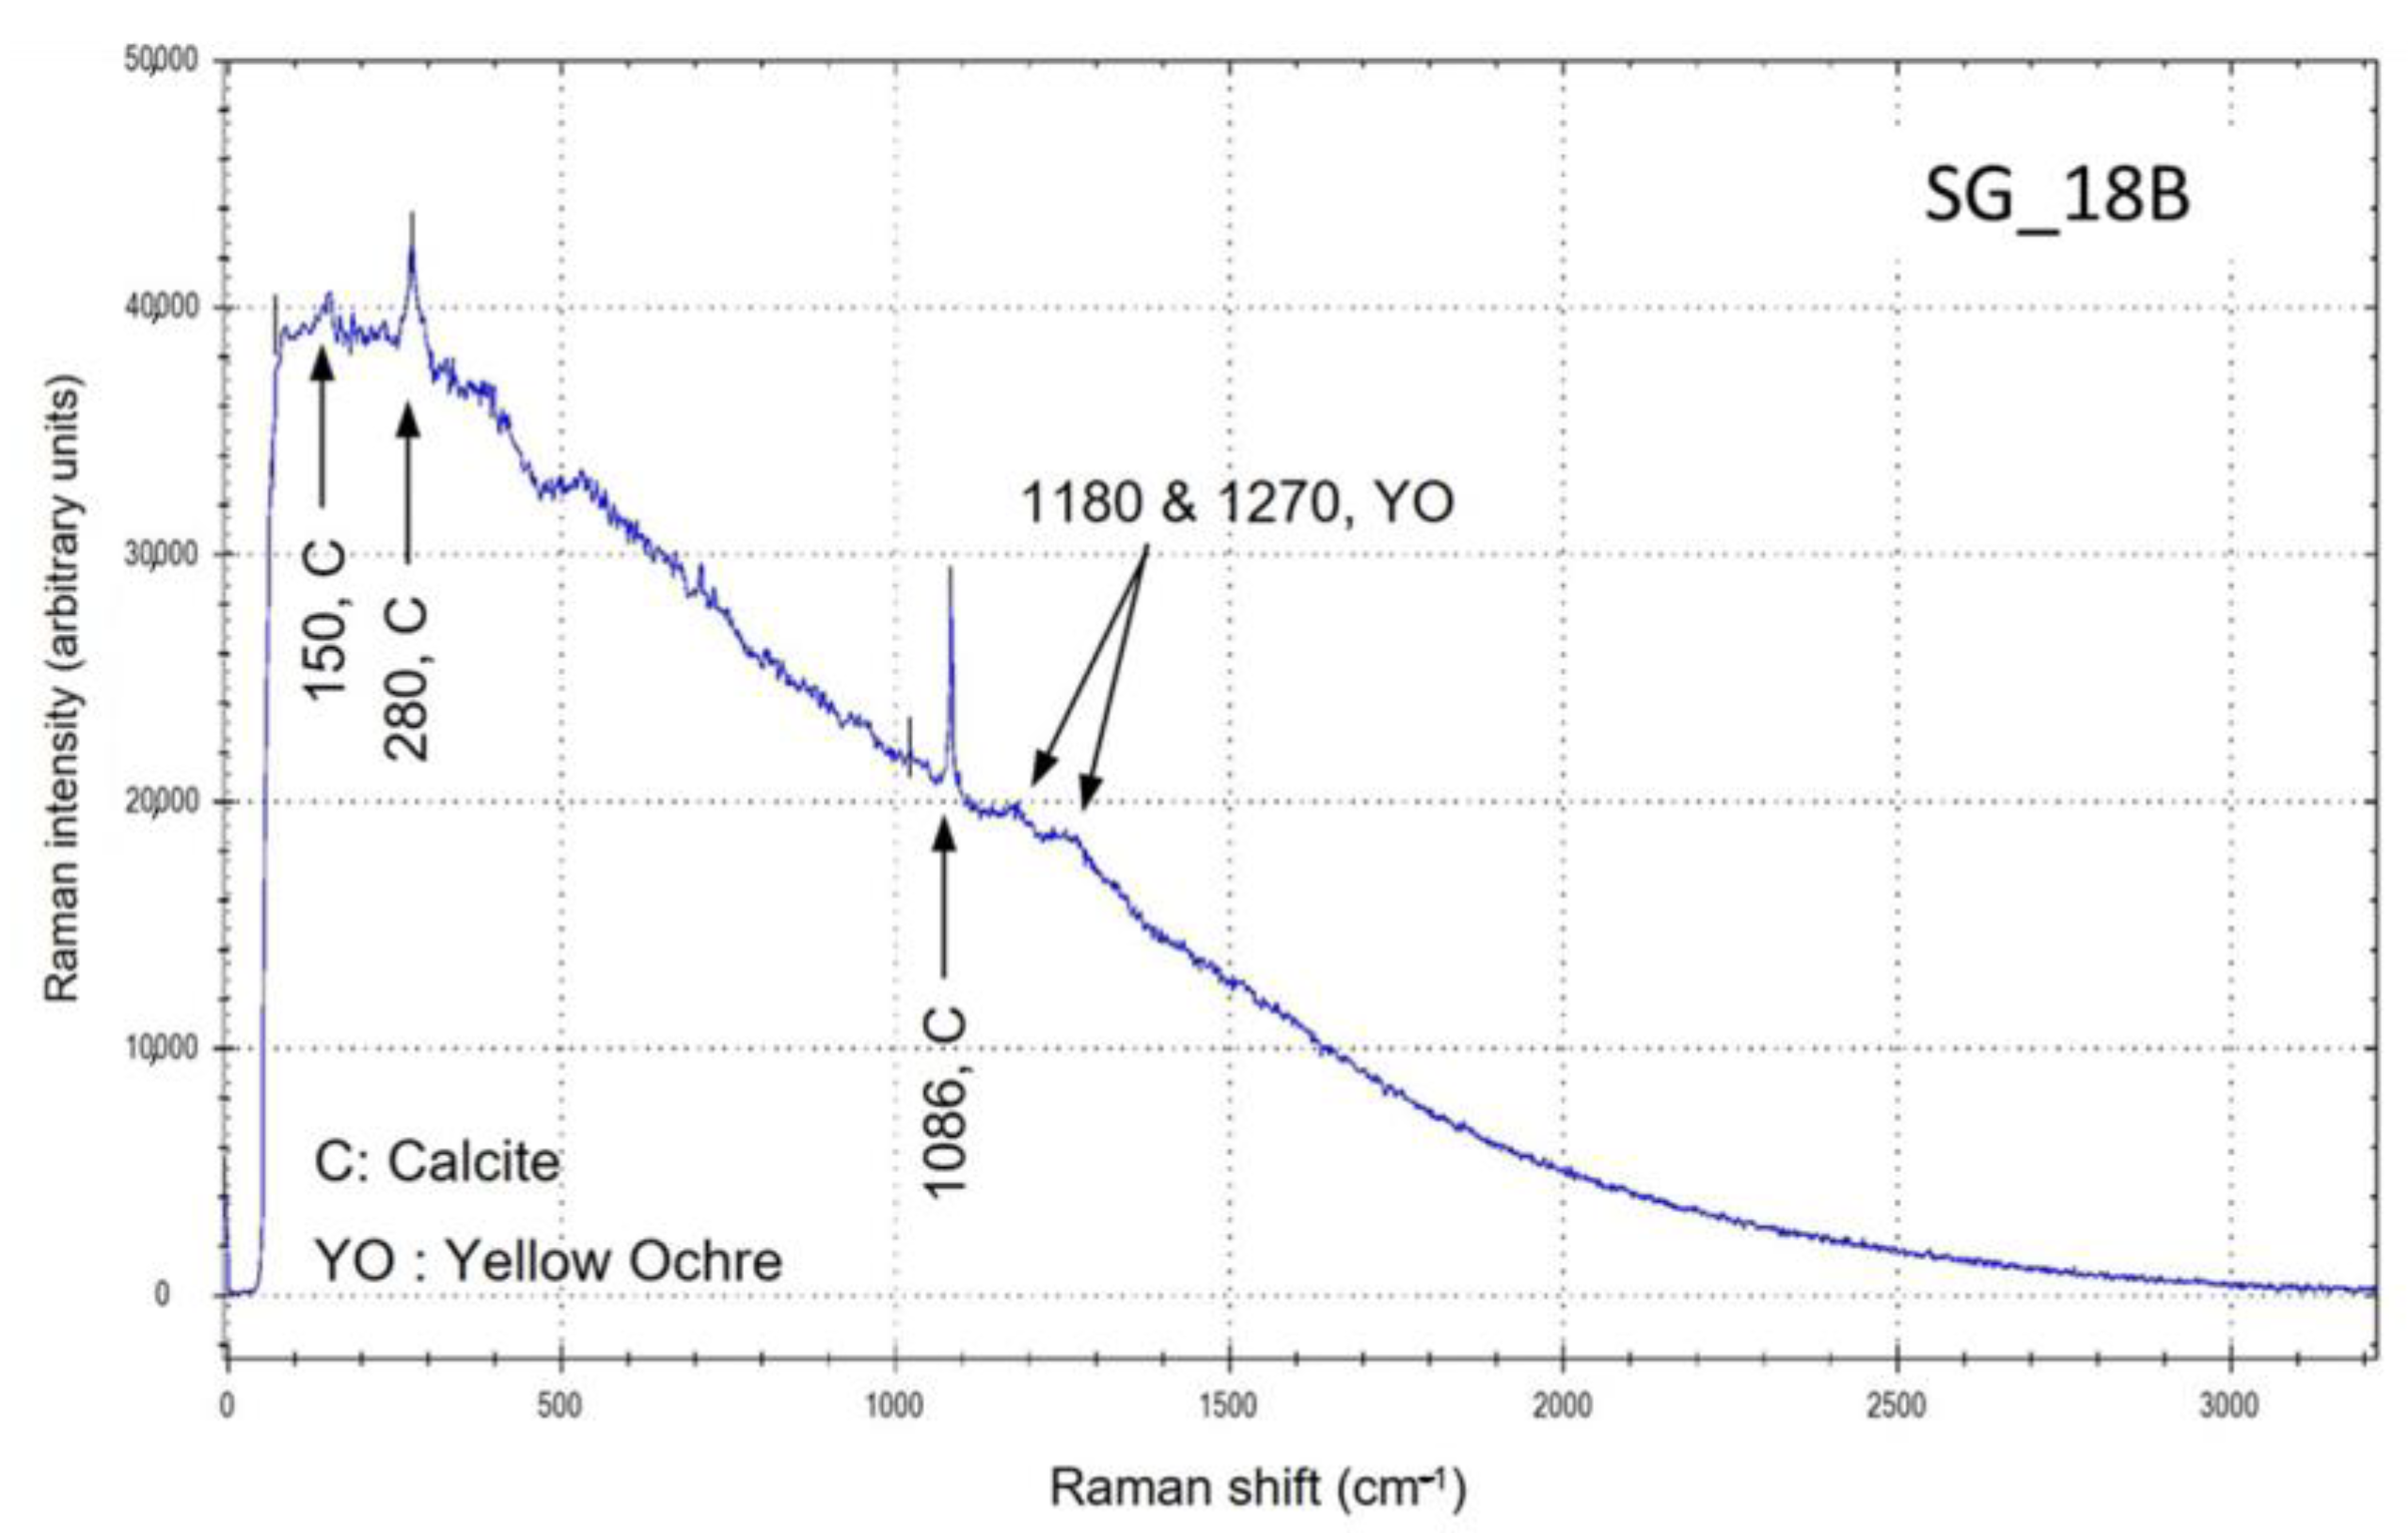
| SG_18B | 0.5 | Panel A | Yellow-orange pictorial layer, whitish preparation/priming sample taken along an existing gap | Raman |
| SG_19 | 0.5 | Panel A | Detail of a leaf—Original area (green pictorial layer on a brown-red layer taken up to white plaster support) | OM, SEM-EDS, XRD |
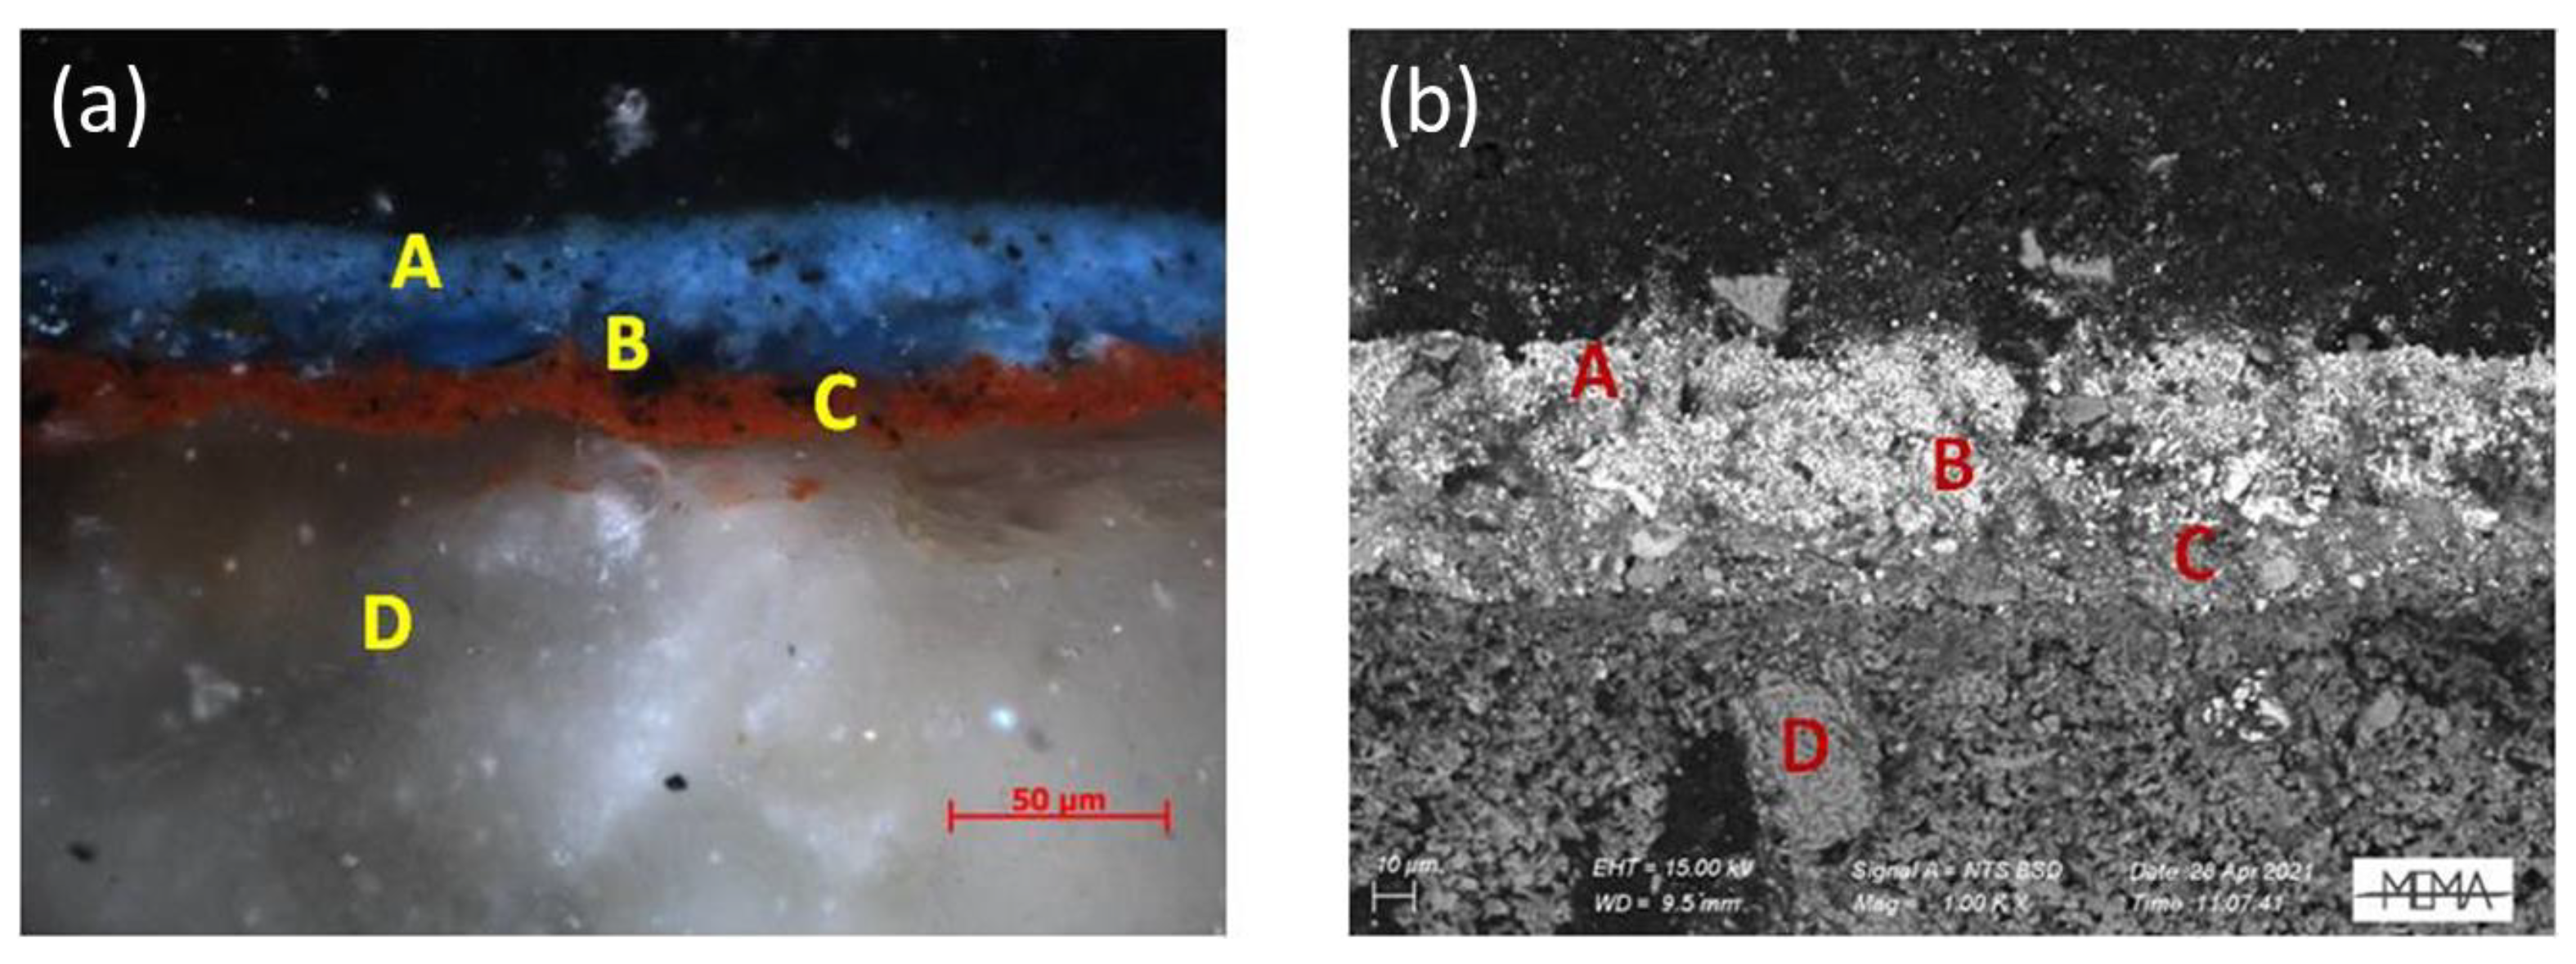
| SG_20 | 0.5 | Panel A | Original area (blue pictorial layer on a brown-red layer + fragments of plaster below) | OM, SEM-EDS, XRD |
| SG_21A | 0.6 | Panel A | Blue pattern above the window—Original area (blue pictorial layer on a brown-red layer + fragments of plaster below) | OM, SEM-EDS, XRD |
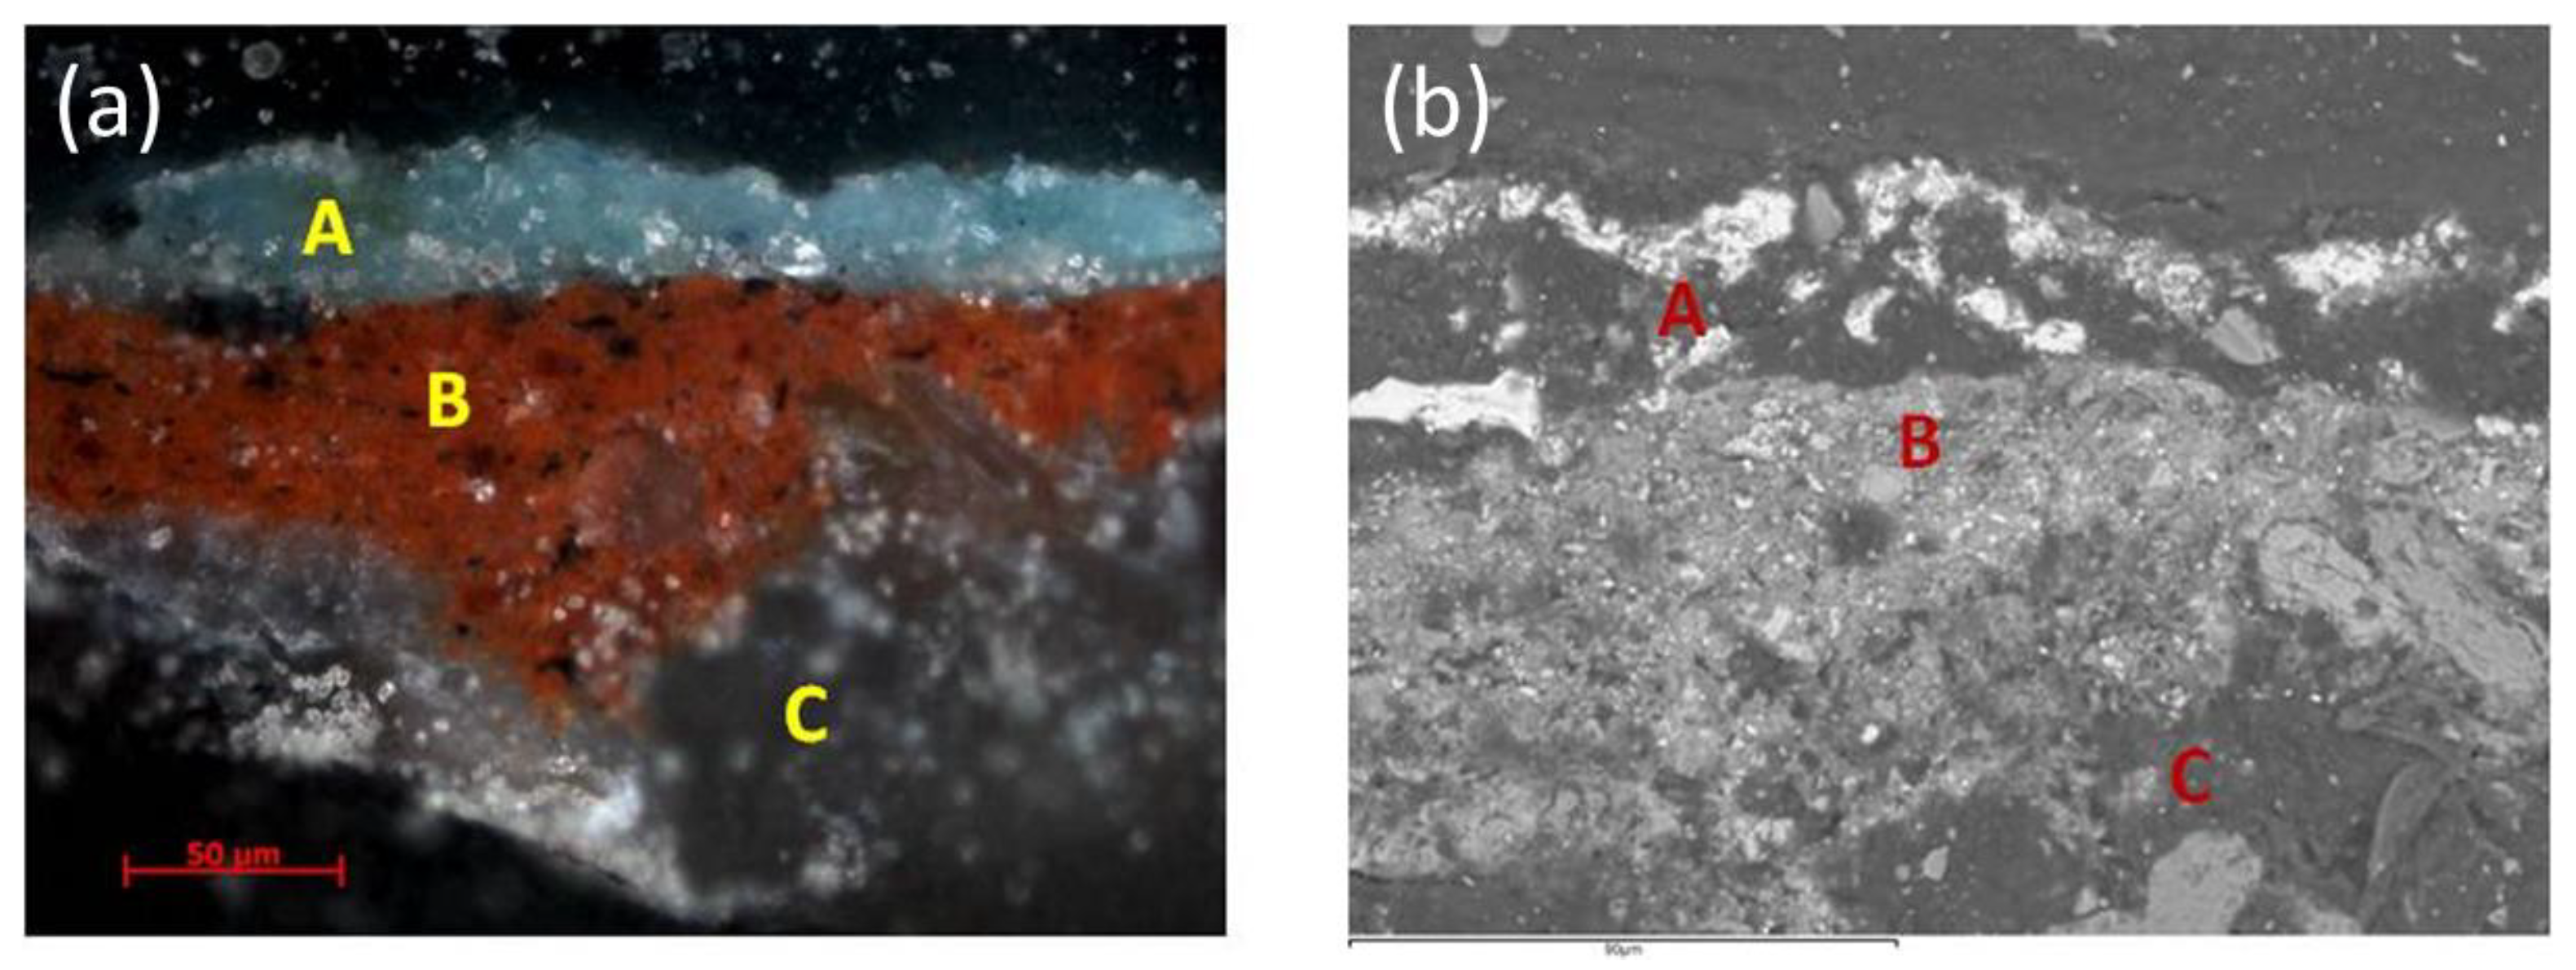
| SG_22 | 0.6 | Panel A | Sky, green pattern—Original area (green pictorial layer, due to degradation of an originally light-blue layer, on a red-brown layer (fragments of underlying plaster) | OM, SEM-EDS, XRD |
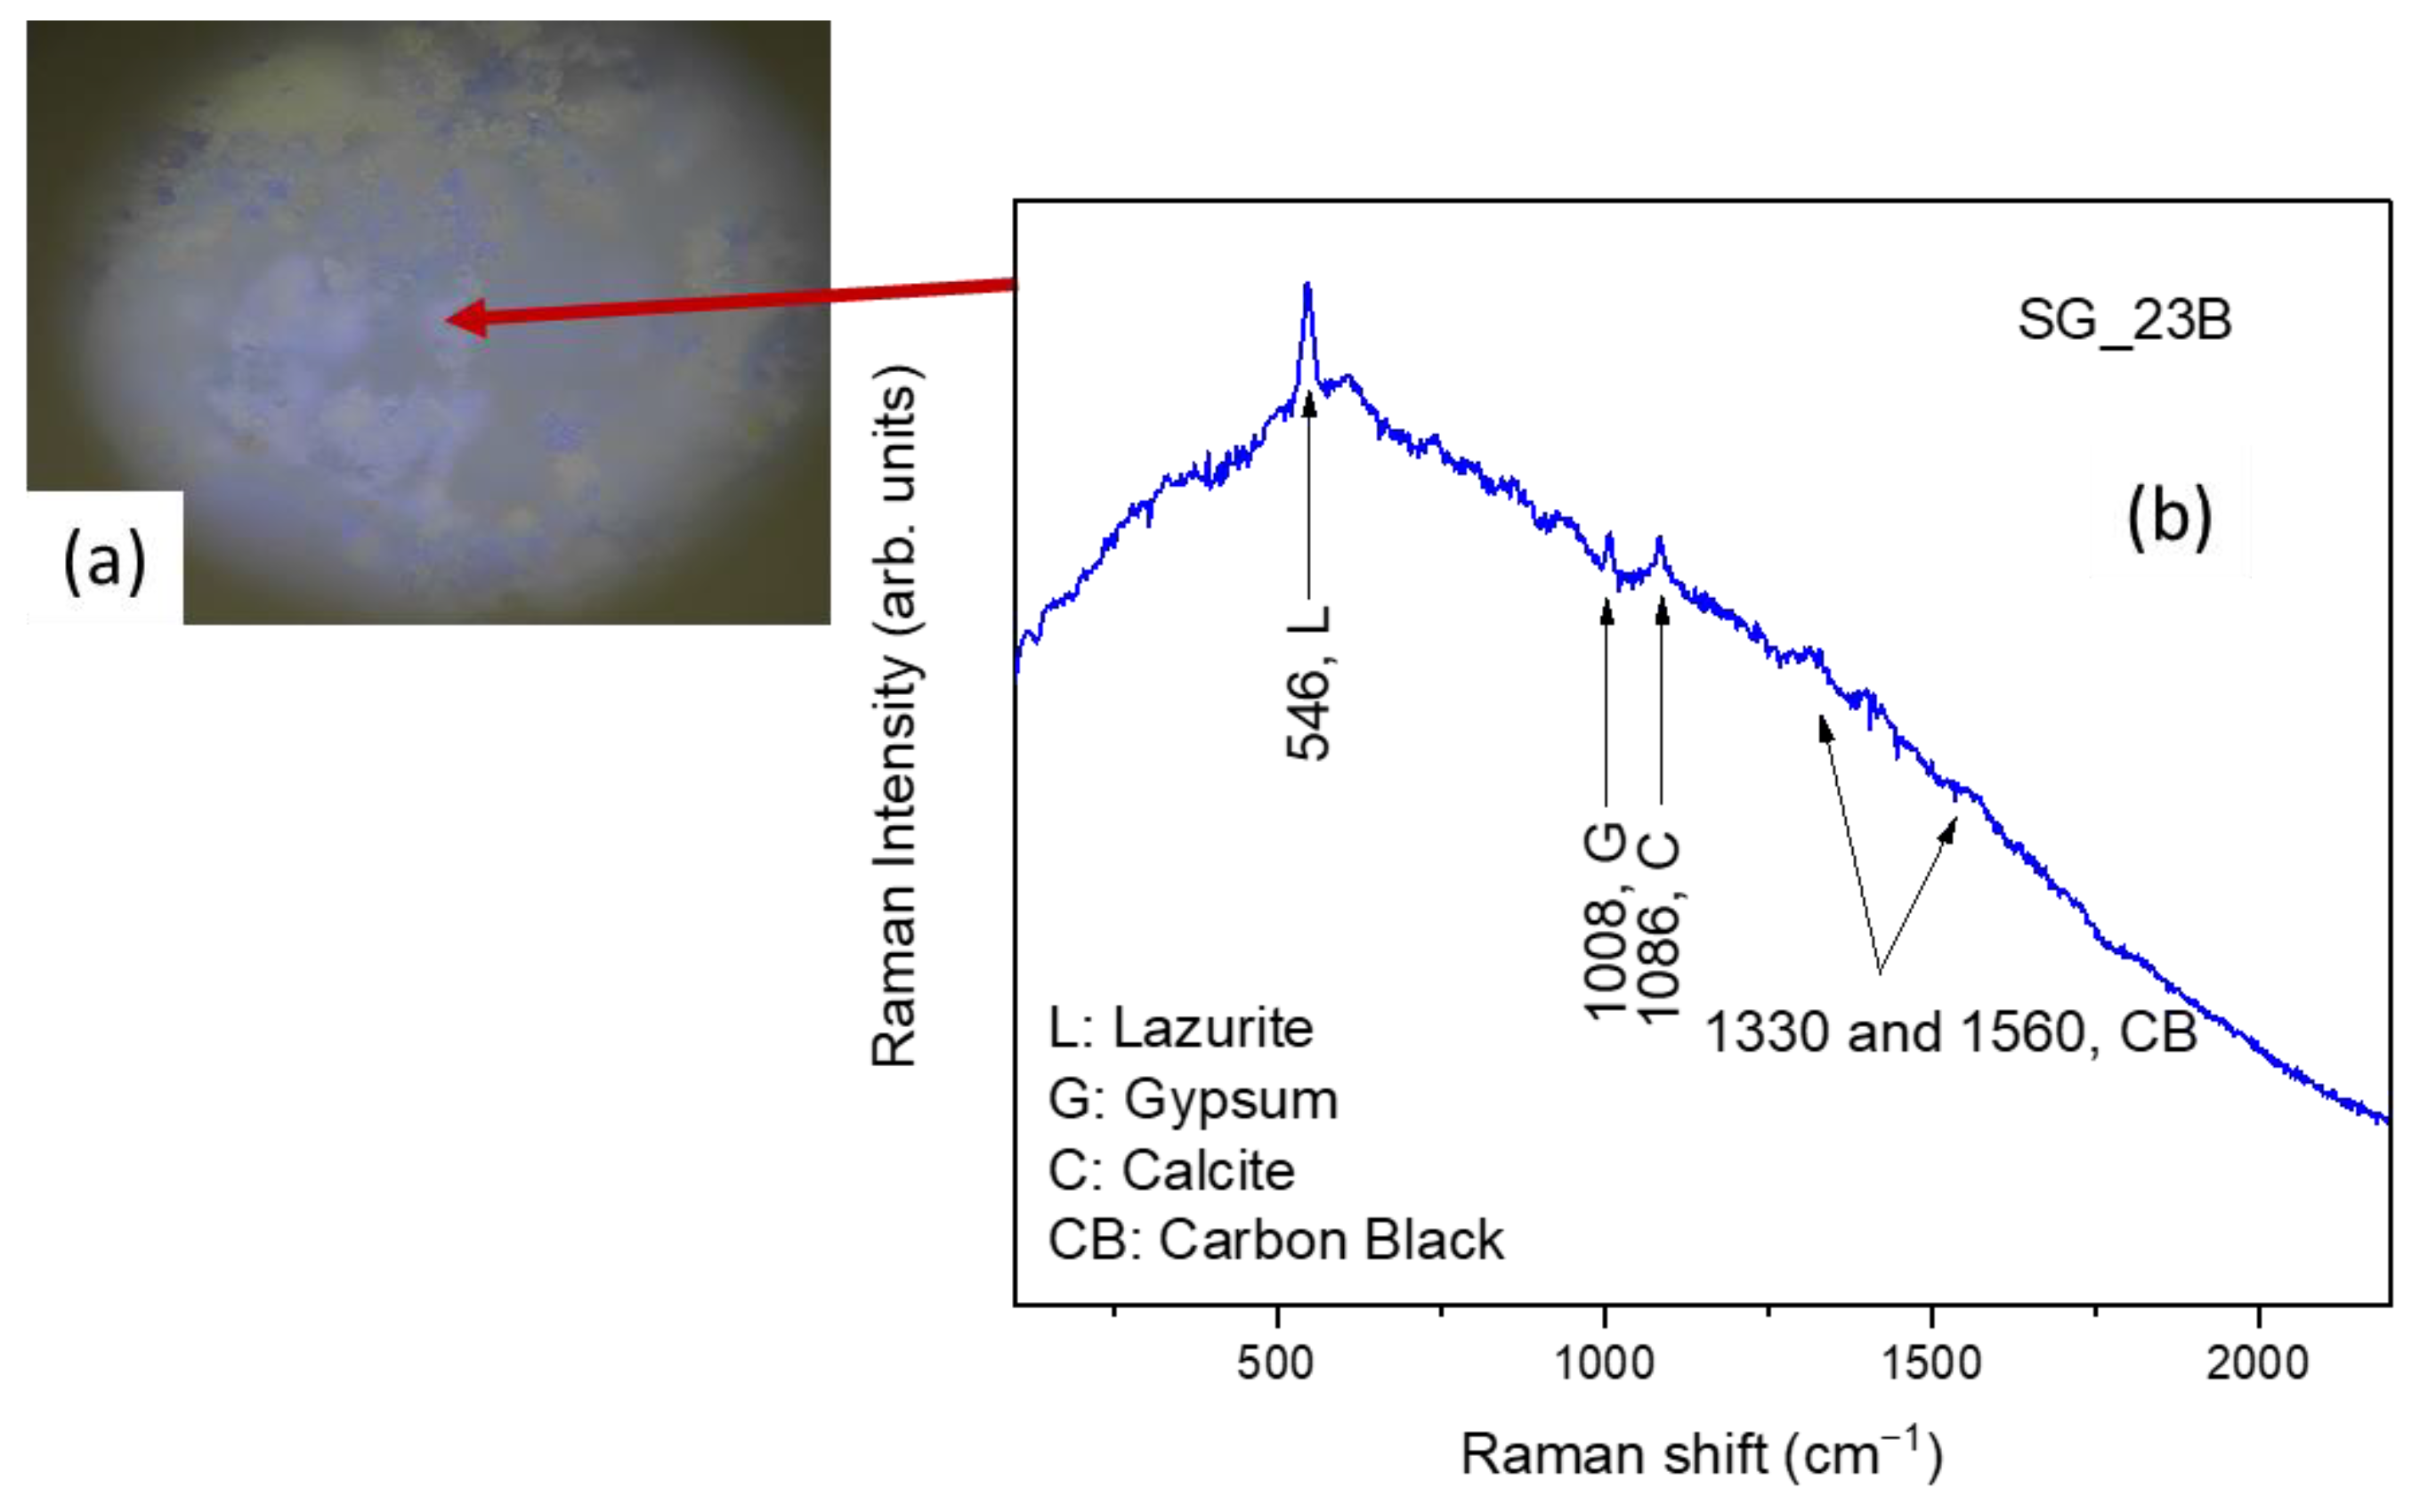
| SG_23B | 0.6 | Panel A | Sky—Area with drops and probable alterations (light-blue pictorial layer) | µ-Raman, FT-IR |
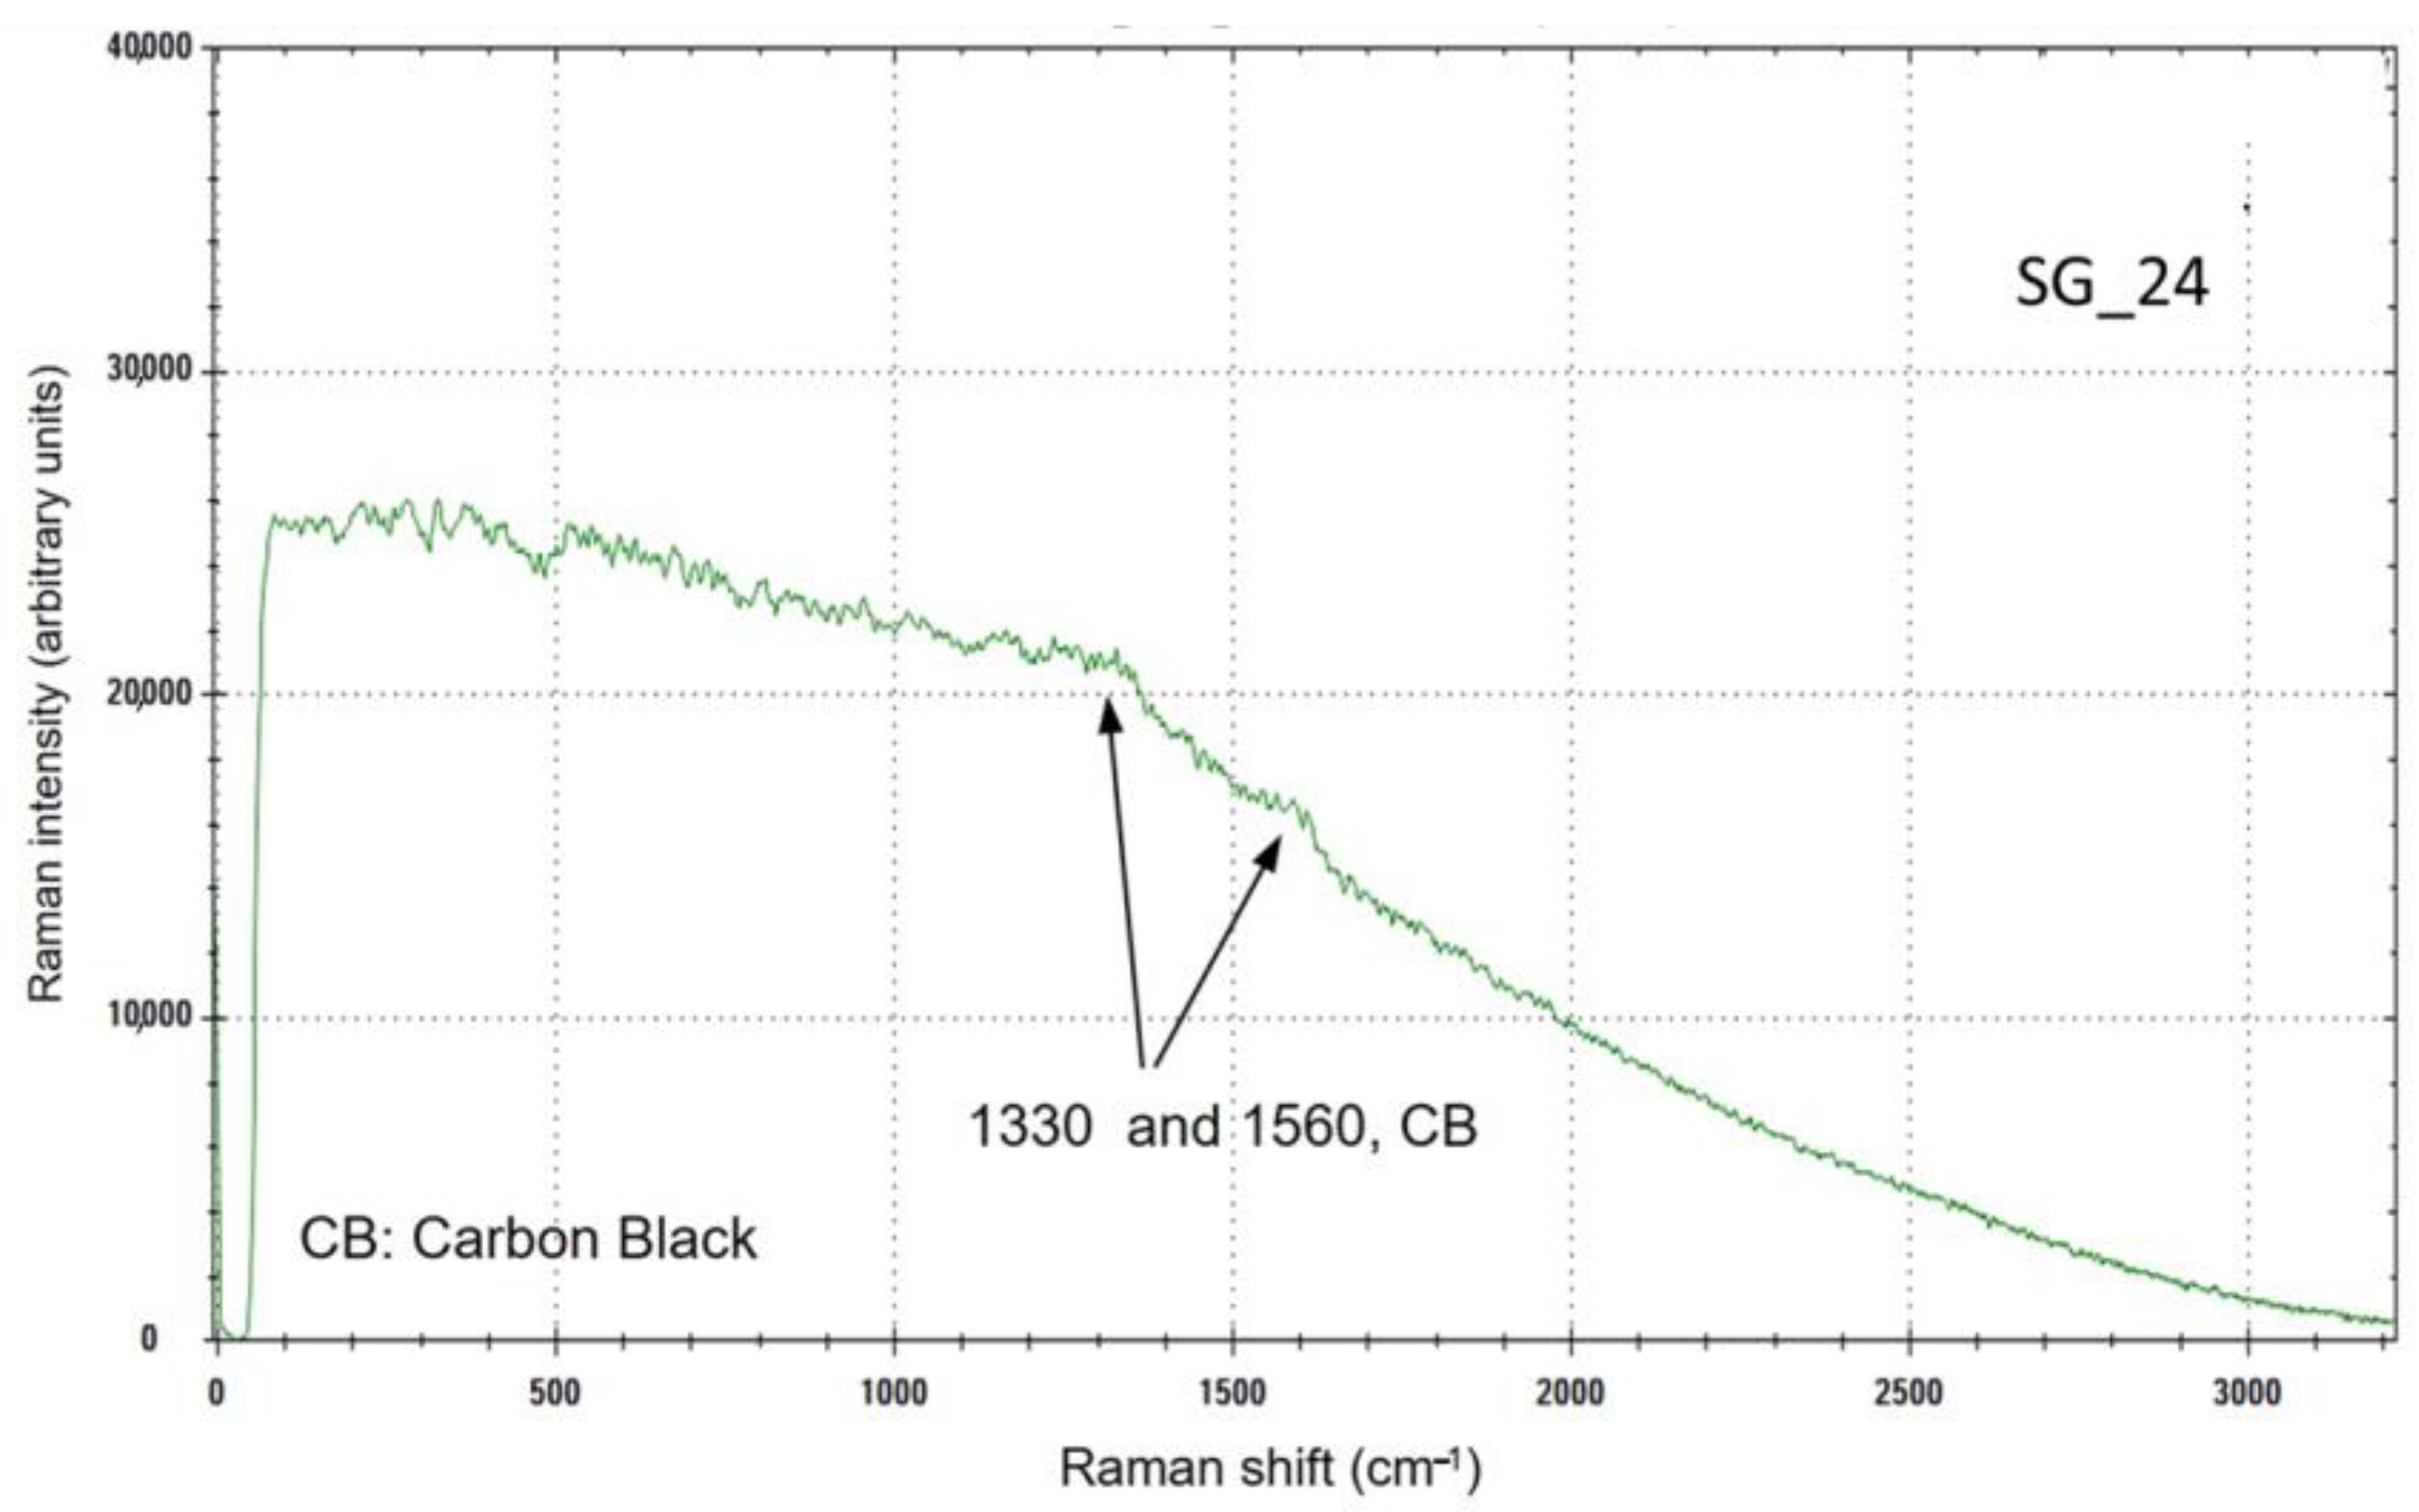
| SG_24 | 0.5 | Panel A | Landscape, area contiguous to the window—Brown-green pictorial layer + white preparation/priming taken along a gap | Raman |
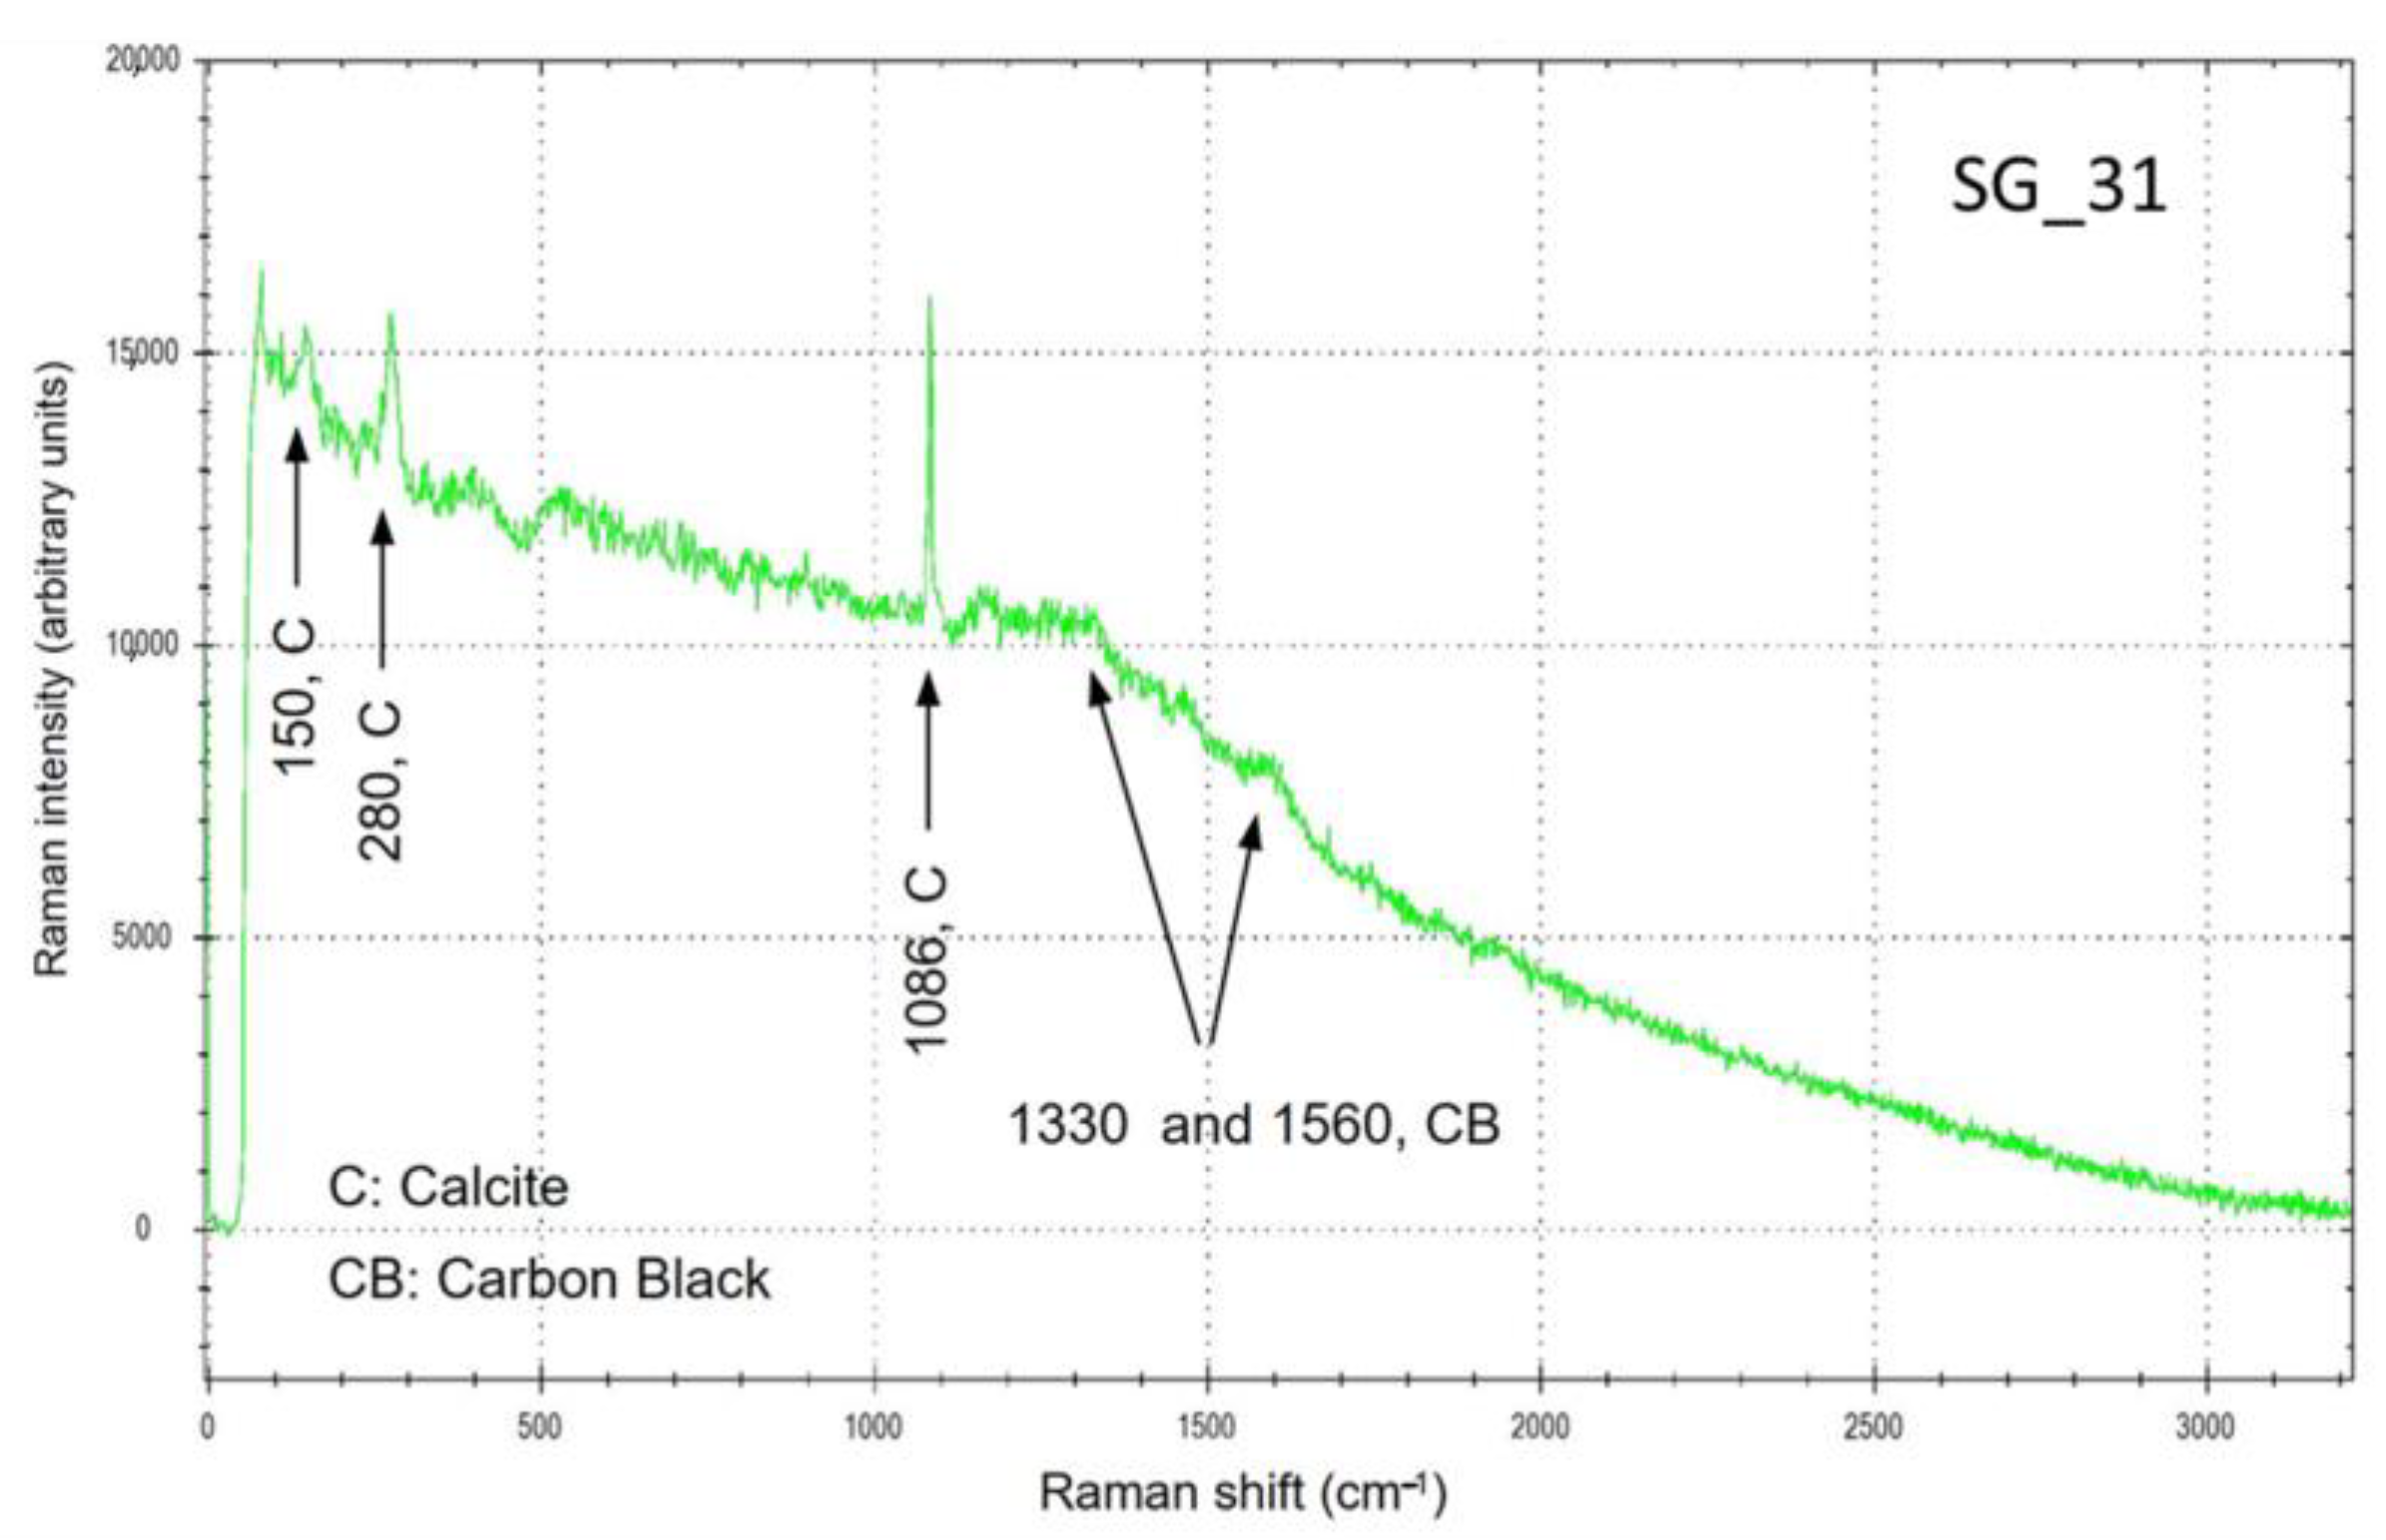
| SG_31 | 0.5 | Panel A | Blue pictorial layer + white preparation/priming and sampling carried out in correspondence with a gap | Raman |
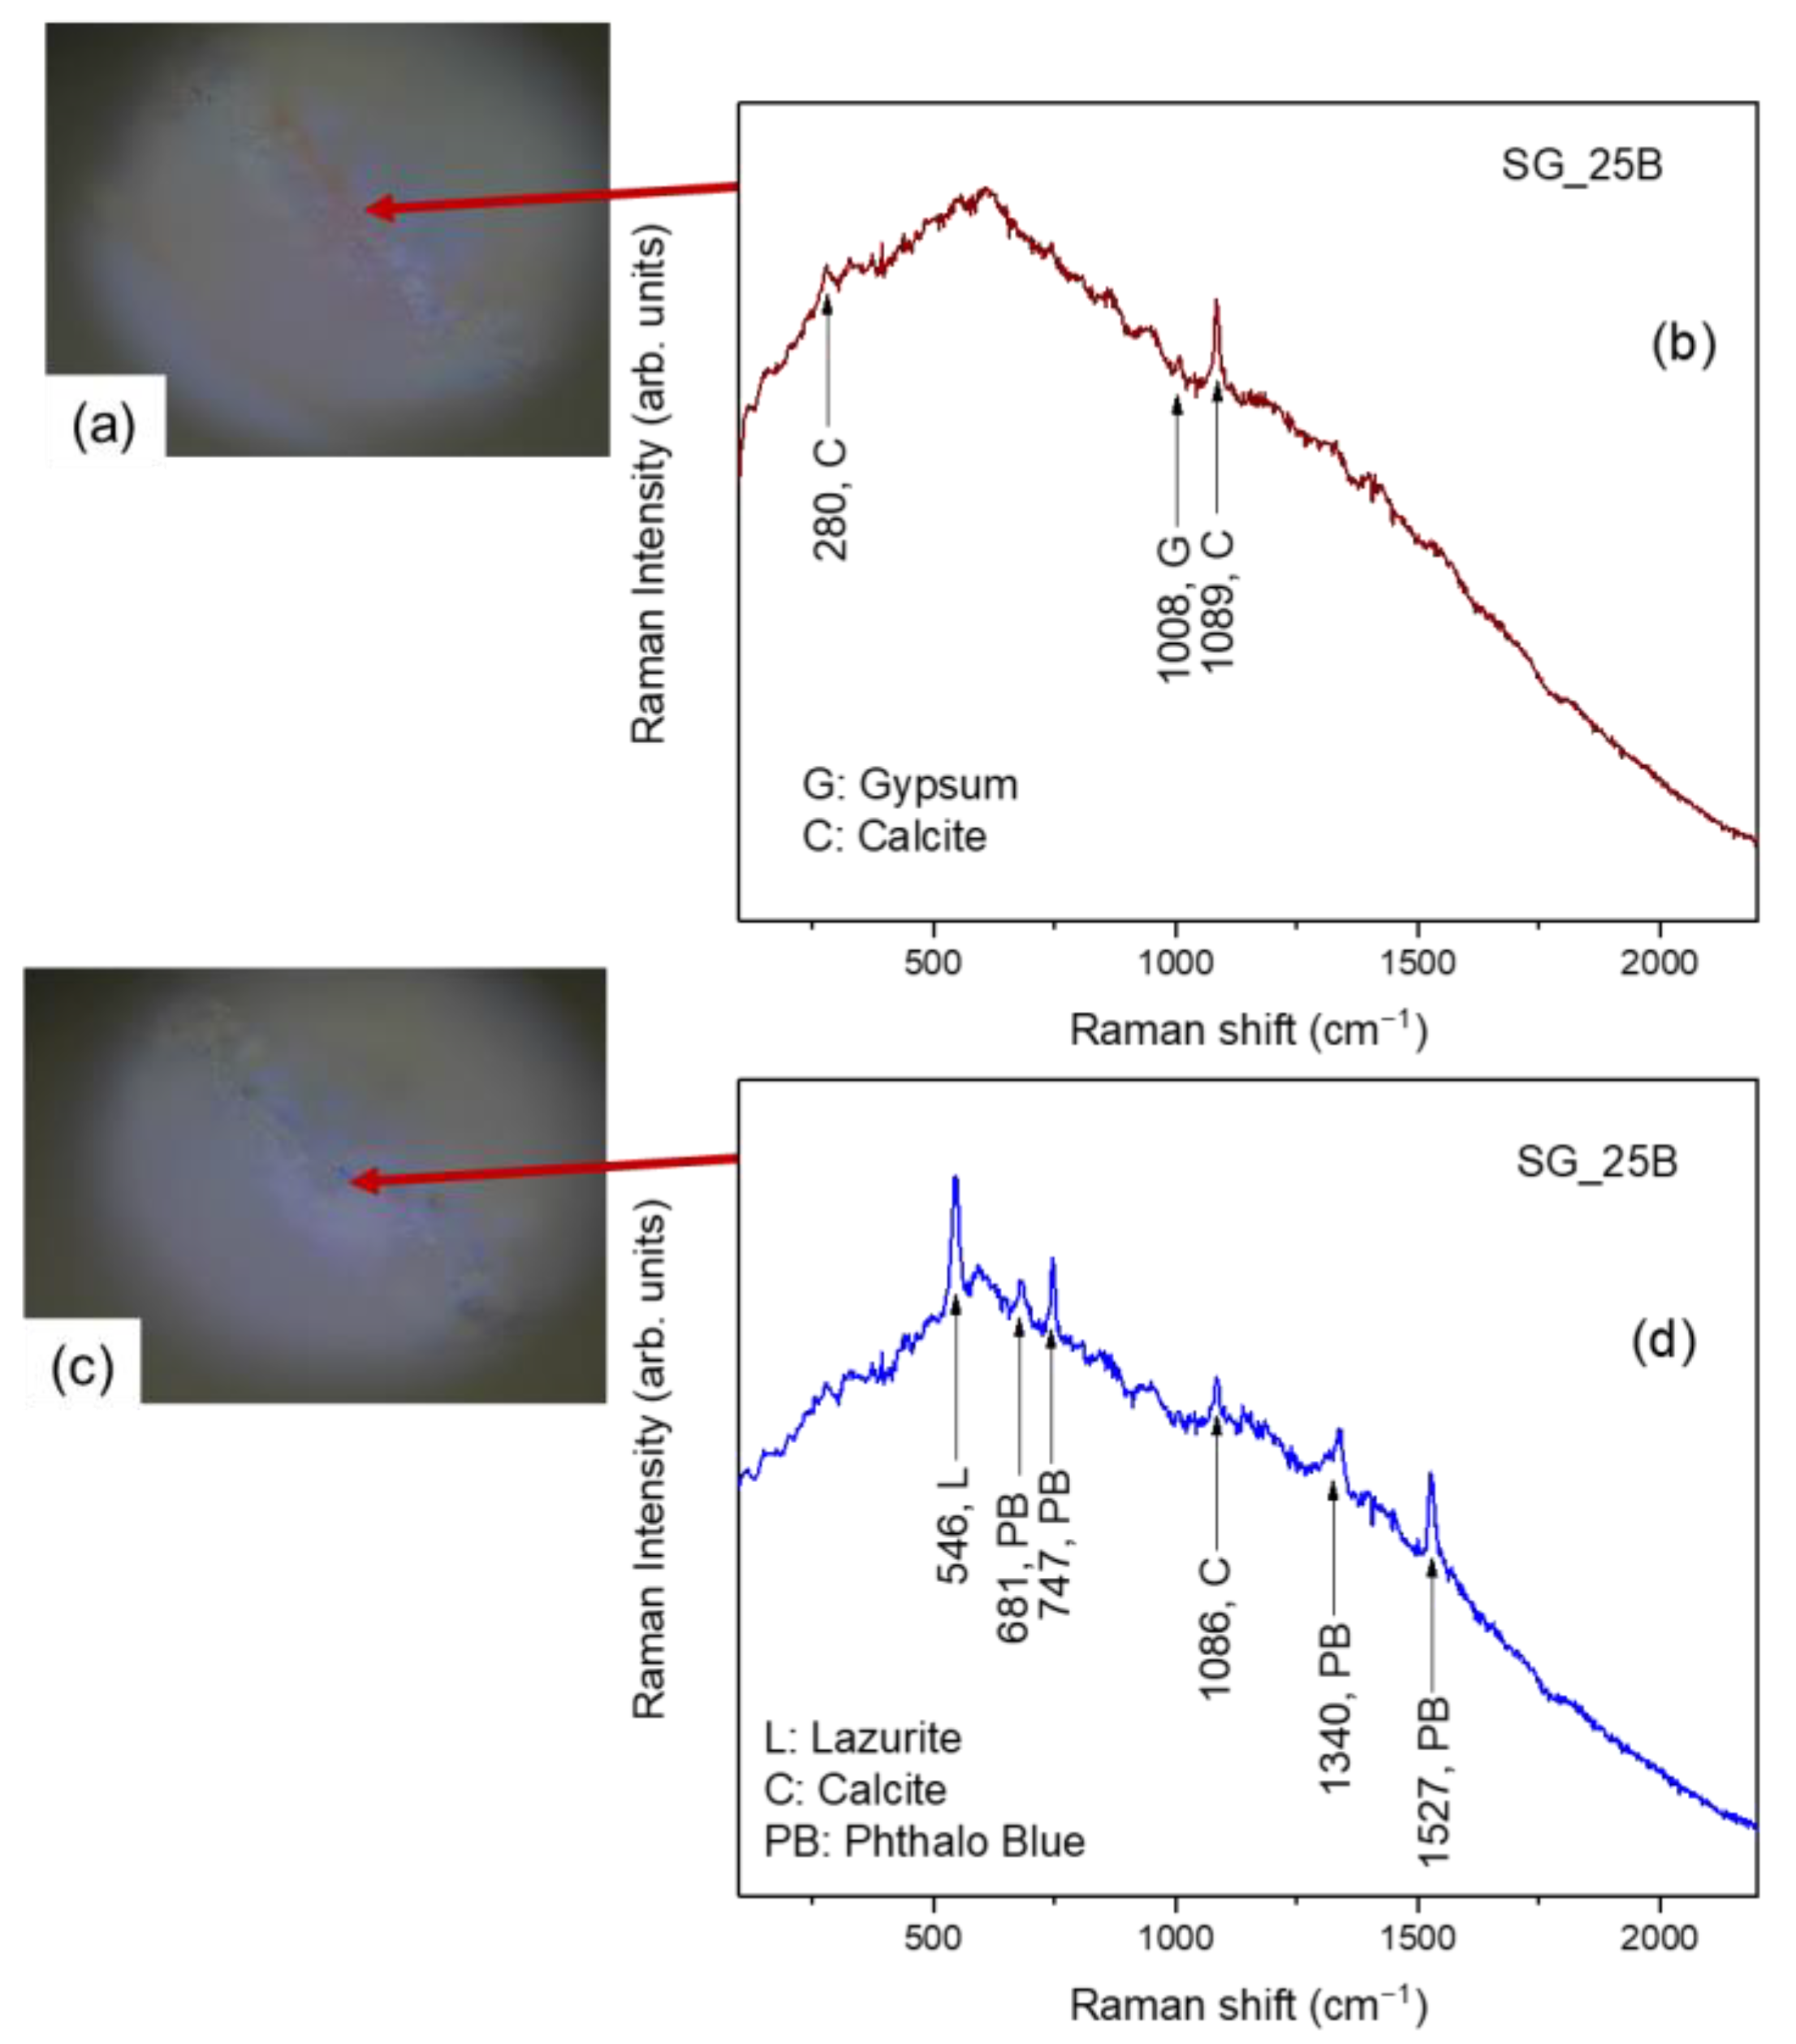
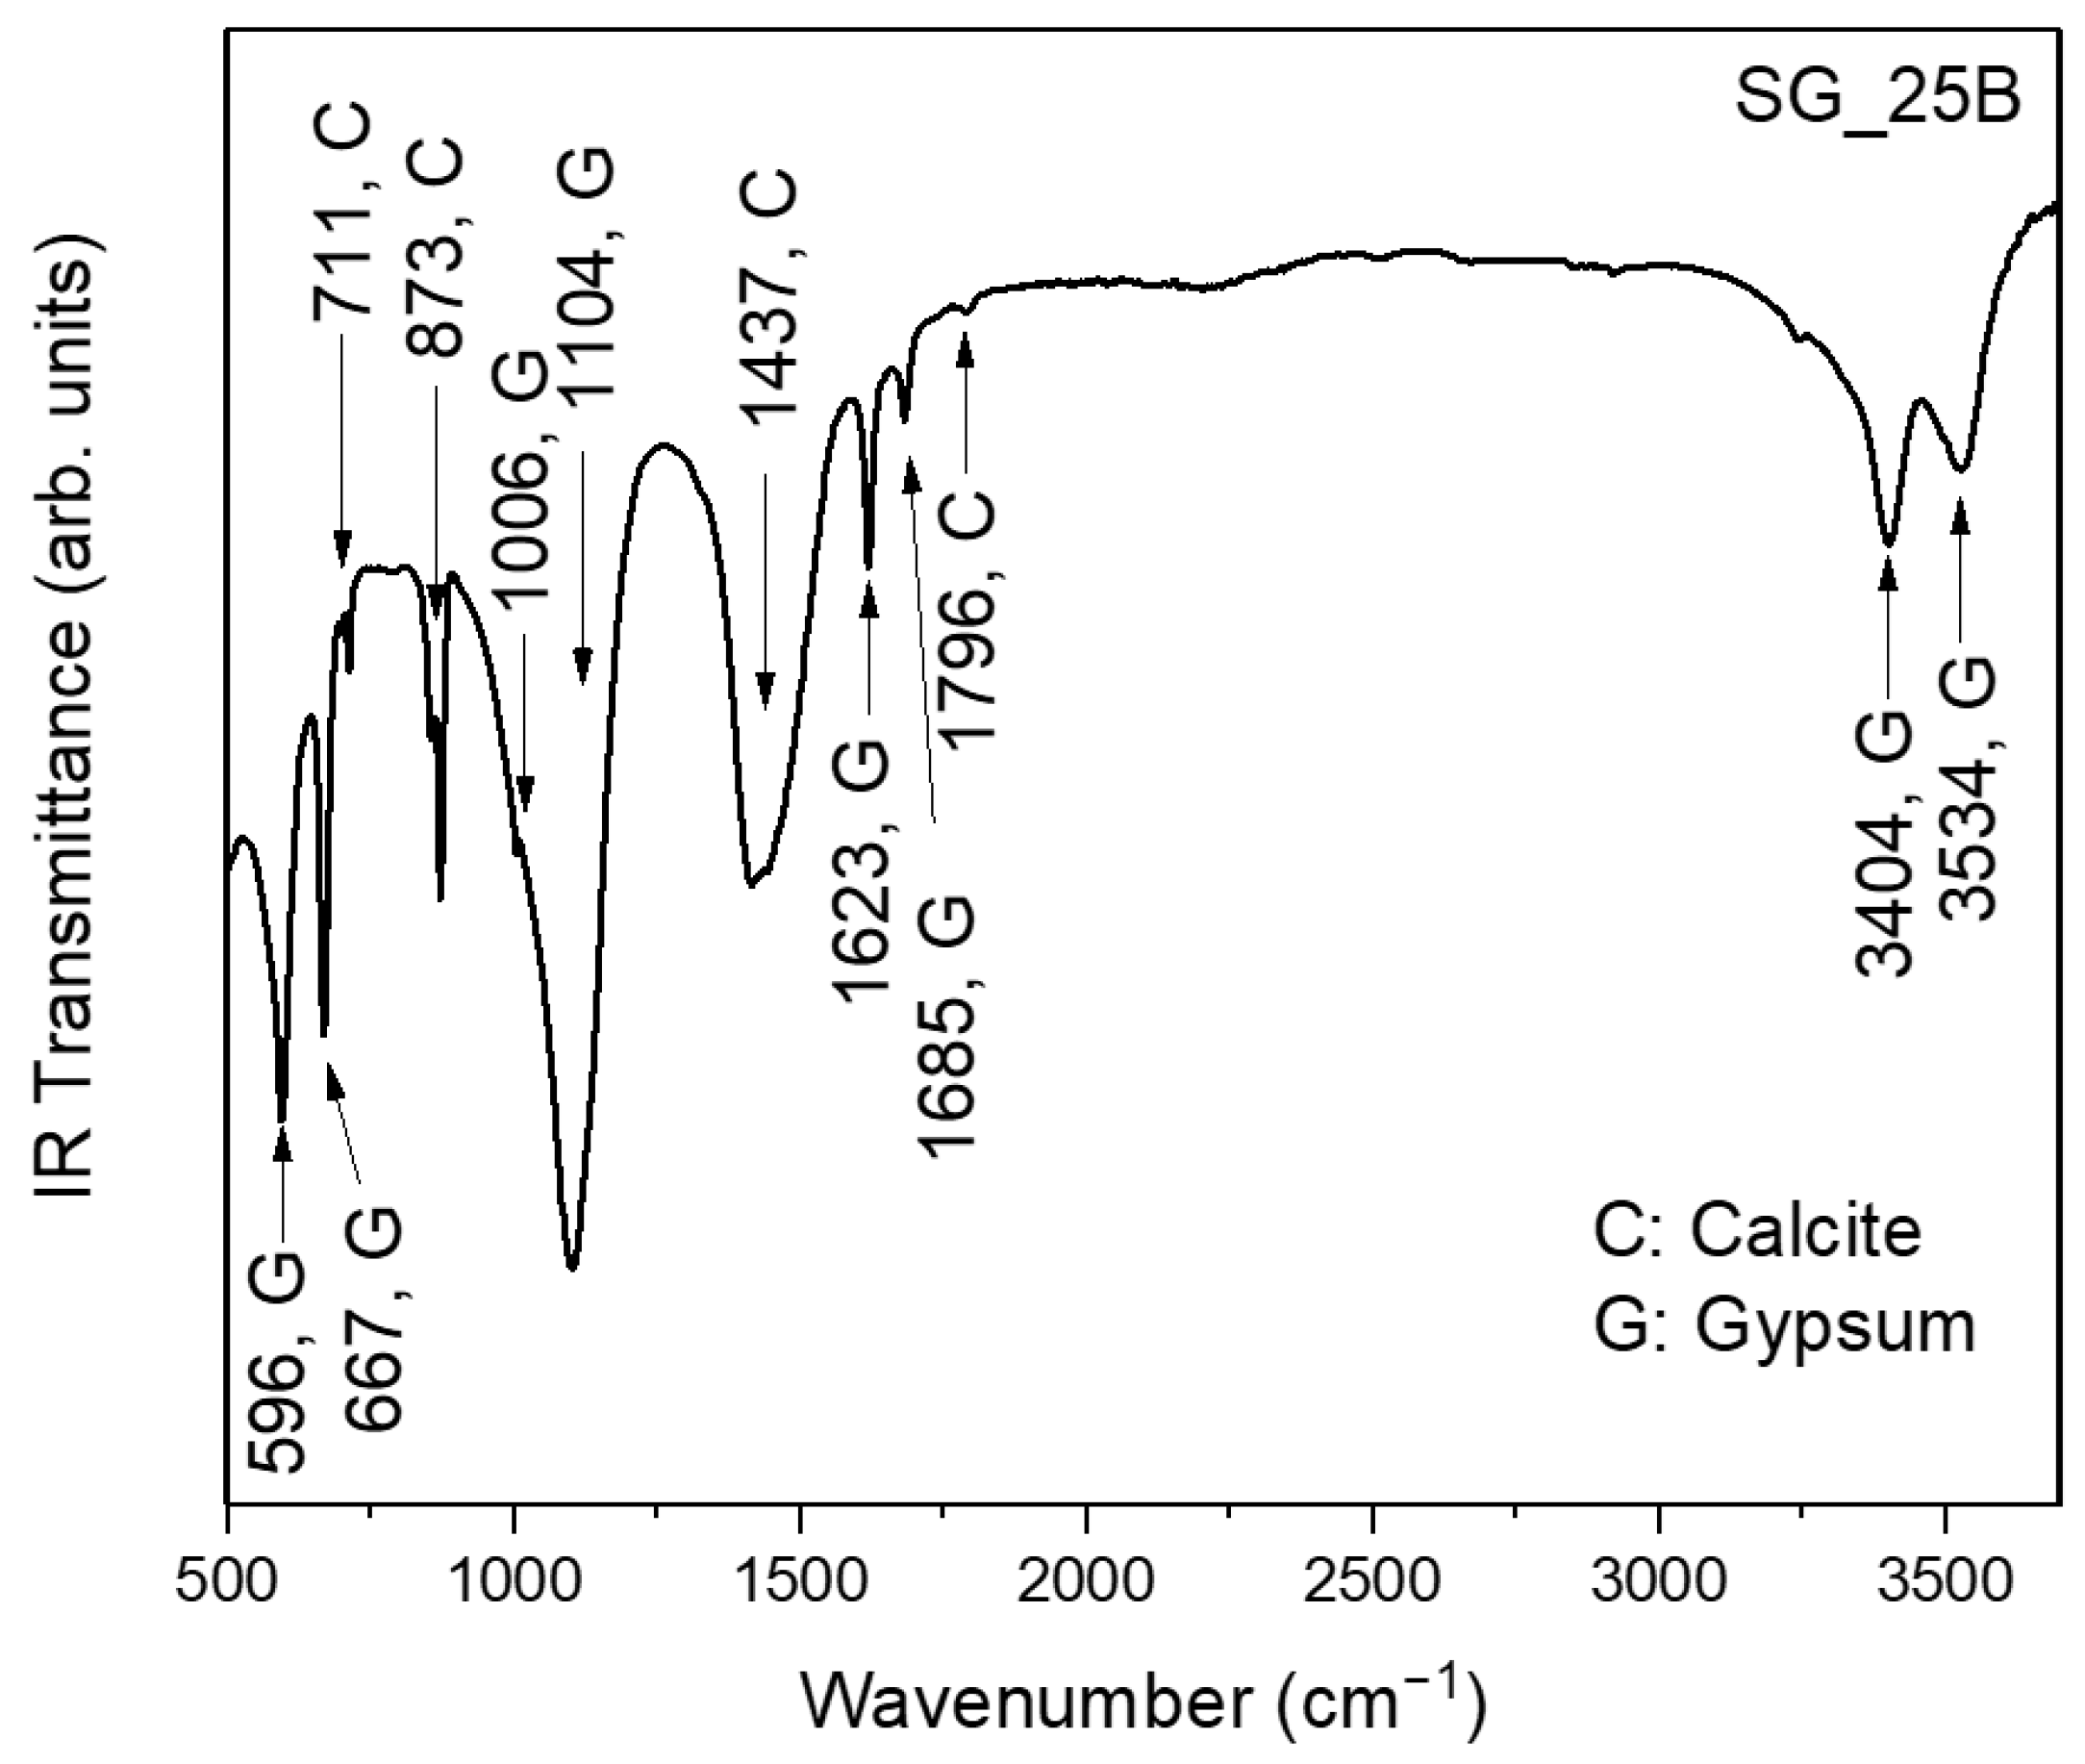
| SG_25B | 0.6 | Panel D | Sky, upper portion—Blue pictorial layer on a brown-red layer + fragments of plaster below | µ-Raman, FT-IR |
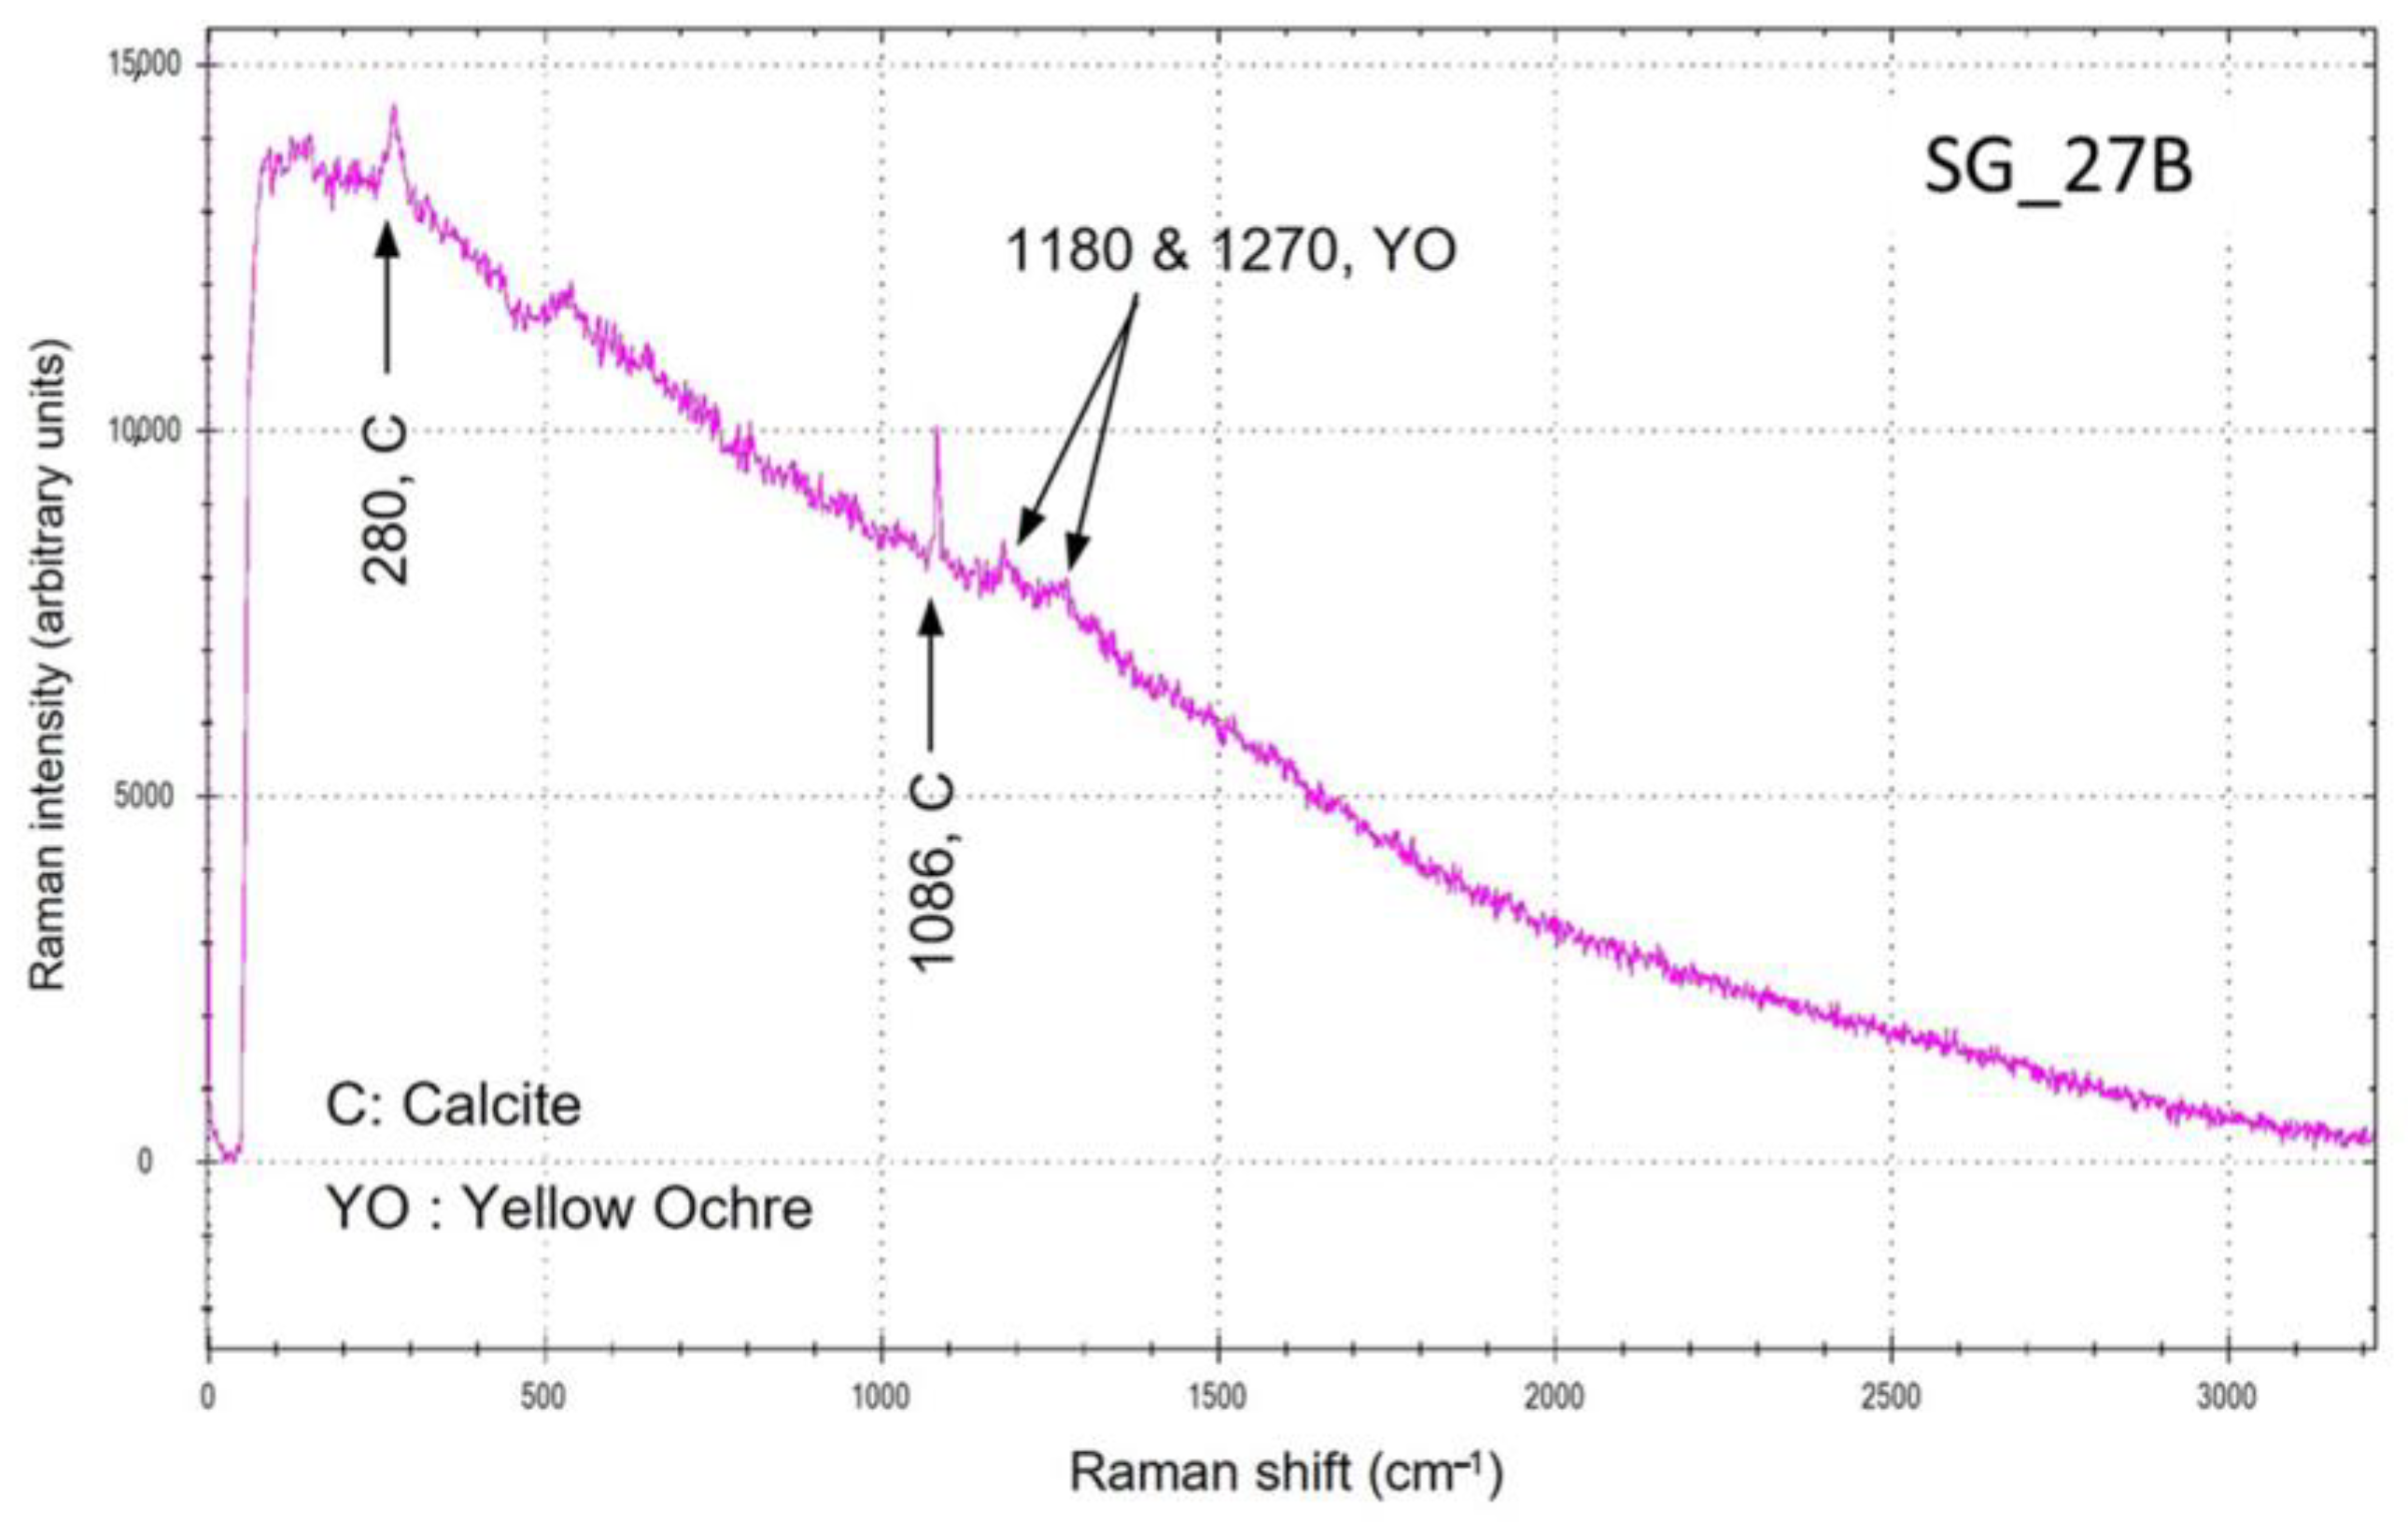
| SG_27B | 0.5 | Panel D | Light-blue/yellow pictorial layer + white preparation/priming | Raman |
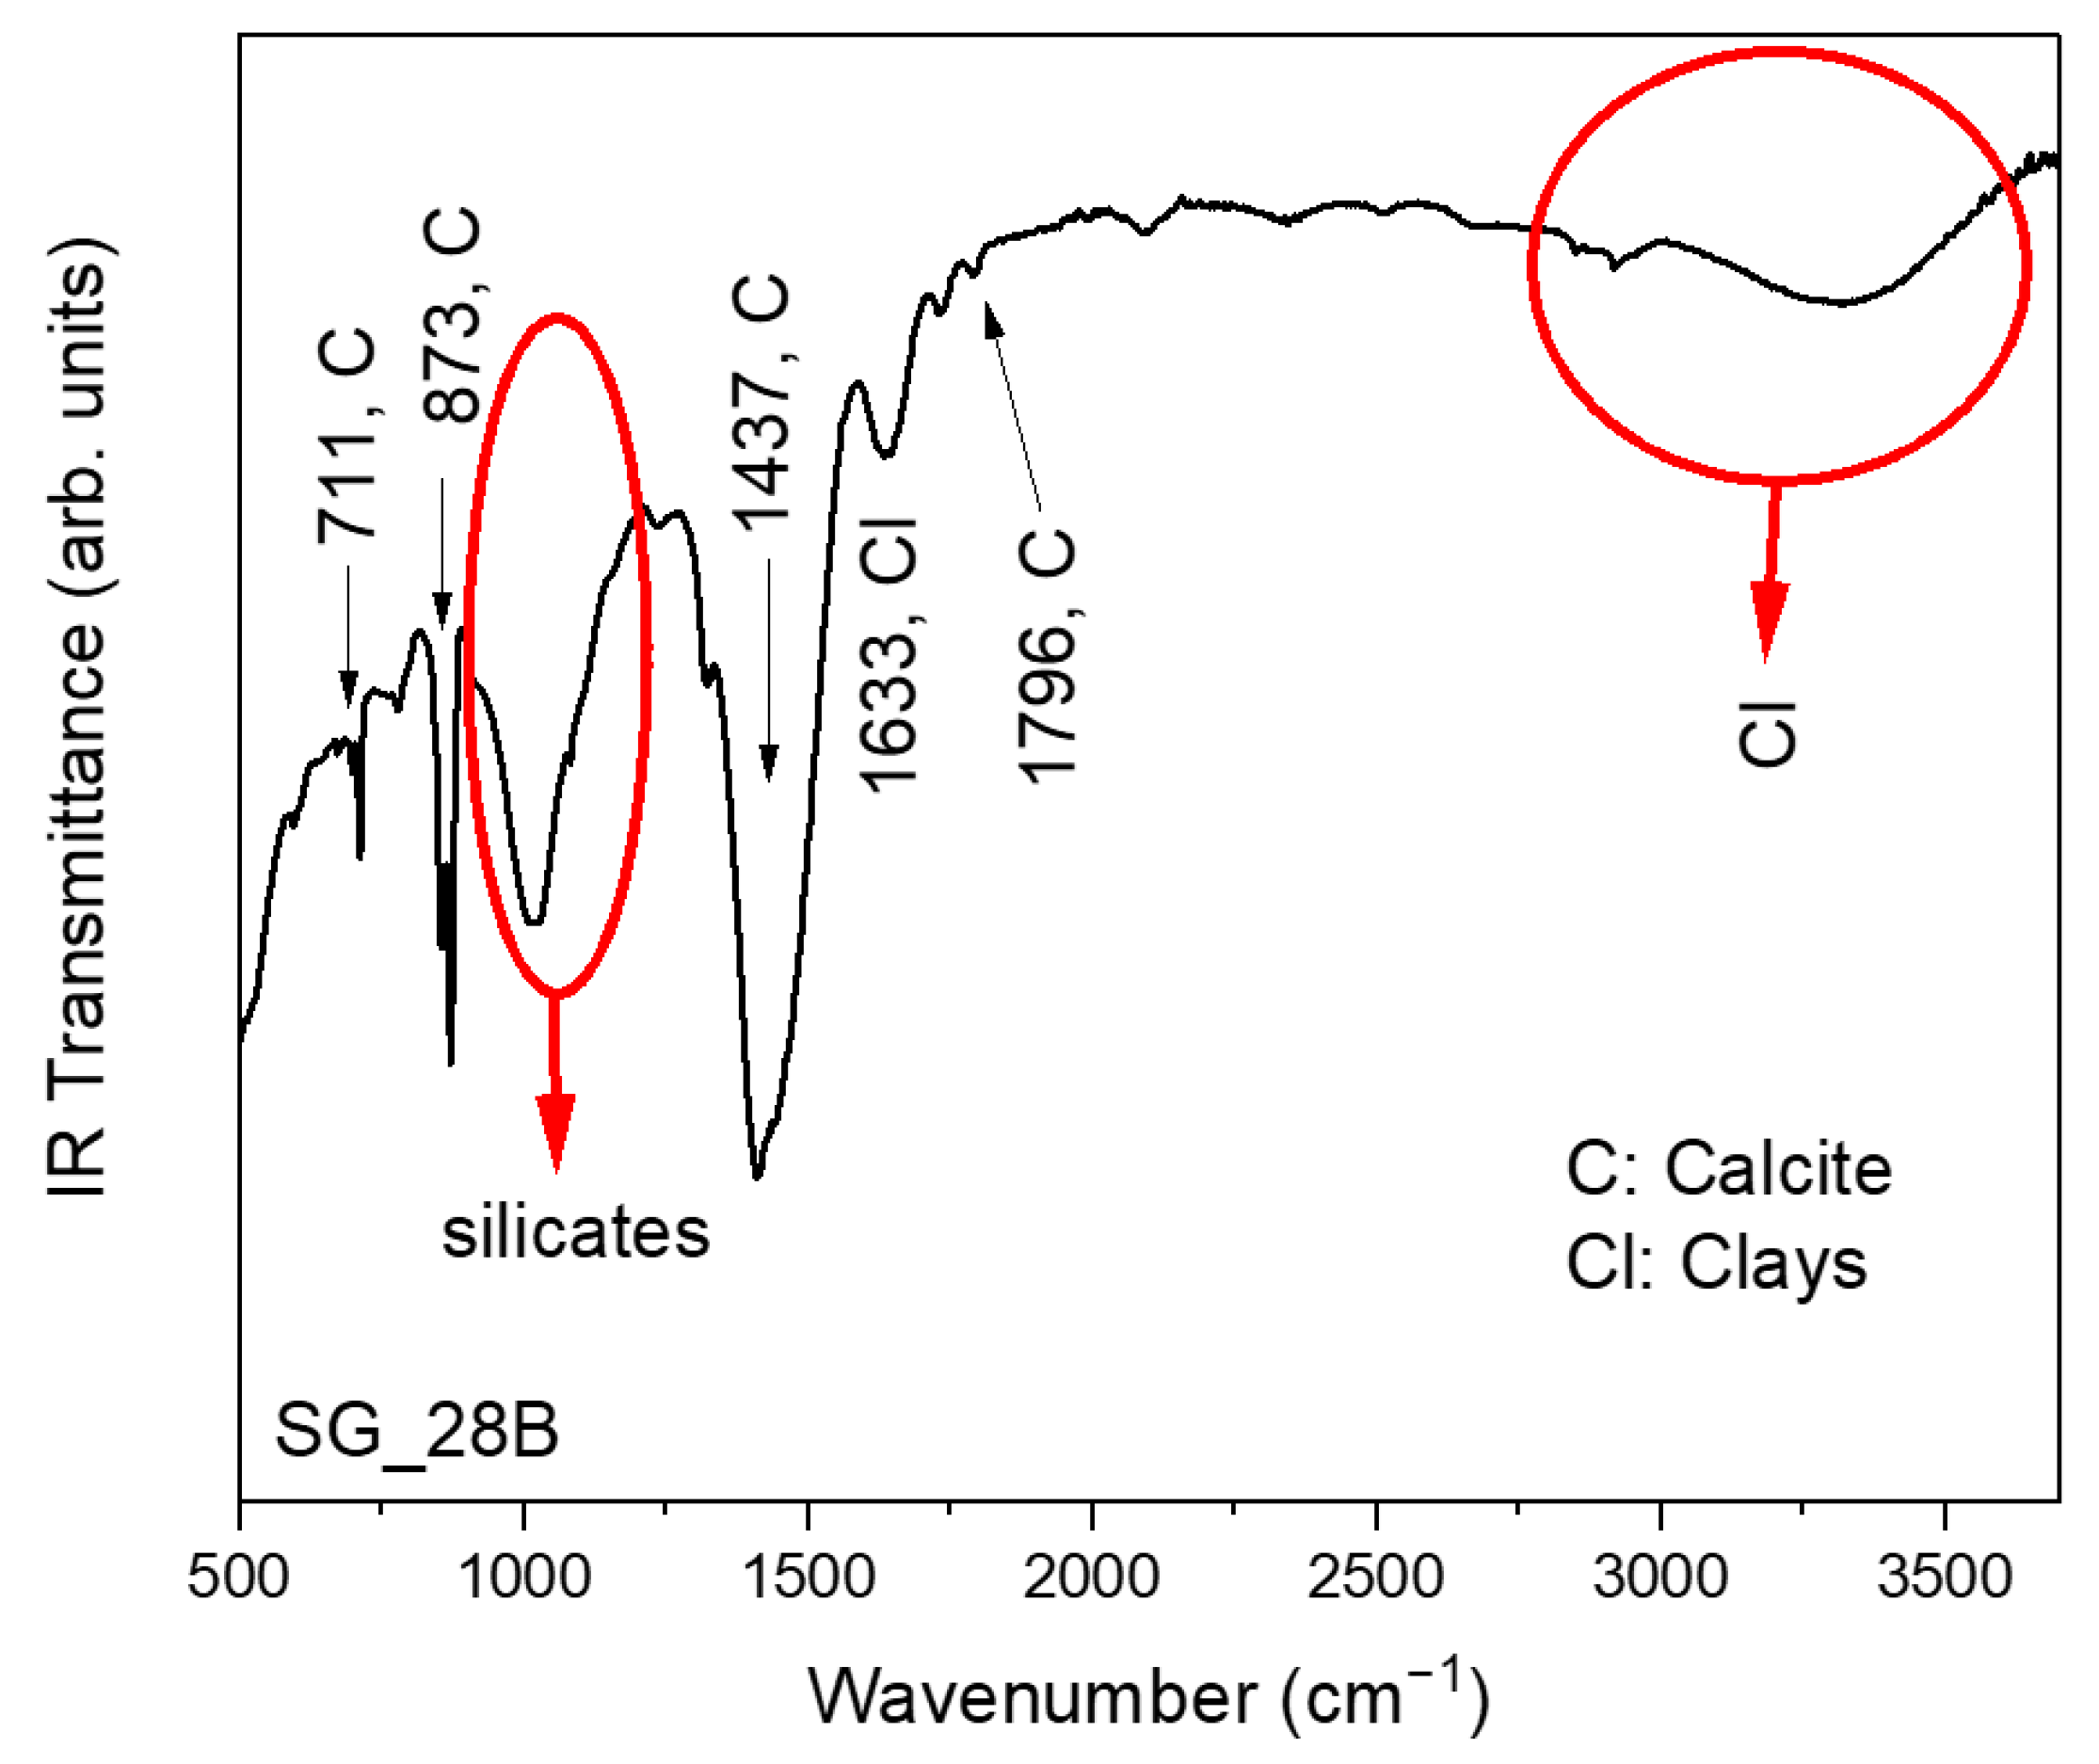
| SG_28B | 0.6 | Panel D | Dark-green pictorial layer + plaster fragments. The area also features glazed pictorial additions | µ-Raman, FT-IR |
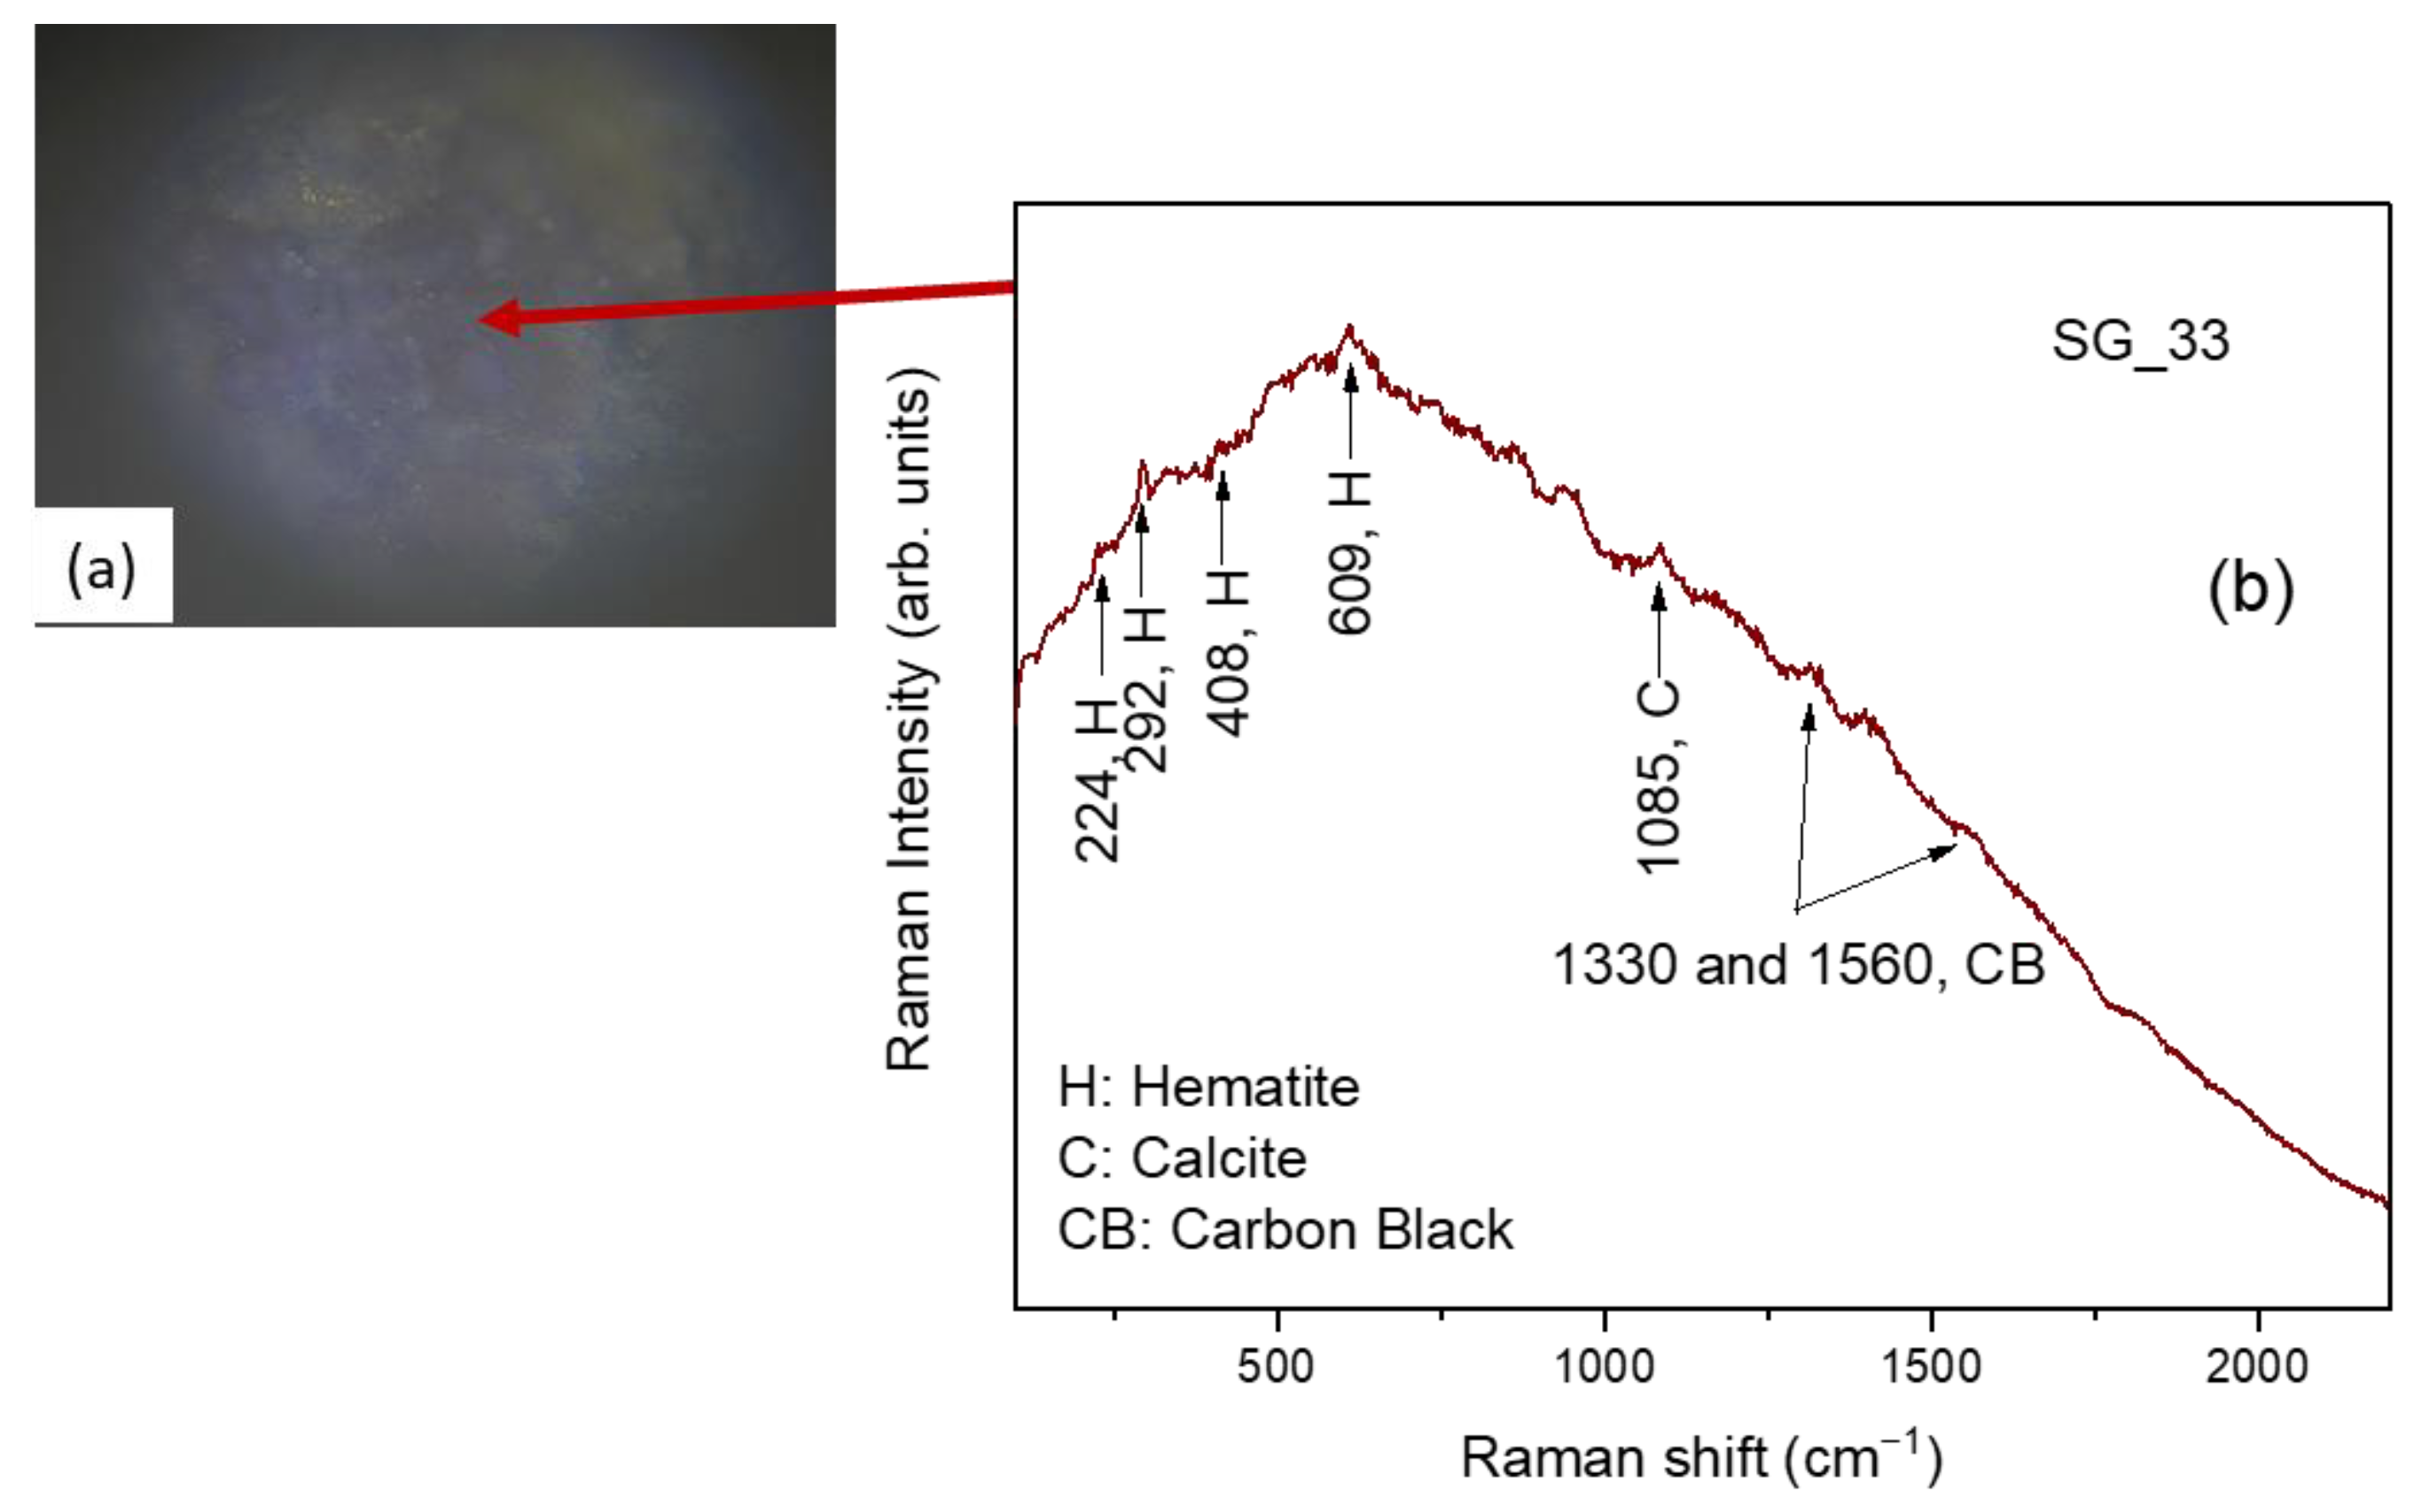
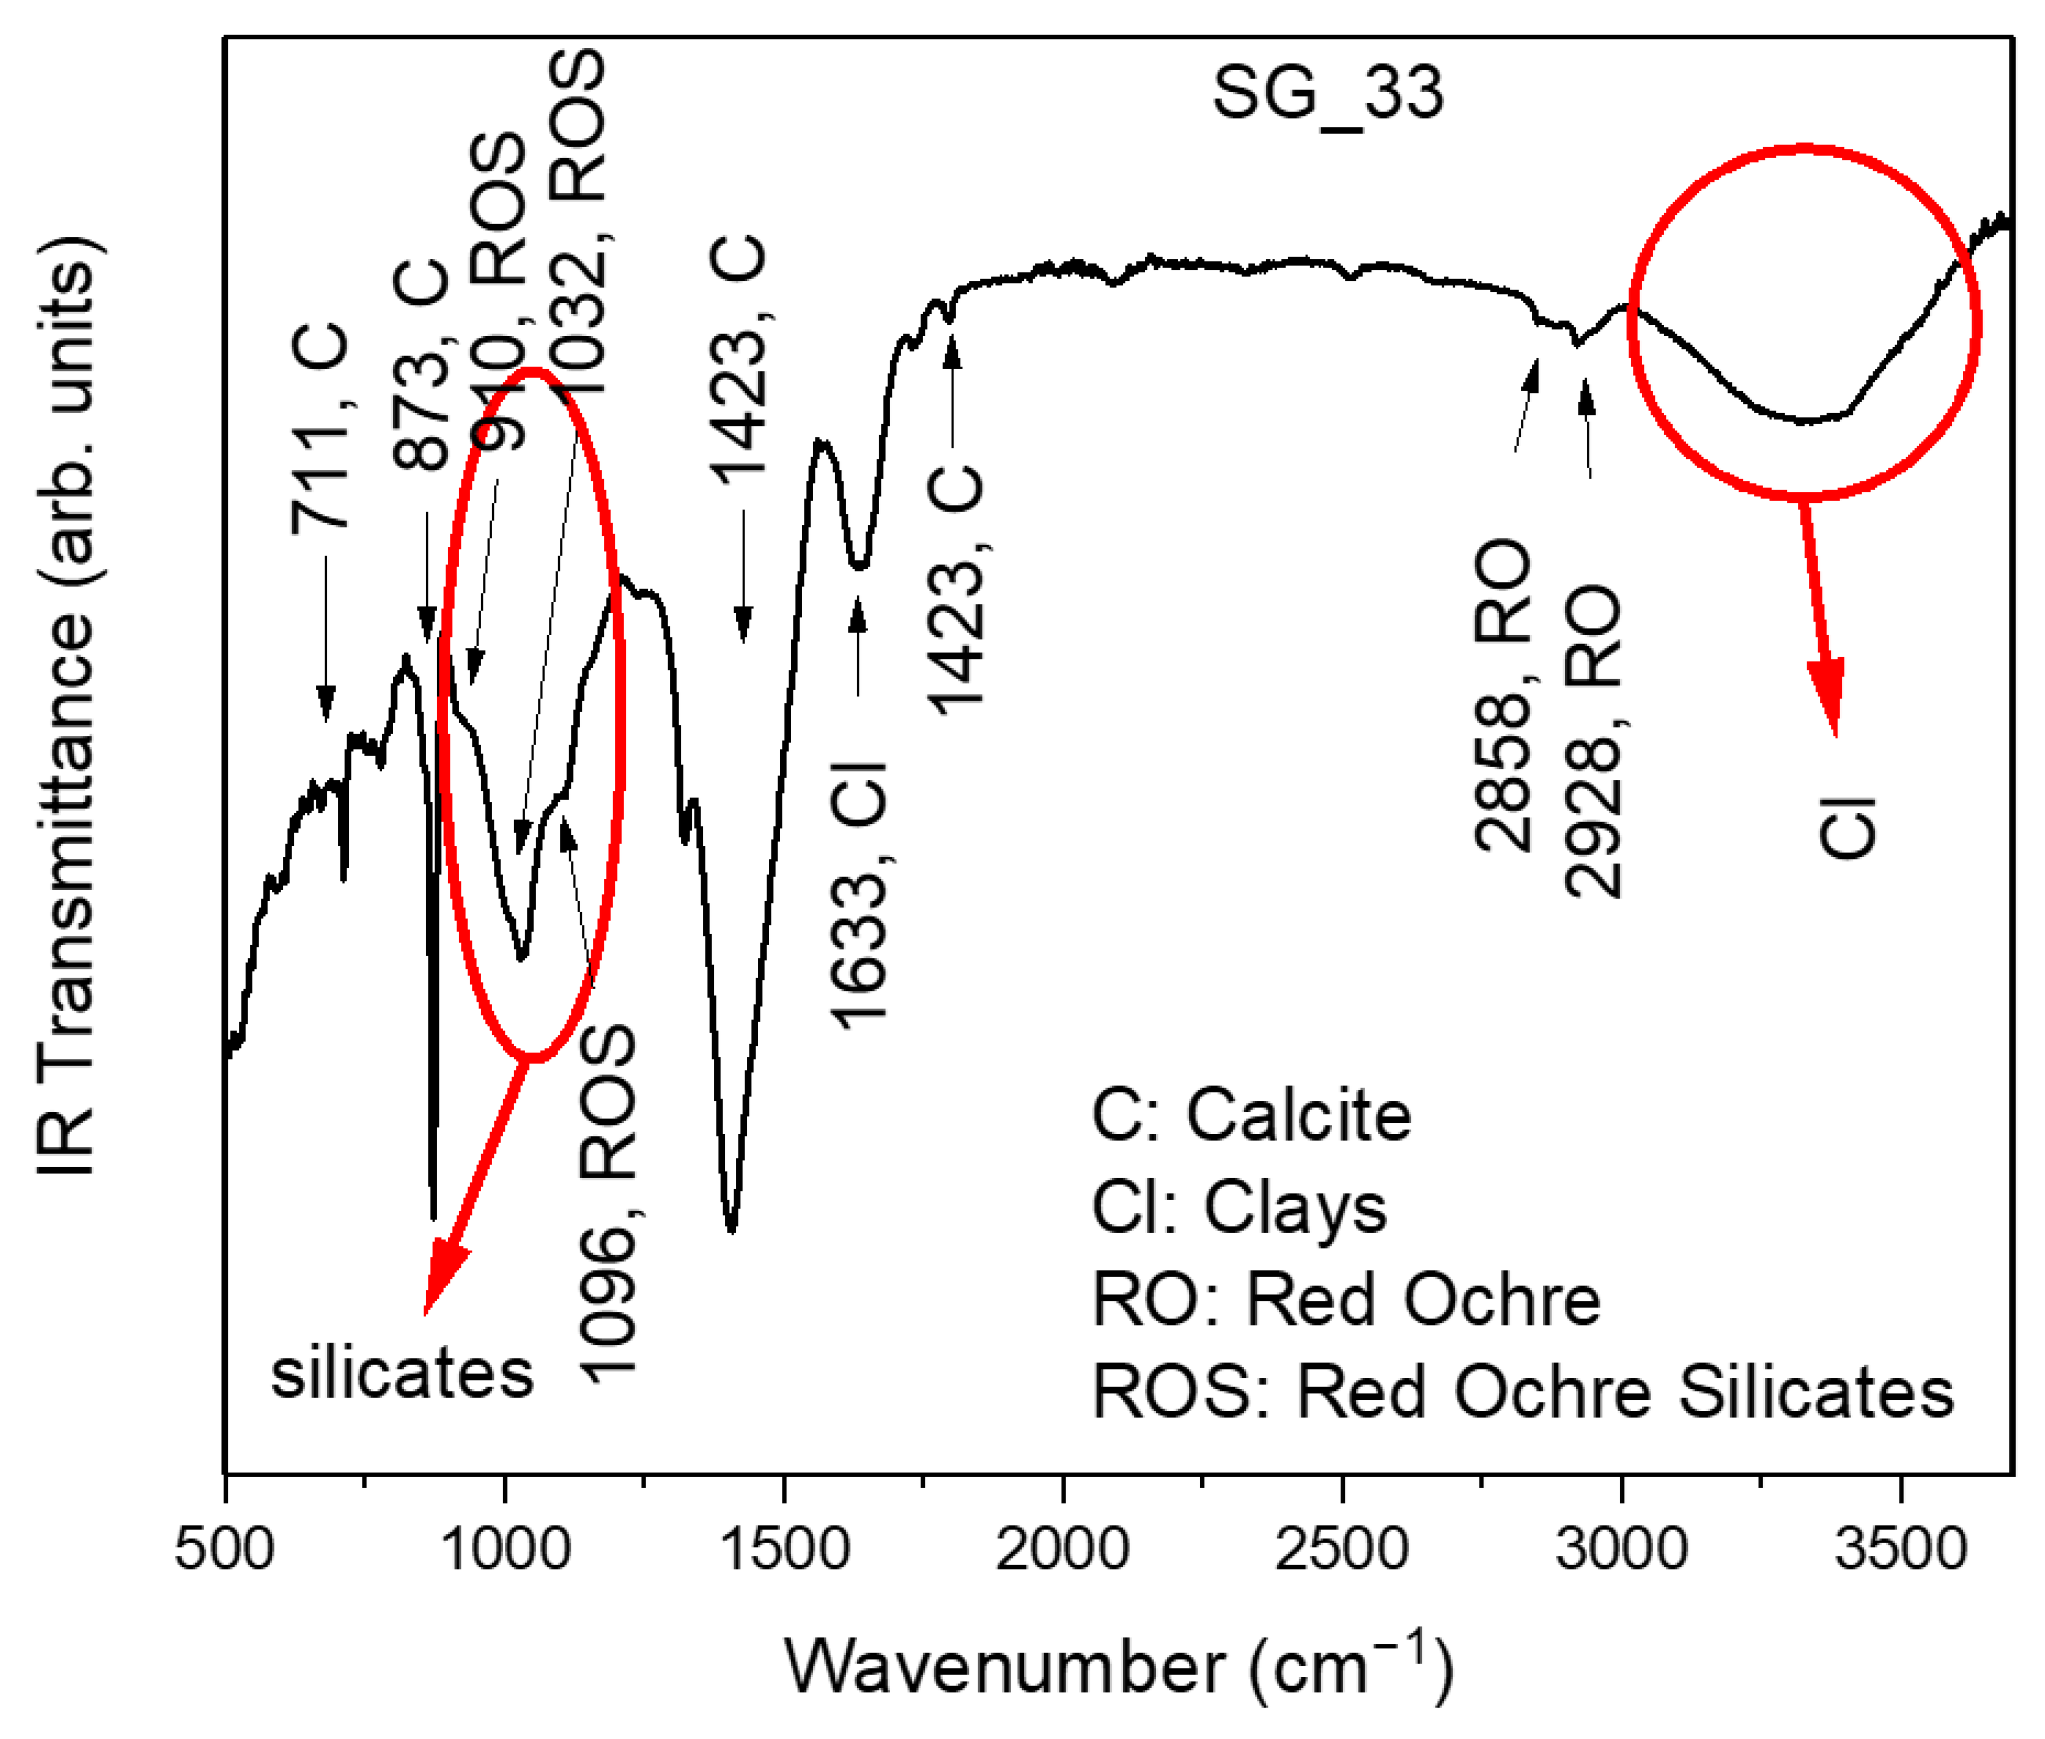
| SG_33 | 0.6 | Panel E | Purple pictorial layer (area affected by protective agents that make the surface shiny with a “wax” effect) + plaster fragments | µ-Raman, FT-IR |
| SG_45B | 0.5 | Panel E | Detail of the drapery of the loincloth of the risen Christ—White pictorial layer applied on an underlying pictorial surface | ICP-MS, TIMS |
| Sample ID | Element | Concentration [mg·kg−1] | Concentration [%] |
| SG_45B | Na | 265 | 0.03 |
| Mg | 2100 | 0.2 | |
| Ca | 62,000 | 6.2 | |
| Fe | 1000 | 0.1 | |
| Cu | 74 | 0.007 | |
| Zn | 520 | 0.05 | |
| Ba | 1000 | 0.1 | |
| Pb | 450 | 0.045 |
| Sample | 207Pb/206Pb | 208Pb/206Pb | 206Pb/204Pb | 207Pb/204Pb | 208Pb/204Pb |
|---|---|---|---|---|---|
| SG45B | 0.8529 ± 0.0003 | 2.0900 ± 0.0007 | 18.26 ± 0.03 | 15.57 ± 0.03 | 38.16 ± 0.07 |
| Férols, Montgaillard (France) | 0.8525 | 2.0903 | 18.33 | 15.63 | 38.32 |
| Lastours, Montagne Noire (France) | 0.8535 | 2.0910 | 18.36 | 15.67 | 38.39 |
| Cevennes, Massif Central (France) | 0.8519 | 2.0915 | 18.36 | 15.64 | 38.40 |
Disclaimer/Publisher’s Note: The statements, opinions and data contained in all publications are solely those of the individual author(s) and contributor(s) and not of MDPI and/or the editor(s). MDPI and/or the editor(s) disclaim responsibility for any injury to people or property resulting from any ideas, methods, instructions or products referred to in the content. |
© 2023 by the authors. Licensee MDPI, Basel, Switzerland. This article is an open access article distributed under the terms and conditions of the Creative Commons Attribution (CC BY) license (https://creativecommons.org/licenses/by/4.0/).
Share and Cite
Briani, F.; Caridi, F.; Ferella, F.; Gueli, A.M.; Marchegiani, F.; Nisi, S.; Paladini, G.; Pecchioni, E.; Politi, G.; Santo, A.P.; et al. Multi-Technique Characterization of Painting Drawings of the Pictorial Cycle at the San Panfilo Church in Tornimparte (AQ). Appl. Sci. 2023, 13, 6492. https://doi.org/10.3390/app13116492
Briani F, Caridi F, Ferella F, Gueli AM, Marchegiani F, Nisi S, Paladini G, Pecchioni E, Politi G, Santo AP, et al. Multi-Technique Characterization of Painting Drawings of the Pictorial Cycle at the San Panfilo Church in Tornimparte (AQ). Applied Sciences. 2023; 13(11):6492. https://doi.org/10.3390/app13116492
Chicago/Turabian StyleBriani, Francesca, Francesco Caridi, Francesco Ferella, Anna Maria Gueli, Francesca Marchegiani, Stefano Nisi, Giuseppe Paladini, Elena Pecchioni, Giuseppe Politi, Alba Patrizia Santo, and et al. 2023. "Multi-Technique Characterization of Painting Drawings of the Pictorial Cycle at the San Panfilo Church in Tornimparte (AQ)" Applied Sciences 13, no. 11: 6492. https://doi.org/10.3390/app13116492