Article

Numerical Simulation and Analysis of the Causes and Distribution of Secondary Lining Cracks in Overlapping Railway Tunnels

The Key Laboratory of Road and Traffic Engineering, Ministry of Education, Tongji University, Shanghai 201804, China
*
Author to whom correspondence should be addressed.
Appl. Sci. 2023, 13(11), 6436; https://doi.org/10.3390/app13116436
Submission received: 13 April 2023 / Revised: 15 May 2023 / Accepted: 18 May 2023 / Published: 25 May 2023
(This article belongs to the Topic Complex Rock Mechanics Problems and Solutions)

Abstract

:
The construction of new tunnels above existing tunnels has become increasingly common to optimize underground space utilization. However, such construction may pose potential engineering hazards due to cracking in the secondary lining of the lower tunnel. This study investigates the occurrence and evolutionary characteristics of longitudinal cracks in the secondary lining of the lower tunnel during the construction of the upper tunnel adjacent to the pre-existing lower tunnel. Our findings demonstrate that the construction of the upper tunnel has a significant impact on the lower tunnel, as confirmed by on-site monitoring and numerical simulation results. The redistribution of surrounding rock pressure alters the stress distribution of the secondary lining of the lower tunnel, which is the primary reason for the observed cracking. To mitigate the risk of cracks, two different methods are recommended based on the density of the cracks. In areas with less dense cracks, the method of chiseling and grouting is adopted to improve the strength of the secondary lining, while in relatively dense areas, resin anchor rods with saddle joints are used to enhance the stability of the surrounding rock. Long-term monitoring, classification, and early warning of cracks are also recommended.

1. Introduction

The secondary lining of tunnels is responsible for bearing the rock pressure and operating loads in tunnels [1,2]. However, concrete cracking is a common occurrence in the lining due to various environmental factors that the tunnel may be exposed to during operation [3]. Overlapping tunnel construction methods, which are frequently utilized due to space limitations, can also lead to cracks in the secondary lining. The propagation of such cracks can result in severe structural issues such as leakage [4], spalling [5], and partial lining failure [6], reducing the durability and load-carrying capacity of the lining [7].
Numerous scholars have conducted research on the construction mechanic effects of tunnels adjacent to existing structures. Yun [8] developed a monitoring program that utilizes actual field data based on the principal component analysis method, which can monitor tunnel behavior and prevent large deformations and cracking. Zhang [9] studied the ground and structural disturbances caused by multi-line overlapping tunnels in China, while Liang [10] investigated the dynamic response of the new railway tunnel to the existing railway tunnel’s blasting vibration and its impact on the existing tunnel lining structure before and after the vibration. Such studies have proved valuable in analyzing and controlling cracks in the secondary lining. Ukritchon [11] used a three-dimensional finite element analysis to investigate the undrained tunnel face stability in clay with a linearly increasing shear strength with depth. This work provides valuable insights into the instability pattern of tunnels.
Asymmetric loading effects are the primary cause of secondary lining cracking [12], which have been the subject of much academic attention. Over the last few decades, engineers have been interested in the structural collapse of tunnels under asymmetrical loads [12]. Numerical models have been used to demonstrate the lining cracking and failure processes in shallow-buried tunnels [13,14], deep-buried tunnels [15], and those exposed to asymmetrical loads. Two-dimensional numerical models have also been developed to estimate deformation and displacement behaviors of lining in asymmetrically-loaded tunnels while considering factors such as the shifting transversal gradient, surrounding rock grade, and covering thickness [16]. Zhuo presented an asymmetrical rock pressure calculation approach for super-shallow-buried tunnels [17]. Studies have also investigated the bearing capacity and most likely lining fracture sites [18,19].
However, limited research has been conducted on the causes and timely distribution of cracks, particularly in the case of closely spaced overlapping railway tunnels. This study investigates the causes of secondary lining cracks in the lower tunnel resulting from the construction of an upper tunnel, based on finite element numerical simulation and field crack measurement data collected from a railway tunnel project in Chongqing. Four cross-sections with different horizontal spacing were selected to establish two-dimensional numerical models consistent with the construction conditions on site. The models analyzed the force and yielding of the lining of the two tunnels under different working conditions, from which the location of the cracks was determined and compared with the monitoring results to verify the feasibility of the numerical method. The temporal and spatial distribution of cracks was analyzed, and construction suggestions are proposed.
In order to predict and monitor the stability and safety of tunnels, artificial intelligence techniques are beginning to receive increasing attention. Visual examinations of tunnels do not offer a reliable and objective evaluation of their condition [20]. The use of artificial intelligence in tunnel monitoring is of interest. As one of the effective ways to implement artificial intelligence, deep learning represents an innovative and advantageous way to generate reliable synthetic data that represent actual sample characteristics, providing a useful data augmentation tool in tunnel monitoring [21]. To increase the effectiveness of this strong indirect survey approach, Marco Martino Rosso et al. created an artificial intelligence-based hierarchical automated categorization framework for road tunnel issues [20], which may be one of the lowest costing and most efficient ways of measuring available. In another case, Ngamkhanong used artificial neural networks to predict the stability of planar tunnels in rock masses [22]. Practical application scenarios prove the effectiveness of this approach.
This paper is organized as follows. Part 1 analyses the significance and current status of the research on upper and lower overlapping tunnels and indicates the content of this paper. Part 2 describes the engineering background of the case study and presents the finite element numerical simulation model and the analysis methods used in this study. Part 3 presents the simulation results, including the distribution of stress, deformation, and crack formation in the lower tunnel lining. Part 4 discusses the implications of the simulation results and proposes measures to improve the stability of the tunnel lining. Finally, Part 5 summarizes the main findings and conclusions of this study. This paper contributes to the understanding of the complex interactions between overlapping tunnels and their surrounding rock mass and provides practical guidance for engineers to mitigate the risks of crack formation in lower tunnels subjected to unloading due to the construction of upper tunnels.

2. Methodology

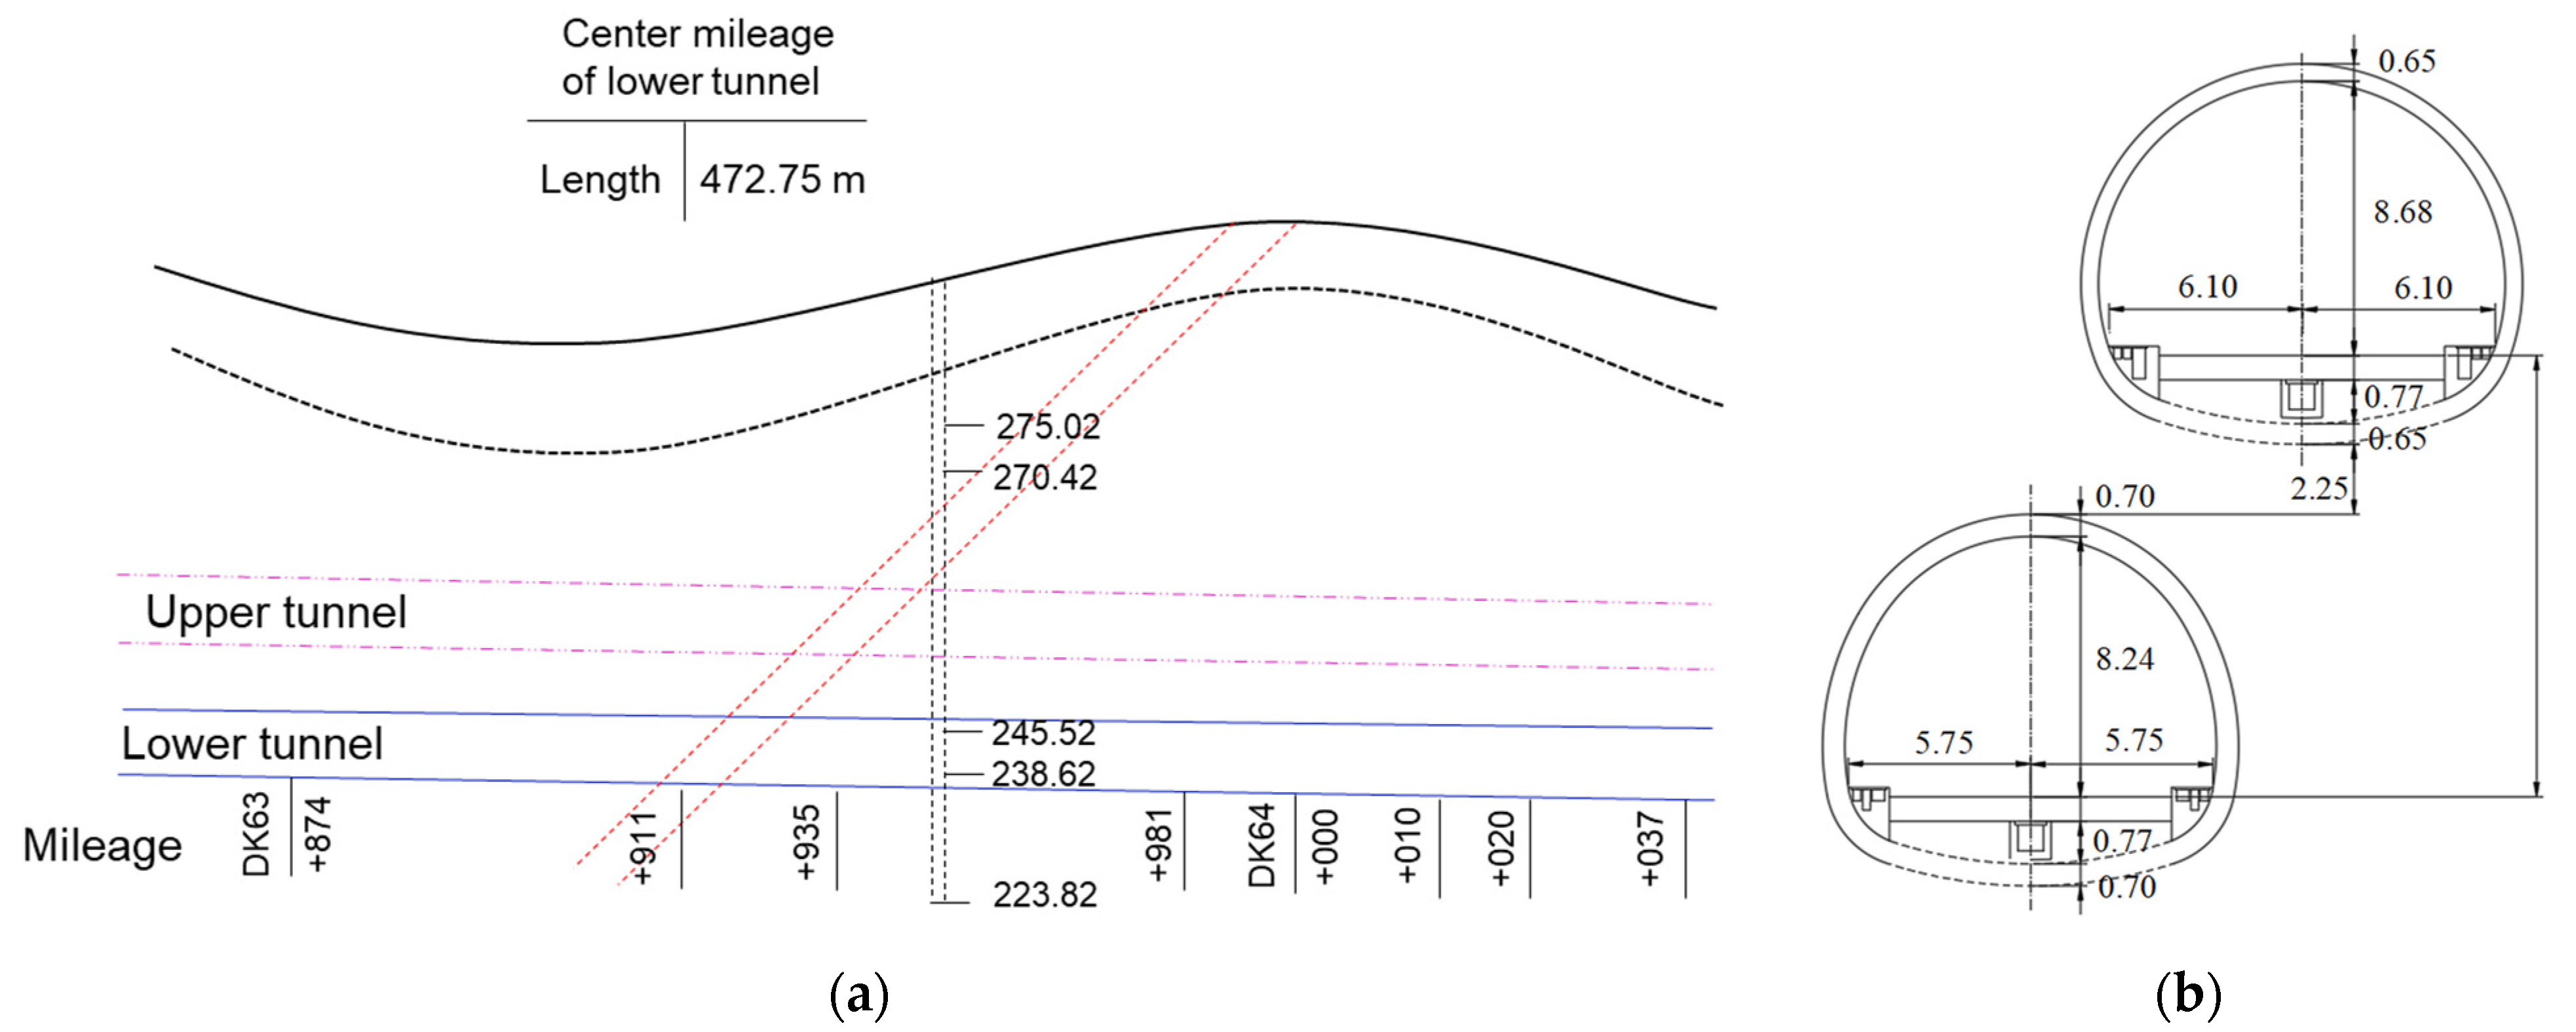
2.1. Project Overview

The upper and lower overlapping tunnels are located at the railway hub loop in Chongqing, China, and are the first upper and lower overlapping high-speed rail tunnels in China. The lower is a two-lane railway tunnel and the upper is a reserved high-speed railway tunnel. The tunnel region predominantly encompasses wooded terrain, featuring a range of elevation between 217.9 and 302.3 m. The minimum height difference between the upper and lower tunnel track surfaces is 13.96 m, with a minimum interlayer distance of around 1.7 m. A depiction of the spatial configuration of the intersecting tunnel sections is presented in Figure 1. The tunnel is designed for mining method excavation. The lower tunnel was constructed first before the upper tunnel was completed.

2.2. Methods of on-Site Investigation of Cracks

Measurements were carried out on-site to evaluate the attributes of cracks that manifested in the tunnel structures. The cracks were documented through on-site markings and photographs. The length, width, and depth of the cracks were meticulously gauged, and their locations and mileages were documented. Specifically, red paint was used to mark the development and length of cracks by drawing thin lines in the direction of their extension. Their depths and maximum crack width were monitored with a non-metallic ultrasonic detector and a reading microscope, respectively. In addition, the development of cracks was monitored using plaster cake. A 50 mm length of plaster was applied to typical cracks. As plaster sets quickly and without shrinkage cracks, the development of cracks can be identified by simply observing if the plaster is cracking. These approaches facilitated an exhaustive assessment of the characteristics and magnitude of the cracks, thereby enabling the development of efficacious repair strategies.

2.3. Numerical Simulation Calculation Method of Cracks

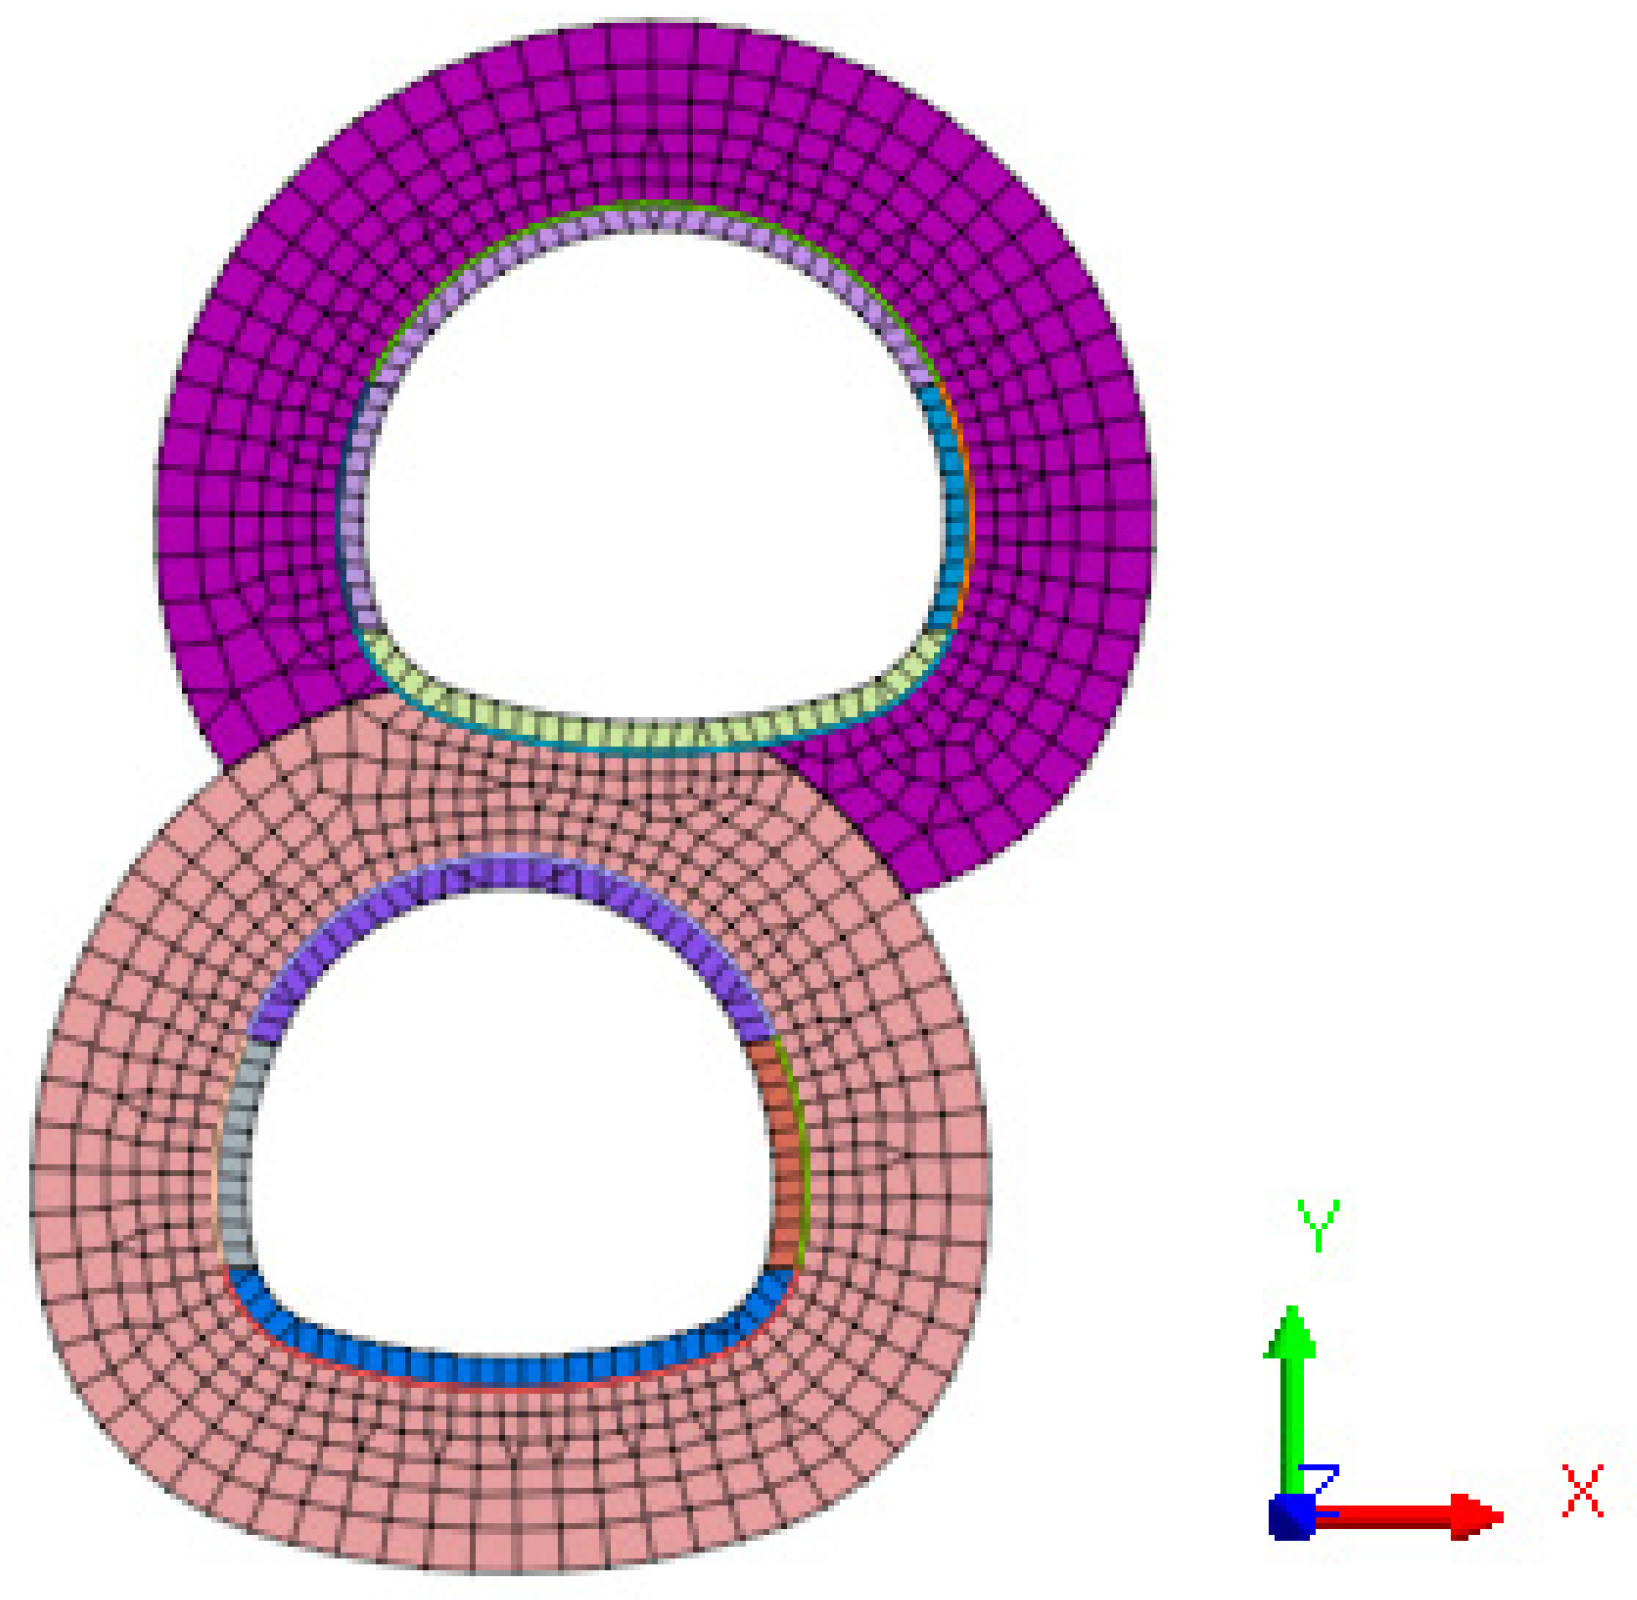
2.3.1. Parameter Delineation

This article presents the design and construction methodology of a joint tunnel project, which involves the construction of the upper tunnel adjacent to the pre-existing lower tunnel. The two tunnels were excavated using the mining method. The overall construction was carried out in accordance with the lower tunnel first and then the upper tunnel completion. To achieve this, the two-step plus temporary cross bracing construction method was employed in the lower tunnel section (DK63 + 690~DK64 + 110) and upper tunnel section (AK63 + 820~AK64 + 062), as illustrated in Figure 2, which depicts the tunnel excavation sequence. Primary support was provided by employing C25 shotcrete with a thickness of 27 cm and Φ22 mm radial anchor rods, while the secondary lining comprised C35 concrete with a thickness of 65 cm and 70 cm for the upper and lower tunnels, respectively. However, it is worth noting that the mechanical analysis model did not take into account the influence of groundwater seepage.
According to the position relationship diagram of the top and lower layers of the tunnel, a section is picked every 50 m within the mileage range of the fractures in the secondary lining. The four representative sections illustrated in Figure 3 were chosen for study. The buried depth and the distance between the upper and lower tunnels are shown in Table 1.
The corresponding model sizes of sections 1 to 4 were determined based on related theories such as rock mechanics and the influence range of tunnel excavation (which is typically 3 to 5 times the tunnel radius) [23], as shown in Table 2.
The Class V surrounding rocks around both tunnels are predominantly loose clayey soils, thus allowing the morphology and stresses of the surrounding rocks to be simulated using the Mohr–Coulomb model. The elastic constitutive and two-dimensional plane strain elements were employed to simulate the secondary lining [24]. The primary support, comprising shotcrete and temporary cross bracing, was simulated using one-dimensional beam elements of an elastic constitutive [23,25]. The bolt support function was represented by the reinforcement area in the numerical simulation, and the reinforcement parameters were chosen based on 1.1 times the surrounding rock [23]. The material parameter values for the model were obtained experimentally and are provided in Table 3.
The entirety of the tunnel comprises surrounding rock rated as either grade IV or V, with the former constituting 8.8% of the combined length of the upper and lower tunnels (852.72 m). The influence of a Class IV enclosure is neglected as it accounts for a relatively small proportion of the enclosure, and only the effect of a Class V enclosure is given consideration.

2.3.2. Boundary Conditions

In the simulation, a normal displacement constraint boundary was established on the side and bottom surfaces of the model, while the top surface boundary was left free. To illustrate the grid division of the model, Section 1 was used as an example. The numerical simulation grid model is presented in Figure 4, while the model of the secondary lining and anchor reinforcement zone of the upper and lower tunnels is displayed in Figure 5.

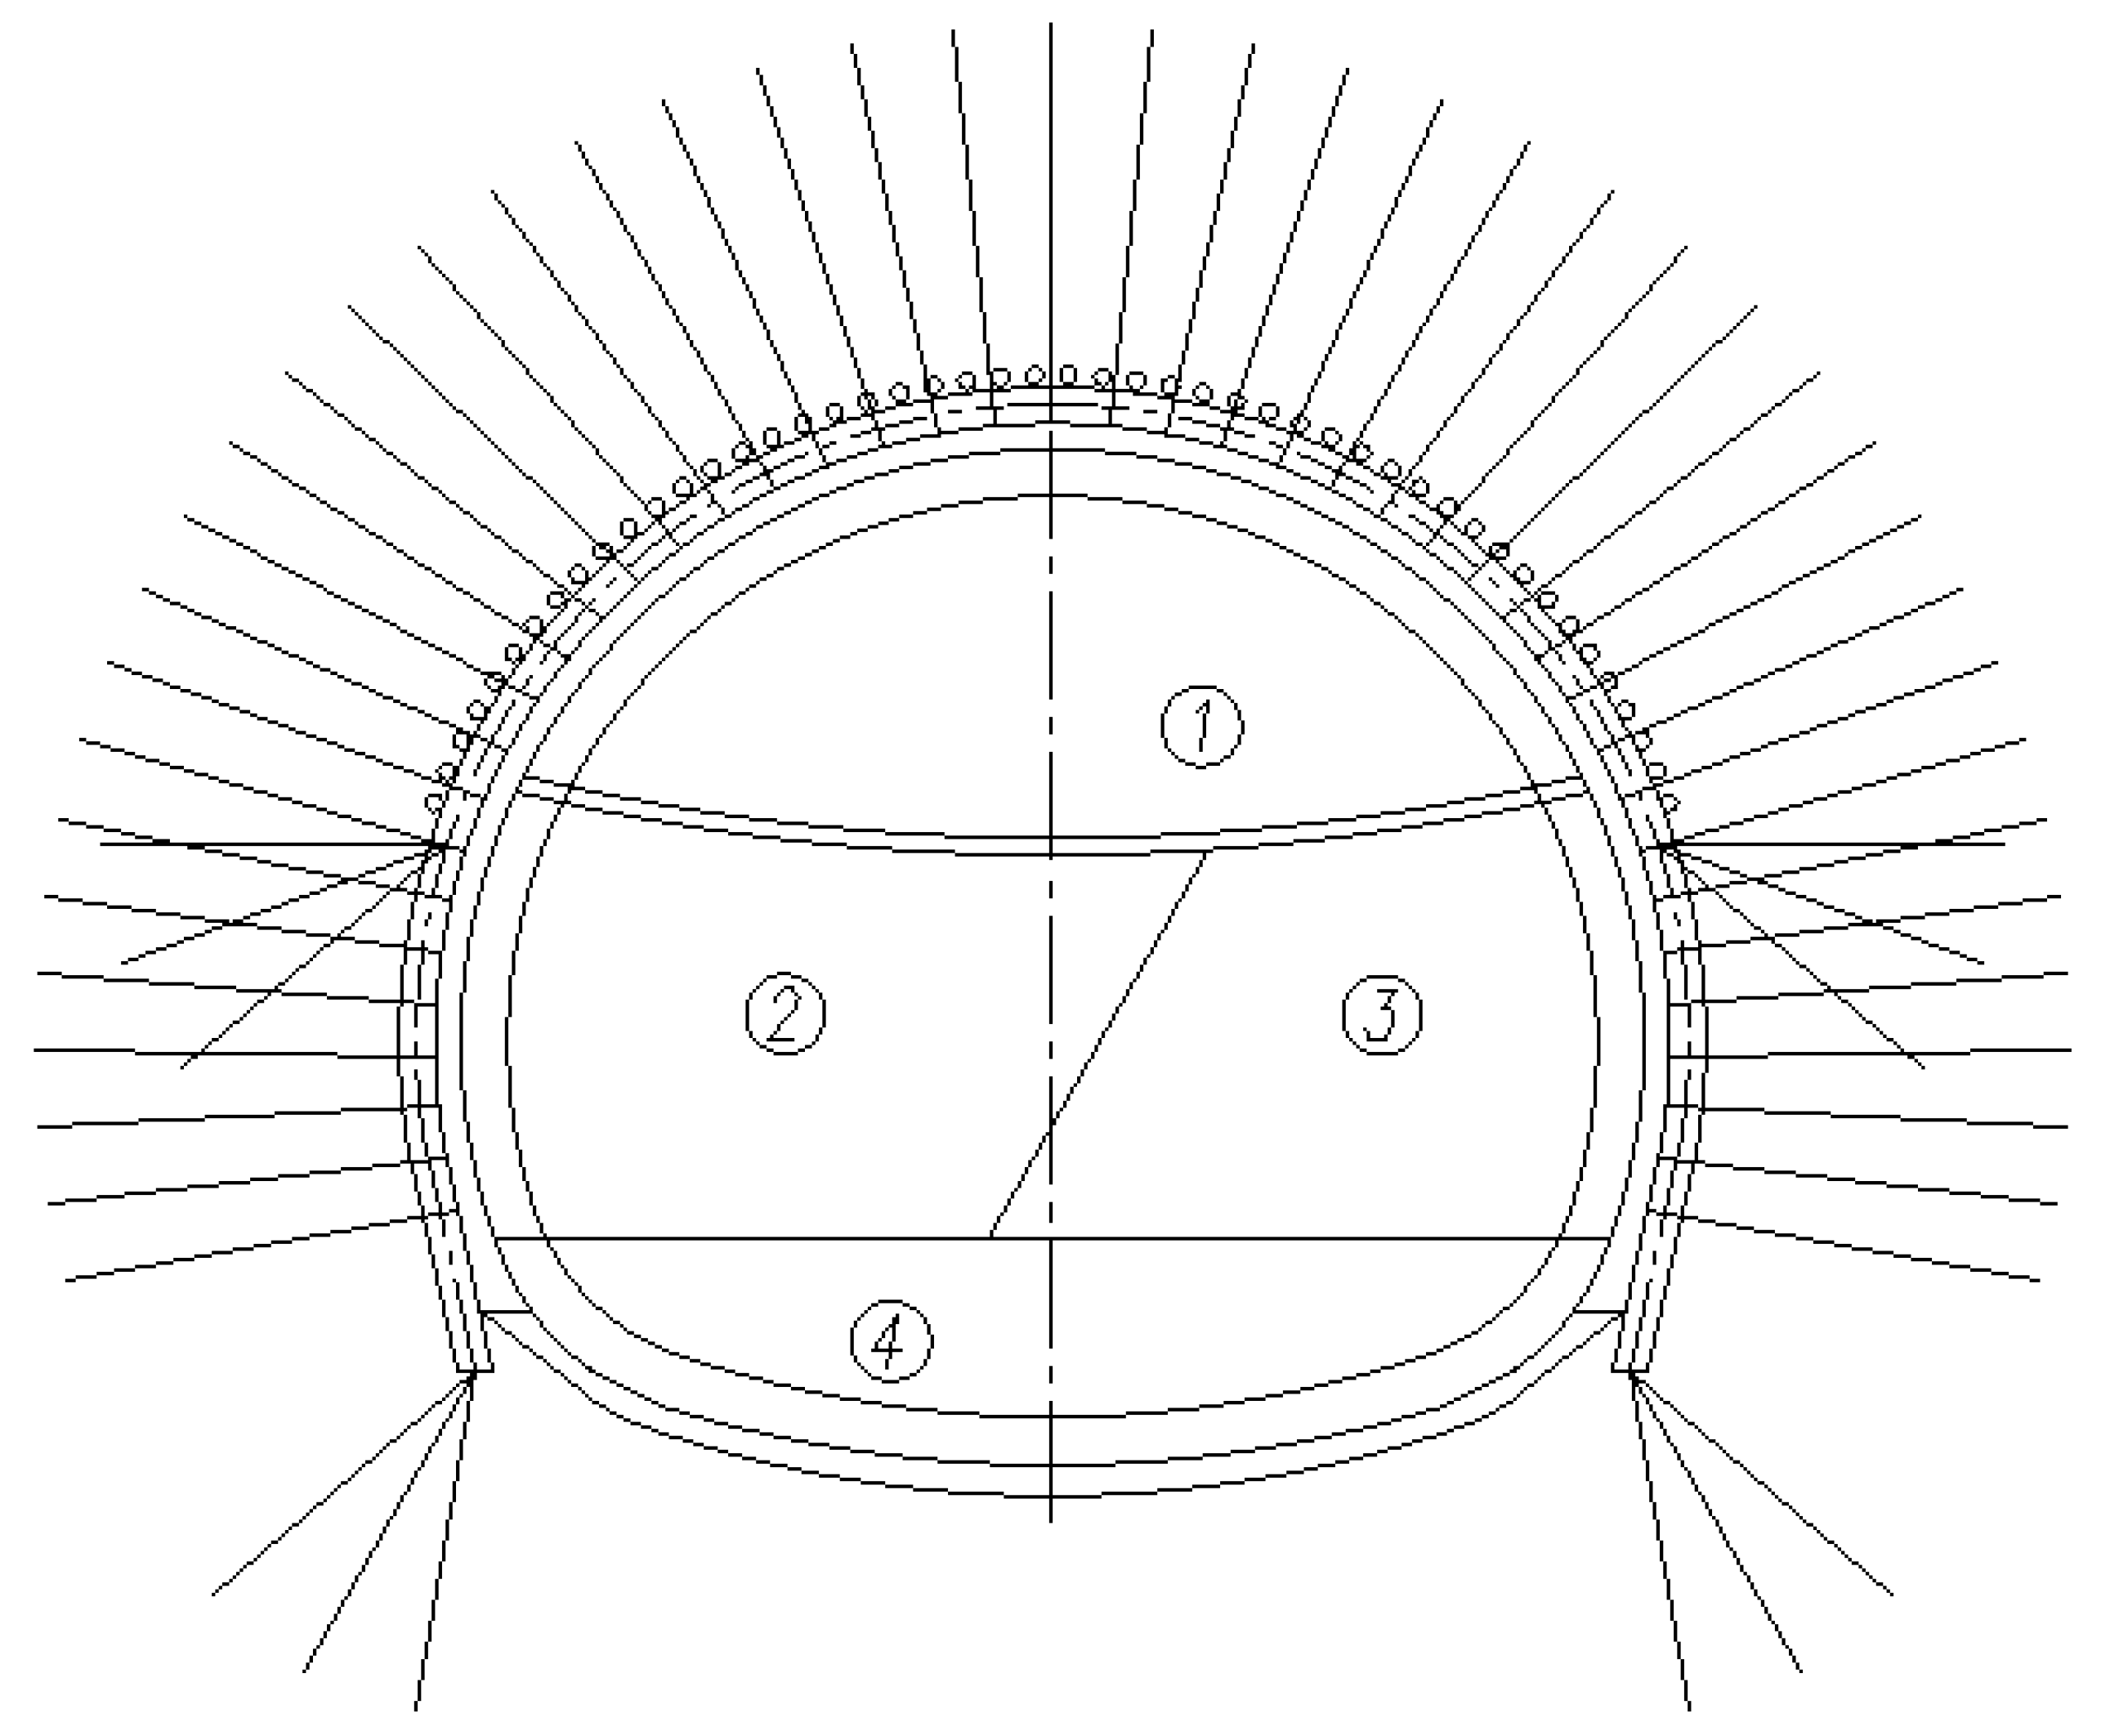
2.3.3. Excavation Process Simulation

The construction process of a tunnel step stacked with temporary cross bracing, as illustrated in Table 4, presents potential dangers during the last two construction processes based on engineering experience.

2.4. Analysis Method of the Cause and Distribution of Cracks

The theoretical causes of cracks can be evaluated by comparing the maximum tensile stress and maximum compressive stress with the standard values of the tensile and compressive strength of C35 concrete, which allows for a determination of whether the secondary lining has cracks. Similarly, the distribution of cracks can be predicted by analyzing the distribution law of the plastic zone of the secondary lining.

3. Results

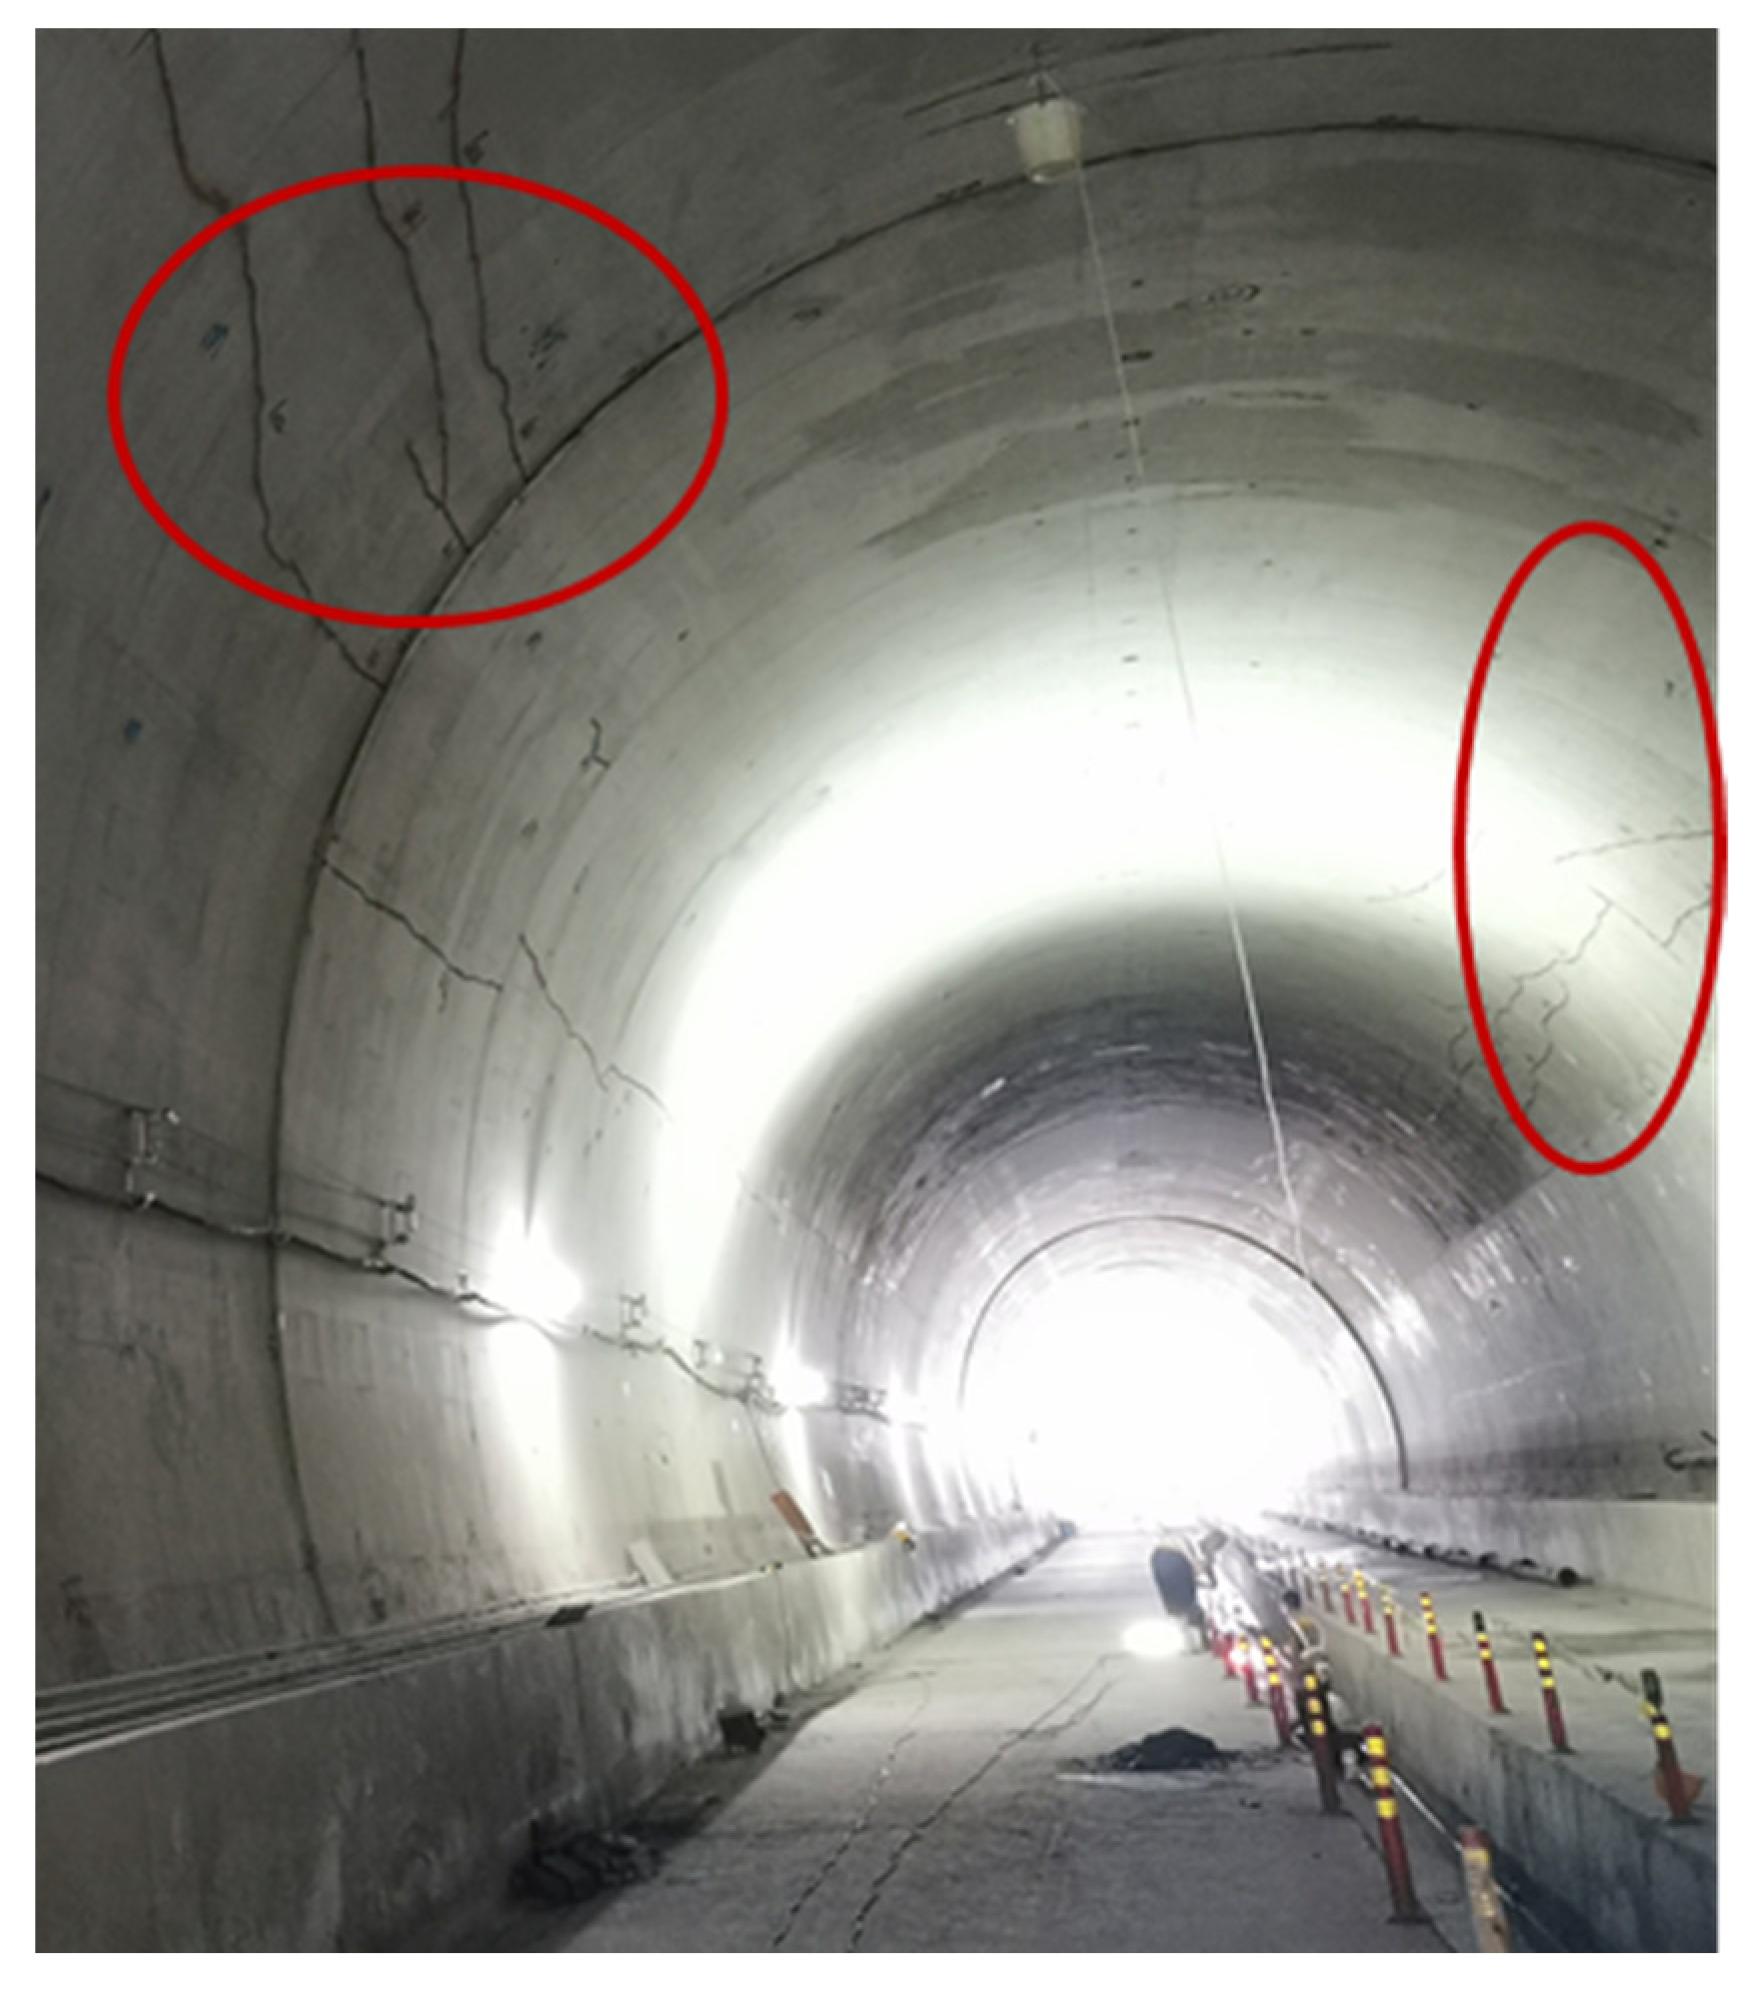
3.1. On-Site Crack Investigation

During the construction of the upper tunnel following the completion of the lower tunnel, a series of longitudinal cracks occurred in the DK63 + 900~DK64 + 950 section of the lower tunnel. Longitudinal cracks were mostly produced by evolving rock pressure or different kinds of construction deficiencies, such as inadequate lining thickness [2]. As the construction of the upper tunnel squeezed the surrounding rock of the lower tunnel, the pressure on the surrounding rock of the lower tunnel increased. These cracks were predominantly located at the right arch waist of the lower tunnel alignment, as illustrated in Figure 6. Furthermore, local cracks appeared on both the left and right arch waists, as shown in Figure 7. The length of the cracks was approximately 12 m, with a width ranging between 0.2 mm and 0.4 mm and a depth ranging from 7.7 cm to 12.5 cm, as presented in Table 5.

3.2. Calculation of Stress and Plastic Zone

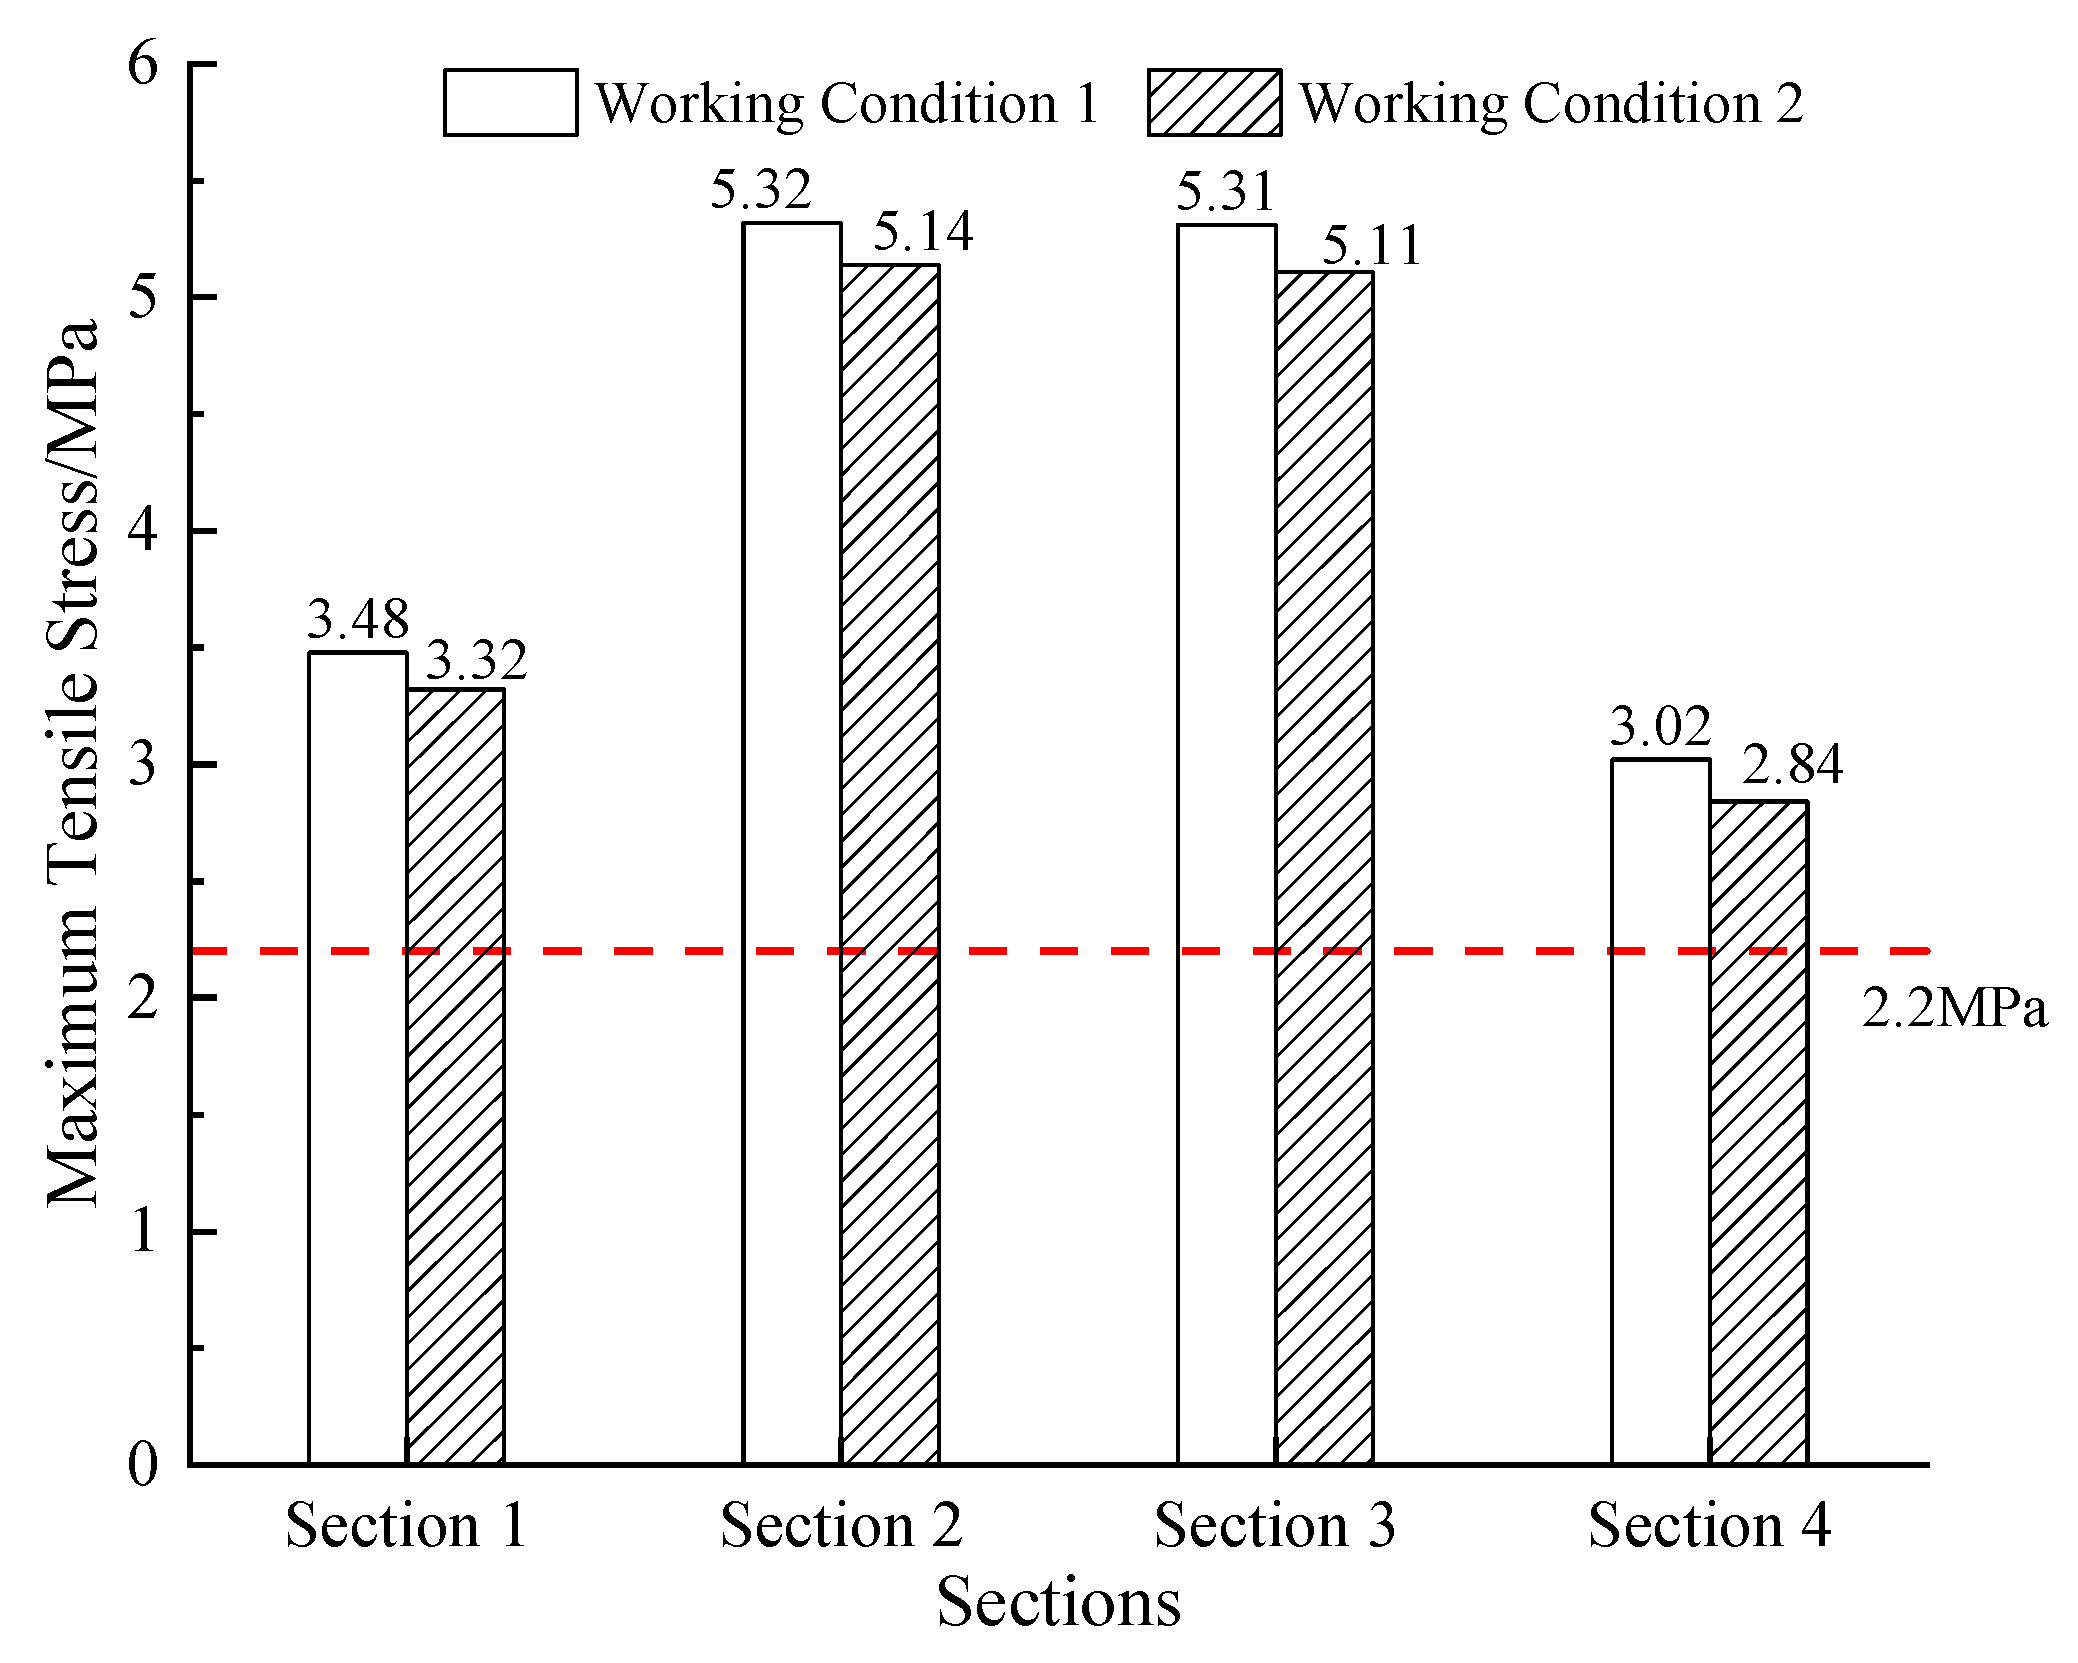
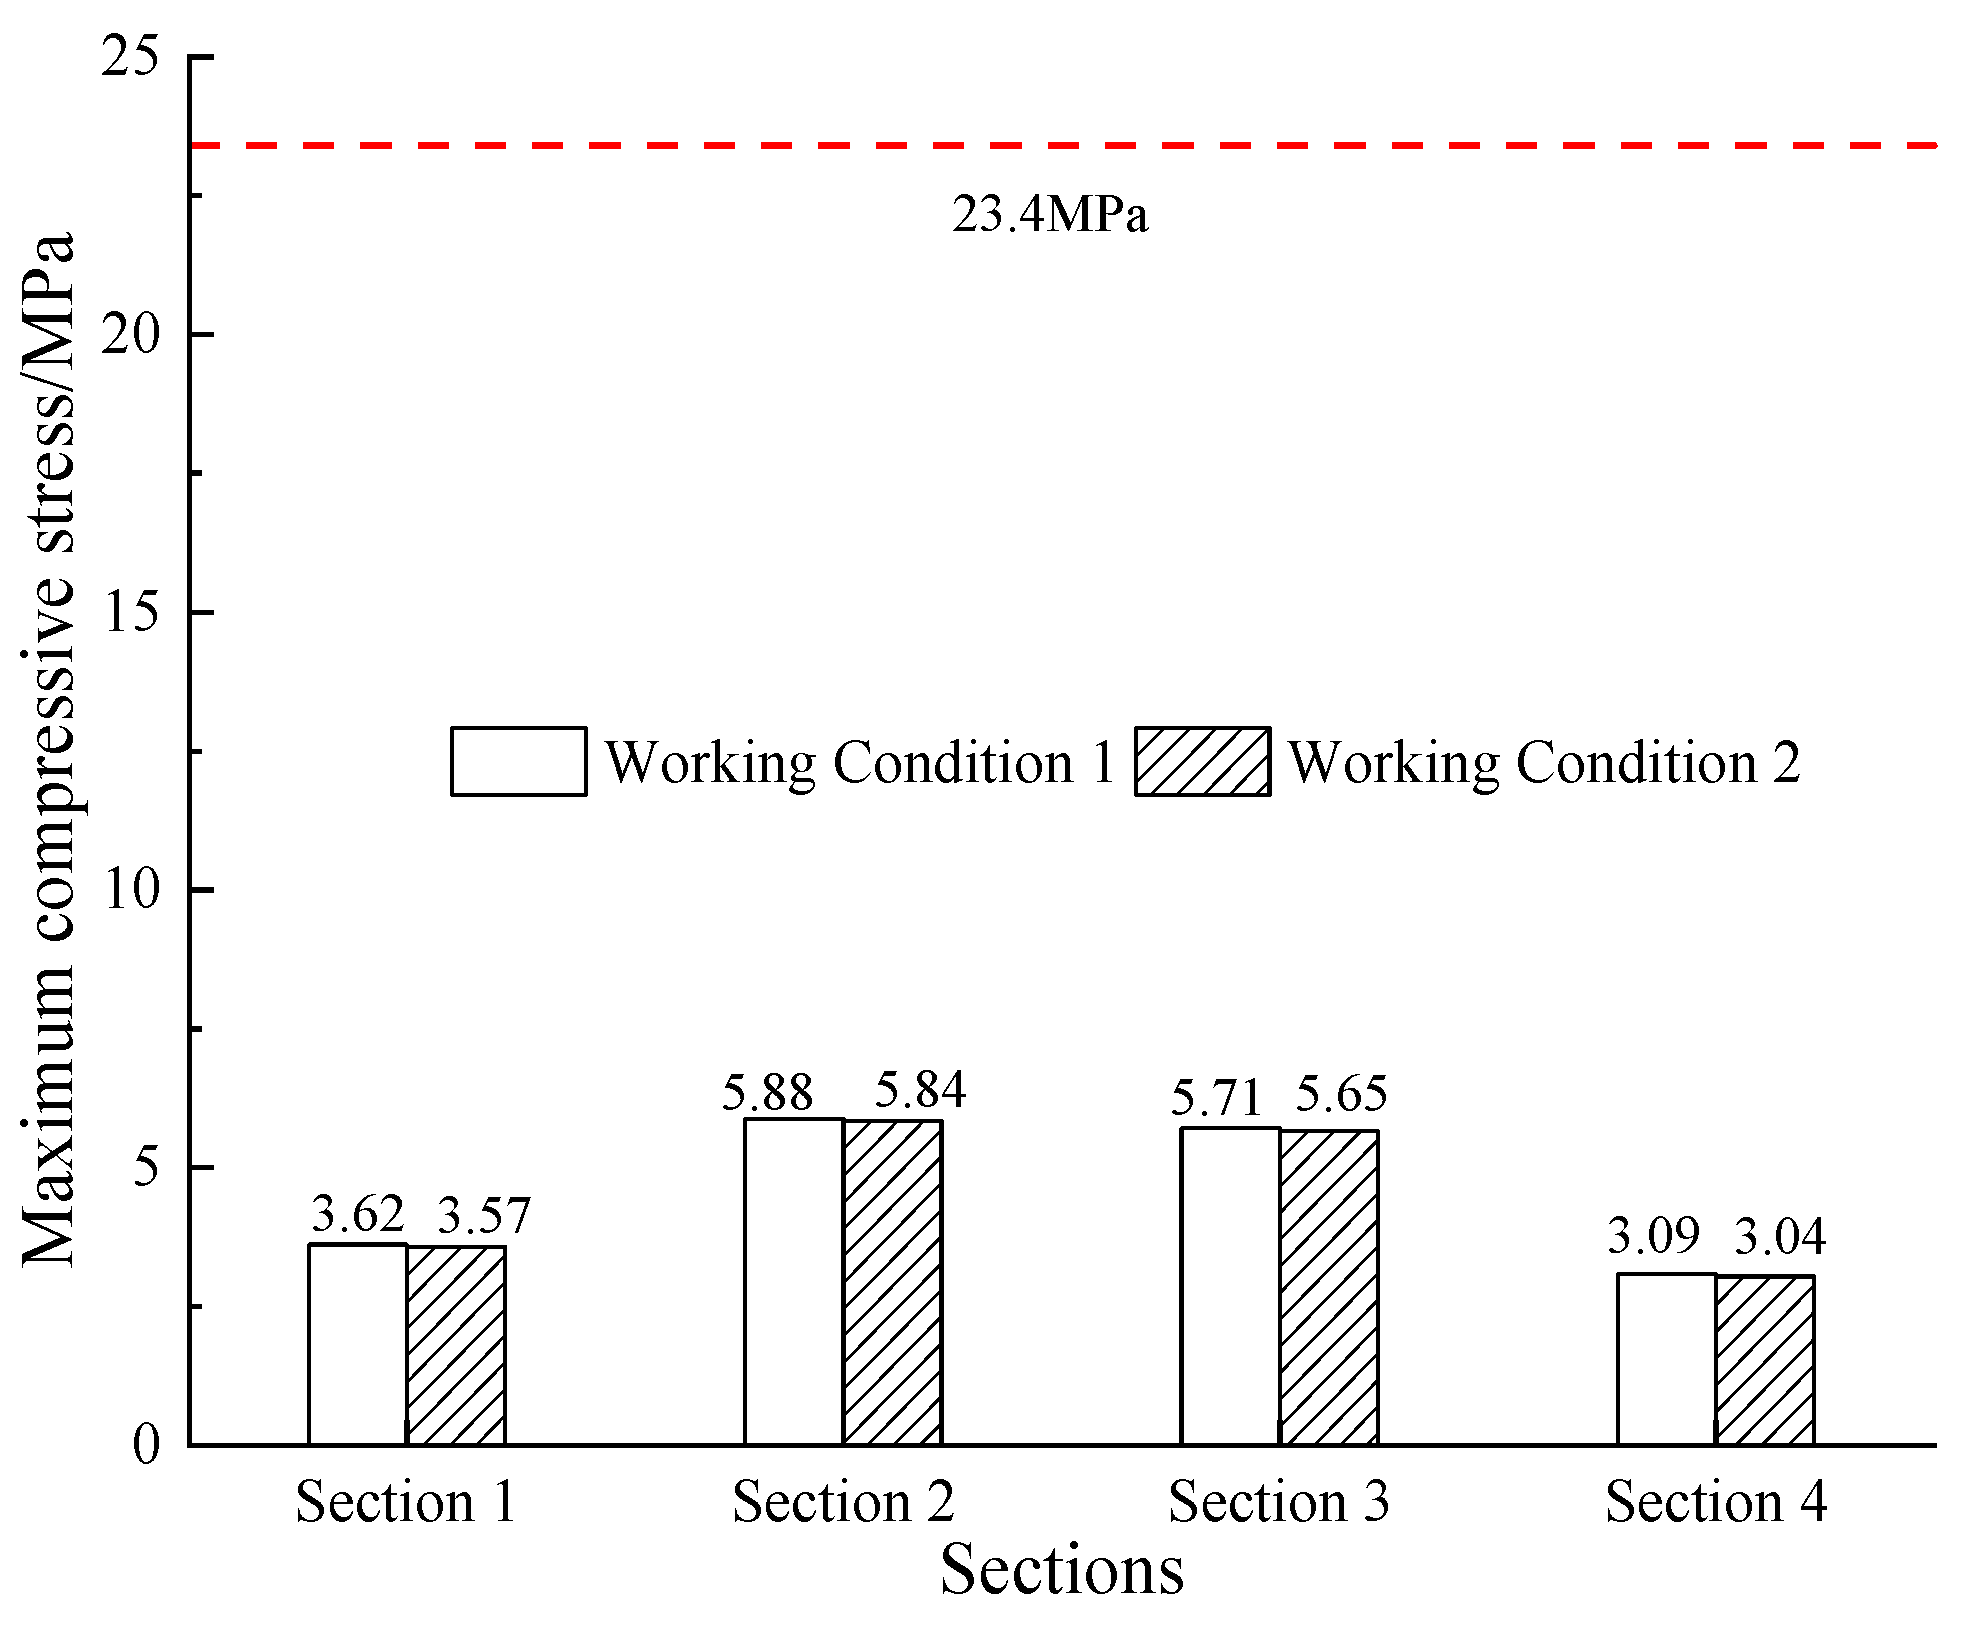
3.2.1. Stress Distribution

Due to the excavation, primary support, and secondary lining construction of the upper tunnel, the stress state of the lower tunnel structure will change accordingly [2]. Figure 8, Figure 9, Figure 10 and Figure 11 show the stress calculation of the secondary lining for each section in working condition 11 and working condition 12, respectively. As a result, a positive value indicates tension and a negative value indicates compression.
Based on the stress analysis results, it is evident that the construction of the upper tunnel has caused significant changes in the stress state of the lower tunnel structure. The majority of the secondary lining in the lower tunnel is under compression, with the maximum tensile stress appearing near the left and right arch waists. Additionally, it is observed that the maximum tensile stress value in working condition 1 is higher than that in working condition 2 for each section, indicating that closing the upper tunnel as soon as possible to form a ring can help improve the stress state of the lower tunnel.

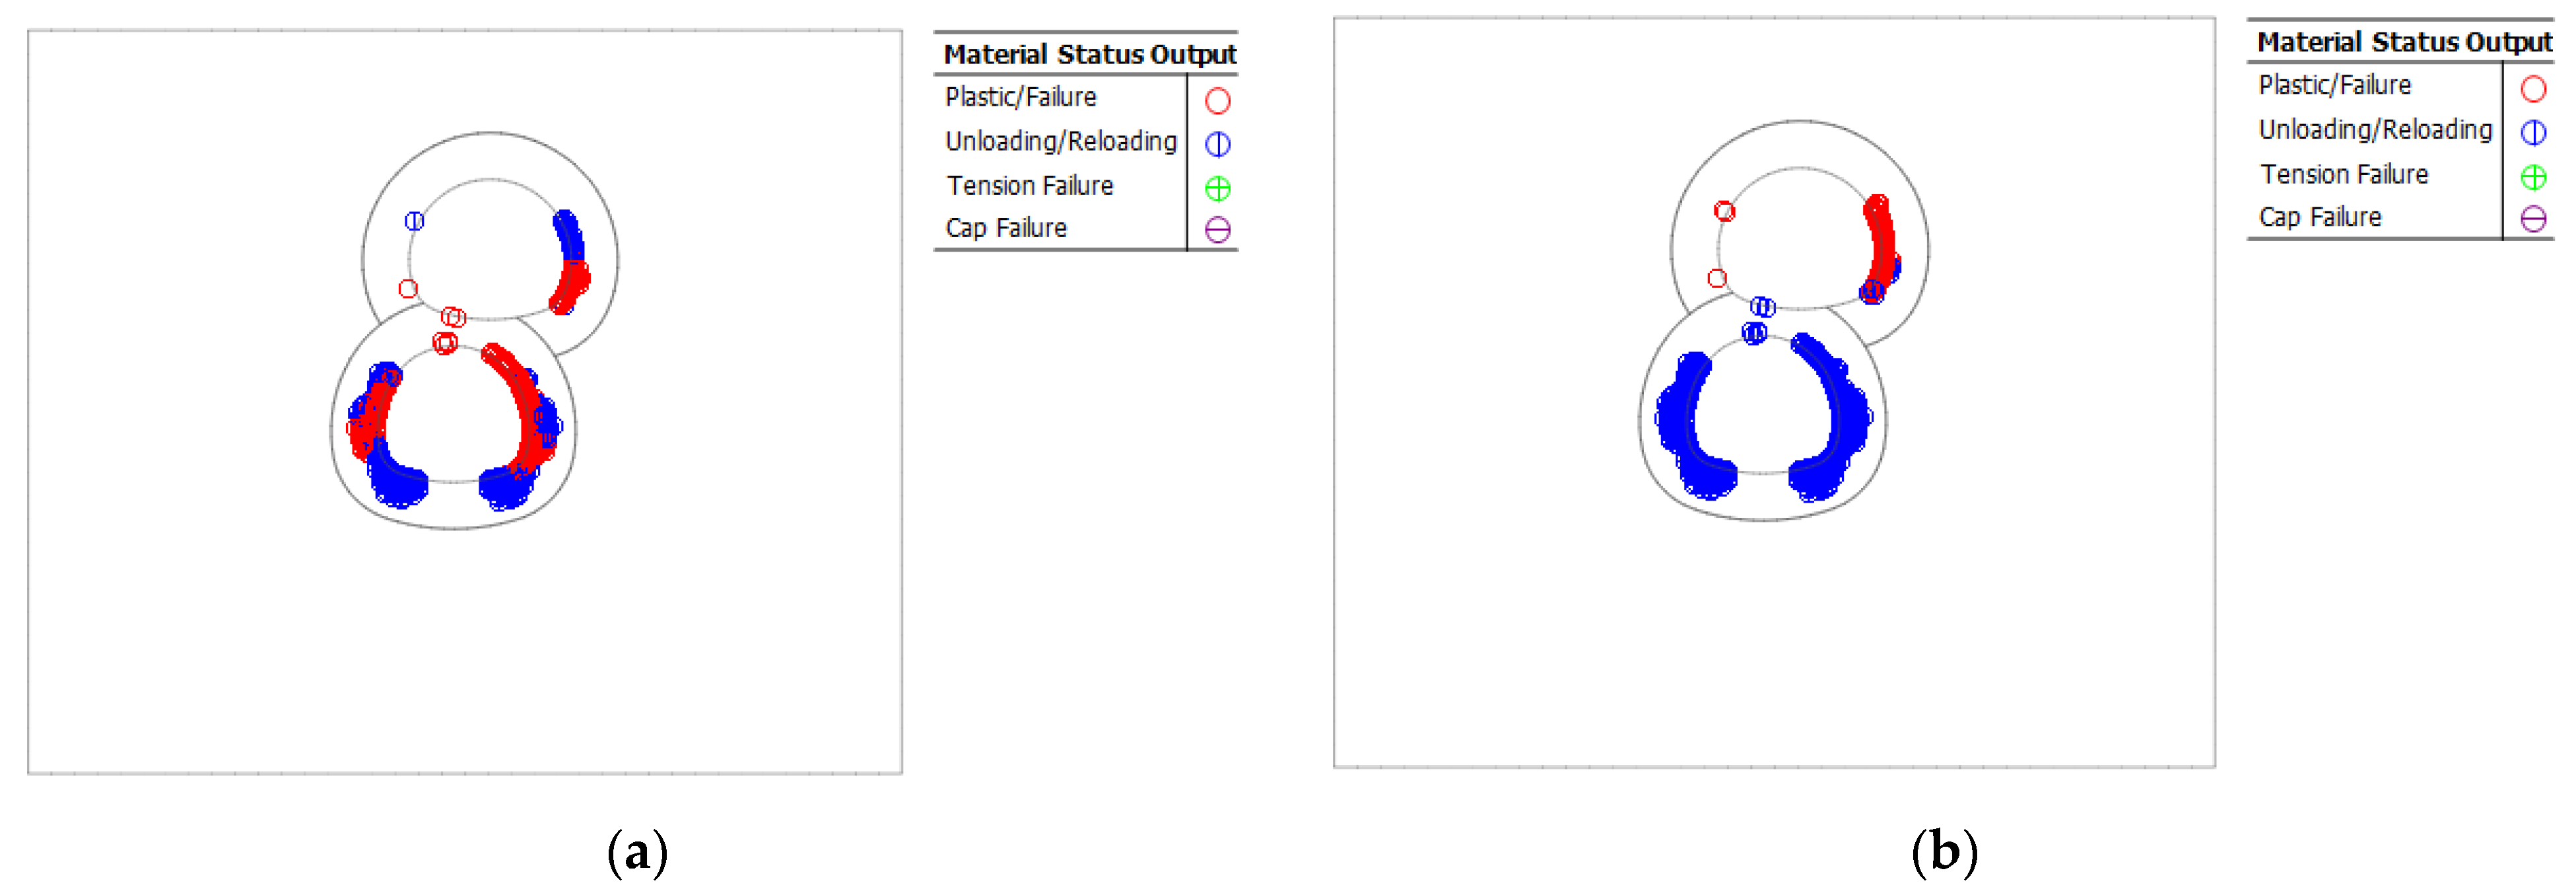
3.2.2. Plastic Zone Distribution

Figure 12, Figure 13, Figure 14 and Figure 15 present the distribution of the plastic zone of the secondary lining during the upper tunnel excavation process. The figures reveal several distinctive patterns in the distribution of the plastic zone. The plastic zone is predominantly located on both sides of the arch waist of the lower tunnel, and the extent of the plastic zone on the right side is greater than that on the left side. A comparison between working condition 11 and working condition 12 indicates that the secondary lining of the upper tunnel can be closed into a ring after completion, resulting in the restoration of most of the plastic zone of the lower tunnel structure to an elastic state. This implies that the surrounding rock stress is redistributed, leading to an improvement in the stress state of the lower tunnel.
As the horizontal distance between the upper and lower tunnels decreases, the distribution of the plastic zone gradually changes from a predominantly larger distribution on the right side of the arch waist to an equal distribution on both sides, exhibiting apparent symmetry.

4. Discussion

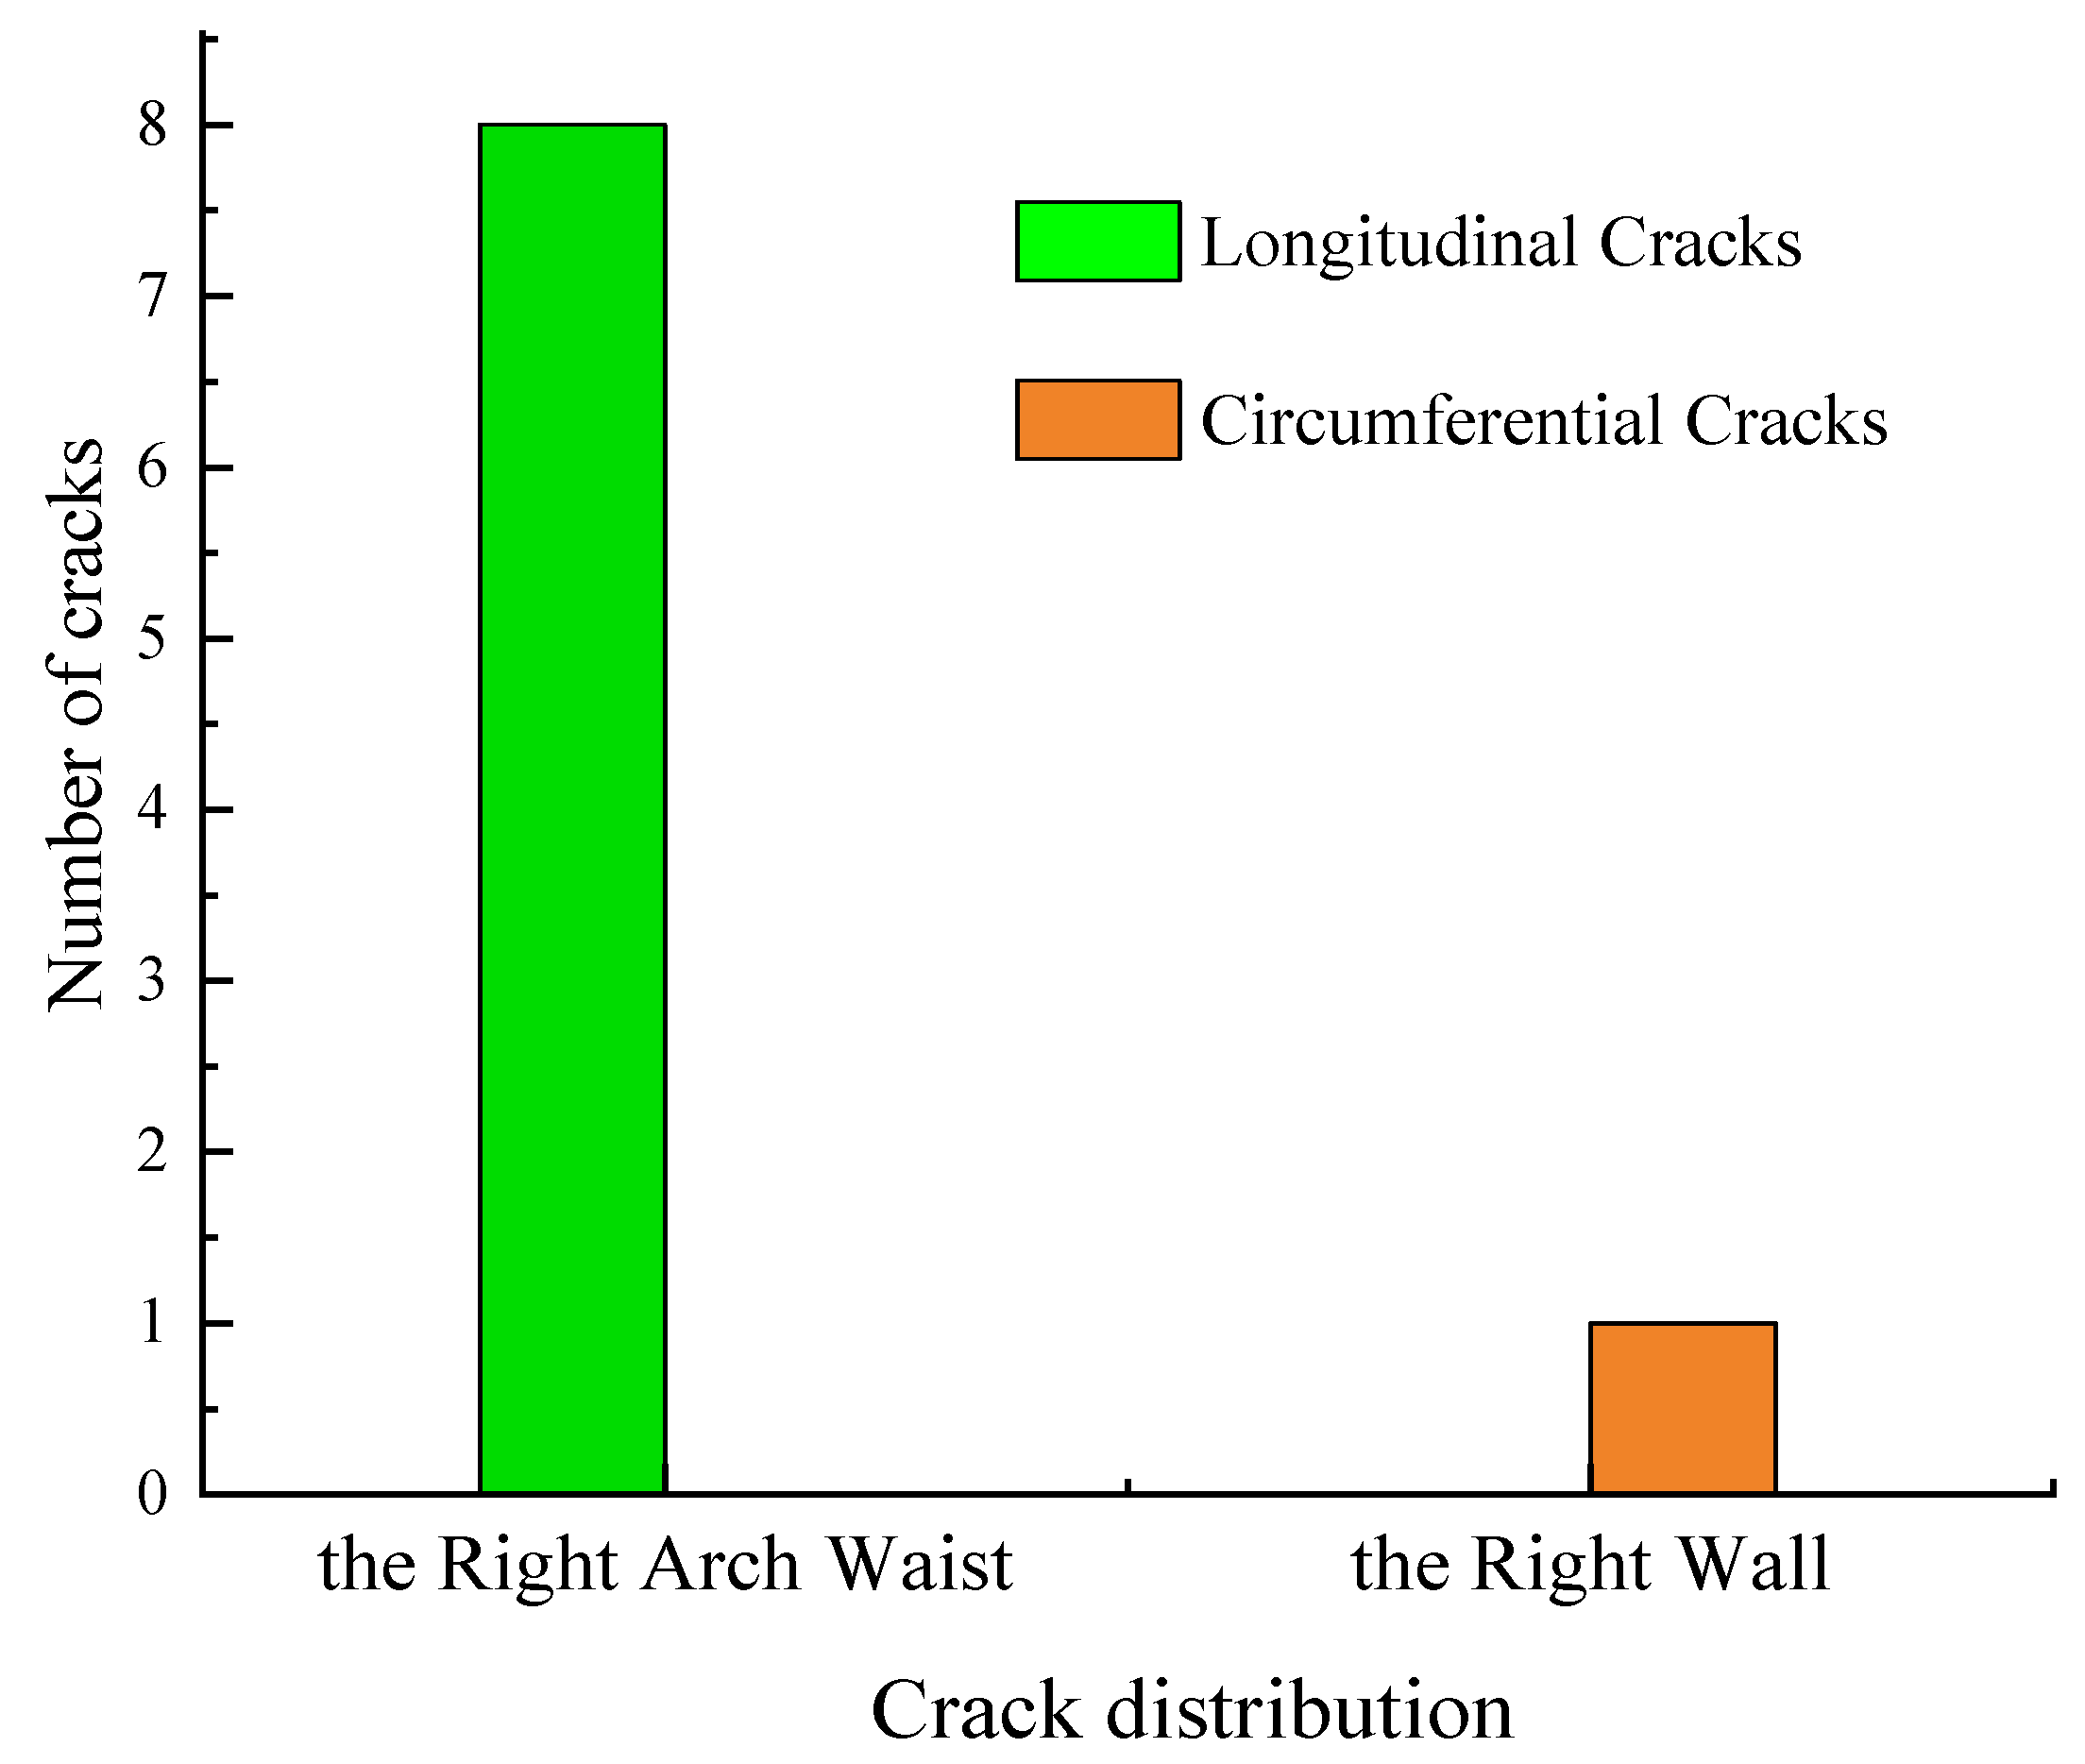
4.1. Statistics on the on-Site Distribution of Cracks

Table 6 and Figure 16 present the analysis of crack types and distribution positions. Longitudinal cracks accounted for the majority of the cracks with a percentage of 88.89%, while circumferential cracks accounted for only 11.11%. The longitudinal cracks were mainly concentrated on the right arch waist, while the circumferential cracks were distributed on the right wall.

4.2. Discussions on the Theoretical Causes and Distribution of Cracks

Figure 17 and Figure 18 present a comparison between the maximum tensile and compressive stress of the secondary lining of the lower tunnel and the standard value of concrete’s tensile and compressive strength. The results indicate that the unloading effect of the upper tunnel excavation results in a change in the structural stress of the lower tunnel. This change causes the maximum tensile stress of the secondary lining of the lower tunnel to exceed the standard value of the concrete tensile strength. As a result, the rock mass at the arch waist enters a plastic state, leading to the formation of cracks in the secondary lining.
Figure 17 further highlights that section 2 has the highest maximum tensile stress value among all the sections. This finding indicates that the unloading of the upper tunnel near this specific mileage has the most significant impact on the surrounding rock of the lower tunnel, causing the most noticeable trend of concentrated distribution of cracks. Moreover, the maximum tensile stress corresponds to working condition 11, wherein the temporary cross bracing of the upper tunnel has not been removed, and the secondary lining has not yet formed a ring. Therefore, this suggests that the lower tunnel is most prone to cracks during this phase.
In addition, Figure 19 demonstrates that, except for section 3, the maximum tensile stress occurs at the right arch waist, suggesting a higher risk of crack formation near the right arch waist. Conversely, the maximum tensile stress of section 3 occurs at the left arch waist. Additionally, the maximum tensile stress at sections 2 to 4 is relatively high, implying that cracks may develop at both the left and right arch waists of sections 2 to 4.
After comparing the on-site monitoring feedback and the lining crack situation with Figure 15 and Figure 19, it can be concluded that the theoretical distribution law of cracks in time and space is consistent with the existing crack distribution law. This indicates that the theoretical analysis is reliable and can be used to guide the design and construction of similar tunnel projects in the future.

4.3. Suggestions on Cracks in the Secondary Lining

4.3.1. Tunnel Crack Treatment Measures

Effective treatment of tunnel cracks can be approached from three main perspectives: strengthening the lining’s strength, improving the stability of the surrounding rock, and implementing long-term monitoring and early warning. Appropriate solutions and monitoring requirements have been suggested based on the relevant specifications for different parts of the tunnel with varying densities of cracks. Crack width is classified as hairy (less than 0.3 mm) or small (between 0.3 mm and 2 mm), and recommended treatment measures for these types of cracks involve strengthening daily monitoring and implementing long-term monitoring without treatment. Surface smearing is commonly used for cracks less than 0.5 mm in width for surface repair. When it comes to crack depth, it should not exceed 25% (16 cm) of the lining thickness. Grouting can be used for plugging, without the need for structural reinforcement. For crack length, continuous cracks exceeding 6 m in length require reinforcement with bolts.

4.3.2. Suggestions for the Treatment of Cracks in the Lower Tunnel

The crack length in the lower tunnel of Jigongzui is 12 m, with a crack width ranging from 0.2 to 0.4 mm, and a crack depth between 7.7 and 12.5 cm. Considering the dimensions of the cracks, the method of using bolt reinforcement to improve the stability of the surrounding rock is not prioritized in order to protect the waterproof layer of the tunnel. Therefore, the following measures are recommended.
For areas where longitudinal cracks are not densely distributed, Figure 20 shows the treatment measures. Firstly, a groove with a depth and width of 15 cm × 8 cm should be drilled along the crack, and the groove should be cleared. Secondly, the groove should be filled with high-strength expansion mortar with a thickness of 13 cm, and a grouting nozzle should be pre-buried every 60 cm along the groove. To ensure the effectiveness of the grouting, the grouting nozzle must be at the bottom of the chiseled groove. Thirdly, after the high-strength expansion mortar has solidified, the pre-prepared slurry (epoxy resin: dibutyl: ethylenediamine: talc = 1:1.2:0.7:0.8) should be injected into the grouting tip until it is full. Finally, after the grouting is completed, the remaining groove surface should be smoothed with color mortar to a thickness of 2 cm.
To ensure the protection of the waterproof layer in the lower tunnel of Jigongzui, the recommended treatment measures for the cracks, with a length of approximately 12 m, a width ranging from 0.2 to 0.4 mm, and a depth varying from 7.7 to 12.5 cm, prioritize the use of high-strength expansion mortar and epoxy resin slurry injection instead of bolt reinforcement to improve the stability of the surrounding rock. For areas with longitudinal cracks that are not densely distributed, a 15 cm × 8 cm groove is drilled along the crack, and a grouting nozzle is pre-buried every 60 cm. The groove is filled with high-strength expansion mortar and the pre-prepared slurry is injected into the grouting tip. In areas where the local longitudinal cracks are relatively dense, Φ25 mm resin anchor rods are laid on both sides of the crack, with a longitudinal spacing of 3 m, and a water-stop device and backing plate are installed at the end of the anchor rod.
Additionally, strengthening the monitoring and long-term monitoring of the cracks’ length, width, and depth, with a focus on section 2, where the cracks are concentrated, is recommended. It is important to classify the cracks and provide early warning in a timely manner [26].

4.4. Limitations and Future Work

Based on the assumptions made, the present simulation only considers the impact of mechanical factors and does not account for the influence of groundwater. The inclusion of groundwater effects would provide a more accurate estimate of settlement results. Additionally, due to the limitations of computing resources, a plane strain model was employed for the numerical simulation calculation model instead of a three-dimensional one. With improved computational efficiency, a three-dimensional calculation model could be developed to study the distribution of cracks in the tunnel’s three-dimensional space, allowing for more precise identification of the areas where cracks may arise.

5. Conclusions

The present study focuses on the analysis of the causes and distribution of cracks in overlapping railway tunnels using finite element numerical simulation. The main findings of this study are as follows.
(1) The construction of the upper tunnel leads to a significant unloading effect on the lower tunnel, causing the redistribution of surrounding rock pressure. The maximum tensile stress of the secondary lining of the lower tunnel exceeds the standard value of the tensile strength of C35 concrete, which is the primary cause of longitudinal cracks in the tunnel lining structure.
(2) Both left and right arch waists are prone to longitudinal cracks, with a higher risk of cracking at the right arch waist than the left arch.
(3) The unloading effect of the upper tunnel has the most significant impact on the lower tunnel in the vicinity of section 2.
(4) The unloading of the upper tunnel is most apparent before the removal of the temporary bracing and construction of the secondary lining. Thus, accelerating the completion of the secondary lining construction can reduce the possibility of cracks in the lower tunnel.
(5) This study recommends chiseling and grouting to improve the strength of the secondary lining in the area where the longitudinal cracks are not very dense. However, resin anchor rods with saddle joints are recommended in relatively dense areas to enhance the stability of the surrounding rock. This study also emphasizes the importance of long-term monitoring, classification, and early warning of cracks to ensure the safety of the tunnel.

Author Contributions

Conceptualization, J.X. and Q.X.; software, Z.T.; validation, formal analysis, J.X.; investigation, J.X. and F.Z.; resources, Q.X.; data curation, Q.X., F.Z. and Z.T.; writing—original draft preparation, J.X., Q.X. and F.Z.; writing—review and editing, J.X., Q.X. and Z.T.; project administration, Q.X.; funding acquisition, Q.X. All authors have read and agreed to the published version of the manuscript.

Funding

This research was funded by Key project of the National Natural Science Foundation of China (41130751).

Institutional Review Board Statement

Not applicable.

Informed Consent Statement

Not applicable.

Data Availability Statement

Not applicable.

Conflicts of Interest

The authors declare no conflict of interest.

References

  1. Tonon, F. Sequential excavation, NATM and ADECO: What they have in common and how they differ. Tunn. Undergr. Space Technol. 2010, 25, 245–265. [Google Scholar] [CrossRef]
  2. Xu, G.; He, C.; Chen, Z.; Liu, C.; Wang, B.; Zou, Y. Mechanical behavior of secondary tunnel lining with longitudinal crack. Eng. Fail. Anal. 2020, 113, 104543. [Google Scholar] [CrossRef]
  3. Zhu, C.; Karakus, M.; He, M.; Meng, Q.; Shang, J.; Wang, Y.; Yin, Q. Volumetric deformation and damage evolution of Tibet interbedded skarn under multistage constant-amplitude-cyclic loading. Int. J. Rock Mech. Min. Sci. 2022, 152, 105066. [Google Scholar] [CrossRef]
  4. Lai, J.; Qiu, J.; Fan, H.; Chen, J.; Hu, Z.; Zhang, Q.; Wang, J. Structural Safety Assessment of Existing Multiarch Tunnel: A Case Study. Adv. Mater. Sci. Eng. 2017, 2017, 1697041. [Google Scholar] [CrossRef]
  5. Yang, F.; Zhang, C.; Zhou, H.; Liu, N.; Zhang, Y.; Azhar, M.U.; Dai, F. The long-term safety of a deeply buried soft rock tunnel lining under inside-to-outside seepage conditions. Tunn. Undergr. Space Technol. 2017, 67, 132–146. [Google Scholar] [CrossRef]
  6. Fang, Y.; Guo, J.; Grasmick, J.; Mooney, M. The effect of external water pressure on the liner behavior of large cross-section tunnels. Tunn. Undergr. Space Technol. 2016, 60, 80–95. [Google Scholar] [CrossRef]
  7. Xu, Q.; Zhang, L.; Zhu, H.; Gong, Z.; Liu, J.; Zhu, Y. Laboratory tests on conditioning the sandy cobble soil for EPB shield tunnelling and its field application. Tunn. Undergr. Space Technol. 2020, 105, 103512. [Google Scholar] [CrossRef]
  8. Yun, H.-B.; Park, S.-H.; Mehdawi, N.; Mokhtari, S.; Chopra, M.; Reddi, L.N.; Park, K.-T. Monitoring for close proximity tunneling effects on an existing tunnel using principal component analysis technique with limited sensor data. Tunn. Undergr. Space Technol. 2014, 43, 398–412. [Google Scholar] [CrossRef]
  9. Zhang, Z.; Huang, M. Geotechnical influence on existing subway tunnels induced by multiline tunneling in Shanghai soft soil. Comput. Geotech. 2014, 56, 121–132. [Google Scholar] [CrossRef]
  10. Liang, Q.; Li, J.; Li, D.; Ou, E. Effect of Blast-Induced Vibration from New Railway Tunnel on Existing Adjacent Railway Tunnel in Xinjiang, China. Rock Mech. Rock Eng. 2013, 46, 19–39. [Google Scholar] [CrossRef]
  11. Ukritchon, B.; Yingchaloenkitkhajorn, K.; Keawsawasvong, S. Three-dimensional undrained tunnel face stability in clay with a linearly increasing shear strength with depth. Comput. Geotech. 2017, 88, 146–151. [Google Scholar] [CrossRef]
  12. Zhou, X.; Wang, J.; Lin, B. Study on calculation of rock pressure for ultra-shallow tunnel in poor surrounding rock and its tunneling procedure. J. Mod. Transp. 2014, 22, 1–11. [Google Scholar] [CrossRef]
  13. Xiao, J.Z.; Dai, F.C.; Wei, Y.Q.; Xing, Y.C.; Cai, H.; Xu, C. Analysis of mechanical behavior in a pipe roof during excavation of a shallow bias tunnel in loose deposits. Environ. Earth Sci. 2016, 75, 293. [Google Scholar] [CrossRef]
  14. Yang, C.; Hu, Z.; Huang, D.; Guo, F. Failure Mechanism of Primary Support for a Shallow and Asymmetrically Loaded Tunnel Portal and Treatment Measures. J. Perform. Constr. Facil. 2020, 34, 04019105. [Google Scholar] [CrossRef]
  15. Kong, C.; Gao, X.; Cao, L.; Liu, K. Analysis of the failure of primary support of a deep-buried railway tunnel in silty clay. Eng. Fail. Anal. 2016, 66, 259–273. [Google Scholar] [CrossRef]
  16. Yang, C.; Zhang, Y.-X.; Huang, D.; Zhu, Q. Deformation Behavior of Topographic Unsymmetrical Loaded Tunnels and Their Pre-Reinforcements after Excavation. J. Highw. Transp. Res. Dev. 2013, 7, 69–75. [Google Scholar] [CrossRef]
  17. Zhou, Y.-Y.; Feng, X.-T.; Xu, D.-P.; Fan, Q.-X. An enhanced equivalent continuum model for layered rock mass incorporating bedding structure and stress dependence. Int. J. Rock Mech. Min. Sci. 2017, 97, 75–98. [Google Scholar] [CrossRef]
  18. Simanjuntak, T.; Marence, M.; Mynett, A.; Schleiss, A. Pressure tunnels in non-uniform in situ stress conditions. Tunn. Undergr. Space Technol. 2014, 42, 227–236. [Google Scholar] [CrossRef]
  19. Lei, M.; Peng, L.; Shi, C. Model test to investigate the failure mechanisms and lining stress characteristics of shallow buried tunnels under unsymmetrical loading. Tunn. Undergr. Space Technol. 2015, 46, 64–75. [Google Scholar] [CrossRef]
  20. Rosso, M.M.; Marasco, G.; Aiello, S.; Aloisio, A.; Chiaia, B.; Marano, G.C. Convolutional networks and transformers for intelligent road tunnel investigations. Comput. Struct. 2023, 275, 106918. [Google Scholar] [CrossRef]
  21. Marano, G.C.; Rosso, M.M.; Aloisio, A.; Cirrincione, G. Generative adversarial networks review in earthquake-related engineering fields. Bull. Earthq. Eng. 2023, 1–52. [Google Scholar] [CrossRef]
  22. Ngamkhanong, C.; Keawsawasvong, S.; Jearsiripongkul, T.; Cabangon, L.T.; Payan, M.; Sangjinda, K.; Banyong, R.; Thongchom, C. Data-Driven Prediction of Stability of Rock Tunnel Heading: An Application of Machine Learning Models. Infrastructures 2022, 7, 148. [Google Scholar] [CrossRef]
  23. Yuan, F.; Liu, Y.; Xu, Q.; Zheng, Y.; Hu, L.; Zhao, P.; Cui, Y. Study on Mechanical Characteristics and Construction Control of the Railway Overlapping Tunnels. Front. Earth Sci. 2022, 10, 721. [Google Scholar] [CrossRef]
  24. Li, G.; Zhu, C.; He, M.; Zuo, Y.; Gong, F.; Xue, Y.; Feng, G. Intelligent method for parameters optimization of cable in soft rock tunnel base on longitudinal wave velocity. Tunn. Undergr. Space Technol. 2023, 133, 104905. [Google Scholar] [CrossRef]
  25. Ren, F.; Zhu, C.; He, M.; Shang, J.; Feng, G.; Bai, J. Characteristics and Precursor of Static and Dynamic Triggered Rockburst: Insight from Multifractal. Rock Mech. Rock Eng. 2023, 56, 1945–1967. [Google Scholar] [CrossRef]
  26. Qu, Z.; Chen, S.Q.; Liu, Y.Q.; Liu, L. Linear seam elimination of tunnel crack images based on statistical specific pixels ratio and adaptive fragmented segmentation. IEEE Trans. Intell. Transp. Syst. 2020, 21, 3599–3607. [Google Scholar] [CrossRef]
Figure 1. Geometric layout of the tunnel; (a) longitudinal section of upper and lower tunnels; (b) cross-section of DK63 + 800 (unit: m).
Applsci 13 06436 g001
Figure 2. Tunnel excavation construction sequence.
Applsci 13 06436 g002
Figure 3. Four calculation sections (unit: m). (a) Section 1, (b) Section 2, (c) Section 3, and (d) Section 4.
Applsci 13 06436 g003
Figure 4. Two-dimensional finite element model.
Applsci 13 06436 g004
Figure 5. Secondary lining and equivalent anchor reinforcement area.
Applsci 13 06436 g005
Figure 6. Photograph of longitudinal cracks on the right arch waist.
Applsci 13 06436 g006
Figure 7. Photograph of longitudinal cracks on both sides.
Applsci 13 06436 g007
Figure 8. Stress distributions of secondary lining at different construction steps for section 1. (a) Maximum principal stress of working condition 11, (b) minimum principal stress of working condition 11, (c) maximum principal stress of working condition 12, and (d) minimum principal stress of working condition 12.
Applsci 13 06436 g008
Figure 9. Stress distributions of secondary lining at different construction steps for section 2. (a) Maximum principal stress of working condition 11, (b) minimum principal stress of working condition 11, (c) maximum principal stress of working condition 12, and (d) minimum principal stress of working condition 12.
Applsci 13 06436 g009aApplsci 13 06436 g009b
Figure 10. Stress distributions of secondary lining at different construction steps for section 3. (a) Maximum principal stress of working condition 11, (b) minimum principal stress of working condition 11, (c) maximum principal stress of working condition 12, and (d) minimum principal stress of working condition 12.
Applsci 13 06436 g010
Figure 11. Stress distributions of secondary lining at different construction steps for section 4. (a) Maximum principal stress of working condition 11, (b) minimum principal stress of working condition 11, (c) maximum principal stress of working condition 12, and (d) minimum principal stress of working condition 12.
Applsci 13 06436 g011
Figure 12. Distributions of the plastic zone for different construction steps for section 1. (a) Working condition 11; (b) working condition 12.
Applsci 13 06436 g012
Figure 13. Distributions of the plastic zone for different construction steps for section 2. (a) Working condition 11; (b) working condition 12.
Applsci 13 06436 g013
Figure 14. Distributions of the plastic zone for different construction steps for section 3. (a) Working condition 11; (b) working condition 12.
Applsci 13 06436 g014
Figure 15. Distributions of the plastic zone for different construction steps for section 4. (a) Working condition 11; (b) working condition 12.
Applsci 13 06436 g015
Figure 16. Statistics of crack distribution position.
Applsci 13 06436 g016
Figure 17. The maximum tensile stress of each section.
Applsci 13 06436 g017
Figure 18. The maximum compressive stress of each section.
Applsci 13 06436 g018
Figure 19. The maximum tensile stress conditions and distribution locations.
Applsci 13 06436 g019
Figure 20. Treatment measures for areas where longitudinal cracks are not densely distributed.
Applsci 13 06436 g020
Table 1. Information of each calculation section.
CategorySection 1Section 2Section 3Section 4
MileageDK63 + 900DK63 + 950DK64 + 000DK64 + 050
Buried depth of upper tunnel (m)12.826.625.88.3
The vertical distance between upper and lower tunnels (m)2.252.282.282.31
The horizontal distance between upper and lower tunnels (m)3.161.460.40.05
Table 2. Model size for each calculation section.
CategorySection 1Section 2Section 3Section 4
MileageDK63 + 900DK63 + 950DK64 + 000DK64 + 050
Length of the model (m)75757575
Height of the model (m)65807560
Table 3. Physical and mechanical parameters of model materials.
Material NameGravity
(kN/m3)
Poisson RatioCohesion
(kPa)
Internal Friction Angle
(°)
Deformation Modulus
(GPa)
Grade V surrounding rock260.4216024.51.65
Bolt reinforcement area28.60.42176.027.01.8
C25 concrete250.2//28
C35 concrete250.2//31.5
Steel78.50.25//200
Table 4. A brief description of tunnel simulated construction processes.
Working
Condition
Construction ContentRemarks
1Initial ground stressActivating of all soil elements and application of boundary conditions and gravity loads.
2Displacement clearing/
3Construction of the lower tunnelExcavating the hole ①, spraying the area with mix and anchors and constructing temporary cross bracing.
4Construction of the lower tunnelExcavating the cave ②, spraying the area with the mix, and anchoring the rods.
5Construction of the lower tunnelExcavating the cave ③, spraying the area with the mix, and anchoring the rods.
6Construction of the lower tunnelExcavating the cave ④, spraying the area with the mix, and anchoring the rods.
7Construction of the lower tunnelConstruction of secondary lining and removal of temporary cross bracings.
8Construction of the upper tunnelExcavating the cave ①, spraying the area with the mix, and anchoring the rods.
9Construction of the upper tunnelExcavating the cave ②, spraying the area with the mix, and anchoring the rods.
10Construction of the upper tunnelExcavating the cave ③, spraying the area with the mix, and anchoring the rods.
11Construction of the upper tunnelExcavating the cave ④, spraying the area with the mix, and anchoring the rods.
12Construction of the upper tunnelConstruction of secondary lining and removal of temporary cross bracings.
Table 5. A summary of crack conditions.
MileageCrack Length (m)Crack Width (mm)Maximum Crack Depth (cm)Crack Type
DK63 + 905120.311.8Longitudinal direction
DK63 + 905120.27.7Longitudinal direction
DK63 + 932120.39Longitudinal direction
DK63 + 933120.310.9Longitudinal direction
DK63 + 936120.411.9Longitudinal direction
DK63 + 934.5120.212.5Longitudinal direction
DK63 + 934.5120.311.2Longitudinal direction
DK64 + 14020.37.8Circumferential direction
DK64 + 026120.38.4Longitudinal direction
Table 6. Crack statistical analysis results.
Crack TypeProportion/Number of ArticlesLocationProportion/Number of
Articles
Longitudinal88.89%/8Right arch waist100%/8
Circumferential11.11%/1Right side wall100%/1
Disclaimer/Publisher’s Note: The statements, opinions and data contained in all publications are solely those of the individual author(s) and contributor(s) and not of MDPI and/or the editor(s). MDPI and/or the editor(s) disclaim responsibility for any injury to people or property resulting from any ideas, methods, instructions or products referred to in the content.

