Article

Air Quality Improvement in Urban Street Canyons: An Assessment of the Effects of Selected Traffic Management Strategies Using OSPM Model

Department of Environmental Management and Protection, Faculty of Geo-data Science, Geodesy and Environmental Engineering, AGH University of Science and Technology, Mickiewicza 30 Av., 30-059 Krakow, Poland
*
Author to whom correspondence should be addressed.
Appl. Sci. 2023, 13(11), 6431; https://doi.org/10.3390/app13116431
Submission received: 1 April 2023 / Revised: 12 May 2023 / Accepted: 22 May 2023 / Published: 24 May 2023
(This article belongs to the Special Issue Short- and Long-Term Air Pollution Analysis, Modeling and Prediction)

Abstract

:

Featured Application

The results presented in the article can be used to optimize activities in the field of road traffic management to improve air quality in urban street canyons.

Abstract

Constantly changing vehicle stock, modification of road infrastructure, and other conditions result in a need to update the knowledge on the effectiveness of individual traffic management strategies, which could form the basis for actions taken by local authorities to improve air quality in crowded city centers, especially in street canyons. The article presents research results that evaluate the theoretical effects of introducing select traffic reorganization scenarios in the example of four street canyons located in Krakow (Poland) that are different in terms of vehicle traffic volume and canyon geometry. These scenarios were based on a reduction in the average traffic speed, road capacity or the admission of cars meeting certain exhaust emission standards. The authors estimated changes in emissions of nitrogen oxides (NO, NO2 and total NOx) and particulate matter (PM10 and PM2.5) as well as investigated the effect of these changes on air quality in the canyons using the Operational Street Pollution Model (OSPM). Significant effects in terms of improving air quality were identified only in scenarios based on a significant reduction in traffic volume and the elimination of passenger cars and light commercial vehicles with internal combustion engines that did not meet the requirements of the Euro 4, Euro 5 or Euro 6 emission standards. For these scenarios, depending on the variant and canyon analyzed, the emission reduction was achieved at a level of approximately 36–66% for NO, 28–77% for NO2, 35–67% for NOx and 44–78% for both PM10 and PM2.5. The expected effect of improving air quality in individual street canyons for these substances was 15–44%, 5–14%, 11–36% and 3–14%, respectively. The differences obtained in the percentage reduction of emissions and pollutant concentrations in the air were the result of a relatively high background of pollutants that suppress the achieved effect of improving air quality to a large extent.

1. Introduction

Air quality in large cities is determined by the cumulative impact of many sources of emission, among which, road transport is usually of great importance, especially in areas where air emissions from other sources have already been significantly reduced. The direct effect of road traffic emissions is the increase in the concentration of some air pollutants in the vicinity of communication routes, mainly nitrogen oxides (NOx) and particulate matter (PM10 and PM2.5 fractions), which is confirmed by the results of measurements recorded at communication air quality monitoring stations relative to urban background stations [1,2,3,4,5]. Street canyons with high traffic volume and poor ventilation are particularly exposed to this type of impact [6,7,8]. Inside these canyons, air emissions occur, including the primary emission of dust and gaseous pollutants due to the movement of motor vehicles (engine emissions and abrasion of brakes, tires, road surfaces, etc.) and the secondary dust emission from the road surface [9,10,11,12]. Furthermore, in street canyons, the mixed zone of pollutants is limited by the compact pattern of buildings, resulting in a greater impact of emissions from road transport on air quality. Its volume depends not only on meteorological conditions, but also on numerous other factors, the most important of which include: the canyon geometry and its location in relation to the dominant wind directions [13,14,15], the measures applied to reduce the resuspension of the road silt [10,16,17], the presence of additional green infrastructure [18,19,20,21], as well as the type and amount of substances flowing in from neighboring areas, which can trigger chemical transformations of pollutants in the air of [22,23].
The impact of road transport on air quality can be reduced e.g., with the use of various traffic management activities [24,25,26,27,28]. Some of these measures may e.g., be aimed at reducing the volume of traffic by shifting transit traffic to ring roads, limiting the capacity of individual road sections or introducing other restrictions or improvements, but sometimes they also have a significant effect on the structure of vehicles travelling in a given area (introducing traffic ban for certain categories of vehicles and creating low-emission zones). The degree of changes in air pollutant concentrations resulting from such actions depends mainly on their type and scale of implementation, as well as on the background level of the analyzed pollutants in relation to the impact of road transport itself. Therefore, the demonstrated effects of improved air quality in the vicinity of communication routes are usually significantly lower than the level achieved in reducing air pollutant emissions from road traffic alone [24,26].
The selection of a specific traffic management strategy in terms of improving air quality in a given city should be based on the assessment of its potential effects. This could be done by estimating changes in air pollutant emissions resulting from the strategies analyzed and modeling the impact of these changes on air quality. Only after the implementation of a given strategy are the assumed environmental effects usually verified, based on the observed changes in the concentrations of pollutants in the air in the zone covered by these changes [25,29,30]. The analysis of environmental effects can also be followed by a health, economic and landscape impact assessment [31,32,33].
The purpose of this research study is to assess the effects of the expected reduction in the emissions of specific air pollutants (NOx, PM10 and PM2.5) from road transport for several hypothetical traffic management scenarios analyzed for selected street canyons of Krakow, one of the most crowded cities in Poland and in the world [34]. This assessment was carried out based on the estimated changes in the emissions of the analyzed substances for individual scenarios, and the results of the modeling of their concentrations in the air was carried out with the use of the Operational Street Pollution Model (OSPM), dedicated to street canyons [35,36,37]. The OSPM model had already been used for similar purposes, including by Mensink and Cosemans (Ghent, Belgium) [38], Ghafghazi and Hatzopoulou (Montreal, Canada) [39], Lazić et al. (Belgrade, Serbia) [40], Steinberga et al. (Riga, Latvia) [41] and Bogacki et al. (Krakow, Poland) [26].
It is also known to have been used to model air pollutant concentrations for a larger number of street canyons or the entire network of high streets in large cities. Examples of such an application of the OSPM model include studies that evaluate the effect of the European strategy to control emissions from road transport before 2030 on air quality in 20 cities located in northern and southern Europe [42], the analysis of the effect of introducing a vehicle speed limit 30 km·h−1 on the level of NO2 concentrations on one of the weekends in Munich (Germany) [43] or the influence of various traffic management strategies in Dublin (Ireland) on air quality and public health [44]. Earlier research conducted in Krakow by Bogacki et al. [26] involved assessing the influence of three traffic reorganization scenarios on air quality, considered for one of the sections of 29-Listopada Av., which is an exit route from the city center to the north, with a traffic volume of 19.5 million vehicles per year. The scenarios analyzed included: narrowing the cross section of the street by eliminating one lane in each direction (from three to two lanes), limiting the speed limit from 70 km·h−1 to 50 km·h−1 and admitting only passenger cars and light commercial vehicles meeting Euro 4 emission standards or higher.
This paper presents the results of subsequent studies assessing the impact of traffic management scenarios on air quality in street canyons in Krakow, such as reducing the number of lanes, reducing the speed limit or applying restrictions to vehicles, for four streets that are different in terms of their volume, structure, and average speed of vehicle traffic, as well as the geometry of their canyons and the location of their axes in relation to the prevailing wind directions. These studies included e.g., the Krasińskiego Av. (KRAS) street canyon, with a traffic volume of over 24 million vehicles annually, where the communication-type air quality monitoring station was located, which had already been used several times to verify the OSPM model [45,46]. The research conducted is part of a larger action aimed at selecting optimal methods to reduce emissions from road transport and further improve air quality in Krakow. Most of the already implemented and planned activities are based on reducing vehicle traffic in the city center by expanding the paid parking zone, optimizing various traffic engineering solutions, strengthening the role of public transport and promoting ecological forms of travel supported by the construction of an integrated metropolitan transport system, a network of ring roads and bicycle paths, P&R (park and ride) car parks, electric vehicle charging stations and electric bike or scooter rental system [47,48,49,50,51,52,53]. Subsequent measures will aim to introduce clean transport or low-emission zones in Krakow, of which, various scenarios are already provided in the new air quality plans for the Malopolska Province [54].

2. Materials and Methods

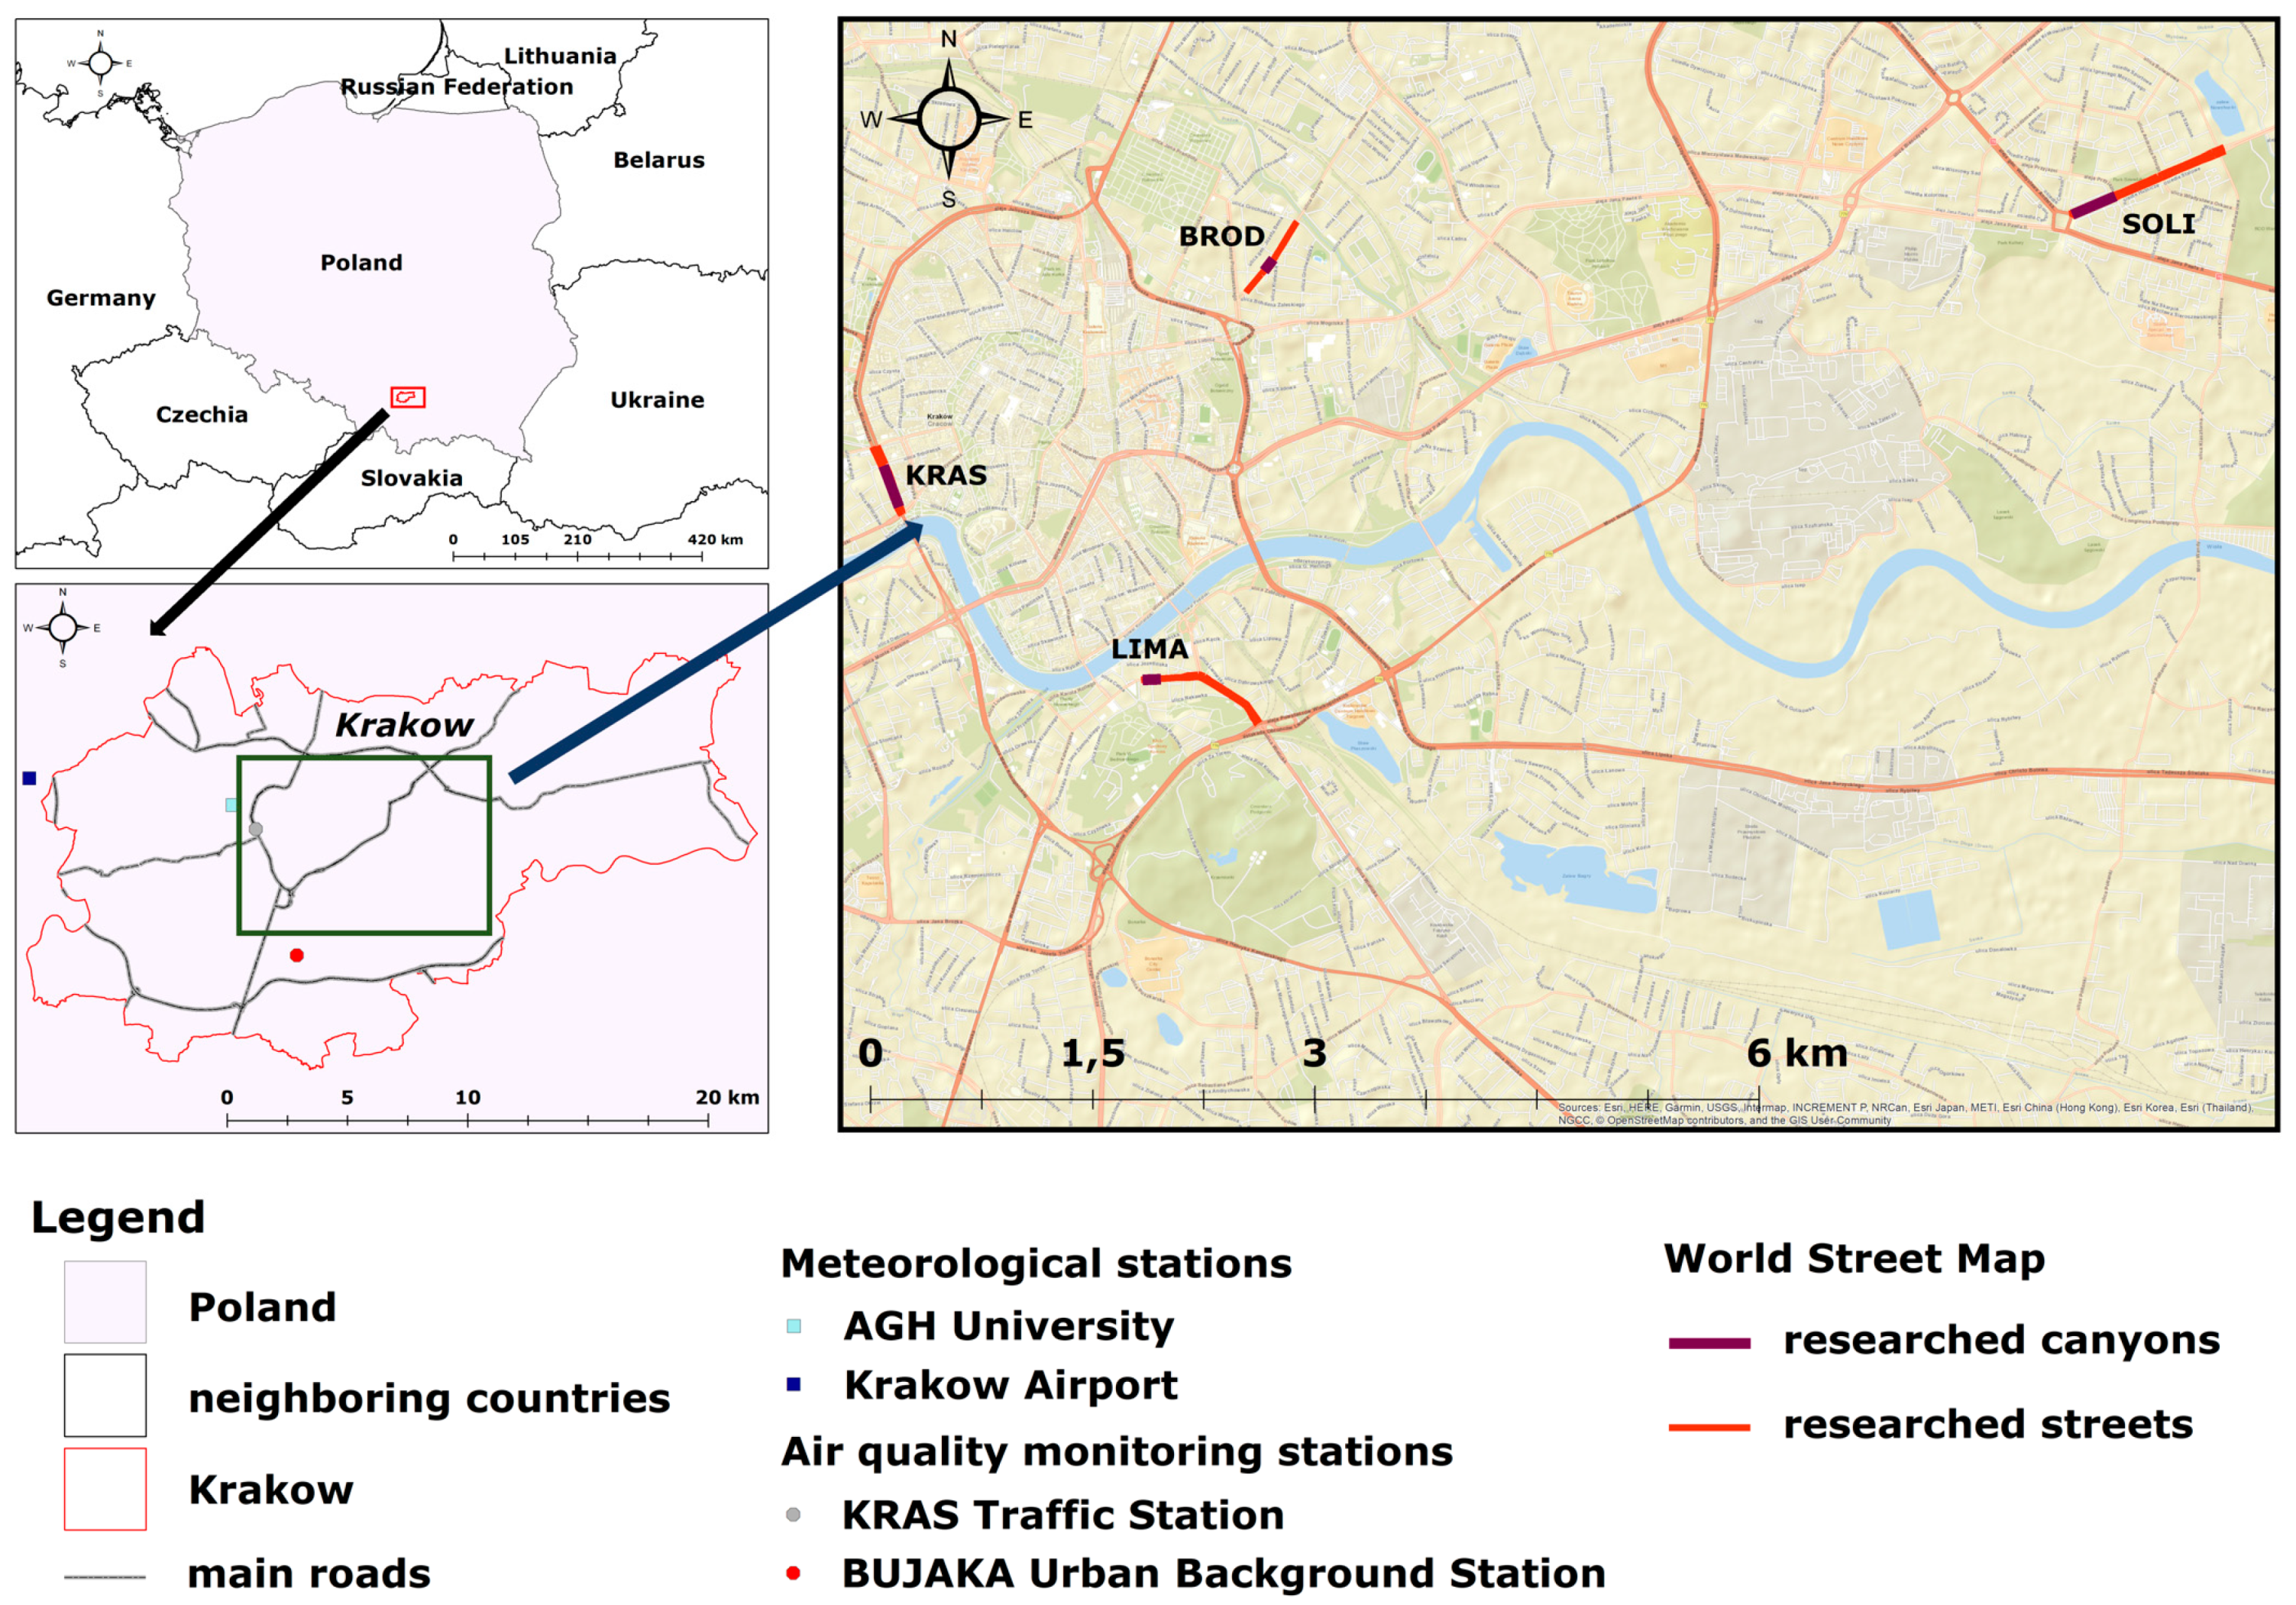
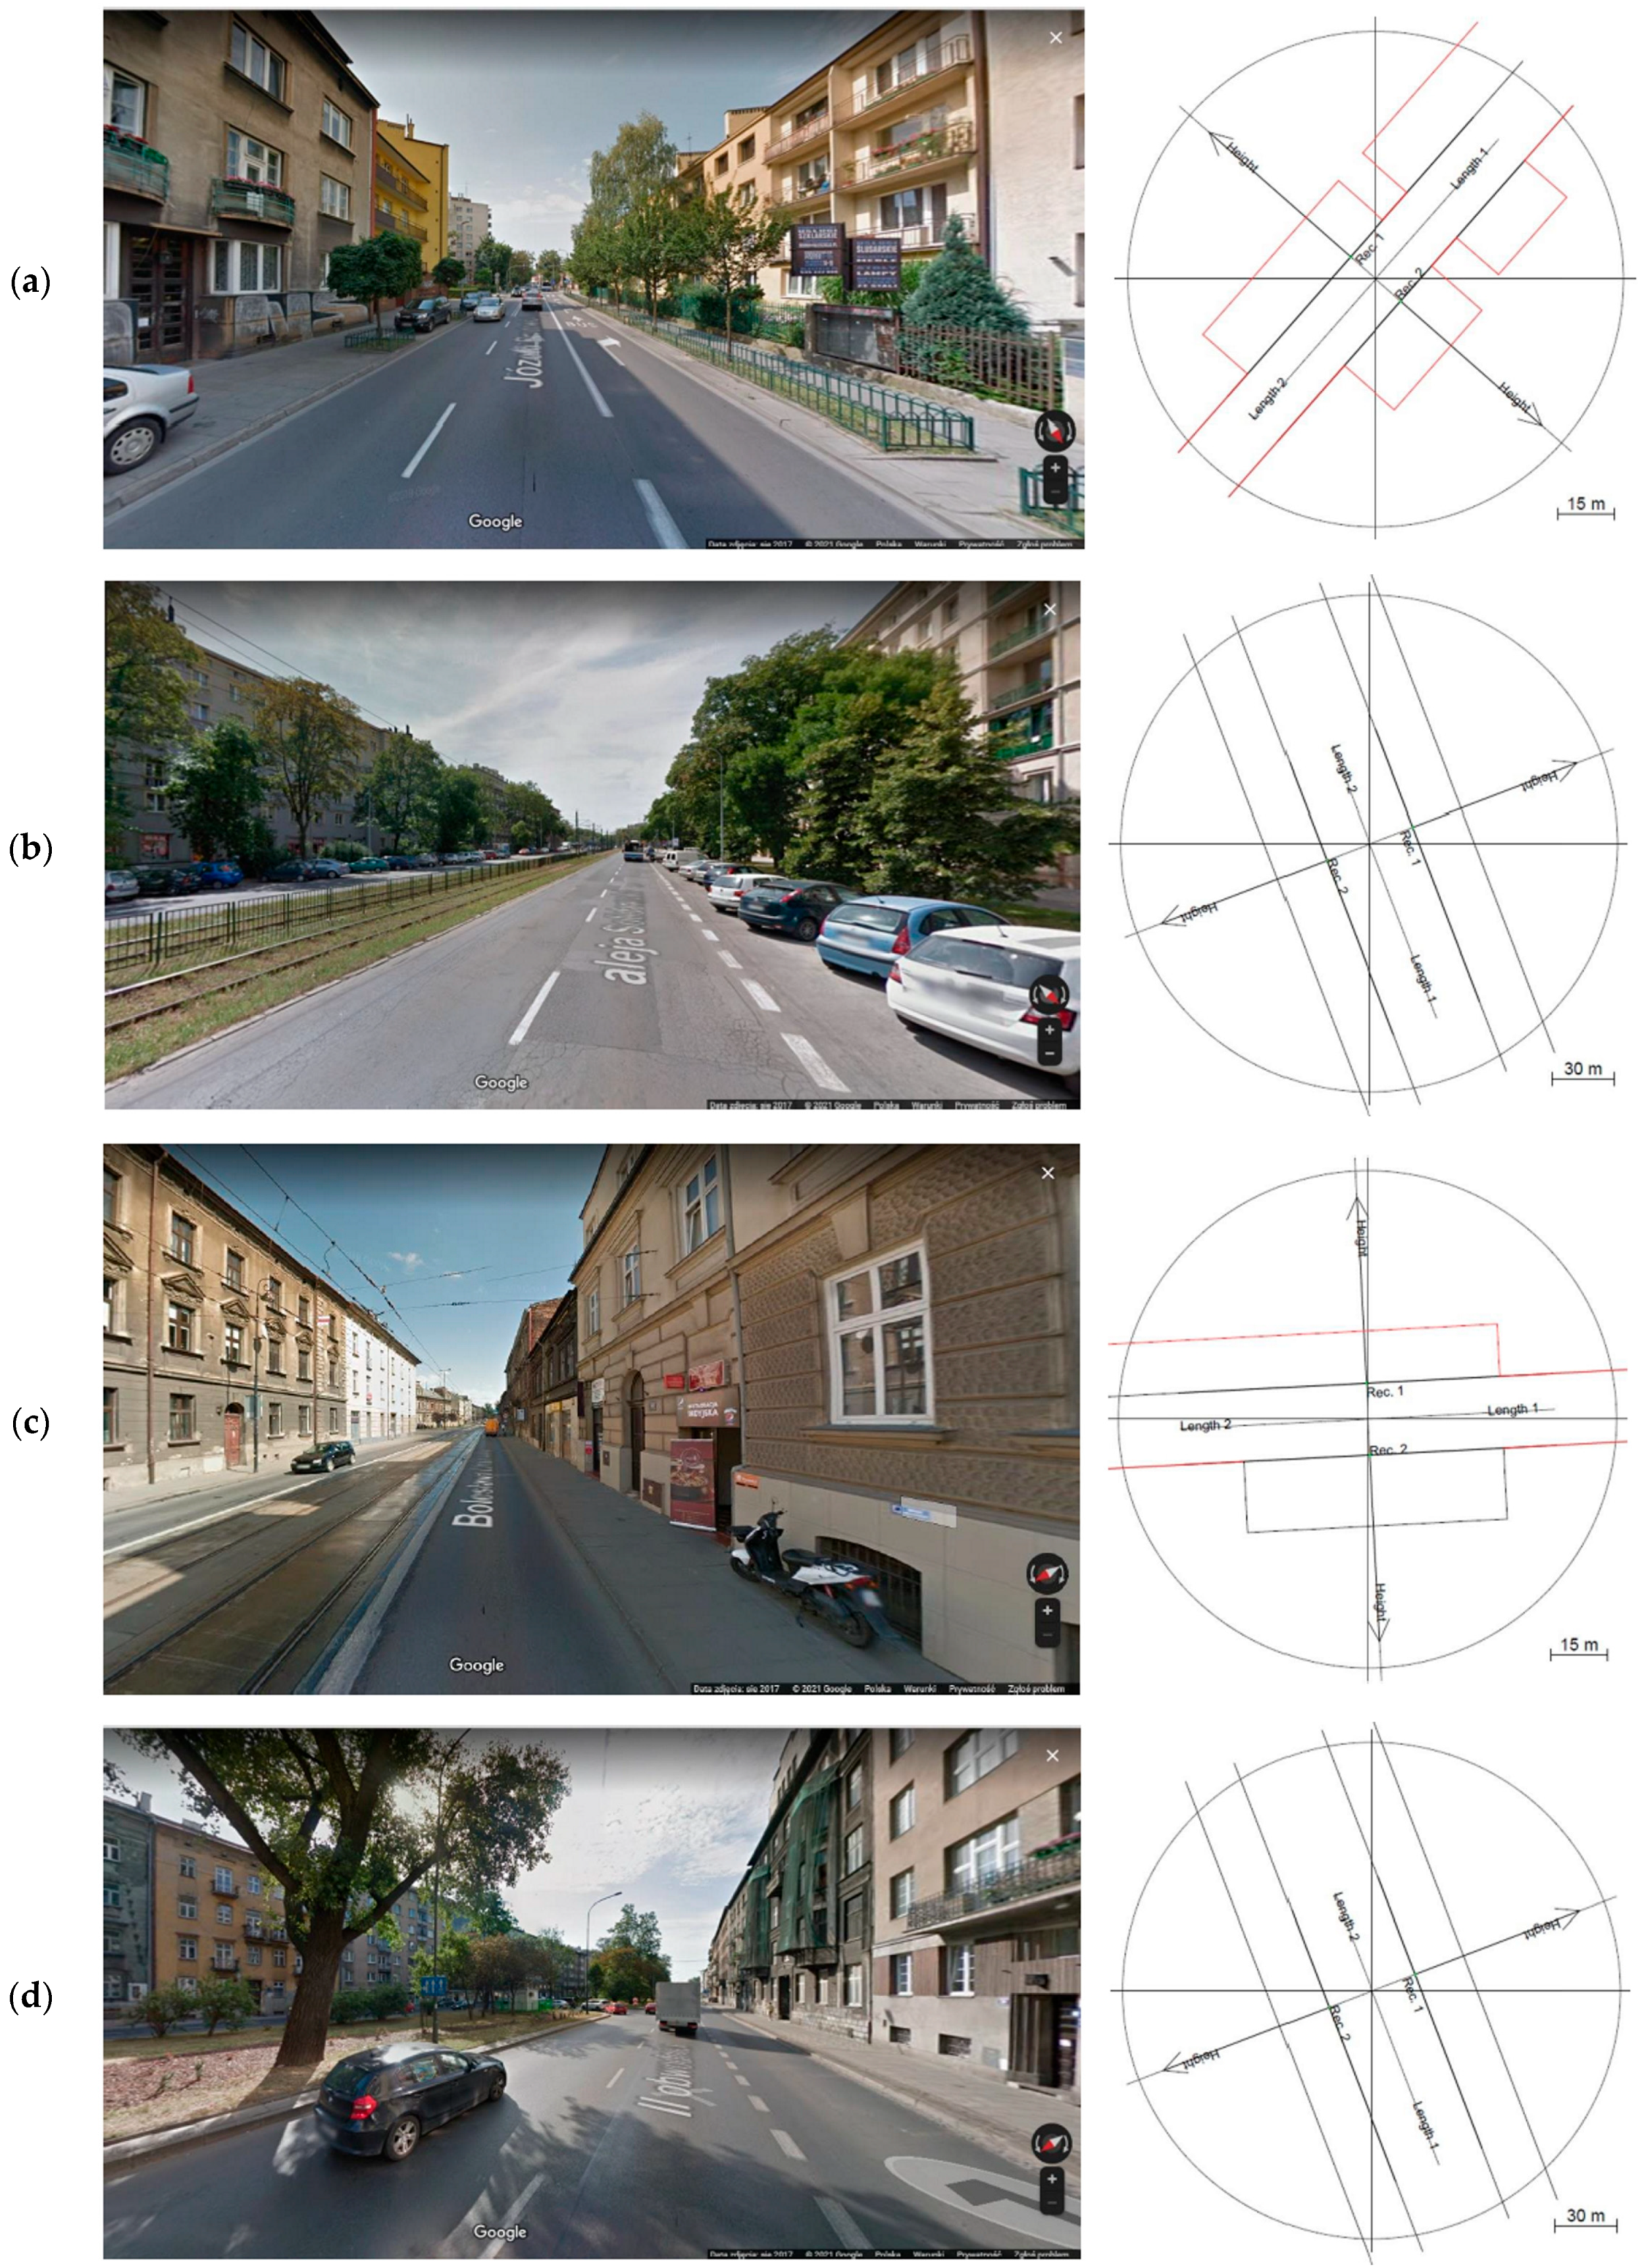
2.1. General Characteristics of Research Objects

The objects of the research included selected street canyons located in the city of Krakow (the capital of Malopolska Province), with a population of approximately 800,000 (as of 2022) and a hard surface road network of 300 km per 100 km² of the city area [55]. According to the TomTom Traffic Index Report published for 2021 [34], Krakow, with a traffic congestion level of 42%, ranks second among 213 cities in the world with a population of up to 800,000 (included in this report) and 20th among all 404 cities analyzed. As a consequence of the dense development in the city center and the large number of housing estates, Krakow has many street canyons with poor air circulation conditions. The second ring road of the city of Krakow (that includes the KRAS street canyon) is particularly notable because its traffic volume exceeds 20 million vehicles annually.
The study analyzes four two-sided street canyons located within road sections with an annual traffic volume of 2.2 million vehicles (BROD), 3.5 million vehicles (SOLI), 8.6 million vehicles (LIMA), and 24.3 million vehicles (KRAS), surrounded by compact development with buildings with a height of approximately 16 to 31 m (Table 1, Figure 1 and Figure 2).
In the street canyon with the highest traffic (KRAS), which is part of the second ring road of the city of Krakow, there is an air quality monitoring station (urban traffic type) located within the green belt that separates the roadways of opposite traffic directions (Figure 2d). This station continuously measures concentrations of air pollutants such as NOx, PM10 and PM2.5. Therefore, the results of the measurements from this station were used to assess the accuracy of the OSPM model, used in these studies in air pollutant dispersion modeling.

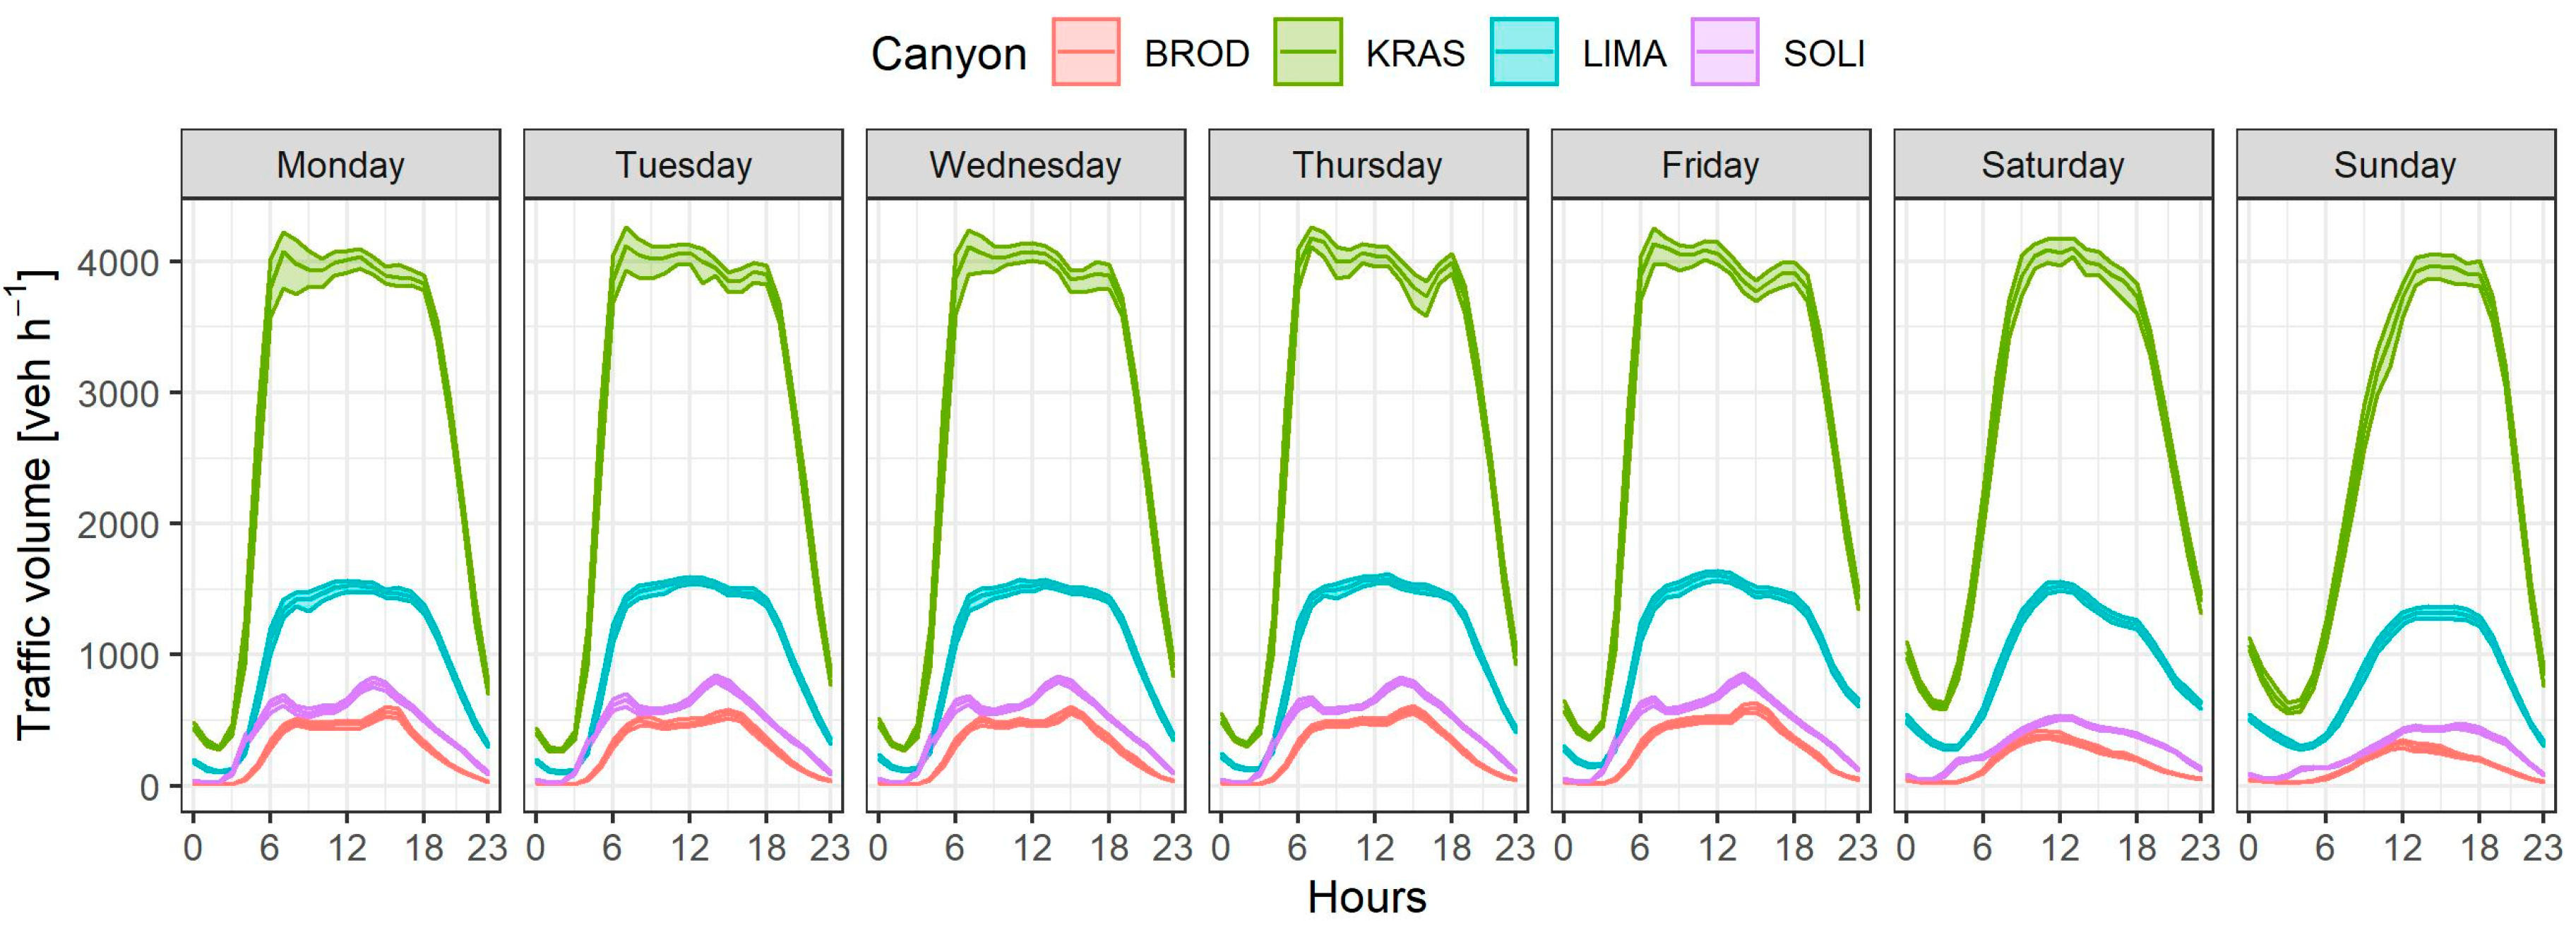
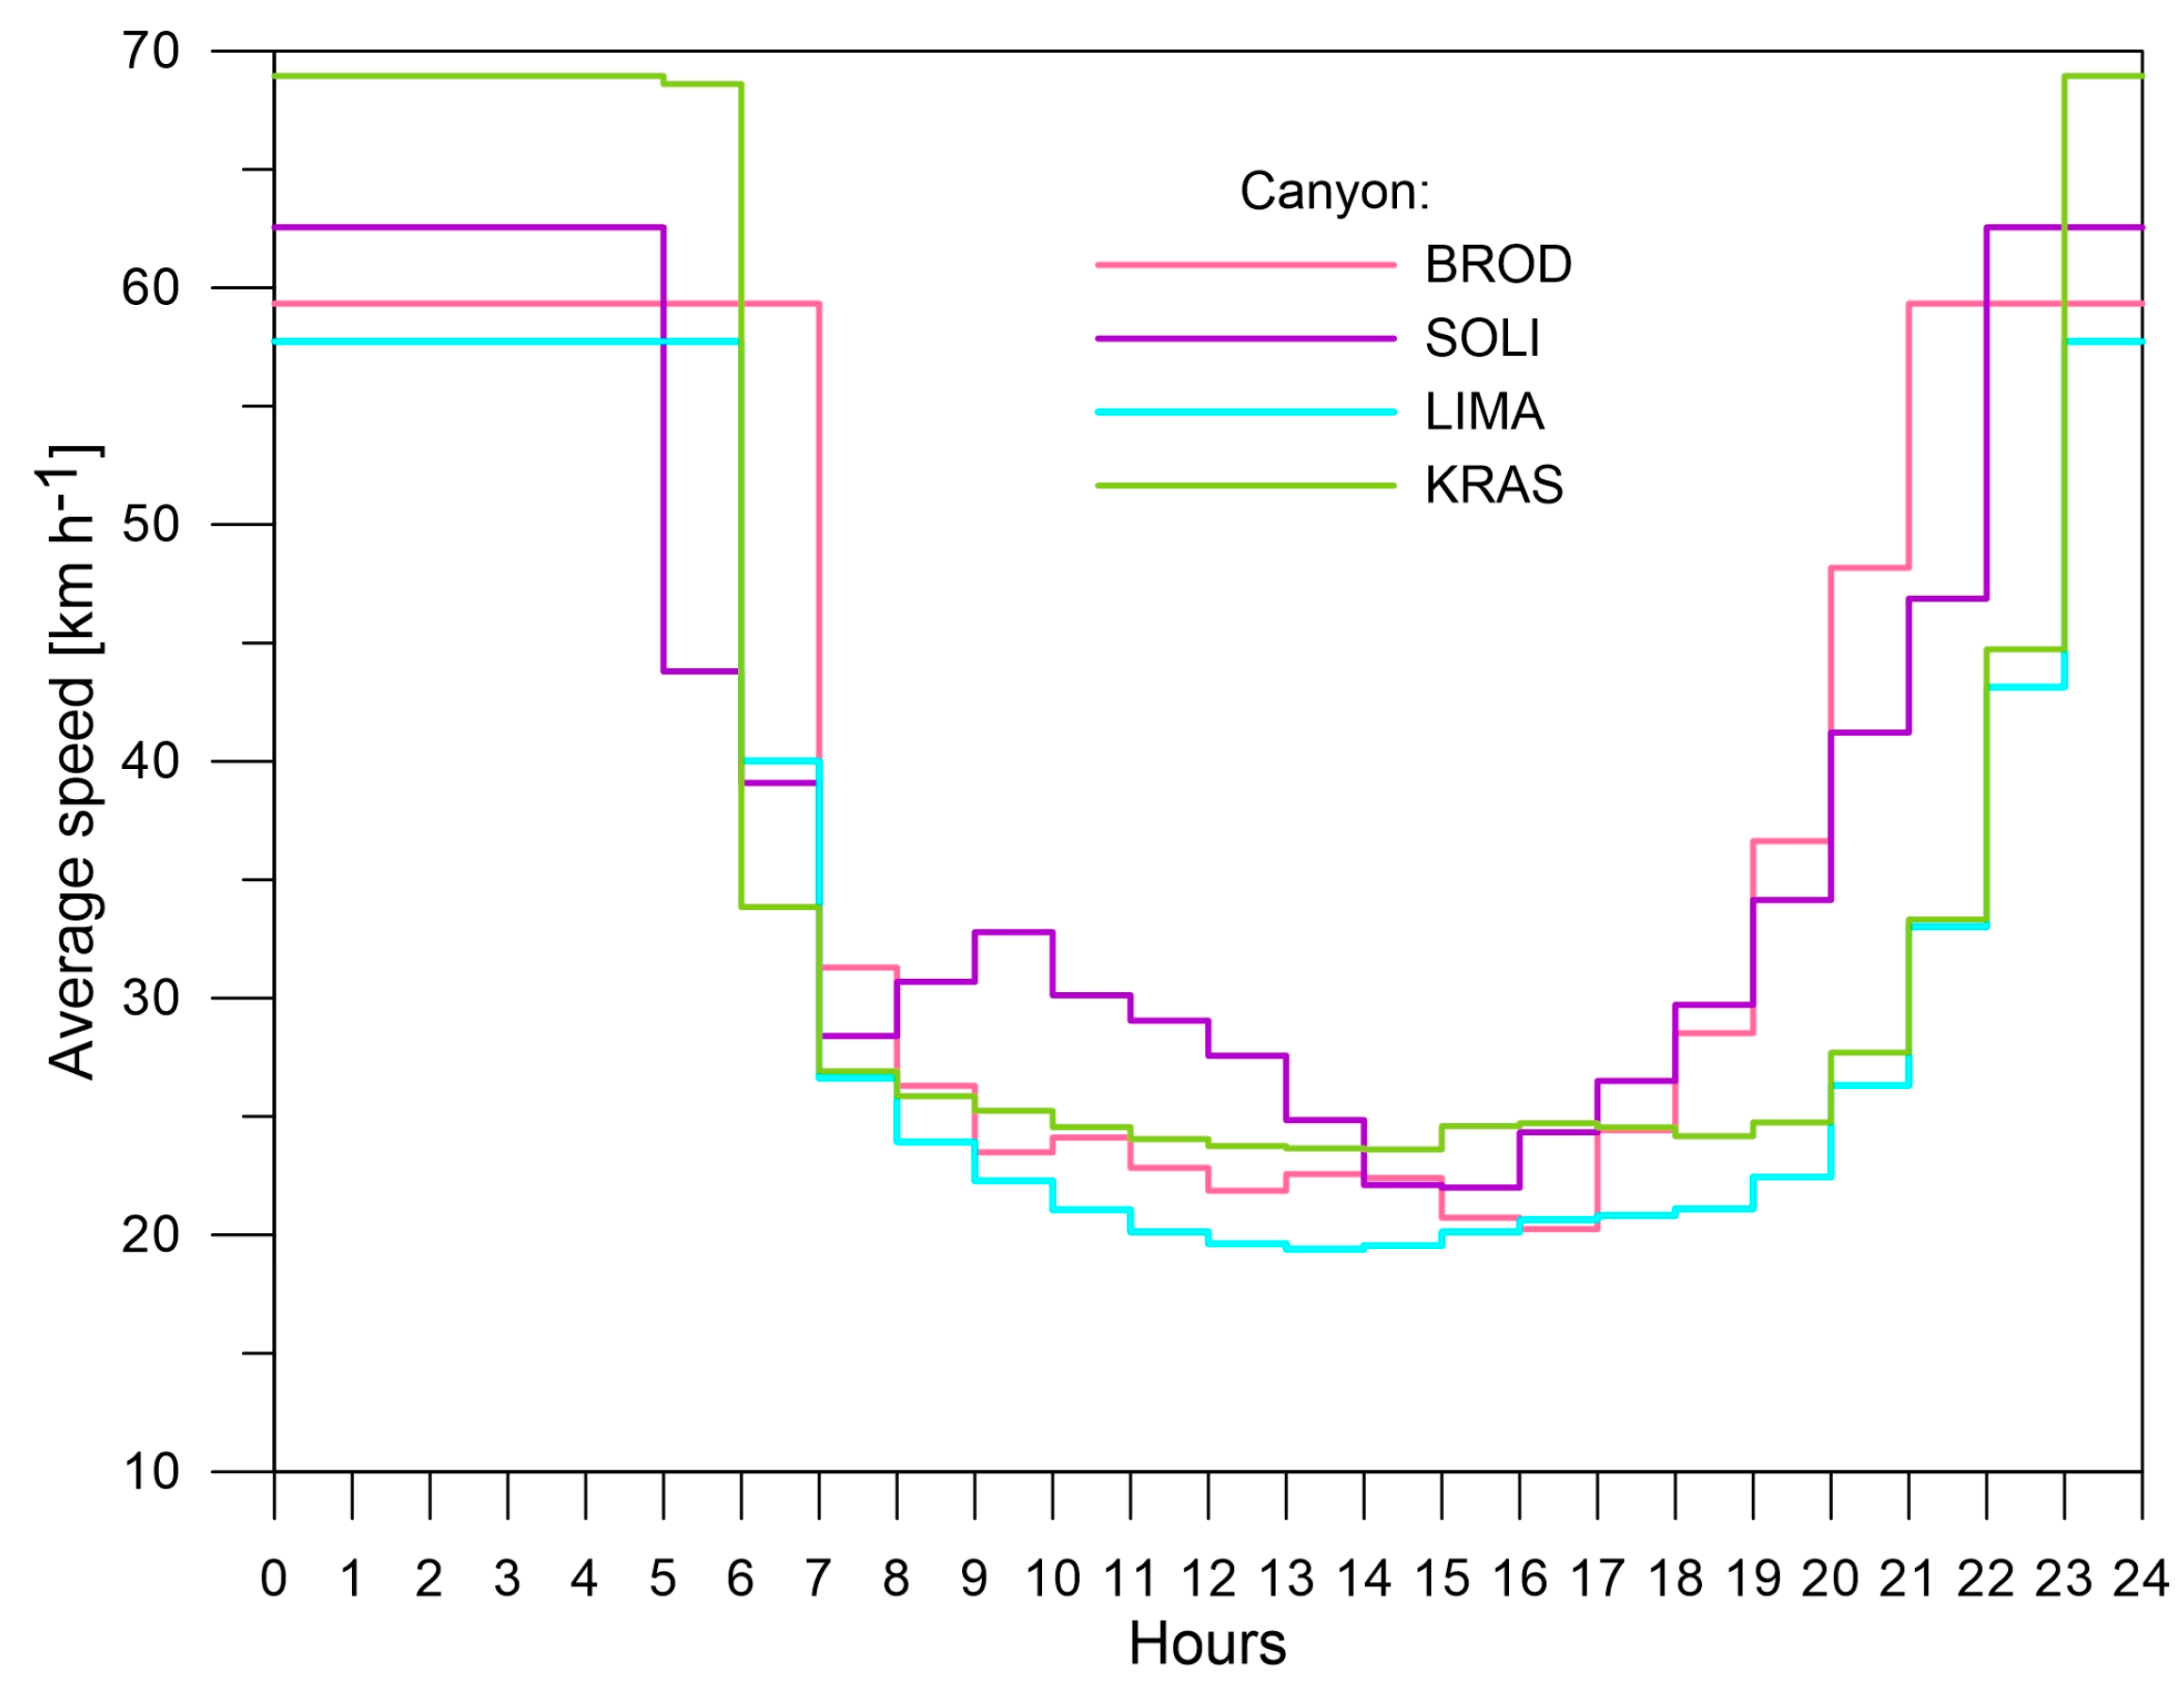
2.2. Profiles of Volume, Average Speeds, and Traffic Structure Adopted for the Baseline Variant

The baseline variant (v0), which describes the real volume of vehicle traffic in 2017 recorded with automatic sensors (induction loops) located in a given canyon (without distinguishing between vehicle categories) with a record every one and a half minutes, was adopted as a reference point for the proposed scenarios of changes in traffic management. The available measurement data was processed to obtain the total number of vehicles passing through a given street canyon at each hour of the year in both directions, after filling any measurement data gaps with appropriate values for a given hour, day of the week, and month. Figure 3 illustrates the daily traffic volume profiles obtained, distinguishing between the days of the week for the street canyons analyzed.
The average speed of vehicles at each hour of the day was adopted at a constant level on all days of the week (Figure 4) based on the relationship between the average speed during rush hour and the average daily profile of traffic volume, taking into account the information on the speed limit in force in 2017 on a given road. Average speed values at peak hours for street canyons were determined using the Krakow Traffic Model, described in more detail in Section 2.3.
The number of vehicles registered in Malopolska Province was acquired from the Central Register of Vehicles and Drivers database managed by the Ministry of Digital Affairs [57]. On the basis of these data, the vehicle structures were developed for Krakow and the other counties of Malopolska Province. Data for the years 2016–2018 were used (Figure 5 and Figure S1—in Supplementary Materials) and adopted with weights of 0.75 for Krakow and 0.25 for the other counties in terms of vehicle structures. It was assumed that such a vehicle structure would be representative of the fleet of vehicles travelling in that time on the main roads of Krakow. The assumed fleet was also representative in the analyzed street canyons, and thus, it was adopted for the calculation of air pollutant emissions for the baseline variant (v0). On the basis of the above-mentioned database, other vehicle-related parameters necessary for the calculation of the emissions were adopted; for example, the average mileage for some vehicle categories. The missing data for some vehicle categories were filled based on the research work of the Central Statistical Office [58].

2.3. Analyzed Scenarios of Changes in Road Traffic Organization and Adopted Assumptions

Three exemplary scenarios of changes in the traffic organization described in Table 2 were analyzed for each of the individual street canyons. The analysis also included the possible effects resulting from their implementation in terms of changes in emissions and impact on air quality in the canyon. Potentially feasible scenarios of changes regarding traffic management were developed with the support of the Department of Municipal Services and Climate in the Municipality of Krakow City and took into account:
  • narrowing the street cross section by reducing the number of traffic lanes (elimination of one lane in each direction), changing the use of existing lanes or creating a bus lane (SOLI);
  • reducing the speed limit from 50 km·h−1 to 40 km·h−1 (BROD);
  • reducing the speed limit from 70 km·h−1 to 50 km·h−1 (SOLI, KRAS);
  • only passenger cars meeting at least the Euro 4 emission standard and light commercial vehicles meeting at least the Euro 4 emission standard (BROD, SOLI, LIMA, KRAS) are admitted to traffic;
  • only passenger cars meeting at least the Euro 5 emission standard and light commercial vehicles meeting at least the Euro 5 emission standard (BROD, LIMA, KRAS) are admitted to traffic;
  • only passenger cars meeting the Euro 6 emission standard and light commercial vehicles meeting at least the Euro 6 emission standard (LIMA) are admitted to traffic.
The profiles of traffic volume and average vehicle speeds for the considered scenarios of road traffic reorganization (variants v1–v3) were estimated based on the measurement data developed for variant v0, and the additional parameters consist of percentage changes in traffic volume and speed from the vehicle stock. The parameters for the scenarios analyzed were calculated using the Krakow Traffic Model [56]. The Krakow Traffic Model is a typical four-stage macrosimulation model that simulates the transport reactions of Krakowian citizens related to daily trips. It was developed in 2015 at the Cracow University of Technology with the use of PTV-Visum software [59], based on research on the behavior of transport system users [60] and measurements of the volume of traffic on the road during the peak hours in the morning and afternoon. Since then, data related to the transport system have been periodically updated in this model by the Municipality of Krakow City. Changes in the road network, travelers’ transport responses, traffic volume during peak hours and public transport schedules are taken into account.
For some scenarios, additional assumptions were also included. For example, for the variants that allow the movement of only passenger cars and light commercial vehicles meeting the Euro 4, Euro 5 or Euro 6 emission standards, it was assumed that 5% of the number of real vehicles (known from variant v0) which were excluded from road traffic (vehicles excluded due to non-compliance with a permitted emission standard) would be replaced with new vehicles meeting the Euro 6 emission standard. Therefore, these scenarios should represent the initial situation after the possible implementation of the restrictions analyzed to the organization of road traffic. Furthermore, the assumption that the variability of the traffic speed on each day of the week was the same (according to the daily profile of 1-h average speeds modeled for each scenario) was maintained, as presented in the baseline variant v0.

2.4. Calculation of Air Pollutant Emissions from Street Canyons

To reflect the total impact of road transport on air quality, the calculations of pollutant emissions from individual street canyons included both the primary emissions from motor vehicles and the secondary emissions resulting from mechanical turbulence caused by moving vehicles.
The volume of exhausted and abrasion emissions from motor vehicles was calculated based on traffic volume, average speed and vehicle structure, according to the CORINAIR methodology [61] using COPERT 5.2 software [62]. The calculations included the emission of selected pollutants (NO, NO2, PM10 and PM2.5) from fuel combustion (including cold and hot emission) and the emission of PM10 and PM2.5 resulting from the abrasion of tires, brakes and road surfaces. The calculations were performed for all categories and subcategories of vehicles registered in Krakow and other counties in Malopolska Province, taking into account the technical condition (mileage) and the meeting of certain Euro emission standards [63]. As a result of further analyses and recalculations, appropriate emission factors were derived, expressed in g·km−1·veh−1. They were differentiated in terms of the amount of cold and hot emissions from fuel combustion in individual months. Then, taking into account the assumed weights for the vehicle fleet registered in Krakow (weight 0.75) and other communes of the province (weight 0.25), the weighted average emission factors (expressed in g·km−1·veh−1) were determined. They were prepared independently for all vehicle categories, months and hourly distribution. In the next step, the values of the emission factors mentioned above were averaged broken down into three vehicle categories (passenger cars, light commercial vehicles and heavy duty vehicles with buses). This assumption is based on the division of the vehicle structure applied in the Krakow Traffic Model. The average hourly emission (expressed in g·km−1·veh−1) for each street canyon was determined, based on the average vehicle structure modeled with the model for each of the street canyons and the hourly traffic volume (Section 2.2). These calculations were repeated independently for each variant.
Secondary emission of road dust was estimated on the basis of the guidelines of the U.S. EPA [64,65] using the following dependencies:
E = k · (sL)0.91 · W1.02,
where, E—particulate emission factor for one vehicle [g·km−1], k—particle size multiplier for the particle size range (PM10 or PM2.5), sL—road surface silt loading [g·m−2], W—average weight of vehicles traveling the road [Mg].
As recommended by the Midwest Research Institute [66] and the U.S. EPA [64] in these calculations, the value of the road surface silt loading (sL) was assumed to be:
  • 0.06 g·m−2 for canyons with vehicle traffic volume of 5000–10,000 vehicles per day,
  • 0.03 g·m−2 for canyons with vehicle traffic above 10,000 vehicles per day.
In the case of PM10 emissions, the particle size multiplier (k) was adopted at 0.62 [64], while in the case of PM2.5 emissions, it was adopted at 0.25, based on the results of studies carried out previously by Bogacki et al. [67] for several streets in Krakow. The multipliers mentioned above were successfully verified by Rzeszutek et al. [46] by obtaining appropriate quality forecasts of PM10 and PM2.5 concentrations in the air for the KRAS canyon.
For each case, the secondary road dust emission was determined with a resolution of 1 h, taking into account the hourly variability of the traffic volume in a given variant (scenario) and the prevailing meteorological conditions (precipitation volume). According to the adopted methodology, for hours with precipitation of at least 0.254 mm, the value of secondary emission E was assumed to be zero [64,65].

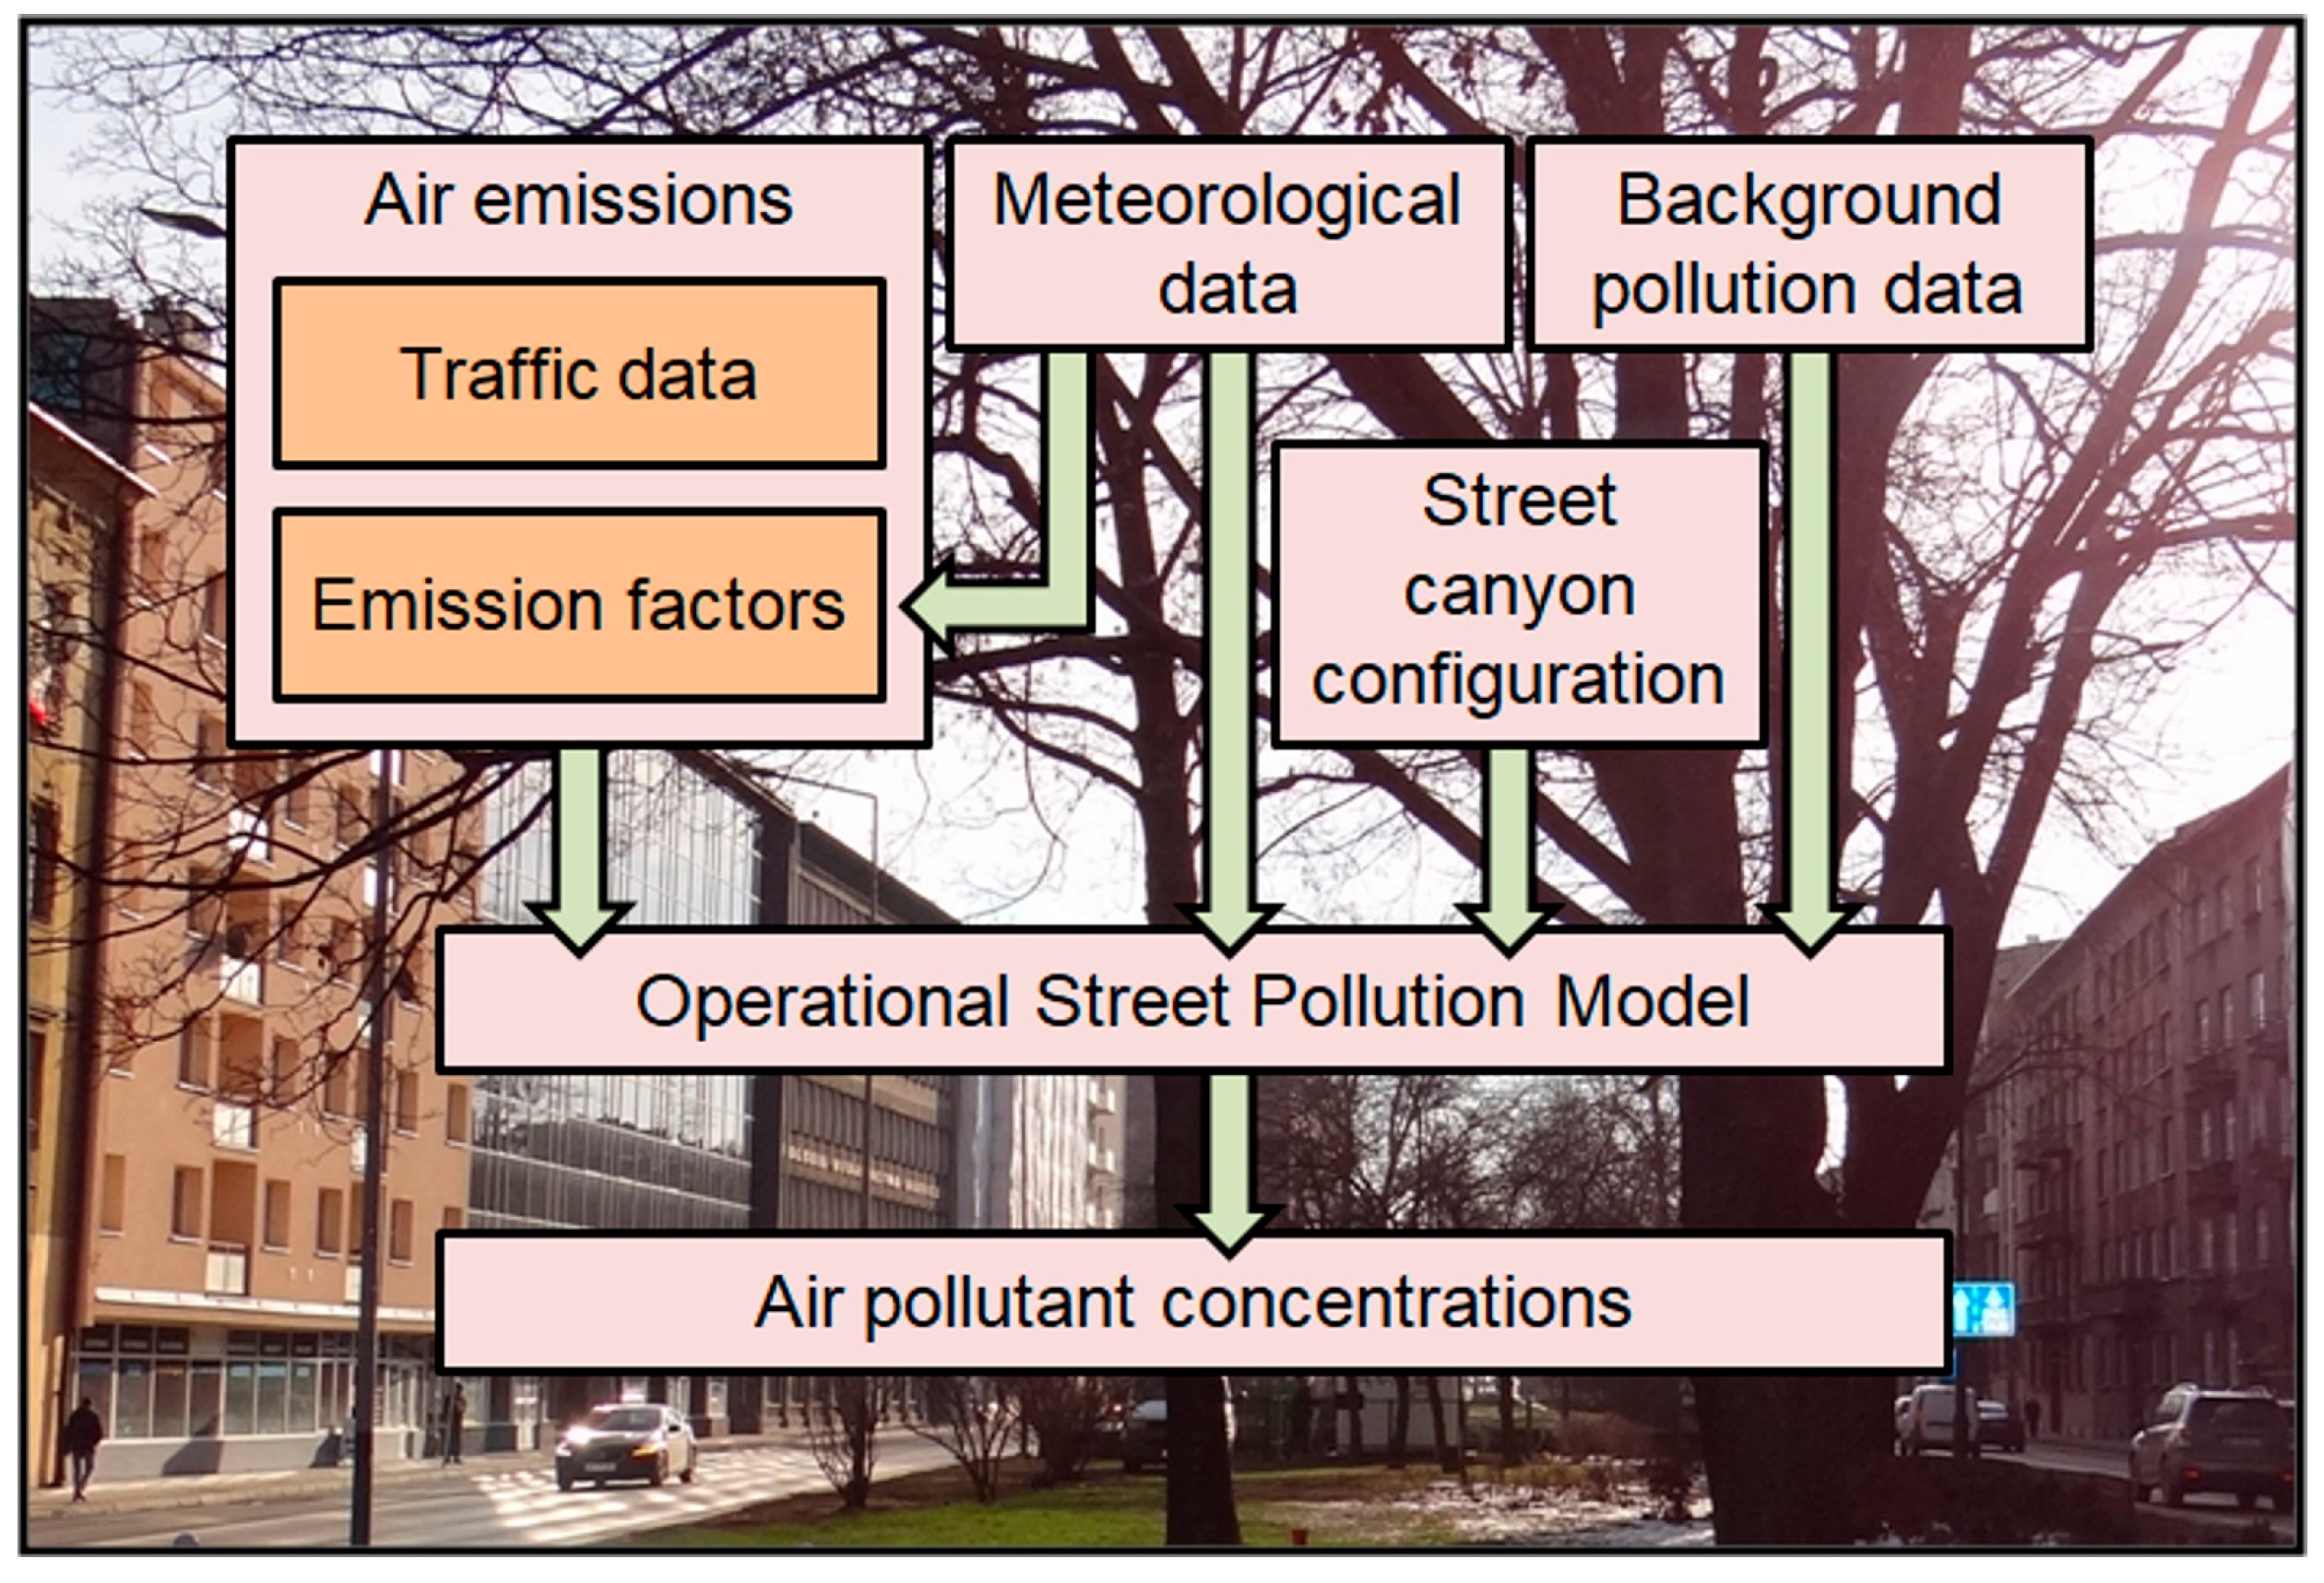
2.5. Modeling of Pollutant Concentrations in the Air

Calculations of air pollutant concentrations were performed using the microscale dispersion OSPM model, dedicated to the assessment of air quality in street canyons. This model is characterized by high precision in predicting concentration levels, which has been widely discussed in numerous studies [36,37,45,46,68,69,70,71]. The OSPM is a combination of the Gaussian plume model and the box model, which makes it possible to model direct and recirculation effects, taking into account the pollution background [35,72]. In this model, it is assumed that air pollutants caused by vehicle traffic accumulate on the leeward side of a street canyon (recirculation vortex effect) and concentrations in the recirculation zone are calculated based on the assumption that the inflow of air pollutants is equal to its outflow. In addition, simple mechanisms of chemical transformation of NOx have been implemented in the model, depending on the ozone (O3) concentration and the intensity of solar radiation [37], and hence, information about the background of O3 and appropriate meteorological data are required. However, the processes of homogeneous nucleation, coagulation, condensation, evaporation or wet and dry deposition are not taken into account, which may be of some importance in modeling concentrations in the air, for example, of particulate matter [73].
Pollutant concentrations were calculated with a 1-h time step at two extreme points of the cross section located in the center of a given street canyon at a height of 1.5 m above ground level for the BROD, SOLI and LIMA canyons, and at a height of 2.5 m above ground level for the KRAS canyon, and then they were averaged. The slightly greater height of the calculation points for the KRAS canyon resulted from the need to adjust it to the height of the air intake at the air quality monitoring station located in this canyon in order to validate the model used.
The validation of the OSPM model was carried out by comparing the modeling results performed for the baseline variant in the KRAS street canyon to the results of air pollutant (NO2, NOx, PM10 and PM2,5) concentration measurements observed in 2017 at the traffic station located in the center of this canyon. The accuracy of the model was assessed using the following statistical parameters: mean bias (MB), mean absolute error (MAE), root mean square error (RMSE), normalized mean bias (NMB), normalized mean error (NME), fraction of predictions within a factor of two (FAC2), Pearson’s correlation coefficient (r) and index of agreement (IOA) [74,75,76,77]. The uncertainty of the OSPM model was taken into account in the assessment of the significance of changes in air pollutant concentrations obtained for the considered variants of road traffic organization as a result of atmospheric dispersion modeling.

2.6. Meteorological Data and Background of Air Pollutants

Basic meteorological data necessary for the calculation of pollutant emissions and modeling of their dispersion in the air were adopted based on the measurement results for 2017 captured from the meteorological station belonging to AGH University [78], located at a height of approximately 20 m above ground level (on the roof of a four-story building) near the Krakow city center, approximately 1.5 km from the KRAS canyon (Figure 1). The location of the meteorological station allowed for the recording of the directions and speeds of the winds that blow above the roofs of neighboring buildings, allowing the proper modeling of the turbulence in the street canyon caused by wind, without taking into account conversion factors [35,79]. The measurement data from this station were also considered representative for all other analyzed street canyons, despite their greater distance from this station (depending on the canyon, approximately 4–9 km) due to the location of these canyons on a similar terrain elevation (differences not exceeding several meters above ground level) and no other meteorological stations located closer to guarantee the appropriate quality of the results. For example, the nearest state meteorological station belonging to the Institute of Meteorology and Water Management (IMGW) was located approximately 10–18 km from the individual canyons, on the outskirts of the city, near Krakow Airport (Figure 1). However, data from this station were not used in this study due to the fact that it was located in an open area and was characterized by much higher average wind speeds and a different wind rose compared to the station located at AGH University [80]. Total solar radiation included in the OSPM model in modeling the course of photochemical reactions involving nitrogen oxides was captured from the ERA5 meteorological reanalysis provided by the European Center for Medium-Range Weather Forecasts (ECMWF) [81].
The background of air pollution (including O3 background levels) used in the calculations performed with the OSPM model was adopted according to the methodology described in [46], using mainly 1 h measurement data for 2017 from the air quality monitoring station located on Bujaka Street in Krakow (BUJAKA urban background station) (Figure 1). In the absence of measurement data from this station, as well as for periods with concentrations higher than those recorded at the air quality monitoring station located inside the KRAS street canyon (KRAS traffic station), the instantaneous background values were determined based on the measurement data recorded at other air quality monitoring stations in Krakow. For example, as far as the O3 background is concerned, it was determined only based on data from the BUJAKA station (due to the lack of measurements of this substance at other stations), and the completeness of the 1 h data in 2017 exceeded 97%.
Figure 6 shows a simplified flow chart of the research methodology visualizing the sequence of operations performed and the use of meteorological and background pollution data. More detailed information on these data adopted for the city of Krakow in 2017 is presented in [26].

2.7. Background Diminution Rate

As part of the analyses, a new quantitative factor was proposed to describe the percentage rate of obscuring relative changes in air pollutant concentrations for the compared variants, caused by the influence of the adopted pollution background—the so-called Background Diminution Rate (BDR). It was calculated from the following dependence:
BDR = 1 C RTB _ vX C RTB _ v 0   ·   C RT _ v 0 C RT _ vX C RT _ v 0   ·   C RTB _ v 0 · 100 % ,
where, CRTB_vX—average air concentration resulting from the impact of road transport emissions in the street canyon and simultaneously background pollution obtained for variant vX [μg·m−3], CRTB_v0—average air concentration resulting from the impact of road transport emissions in the street canyon and simultaneously background pollution obtained for variant v0 [μg·m−3], CRT_vX—average air concentration resulting from the impact of road transport emissions in the street canyon obtained for variant vX [μg·m−3], CRT_v0—average air concentration resulting from the impact of road transport emissions in the street canyon obtained for variant v0 [μg·m−3].

3. Results

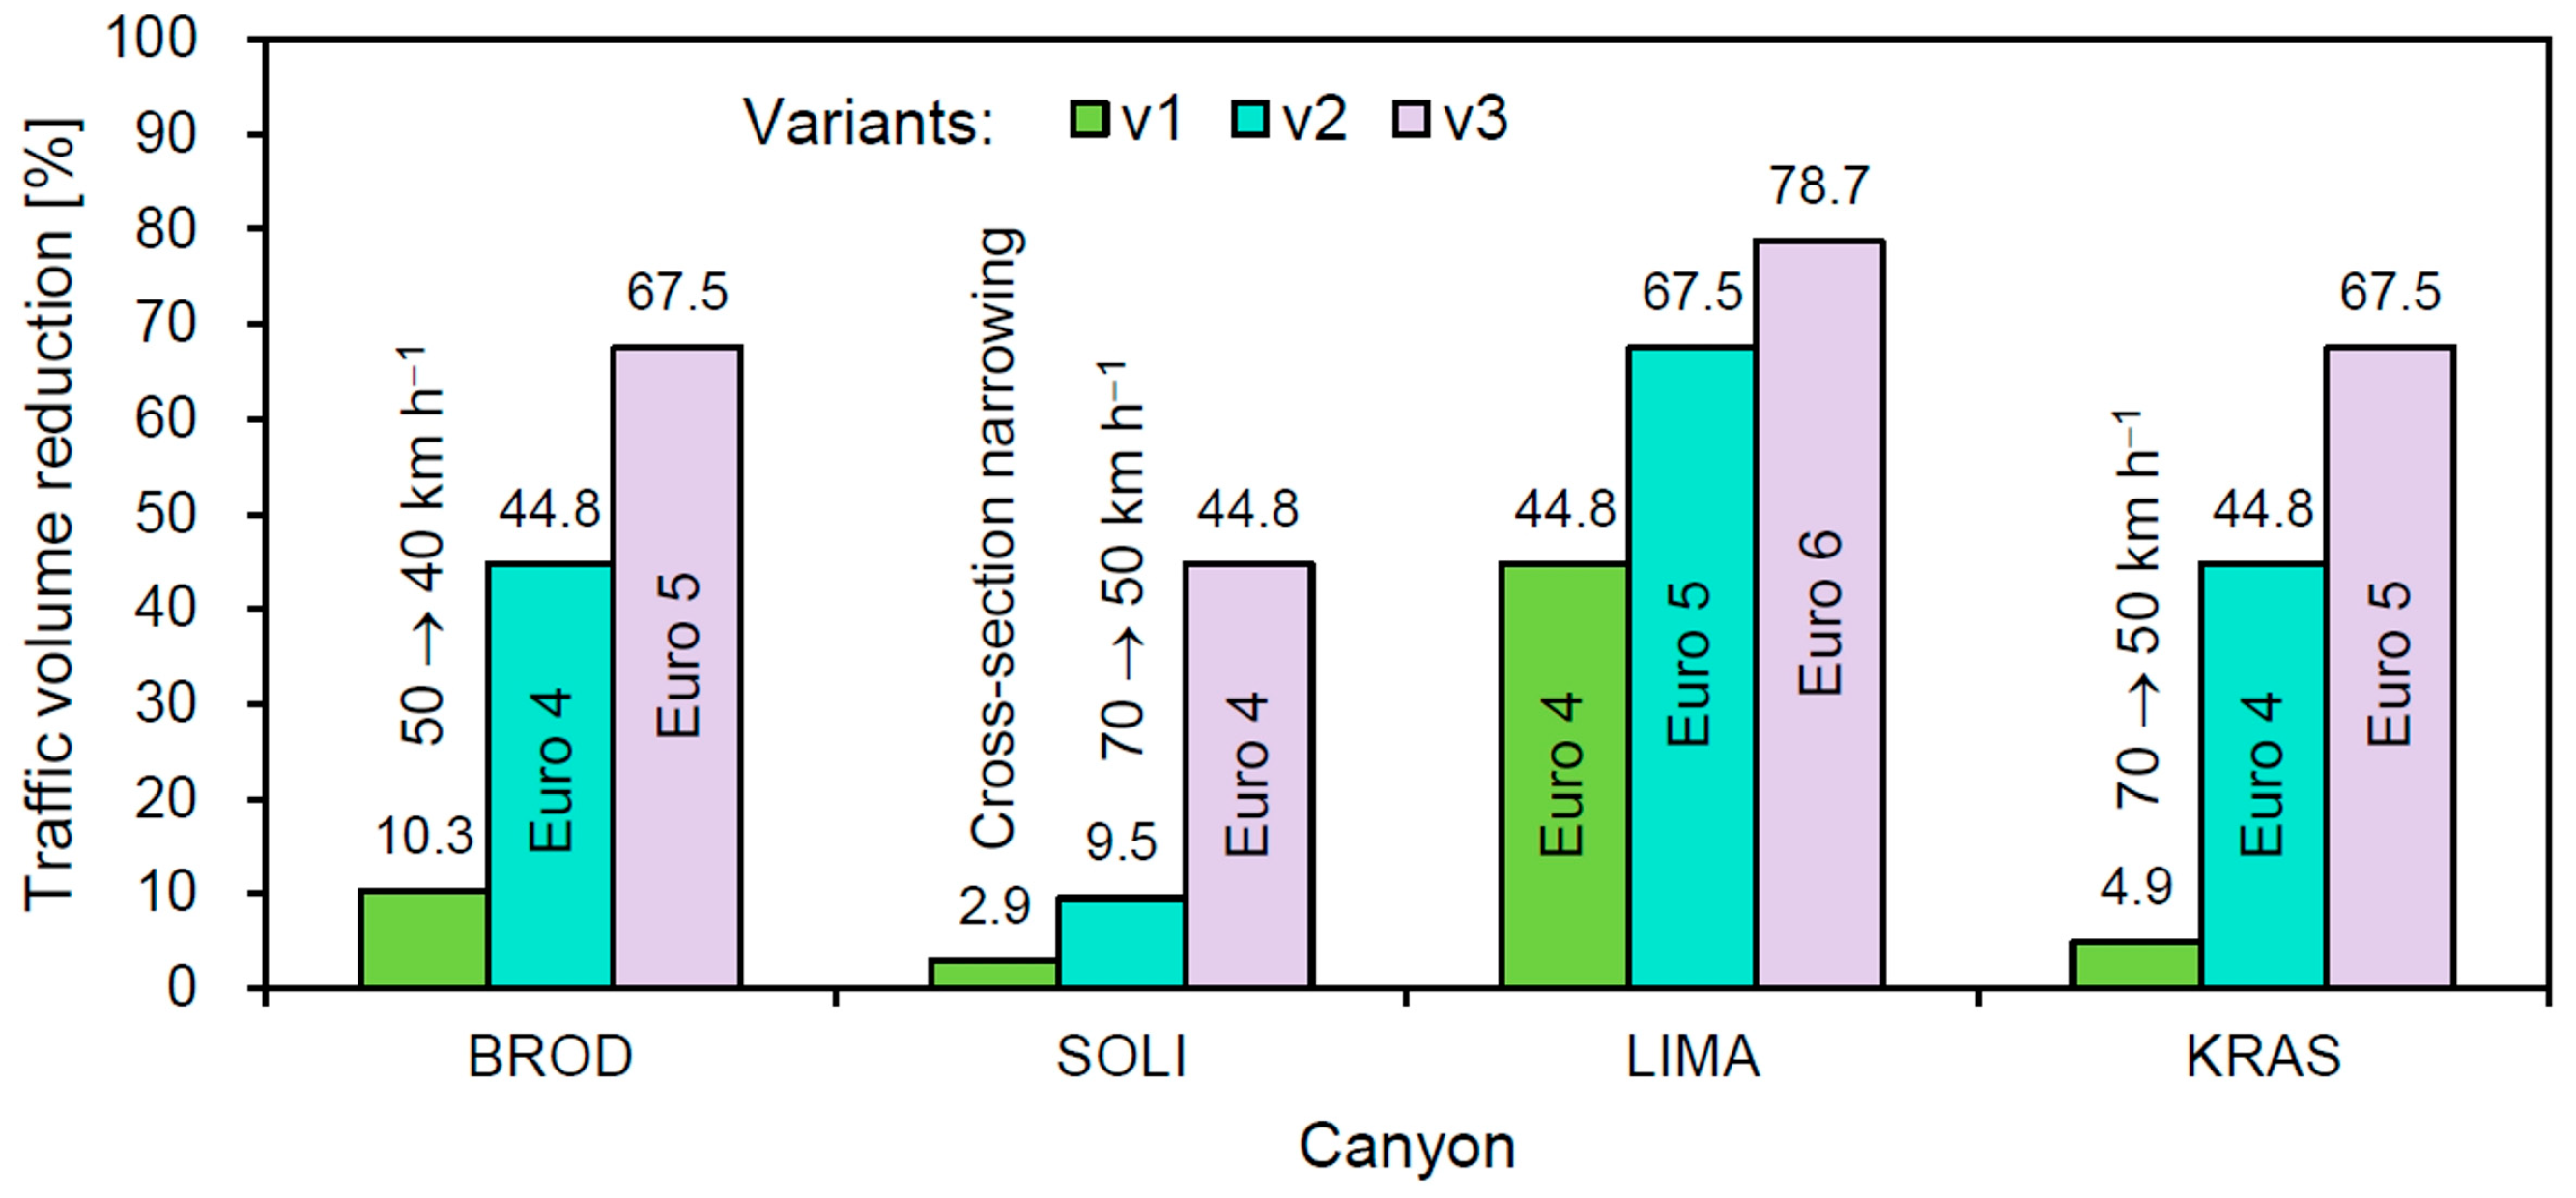
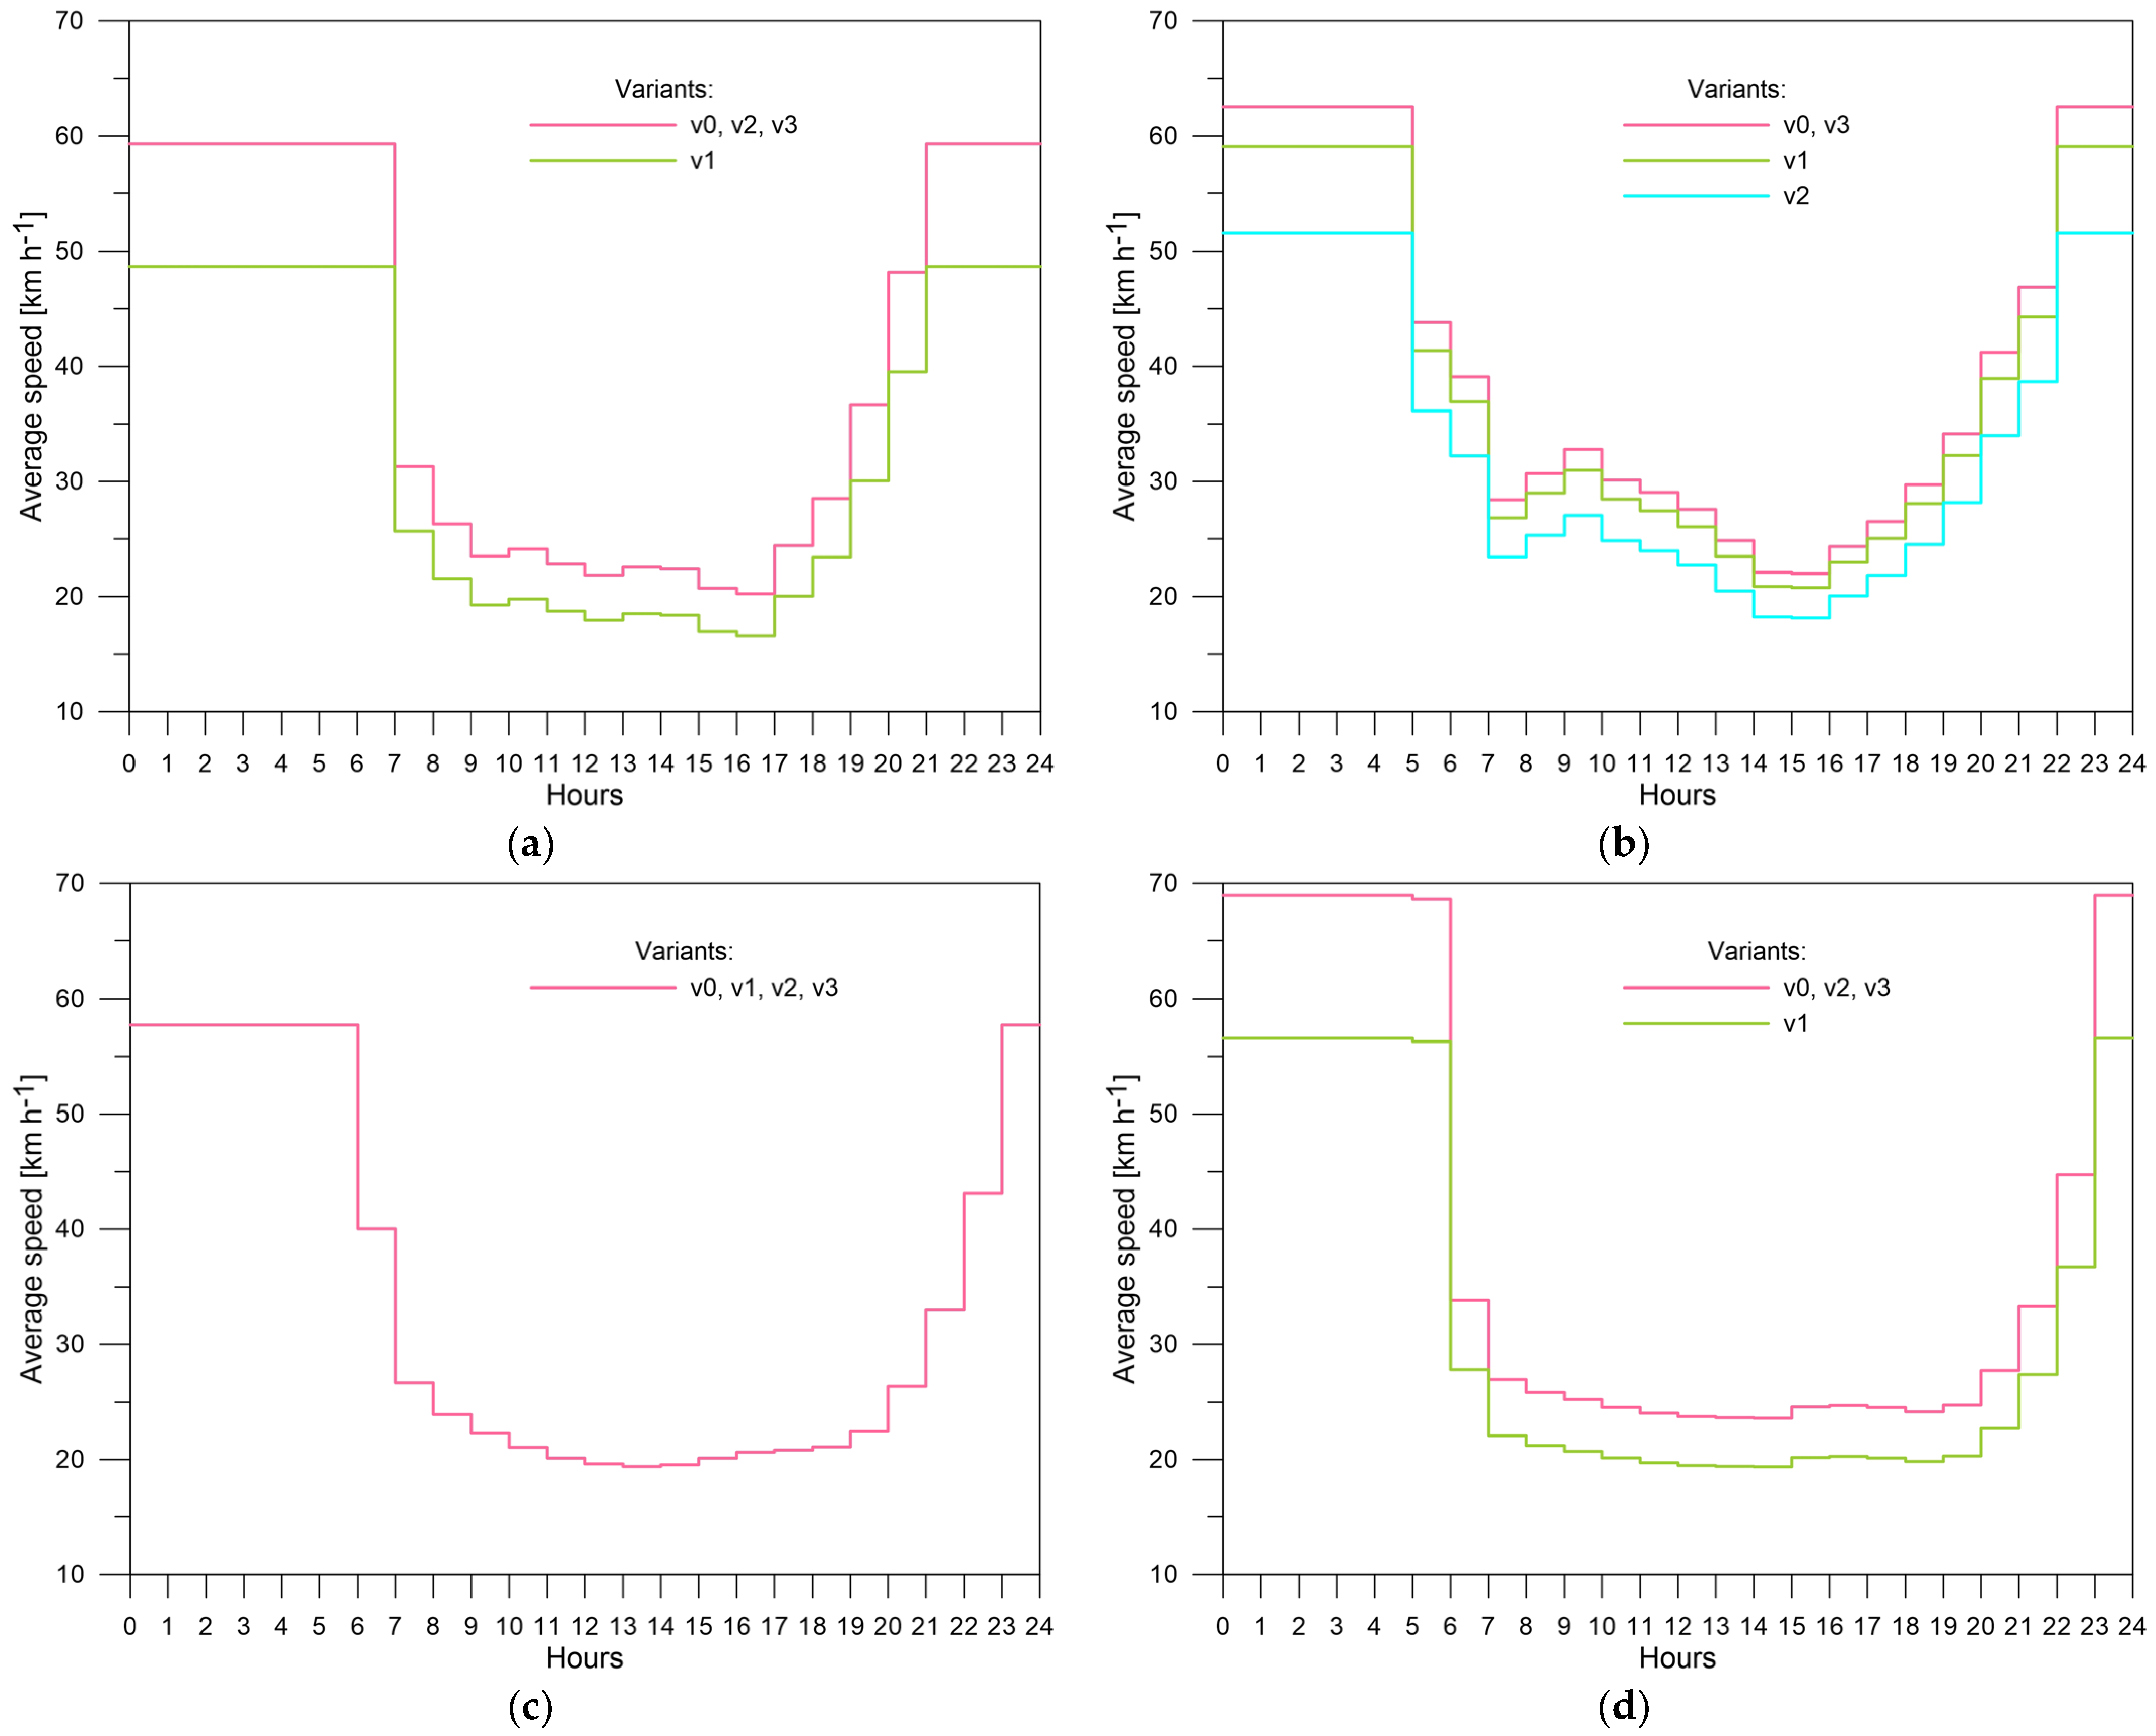
3.1. Volume and Speed of Vehicle Traffic Determined for the Analyzed Variants

Figure 7 shows the profiles of the average traffic volume with a 95% confidence interval for the individual scenarios of traffic reorganization in terms of hours and days of the week. Table S1 (Supplementary Materials) presents a summary of the total annual and average annual values of the vehicle traffic volume forecasts for the scenarios and street canyons considered. The percentage rate of traffic volume reduction obtained for variants v1–v3 in relation to the baseline variant v0 is visualized in Figure 8.
Among the analyzed scenarios of changes in the organization of road traffic, the highest rates of vehicle traffic volume reduction in relation to the baseline variant (v0) were obtained for the variants in which the criterion of compliance with the Euro 4, Euro 5 or Euro 6 emission standards were implemented. The introduction of these scenarios resulted in a reduction in traffic volume of approximately 45–79%, depending on the emission standard criterion adopted (Figure 8). This was due to the large share of older cars that did not meet the given criterion in the vehicle structure determined for the baseline variant and the additional assumption that only 5% of the vehicles eliminated in this way from traffic would be replaced by the newest vehicles meeting the Euro 6 emission standard. In the case of the scenario in which passenger cars and delivery vans meeting the Euro 6 emission standard (the LIMA street canyon, variant v3) were admitted to traffic, the average reduction in traffic volume was predicted at a level of approximately 78.7% compared to variant v0. However, the variants based on the elimination of only those vehicles that did not meet the Euro 5 and 4 emission standards, respectively, were characterized by a reduction in traffic volume of approximately 67.5% and 44.8%. Statistical analysis showed that these variants compared to variant v0 are statistically significantly different at the 95% confidence intervals (Figure 7).
In the case of the remaining traffic reorganization scenarios analyzed for some street canyons (BROD, SOLI, KRAS), the predicted reduction in traffic volume in relation to variant v0 was achieved at a much lower level (of 3–10%). In these cases, the calculated 95% confidence intervals for the average traffic volume overlapped (Figure 7). This means that these scenarios do not result in statistically significant changes in traffic volume.
The variability of 1 h vehicle traffic speeds for all variants of traffic organization analyzed in the considered street canyons (average values for traffic in both directions) is presented in Figure 9. Limitation of the average speed of vehicle traffic relative to the baseline variant (Table 1) was provided only for the variant v1 for the BROD, SOLI and KRAS street canyons (averaged real reductions amounted to 17.9%, 5.5% and 17.9%, respectively) and for variant v2 for the SOLI canyon (reduction of 17.5%) (Table S2). The introduction of emission reduction scenarios also affects vehicle speed profiles. As a rule, a decrease in traffic intensity results in an increase in the speed of moving vehicles (Figure 7, Figure 8 and Figure 9). Variant v2 for SOLI is an exception (Figure 9b), because this scenario takes into account the planned introduction of a speed limit from 70 km·h−1 to 50 km·h−1.

3.2. Changes in Air Pollutant Emissions in Street Canyons

The summary of the average emission factors of the air pollutants analyzed estimated for individual street canyons and variants is included in Table 3. Absolute and percentage changes of these emissions captured for variants v1–v3 compared to variant v0 (baseline) are presented in Figure 10 and Figure S2, respectively.
The data presented show that the calculated average annual pollutant emission rates (Table 3) are most frequently directly proportional to the volume of vehicle traffic summarized for individual variants in Table 1 and Table 3. However, for the KRAS canyon and variant v1, due to the introduced speed limit, from 70 km·h−1 to 50 km·h−1 (resulting in a reduction of the actual average daily vehicle traffic speed from 39.3 km·h−1 to 24.6 km·h−1), the NOx emission increased by approximately 3% compared to variant v0, despite a certain decrease in the predicted vehicle traffic volume (by approximately 5%). The greatest emission reduction (Figure 10 and Figures S2–S4) was observed for variants based on the assumption that only passenger cars and light commercial vehicles meeting at least the Euro 4, Euro 5 or Euro 6 emission standards were admitted to traffic. Depending on the street canyon, the air emission reductions of all the substances analyzed were approximately 25–55%, 60–70% and 65–78% for the traffic management scenarios related to the emission standards of Euro 4, Euro 5 and Euro 6, respectively. The values of average differences obtained with 95% confidence intervals (Figure 10) indicate that changes in emission factors for the above-mentioned scenarios are statistically significant.
In the case of scenarios based on the exclusion from traffic of passenger cars and delivery vans that did not meet the Euro 4, Euro 5 or Euro 6 emission standards, the emission reduction was obtained at a level of approximately 36–66% for NO, 28–77% for NO2, 35–67% for NOx and 44–78% for both PM10 and PM2.5 (compared to variant v0). The percentage reduction in NO2 emissions was observed at a level of 32–47% less than the percentage reduction in NO emissions for the variant in which vehicles that did not meet the Euro 4 emission standard (BROD-v2, SOLI-v3, LIMA-v1, and KRAS-v2) were banned from traffic. For variants in which vehicles that did not meet the Euro 5 emission standard (BROD-v3, LIMA-v2, and KRAS-v3) were banned from traffic, similar reductions in NO and NO2 emissions were noted. In the case of the variant in which only vehicles meeting the Euro 6 emission standard were allowed into traffic (LIMA-v3), there was a smaller reduction in NO emissions compared to NO2 emissions. These changes were due to differences in individual emission factors assigned to individual groups of vehicles that meet a specific Euro emission standard.

3.3. Results of Modeling Pollutant Concentrations in the Air

3.3.1. Assessment of the Accuracy of the OSPM Model

Table 4 presents a summary of the statistical parameters of the OSPM model evaluation performed for the KRAS street canyon.
The obtained mean bias (MB) and normalized mean bias (NMB) values indicated a bias of the OSPM model. The modeling results were at a lower level when compared to the measured values (by approximately 23% for NO2 and approximately 10–16% for NOx, PM10 and PM2.5). The mean absolute error (MAE) and normalized mean error (NME) values provided information on the absolute deviation of the results from the mean value. The absolute deviation values determined ranged from 22% to 29% compared to the mean values of the observed concentrations. The FAC2 values indicated that at least 90% of the modeling results obtained fell within the range of double overestimation or underestimation of the measured concentration values. It should be noted that the values obtained of the Pearson’s correlation coefficient (r > 0.8) and the index of agreement (IOA > 0.6) confirmed the appropriate quality of the model used. However, it should be noted that the modeling results were underestimated. The methodology to determine the background of air pollutants (especially with regard to PM10 and PM2.5) was considered the main reason for the discrepancy between the modeled and observed values, due to the fact that the background level in this case was strongly determined by the seasonal and daily variability of the emissions from the municipal sector [5,27].

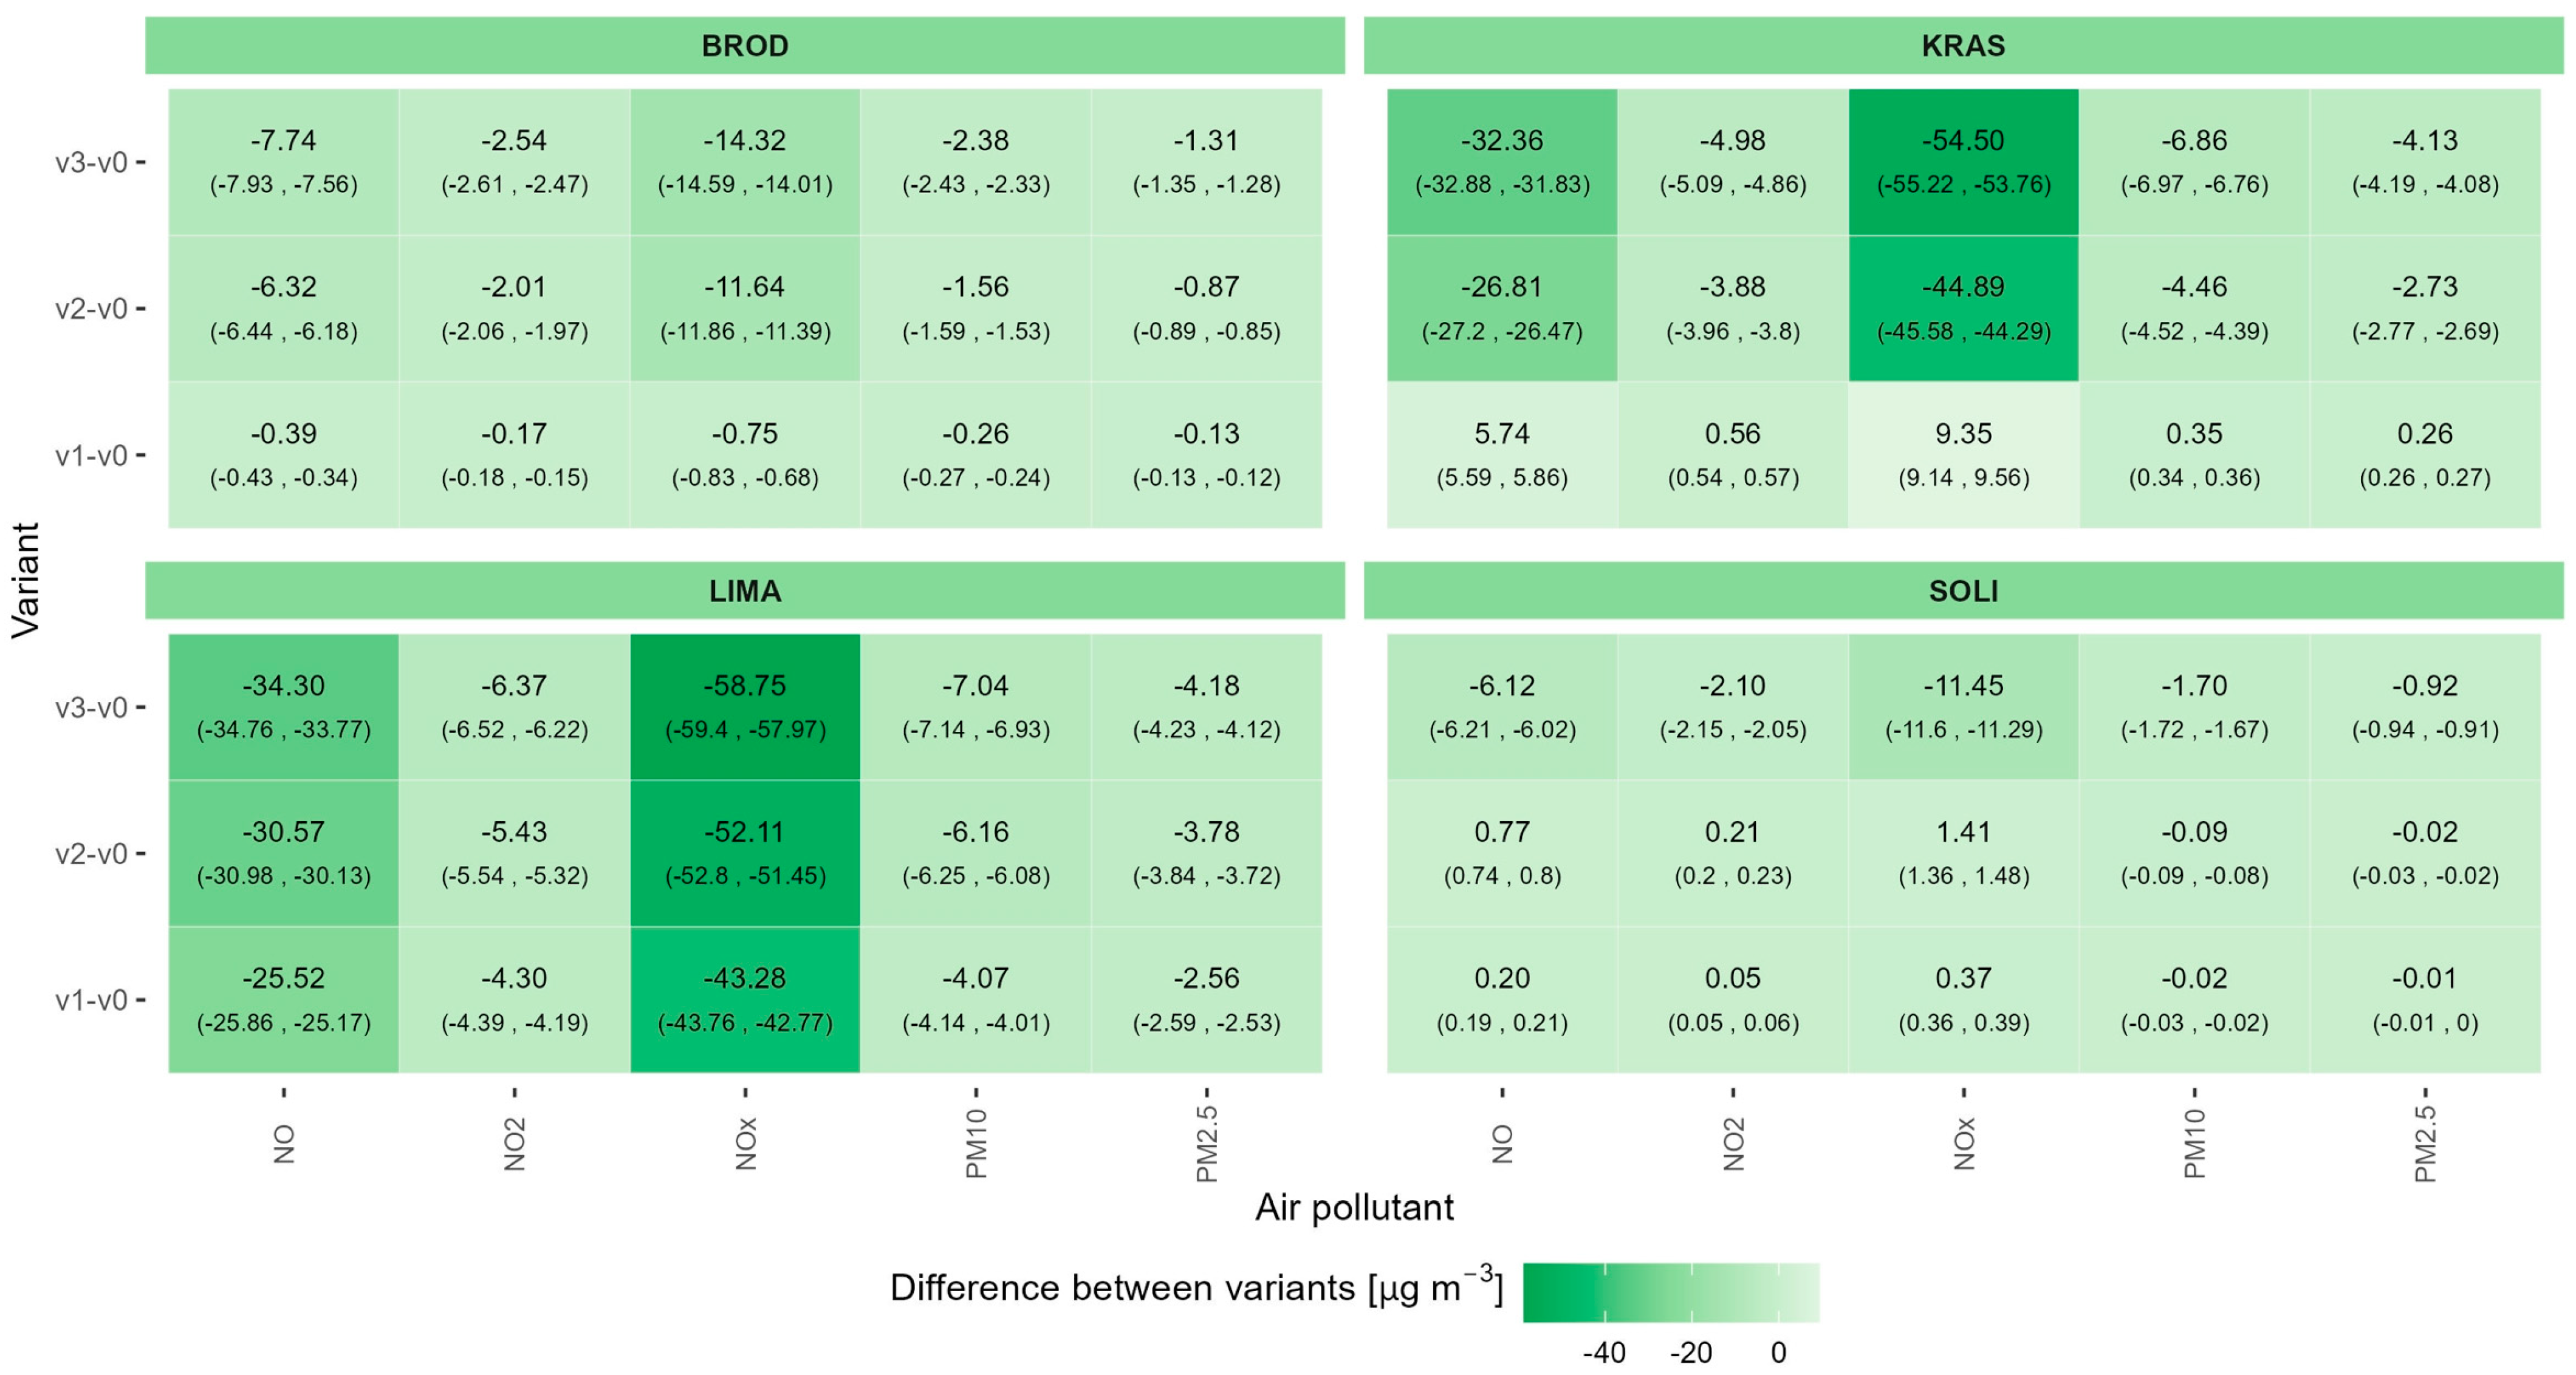
3.3.2. Predicted Changes in Air Pollutant Concentrations in the Analyzed Street Canyons

The annual average air concentrations of pollutants analyzed for individual street canyons and variants from the OSPM model are presented in Table 5. It contains the results of calculations of air pollutant concentrations reflecting only the impact of pollutant emissions from road transport within a given canyon (without taking into account background pollution) and the effect of this emission against the adopted background level (the same for all variants). The absolute changes in pollutant concentrations in the air for the latter case in variants v1, v2 and v3 compared to variant v0 are demonstrated in Figure 11. Furthermore, the Supplementary Materials present the results discussed above in percentage form (Figure S5) and as daily and weekly profiles (Figures S5 and S7). They visualize the predicted initial effects of implementing individual variants, taking into account the pollution background.
Similarly, as was the case with changes in the volume of pollutant emissions, the greatest predicted effects of reducing the average annual concentrations in the air were obtained for variants in which passenger cars and delivery vans that did not meet a given Euro standard were banned from traffic. For example, depending on the street canyon, the expected reductions in the average annual concentrations of NO, NO2, NOx, PM10 and PM2.5 in the air (compared to variant v0, taking into account the background pollution) were defined at levels of approximately 16–33%, 5–9%, 11–26%, 4–9% and 3–8%, respectively, for the variants based on the Euro 4 (BROD-v2, SOLI-v3, LIMA-v1 and KRAS-v2), and approximately 23–40%, 7–12%, 16–32%, 6–14% and 4–12% for the variants based on the Euro 5 (BROD-v3, LIMA-v2 and KRAS-v3) emission standards. However, in the case of the variant in which only vehicles meeting the Euro 6 emission standard (LIMA-v3) were admitted to traffic, these reductions reached the levels of 44.5%, 13.7%, 35.8%, 14.5% and 12.6%, respectively (Figure S5). They reflected the potential improvement of air quality in terms of the substances compared to variant v0.
For some variants that only involve the limitation of the capacity of a given road section, that is, the narrowed street section (SOLI-v1) or the reduction of the current permissible speed (BROD-v1, SOLI-v2), the expected effect of reducing the mean annual concentrations in the air of the pollutants analyzed is very low (below 1 μg·m−3) or even deterioration of air quality may occur (SOLI-v1, SOLI-v2, KRAS-v1), especially regarding NOx (Table 5). The highest absolute increase in the mean annual concentration of NOx in the air compared to the baseline variant (by approximately 9 μg·m−3 converted to NO2) was obtained in the case of the KRAS street canyon for variant v1, associated with a reduction in the average vehicle speed by several km·h−1 (Figure 9, Table S2) and an increase in NOx engine emissions (Table 3).
Figure 12 presents the average contribution of pollutant emissions from road transport in the street canyons analyzed in shaping air quality in a given canyon and variant, obtained from modeling using the OSPM model. This contribution is definitely higher in the case of NOx and lower in the case of PM10 and PM2.5, and also depends on the amount of traffic in a given canyon. The pollution background that obscures the possible relative improvement of air quality in the canyon resulting from the implementation of the analyzed variants of traffic reorganization is approximately constant for a given canyon and substances (Table 5, Figure 13). However, the lower the background level is of a given substance compared to its concentration in the air, which is only the result of emissions from road transport occurring in the analyzed street canyon, the smaller its effect (Figure 12).
The average values of the background diminution rate (BDR) of the relative changes in air concentrations of NO, NO2, NOx, PM10 and PM2.5 in the street canyons with lower traffic (BROD, SOLI) were estimated at the levels of approximately 60%, 80%, 68%, 91% and 93%, respectively (Figure 13). Analogous mean BDR values for the relative changes in the concentrations of these pollutants in the air in the street canyons with heavier traffic (LIMA, KRAS) were obtained at the following levels: 28%, 66%, 39%, 79% and 82%, respectively. This means that the pollution background has a large impact on obscuring the effects of improving air quality obtained as a result of reducing traffic-related emissions. This impact is greater when the background level of a given substance is higher and its emission from a given road section is lower. The differences obtained in this respect for the analyzed substances and street canyons indicate that local actions aimed at reducing emissions from road transport should be more visible in terms of lowering air concentrations of pollutants such as NO and NO2 (NOx) than PM10 or PM2.5.

4. Discussion

Changes in vehicle traffic volume and their average speeds implied for variants v1–v3 compared to variant v0 (Figure 7, Figure 8 and Figure 9, Tables S1 and S2) result from the assumptions made for individual scenarios of changes in traffic organization in a given street canyon (Section 2.3). They translate into changes in the volume of air pollutant emissions from road transport estimated for the canyon and variant analyzed (Table 3, Figure 10 and Figures S2–S4) as well as their concentrations in the air in the canyon (Table 5, Figure 11 and Figures S5–S7). The scope of these changes depends on the degree of interference of a given scenario into the emission sources considered (i.e., in this case, the number and type of vehicles driving through the analyzed street canyon in the analyzed period) and the average traffic speeds (and the average time of vehicles travelling through the analyzed road section).
The fact that vehicles that did not meet the emission standard adopted in a given calculation variant were not allowed in traffic obviously changed the original structure of vehicles driving in the analyzed canyons and thus changed the amount of pollutants emitted from vehicles, which affected the level of their concentrations in the air in the canyon. Scenarios appropriate for these cases usually resulted in a statistically significant reduction in pollutant concentration levels compared to variant v0, corresponding to real conditions (Figure 11, Figures S6 and S7). On the other hand, the scenarios based on keeping the basic traffic structure and resulting only in a slight reduction in the average traffic volume and/or speed (due to narrowing the street cross section or limiting the speed limit) did not result in significant changes in the emissions of pollutants into the air or in a noticeable improvement in the air quality in the canyon compared to the baseline variant. Due to the insufficient effect of lowering air pollutant concentration (if any, it was 1% at most), these measures should therefore be considered ineffective and, in cases resulting in an increase in pollutant emissions, as not recommended.
The reduction in the traffic speed, where it was relatively high in the baseline variant, resulted in an increase in NOx engine emissions in 24 h (KRAS-v2) or at selected hours of the day (KRAS-v1, SOLI-v1, SOLI-v2) (Table 3, Figures S3 and S4). Changes in the average speed of vehicles throughout the day, and especially during peak hours, translated in these cases into changes in the values of the primary NOx emission factors calculated using the COPERT model [62] and an increase in these emission factors compared to variant v0. The results of the estimate of emission factors were also affected by the calculation modes “Urban Peak” and “Urban Peak Off” included in the COPERT methodology, which made it possible to indirectly consider traffic congestion on roads depending on traffic speed [82]. For example, for the KRAS canyon, due to heavy traffic, the calculations in the “Urban Peak” mode were carried out from 6:00 a.m. to 9:00 p.m. A significant increase in NOx emissions for variant v1 between, e.g., 7:00 a.m. and 9:00 a.m. (with an assumed mean vehicle speed of 21.2 km·h−1) compared to variant v0 (for which the average traffic speed during these hours was 25.9 km·h−1) allowed for the conclusion that variant v0 was better in this respect. Thus, to reduce NOx emissions, it is important that, during peak hours, the capacity of the road is maintained at a level sufficient to keep traffic flowing.
The research carried out confirms the rather moderate effects of the introduction of low-emission zones observed in terms of improving air quality in the centers of large cities [20,24,25,30,83,84,85,86,87]. Should the introduction of a low-emission zone not reduce the traffic volume, the concentrations of NO2, NOx, PM10 and PM2.5 in the air are usually reduced by a few to several percent compared to the reference year. The reduction of air pollutant concentrations by more than 20% was observed rarely, and only when more stringent rules were introduced for entering a given zone or, as was the case during the lockdowns caused by the COVID-19 pandemic, as a result of drastic limitation of human activity and decreased need to travel [88,89,90,91,92,93,94,95]. This is also reflected in the previous modeling results of the potential effects of implementing various traffic reorganization scenarios or low-emission zones carried out for Ghent [38], Montreal [39], Belgrade [40], Riga [41], Krakow [26], Warsaw [96] and Paris [30] using the OSPM or the CALPUFF (Warsaw) and the AIRPARIF (Paris) models. Only a significant reduction in NOx and particulate matter emissions from road transport (by at least 20%) brings a noticeable improvement in air quality, although, as in this study, the estimated effect of reducing pollutant emissions does not translate into an analogous effect of reducing their concentrations in the air, which is usually much lower. This is due to the fact that the air quality in the street canyons is largely influenced by other emission sources that form the pollution background.
In 2017, which was adopted as a reference point in this research study (the baseline variant), in Krakow, there was a relatively high background of the air pollutants analyzed, reaching approximately 22, 31, 65, 39 and 27 μg·m−3 for NO, NO2, NOx, PM10 and PM2.5, respectively. This translated into a significant reduction in the relative changes in the concentrations of pollutants in the air in street canyons that occurred as a result of changes in their emission levels within a given canyon, implied in individual traffic reorganization scenarios (Figure 12). The greatest reduction (70–90%) was observed for canyons with low vehicle traffic, for which the contribution of road transport emissions in shaping air quality in the canyon was much lower compared to the background of the pollutants analyzed. On the other hand, for the KRAS street canyon with heavy traffic (approximately 25 million vehicles per year), where air quality was primarily determined by transport emissions [45,97,98,99,100,101], a huge reduction of vehicle flow and other changes affecting the reduction of air pollutant emissions brought more noticeable effects in terms of air quality improvement (Table 5, Figure 11 and Figure S5). This was also confirmed by the research results obtained for the 29-Listopada Av. street canyon in Krakow with high traffic intensity (approximately 19.5 million vehicles per year), where, for the traffic reorganization scenario involving only vehicles meeting the Euro 4 emission standard being admitted to traffic, the expected reductions in the air concentrations of NO2, NOx, PM10 and PM2.5 reached 3.3, 46.3, 4.7 and 2.9 μg·m−3, respectively, that is, approximately 7%, 24%, 9% and 8% compared to the baseline variant, having taken the pollution background into account [26].
Background pollution may reduce or increase pollutant concentrations in the air resulting from the interference of local emission sources depending on the prevailing meteorological conditions (wind speed and direction, height of the mixed layer) and whether the instantaneous background level is lower (the effect of dilution and ventilation) or greater (the effect of concentration and accumulation of pollutants) compared to concentration values resulting from emissions only from local sources [102,103,104,105]. In street canyons, additional vortices of air that flow in from outside the canyon can be formed; therefore, in the case of modeling this type of circulation effect, the location of the canyon in relation to the instantaneous or dominant (in long-term analyses) wind direction is important, as well as the building layout and configurations of the roof and walls [35,37,79,106,107,108,109]. As Krakow is dominated by winds from the west, south-west, east and north-east directions, resulting, e.g., from the city’s location in the Vistula River valley [110], the KRAS street canyon orientated transversely to these directions is the least ventilated and most susceptible to the formation of air vortices inside the canyon. These turbulences intensify the process of mixing air and exhaust gases as well as the resuspension of road dust. The average annual contribution of traffic-related particles in total PM10 and PM2.5 air concentrations in the KRAS canyon in the base variant was 22% and 19%, respectively (Figure 12), that is, at a level similar to the result obtained for the 29-Listopada Av. street canyon in Krakow [26], also located transversely to the dominant wind directions. Due to the reduction in primary and secondary dust emissions implied for variants v1–v3, the contribution of these sources to total PM10 and PM2.5 concentrations in the air for the analyzed canyon obtained as a result of modeling decreased proportionally to reduction in their emissions.
It should also be noted that the results of the modeling of PM10 and PM2.5 air concentrations are also determined in this case by the hourly variability of the background of these pollutants obtained from the air quality monitoring stations and originating from all emission sources that affect the measurement results. Thus, particles formed as a result of chemical transformations of gaseous precursors could also be included with this background pollution. The results of studies carried out using dispersion models taking into account secondary chemical reactions that occur in street canyons or evaluating the origin of fine particulate matter in urban air indicate that gaseous pollutants emitted from road traffic and other sources are important precursors for the formation of secondary inorganic and organic aerosols in the air near the streets [111,112,113]. Therefore, the reduction of secondary aerosol precursor emissions should contribute to a further reduction in the background of fine particulate matter in urban air, and thus, to its global background as well, due to the large impact of anthropogenic emission sources located in urban areas on the level of aerosols in the atmosphere [114].
The results of the OSPM model validation carried out for 2017 in the KRAS street canyon (Table 4) were at a level similar to the known results of the air quality model evaluation for street canyons [70,115,116], including the results of the evaluation carried out for the same canyon, but earlier [45,46]. In the literature, there are also cases of even higher accuracy of the predicted results [117,118,119], but they were based on the results of 24 h, not 1 h forecasts. The results of the model evaluation indicated that the modeling uncertainty was approximately 22–29% in relation to the observed average. On the other hand, the obtained percentage levels of reduction in air concentration values for some variants were within the range of this uncertainty. This means that, in these cases, the accuracy of the air quality modeling techniques used is not adequate to achieve the assumed objectives. Therefore, the studies cannot determine whether the scenarios characterized by a low level of reduction of traffic-related emissions and pollutant concentrations in the air will actually contribute to improving air quality in the street canyons analyzed. The previous experience of many urban agglomerations shows that the introduction of low emission zones in the initial period of their existence results in a reduction in NO2, PM10 and PM2.5 air concentrations from 0.5 to 7%, and reduction effects of more than 10% were sometimes observed only for NOx [25,29,83,84,85,87]. Given the multitude of factors that determine air quality, it may not be possible to determine actual changes by a few percent using emission estimation and concentration modeling techniques.
In recent years, a gradual improvement in air quality in Krakow has been observed [120], related, e.g., to the implementation of mechanisms promoting thermal modernization of buildings, the use of more environmentally friendly heating sources, and the ban on burning solid fuels in domestic stoves and low-power boilers within the city administrative boundaries that came into force on 1 September 2019 [54,121]. Consequently, reductions in emissions from road transport, especially for NOx and particulate matter, will become more important. For the effect of improved air quality to be visible not only in street canyons but also in a large area of the city, such activities should be introduced on a larger scale. In practice, this comes down to the establishment of low- or zero-emission zones, similar to those that exist in many other European cities. In Poland, these have so far been limited only to selected streets completely closed to traffic or to the oldest parts of cities with admissible entry only for eligible vehicles. Assuming the introduction of a low-emission zone in Krakow, one can expect both a reduction in the background level of individual air pollutants and a greater relative effect of reducing their concentrations in the air in the street canyons themselves.
The spontaneous replacement of the old vehicle fleet resulting from the purchase of new cars in Poland is quite slow, and the highly-developed used vehicle market, which is in high demand, does not allow for the quick elimination of old cars from Polish roads [122,123,124]. The recently observed large increase in the popularity of electric vehicles [125,126,127] and the development of hydrogen propulsion [128] provide a great opportunity to accelerate this trend. The introduction of low- or zero-emission zones in Polish cities may, therefore, actually bring about not only a significant change in the structure of vehicles driving in these zones, but also a significant reduction in the number of cars with traditional combustion engines.
Therefore, traffic management change strategies based on admitting only vehicles that meet a specific exhaust emission standard to traffic can soon lead to an effective ban on driving in these zones for a large volume of cars with internal combustion engines and, most importantly, old vehicles, in the case where their use has a large effect on the amount of pollutant emissions [129]. The reduction in traffic volume and exhaust emissions adopted in this paper for some traffic reorganization scenarios may actually be associated with a significant reduction in the number of vehicles equipped with this type of engine. Together with the progressive elimination of this type of vehicle from traffic, the contribution of non-exhaust emissions to the total balance of pollutant emissions from road transport will increase, and actions focusing on minimizing this emission will become increasingly important [9,10,16,17,130,131,132]. This is of particular importance in the case of the balance of primary and secondary particulate emissions related to road traffic and their impact on the levels of PM10 and PM2.5 in the air. In the case of nitrogen oxides, any significant reduction in their engine emissions, including large-scale replacement of internal combustion vehicles with a battery-electric fleet, should have more noticeable and immediate effects on improving air quality within street canyons and near roads [133,134,135]. On the other hand, an excessive reduction in NOx emissions with unchanged emissions of volatile organic compounds (VOCs) can lead to an increase in O3 concentrations in urban areas under the VOCs-limited regime on ozone formation (due to a lowered titration of O3 by NO) [136,137,138,139]. From this point of view, in parallel with the reduction of NOx emissions from road transport, appropriate strategies should also be implemented to control the emission of VOCs from local sources, and in urban areas in particular, as part of greening and re-naturing programs, low-VOCs-emitting tree species should be used [140].

5. Conclusions

The conducted research presents the degree of difficulty in the implementation of the task aimed at improving air quality in street canyons as far as the two most severe groups of pollutants are concerned, NOx (NO and NO2) and particulate matter (PM10 and PM2.5), especially when there is a relatively high background of these pollutants, characteristic of cities such as Krakow. Four street canyons that vary in traffic volume and two groups of traffic reorganization scenarios were analyzed, for which, clear differences were obtained with respect to the emission levels of the pollutants considered and their concentrations in the air.
A significant reduction in street canyon air concentrations of NO (about 15–44%) and NO2 (about 5–14%), as well as PM10 (about 4–14%) and PM2.5 (about 3–13%), compared to the adopted base year, was possible only in the scenarios in which there had been a considerable reduction in the traffic volume of cars with combustion engines driving through a given canyon and the elimination of old vehicles from traffic (only vehicles that met the Euro 4–6 emission standards were admitted). The maximum effects of reducing air pollutant concentrations were possible when only vehicles meeting the Euro 6 emission standard were admitted to traffic, with the additional assumption of the limited possibility of replacing banned cars with new combustion vehicles. This type of additional restriction appears to be realistic in light of the observed trend of replacing vehicles with traditional combustion engines with electric vehicles, and ultimately, with hydrogen ones as well.
Among the scenarios considered for changes in car traffic organization, variants aimed at calming traffic in a given street canyon seemed to be a promising solution. For example, the reduced capacity of a given road section may encourage the more widespread use of public transport or bicycles and electric scooters (which can move along bicycle paths) or transfer car traffic to other city zones. Nevertheless, simulations carried out with the use of the Krakow Traffic Model in such cases did not exhibit a significant reduction in the stream of motor vehicles. Therefore, the estimated changes in air pollutants emission were usually small and rarely brought about the desired effects. Great caution should also be exercised in the cases of changes in the speed limits, and a detailed assessment should be made of whether this will result in a decrease or increase in the emissions of individual air pollutants.
The impact of changes in traffic organization on air quality can be obscured by background pollution resulting from other emission sources to an extent, depending on the background level and the contribution of road transport emissions to the overall air pollution in a given canyon. In low-traffic street canyons (1–4 million vehicles per year), the average background reduction in relative changes in air concentrations can exceed 70% for NO2 and 90% for PM10 and PM2.5, especially with a high background of these pollutants (close to or exceeding the permissible annual average level). The effects of implementing traffic reorganization scenarios (improving air quality) should be much more visible in street canyons with much higher traffic (e.g., 10–25 million vehicles per year), where the initial contribution of NOx and fine dust emissions from road transport (before their limitation) in shaping air quality may exceed 60% and 20%, respectively.
The results obtained for the model accuracy assessment (22–29%) and the concentration reductions for individual variants are convergent. This means that it is impossible to determine the reliable effects of air quality improvement using emission estimation and air quality modeling methods. To observe these effects, it is advisable to use air quality monitoring data and maintain air quality monitoring stations at individual locations before and after the implementation of a given air quality improvement measure. Further research is recommended in the field of optimizing the methods of reducing the impact of traffic-related pollutants on air quality (and consequently, on human health), as well as in the field of increasing the accuracy of the modeling methods used for this purpose.

Supplementary Materials

The following supporting information can be downloaded at: https://www.mdpi.com/article/10.3390/app13116431/s1, Figure S1: Detailed data on vehicles registered in the city of Krakow and other counties of the Malopolska Province in the analyzed period; Table S1: Comparison of the total annual (y), daily average (d) and hourly average (h) traffic volumes of vehicles predicted for individual street canyons and variants. Daily average and hourly average values are estimated, rounded to the full number of vehicles; Table S2: Average vehicle speeds determined for individual street canyons and variants; Figure S2: The matrix of percentage changes in the mean annual emission factors of the analyzed pollutants from individual street canyons obtained for variants v1, v2 and v3 compared to variant v0; Figure S3: Daily variability of differences in the average 1-h emissions of pollutants into the air from the analyzed canyons obtained for variants v1, v2 and v3 in relation to variant v0 (with 95% confidence intervals); Figure S4: The annual variability of differences in the average monthly emissions of pollutants to the air from the analyzed canyons obtained for variants v1, v2 and v3 in relation to variant v0 (with 95% confidence intervals); Figure S5: The matrix of percentage changes in the mean annual concentrations of the analyzed air pollutants in individual street canyons obtained for variants v1, v2 and v3 compared to variant v0 (including background pollution); Figure S6: Daily variability of absolute differences in the mean 1-h pollutant concentrations in the air in the analyzed canyons obtained for variants v1, v2 and v3 in relation to variant v0 (with 95% confidence intervals); Figure S7: The annual variability of absolute differences in the mean 1-h pollutant concentrations in the air in the analyzed canyons obtained for variants v1, v2 and v3 in relation to variant v0 (with 95% confidence intervals).

Author Contributions

Conceptualization, R.O. and M.B.; methodology, R.O., M.B., M.R. and P.B.; software, R.O., M.R. and P.B.; validation, R.O., M.B. and M.R.; formal analysis, R.O., M.B. and M.R.; investigation, R.O., M.B., M.R. and P.B.; resources, R.O., M.R. and P.B.; data curation, R.O., M.R. and P.B.; writing—original draft preparation, R.O.; writing—review and editing, R.O., M.B., M.R. and P.B.; visualization, R.O., M.R. and P.B.; supervision, M.B.; project administration, R.O. and M.B.; funding acquisition, R.O. and M.B. All authors have read and agreed to the published version of the manuscript.

Funding

The work was carried out as part of research associated with the Ministry of Science and Higher Education subsidy to maintain scientific potential (Contract no. 16.16.150.545). This article also uses the results of research studies carried out as part of a research project financed by the Municipality of Krakow (Contract No. 25.25.150.571).

Institutional Review Board Statement

Not applicable.

Informed Consent Statement

Not applicable.

Data Availability Statement

The additional data presented in this study are available in Supplementary Materials. Other data sharing is not applicable to this article.

Acknowledgments

The authors would like to take this opportunity to express great thanks to Marian Mazur and employees of the Department of Municipal Services and Climate in the Municipality of Krakow City for help in the implementation of the research. The authors also express their gratitude to the following institutions that make publicly available the measurement data used in the research: the Chief Inspectorate of Environmental Protection (GIOŚ) in Warsaw, the Institute of Meteorology and Water Management (IMWM) of the National Research Institute in Warsaw and the Environmental Physics Group at the Faculty of Physics and Applied Computer Science at the AGH University of Science and Technology in Krakow.

Conflicts of Interest

The authors declare no conflict of interest.

Abbreviations

AIRPARIFAir quality observatory in the Paris region
BRODBrodowicza Street
BUJAKABujaka Street
CALPUFFCalifornia Puff-Advection Model
COPERTEU standard vehicle emissions calculator
CORINAIRCore Inventory of Air Emissions of European Environment Agency
ECMWFEuropean Center for Medium-Range Weather Forecasts
ERA5The fifth generation of ECMWF reanalysis
FAC2Fraction of predictions within a factor of two
IOAIndex of agreement
KRASKrasińskiego Avenue
LIMALimanowskiego Street
MAEMean absolute error
MBMean bias
NMBNormalized mean bias
NMENormalized mean error
OSPMOperational Street Pollution Model
RMSERoot mean square error
SOLISolidarności Avenue
U.S. EPAUnited States Environmental Protection Agency

References

  1. Kassomenos, P.; Vardoulakis, S.; Chaloulakou, A.; Grivas, G.; Borge, R.; Lumbreras, J. Levels, sources and seasonality of coarse particles (PM10-PM2.5) in three European capitals-Implications for particulate pollution control. Atmos. Environ. 2012, 54, 337–347. [Google Scholar] [CrossRef]
  2. Cyrys, J.; Eeftens, M.; Heinrich, J.; Ampe, C.; Armengaud, A.; Beelen, R.; Bellander, T.; Beregszaszi, T.; Birk, M.; Cesaroni, G.; et al. Variation of NO2 and NOx concentrations between and within 36 European study areas: Results from the ESCAPE study. Atmos. Environ. 2012, 62, 374–390. [Google Scholar] [CrossRef]
  3. Chart-Asa, C.; Gibson, J.M.D. Health impact assessment of traffic-related air pollution at the urban project scale: Influence of variability and uncertainty. Sci. Total Environ. 2015, 506, 409–421. [Google Scholar] [CrossRef]
  4. Zhang, Z.H.; Khlystov, A.; Norford, L.K.; Tan, Z.K.; Balasubramanian, R. Characterization of traffic-related ambient fine particulate matter (PM2.5) in an Asian city: Environmental and health implications. Atmos. Environ. 2017, 161, 132–143. [Google Scholar] [CrossRef]
  5. Oleniacz, R.; Gorzelnik, T. Assessment of the Variability of Air Pollutant Concentrations at Industrial, Traffic and Urban Background Stations in Krakow (Poland) Using Statistical Methods. Sustainability 2021, 13, 5623. [Google Scholar] [CrossRef]
  6. Bukowiecki, N.; Lienemann, P.; Hill, M.; Furger, M.; Richard, A.; Amato, F.; Prévôt, A.S.H.; Baltensperger, U.; Buchmann, B.; Gehrig, R. PM10 emission factors for non-exhaust particles generated by road traffic in an urban street canyon and along a freeway in Switzerland. Atmos. Environ. 2010, 44, 2330–2340. [Google Scholar] [CrossRef]
  7. Rakowska, A.; Wong, K.C.; Townsend, T.; Chan, K.L.; Westerdahl, D.; Ng, S.; Močnik, G.; Drinovec, L.; Ning, Z. Impact of traffic volume and composition on the air quality and pedestrian exposure in urban street canyon. Atmos. Environ. 2014, 98, 260–270. [Google Scholar] [CrossRef]
  8. Wang, H.; Brimblecombe, P.; Ngan, K. A numerical study of local traffic volume and air quality within urban street canyons. Sci. Total Environ. 2021, 791, 148138. [Google Scholar] [CrossRef]
  9. Harrison, R.M.; Allan, J.; Carruthers, D.; Heal, M.R.; Lewis, A.C.; Marner, B.; Murrells, T.; Williams, A. Non-Exhaust Vehicle Emissions of Particulate Matter and VOC from Road Traffic: A Review. Atmos. Environ. 2021, 262, 118592. [Google Scholar] [CrossRef]
  10. Piscitello, A.; Bianco, C.; Casasso, A.; Sethi, R. Non-exhaust traffic emissions: Sources, characterization, and mitigation measures. Sci. Total Environ. 2021, 766, 144440. [Google Scholar] [CrossRef]
  11. Rienda, I.C.; Alves, C.A. Road dust resuspension: A review. Atmos. Res. 2021, 261, 105740. [Google Scholar] [CrossRef]
  12. Alshetty, D.; Shiva Nagendra, S.N. Urban characteristics and its influence on resuspension of road dust, air quality and exposure. Air Qual. Atmos. Health 2022, 15, 273–287. [Google Scholar] [CrossRef]
  13. Ortolani, C.; Vitale, M. The importance of local scale for assessing, monitoring and predicting of air quality in urban areas. Sustain. Cities Soc. 2016, 26, 150–160. [Google Scholar] [CrossRef]
  14. Lee, C. Impacts of urban form on air quality: Emissions on the road and concentrations in the US metropolitan areas. J. Environ. Manag. 2019, 246, 192–202. [Google Scholar] [CrossRef]
  15. Voordeckers, D.; Meysman, F.J.R.; Billen, P.; Tytgat, T.; Van Acker, M. The impact of street canyon morphology and traffic volume on NO2 values in the street canyons of Antwerp. Build. Environ. 2021, 197, 107825. [Google Scholar] [CrossRef]
  16. Bogacki, M.; Oleniacz, R.; Rzeszutek, M.; Szulecka, A.; Mazur, M. The impact of intense street cleaning on particulate matter air concentrations: A case study of a street canyon in Krakow (Poland). E3S Web Conf. 2018, 45, 00009. [Google Scholar] [CrossRef]
  17. Gulia, S.; Goyal, P.; Goyal, S.K.; Kumar, R. Re-suspension of road dust: Contribution, assessment and control through dust suppressants—A review. Int. J. Environ. Sci. Technol. 2019, 16, 1717–1728. [Google Scholar] [CrossRef]
  18. Abhijith, K.V.; Kumar, P.; Gallagher, J.; McNabola, A.; Baldauf, R.; Pilla, F.; Broderick, B.; Di Sabatino, S.; Pulvirenti, B. Air pollution abatement performances of green infrastructure in open road and built-up street canyon environments—A review. Atmos. Environ. 2017, 162, 71–86. [Google Scholar] [CrossRef]
  19. Chen, X.; Wang, X.; Wu, X.; Guo, J.; Zhou, Z. Influence of roadside vegetation barriers on air quality inside urban street canyons. Urban For. Urban Green. 2021, 63, 127219. [Google Scholar] [CrossRef]
  20. Huang, Y.; Lei, C.; Liu, C.H.; Perez, P.; Forehead, H.; Kong, S.; Zhou, J.L. A review of strategies for mitigating roadside air pollution in urban street canyons. Environ. Pollut. 2021, 280, 116971. [Google Scholar] [CrossRef] [PubMed]
  21. Zhang, L.; Zhang, Z.; Feng, C.; Tian, M.; Gao, Y. Impact of various vegetation configurations on traffic fine particle pollutants in a street canyon for different wind regimes. Sci. Total Environ. 2021, 789, 147960. [Google Scholar] [CrossRef]
  22. Bright, V.B.; Bloss, W.J.; Cai, X. Urban street canyons: Coupling dynamics, chemistry and within-canyon chemical processing of emissions. Atmos. Environ. 2013, 68, 127–142. [Google Scholar] [CrossRef]
  23. Střižík, M.; Zelinger, Z.; Kubát, P.; Civiš, S.; Bestová, I.; Nevrlý, V.; Kadeřábek, P.; Čadil, J.; Berger, P.; Černý, A.; et al. Influence of photochemical processes on traffic-related airborne pollutants in urban street canyon. J. Atmos. Sol.-Terr. Phys. 2016, 147, 1–10. [Google Scholar] [CrossRef]
  24. Bigazzi, A.Y.; Rouleau, M. Can traffic management strategies improve urban air quality? A review of the evidence. J. Transp. Health 2017, 7, 111–124. [Google Scholar] [CrossRef]
  25. Holman, C.; Harrison, R.; Querol, X. Review of the efficacy of low emission zones to improve urban air quality in European cities. Atmos. Environ. 2015, 111, 161–169. [Google Scholar] [CrossRef]
  26. Bogacki, M.; Oleniacz, R.; Rzeszutek, M.; Bździuch, P.; Szulecka, A.; Gorzelnik, T. Assessing the impact of road traffic reorganization on air quality: A street canyon case study. Atmosphere 2020, 11, 695. [Google Scholar] [CrossRef]
  27. Host, S.; Honoré, C.; Joly, F.; Saunal, A.; Le Tertre, A.; Medina, S. Implementation of various hypothetical low emission zone scenarios in Greater Paris: Assessment of fine-scale reduction in exposure and expected health benefits. Environ. Res. 2020, 185, 109405. [Google Scholar] [CrossRef]
  28. Lurkin, V.; Hambuckers, J.; Van Woensel, T. Urban low emissions zones: A behavioral operations management perspective. Transp. Res. A Policy Pract. 2021, 144, 222–240. [Google Scholar] [CrossRef]
  29. Santos, F.M.; Gómez-Losada, Á.; Pires, J.C. Impact of the implementation of Lisbon low emission zone on air quality. J. Hazard. Mater. 2019, 365, 632–641. [Google Scholar] [CrossRef]
  30. Poulhès, A.; Proulhac, L. The Paris Region low emission zone, a benefit shared with residents outside the zone. Transp. Res. D Transp. Env. 2021, 98, 102977. [Google Scholar] [CrossRef]
  31. Holnicki, P.; Kałuszko, A.; Nahorski, Z. Scenario Analysis of Air Quality Improvement in Warsaw, Poland, by the End of the Current Decade. Atmosphere 2022, 13, 1613. [Google Scholar] [CrossRef]
  32. Moreno, E.; Schwarz, L.; Host, S.; Chanel, O.; Benmarhnia, T. The environmental justice implications of the Paris low emission zone: A health and economic impact assessment. Air Qual. Atmos. Health 2022, 15, 2171–2184. [Google Scholar] [CrossRef]
  33. Hyka, I.; Hysa, A.; Dervishi, S.; Solomun, M.K.; Kuriqi, A.; Vishwakarma, D.K.; Sestras, P. Spatiotemporal Dynamics of Landscape Transformation in Western Balkans’ Metropolitan Areas. Land 2022, 11, 1892. [Google Scholar] [CrossRef]
  34. TomTom Traffic Index—Ranking 2021. Available online: https://www.tomtom.com/traffic-index/ranking/ (accessed on 20 December 2022).
  35. Berkowicz, R. OSPM—A parameterised street pollution model. Environ. Monit. Assess. 2000, 65, 323–331. [Google Scholar] [CrossRef]
  36. Vardoulakis, S.; Valiantis, M.; Milner, J.; ApSimon, H. Operational air pollution modelling in the UK—Street canyon applications and challenges. Atmos. Environ. 2007, 41, 4622–4637. [Google Scholar] [CrossRef]
  37. Berkowicz, R.; Ketzel, M.; Jensen, S.S.; Hvidberg, M.; Raaschou-Nielsen, O. Evaluation and application of OSPM for traffic pollution assessment for a large number of street locations. Environ. Modell. Softw. 2008, 23, 296–303. [Google Scholar] [CrossRef]
  38. Mensink, C.; Cosemans, G. From traffic flow simulations to pollutant concentrations in street canyons and backyards. Environ. Modell. Softw. 2008, 23, 288–295. [Google Scholar] [CrossRef]
  39. Ghafghazi, G.; Hatzopoulou, M. Simulating the air quality impacts of traffic calming schemes in a dense urban neighborhood. Transp. Res. D Transp. Env. 2015, 35, 11–22. [Google Scholar] [CrossRef]
  40. Lazić, L.; Urošević, M.A.; Mijić, Z.; Vuković, G.; Ilić, L. Traffic contribution to air pollution in urban street canyons: Integrated application of the OSPM, moss biomonitoring and spectral analysis. Atmos. Environ. 2016, 141, 347–360. [Google Scholar] [CrossRef]
  41. Steinberga, I.; Sustere, L.; Bikse, J.; Bikse, J., Jr.; Kleperis, J. Traffic induced air pollution modeling: Scenario analysis for air quality management in street canyon. Procedia Comput. Sci. 2019, 149, 384–389. [Google Scholar] [CrossRef]
  42. Giannouli, M.; Kalognomou, E.A.; Mellios, G.; Moussiopoulos, N.; Samaras, Z.; Fiala, J. Impact of European emission control strategies on urban and local air quality. Atmos. Environ. 2011, 45, 4753–4762. [Google Scholar] [CrossRef]
  43. Hülsmann, F.; Gerike, R.; Ketzel, M. Modelling traffic and air pollution in an integrated approach-the case of Munich. Urban Clim. 2014, 10, 732–744. [Google Scholar] [CrossRef]
  44. Tang, J.; McNabola, A.; Misstear, B. The potential impacts of different traffic management strategies on air pollution and public health for a more sustainable city: A modelling case study from Dublin, Ireland. Sustain. Cities Soc. 2020, 60, 102229. [Google Scholar] [CrossRef]
  45. Rzeszutek, M.; Bogacki, M. Ocena modelu dyspersji zanieczyszczeń powietrza OSPM: Studium przypadku, Polska, Kraków. Rocznik Ochr. Srod. 2016, 18, 351–362. [Google Scholar]
  46. Rzeszutek, M.; Bogacki, M.; Bździuch, P.; Szulecka, A. Improvement assessment of the OSPM model performance by considering the secondary road dust emissions. Transp. Res. D Trans. Environ. 2019, 68, 137–149. [Google Scholar] [CrossRef]
  47. Solecka, K.; Żak, J. Integration of the urban public transportation system with the application of traffic simulation. Transp. Res. Proc. 2014, 3, 259–268. [Google Scholar] [CrossRef]
  48. Bogacki, M.; Bździuch, P. Urban bus emission trends in the Krakow metropolitan area (Poland) from 2010 to 2015. Transp. Res. D Transp. Env. 2019, 67, 33–50. [Google Scholar] [CrossRef]
  49. Pieriegud, J. E-mobility on-demand in the Central and Eastern European countries: Current trends, barriers and opportunities. Transp. Econ. Logist. 2019, 81, 143–154. [Google Scholar] [CrossRef]
  50. Drabicki, A.; Szarata, A.; Kucharski, R. Suppressing the effects of induced traffic in urban road systems: Impact assessment with macrosimulation tools-results from the city of Krakow (Poland). Transp. Res. Proc. 2020, 47, 131–138. [Google Scholar] [CrossRef]
  51. Kucharski, R.; Drabicki, A.; Paszkowski, J.; Szarata, A. Lewis-Mogridge Points: A Nonarbitrary Method to Include Induced Traffic in Cost-Benefit Analyses. J. Adv. Transp. 2020, 2020, 3096260. [Google Scholar] [CrossRef]
  52. Macioszek, E.; Kurek, A. P&R parking and bike-sharing system as solutions supporting transport accessibility of the city. Transp. Probl. 2020, 15, 275–286. [Google Scholar] [CrossRef]
  53. Štraub, D.; Gajda, A. E-scooter sharing schemes operational zones in Poland: Dataset on voivodeship capital cities. Data Brief 2020, 33, 106560. [Google Scholar] [CrossRef] [PubMed]
  54. Air Quality Plan for the Małopolska Region from 2020 (28/09/20). Available online: https://powietrze.malopolska.pl/wp-content/uploads/2021/07/AQP_Malopolska_Full_text.pdf (accessed on 30 June 2021).
  55. Statistical Office in Krakow. Available online: https://krakow.stat.gov.pl/en/ (accessed on 15 December 2022).
  56. Szarata, A.; Kulpa, T.; Kucharski, R.; Pyzik, M.; Drabicki, A.; Siwek, K.; Wójcik, M.; Banet, K. Krakowski Model Ruchu 2014; Politechnika Krakowska, PBS Sp. z o.o.; EKKOM Sp. z o.o.; International Management Services Sp. z o.o.: Kraków, Poland, 2015.
  57. Centralna Ewidencja Pojazdów i Kierowców. Available online: http://www.cepik.gov.pl/ (accessed on 30 September 2019). (In Polish)
  58. Development of the Methodology and Estimation of the External Costs of Air Pollution Emitted from Road Transport at National Level. GUS Research and Statistical Education Centre, Szczecin, Poland, Final Report No. 20/BR/POPT/CBiES/2017. Available online: https://stat.gov.pl/statystyki-eksperymentalne/uslugi-publiczne/ (accessed on 30 June 2022). (In Polish)
  59. PTV-Visum. Available online: https://www.myptv.com/en/mobility-software/ptv-visum (accessed on 30 June 2022).
  60. Szarata, A. Wyniki badań podróży w Krakowie-KBR 2013. Transp. Miej. Region. 2015, 5, 4–8. [Google Scholar]
  61. EMEP/EEA Air Pollutant Emission Inventory Guidebook 2016, Part B, Section 1.A.3.b.i-iv, Road Transport, EEA Report No 21/2016 (Update July 2018), pp. 1 EEA, 2018143. Available online: https://www.eea.europa.eu/publications/emep-eea-guidebook-2016/part-b-sectoral-guidance-chapters/1-energy/1-a-combustion/1-a-3-b-i/view (accessed on 31 December 2018).
  62. EMISIA Conscious of Transport’s Impact—COPERT. Available online: https://www.emisia.com/utilities/copert/ (accessed on 31 December 2018).
  63. Johnson, T.; Joshi, A. Review of Vehicle Engine Efficiency and Emissions. SAE Int. J. Engines 2018, 11, 1307–1330. Available online: https://www.jstor.org/stable/26649163 (accessed on 31 January 2019). [CrossRef]
  64. U.S. EPA. AP-42, Compilation of Air Pollutant Emission Factors, 5th ed.; Section 13.2.1, Paved Roads; U.S. EPA: Washington, DC, USA, 2011; Volume I, Chapter 13; pp. 1–15. Available online: https://www3.epa.gov/ttn/chief/ap42/ch13/final/c13s0201.pdf (accessed on 31 December 2018).
  65. U.S. EPA. Emission Factor Documentation for AP-42; Section 13.2.1, Paved Roads; U.S. EPA: Washington, DC, USA, 2011; pp. 4–54. Available online: https://www3.epa.gov/ttn/chief/ap42/ch13/bgdocs/b13s0201.pdf (accessed on 31 December 2018).
  66. Cowherd, C. Background Document for Revisions to Fine Fraction Ratios Used for AP-42 Fugitive Dust Emission Factors; Technical Report MRI Project No. 110397; Midwest Research Institute: Denver, CO, USA, 2006; pp. 1–15. Available online: https://www3.epa.gov/ttnchie1/ap42/ch13/bgdocs/b13s02.pdf (accessed on 31 December 2018).
  67. Bogacki, M.; Mazur, M.; Oleniacz, R.; Rzeszutek, M.; Szulecka, A. Re-entrained road dust PM10 emission from selected streets of Krakow and its impact on air quality. E3S Web Conf. 2018, 28, 01003. [Google Scholar] [CrossRef]
  68. Hu, W.; Zhong, Q. Using the OSPM model on pollutant dispersion in an urban street canyon. Adv. Atmos. Sci. 2010, 27, 621–628. [Google Scholar] [CrossRef]
  69. Kakosimos, K.E.; Hertel, O.; Ketzel, M.; Berkowicz, R. Operational Street Pollution Mod-l (OSPM)—A review of performed application and validation studies, and future prospects. Environ. Chem. 2010, 7, 485–503. [Google Scholar] [CrossRef]
  70. Elbir, T.; Kara, M.; Bayram, A.; Altiok, H.; Dumanoglu, Y. Comparison of predicted and observed PM10 concentrations in several urban street canyons. Air Qual. Atmos. Health 2011, 4, 121–131. [Google Scholar] [CrossRef]
  71. Ottosen, T.B.; Kakosimos, K.E.; Johansson, C.; Hertel, O.; Brandt, J.; Skov, H.; Berkowicz, R.; Ellermann, T.; Jensen, S.S.; Ketzel, M. Analysis of the impact of inhomogeneous emissions in the Operational Street Pollution Model (OSPM). Geosci. Model Dev. 2015, 8, 3231–3245. [Google Scholar] [CrossRef]
  72. Berkowicz, R.; Hertel, O.; Larsen, S.E.; Soerensen, N.N.; Nielsen, M. Modelling Traffic Pollution in Streets; Technical Report; National Environmental Research Institute: Roskilde, Denmark, 1997; Available online: https://orbit.dtu.dk/files/128001317/Modelling_traffic_pollution_in_streets.pdf (accessed on 31 December 2018).
  73. Kumar, P.; Ketzel, M.; Vardoulakis, S.; Pirjola, L.; Britter, R. Dynamics and dispersion modelling of nanoparticles from road traffic in the urban atmospheric environment—A review. J. Aerosol. Sci. 2011, 42, 580–603. [Google Scholar] [CrossRef]
  74. Bennett, N.D.; Croke, B.F.W.; Guariso, G.; Guillaume, J.H.A.; Hamilton, S.H.; Jakeman, A.J.; Marsili-Libelli, S.; Newham, L.T.H.; Norton, J.P.; Perrin, C.; et al. Characterising performance of environmental models. Environ. Model. Softw. 2013, 40, 1–20. [Google Scholar] [CrossRef]
  75. Carslaw, D.C.; Ropkins, K. Openair—An R package for air quality data analysis. Environ. Model. Softw. 2012, 27–28, 52–61. [Google Scholar] [CrossRef]
  76. Emery, C.; Liu, Z.; Russell, A.G.; Odman, M.T.; Yarwood, G.; Kumar, N. Recommendations on statistics and benchmarks to assess photochemical model performance. J. Air Waste Manag. Assoc. 2017, 67, 582–598. [Google Scholar] [CrossRef] [PubMed]
  77. Willmott, C.J.; Robeson, S.M.; Matsuura, K. A refined index of model performance. Int. J. Climatol. 2012, 32, 2088–2094. [Google Scholar] [CrossRef]
  78. Serwis Meteo—AGH, WFiIS, ZFŚ. Available online: http://meteo.ftj.agh.edu.pl (accessed on 30 September 2019). (In Polish).
  79. Ketzel, M.; Jensen, S.S.; Brandt, J.; Ellermann, T.; Olesen, H.R.; Berkowicz, R.; Hertel, O. Evaluation of the street pollution model OSPM for measurements at 12 streets stations using a newly developed and freely available evaluation tool. J. Civ. Environ. Eng. 2012, S1, 004. [Google Scholar] [CrossRef]
  80. Oleniacz, R.; Gorzelnik, T.; Szulecka, A. A comparative analysis of air pollutant concentrations and inflow trajectories: A case study of selected cities in South-Eastern Poland. E3S Web Conf. 2018, 45, 00060. [Google Scholar] [CrossRef]
  81. Hoffmann, L.; Günther, G.; Li, D.; Stein, O.; Wu, X.; Griessbach, S.; Heng, Y.; Konopka, P.; Müller, R.; Vogel, B.; et al. From ERA-Interim to ERA5: The considerable impact of ECMWF’s next-generation reanalysis on Lagrangian transport simulations. Atmos. Chem. Phys. 2019, 19, 3097–3214. [Google Scholar] [CrossRef]
  82. Samaras, C.; Tsokolis, D.; Toffolo, S.; Magra, G.; Ntziachristos, L.; Samaras, Z. Improving fuel consumption and CO2 emissions calculations in urban areas by coupling a dynamic micro traffic model with an instantaneous emissions model. Transp. Res. D Trans. Environ. 2018, 65, 772–783. [Google Scholar] [CrossRef]
  83. Boogaard, H.; Janssen, N.A.; Fischer, P.H.; Kos, G.P.; Weijers, E.P.; Cassee, F.R.; van der Zee, S.C.; de Hartog, J.J.; Meliefste, K.; Wang, M.; et al. Impact of low emission zones and local traffic policies on ambient air pollution concentrations. Sci. Total Environ. 2012, 435, 132–140. [Google Scholar] [CrossRef]
  84. Panteliadis, P.; Strak, M.; Hoek, G.; Weijers, E.; van der Zee, S.; Dijkema, M. Implementation of a low emission zone and evaluation of effects on air quality by long-term monitoring. Atmos. Environ. 2014, 86, 113–119. [Google Scholar] [CrossRef]
  85. Ferreira, F.; Gomes, P.; Tente, H.; Carvalho, A.C.; Pereira, P.; Monjardino, J. Air quality improvements following implementation’of Lisbon’s Low Emission Zone. Atmos. Environ. 2015, 122, 373–381. [Google Scholar] [CrossRef]
  86. Amundsen, A.H.; Sundvor, I. Low Emission Zones in Europe: Requirement, Enforcement and Air Quality. TØI Report No. 1666/2018. Available online: https://www.toi.no/getfile.php/1349204/Publikasjoner/T%C3%98I%20rapporter/2018/1666-2018/1666-2018-elektronisk.pdf (accessed on 31 December 2022).
  87. Tartakovsky, D.; Kordova-Biezuner, L.; Berlin, E.; Broday, D. Air quality impacts of the low emission zone policy in Haifa. Atmos. Environ. 2020, 232, 117472. [Google Scholar] [CrossRef]
  88. Xiang, J.; Austin, E.; Gould, T.; Larson, T.; Shirai, J.; Liu, Y.; Marshall, J.; Seto, E. Impacts of the COVID-19 responses on traffic-related air pollution in a Northwestern US city. Sci. Total Environ. 2020, 747, 141325. [Google Scholar] [CrossRef]
  89. Lipfert, F.W.; Wyzga, R.E. COVID-19 and the Environment, Review and Analysis. Environments 2021, 8, 42. [Google Scholar] [CrossRef]
  90. Matthias, V.; Quante, M.; Arndt, J.A.; Badeke, R.; Fink, L.; Petrik, R.; Feldner, J.; Schwarzkopf, D.; Link, E.M.; Ramacher, M.O.P.; et al. The role of emission reductions and the meteorological situation for air quality improvements during the COVID-19 lockdown period in central Europe. Atmos. Chem. Phys. 2021, 21, 13931–13971. [Google Scholar] [CrossRef]
  91. Skirienė, A.F.; Stasiškienė, Ž. COVID-19 and air pollution: Measuring pandemic impact to air quality in five European countries. Atmosphere 2021, 12, 290. [Google Scholar] [CrossRef]
  92. Viteri, G.; de Mera, Y.D.; Rodríguez, A.; Rodríguez, D.; Tajuelo, M.; Escalona, A.; Aranda, A. Impact of SARS-CoV-2 lockdown and de-escalation on air-quality parameters. Chemosphere 2021, 265, 129027. [Google Scholar] [CrossRef]
  93. Wu, C.L.; Wang, H.W.; Cai, W.J.; Ni, A.N.; Peng, Z.R. Impact of the COVID-19 lockdown on roadside traffic-related air pollution in Shanghai, China. Build. Environ. 2021, 194, 107718. [Google Scholar] [CrossRef]
  94. Akan, A.P.; Coccia, M. Changes of Air Pollution between Countries Because of Lockdowns to Face COVID-19 Pandemic. Appl. Sci. 2022, 12, 12806. [Google Scholar] [CrossRef]
  95. Badyda, A.; Brzeziński, A.; Dybicz, T.; Jesionkiewicz-Niedzińska, K.; Olszewski, P.; Osińska, B.; Szagała, P.; Mucha, D. Impact of COVID-19 Mobility Changes on Air Quality in Warsaw. Appl. Sci. 2022, 12, 7372. [Google Scholar] [CrossRef]
  96. Holnicki, P.; Nahorski, Z.; Kałuszko, A. Impact of Vehicle Fleet Modernization on the Traffic-Originated Air Pollution in an Urban Area-A Case Study. Atmosphere 2021, 12, 1581. [Google Scholar] [CrossRef]
  97. Choi, H.; Melly, S.; Spengler, J. Intraurban and longitudinal variability of classical pollutants in Kraków, Poland, 2000–2010. Int. J. Environ. Res. Public Health 2015, 12, 4967–4991. [Google Scholar] [CrossRef] [PubMed]
  98. Chlebowska-Styś, A.; Kobus, D.; Zathey, M.; Sówka, I. The impact of road transport on air quality in selected Polish cities. Ecol. Chem. Eng. S 2019, 26, 19–36. [Google Scholar] [CrossRef]
  99. Gorzelnik, T.; Oleniacz, R. Suitability analysis of new air quality monitoring stations in Krakow as related to assessment of spatial and temporal variability of PM10 concentrations. Geomat. Environ. Eng. 2019, 13, 31–45. [Google Scholar] [CrossRef]
  100. Mikulski, M.; Droździel, P.; Tarkowski, S. Reduction of transport-related air pollution. A case study based on the impact of the COVID-19 pandemic on the level of NOx emissions in the city of Krakow. Open Eng. 2021, 11, 790–796. [Google Scholar] [CrossRef]
  101. Samek, L.; Styszko, K.; Stegowski, Z.; Zimnoch, M.; Skiba, A.; Turek-Fijak, A.; Gorczyca, Z.; Furman, P.; Kasper-Giebl, A.; Rozanski, K. Comparison of PM10 Sources at Traffic and Urban Background Sites Based on Elemental, Chemical and Isotopic Composition: Case Study from Krakow, Southern Poland. Atmosphere 2021, 12, 1364. [Google Scholar] [CrossRef]
  102. Oleniacz, R.; Bogacki, M.; Szulecka, A.; Rzeszutek, M.; Mazur, M. Assessing the impact of wind speed and mixing-layer height on air quality in Krakow (Poland) in the years 2014–2015. JCEEA 2016, 33, 315–342. [Google Scholar] [CrossRef]
  103. Oleniacz, R.; Gorzelnik, T.; Bogacki, M. Impact of urban, suburban and industrial background on air pollution levels of dust substances in North-Eastern part of Krakow (Poland). IOP Conf. Ser. Earth Environ. Sci. 2021, 642, 012013. [Google Scholar] [CrossRef]
  104. Al-Rashidi, M.S.; Yassin, M.F.; Alhajeri, N.S.; Malek, M.J. Gaseous air pollution background estimation in urban, suburban, and rural environments. Arab. J. Geosci. 2018, 11, 59. [Google Scholar] [CrossRef]
  105. Fan, Y.; Zhao, Y.; Torres, J.F.; Xu, F.; Lei, C.; Li, Y.; Carmeliet, J. Natural convection over vertical and horizontal heated flat surfaces: A review of recent progress focusing on underpinnings and implications for heat transfer and environmental applications. Phys. Fluids 2021, 33, 101301. [Google Scholar] [CrossRef]
  106. Zhang, Y.; Gu, Z.; Yu, C.W. Review on numerical simulation of airflow and pollutant dispersion in urban street canyons under natural background wind condition. Aerosol. Air Qual. Res. 2018, 18, 780–789. [Google Scholar] [CrossRef]
  107. Zhang, Y.; Gu, Z.; Yu, C.W. Impact factors on airflow and pollutant dispersion in urban street canyons and comprehensive simulations: A review. Curr. Pollut. Rep. 2020, 6, 425–439. [Google Scholar] [CrossRef]
  108. Hood, C.; Stocker, J.; Seaton, M.; Johnson, K.; O’Neill, J.; Thorne, L.; Carruthers, D. Comprehensive evaluation of an advanced street canyon air pollution model. J. Air Waste Manag. Assoc. 2021, 71, 247–267. [Google Scholar] [CrossRef]
  109. Lauriks, T.; Longo, R.; Baetens, D.; Derudi, M.; Parente, A.; Bellemans, A.; Van Beeck, J.; Denys, S. Application of improved CFD modeling for prediction and mitigation of traffic-related air pollution hotspots in a realistic urban street. Atmos. Environ. 2021, 246, 118127. [Google Scholar] [CrossRef]
  110. Godłowska, J. Wpływ Warunków Meteorologicznych na Jakość Powietrza w Krakowie. In Badania Porównawcze i Próba Podejścia Modelowego; IMGW-PIB: Warszawa, Poland, 2019; pp. 17–19. [Google Scholar]
  111. Zhong, J.; Cai, X.M.; Bloss, W.J. Coupling dynamics and chemistry in the air pollution modelling of street canyons: A review. Environ. Pollut. 2016, 214, 690–704. [Google Scholar] [CrossRef] [PubMed]
  112. Lugon, L.; Sartelet, K.; Kim, Y.; Vigneron, J.; Chrétien, O. Simulation of primary and secondary particles in the streets of Paris using MUNICH. Faraday Discuss. 2021, 226, 432–456. [Google Scholar] [CrossRef] [PubMed]
  113. Song, J.; Saathoff, H.; Gao, L.; Gebhardt, R.; Jiang, F.; Vallon, M.; Bauer, J.; Norra, S.; Leisner, T. Variations of PM2.5 sources in the context of meteorology and seasonality at an urban street canyon in Southwest Germany. Atmos. Environ. 2022, 282, 119147. [Google Scholar] [CrossRef]
  114. Sharma, V.; Ghosh, S.; Singh, S.; Vishwakarma, D.K.; Al-Ansari, N.; Tiwari, R.K.; Kuriqi, A. Spatial Variation and Relation of Aerosol Optical Depth with LULC and Spectral Indices. Atmosphere 2022, 13, 1992. [Google Scholar] [CrossRef]
  115. Assael, M.J.; Delaki, M.; Kakosimos, K.E. Applying the OSPM model to the calculation of PM10 concentration levels in the historical centre of the city of Thessaloniki. Atmos. Environ. 2008, 42, 65–77. [Google Scholar] [CrossRef]
  116. Wang, T.; Xie, S. Assessment of traffic-related air pollution in the urban streets before and during the 2008 Beijing Olympic Games traffic control period. Atmos. Environ. 2009, 43, 5682–5690. [Google Scholar] [CrossRef]
  117. Brizio, E.; Genon, G.; Borsarelli, S. PM emissions in an urban context. Am. J. Environ. Sci. 2007, 3, 166–174. [Google Scholar] [CrossRef]
  118. Ketzel, M.; Omstedt, G.; Johansson, C.; Düring, I.; Pohjola, M.; Oettl, D.; Gidhagen, L.; Wåhlin, P.; Lohmeyer, A.; Haakana, M.; et al. Estimation and validation of PM2.5/PM10 exhaust and non-exhaust emission factors for practical street pollution modelling. Atmos. Environ. 2007, 41, 9370–9385. [Google Scholar] [CrossRef]
  119. Kumar, A.; Ketzel, M.; Patil, R.S.; Dikshit, A.K.; Hertel, O. Vehicular pollution modeling using the operational street pollution model (OSPM) for Chembur, Mumbai (India). Environ. Monit. Assess. 2016, 188, 349. [Google Scholar] [CrossRef]
  120. Traczyk, P.; Gruszecka-Kosowska, A. The condition of air pollution in Kraków, Poland, in 2005-2020, with health risk assessment. Int. J. Environ. Res. Public Health 2020, 17, 6063. [Google Scholar] [CrossRef]
  121. Standar, A.; Kozera, A.; Jabkowski, D. The Role of Large Cities in the Development of Low-Carbon Economy—The Example of Poland. Energies 2022, 15, 595. [Google Scholar] [CrossRef]
  122. Olszowiec, P.; Luft, M.; Łukasik, Z. Analiza trendów i rozwoju polskiego rynku pojazdów używanych. Autobusy 2018, 6, 640–643. [Google Scholar] [CrossRef]
  123. Zielińska, E. Rynek dystrybucji nowych aut osobowych w salonach samochodowych w Polsce. Autobusy 2019, 12, 241–244. [Google Scholar] [CrossRef]
  124. Stryjakiewicz, T.; Kołsut, B.; Doszczeczko, B.; Dyba, W.; Kisiała, W.; Kudłak, R.; Wojtyra, B. Przegląd ekonomiczno-przestrzennych badań rynku samochodów osobowych. Przegląd Geogr. 2021, 93, 249–268. [Google Scholar] [CrossRef]
  125. Wappelhorst, S.; Pniewska, I. Emerging Electric Passenger Car Markets in Europe: Can Poland Lead the Way? ICCT Working Paper 2020-19; International Council on Clean Transportation: Washington, DC, USA, 2020; pp. 1–17. Available online: https://theicct.org/sites/default/files/publications/Poland-ev-market-sept2020.pdf (accessed on 31 December 2021).
  126. Lewicki, W.; Drożdż, W.; Wróblewski, P.; Żarna, K. The Road to Electromobility in Poland: Consumer Attitude Assessment. Eur. Res. Stud. 2021, 24, 28–39. [Google Scholar] [CrossRef]
  127. Mądziel, M.; Campisi, T.; Jaworski, A.; Tesoriere, G. The development of strategies to reduce exhaust emissions from passenger cars in Rzeszow city-Poland a preliminary assessment of the results produced by the increase of e-fleet. Energies 2021, 14, 1046. [Google Scholar] [CrossRef]
  128. Gis, M.; Gis, W. The current state and prospects for hydrogenisation of motor transport in Northwestern Europe and Poland. Combust. Engines 2022, 190, 61–71. [Google Scholar] [CrossRef]
  129. Liu, H.; Qi, L.; Liang, C.; Deng, F.; Man, H.; He, K. How aging process changes characteristics of vehicle emissions? A review. Crit. Rev. Environ. Sci. Technol. 2020, 50, 1796–1828. [Google Scholar] [CrossRef]
  130. Beji, A.; Deboudt, K.; Khardi, S.; Muresan, B.; Flament, P.; Fourmentin, M.; Lumière, L. Non-exhaust particle emissions under various driving conditions: Implications for sustainable mobility. Transp. Res. D Trans. Environ. 2020, 81, 102290. [Google Scholar] [CrossRef]
  131. Generowicz, A.; Gronba-Chyła, A.; Kulczycka, J.; Harazin, P.; Gaska, K.; Ciuła, J.; Ocłoń, P. Life Cycle Assessment for the environmental impact assessment of a city’ cleaning system. The case of Cracow (Poland). J. Clean. Prod. 2023, 382, 135184. [Google Scholar] [CrossRef]
  132. Wang, H.; Han, L.; Li, T.; Qu, S.; Zhao, Y.; Fan, S.; Chen, T.; Cui, H.; Liu, J. Temporal-spatial distributions of road silt loadings and fugitive road dust emissions in Beijing from 2019 to 2020. J. Environ. Sci. 2023, 132, 56–70. [Google Scholar] [CrossRef]
  133. Sun, L.; Wang, S.; Liu, S.; Yao, L.; Luo, W.; Shukla, A. A completive research on the feasibility and adaptation of shared transportation in mega-cities—A case study in Beijing. Appl. Energy 2018, 230, 1014–1033. [Google Scholar] [CrossRef]
  134. Harrison, R.M.; Van Vu, T.; Jafar, H.; Shi, Z. More mileage in reducing urban air pollution from road traffic. Environ. Int. 2021, 149, 106329. [Google Scholar] [CrossRef]
  135. Zimakowska-Laskowska, M.; Laskowski, P.; Wojs, M.K.; Orliński, P. Prediction of Pollutant Emissions in Various Cases in Road Transport. Appl. Sci. 2022, 12, 11975. [Google Scholar] [CrossRef]
  136. Sicard, P.; Paoletti, E.; Agathokleous, E.; Araminienė, V.; Proietti, C.; Coulibaly, F.; De Marco, A. Ozone weekend effect in cities: Deep insights for urban air pollution control. Environ. Res. 2020, 191, 110193. [Google Scholar] [CrossRef] [PubMed]
  137. Akimoto, H.; Tanimoto, H. Rethinking of the adverse effects of NOx-control on the reduction of methane and tropospheric ozone—Challenges toward a denitrified society. Atmos. Environ. 2022, 277, 119033. [Google Scholar] [CrossRef]
  138. Sicard, P.; Agathokleous, E.; Anenberg, S.C.; De Marco, A.; Paoletti, E.; Calatayud, V. Trends in urban air pollution over the last two decades: A global perspective. Sci. Total Environ. 2023, 858, 160064. [Google Scholar] [CrossRef] [PubMed]
  139. Tang, M.X.; Huang, X.F.; Yao, P.T.; Wang, R.H.; Li, Z.J.; Liang, C.X.; Peng, X.; Cao, L.M.; Du, K.; Yu, K.; et al. How much urban air quality is affected by local emissions: A unique case study from a megacity in the Pearl River Delta, China. Atmos. Environ. 2023, 299, 119666. [Google Scholar] [CrossRef]
  140. Sicard, P.; Agathokleous, E.; De Marco, A.; Paoletti, E. Ozone-reducing urban plants: Choose carefully. Science 2022, 377, 585. Available online: https://www.science.org/doi/10.1126/science.add9734 (accessed on 31 March 2023). [CrossRef] [PubMed]
Figure 1. Location of selected meteorological stations, air quality monitoring stations and analyzed street canyons in Krakow (source: own development using ESRI tools).
Applsci 13 06431 g001
Figure 2. View of individual street canyons and visualization of their dimensions and orientation: (a) BROD, (b) SOLI, (c) LIMA, (d) KRAS (source: own development using Google Maps and WinOSP).
Applsci 13 06431 g002
Figure 3. Daily traffic volume for the analyzed street canyons with 95% confidence levels (baseline variant v0).
Applsci 13 06431 g003
Figure 4. Daily traffic volume for the analyzed street canyons with 95% confidence levels (baseline variant v0).
Applsci 13 06431 g004
Figure 5. Structure of vehicles registered in Krakow and other counties of Malopolska Province used in the calculation of pollutant emissions for the baseline variant (v0).
Applsci 13 06431 g005
Figure 6. Scheme presenting the research methodology along with the places where meteorological and background pollution data were used.
Applsci 13 06431 g006
Figure 7. Daily and weekly profiles of vehicle traffic for individual variants and street canyons with 95% confidence intervals.
Applsci 13 06431 g007
Figure 8. Average rate of vehicle traffic reduction in variants v1–v3 compared to variant v0.
Applsci 13 06431 g008
Figure 9. Daily vehicle speed profiles determined for the road traffic variants analyzed in individual street canyons: (a) BROD, (b) SOLI, (c) LIMA, (d) KRAS.
Applsci 13 06431 g009
Figure 10. The matrix of differences in the mean annual emission factors of the analyzed pollutants from individual street canyons obtained for variants v1, v2 and v3 in relation to variant v0 (with 95% confidence intervals listed in parentheses).
Applsci 13 06431 g010
Figure 11. The matrix of changes in the mean annual concentrations of the air pollutants analyzed in individual street canyons captured for variants v1, v2 and v3 compared to variant v0 (with 95% confidence intervals listed in parentheses).
Applsci 13 06431 g011
Figure 12. Average contribution of total road transport emissions in individual street canyons to the level of annual average pollutant concentrations in the air in the canyon, obtained from modeling, taking into account their background for the analyzed variants.
Applsci 13 06431 g012
Figure 13. Average diminution rate of relative changes in air pollutant concentrations in the analyzed street canyons caused by the adopted background level.
Applsci 13 06431 g013
Table 1. Characteristics of the analyzed street canyons.
ParameterStreet Canyon
BRODSOLILIMAKRAS
Street nameBrodowicza St.Solidarności Av.Limanowskiego St.Krasińskiego Av.
Number of lanes—left/right side2 */12/21/13 */3 *
Canyon width 18 m57 m19 m45 m
Average height of buildings—left/right side18/16 m31/24 m16/20 m26/29 m
Canyon length included in
calculations
100 m200 m100 m140 m
Azimuth angle of the road axis40°70°85°160°
Total annual (y),
daily average (d)
and hourly average (h)
vehicle (veh) traffic 1
2,234,645 veh·y−13,521,622 veh·y−18,641,101 veh·y−124,299,303 veh·y−1
6122 veh·d−19648 veh·d−123,674 veh·d−166,573 veh·d−1
255 veh·h−1402 veh·h−1986 veh·h−12774 veh·h−1
Speed limit during the day/at night 250/60 km·h−170/70 km·h−150/60 km·h−170/70 km·h−1
Average daily speed 340.3 km·h−140.5 km·h−134.3 km·h−139.3 km·h−1
Average speed during peak hours 3,424.1 km·h−127.3 km·h−121.3 km·h−124.6 km·h−1
* Including a bus lane (for public transport buses, taxis and other emergency vehicles). 1 2017 data adopted as the baseline variant (v0) based on the results of continuous measurements carried out by the Municipality of Krakow (Department of Road Management). 2 In the period under consideration (2017), the increased speed limit from 50 km·h−1 to 60 km·h−1 on road sections running in built-up areas was in force at night: from 11.00 p.m. to 5.00 a.m. 3 2017 data estimated using the Krakow Traffic Model [56]. 4 From 7.00 a.m. to 7.00 p.m.
Table 2. Characteristics of the assumed scenarios in terms of changes in the organization of vehicle traffic for individual street canyons.
Street CanyonVariantDescription of Vehicle Traffic Reorganization Scenario
BRODv1Reducing the speed limit from 50 km·h−1 to 40 km·h−1.
v2Only passenger cars and delivery vans meeting at least the Euro 4 emission standard are admitted to traffic.
v3Only passenger cars and delivery vans meeting at least the Euro 5 emission standard are admitted to traffic.
SOLIv1Narrowing street cross-section.
v2Reducing the speed limit from 70 km·h−1 to 50 km·h−1.
v3Only passenger cars and light commercial vehicles meeting at least the Euro 4 emission standard are admitted to traffic.
LIMAv1Only passenger cars and light commercial vehicles meeting at least the Euro 4 emission standard are admitted to traffic.
v2Only passenger cars and light commercial vehicles meeting at least the Euro 5 emission standard are admitted to traffic.
v3Only passenger cars and light commercial vehicles meeting at least the Euro 6 emission standard are admitted to traffic.
KRASv1Reducing the speed limit from 70 km·h−1 to 50 km·h−1.
v2Only passenger cars and delivery vans meeting at least the Euro 4 emission standard are admitted to traffic.
v3Only passenger cars and delivery vans meeting at least the Euro 5 emission standard are admitted to traffic.
Table 3. Averaged annual emission factors of the analyzed pollutants calculated for individual canyons and variants.
Street
Canyon
VariantAir Pollutant Emission Factors [g·km−1·h−1]
NONO2NOx (as NO2)PM10PM2.5
BRODv0117.230.2209.848.723.7
v1111.829.3200.744.121.6
v252.521.3101.826.312.4
v342.211.275.915.37.0
SOLIv0259.254.9452.379.639.4
v1257.154.7448.977.538.5
v2253.754.2443.372.936.5
v3164.541.2293.544.822.2
LIMAv0522.5126.2927.3126.568.2
v1251.290.1475.367.534.9
v2209.750.0371.639.820.2
v3179.729.3304.928.014.8
KRASv01333.6334.92379.7349.4185.3
v11367.2344.92441.3336.8180.3
v2648.5239.41233.8188.496.7
v3537.5131.5955.7110.855.6
Table 4. OSPM model validation results obtained for the KRAS street canyon (variant v0).
Air PollutantMBNMBMAENMEFAC2rIOA
NO2−14.18−0.2315.440.250.950.850.62
NOx−26.51−0.1357.850.290.900.810.70
PM10−5.83−0.1012.050.220.950.940.83
PM2.5−6.56−0.169.100.220.930.960.84
Table 5. Modeling results of annually averaged air pollutant concentrations in individual street canyons for the variants considered without and with the background pollution level (mean values at the extreme points of the calculation section).
Street
Canyon
VariantBackground StatusPollutant Concentrations in the Air [μg·m−3]
NONO2NOx
(as NO2)
PM10PM2.5
BRODv0no117.230.2209.848.723.7
v1yes111.829.3200.744.121.6
v2no52.521.3101.826.312.4
v3yes42.211.275.915.37.0
SOLIv0no259.254.9452.379.639.4
v1yes257.154.7448.977.538.5
v2no253.754.2443.372.936.5
v3yes164.541.2293.544.822.2
LIMAv0no522.5126.2927.3126.568.2
v1yes251.290.1475.367.534.9
v2no209.750.0371.639.820.2
v3yes179.729.3304.928.014.8
KRASv0no1333.6334.92379.7349.4185.3
v1yes1367.2344.92441.3336.8180.3
v2no648.5239.41233.8188.496.7
v3yes537.5131.5955.7110.855.6
Mean background level22.430.864.638.627.3
Disclaimer/Publisher’s Note: The statements, opinions and data contained in all publications are solely those of the individual author(s) and contributor(s) and not of MDPI and/or the editor(s). MDPI and/or the editor(s) disclaim responsibility for any injury to people or property resulting from any ideas, methods, instructions or products referred to in the content.

