

A Complete and High-Resolution Estimate of Sardinia’s Rooftop Photovoltaic Potential


CRS4, Center for Advanced Studies, Research and Development in Sardinia, Loc. Piscina Manna ed. 1, 09050 Pula, CA, Italy
*
Author to whom correspondence should be addressed.
Appl. Sci. 2023, 13(1), 7; https://doi.org/10.3390/app13010007
Submission received: 14 November 2022
/
Revised: 2 December 2022
/
Accepted: 16 December 2022
/
Published: 20 December 2022
(This article belongs to the Special Issue GIS Applications in Green Development)
Abstract
:The implementation of the energy transition and the building of energy communities are driving forward the exploitation of the potential for rooftop photovoltaic power generation. Estimating rooftop PV generation potential requires the processing of different types of data, such as the cadastral information of buildings, a detailed description of available rooftop areas, and solar irradiance data. High-resolution estimation based on GIS data is normally limited to small survey areas. Instead, by using an algorithm for the efficient calculation of shadows over rooftops, and the integration of solar irradiance over time, we developed a procedure that allows for the rapid full census assessment of rooftop photovoltaic potential with a spatial resolution of 1 m, applicable at the regional scale and requiring minimal computational resources. We applied this approach to the rooftops of buildings in Sardinia, an island and region of Italy of particular interest for the energy transition. In addition to estimating the geographic potential, we carried out a preliminary assessment of the technical and economic potential, yielding a maximal photovoltaic rooftop generation potential of 22 TWh for the entire region.
1. Introduction
In recent years, the European Union has been very committed to increasing the amount of energy generated from renewable sources. The first target, set with the Renewable Energy Directive of 2009 [1], aimed at increasing the percentage of energy from renewable sources to 20% by 2020; the Renewable Energy Directive II of 2018 [2] set this percentage to 32%, to be reached by 2030. The REPowerEU directive from May 2022 [3] proposed to increase this target to 45% by 2030 in order for the European Union to become increasingly autonomous from importing fossil fuels.
In this paper, we deal with the generation of electricity from solar radiation by means of photovoltaic panels, which is particularly widespread in Italy (in 2021, it met 8.7% of the national electricity demand, and 21.8% of the production from renewable sources [4]). The installation of photovoltaic systems has been promoted by the Italian government, e.g., by way of incentives such as “Superbonus 110%” [5,6].
Building rooftops offer significant potential for the deployment of photovoltaic (PV) systems, and enable better geographic correlation between supply and demand [7]. The installation of photovoltaic modules has low impact from the point of view of urban planning, since the panels are mounted onto existing roofs.
Energy produced by photovoltaic systems can play a crucial role in reducing greenhouse gas emissions [8]; the contribution of rooftop photovoltaic systems is essential in smart cities [9], and the estimation of the production potential is a prerequisite for the transformation of cities and energy communities [10,11] into net zero energy districts [12].
The estimation of the photovoltaic potential is, therefore, required in various fields of study and research. The determination of the photovoltaic potential in urban areas consists of four basic parts [13,14]: physical potential, geographic potential, technical potential, and economic potential. (i) Physical potential consists of assessing the solar irradiation over the region of interest; (ii) geographic potential consists of identifying and characterizing the surfaces suitable for photovoltaic installations; (iii) technical potential studies the transformation of the solar energy harvested by the panels into electric energy; (iv) economic potential evaluates the return on the investment incurred in the installation of photovoltaic systems.
According to the literature, different techniques are used according to the scale of the analysis to be conducted [15]. Studies on a continental [7] or global [16] scale have a lower level of detail, with analyses primarily using statistical methods and machine learning techniques.
Joshi et al. carried out a global-scale estimation of the technical potential of rooftop PV systems [16]. Earth’s surface is divided into sectors of 10 km2, and the total area of building roofs is estimated for each with a machine-learning approach on the basis of population density, and geographic information system (GIS) datasets. The result is the technical and economic potentials calculated for all countries and for each month of the average year. Bodis et al., using satellite and statistical data, and machine-learning techniques, estimated the photovoltaic potential on EU rooftops at 100 m spatial resolution [7].
Statistical methods are still used in national- [17] and regional [18]-scale studies, often being supplemented with GIS data [19].
The use of machine-learning algorithms coupled with high-resolution GIS data and physical models allowed for Walch et al. to estimate with a high level of detail the large scale rooftop photovoltaic potential in Switzerland [19]. An evaluation of the geographic potential is realized by combining the estimated average monthly irradiance obtained from satellite data with available rooftop area, shading effects and rooftop geometry. Lastly, the use of physical models allows for the estimation of the technical potential and its uncertainty. The work of Walch et al. is a notable exception to other studies on the same geographic scale because of the level of detail in the analysis. Regional-scale analyses are typically carried out using statistical methods for extrapolating detailed analyses to samples. Bernasconi et al., for example, estimated the area available for PV installation using the clustering analysis of the urban and morphological characteristics of municipalities in Lombardy, the most densely populated region in Italy with the largest number of inhabitants [18].
Analyses on an urban scale, on the other hand, require the use of GIS data [20] or light detection and ranging (LiDAR) surveys [21,22], or both [23,24], and other data sources such as satellite images [25] or aerial photographic images [26] processed with machine-learning techniques [27,28,29].
In [20], for an area of the city of Turin (Italy) having an extension of 1 km2 and containing 1228 buildings, GIS tools were used to estimate the tilt and orientation of rooftops from high-resolution (0.5 m) digital surface models. The problem of shading and effective irradiance had already been addressed in [23], where the sky view factor [30,31], and obstructions due to terrain and buildings were calculated with LiDAR data for a small area in the city of Kingston, Ontario (Canada), and in [21], in which a three-dimensional model of buildings was developed to calculate shading and thus the actual irradiance on rooftops in the municipality of Avellino (Italy).
More recently, in [22], a method was proposed for the automatic identification of roofs suitable for photovoltaic systems. The technique was demonstrated on buildings in the city of Gothenburg (Sweden) using a digital model of the surface with a resolution of 10 cm as the only input. The algorithm presented in [25] allowed for the examination of a 1 km2 area at high resolution in the city of Giessen (Germany).
In [24], a methodology was developed for the estimation of the rooftop potential for food, water, and photovoltaics in the city of Zaragoza (Spain), where LiDAR and cadastral data were used to identify suitable covers for the different purposes. Recently, techniques in machine learning have been added to the GIS methodologies mentioned above, such as in [26] where a fast method was proposed to three-dimensionally construct the geometry of buildings in an area of the Netherlands through the use of stereo aerial imagery with 10 cm resolution and cadastral information, while deep-learning techniques have found use for the segmentation of suitable roof surfaces in urban areas [27,29].
Our work illustrates a complete methodology that allows for the high-resolution estimation of the photovoltaic potential at a regional scale. We applied the procedure on a large scale to an entire region of Italy, the island of Sardinia, and expanded the results presented at the city scale in [32]. Sardinia has great potential for generation from renewable sources and is included in the Coal Regions in Transition (CRiTs) initiative supported by the European Union [33]; therefore, it needs to develop and implement projects to realize a viable economic and technological transformation.
As far as physical potential is concerned, we reworked the data provided by PVGIS [34]; in terms of the technical potential, and calculated the average energy production by means of a simplified formulation [35]; the economic potential was evaluated by means of an estimation of the levelized cost of electricity (LCOE) [36]. Our method focuses on the geographic potential and thus uses open cadastral, GIS, and LiDAR data to estimate the available rooftop surface, to approximate the inclination and orientation of building rooftops, and to evaluate the shading effects between buildings [32].
The scientific contribution is related to the extremely effective algorithm used for time integration of solar irradiance reaching a surface, accounting for the shading effects of other buildings, which can be applied to the roof surfaces of buildings in the entire region with a spatial resolution of 1 m. Our procedure allows for us to combine a very high level of detail within the extent of the area under consideration. The proposed methodology, in terms of the employed types of techniques, the level of detail, and the extent of the examined area, can be directly compared with the work of Walch et al. [19]. However, in our case, we propose a more detailed analysis of the effects of shading and calculation of the average annual irradiance. In fact, due to the efficiency of our procedure, we were able to integrate over time the solar irradiance incident on each surface pixel modulated by shading effects with a temporal resolution of one hour, whereas in the cited work, the calculation was conducted on an hourly basis and with a monthly averaged irradiation.
By employing open data and open-source software, our procedure was able to estimate the technical potential for the entire region of Sardinia on a modest workstation and in a reasonable time (less than a week), thus demonstrating, contrary to common understanding [37], that it is possible to obtain a timely estimation of photovoltaic potential with a LiDAR-based approach, even for large areas, by employing limited computational resources.
Section 2 describes the data used in the study; Section 3 explains the methodologies used to process the data to obtain the physical, geographic, technological, and economic potential; Section 4 illustrates the results obtained on a regional level; Section 5 discusses the results; Section 6 draws conclusions and addresses possible future developments.
2. Data
2.1. Introduction
The energy that may be generated by a photovoltaic system can be estimated by knowing (i) the location of the system, (ii) the tilt and orientation of the panels, (iii) the parameters that characterize the modules and the inverter, (iv) the temperature, the wind speed, and the average amount of direct and diffuse radiation at the site, and (v) the presence of any shading that may affect the amount of direct radiation reaching the panels.
In the following paragraphs, we illustrate the procedures for acquiring and processing the data required to obtain our estimate, i.e., the building blueprints (Section 2.2), the elevation raster (Section 2.3), the solar radiation measurements, and the meteorological data (Section 2.4).
2.2. Building Blueprints
Knowledge of the correct position of a building allows for us to associate it with the average irradiance estimated for that geographic area, while the relative position with respect to other buildings and their elevation allow for us to calculate the possible shading that reduces the overall irradiance received.
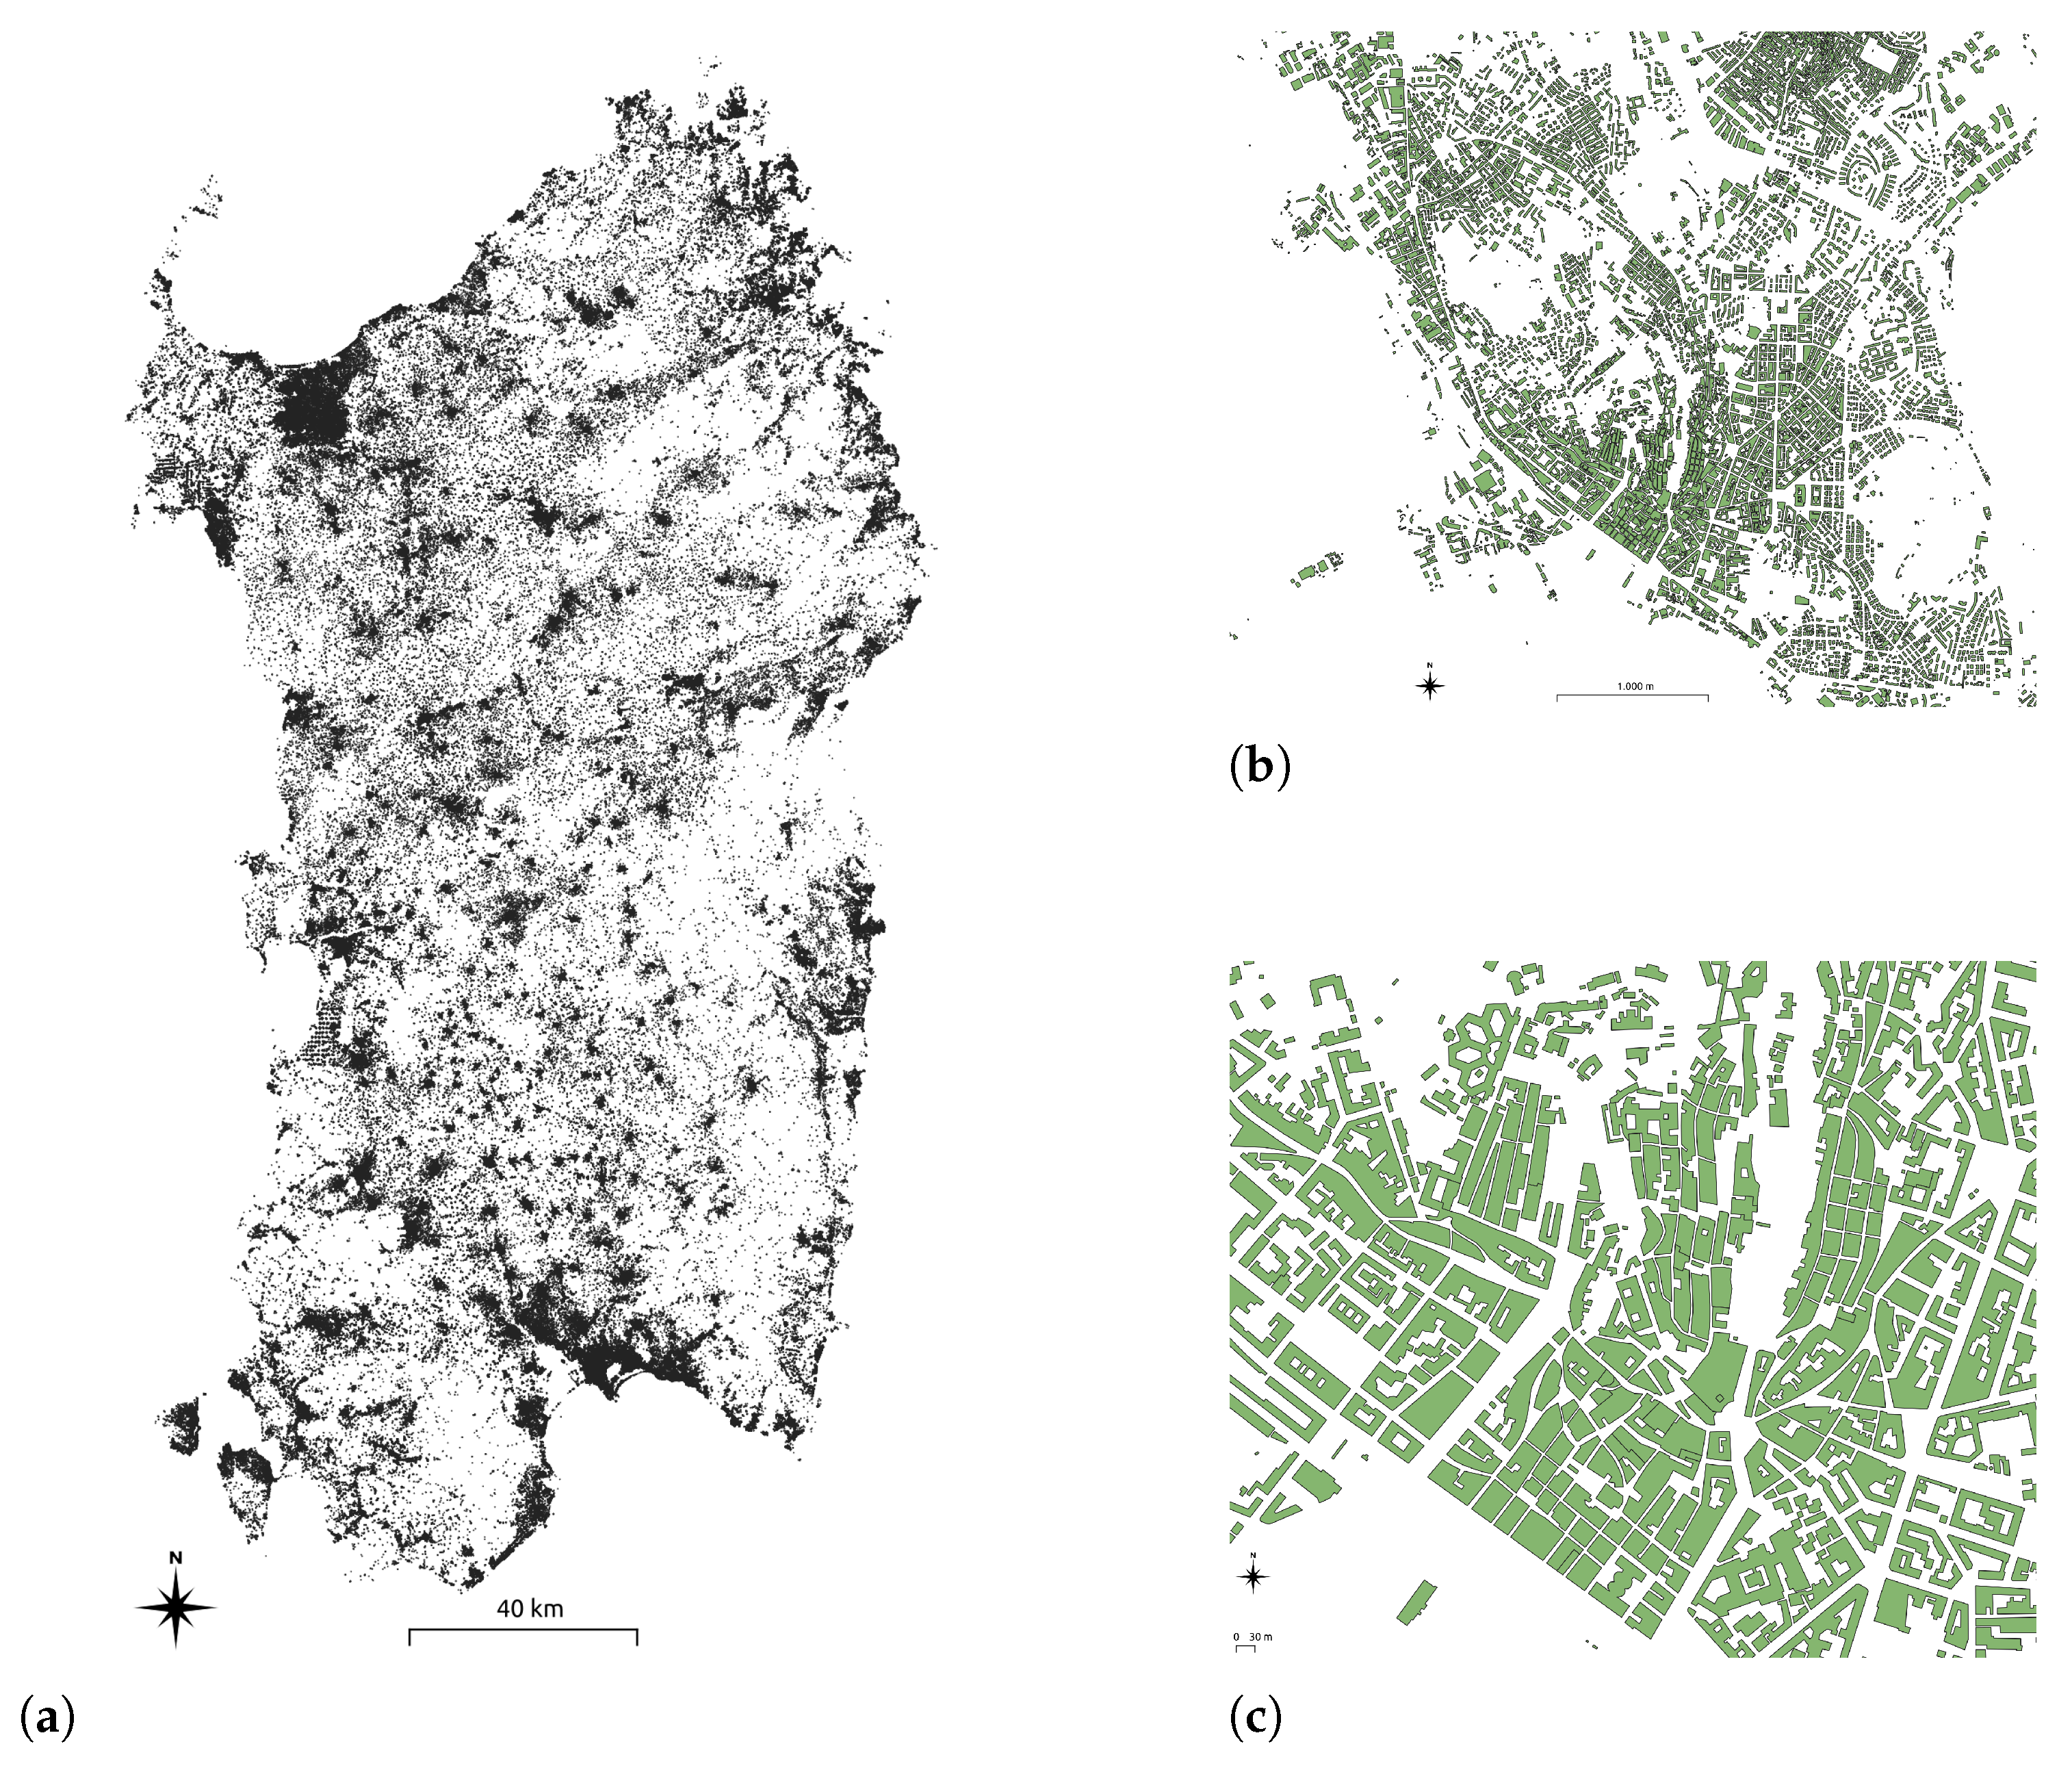
The Geotopographic Database (DBGT) of Sardinia [38] provides the regional technical authoritative maps in digital format (DBGT10K, published in 2017). Among the various available layers, we were interested in the shape files representing the building blueprints (Figure 1) and the municipal boundaries.
In the same regional geoportal, the DBGT10K updated to 2020 is available, although only for the southern part of the island. For the purposes of this study, we used the building blueprints published in 2017 in order to have more consistent data. The geometries contained in the shapefile of the building blueprints allow us to calculate the surface extent of the building rooftops, and its attributes describe the intended use of the buildings, therefore enabling us to remove unsuitable buildings from the dataset. The shape file of the administrative boundaries allowed for us to identify the buildings within each municipality.
2.3. Elevation Data
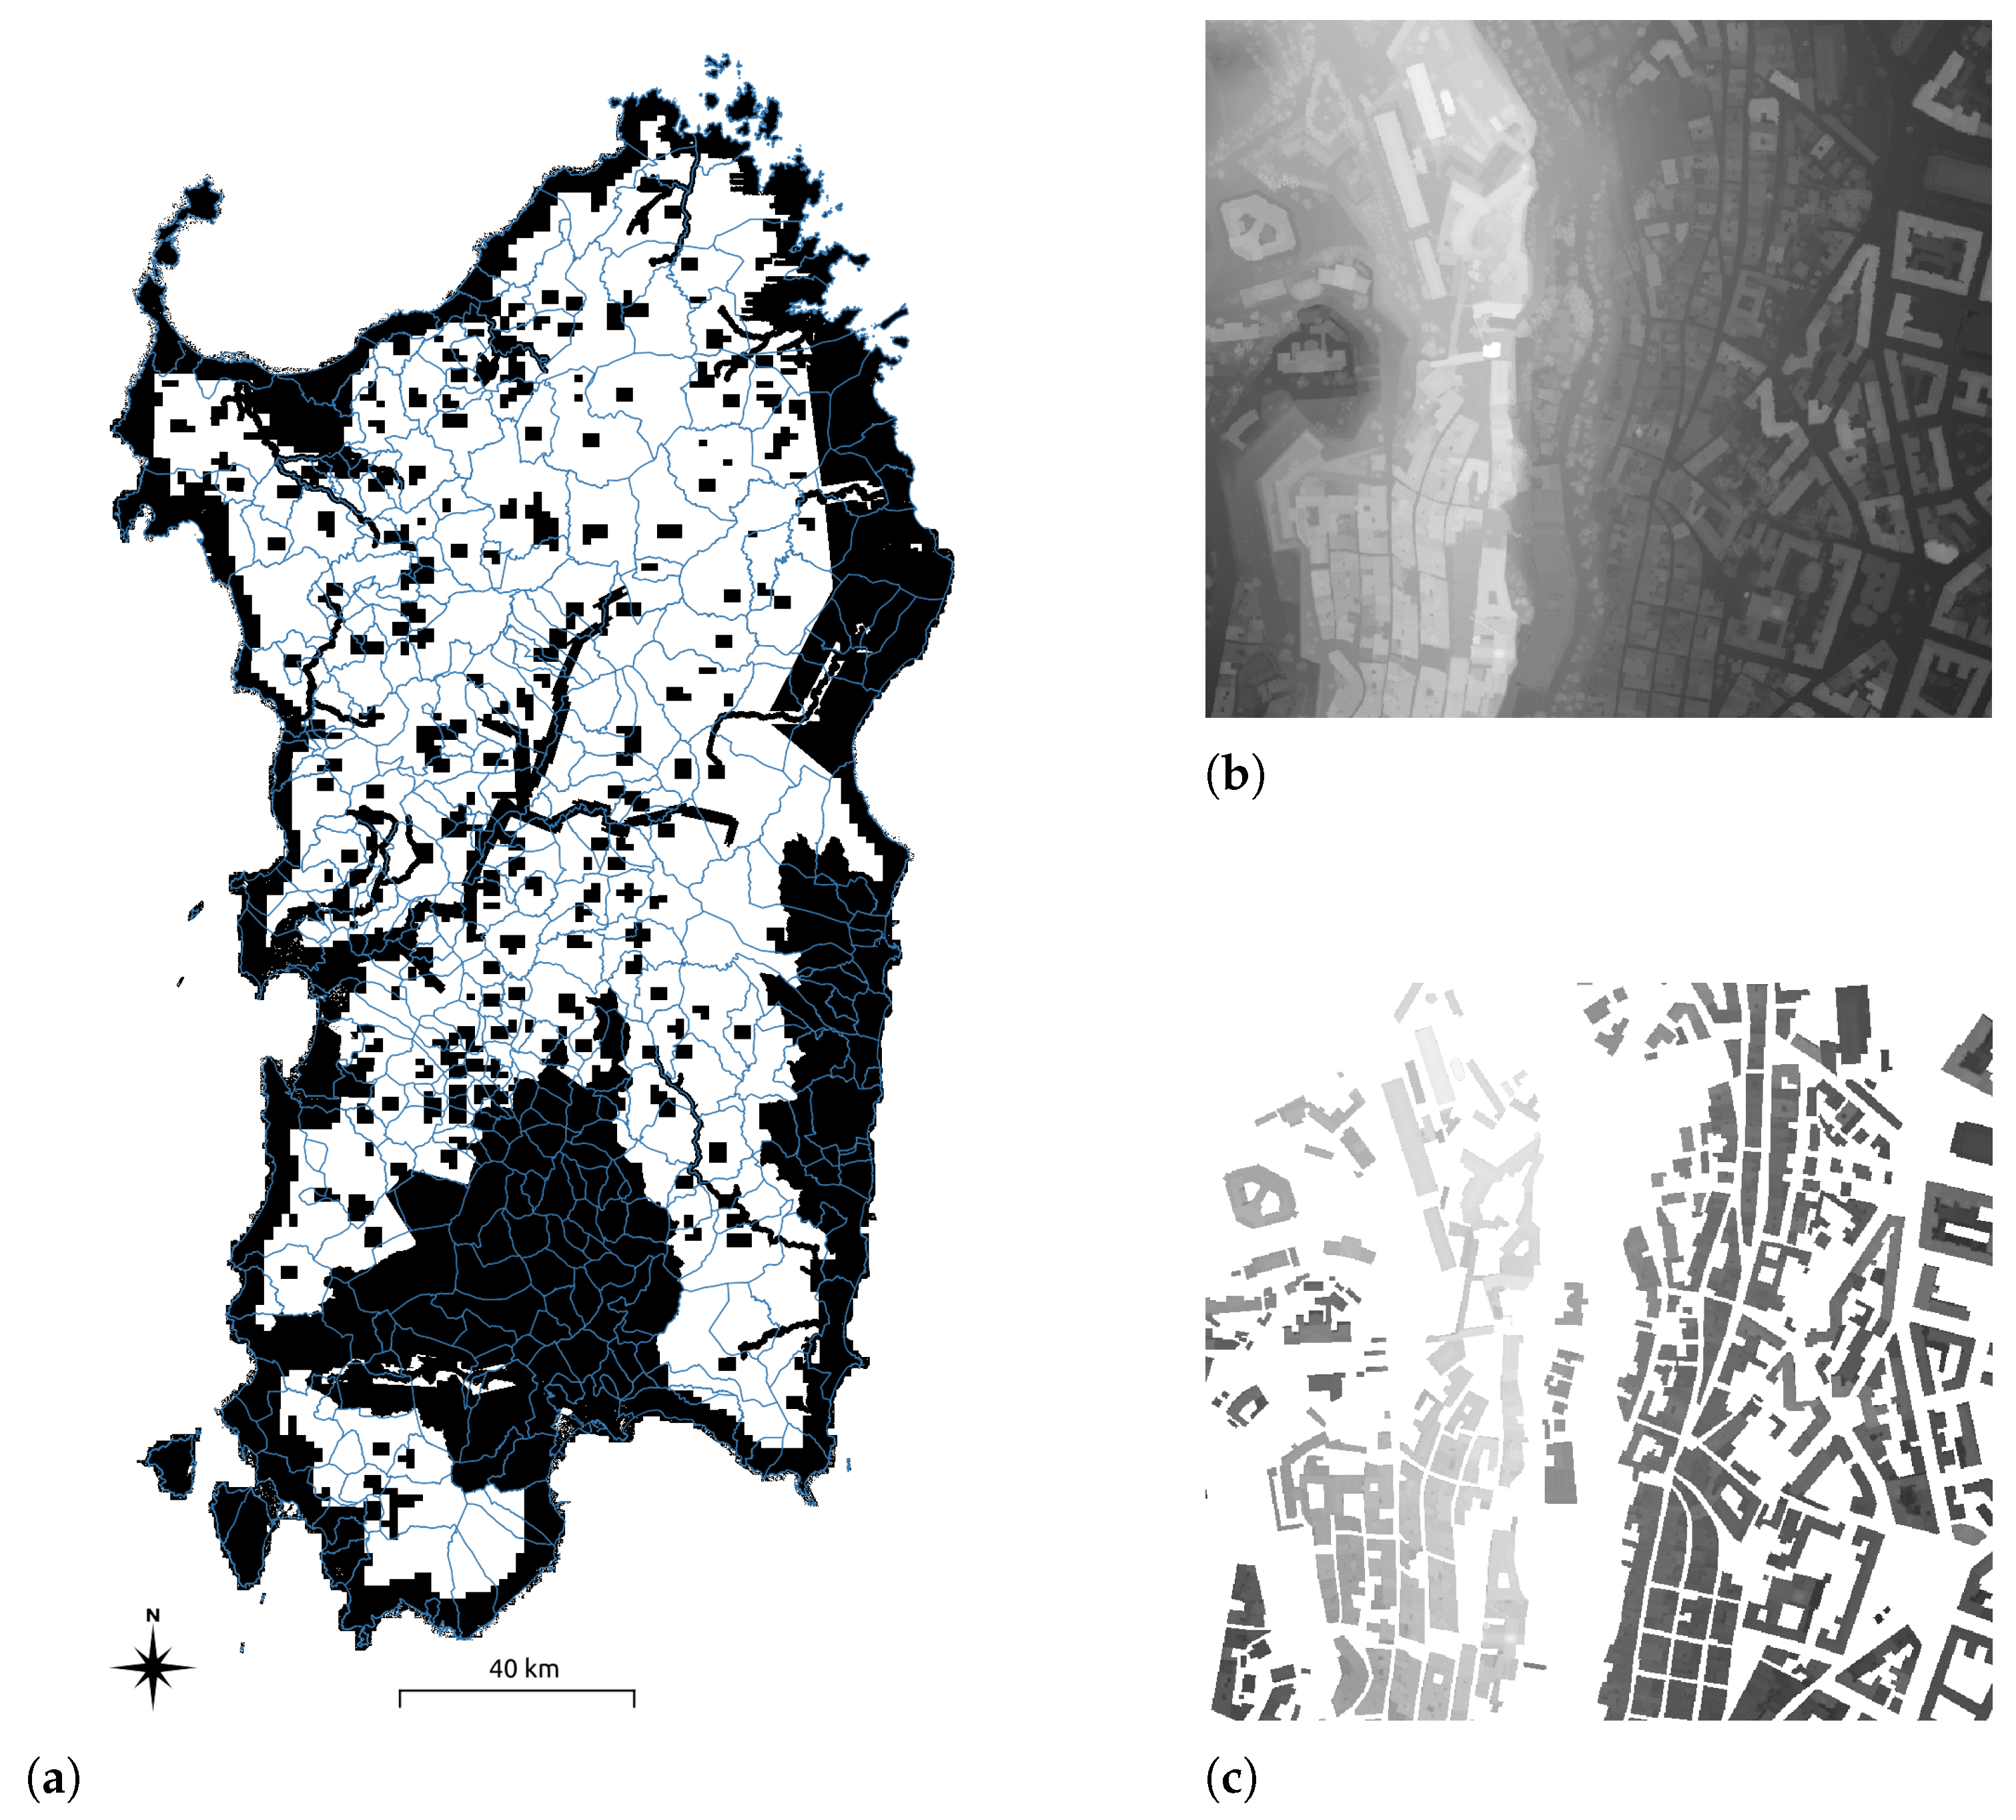
We used the elevation data of the buildings, vegetation, and terrain to calculate any projected shadows. In the absence of the three-dimensional model of the buildings, the elevation data is provided by the raster files of the digital surface model (DSM) published by the geoportal of the region of Sardinia [39]. The data covered a good portion of Sardinia (Figure 2a), in particular the coastal, fluvial, and Campidano lowland areas, i.e., the most densely populated territories. The DSMs were obtained from six different LiDAR acquisition campaigns that took place between 2008 and 2013. Belonging to distinct datasets, the raster files are heterogeneous and are offered in a variety of formats (Erdas Imagine, GeoTIFF, ESRI ASCII Grid), each with its own specific peculiarities. As a result, we standardized the raster data on a GeoTIFF format with an EPSG:32632 reference coordinate system and a 1 m horizontal resolution.
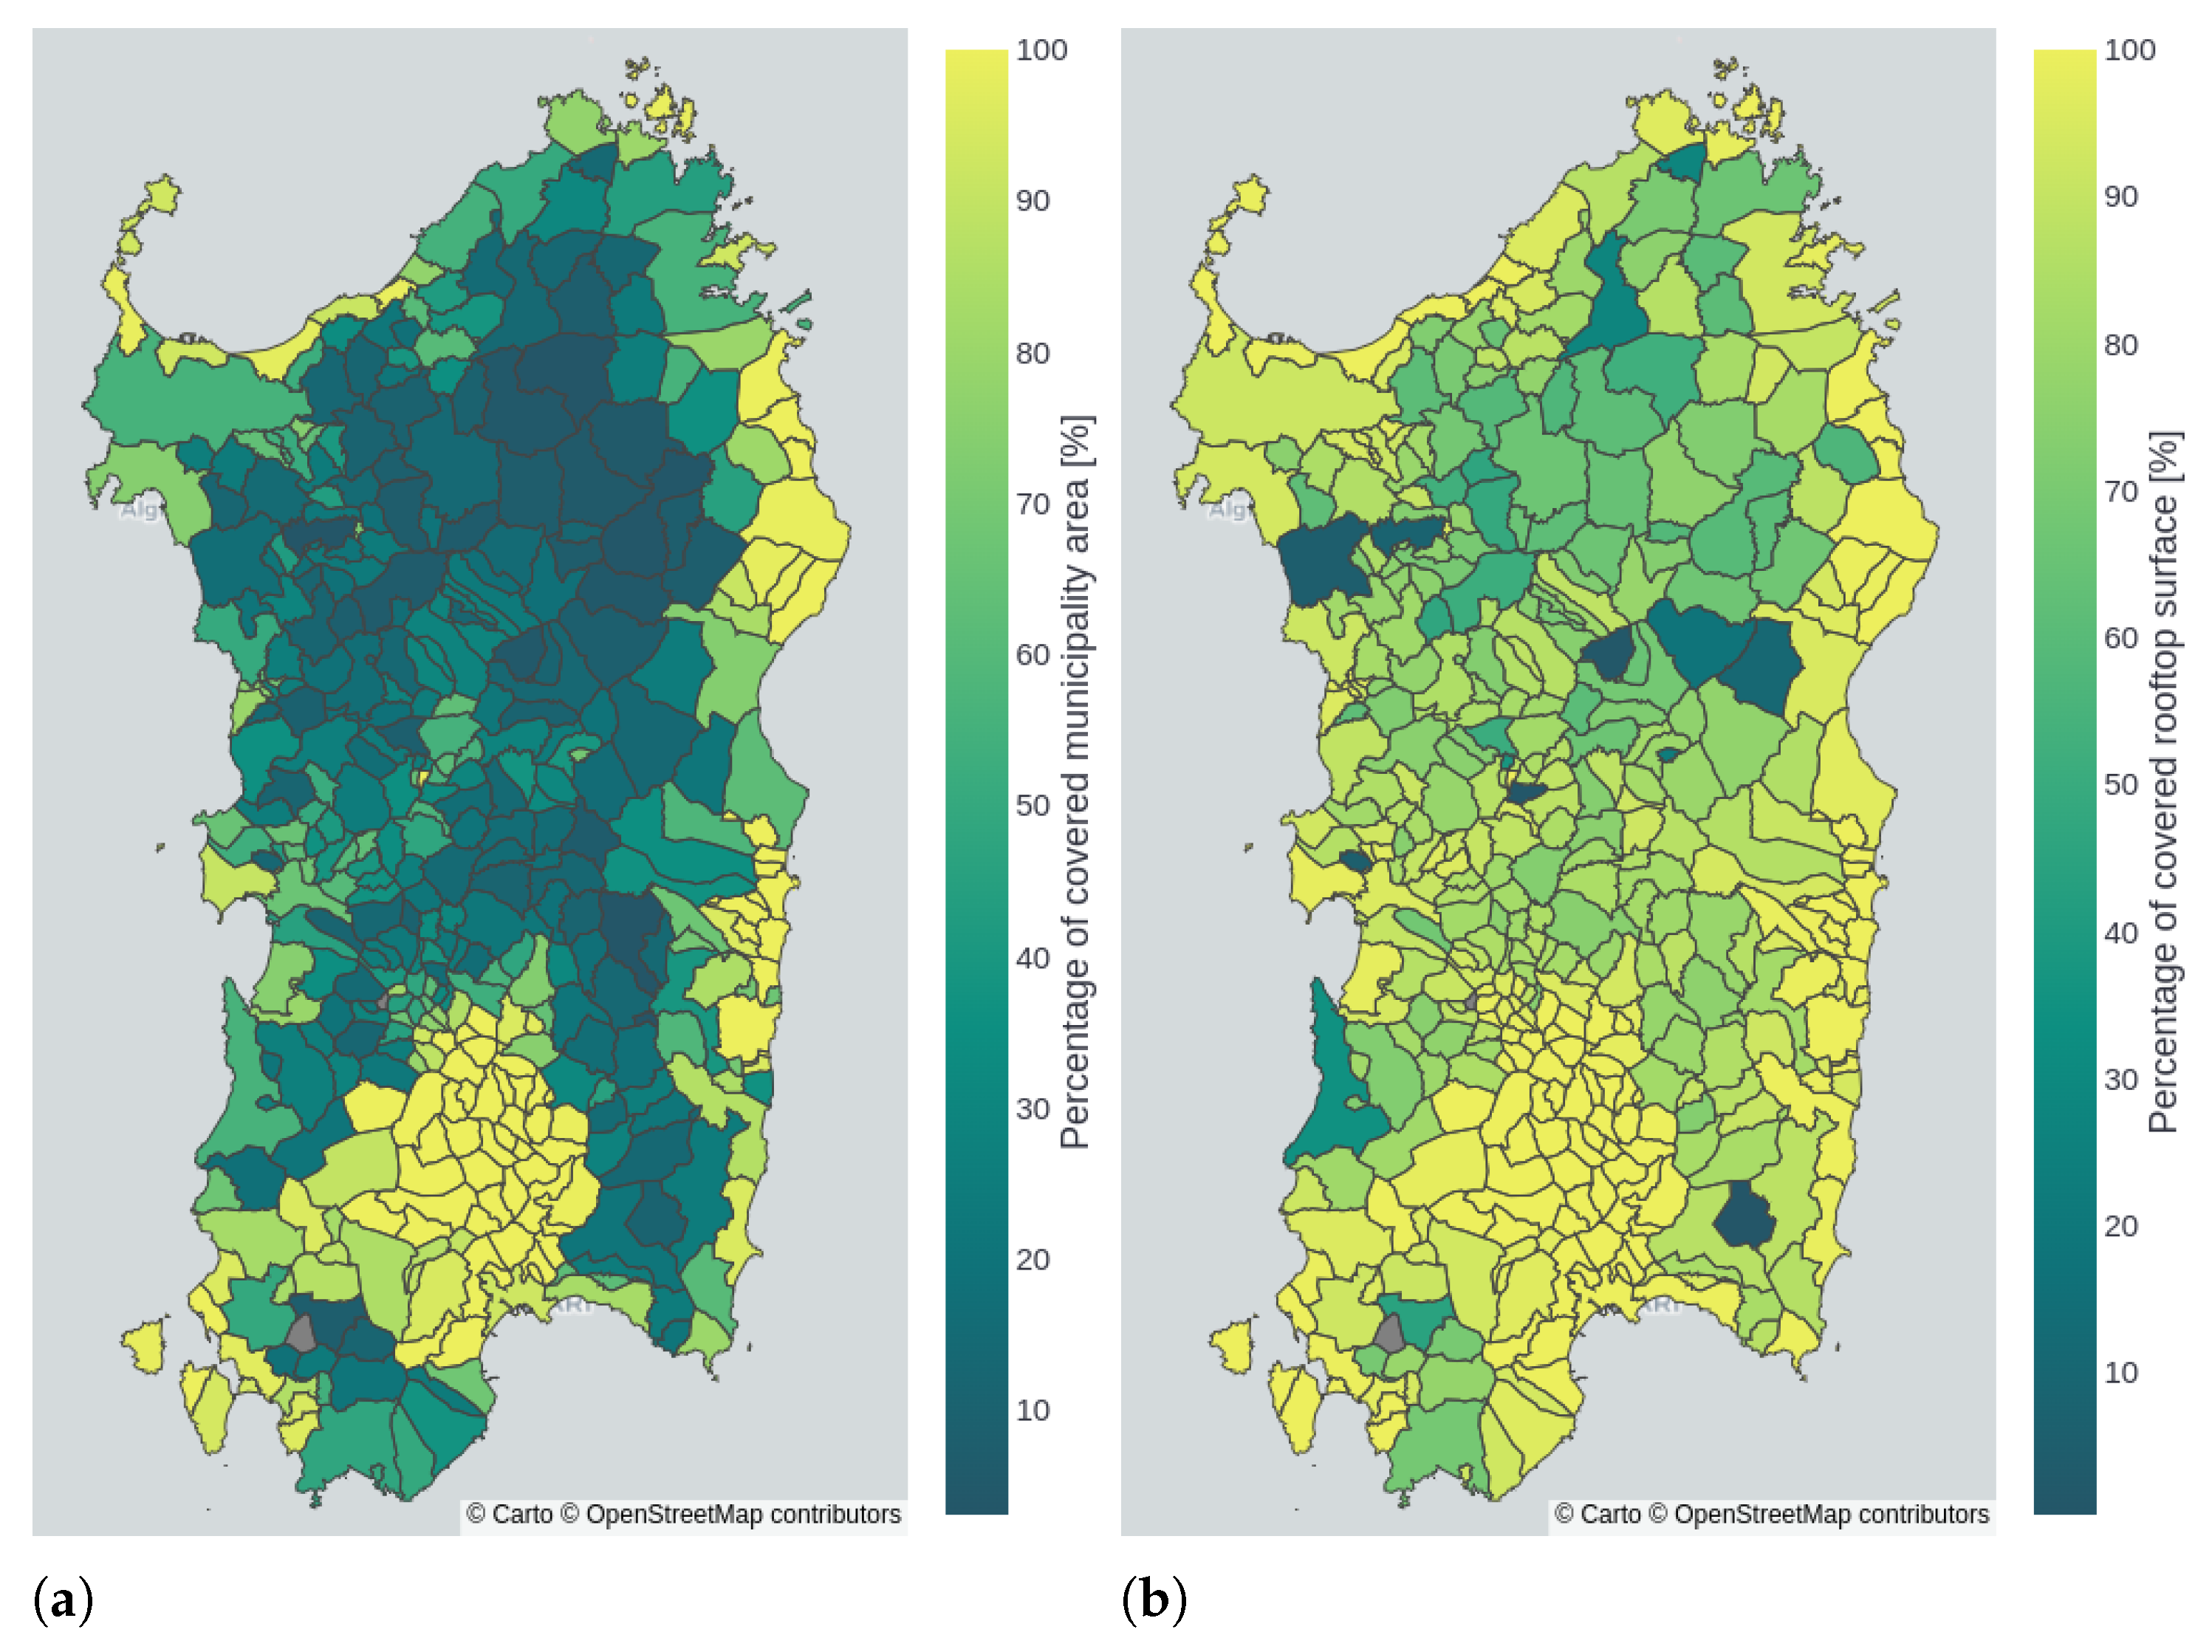
In general, the DSM covers 45.01% of the territory of Sardinia (i.e., 10,844 km2 out of 24,093 km2) and as much as 87.36% of the area occupied by buildings (113 km2 out of 130 km2), as shown in Figure 3. We assumed that the remaining 12.64% of the buildings had the same characteristics as the buildings for which the digital surface model is available, so we calculate the total results for the individual municipalities and the entire region of Sardinia by means of a proportion.
2.4. Radiation and Weather Data
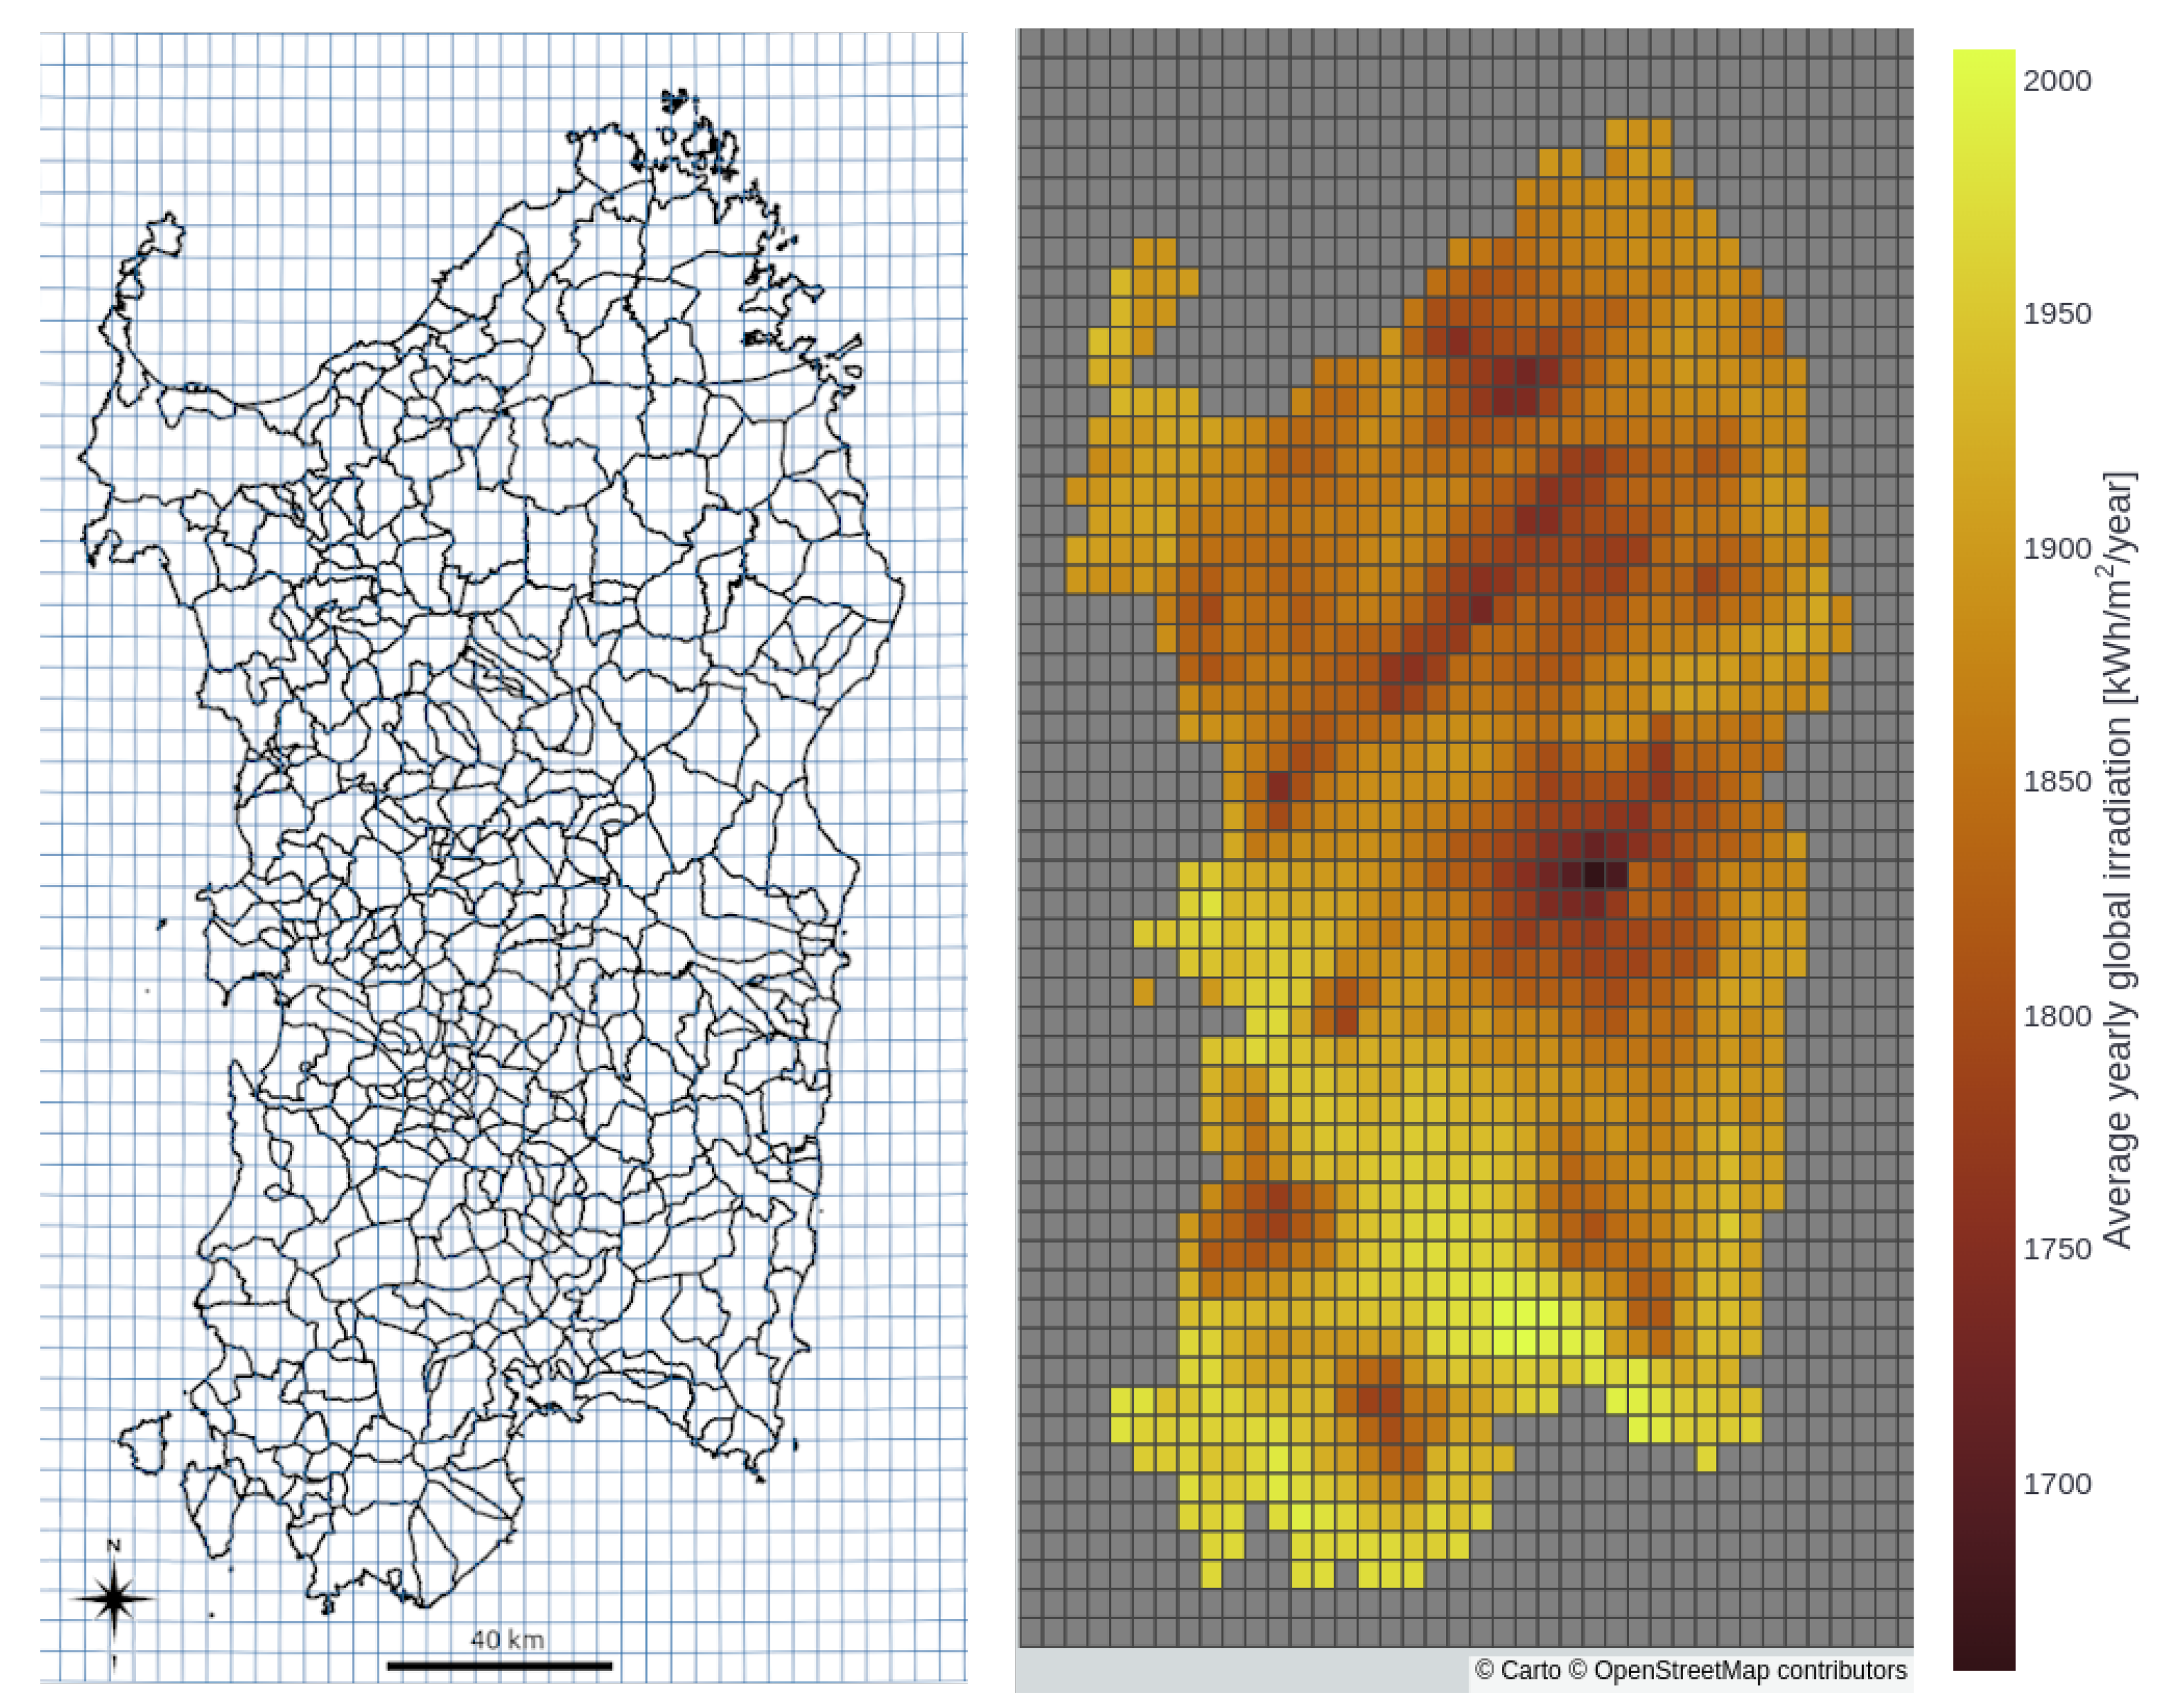
For the measurements of solar radiation, temperature, and wind speed, we used the data offered by the PVGIS portal [34]. According to the resolution of the PVGIS-SARAH2 solar radiation database [40,41], we identified the 0.05° resolution sectors that overlap the territory of Sardinia (Figure 4) and collected the time series data via a series of application programming interface (API) calls to https://re.jrc.ec.europa.eu/api/v5_2/seriescalc (accessed on 13 November 2022).
Each individual call to the API service returned a 16-year long (2005–2020) hourly time series of the values (, direct irradiance on the plane of the array, POA), (, diffuse irradiance on the POA), (reflected irradiance on the POA), (elevation of the sun), (air temperature measured at 2 m above the surface) and (wind speed measured at 10 m above the surface). As a result, each time series contains over 140,000 values.
3. Methodology
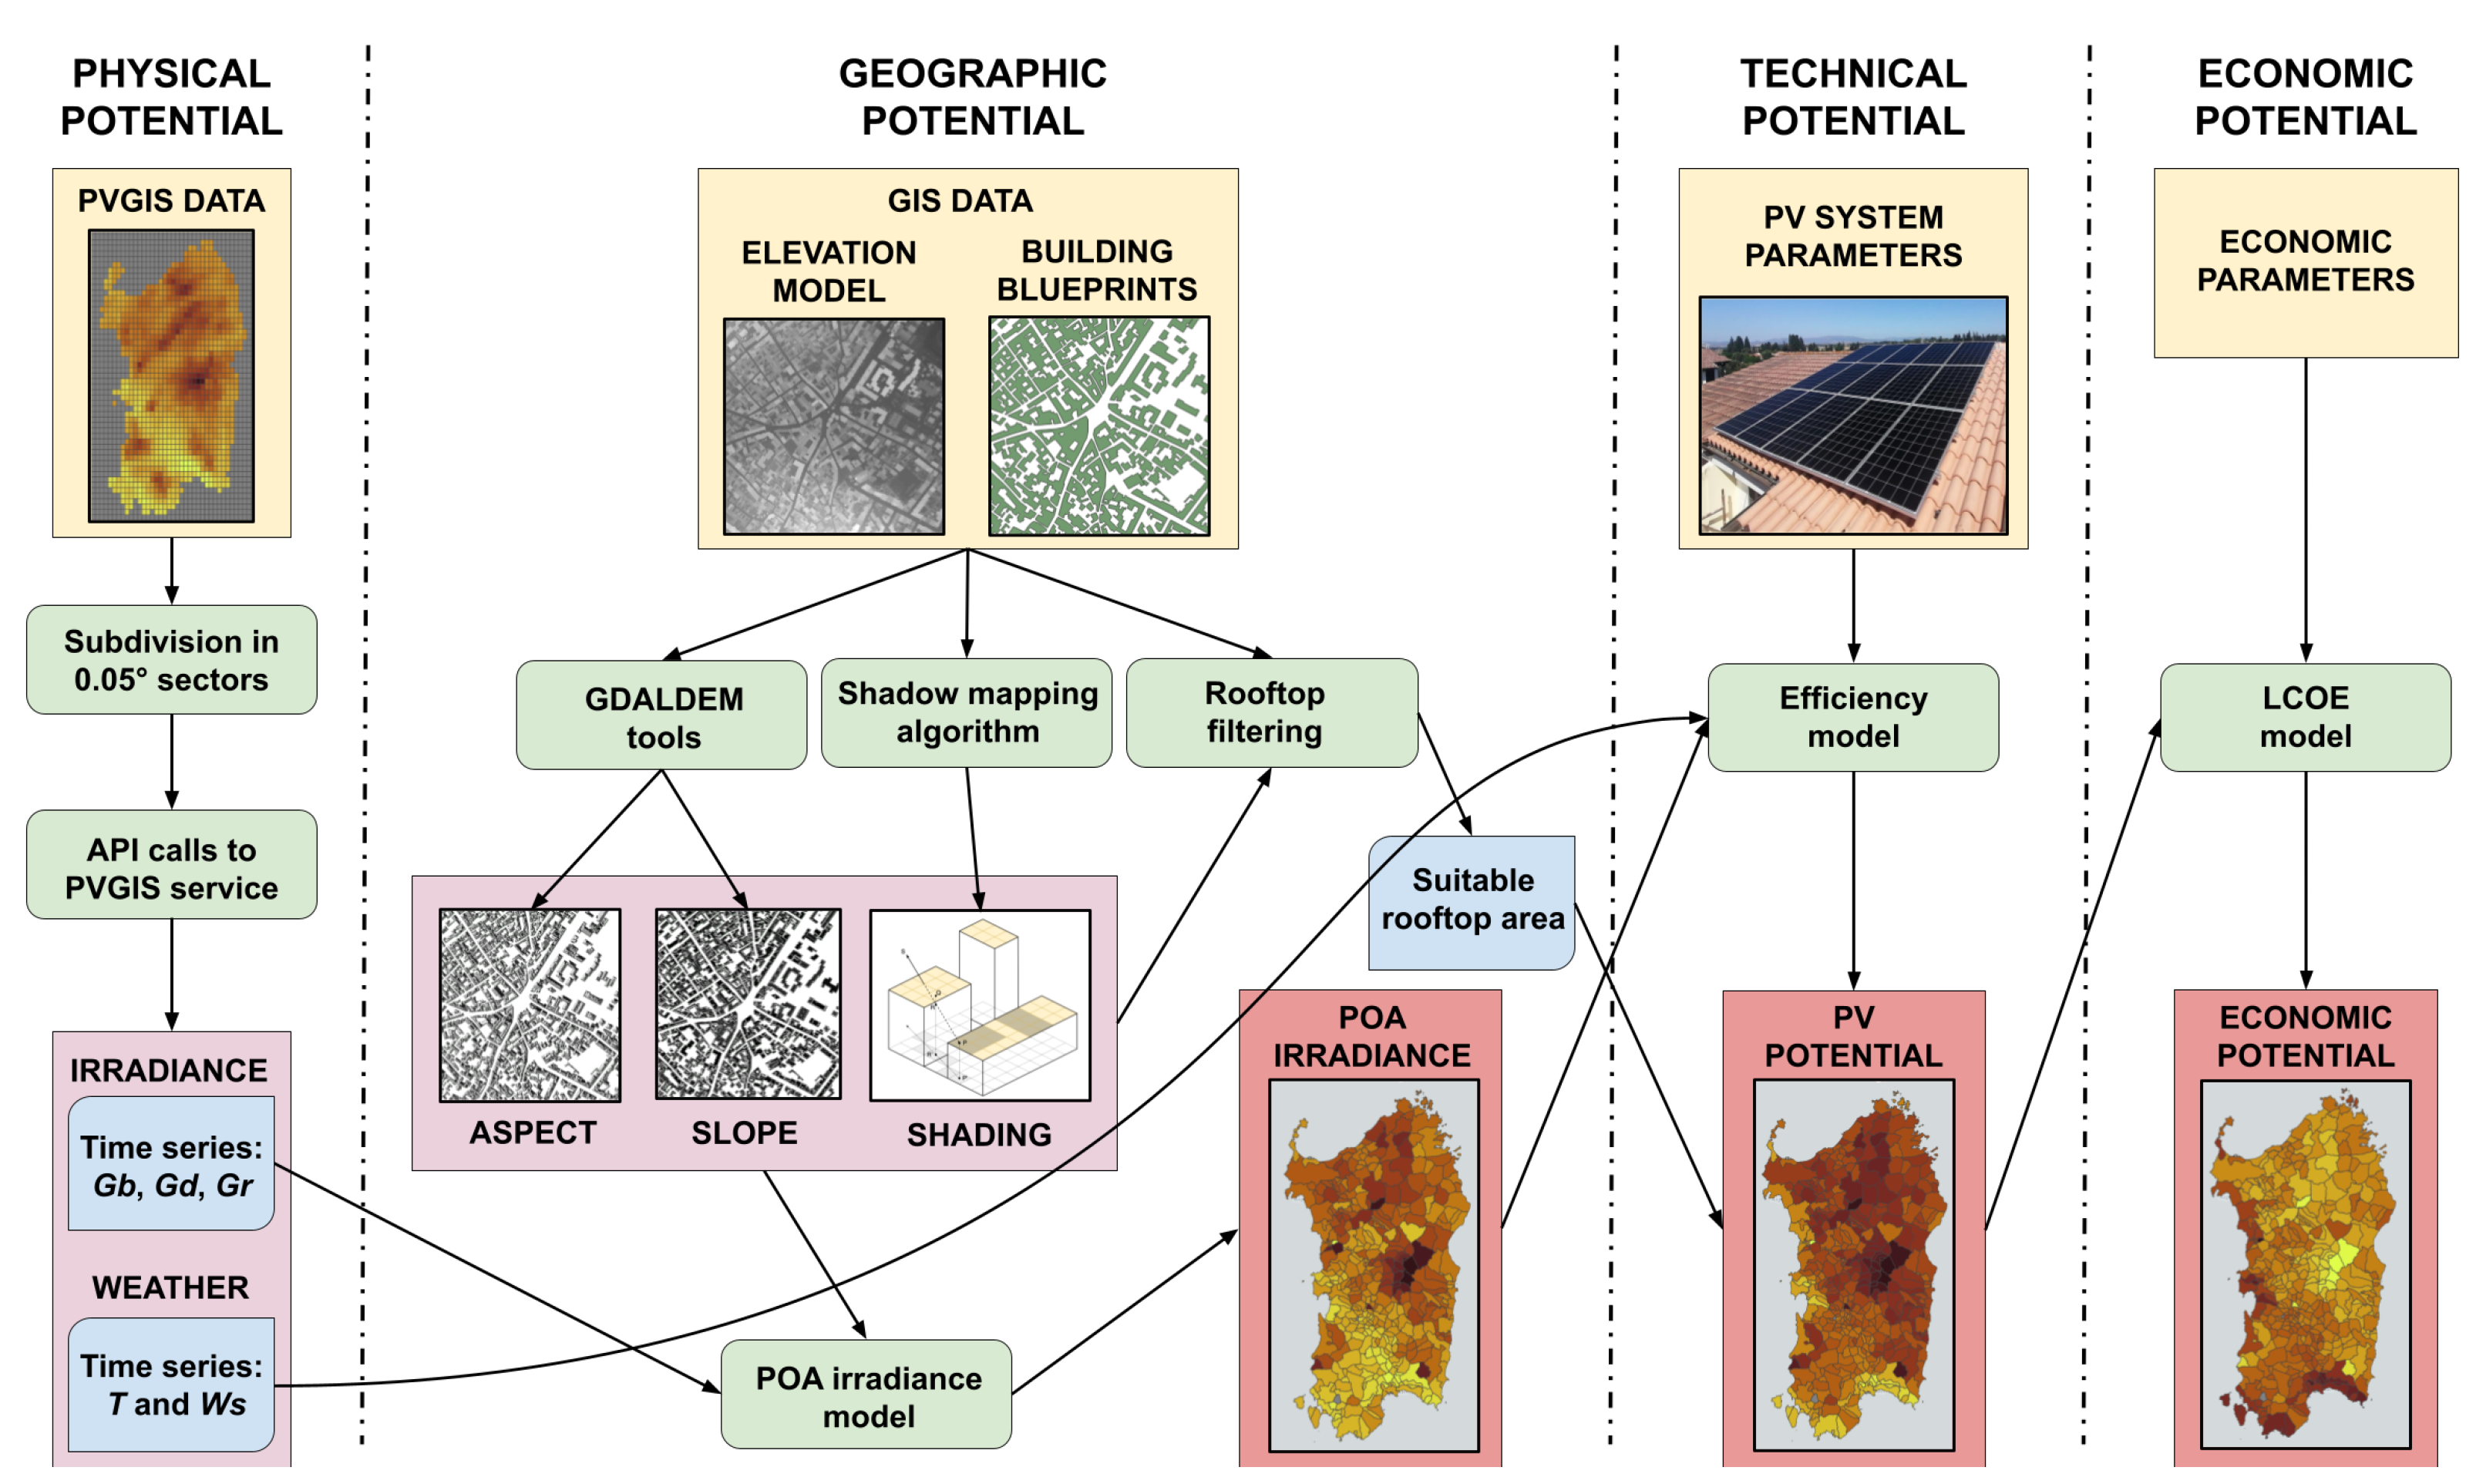
In the following paragraphs, we illustrate the methodologies used for computing the slope and aspect of building rooftops (Section 3.1), for evaluating the shadings (Section 3.2), for estimating the radiation incident on rooftops (Section 3.3), for evaluating the energy produced by photovoltaic panels installed on the rooftops themselves (Section 3.4), and for studying the cost-effectiveness of the investment (Section 3.5). An overview of the whole procedure is presented in Figure 5, where the steps within each of the physical, geographic, technical and economic potentials and the connections between different data and methodologies are emphasized.
3.1. Computation of Rooftop Slope and Aspect
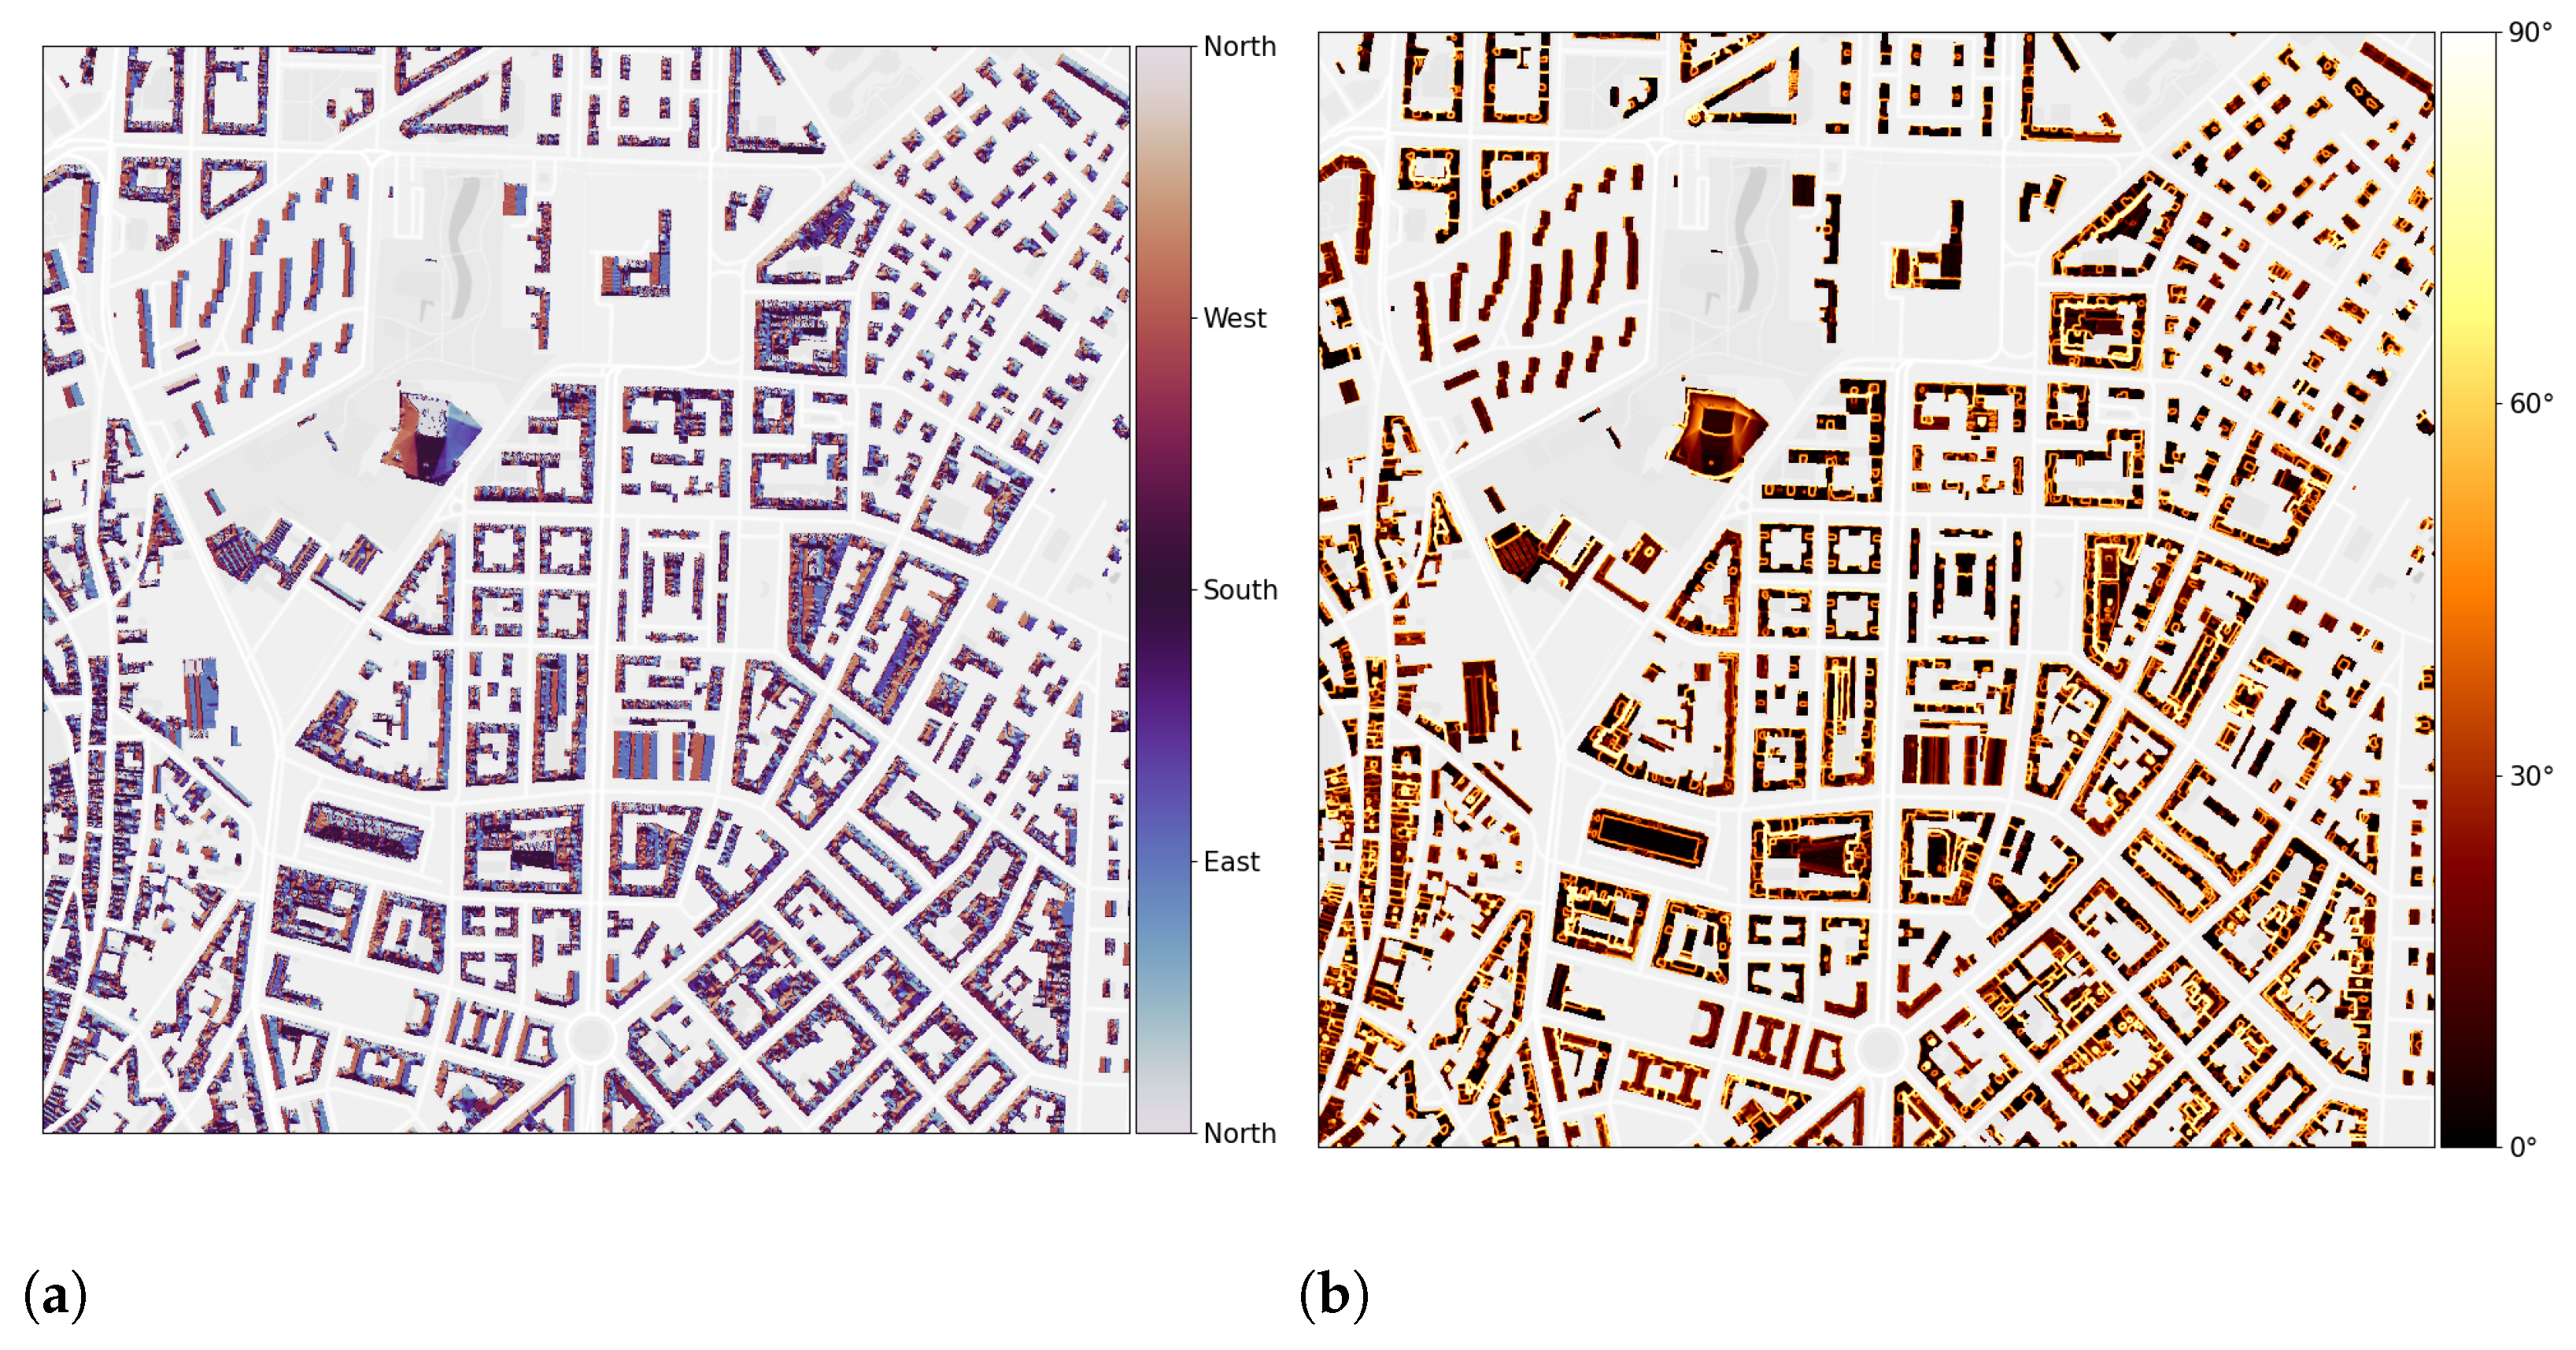
By applying the algorithms to the DSM [42], offered by the tool gdaldem of the GDAL library [43], we obtained the 1 m resolution raster map estimates of the tilt and orientation angles of the roof surface, denoted respectively with and . These values were necessary for the calculation of the incident irradiance on photovoltaic panels, whose annual total varies significantly depending on the orientation with respect to the south and on the inclination of the rooftops on which they are installed. Figure 6 shows the (a) computed aspect and (b) slope values for the rooftop of the buildings within an area of the Municipality of Cagliari.
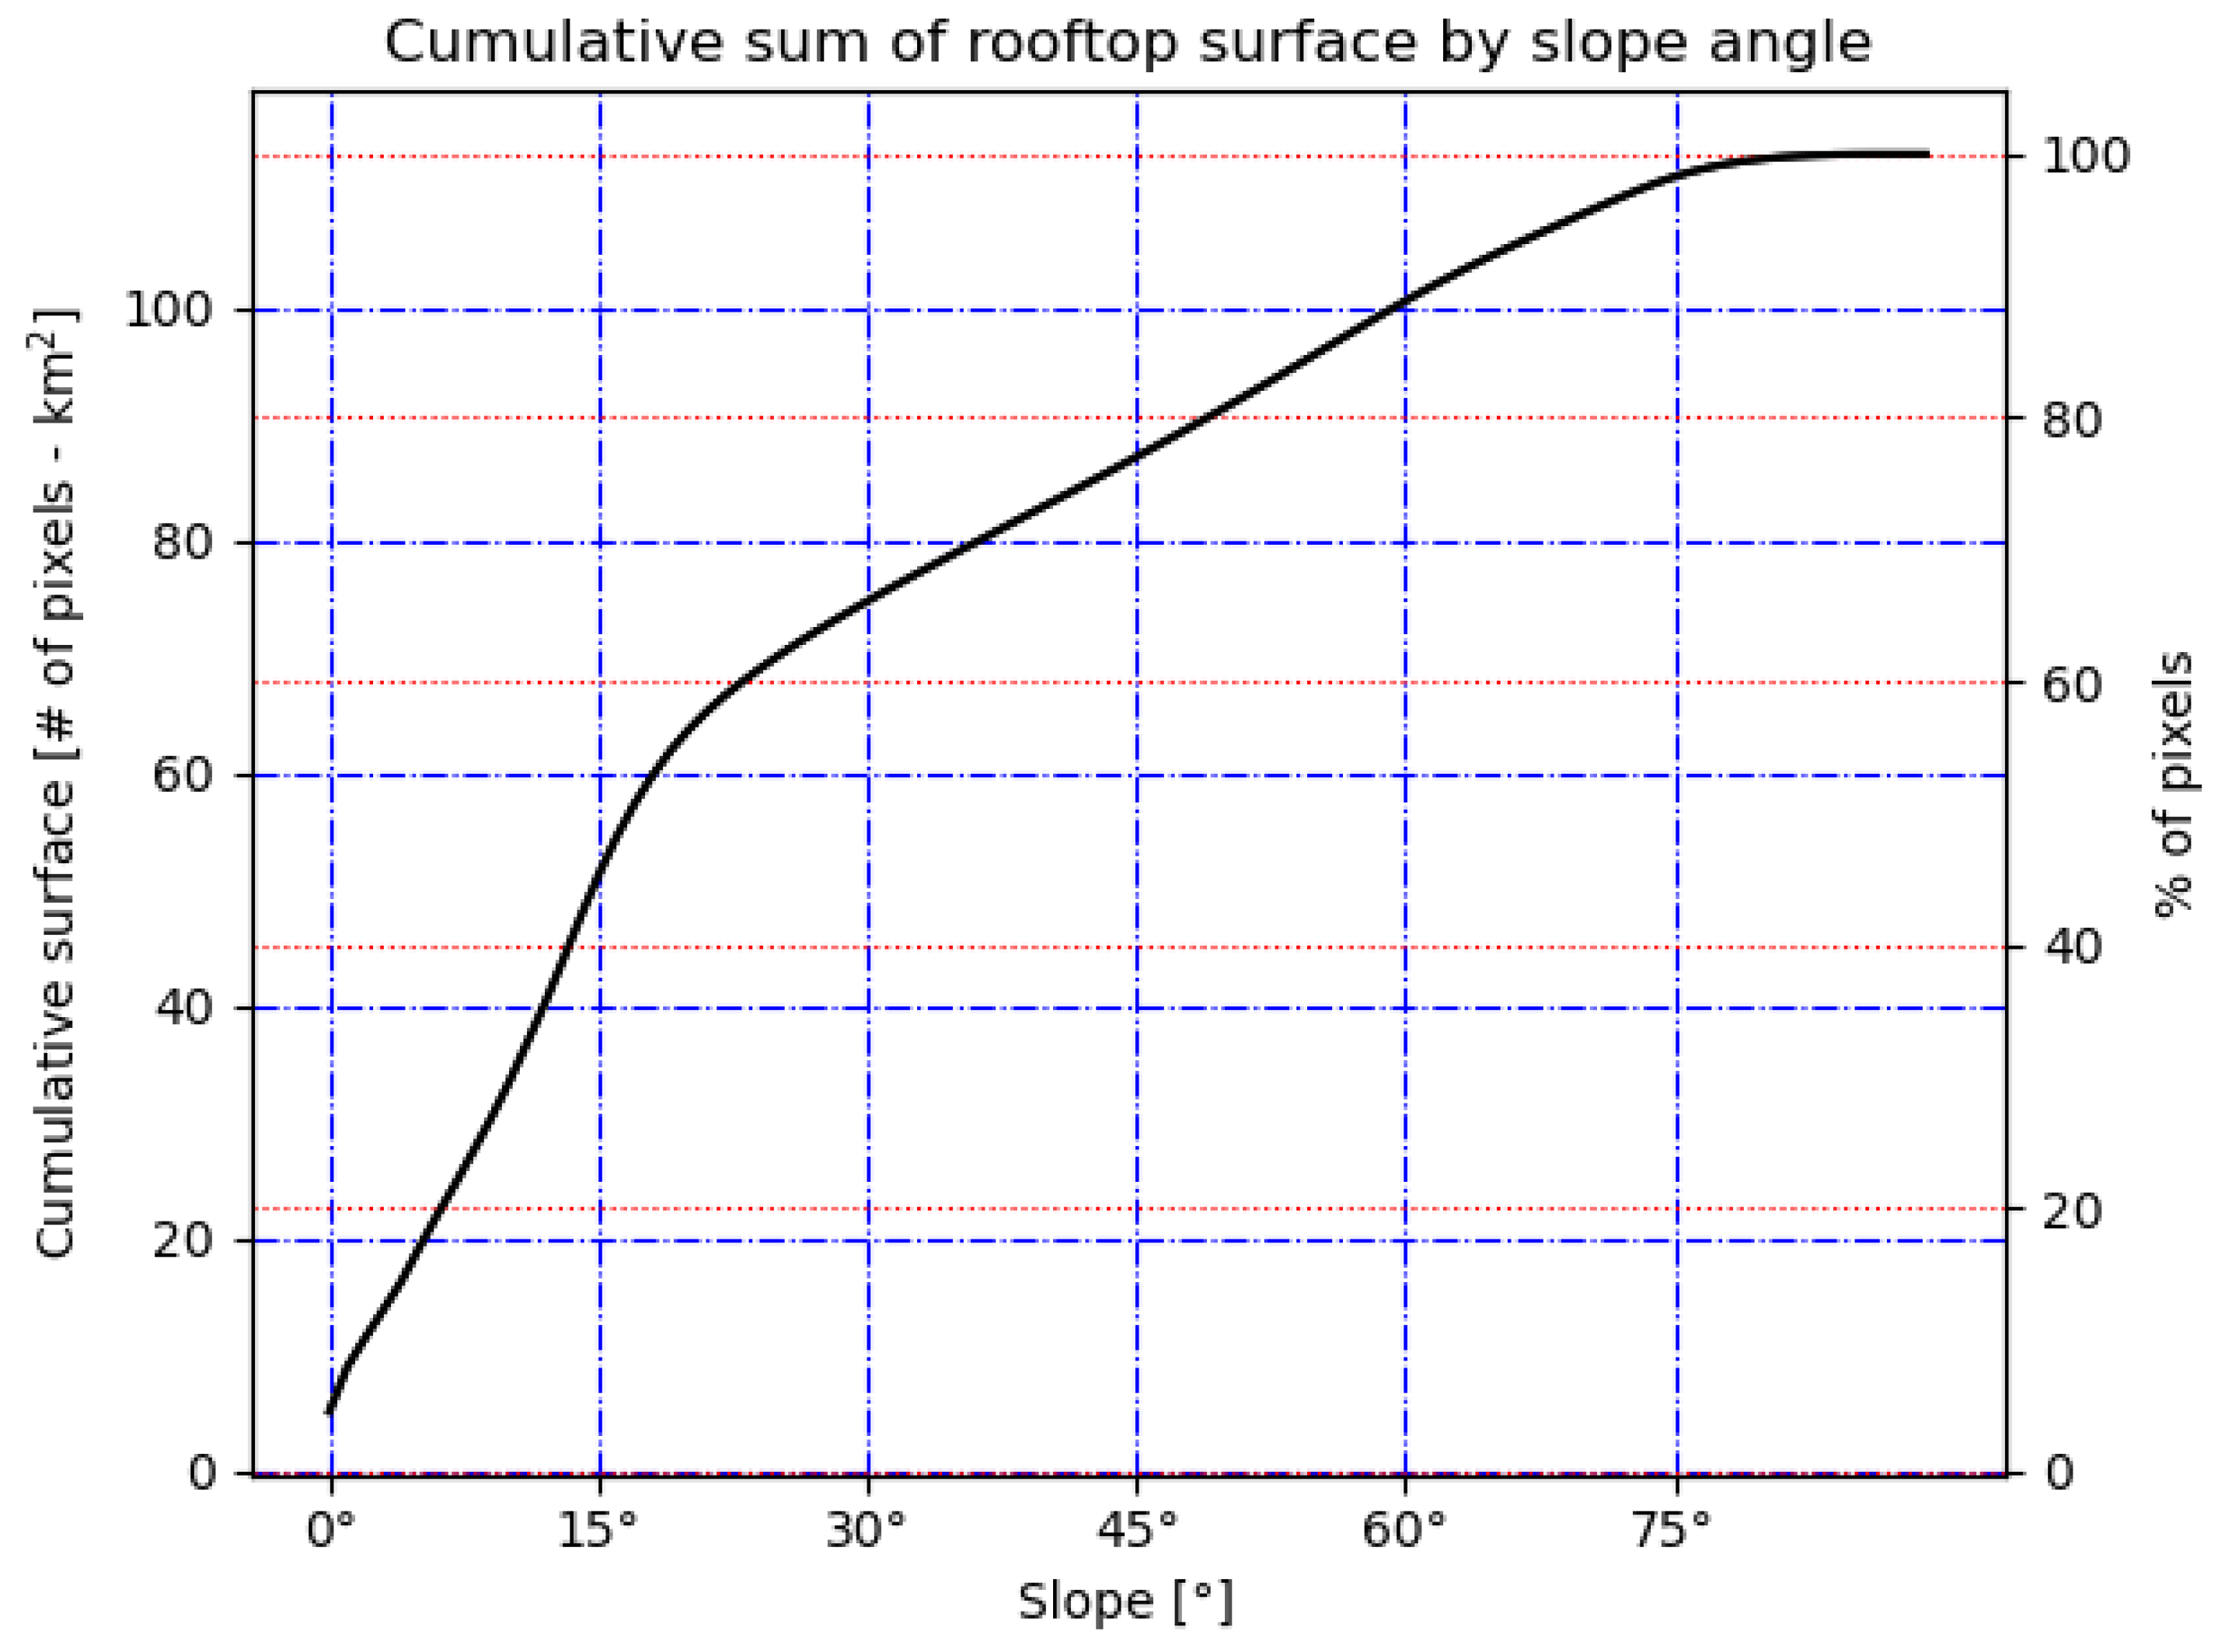
The DSM covers a total building rooftop surface of about 113 km2, corresponding to 113 million pixels. Not all surfaces are suitable for the installation of panels due to the peculiarities of the buildings, discontinuities, irregularities, and steep inclinations of the rooftop surfaces. After filtering the unsuitable portions of building rooftops, we obtained a total useful surface area of approximately 80 km2.
Figure 7 shows the cumulative sum of the rooftop surfaces: about 60% of building rooftops were characterized by a slope less than 20°. Around 25% of rooftops had a slope greater than 45° and were thus excluded from the dataset. A further 5% of the rooftops were removed because they were part of contiguous surfaces that were too small to allow for the installation of photovoltaic modules. The aspect of the building rooftops is instead described by a continuous uniform distribution (not shown).
3.2. Computation of Shadows over Rooftops
Knowing whether a portion of a rooftop is shaded for a given position of the sun in the sky allows the amount of total irradiation received by the photovoltaic panels to be corrected by excluding the contribution of the direct component of the irradiation. Using the shadow mapping algorithm presented in [32], we determined for all individual pixels of the rooftop surfaces whether they are illuminated or in shadow for each of the selected positions of the sun. The procedure is a variation of the well-known Bresenham algorithm [44] used in computer graphics to draw segments between two points on a grid. Please refer to [32] for a detailed description of our implementation.
3.3. Estimation of Incident Radiation
The mean annual irradiance on the plane of the array was obtained from the sum of several contributions, i.e., the mean annual irradiances due to the direct component , the diffuse component from the sky and the diffuse component from the ground :
The individual addends of Equation (1) could be approximated to summations:
Equation (2) calculates the average annual contribution due to direct irradiance over a year (T), which was discretized into one-hour time intervals . In Equation (2) is the mean direct normal irradiance, indicates whether the point at time instant of the year is in shadow or is illuminated by the sun, and is the mean angle of incidence of the solar ray with respect to the panel surface at time .
Equation (3) is relative to the average annual contribution due to diffuse irradiance from the sky on a surface tilted with angle with the isotropic sky model [45]; is the diffuse horizontal irradiance.
Equation (4) is relative to the average annual contribution due to diffuse irradiance from the ground on a tilted surface; is the global horizontal irradiance, and is the albedo.
In our model, the values of GHI, DHI, and DNI depend solely on the position of the Sun with respect to the panel. Each instant of the year corresponds to a specific position of the sun in the sky, as defined by azimuth angles and zenith angles . Performing the calculation described in Section 3.2 for millions of pixels and for hundreds of thousands of possible positions of the Sun in the sky (a year consists of over 500,000 min) is too computationally onerous. With the objective of keeping the spatial resolution of 1 m unchanged, it is possible to significantly reduce the number of sun positions for which to calculate whether a point is illuminated by the sun or is in shadow.
The employed strategy was to divide the sky into sectors with a resolution of (both in azimuth and zenith) without sacrificing accuracy [32]. As a result, Equations (2)–(4) are transformed into:
where , and, using Iverson’s notation,
Equations (8)–(10) allow for the calculation of the average direct, diffuse, and global components of solar irradiance for each portion of the sky as a function of the indices of azimuth and zenith.
As a result, the shading calculation for each pixel only needs to be performed a few hundred times, i.e., for combinations of and angles for which . By repeating the computations for each pixel of the DSM raster belonging to the area inside the perimeter of the buildings, we thus obtain the 1 m resolution map of the mean annual irradiance on the plane of the array , and the components , and for all the buildings in Sardinia.
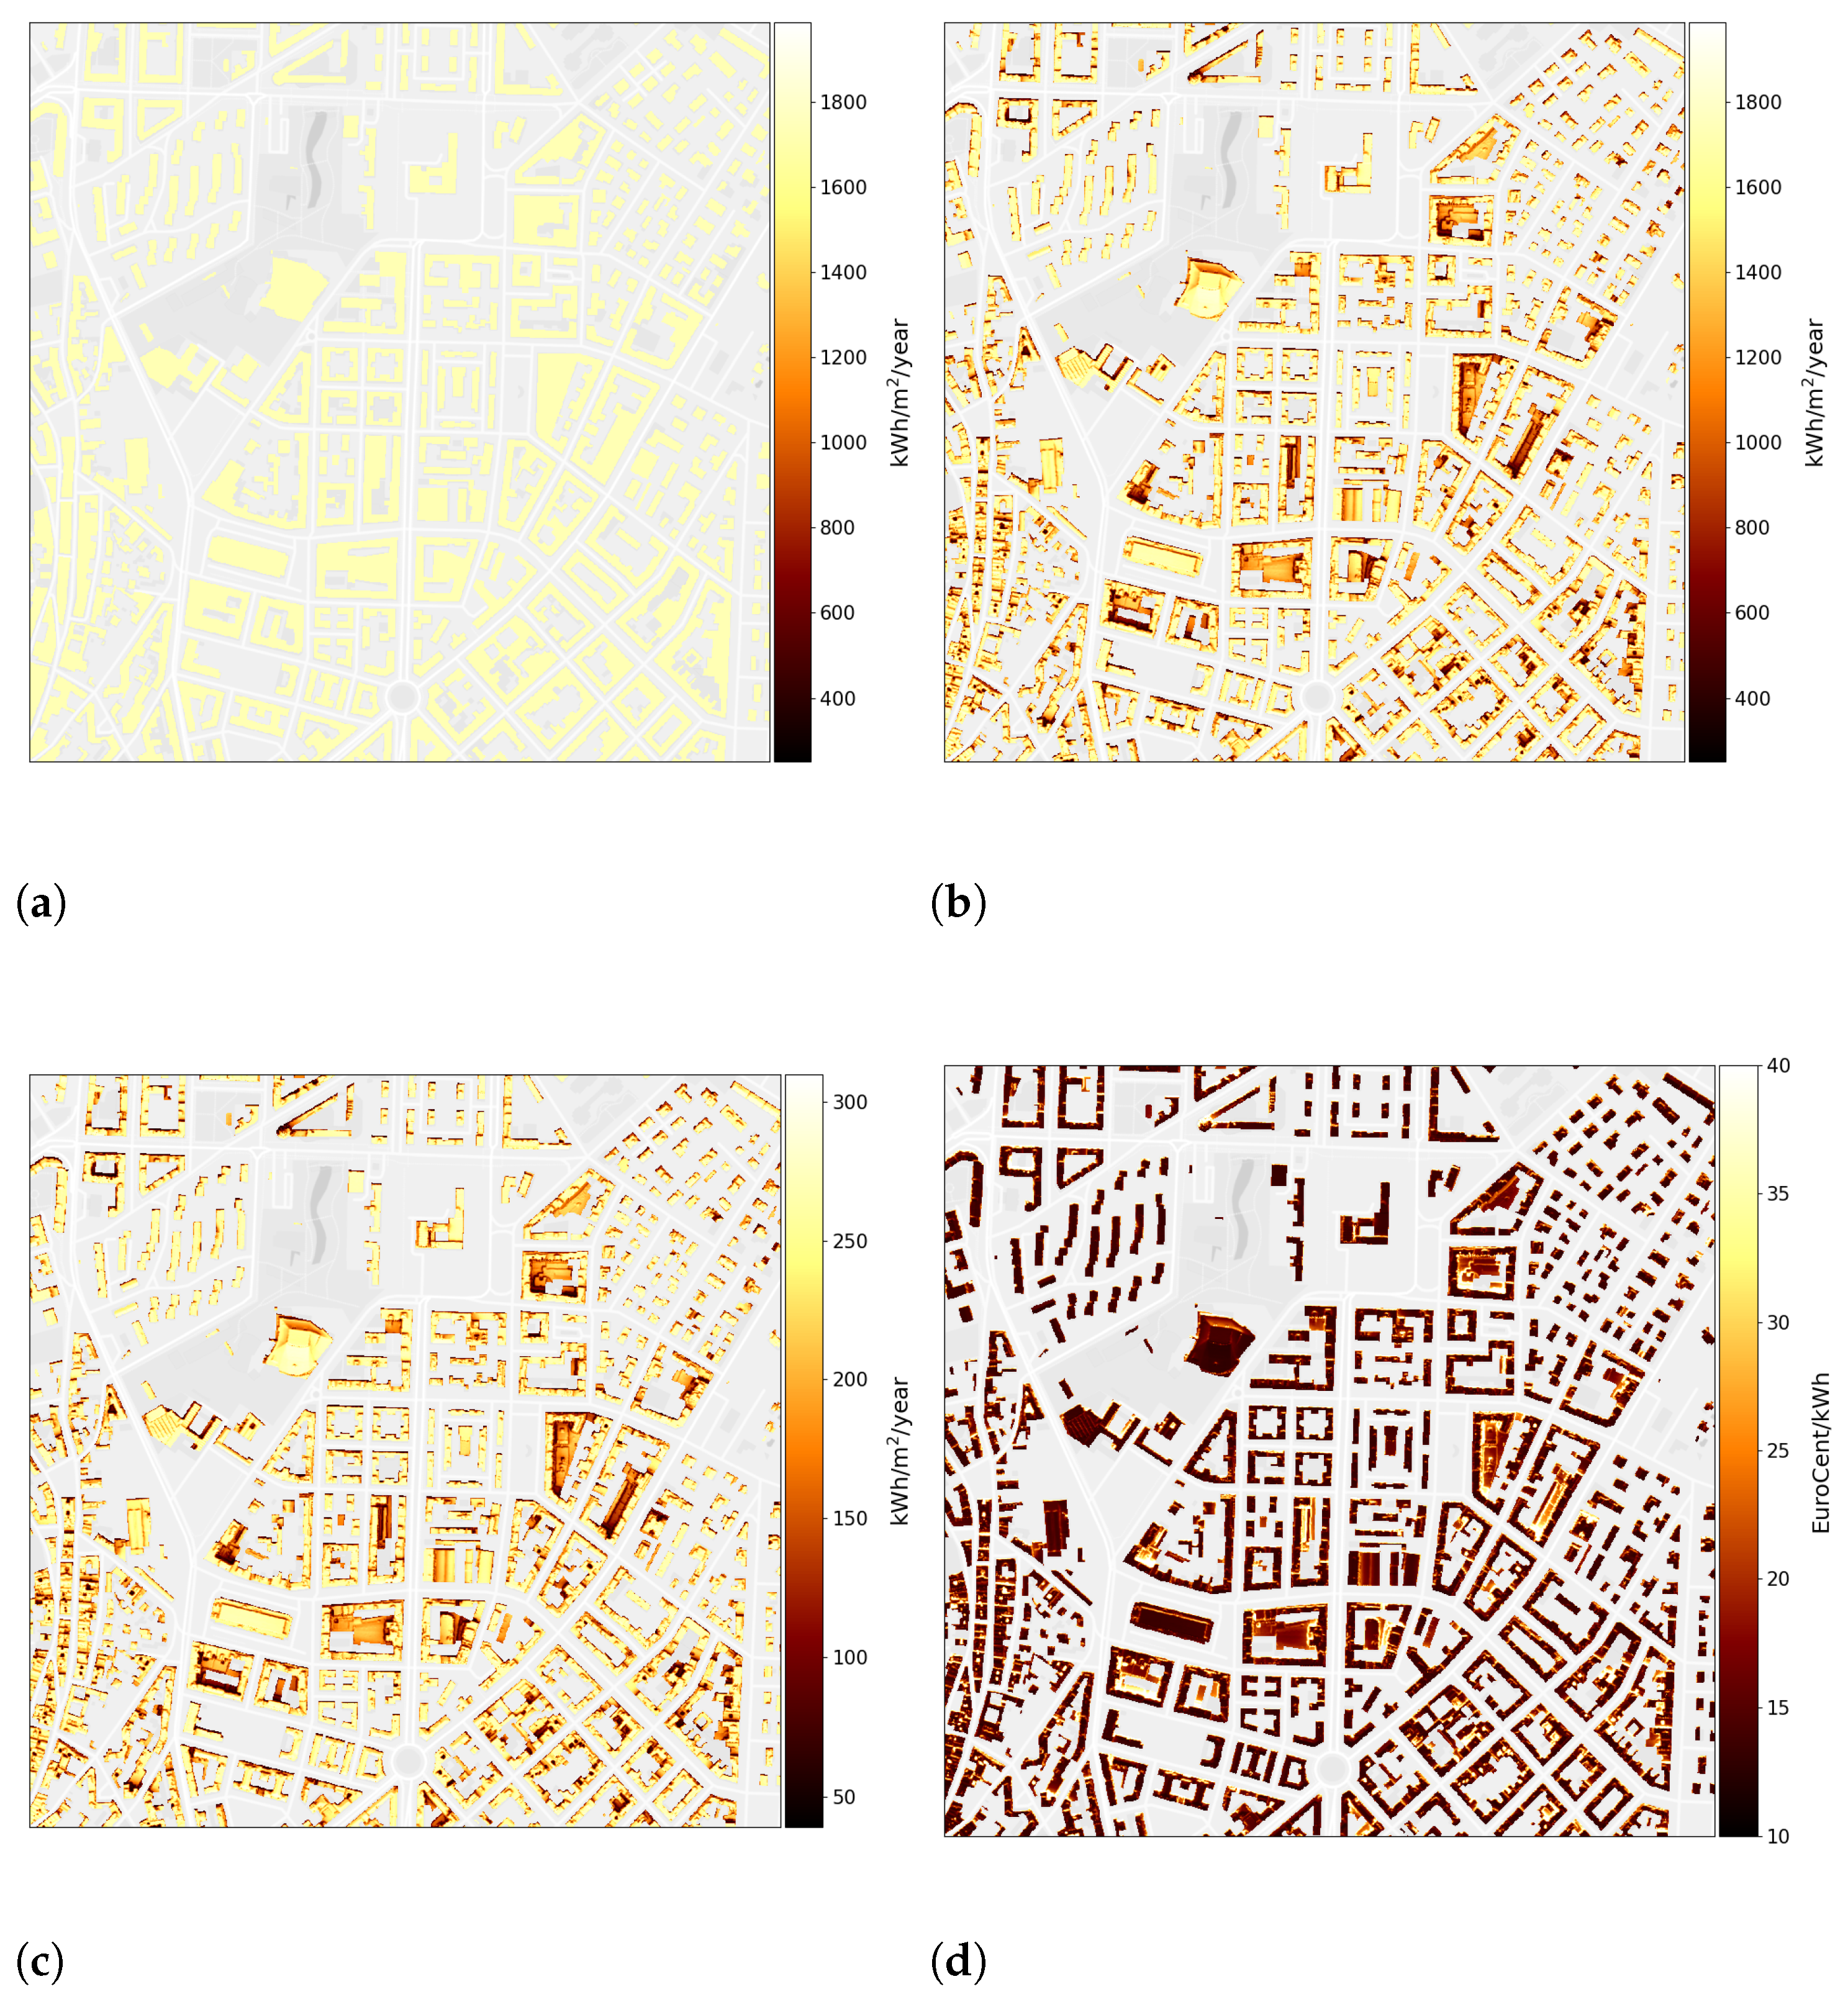
Figure 8a shows an extract of the global horizontal irradiance (GHI) map, whereas Figure 8b depicts the irradiance on the plane of the array (POA). It is immediately noticeable how the darker areas, i.e., those facing north or shaded by other buildings, receive less radiation than the light-colored areas do, i.e., those facing south or are taller than the surrounding buildings.
3.4. Estimation of Photovoltaic Technical Potential
For the estimation of the photovoltaic technical potential, historical time series of temperature and wind speed provided by PVGIS were used in addition to the irradiation on the POA. The power output of the photovoltaic installations, according to the model of Huld et al. [35], depends on irradiation, weather conditions, system characteristics, and system losses:
where represents the irradiance in the plane of the arrays, and represents the power output from the photovoltaic modules determined under standard test conditions; in our case, it defined as W, where represents the nominal (18.2%) efficiency [33] and m2 is the area covered by a single pixel of the raster. Relative efficiency is calculated as follows:
where and parameters , which depend on the solar panel technology used, were calibrated on the basis of measurements by ESTI, the Joint Research Centre’s European Solar Test Installation laboratory [35]. Temperature module is defined as follows:
where is the ambient temperature [46], is the wind speed, and coefficients and are determined in [47]. Lastly, generic system loss , as recommended by PVGIS, was considered. Such system losses include the reduction of the panel efficiency over time and the losses due to the transfer of power from the photovoltaic panels to the electrical grid via cables and inverter [7].
By integrating power output from Equation (11) over a one-year period, we obtained the average energy generated annually by a hypothetical 1 m2 sized panel installed on a portion of a roof characterized by specific irradiation values, weather conditions, tilt, and orientation. Thus, we obtained the technical potential map, an extract of which is shown as an example in Figure 8c, where each pixel represents the amount of energy that could be produced annually by photovoltaic modules characterized by a 1 m2 surface, efficiency of 18.2% and system losses of 14.0%.
3.5. Estimation of Economic Potential
An initial estimation of the economic potential is obtained by calculating the levelized cost of electricity (LCOE), which expresses the ratio of the costs incurred for the installation of a photovoltaic system to the energy produced by the system itself over the period of operation. Therefore, it indicates how much it would cost to produce 1 kWh with a 1 kWp photovoltaic system. When the LCOE value is lower than the cost of a kWh purchased from the grid, the investment is remunerative. We calculated the LCOE coefficient as follows [36,48]:
where (capital expenditure) is the initial cost of the plant [49], which includes the purchase of panels and inverters, and the installation costs; (operating expense) is the annual running cost of the system [49] that takes into account the tariff to be paid to the grid operator and the eventual cleaning and maintenance of the system; represents the tax deductions or purchase incentives that for simplicity we consider null; The cost of capital is [49]; we assumed an operating life of years. Lastly, represents the average energy produced annually by a 1 kWp photovoltaic system with [33].
It is possible to map the cost of electricity by calculating the LCOE for all the pixels on building rooftops, as shown in Figure 8d for a district of the Municipality of Cagliari. Dark pixels show the rooftop surfaces where the installation of photovoltaic systems is most economically convenient. The choice of colours renders the map chromatically complementary to the technical potential map shown in Figure 8c.
4. Results
Using the methodologies presented in Section 3 we computed, with a spatial resolution of 1 m and for the whole territory of Sardinia, the shape (slope and aspect) of the building rooftops, the irradiation incident on the rooftops (taking into account any shading due to the presence of nearby buildings or other obstructions), the average annual energy delivered by standard photovoltaic panels hypothetically installed on the rooftops, and the cost to be incurred for installing a 1 kWp photovoltaic system in order for it to produce 1 kWh of energy. The results provide an overview of the rooftop photovoltaic potential in Sardinia.
We estimated a yearly production of 22 TWh of electricity from photovoltaic systems for the entire island of Sardinia. Its two most populous cities, Cagliari and Sassari, contribute almost 1 TWh each. The other major cities of Olbia, Quartu Sant’Elena, Alghero, Oristano, and Nuoro, each exceeded a yearly production of 300 GWh (Table 1 and Figure 9a).
Figure 9b shows how much energy could be produced per resident per year after the installation of photovoltaic modules on suitable rooftops. Depending on the municipality in Sardinia, the technical potential varied from 215 to 265 kWh/m2/year, and from 10 to 60 MWh/individual/year. The per capita potential depends on two main factors: the presence of apartment buildings, which are widespread in larger cities, lowering the amount of rooftop area per individual; the presence of vacation houses in tourist areas, which are unused for most of the year, and whose owners are rarely among the residents, increasing the available surface per capita.
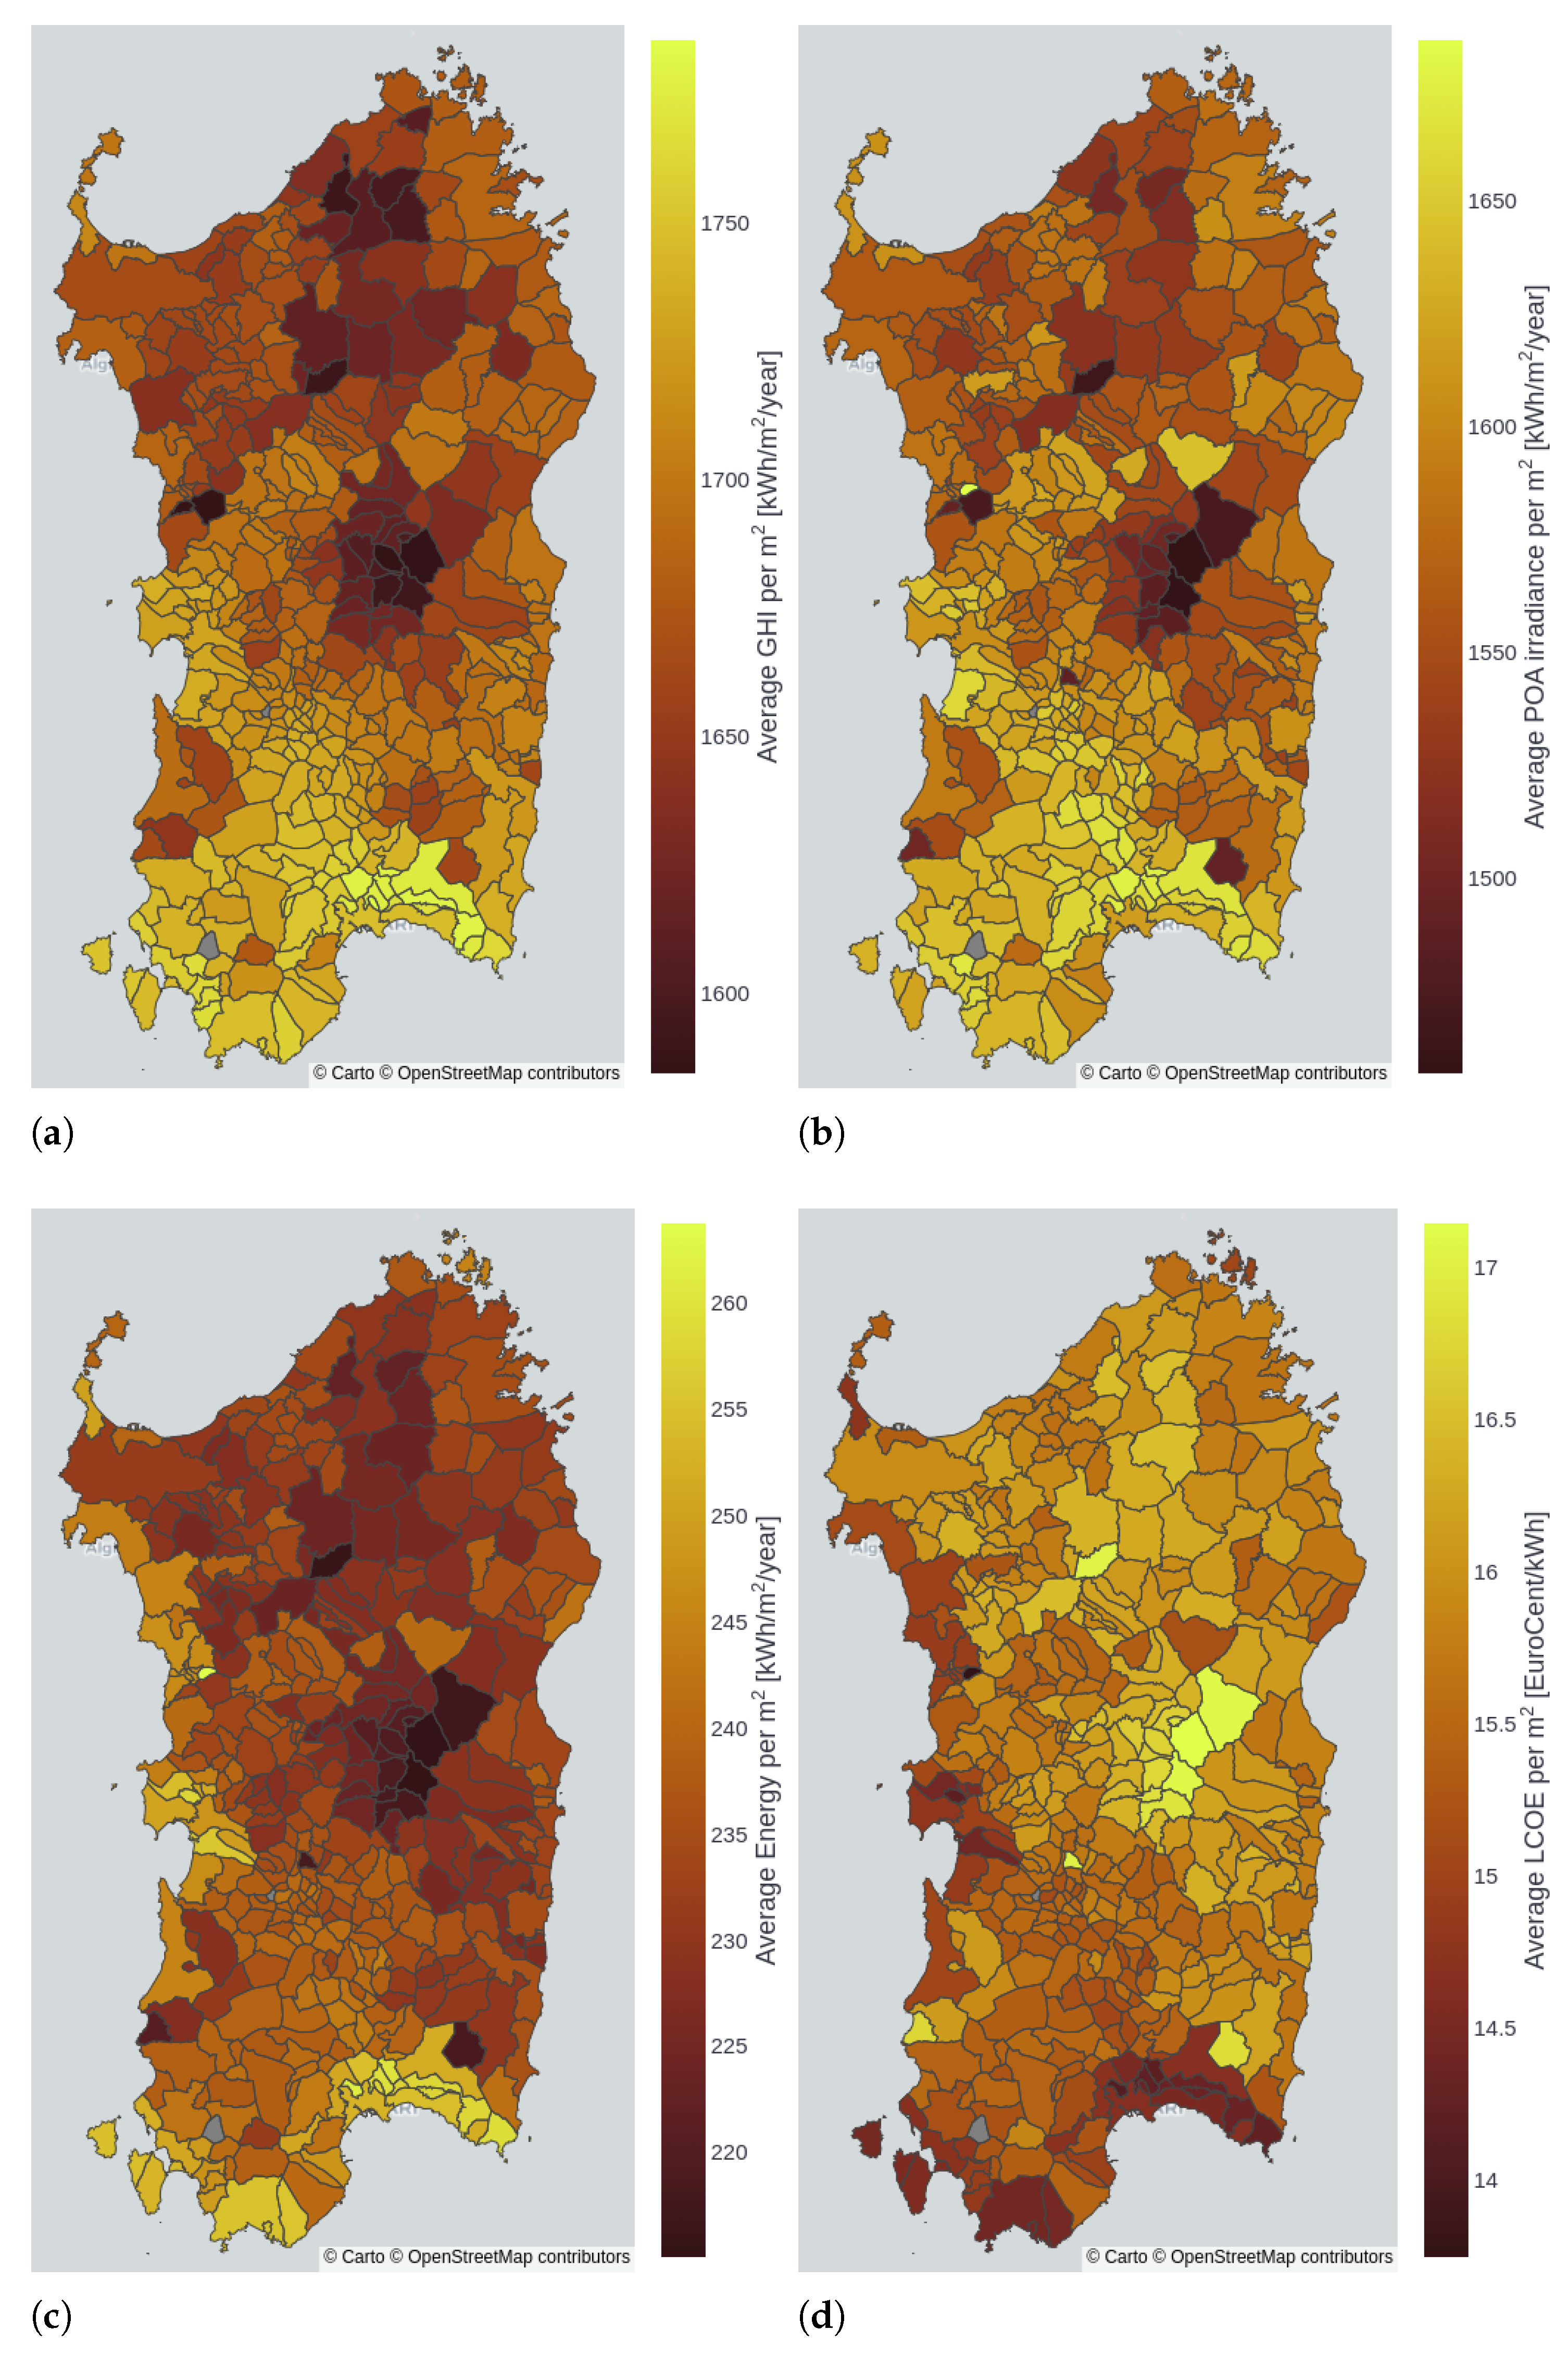
Compared to the total value, which is strongly related to the extension of the municipality’s territory and the number of residents, the photovoltaic potential expressed per m2 is more indicative of the potential of each individual area. Figure 10a shows the annual average global horizontal irradiance per m2, as estimated by PVGIS. The map is similar to Figure 4b, but instead of the 0.05° sectors determined by the PVGIS-SARAH2 database, the GHI values are distributed over the individual territories (from 1600 to close to 1800 kWh/m2/year) The reduction in irradiance on the rooftops due to the shading, inclination, and orientation of the panels leads to the map in Figure 10b, which shows the actual irradiance received per m2 on the plane of the arrays. For some municipalities, the change is drastic, possibly justified by the fortunate exposure of most buildings to the sun. The towns that receive lower irradiance are either in mountainous locations (for which the average irradiance is lower than that for locations on the plains) or are located in deep valleys, situations that greatly reduce the irradiance received when the Sun is not yet high in the sky.
The map of the photovoltaic potential in Figure 10c is qualitatively very similar to the previous one; in fact, the (small) differences between one municipality and another are explained by the equally small differences in temperature and wind speed. Lastly, Figure 10d depicts the average levelized cost of electricity in Sardinia for all municipalities ranging from 14 to 21 EuroCent per kWh. Should the cost of energy remain high as it has been, installing photovoltaic systems in the vast majority of the buildings might be worthwhile, and the energy surplus can be sold to other regions.
The estimated annual photovoltaic potential for the island of Sardinia as a whole, equal to 22 TWh, is obtained by computing the energy production from photovoltaic modules distributed over a surface area larger than 92 km2 (on a total rooftop area of almost 130 km2). This equates to an average annual production of 238.92 kWh per m2, or 1314 kWh produced annually for each kWp installed, using the technology chosen as an example.
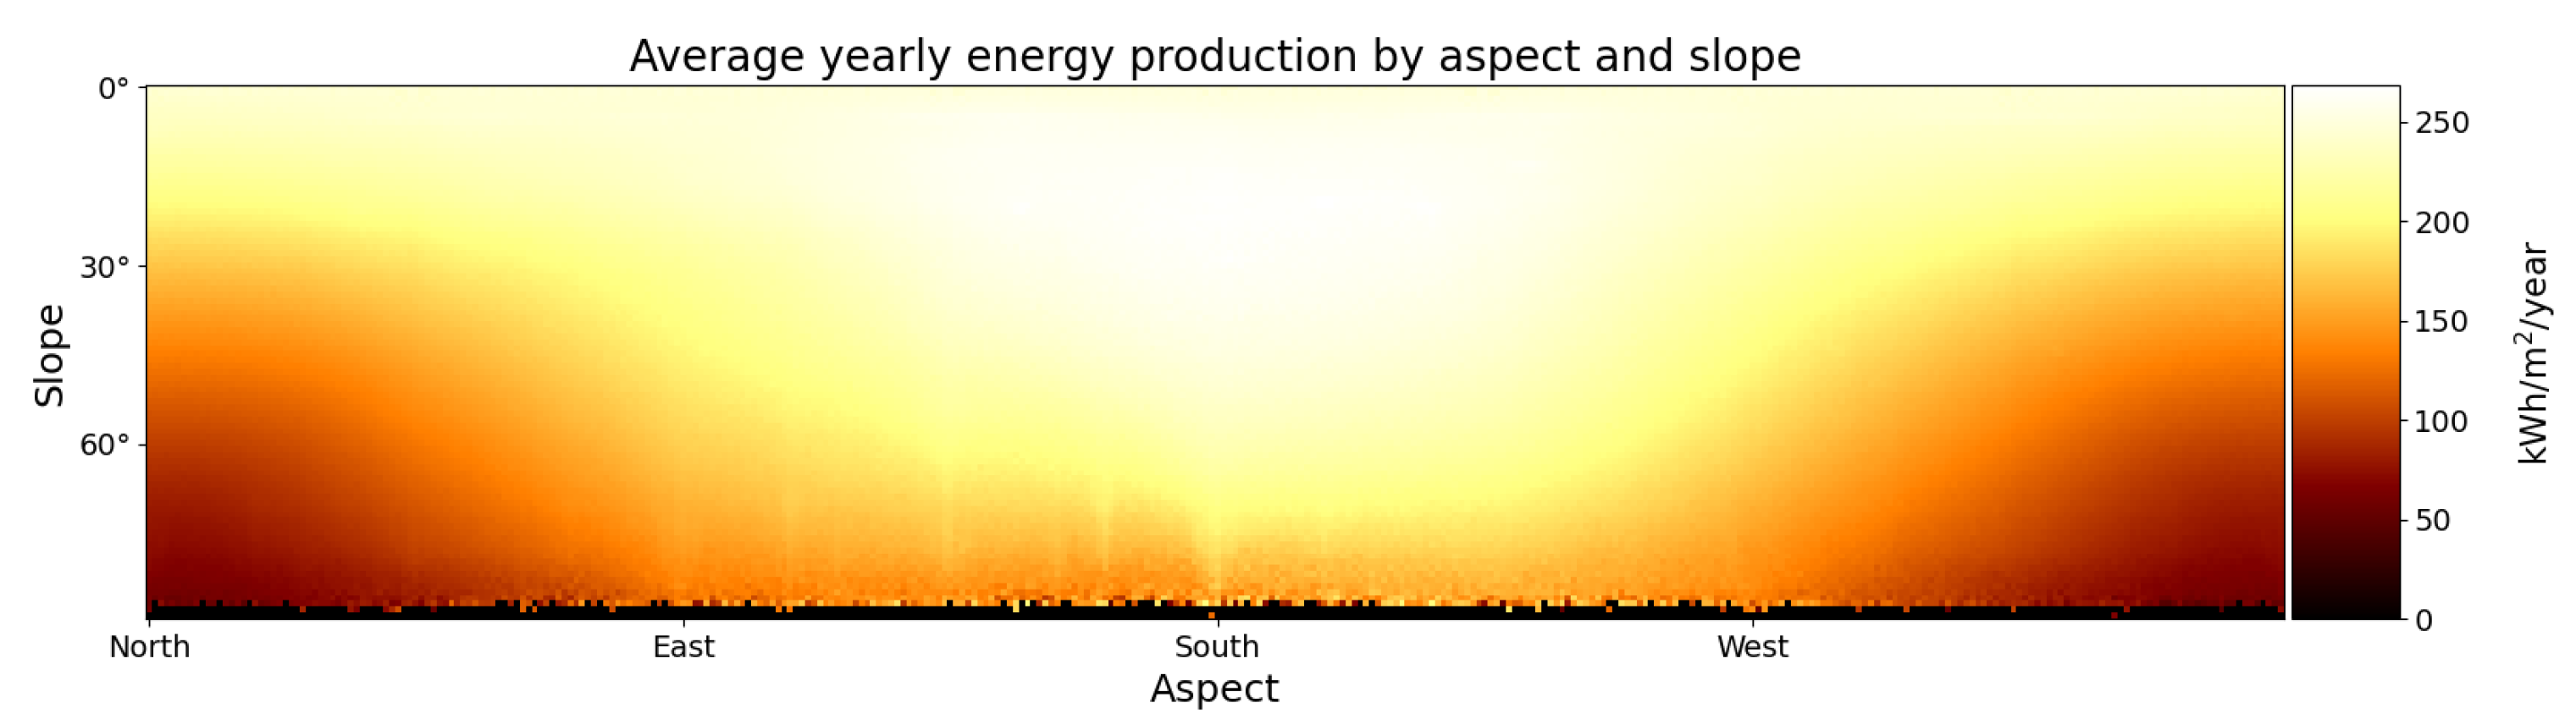
Figure 11 shows the dependence of annual photovoltaic potential, per m2, on rooftop orientation and tilt. In Sardinia, the optimal rooftops which guarantee about 250 kWh/m2/year are those with an orientation between south-west and south-east and a slope between 10° and 30°. North-facing façades are unproductive unless they have an inclination of less than 20°, in which case a production of approximately 200 kWh/m2/year is expected.
5. Discussion
Our procedure estimated a yearly production of 239 kWh per m2, i.e., a photovoltaic potential of 22 TWh distributed over a rooftop area of about 92 km2. The JRC [7] estimates, for the region of Sardinia, a production of 4.68 TWh, but over an area of just 31.96 km2, corresponding to an average of 146.41 kWh per m2. It is not explicit in the text, but it would appear that they used a panel efficiency of 10% instead of 18.2% (as in our case). Using the 18.2% efficiency (5.5 m2/kWp instead of 10), results in an annual production of 266.19 kWh/m2. The JRC estimate was, thus, higher than ours, although this can be explained by their characterization of the modules with optimal aspect (due south) and slope (20°) and not, as in our case, with the actual tilt and orientation of the rooftops. The JRC estimate, moreover, is based on much coarser analysis that does not take into account the actual location of the buildings or the orientation of the rooftops.
Sardinia’s electricity production in 2019 (pre-COVID-19) was 13.14 TWh, with photovoltaic systems accounting for only 8.8% (1.15 TWh), while total consumption was 8.47 TWh [50]. As for the domestic and tertiary sectors, consumption in 2019 amounted to 4.43 TWh. The photovoltaic potential of Sardinia is therefore capable of easily covering domestic and tertiary sector consumption, and that in the industrial and agricultural sectors. Consumption and potential per province are detailed in Table 2. The smaller available surface area per inhabitant and the higher concentration of tertiary sector enterprises render the province of the metropolitan city of Cagliari the most energy-intensive with respect to its photovoltaic potential. This is despite the fact that the installation of modules on just one third of the total rooftop surface could meet the energy needs of all households and services.
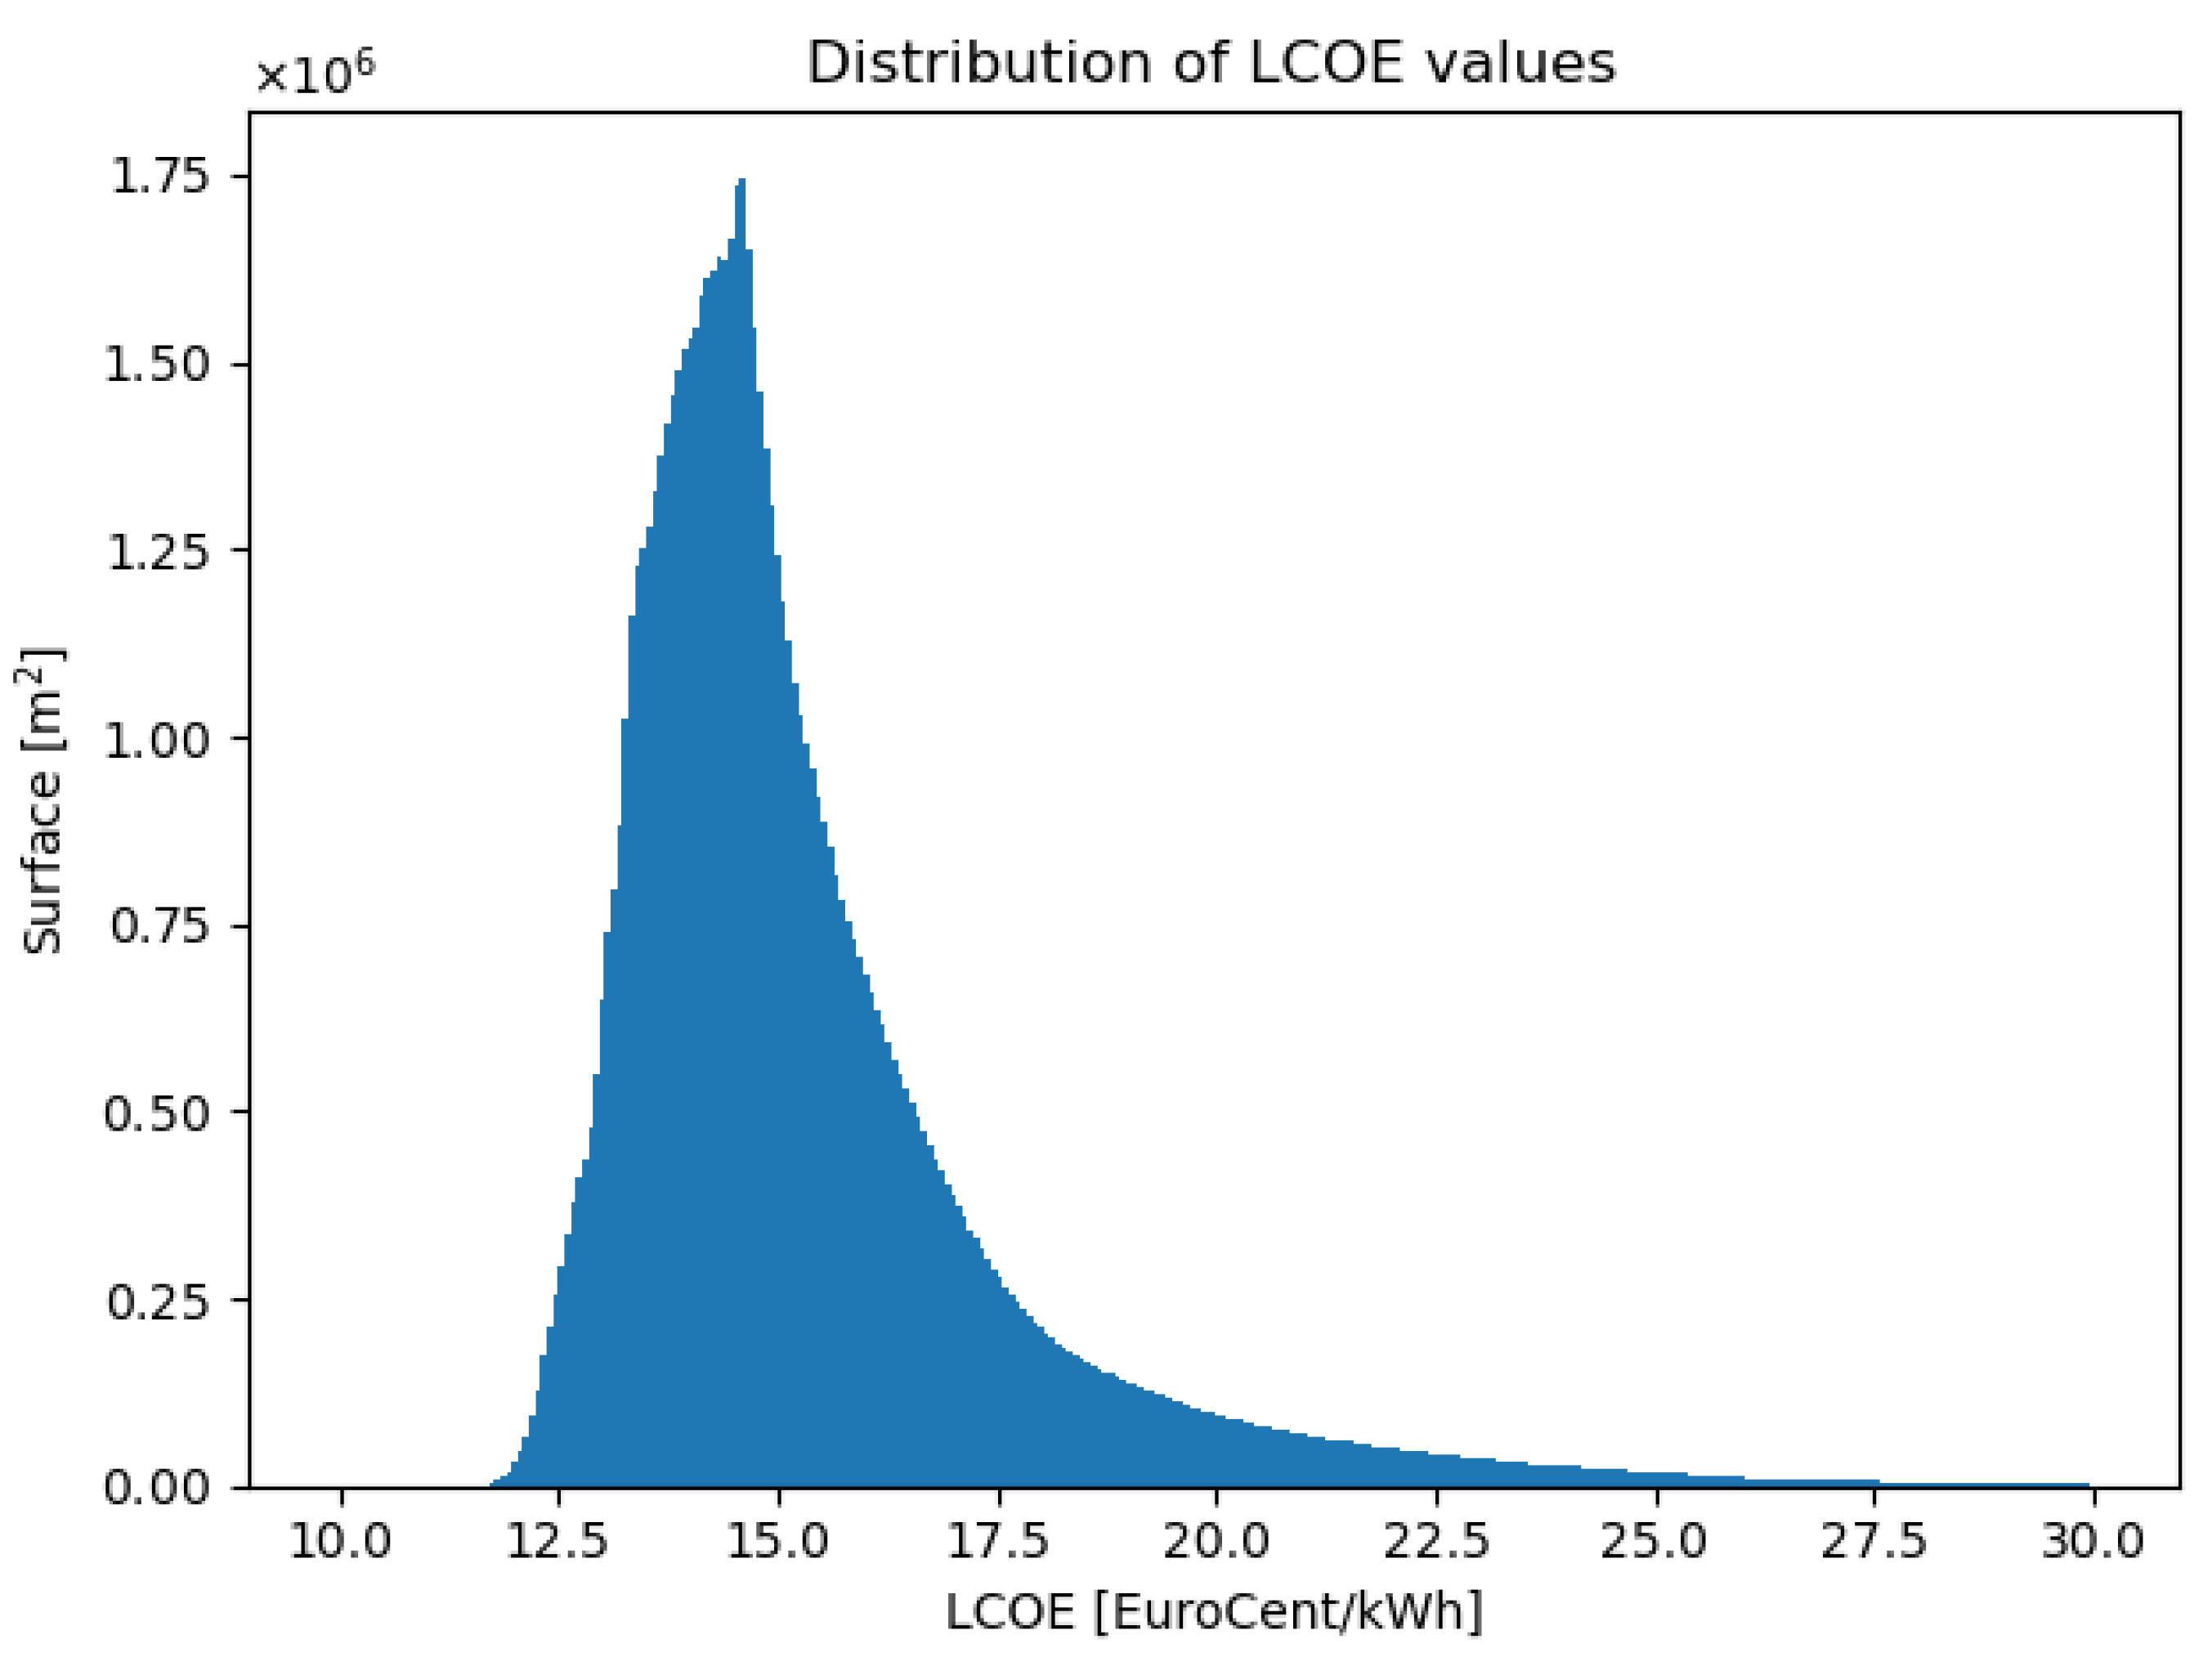
The distribution of the estimated values for the levelized cost of electricity is shown in Figure 12, where 50% of installations had an LCOE below 14.76 EuroCent/kWh, and 50% of installations had an LCOE between 13.94 and 16.10 EuroCent/kWh.
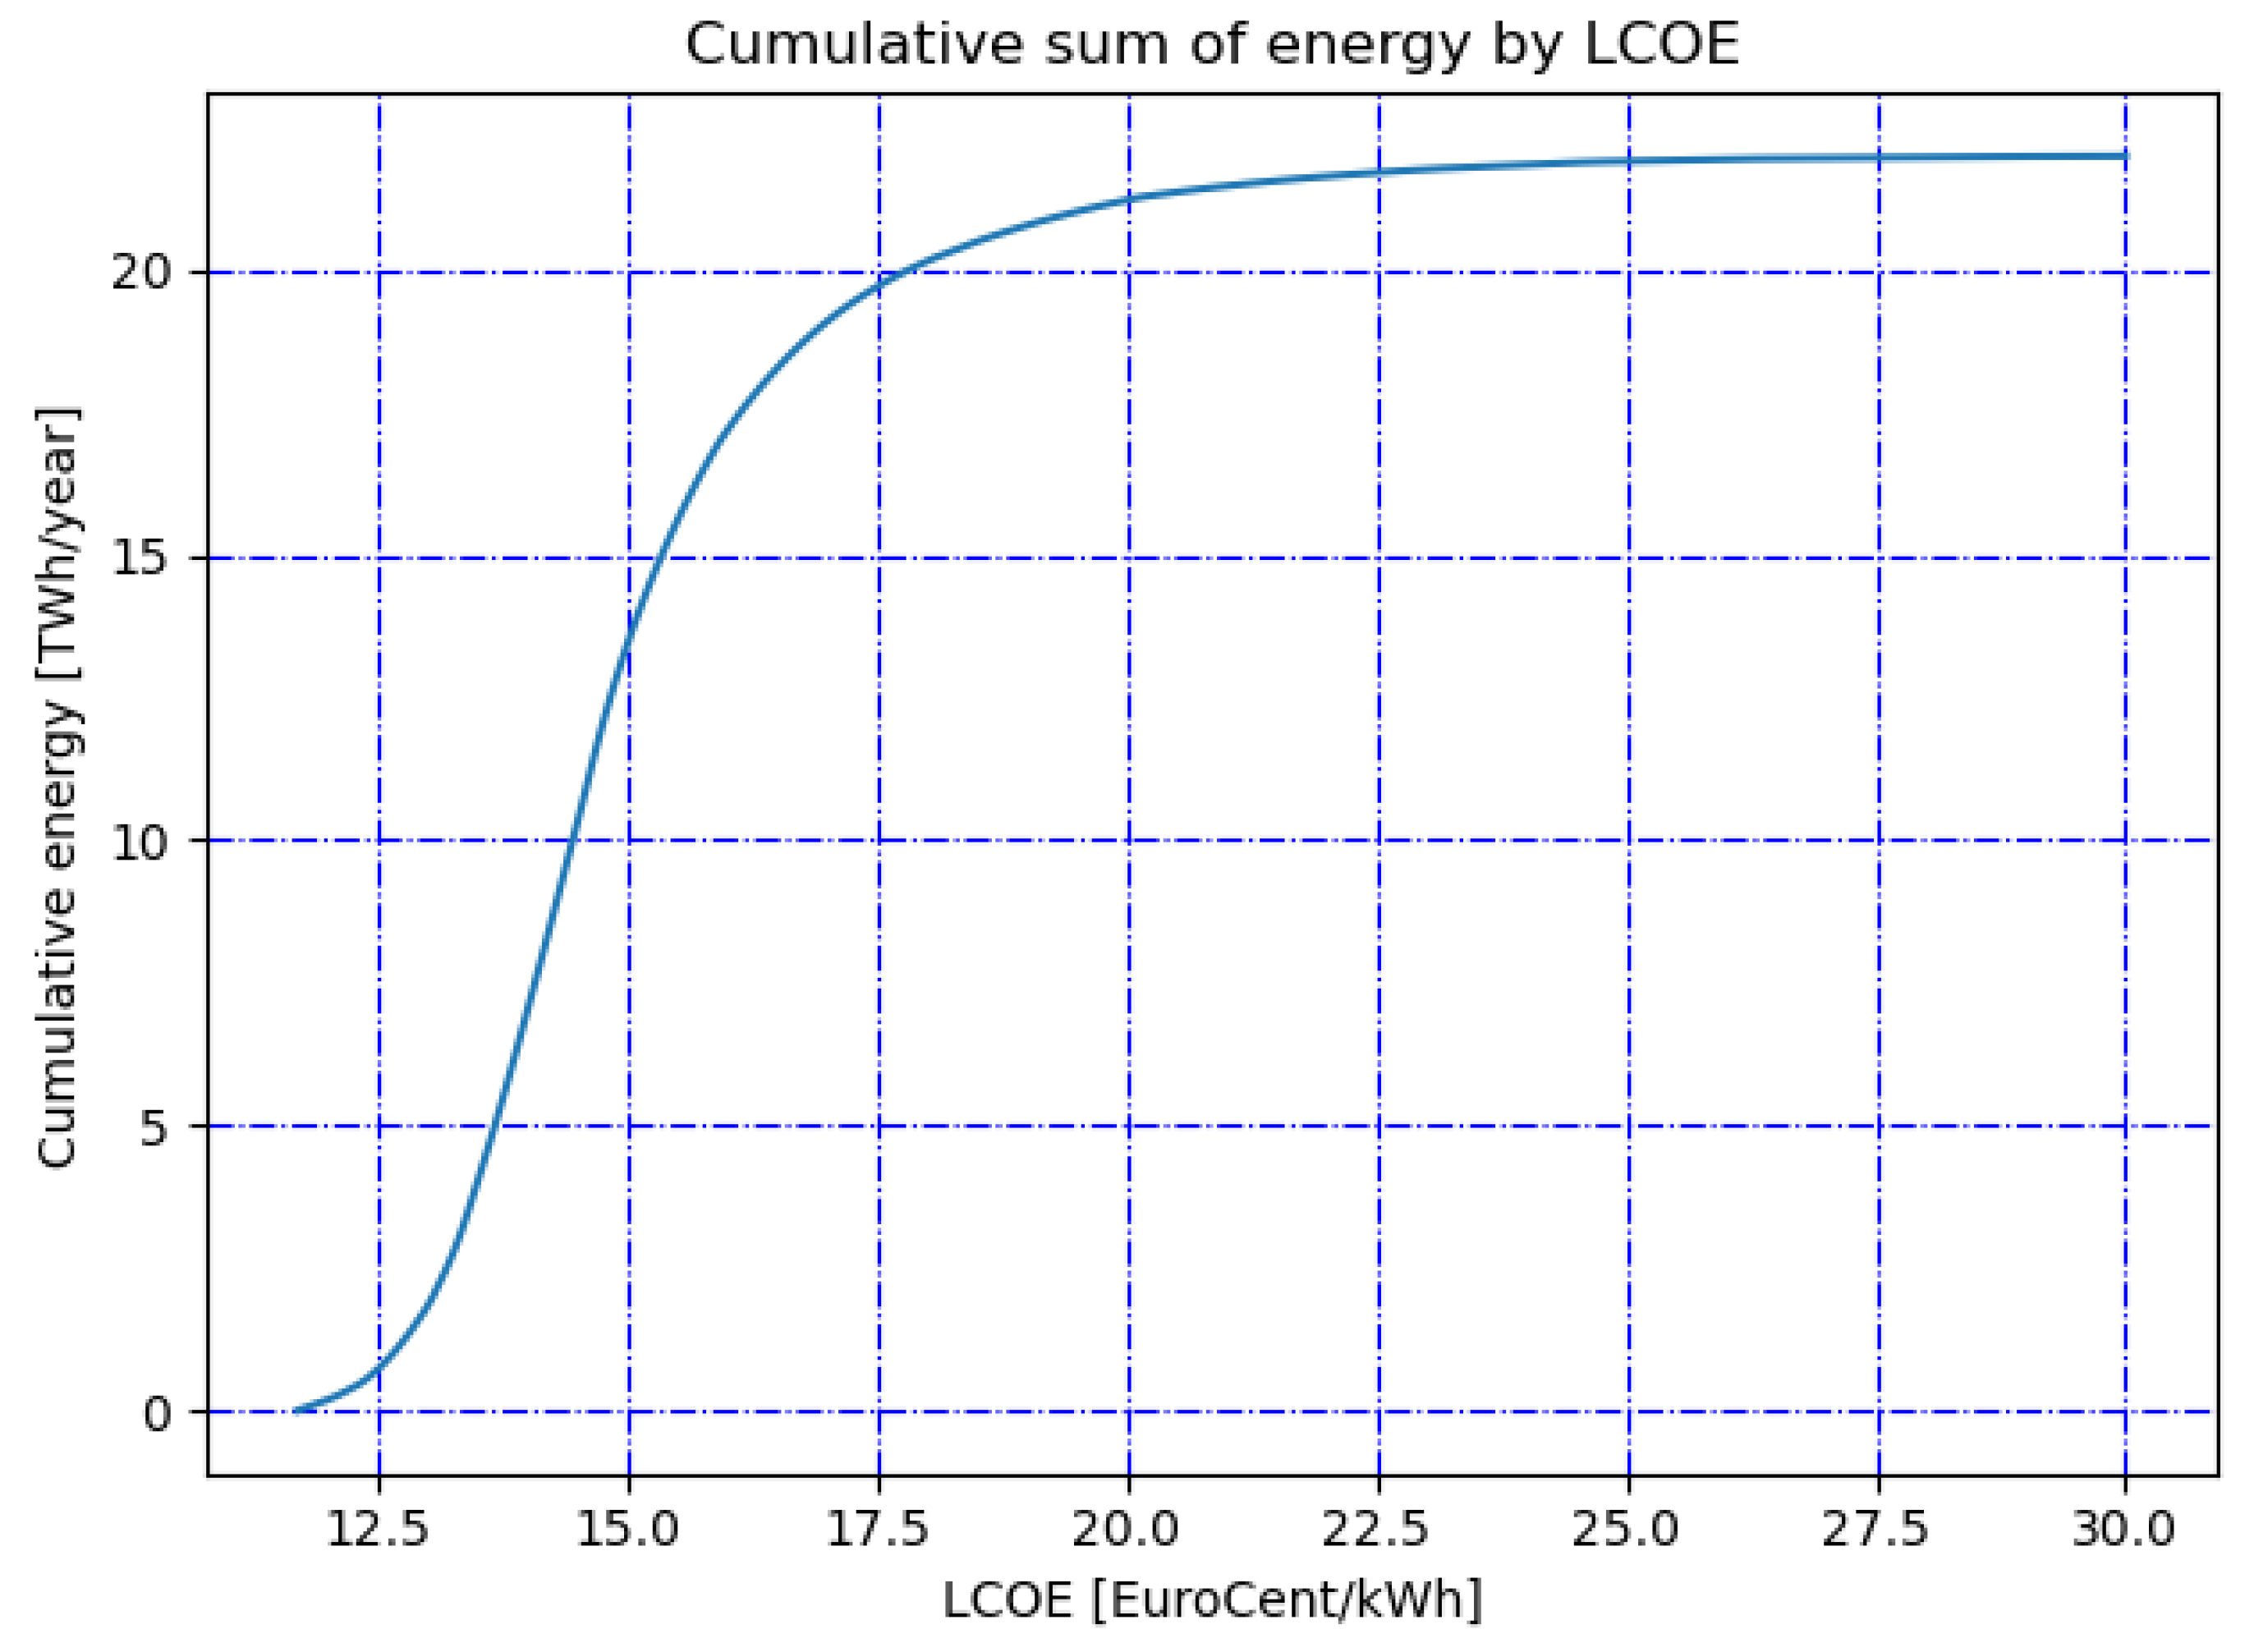
Figure 13 shows the total energy from rooftop PV as a function of the corresponding levelized cost of electricity, and shows that almost all of the available roof area could be exploited for an LCOE of 17.5 EuroCent/kWh.
In Italy, electricity prices in 2022 soared above 30 EuroCent per kWh, making photovoltaic system installation worthwhile even in the least productive locations [51]. Assuming a return to the situation prior to COVID and to quieter geopolitical circumstances, the average energy price from 2010 to 2019 was 9.45 EuroCent/kWh, well below our LCOE values. However, the LCOE values were calculated without taking into account the incentives (SuperBonus 110% or 50% tax deduction, preferential VAT, on-site exchange, -i.e., the sale of energy) thanks to which the installation would be worthwhile even with a return of energy prices to pre-2020 values.
Areas for the improvement of our estimate mainly concern the quality of the data available for analysis. The data used in the work were not particularly recent: the building blueprints, despite having been digitally published in 2017, were obtained from regional databases compiled between 1994 and 2000, and partially updated in 2006, while the digital surface model was based on LiDAR observations performed between 2008 and 2013. Therefore, there is a discrepancy between the data shown by the raster and the cadastral data (e.g., the raster of 2013 might show a building not yet registered in the blueprint dataset); the difference between the current situation (2022) and the one described by the data might not be negligible (entire neighbourhoods might be built in a decade). In terms of data accuracy, the digital surface model does not account for the presence of empty spaces; sometimes the building blueprints also include internal courtyards within the perimeter (e.g., see Figure 14); situations such as these are usually discarded due to the presence of vegetation that makes the presumed building coverage irregular. The available data do not yet cover the entire territory of Sardinia or even the entire set of buildings; the overall estimate was obtained by rescaling the calculation made on the covered area, but it is evident that a complete coverage would lead to fewer uncertainties.
6. Conclusions
In this paper, we presented a high-resolution rooftop photovoltaic potential estimation procedure based on GIS and satellite irradiance data, highly optimized to allow for calculation over large areas.
We applied the procedure to the case of the Sardinia region in Italy. This gave us an estimate of the geographic, technical, and economic potential for the entire region with a spatial resolution of 1 m.
The computation provided an estimate of photovoltaic potential on building roofs as a function of the cost of electricity, with an upper limit value of 22 TWh per year. This potential would abundantly cover the energy needs of the region, in particular those related to household consumption and for service activities directly associated with the buildings on which the panels could be installed. Energy is not power, however, and the need to instantly balance demand and generation of electric power by ensuring the balance of the distribution system is clearly left out of this analysis. This work focused on estimating geographic potential as a basis for further processing, and the technical and economic analysis is based on standard technologies. We, therefore, make our results available to the community in the hope that other researchers could further investigate aspects of economic potential in relation to the different PV technologies available, and in relation to a changing regulatory and economic framework. The procedure is replicable in other areas where the necessary data are available. Our research will continue with the development of artificial intelligence techniques for identifying suitable areas for panel installation from satellite images.
Author Contributions
Conceptualization, A.P. and L.M.; methodology, A.P. and L.M.; software, A.P.; validation, A.P. and L.M.; formal analysis, L.M.; investigation, A.P.; resources, A.P.; data curation, A.P.; writing—original draft preparation, A.P.; writing—review and editing, L.M.; visualization, A.P.; supervision, L.M.; project administration, L.M.; funding acquisition, L.M. All authors have read and agreed to the published version of the manuscript.
Funding
This research was funded by the Tessuto Digitale Metropolitano (TDM) project with funds provided by the Autonomous Region of Sardinia through Action 1.2.2 of the POR FESR Sardinia 2014–2020.
Institutional Review Board Statement
Not applicable.
Informed Consent Statement
Not applicable.
Data Availability Statement
The results presented in this paper are available upon request and are shown at http://s.crs4.it/JM (accessed on 13 November 2022).
Conflicts of Interest
The authors declare no conflict of interest.
Abbreviations
The following abbreviations are used in this manuscript:
| AOI | Angle of incidence |
| API | Application programming interface |
| CAPEX | Capital expenditure |
| DBGT | Geotopographic database |
| DHI | Diffuse horizontal irradiance |
| DNI | Direct normal irradiance |
| DSM | Digital surface model |
| GHI | Global horizontal irradiance |
| GIS | Geographic information system |
| LCOE | Levelized cost of electricity |
| LiDAR | Light detection and ranging |
| OPEX | Operating expense |
| POA | Plane of the array |
| PV | Photovoltaic |
| STC | Standard test conditions |
| TD | Tax deductions |
References
- European Commission. Directive 2009/28/EC of the European Parliament and of the Council of 23 April 2009 on the promotion of the use of energy from renewable sources and amending and subsequently repealing Directives 2001/77/EC and 2003/30/EC. Off. J. Eur. Union 2009, 5, 2009. [Google Scholar]
- European Commission. Directive (EU) 2018/2001 of the European Parliament and of the Council of 11 December 2018 on the promotion of the use of energy from renewable sources. Off. J. Eur. Union 2018, L328, 82. [Google Scholar]
- European Commission. Communication from the Commission to the European Parliament, the European Council, the European Economic and Social Committee and the Committee of the Regions—REPowerEU Plan. Available online: https://eur-lex.europa.eu/legal-content/EN/TXT/?uri=COM%3A2022%3A230%3AFIN (accessed on 13 November 2022).
- Italian Regulatory Authority for Energy, Networks and Environment (ARERA). Produzione Lorda di Energia Elettrica per Fonte. Available online: https://www.arera.it/it/dati/eem6.htm# (accessed on 13 November 2022).
- Ascione, F.; Bianco, N.; Mauro, G.M.; Napolitano, D.F.; Vanoli, G.P. Comprehensive analysis to drive the energy retrofit of a neighborhood by optimizing the solar energy exploitation–An Italian case study. J. Clean. Prod. 2021, 314, 127998. [Google Scholar] [CrossRef]
- Calise, F.; Cappiello, F.L.; Cimmino, L.; d’Accadia, M.D.; Vicidomini, M. Dynamic modelling and thermoeconomic analysis for the energy refurbishment of the Italian building sector: Case study for the “Superbonus 110%” funding strategy. Appl. Therm. Eng. 2022, 213, 118689. [Google Scholar] [CrossRef]
- Bódis, K.; Kougias, I.; Jäger-Waldau, A.; Taylor, N.; Szabó, S. A high-resolution geospatial assessment of the rooftop solar photovoltaic potential in the European Union. Renew. Sustain. Energy Rev. 2019, 114, 109309. [Google Scholar] [CrossRef]
- Jäger-Waldau, A. The untapped area potential for photovoltaic power in the European Union. Clean Technol. 2020, 2, 440–446. [Google Scholar] [CrossRef]
- Hoang, A.T.; Nguyen, X.P. Integrating renewable sources into energy system for smart city as a sagacious strategy towards clean and sustainable process. J. Clean. Prod. 2021, 305, 127161. [Google Scholar] [CrossRef]
- Backe, S.; Zwickl-Bernhard, S.; Schwabeneder, D.; Auer, H.; Korpås, M.; Tomasgard, A. Impact of energy communities on the European electricity and heating system decarbonization pathway: Comparing local and global flexibility responses. Appl. Energy 2022, 323, 119470. [Google Scholar] [CrossRef]
- Wierling, A.; Zeiss, J.P.; Lupi, V.; Candelise, C.; Sciullo, A.; Schwanitz, V.J. The contribution of energy communities to the upscaling of photovoltaics in Germany and Italy. Energies 2021, 14, 2258. [Google Scholar] [CrossRef]
- Komninos, N. Net Zero Energy Districts: Connected Intelligence for Carbon-Neutral Cities. Land 2022, 11, 210. [Google Scholar] [CrossRef]
- Fakhraian, E.; Forment, M.A.; Dalmau, F.V.; Nameni, A.; Guerrero, M.J.C. Determination of the urban rooftop photovoltaic potential: A state of the art. Energy Rep. 2021, 7, 176–185. [Google Scholar] [CrossRef]
- Fakhraian, E.; Alier, M.; Valls Dalmau, F.; Nameni, A.; Casañ Guerrero, M.J. The Urban Rooftop Photovoltaic Potential Determination. Sustainability 2021, 13, 7447. [Google Scholar] [CrossRef]
- Castellanos, S.; Sunter, D.A.; Kammen, D.M. Rooftop solar photovoltaic potential in cities: How scalable are assessment approaches? Environ. Res. Lett. 2017, 12, 125005. [Google Scholar] [CrossRef]
- Joshi, S.; Mittal, S.; Holloway, P.; Shukla, P.R.; Ó Gallachóir, B.; Glynn, J. High resolution global spatiotemporal assessment of rooftop solar photovoltaics potential for renewable electricity generation. Nat. Commun. 2021, 12, 5738. [Google Scholar] [CrossRef]
- Hołuj, A.; Ilba, M.; Lityński, P.; Majewski, K.; Semczuk, M.; Serafin, P. Photovoltaic Solar Energy from Urban Sprawl: Potential for Poland. Energies 2021, 14, 8576. [Google Scholar] [CrossRef]
- Bernasconi, D.; Guariso, G. Rooftop PV: Potential and Impacts in a Complex Territory. Energies 2021, 14, 3687. [Google Scholar] [CrossRef]
- Walch, A.; Castello, R.; Mohajeri, N.; Scartezzini, J.L. Big data mining for the estimation of hourly rooftop photovoltaic potential and its uncertainty. Appl. Energy 2020, 262, 114404. [Google Scholar] [CrossRef]
- Todeschi, V.; Mutani, G.; Baima, L.; Nigra, M.; Robiglio, M. Smart solutions for sustainable cities—The re-coding experience for harnessing the potential of urban rooftops. Appl. Sci. 2020, 10, 7112. [Google Scholar] [CrossRef]
- Borfecchia, F.; Caiaffa, E.; Pollino, M.; De Cecco, L.; Martini, S.; La Porta, L.; Marucci, A. Remote Sensing and GIS in planning photovoltaic potential of urban areas. Eur. J. Remote Sens. 2014, 47, 195–216. [Google Scholar] [CrossRef]
- Aslani, M.; Seipel, S. Automatic identification of utilizable rooftop areas in digital surface models for photovoltaics potential assessment. Appl. Energy 2022, 306, 118033. [Google Scholar] [CrossRef]
- Nguyen, H.T.; Pearce, J.M. Incorporating shading losses in solar photovoltaic potential assessment at the municipal scale. Sol. Energy 2012, 86, 1245–1260. [Google Scholar] [CrossRef] [Green Version]
- Montealegre, A.; García-Pérez, S.; Guillén-Lambea, S.; Monzón-Chavarrías, M.; Sierra-Pérez, J. GIS-based assessment for the potential of implementation of food-energy-water systems on building rooftops at the urban level. Sci. Total Environ. 2022, 803, 149963. [Google Scholar] [CrossRef] [PubMed]
- Koch, H.; Lechner, S.; Erdmann, S.; Hofmann, M. Assessing the Potential of Rooftop Photovoltaics by Processing High-Resolution Irradiation Data, as Applied to Giessen, Germany. Energies 2022, 15, 6991. [Google Scholar] [CrossRef]
- de Vries, T.N.; Bronkhorst, J.; Vermeer, M.; Donker, J.C.; Briels, S.A.; Ziar, H.; Zeman, M.; Isabella, O. A quick-scan method to assess photovoltaic rooftop potential based on aerial imagery and LiDAR. Sol. Energy 2020, 209, 96–107. [Google Scholar] [CrossRef]
- Krapf, S.; Kemmerzell, N.; Khawaja Haseeb Uddin, S.; Hack Vázquez, M.; Netzler, F.; Lienkamp, M. Towards scalable economic photovoltaic potential analysis using aerial images and deep learning. Energies 2021, 14, 3800. [Google Scholar] [CrossRef]
- Fuster-Palop, E.; Prades-Gil, C.; Masip, X.; Viana-Fons, J.D.; Payá, J. Innovative regression-based methodology to assess the techno-economic performance of photovoltaic installations in urban areas. Renew. Sustain. Energy Rev. 2021, 149, 111357. [Google Scholar] [CrossRef]
- Sun, T.; Shan, M.; Rong, X.; Yang, X. Estimating the spatial distribution of solar photovoltaic power generation potential on different types of rural rooftops using a deep learning network applied to satellite images. Appl. Energy 2022, 315, 119025. [Google Scholar] [CrossRef]
- Robinson, D. Urban morphology and indicators of radiation availability. Sol. Energy 2006, 80, 1643–1648. [Google Scholar] [CrossRef]
- Rodríguez, L.R.; Duminil, E.; Ramos, J.S.; Eicker, U. Assessment of the photovoltaic potential at urban level based on 3D city models: A case study and new methodological approach. Sol. Energy 2017, 146, 264–275. [Google Scholar] [CrossRef]
- Pinna, A.; Massidda, L. A procedure for complete census estimation of rooftop photovoltaic potential in urban areas. Smart Cities 2020, 3, 873–893. [Google Scholar] [CrossRef]
- Bódis, K.; Kougias, I.; Taylor, N.; Jäger-Waldau, A. Solar photovoltaic electricity generation: A lifeline for the European coal regions in transition. Sustainability 2019, 11, 3703. [Google Scholar] [CrossRef] [Green Version]
- Huld, T.; Müller, R.; Gambardella, A. A new solar radiation database for estimating PV performance in Europe and Africa. Sol. Energy 2012, 86, 1803–1815. [Google Scholar] [CrossRef]
- Huld, T.; Friesen, G.; Skoczek, A.; Kenny, R.P.; Sample, T.; Field, M.; Dunlop, E.D. A power-rating model for crystalline silicon PV modules. Sol. Energy Mater. Sol. Cells 2011, 95, 3359–3369. [Google Scholar] [CrossRef]
- Branker, K.; Pathak, M.; Pearce, J.M. A review of solar photovoltaic levelized cost of electricity. Renew. Sustain. Energy Rev. 2011, 15, 4470–4482. [Google Scholar] [CrossRef] [Green Version]
- Gassar, A.A.A.; Cha, S.H. Review of geographic information systems-based rooftop solar photovoltaic potential estimation approaches at urban scales. Appl. Energy 2021, 291, 116817. [Google Scholar] [CrossRef]
- Regione Autonoma della Sardegna. Database Geotopografico della Sardegna. Available online: https://www.sardegnageoportale.it/areetematiche/databasegeotopografico/ (accessed on 13 November 2022).
- Regione Autonoma della Sardegna. Modelli Digitali del Terreno e delle Superfici della Sardegna. Available online: https://www.sardegnageoportale.it/areetematiche/modellidigitalidielevazione/ (accessed on 13 November 2022).
- Pfeifroth, U.; Trentmann, J.; Kothe, S.; Hollmann, R.; Werscheck, M. EUMETSAT Satellite Application Facility on Climate Monitoring; Validation Report: Meteosat Solar Surface Radiation and Effective Cloud Albedo Climate Data Record SARAH-2. 1 Climate Data Records; EUMETSAT: Darmstadt, Germany, 2019. [Google Scholar]
- Amillo, A.M.G.; Taylor, N.; Fernandez, A.M.M.; Dunlop, E.D.; Mavrogiorgios, P.; Fahl, F.; Arcaro, G.; Pinedo, I. Adapting PVGIS to trends in climate, technology and user needs. In Proceedings of the 38th European Photovoltaic Solar Energy Conference and Exhibition, Online, 6–10 September 2021. [Google Scholar]
- Horn, B.K. Hill shading and the reflectance map. Proc. IEEE 1981, 69, 14–47. [Google Scholar] [CrossRef] [Green Version]
- GDAL/OGR Contributors. GDAL/OGR Geospatial Data Abstraction Software Library; Open Source Geospatial Foundation: Chicago, IL, USA, 2022. [Google Scholar] [CrossRef]
- Bresenham, J.E. Algorithm for computer control of a digital plotter. IBM Syst. J. 1965, 4, 25–30. [Google Scholar] [CrossRef]
- Loutzenhiser, P.; Manz, H.; Felsmann, C.; Strachan, P.; Frank, T.; Maxwell, G. Empirical validation of models to compute solar irradiance on inclined surfaces for building energy simulation. Sol. Energy 2007, 81, 254–267. [Google Scholar] [CrossRef] [Green Version]
- Faiman, D. Assessing the outdoor operating temperature of photovoltaic modules. Prog. Photovoltaics Res. Appl. 2008, 16, 307–315. [Google Scholar] [CrossRef]
- Koehl, M.; Heck, M.; Wiesmeier, S.; Wirth, J. Modeling of the nominal operating cell temperature based on outdoor weathering. Sol. Energy Mater. Sol. Cells 2011, 95, 1638–1646. [Google Scholar] [CrossRef]
- Huld, T.; Jäger Waldau, A.; Ossenbrink, H.; Szabo, S.; Dunlop, E.; Taylor, N. Cost Maps for Unsubsidised Photovoltaic Electricity; European Commission: Brussels, Belgium, 2014. [Google Scholar]
- Lazzeroni, P.; Moretti, F.; Stirano, F. Economic potential of PV for Italian residential end-users. Energy 2020, 200, 117508. [Google Scholar] [CrossRef]
- Terna. Lo Storico dei Dati Statistici Sull’energia Elettrica e l’Ultimo Bilancio Elettrico. Available online: https://www.terna.it/it/sistema-elettrico/statistiche/pubblicazioni-statistiche (accessed on 4 November 2022).
- Italian Regulatory Authority for Energy, Networks and Environment (ARERA). Andamento del Prezzo dell’Energia Elettrica per il Consumatore Domestico Tipo in Maggior Tutela. Available online: https://www.arera.it/it/dati/eep35.htm (accessed on 13 November 2022).
Figure 1.
(a) Distribution of buildings (in black) in Sardinia and (b,c) building blueprints in the Municipality of Cagliari, the administrative center and largest city in Sardinia.
Figure 1.
(a) Distribution of buildings (in black) in Sardinia and (b,c) building blueprints in the Municipality of Cagliari, the administrative center and largest city in Sardinia.

Figure 2.
(a) Coverage of the 1 m resolution DSM (in black) over the territory of Sardinia and (b,c) a clipping of the DSM within the Municipality of Cagliari.
Figure 2.
(a) Coverage of the 1 m resolution DSM (in black) over the territory of Sardinia and (b,c) a clipping of the DSM within the Municipality of Cagliari.

Figure 3.
(a) Percentage of municipality area and (b) percentage of rooftop surface covered by the DSM.
Figure 3.
(a) Percentage of municipality area and (b) percentage of rooftop surface covered by the DSM.

Figure 4.
The island of Sardinia represented by the territorial boundaries of its municipalities (in black), (left) superimposed on the grid of sectors of size 0.05° (in blue) of the PVGIS-SARAH2 database and (right) by the average annual global irradiance on a 1 m2 surface oriented to the south and inclined by 20°.

Figure 5.
Flowchart representing the workflow followed to obtain the photovoltaic potential of Sardinia. Input data are shown in the yellow boxes, derived data are framed in pink and light-blue boxes, data processing steps were placed in green rounded rectangles, and the workflow results are outlined by red frames.

Figure 6.
(a) Maps of aspect and (b) slope values computed for the building rooftops within the Municipality of Cagliari.
Figure 6.
(a) Maps of aspect and (b) slope values computed for the building rooftops within the Municipality of Cagliari.

Figure 7.
Cumulative sum of rooftop surface, sorted by increasing tilt angle.

Figure 8.
Maps showing, for the rooftop surfaces within the Municipality of Cagliari, (a) the yearly average values per m2 of GHI, (b) irradiation on the POA, (c) and photovoltaic potential; (d) average LCOE.
Figure 8.
Maps showing, for the rooftop surfaces within the Municipality of Cagliari, (a) the yearly average values per m2 of GHI, (b) irradiation on the POA, (c) and photovoltaic potential; (d) average LCOE.

Figure 9.
(a) Total yearly photovoltaic potential and (b) average yearly photovoltaic potential per resident for the municipalities in Sardinia.
Figure 9.
(a) Total yearly photovoltaic potential and (b) average yearly photovoltaic potential per resident for the municipalities in Sardinia.

Figure 10.
(a) Average yearly GHI per m2, (b) irradiation on the POA per m2, (c) photovoltaic potential per m2 and (d) average LCOE for the municipalities in Sardinia.
Figure 10.
(a) Average yearly GHI per m2, (b) irradiation on the POA per m2, (c) photovoltaic potential per m2 and (d) average LCOE for the municipalities in Sardinia.

Figure 11.
Average annual energy production per m2 based on the orientation and inclination of photovoltaic panels in Sardinia.
Figure 11.
Average annual energy production per m2 based on the orientation and inclination of photovoltaic panels in Sardinia.

Figure 12.
Distribution of the levelized cost of electricity for all the rooftop surfaces in Sardinia.
Figure 12.
Distribution of the levelized cost of electricity for all the rooftop surfaces in Sardinia.

Figure 13.
Cumulative sum of energy for all the rooftop surfaces in Sardinia as a function of the levelized cost of electricity.
Figure 13.
Cumulative sum of energy for all the rooftop surfaces in Sardinia as a function of the levelized cost of electricity.

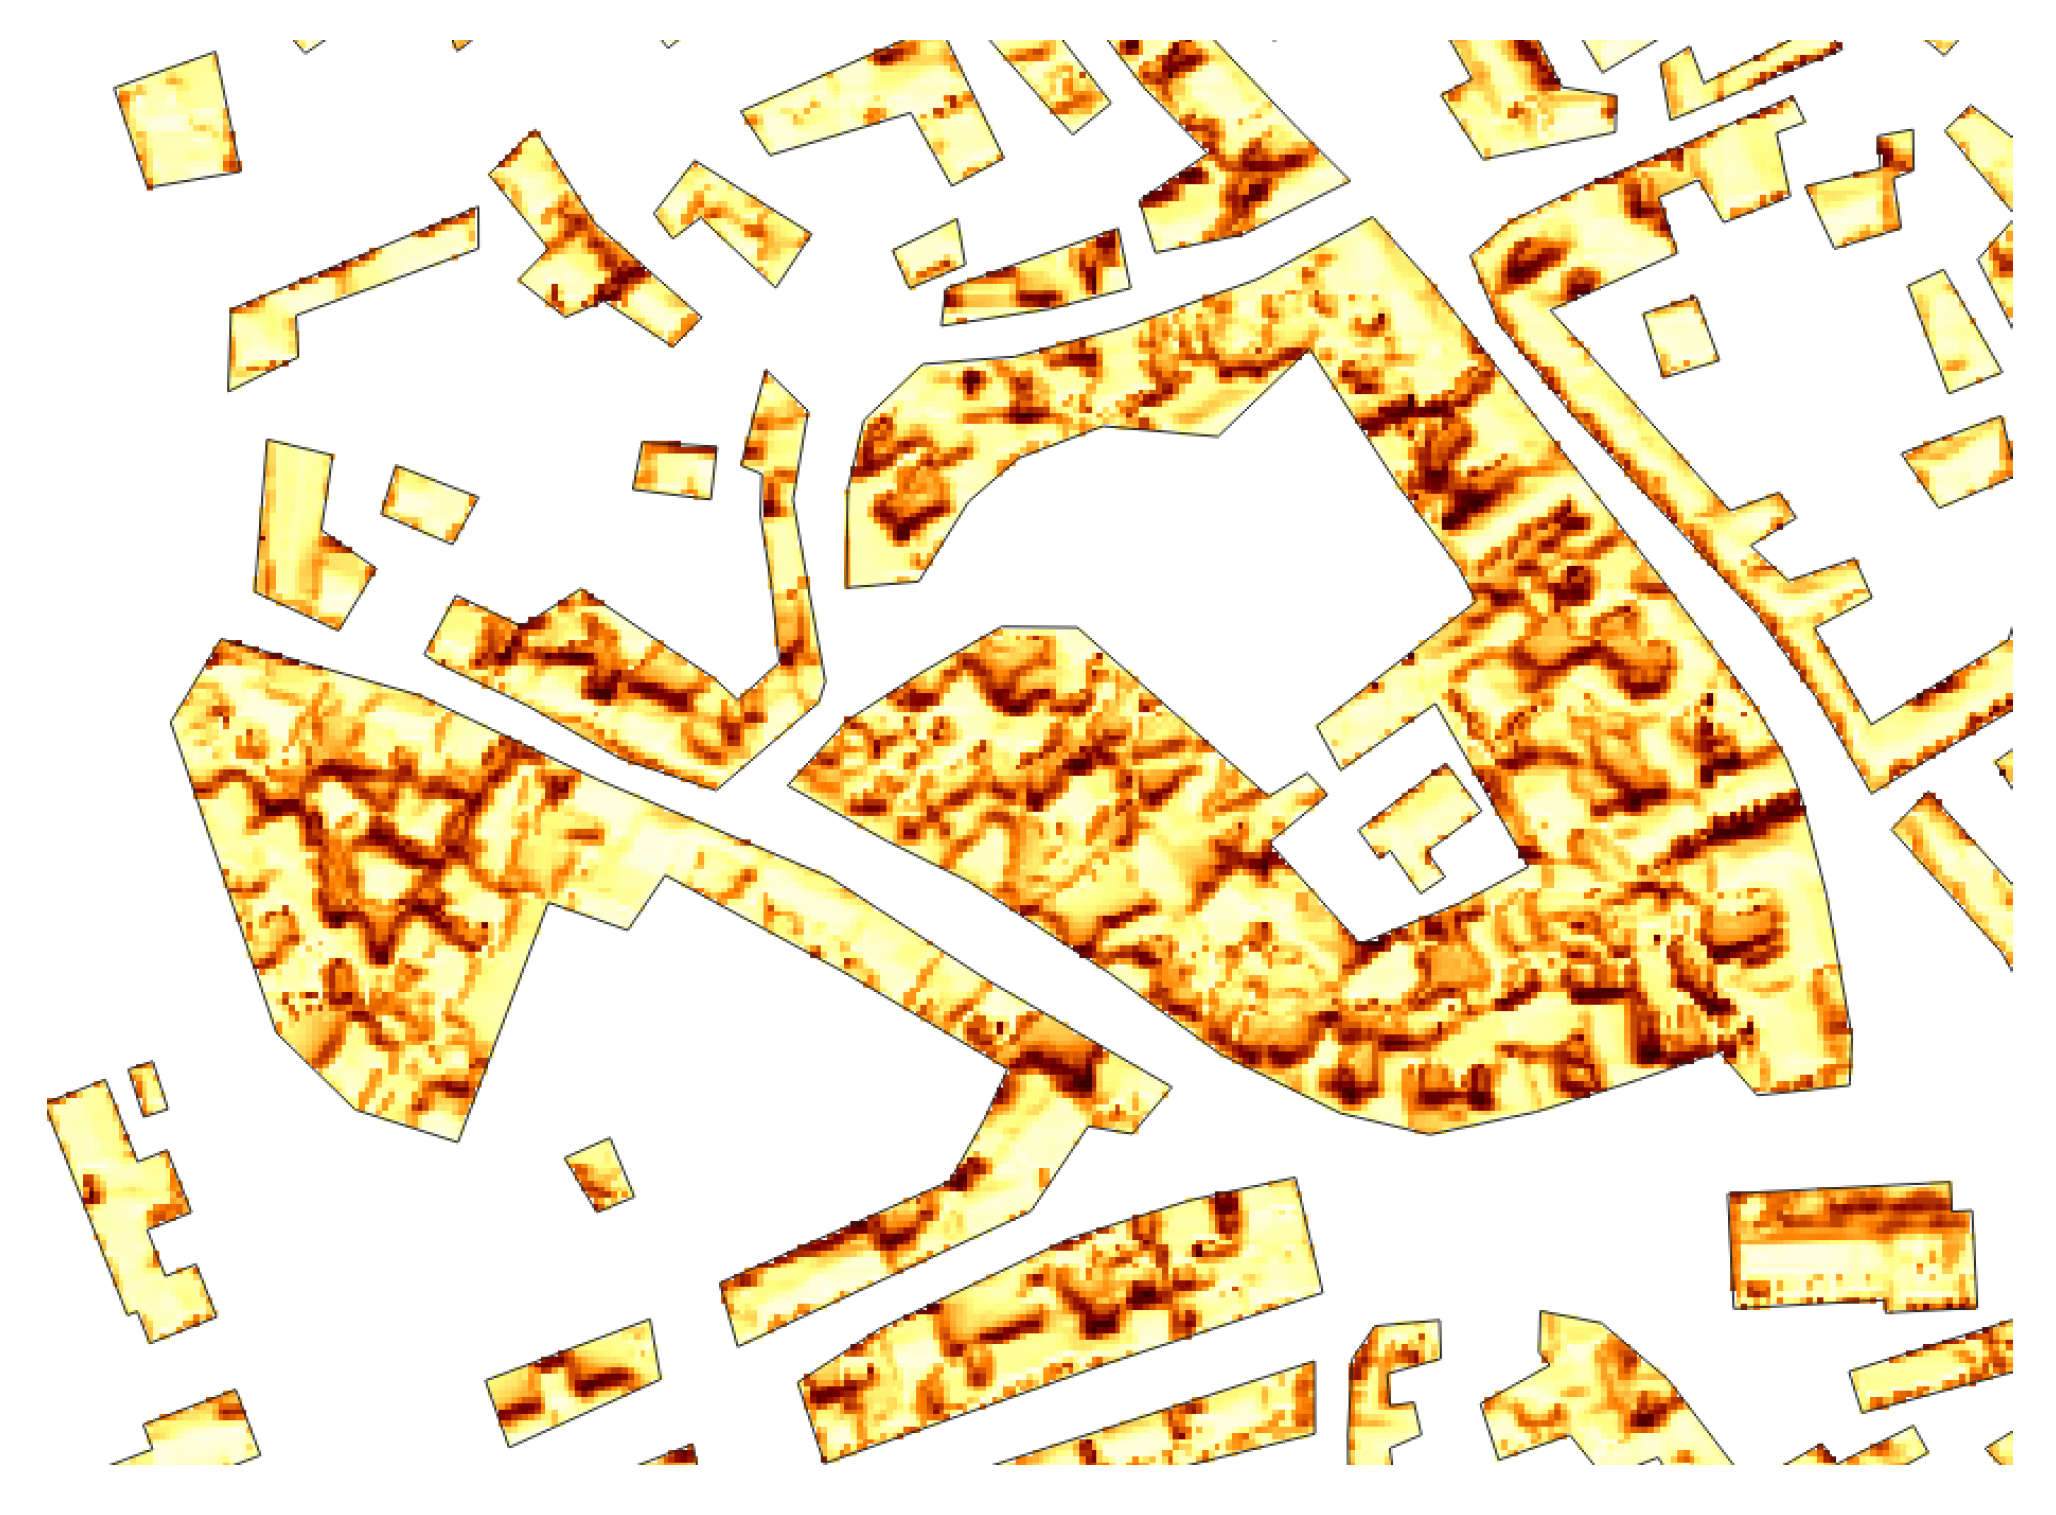
Figure 14.
Portion of the irradiation map in which the perimeter of some buildings does not follow the actual perimeter of the buildings themselves, but also erroneously includes the inner courtyards, thus misleading the algorithm that considers vegetation, for example, as an irregular cover. Surfaces with a slope exceeding and not belonging to contiguous areas of at least 30 m2 are, in any case, not considered in the calculation of municipal and regional photovoltaic potential.


Table 1.
Summary table of annual photovoltaic potential by number of municipalities.
| PV Potential (GWh) | Number of Municipalities |
|---|---|
| 257 | |
| 68 | |
| 35 | |
| 11 | |
| 4 | |
| 2 |
Table 2.
Electricity consumption in the domestic and services sectors, and photovoltaic potential for the 5 provinces of Sardinia. The percentage indicates the fraction of eligible rooftops that, if equipped with a photovoltaic system and accumulators, would cover the needs of the domestic and services sectors.
| Province | Energy Demand | PV Potential | % of Rooftop Surface |
|---|---|---|---|
| Cagliari | 1248 GWh | 3.80 TWh | 32.84% |
| Nuoro | 482 GWh | 2.95 TWh | 16.34% |
| Oristano | 374 GWh | 3.15 TWh | 11.87% |
| Sassari | 1514 GWh | 6.65 TWh | 22.77% |
| Sud Sardegna | 810 GWh | 5.49 TWh | 14.75% |
| Sardinia | 4.43 TWh | 22.04 TWh | 20.10% |
Disclaimer/Publisher’s Note: The statements, opinions and data contained in all publications are solely those of the individual author(s) and contributor(s) and not of MDPI and/or the editor(s). MDPI and/or the editor(s) disclaim responsibility for any injury to people or property resulting from any ideas, methods, instructions or products referred to in the content. |
© 2022 by the authors. Licensee MDPI, Basel, Switzerland. This article is an open access article distributed under the terms and conditions of the Creative Commons Attribution (CC BY) license (https://creativecommons.org/licenses/by/4.0/).
Share and Cite
MDPI and ACS Style
Pinna, A.; Massidda, L. A Complete and High-Resolution Estimate of Sardinia’s Rooftop Photovoltaic Potential. Appl. Sci. 2023, 13, 7. https://doi.org/10.3390/app13010007
AMA Style
Pinna A, Massidda L. A Complete and High-Resolution Estimate of Sardinia’s Rooftop Photovoltaic Potential. Applied Sciences. 2023; 13(1):7. https://doi.org/10.3390/app13010007
Chicago/Turabian StylePinna, Andrea, and Luca Massidda. 2023. "A Complete and High-Resolution Estimate of Sardinia’s Rooftop Photovoltaic Potential" Applied Sciences 13, no. 1: 7. https://doi.org/10.3390/app13010007
Note that from the first issue of 2016, this journal uses article numbers instead of page numbers. See further details here.