Article

Machine Learning in Bioequivalence: Towards Identifying an Appropriate Measure of Absorption Rate

by
Vangelis D. Karalis
1,2
1
Department of Pharmacy, School of Health Sciences, National and Kapodistrian University of Athens, 15784 Athens, Greece
2
Institute of Applied and Computational Mathematics, Foundation for Research and Technology Hellas (FORTH), 70013 Heraklion, Greece
Appl. Sci. 2023, 13(1), 418; https://doi.org/10.3390/app13010418
Submission received: 28 November 2022 / Revised: 16 December 2022 / Accepted: 24 December 2022 / Published: 28 December 2022
(This article belongs to the Special Issue New Trends in Biosciences III)

Abstract

:
In this study, the modern tool of machine learning is used to address an old problem from a new perspective. Traditionally, the scientific basis for determining bioequivalence is based on a pharmacokinetic comparison, specifically the rate and extent of absorption between two products. Even though it is generally agreed that the peak plasma concentration (Cmax) should be used to measure the rate of absorption, several studies have raised concerns. Thus, alternative pharmacokinetic metrics have been proposed to address Cmax shortcomings. The aim of this study is to utilize unsupervised (principal component analysis) and supervised (random forest) machine learning algorithms to uncover the relationships among the pharmacokinetic parameters and identify the most suitable metric for absorption rate. One actual and three simulated donepezil bioequivalence datasets were utilized. For the needs of this study, a population pharmacokinetic model of donepezil was also developed and further used for the simulation of BE datasets with different absorption kinetics. Among the pharmacokinetic metrics explored, the newly proposed Cmax/Tmax ratio is also investigated. The latter was found to better reflect the absorption rate, regardless of the kinetic properties of absorption. This is one of the first studies utilizing machine learning in the field of bioequivalence.

1. Introduction

The goal of bioequivalence (BE) testing is to determine the in vivo “equivalence” of two drug products containing the same active moiety, namely the test (T) and the innovator’s formulation of the same active substance known as the reference (R) product [1,2]. In turn, showing bioequivalence is needed to make sure that the therapeutic effects of the two products under consideration are the same. The idea behind bioequivalence is that a product’s therapeutic profile is a function of the concentration of the active ingredient in the effect site, which relies on the concentration of drug in the general circulation. Thus, two drugs (T and R) are termed bioequivalent if their time-concentration profiles are similar enough to assure comparable clinical performance [3]. Formally, a T product is considered bioequivalent to the original R product if it has the same active ingredient and, when taken at the same molar dose, there are no significant differences in the rate and amount of absorption compared to the R formulation [1,2]. To standardize and clarify the BE assessment procedure, regulatory health agencies around the world have issued many guidelines with a focus on pharmacokinetic (PK) issues, such as the type of PK parameters to be estimated, statistical analysis, and the selection of the appropriate clinical design that will allow the reliable estimation of the PK parameters [4].
In the case of immediate-release formulations, it is now widely accepted that the rate of absorption should be assessed by the peak plasma concentration (Cmax), whereas the extent of absorption is expressed by the area under the time-concentration curve (AUC) from time zero to the last sampling point [1,2]. Other PK metrics are also utilized to provide further information. These include the area under the plasma time-concentration curve extrapolated to infinity (AUCinf), the time (Tmax) at which Cmax occurs, and the time-concentration curve’s terminal slope (lambda). Other PK characteristics, such as the highest and lowest drug concentrations at steady state, the AUC at each interval of administration, and the peak-to-trough fluctuation, are used for modified release products [4,5,6,7,8,9,10].
Even though Cmax is routinely used in BE assessment worldwide, it has been questioned as a metric that expresses the extent of absorption in addition to the rate of absorption [6,11,12]. In this vein, several studies [13,14,15,16,17] have revealed similar problems concerning the use of Cmax as a parameter of absorption rate. Other pharmacokinetic metrics, such as the Cmax/AUC ratio, Tmax, and partial AUCs, have been proposed to address some of the shortcomings of Cmax [12,14,18]. However, even though much work has been done towards the statistical assessment (e.g., scaled bioequivalence limits) and the clinical designs (e.g., replicate, two-stage adaptive), the problematic Cmax is still used, and the inherent problems that it carries seem to have been neglected. This means that despite the fact that in BE assessment there is a detailed and carefully specified framework, the rate of absorption is not actually evaluated.
The use of machine learning (ML) approaches, a subfield of artificial intelligence, is a useful tool for addressing this question [19,20]. ML techniques enable data to be trained, followed by statistical analysis to provide values that fall inside a particular range. ML enables the creation of models from sample data in order to automate decision-making processes based on data inputs. ML tasks are often divided into broad categories based on how the system learns or receives feedback on what it learns. The two most common ML methods are “supervised learning,” in which algorithms are taught using labeled input and output data, and “unsupervised learning,” in which the algorithm is not given labeled data and must identify structure in the input data [19,20].
Despite the fact that the limitations of Cmax as an absorption rate parameter have been recognized since its inception, Cmax has been used in BE studies for more than 30 years. The aim of this study is to use the modern tool of machine learning in order to address, from a new perspective, the old problem of setting the most appropriate rate of absorption for use in BE assessment. Two machine learning algorithms (principal component analysis and random forest) are utilized to explore the relationships among the PK parameters and to identify the most suitable metric for absorption rate. Moreover, among the PK metrics evaluated, a novel metric, the Cmax/Tmax ratio, is introduced and explored for its utility in describing absorption rate alongside the other measurements.
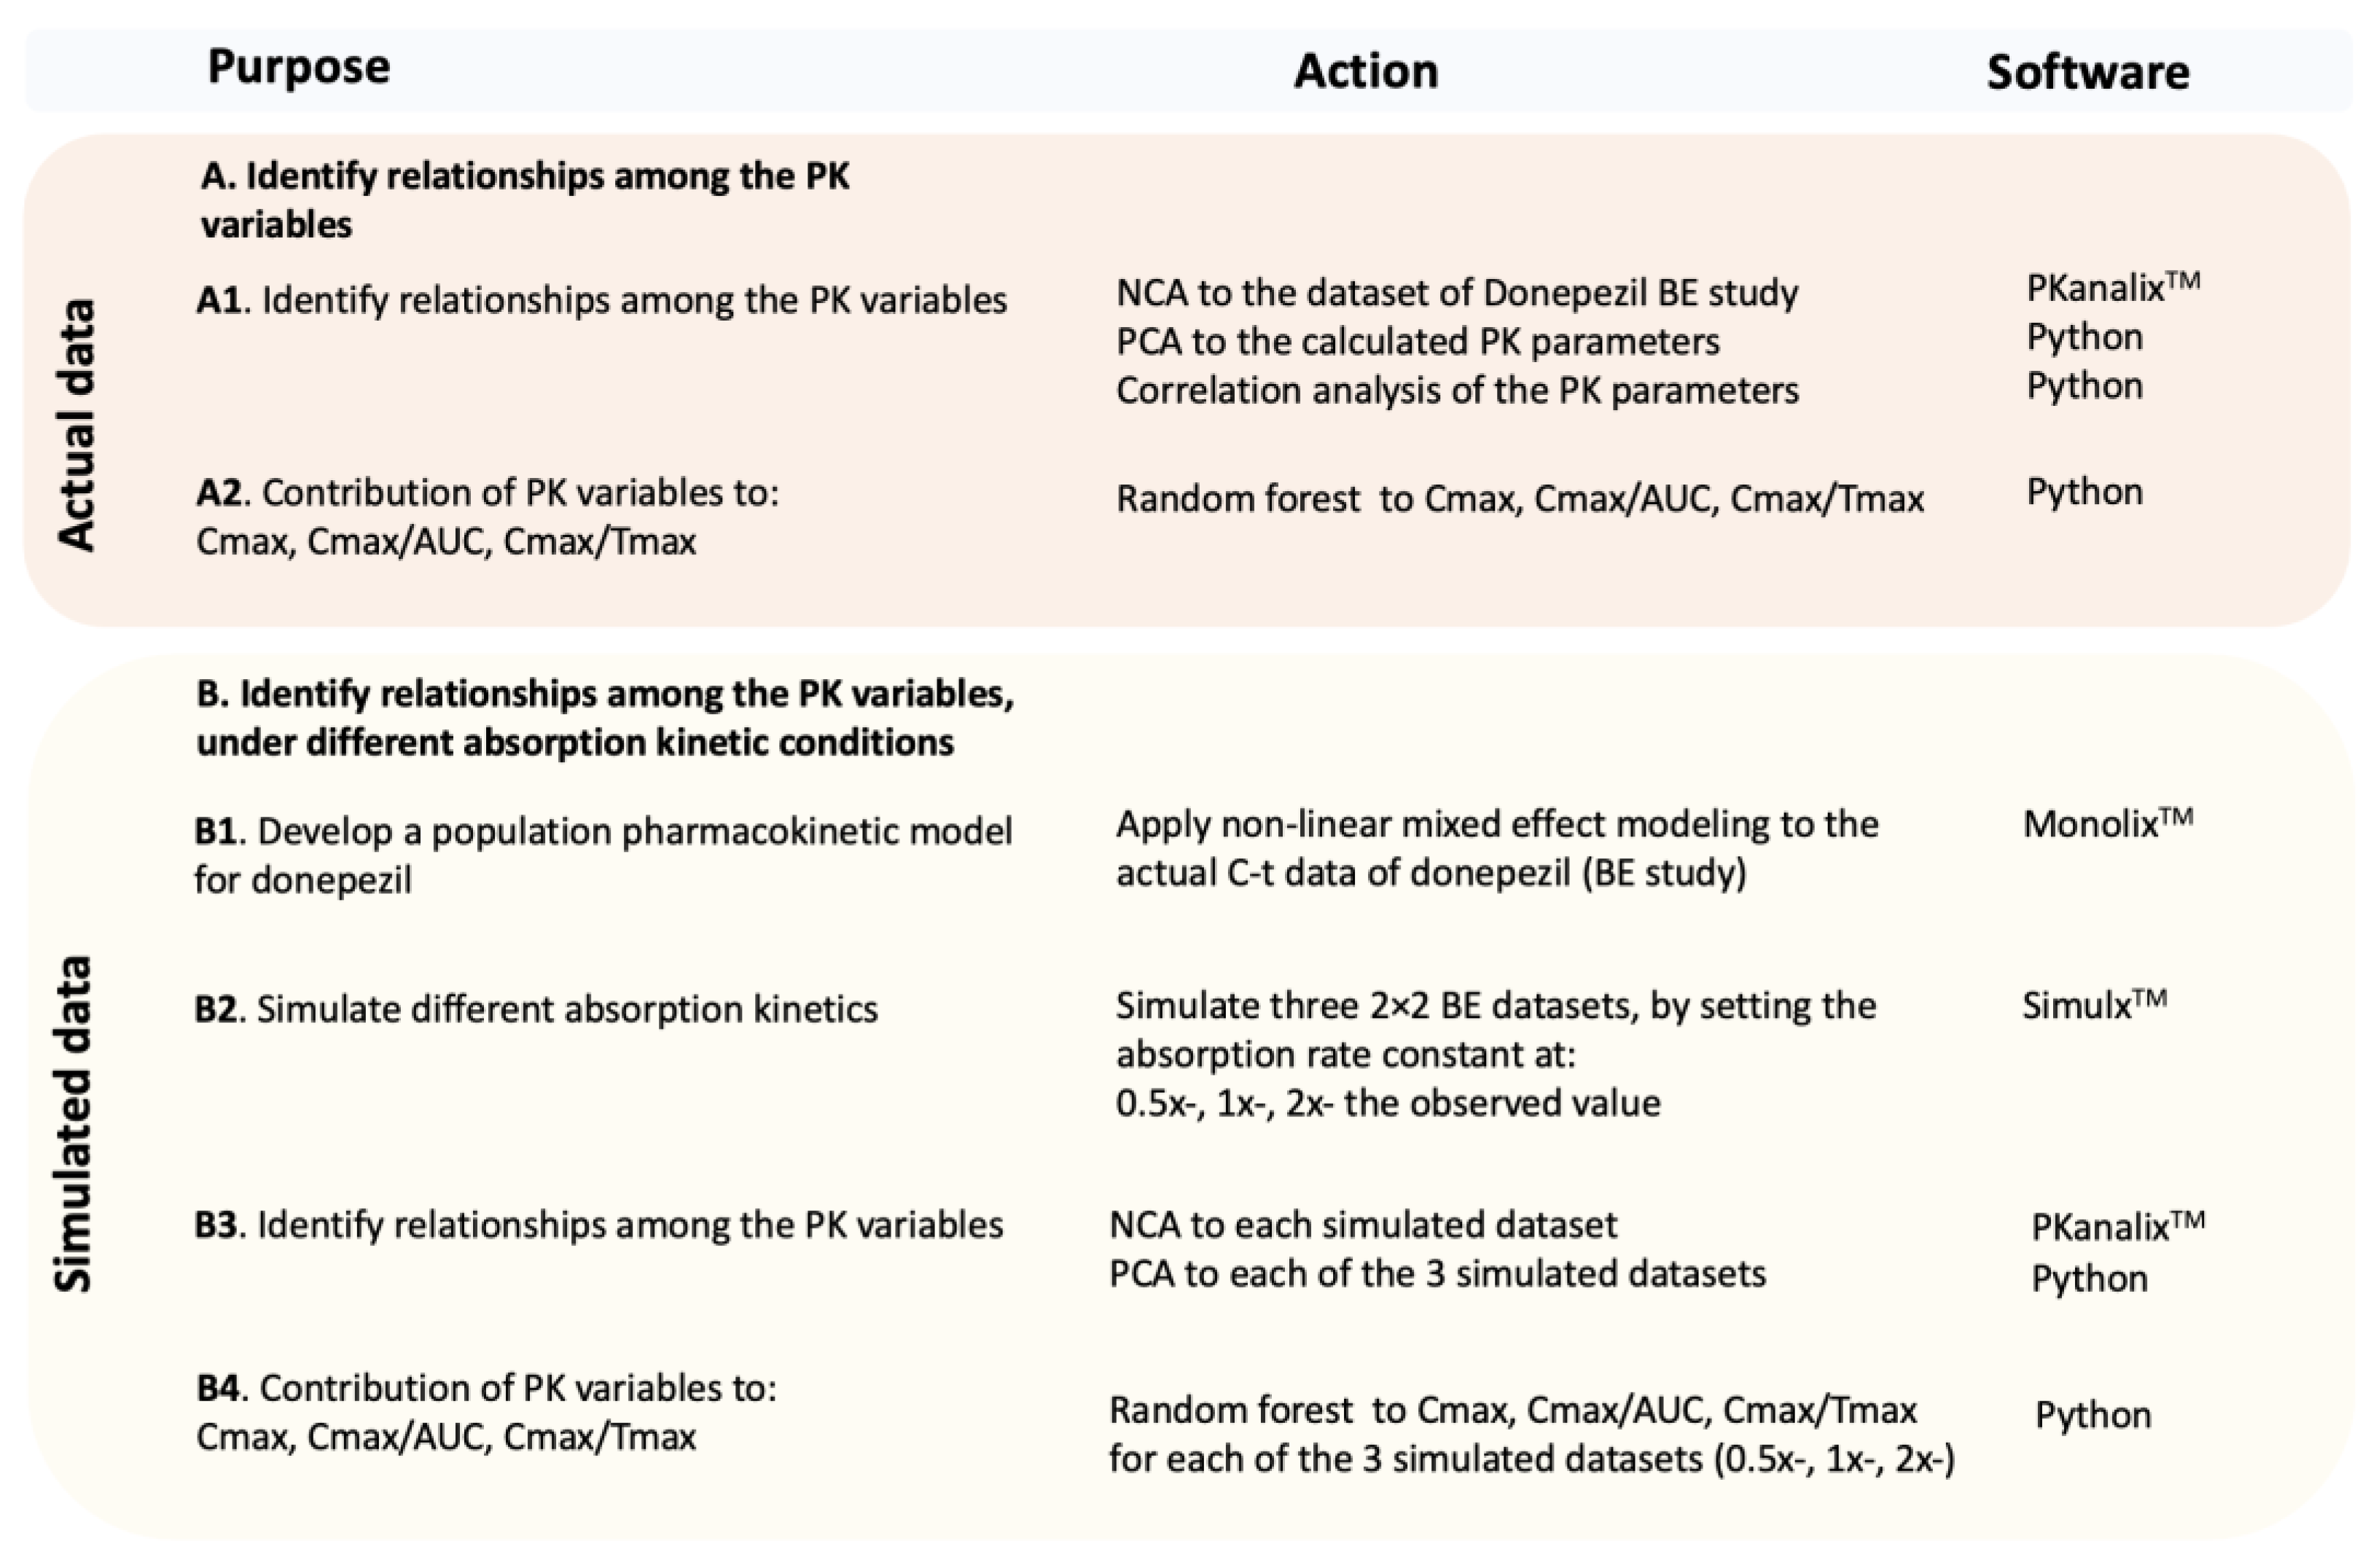
In order to accomplish this task, the computation approach included three steps: (a) First, the two ML algorithms are applied to the actual bioequivalence dataset of donepezil. To validate the findings obtained in the previous step and to address additional questions, simulated bioequivalence datasets were generated. (b) Since a population pharmacokinetic model would be necessary for the simulations, non-linear mixed effect modeling was applied to the actual concentration-time (C-t) data of donepezil. (c) Simulated BE datasets were then generated for three different types of absorption kinetics (slow, intermediate, and fast). (d) Machine learning was applied again to the simulated data.

2. Materials and Methods

2.1. Strategy of the Analysis

In this study, a two-step procedure is used where the ML algorithms are applied to actual and simulated BE data. Figure 1 shows an outline of the strategy that was used in order to address to the questions posed in this study, namely to identify how the PK parameters relate to each other and find the best possible metric for absorption rate.
Initially, from the actual concentration (C) and time (t) data of the donepezil BE study, pharmacokinetic parameters were estimated using the classic non-compartmental (NCA) approach (Figure 1). Then, principal component analysis (PCA) was applied to the previously calculated PK data. Afterwards, correlation analysis was used to explore the bivariate relationships in the original scale of the PK variables. In order to uncover the contribution of PK characteristics into each possible absorption rate metric (Cmax, Cmax/AUC, and Cmax/Tmax), the second ML technique, random forest (RF), was applied.
Aiming to explore more conditions with faster or slower absorption rates and identify the performance of PK metrics, further simulations were performed (Figure 1). To fulfill this task, the first step was to develop a PK model to describe the kinetics of donepezil. Non-linear mixed effect modeling (NLME) was employed on the actual C-t data, and a population PK model for donepezil was developed. In a subsequent step, using the population estimates (and all variabilities calculated from the NLME analysis), three scenarios were simulated: (a) slower absorption by adjusting the absorption rate constant (Ka) to be half of the original (0.5x-), (b) equal to the original Ka (i.e., 1x-), and (c) faster absorption where Ka was set to be twice the original (2x-). Thus, three BE datasets of donepezil were simulated, and the two ML techniques (PCA and RF) were re-applied. The latter allows detecting the relationships among the PK variables and the contribution of each one to another, under different absorption rates. In other words, it was an effort to isolate the impact of absorption rate and elaborate on it.

2.2. Bioequivalence Data-Noncompartmental Analysis

Donepezil is a widely used drug for symptomatic relief of Alzheimer’s disease. The actual C-t data used in this study were obtained from a two-sequence, two-period, crossover BE study in 26 healthy volunteers who received a single dose of donepezil 10 mg tablets (Verisfield SA) and donepezil (Aricept®) from Pfizer, separated by a 21-day washout period. The pharmaceutical company (Verisfield SA) kindly provided the blind C-t data of the study participants in order to perform this computational study. According to the BE study protocol, the blood samples were obtained at 0.5, 1, 2, 3, 4, 6, 8, 12, 24, 48, 96, 144, and 192 h after the treatment. Overall, there were 14 observations per subject and 26 subjects per period of the study. Taking into consideration that the data come from a 2 × 2 crossover study and there was no discrimination between the two medicinal products, there are 52 subjects with 14 observations each. As a result, 52·14 = 728 measurement points.
Following the appropriate clinical and analytical procedures, the blood samples were finally analyzed to quantify donepezil concentration using a validated high-performance liquid chromatography/tandem mass spectrometry (LC-MS/MS). The analytical approach demonstrated great sensitivity, specificity, accuracy, and speed. The linearity of the curve was reported at concentrations ranging from 0.1 to 100 ng/mL. The lower limit of quantitation for donepezil was equal to 0.1 ng/mL.
In the BE study, participated male and female volunteers between the ages of 18 and 45 with a BMI of 18.5 to 24.9 kg/m2. To confirm that they were healthy volunteers, a comprehensive medical history was collected, and a physical examination and laboratory tests were performed 21 days before enrollment in the study. After an overnight fast, the medication was taken orally with roughly 240 mL of water. Subjects fasted for 4 h, 8 h, 12 h, 24 h, 28 h, 32 h, 36 h, and 48 h following administration before eating regular meals. All the participants signed a written consent form, and the study was performed according to the ethical rules of the Helsinki Declaration.
Non-compartmental approaches (PKanalixTM, MonolixSuiteTM 2021R2, and Simulation Plus) were used to calculate the PK parameters of donepezil. These parameters were AUC, Cmax, Tmax, lambda, and the area under the C-t curve extrapolated from time zero to infinity (AUCinf). The linear trapezoidal rule was used to determine AUC and AUCinf. The Cmax/AUC and Cmax/Tmax ratios were calculated for each subject based on these estimates. The term “lambda” refers to the apparent terminal elimination rate constant, which is found by applying a least squares regression analysis to the terminal log-linear phase of the C-t curve, in line with the regulatory guidelines [1,2].

2.3. Principal Component Analysis

A well-established method for transforming a high-dimensional set of features into a low-dimensional set is principal component analysis [
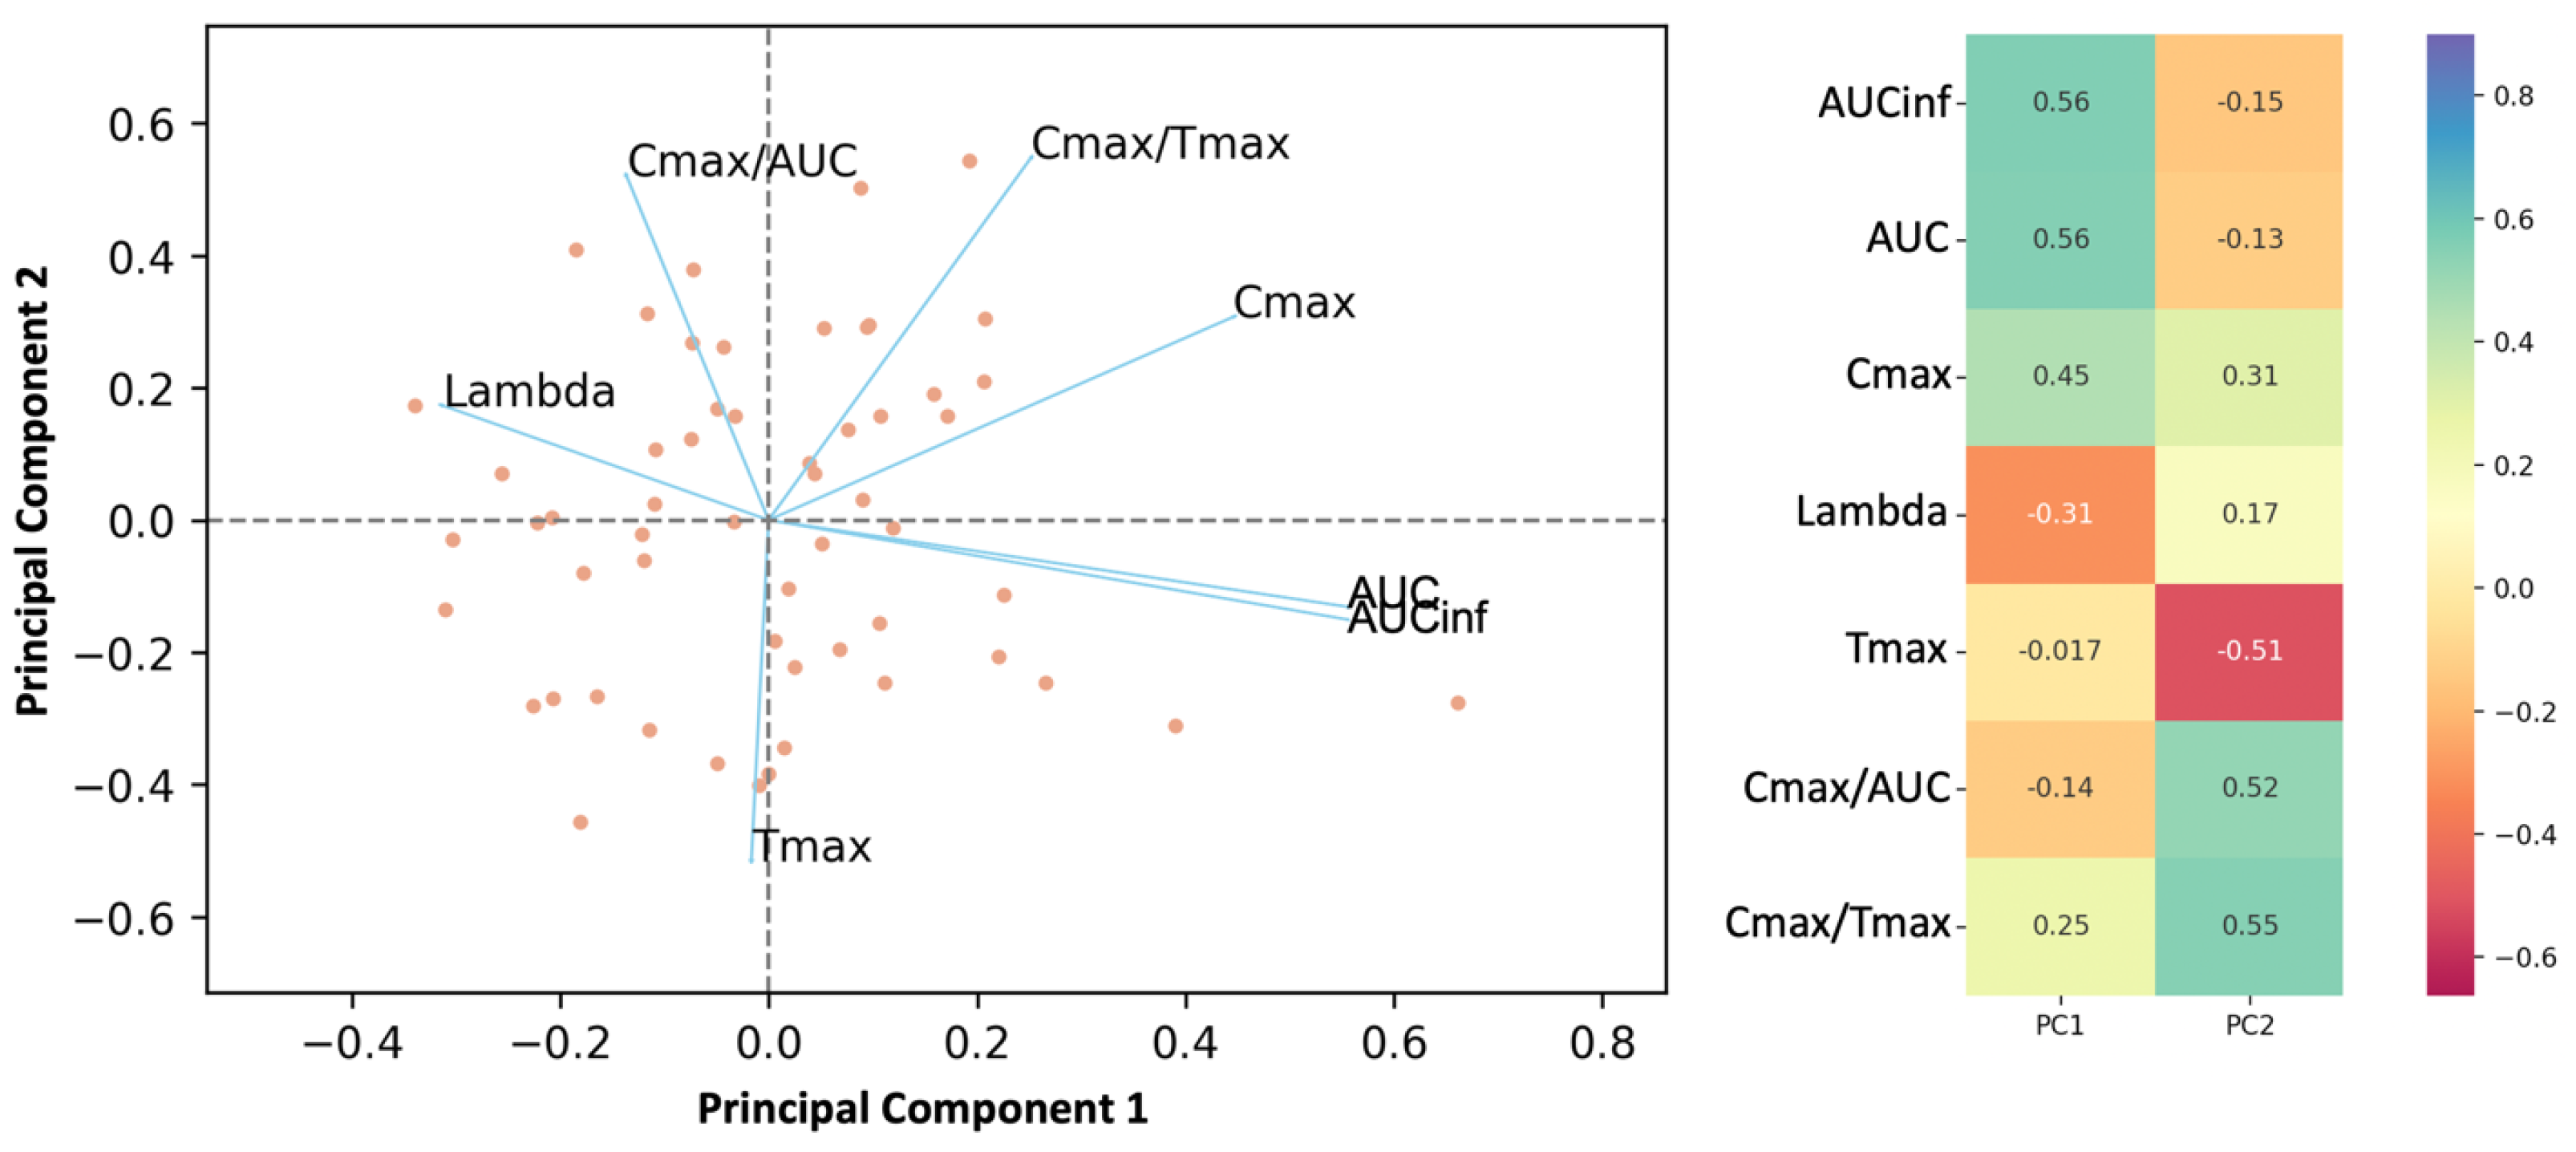
20]. PCA seeks the lowest dimensional representation of the data, while preserving as much information/variance as possible. In order to capture as much variability as possible, PCA converts the original space, produced from the original dataset, into a new space that is a linear combination of the dataset dimensions. Each dimension that is created is referred to as a principal component (PC). The new coordinates of the data are referred to as “scores.” Each PC accounts for a part of the variation in the original data set. The first principal component’s direction is the direction in which the data varies the most. The contribution of each original dimension to the new dimension is expressed by the “loadings”. The closer the loading value is to +1 (or −1), the greater the feature’s positive (or negative) impact on this PC.
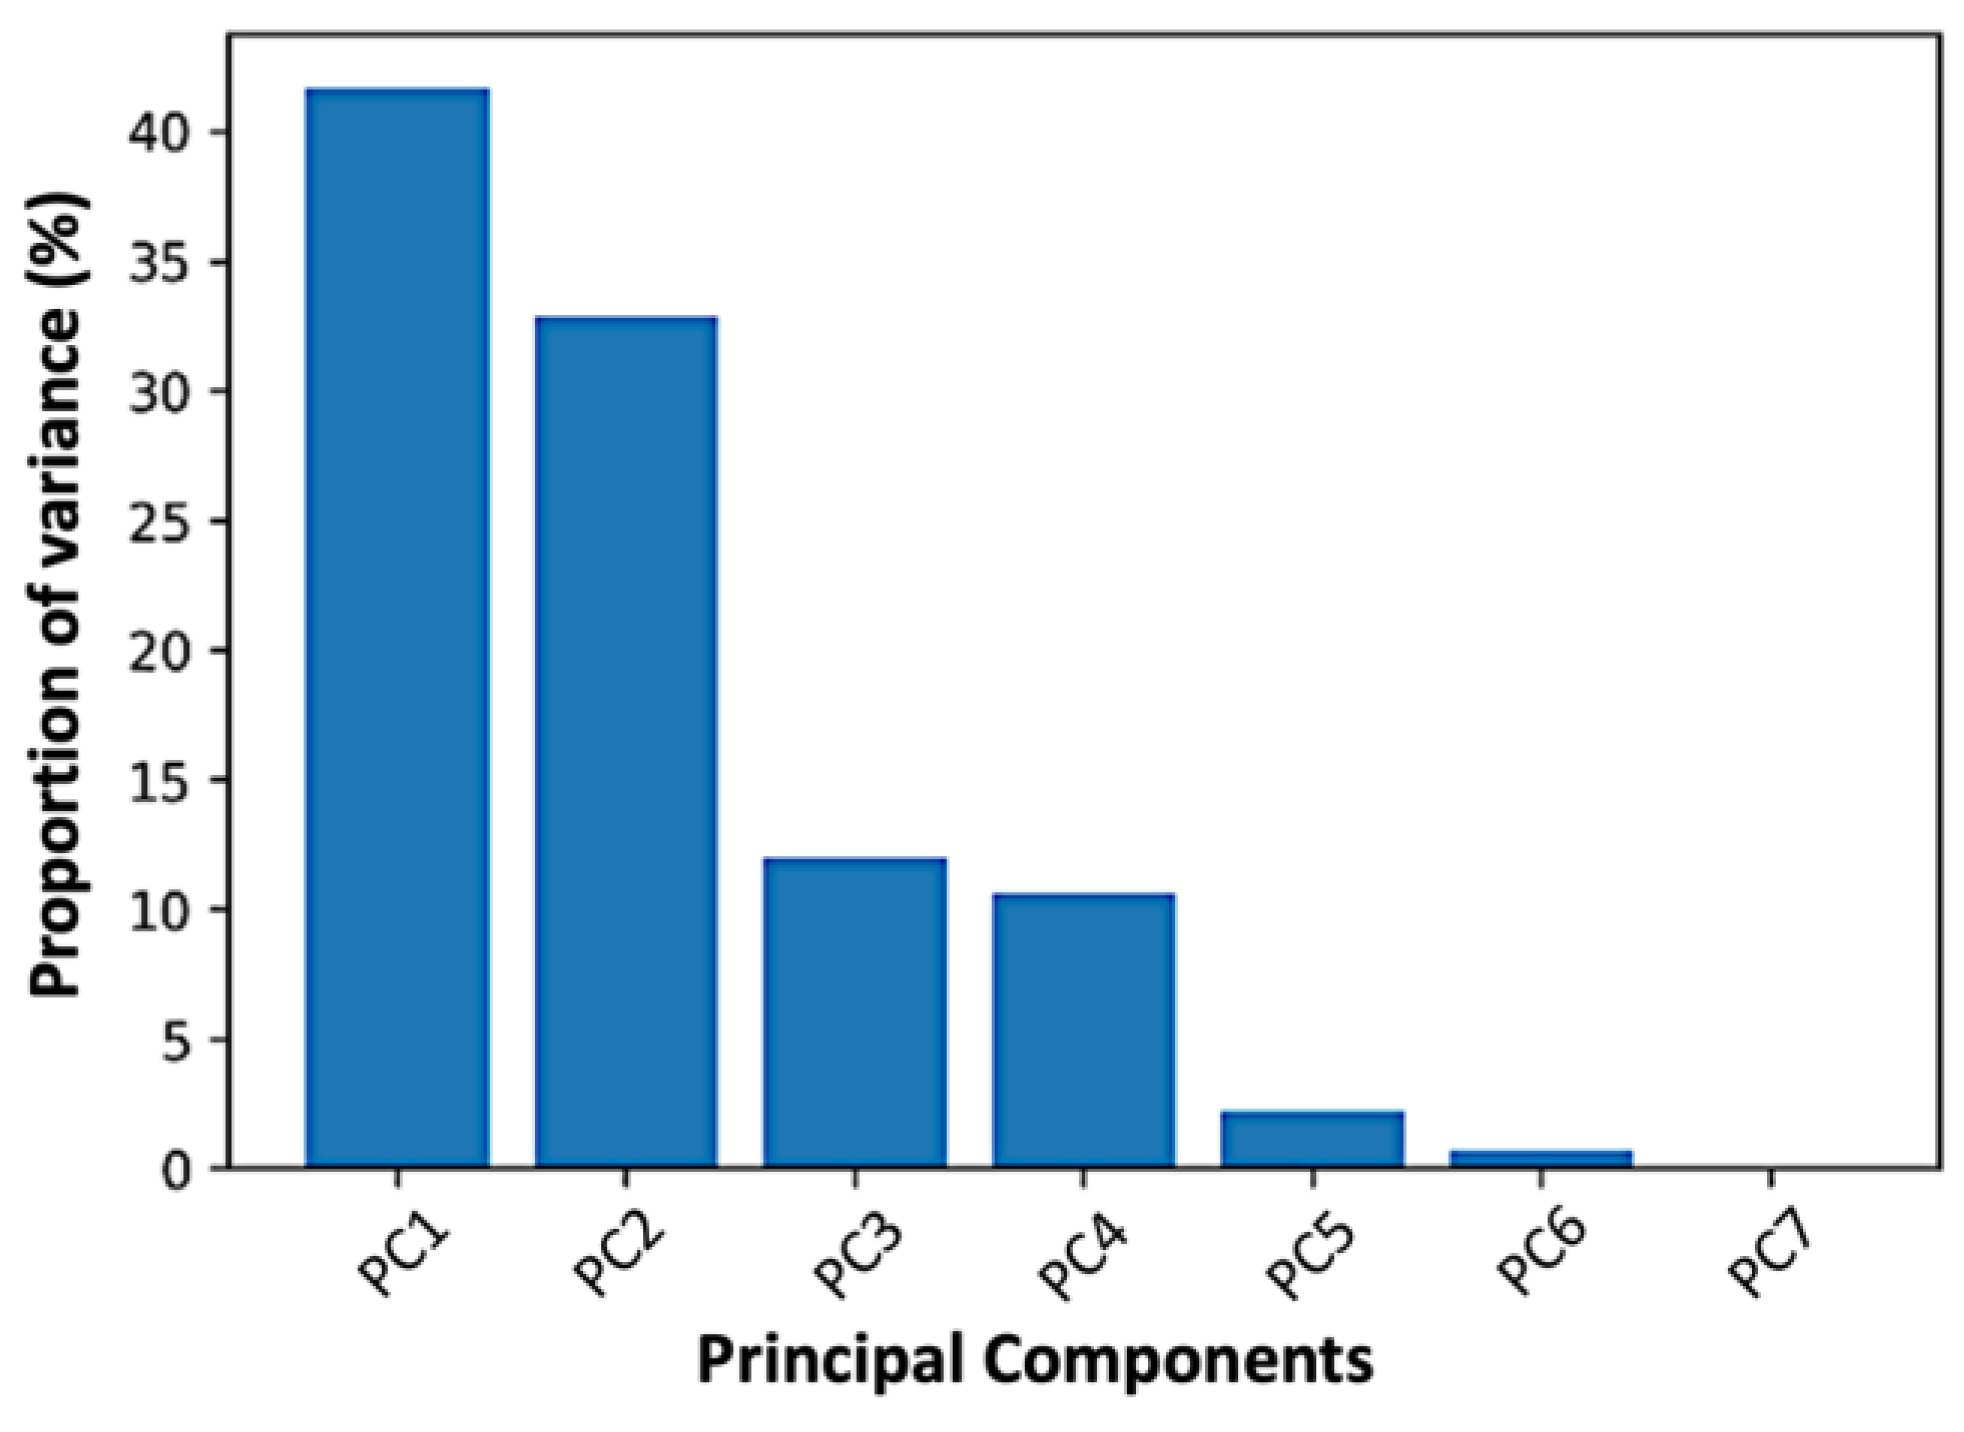
The “biplot” is the usual approach to examine the loadings and scores combined. The biplot is a two-dimensional scatter plot in which the two axes reflect the two most important PCs in terms of explained variance. The loadings of the first two PCs of each characteristic are shown over the data points in this two-dimensional coordinate system, utilizing the scores as coordinates. Scree plots are used to identify the fewest number of primary components required to reflect the original data adequately. A scree plot main aim is to display the findings of the component analysis and to locate the apparent change in slope (elbow). The eigenvalue is shown against the major components in a scree plot. The proportion of variance explained by a component is its eigenvalue divided by the sum of its eigenvalues. The first component typically explains a substantial proportion of the variability, the subsequent components explain a moderate proportion, and the final components explain just a small proportion of the total variability.
The data linear dimensionality was reduced using singular value decomposition (SVD). The latter was employed in order to project data into a lower dimensional space. Before applying the SVD, the input data were centered and scaled for each feature. Since the features (i.e., PK parameters) used in the PCA differed in scale (e.g., Tmax vs. AUC), feature scaling was required prior to conducting the PCA. Using the StandardScaler of “Scikit-learn” from the preprocessing submodule, z-score standardization was used to get all features into the same scale. Because the dataset was constrained, the actual full SVD was computed and then reduced [21]. Because we are interested in finding relationships among all PK parameters, PCA was implemented using the original number of dimensions. As a result, the number of components hyperparameter was set to “none” in order to keep all components. A one-dimensional “numpy” array was used to calculate the percentage of variance explained by each of the selected components. Then, the principal components were ordered by decreasing explained variance and the two first principal components were kept. The entire PCA analysis was implemented in Python v. 3.10.8.

2.4. Correlation Analysis

Correlation analysis is a statistical tool used in research to determine and quantify the strength of a linear association between two variables. The correlation coefficient quantifies the linear relationship between two sets of data. It is the product of the covariances of two variables and their standard deviations. Consequently, it is essentially a standardized measurement of covariance, with the result always falling between +1 and −1. The measure, like covariance, can only indicate a linear connection of variables and ignores numerous other forms of linkages or correlations. In this study, the Pearson correlation coefficient was used as a surrogate measure of the bivariate association between two PK variables. The analysis was performed in Python v. 3.10.8.

2.5. Random Forest

Bagging is a machine learning approach in which many “copies” of the training data are created, where each “copy” is somewhat different from the others. Each copy is then subjected to a weak learner, such as a “decision tree.” This generates a large number of weak models, which are subsequently merged. Random forest is a supervised learning bagging strategy in which a large number of decorrelated trees are produced and then averaged to generate a more precise and consistent prediction of the target variable [20]. It is usual practice to partition the initial dataset into two pieces, “training” and “testing,” to make the algorithm more robust. The training set is used to build the model, and the testing set is used to assess the model’s performance.
Random forest is a supervised machine learning technique for either classification or regression tasks. An RF classifier operates on data with discrete labels, namely classes. Also, RF can be used for regression tasks in addition to classification. Even though RF cannot be used for extrapolation tasks, RF’s nonlinear nature gives it an advantage over linear methods. The response variable in the case of an RF regressor should have numerical values. For the purposes of this study, RF was used for classification. Thus, prior to using RF, the response variable had to be in the form of an ordinal scale. Thus, Cmax, Cmax/AUC, and Cmax/Tmax were transformed into ordinal scales from their original continuous scales.
For the implementation of RF, the hyper-parameters must be defined before training. In general, the hyper-parameter tuning was based on trial-and-error. These hyper-parameters may refer to the number of decision trees in the forest and the number of classes into which the response variable was classified. Bootstrap samples were utilized to construct trees, while the number of trees in the forest was equal to 500. To get all features into the same scale, z-score standardization was employed with the StandardScaler of sklearn from the preprocessing submodule. The number of random states, which affects the randomness of sample bootstrapping when creating trees, was set to 42. No warm was used, but a completely new forest was built every time. The number of parallel jobs was set to one. The utilized criterion (loss function), to determine model classification, was the default of the sklearn library, the Gini impurity. The max depth of each tree was set to 5. It should be stated that several settings were tested, but the final used are those presented above.
The dataset was divided into training and test sets, with the latter accounting for 33% of the data (the remaining 67% referring to the training set). Following the split, the model was trained on the training set and predictions were made on the test set. The feature significance scores were generated and shown using the Matplotlib tool once the random forest model was developed. The “confusion matrix” is employed to assess the performance of a model in a classification task (i.e., where the dependent variable is categorical). The confusion matrix is a M × M matrix, where M refers to the number of classes in the response variable. The matrix compares the expected and true classes. This provides a detailed perspective of the categorization model’s overall performance and the types of errors it makes. The correctness and misinterpretation of the predictions are measured in order to reflect the classification’s performance. When utilizing random forest, it is also feasible to determine the contribution of each variable to the prediction of the response variable by studying the feature importance.
Initially, the response variable was divided into four classes in order to express the conditions of “low”, “intermediate”, “high”, and “very high” values. This hyper-parameter (i.e., number of classes) tuning was based on a trial-and-error rationale; two-, three-, and five- groups were also investigated. The classification results, obtained from the 4-group sorting were at least equal to those from the 3-group. The two other cases (e.g., two or five groups) led to worse classifications. Thus, the 4-group classification was finally selected. Besides, the latter, based on the distribution quartiles, allowed the balanced participation of all attributes. The distribution of each response variable between the four classes was compared by assessing the inter-quartile range (within each group) and applying the Kolmogorov–Smirnov test (at the significance level of 5%). In all cases of the analysis presented below, no statistically significant differences were observed.
The random forest algorithm was implemented in Python v. 3.10.8.

2.6. Non-Linear Mixed Effect Modeling

Individual plasma C-t measurements were collected from the donepezil BE dataset. For nonlinear mixed effects modeling, the stochastic approximation of the expectation maximization algorithm was used, followed by importance sampling approaches [22]. For the final population parameter values, the value of the objective function (OVF) was computed using the important Monte Carlo sampling method.
One-, two-, and three-compartment models with first-order elimination were investigated, with initial parameter estimations based on the literature [
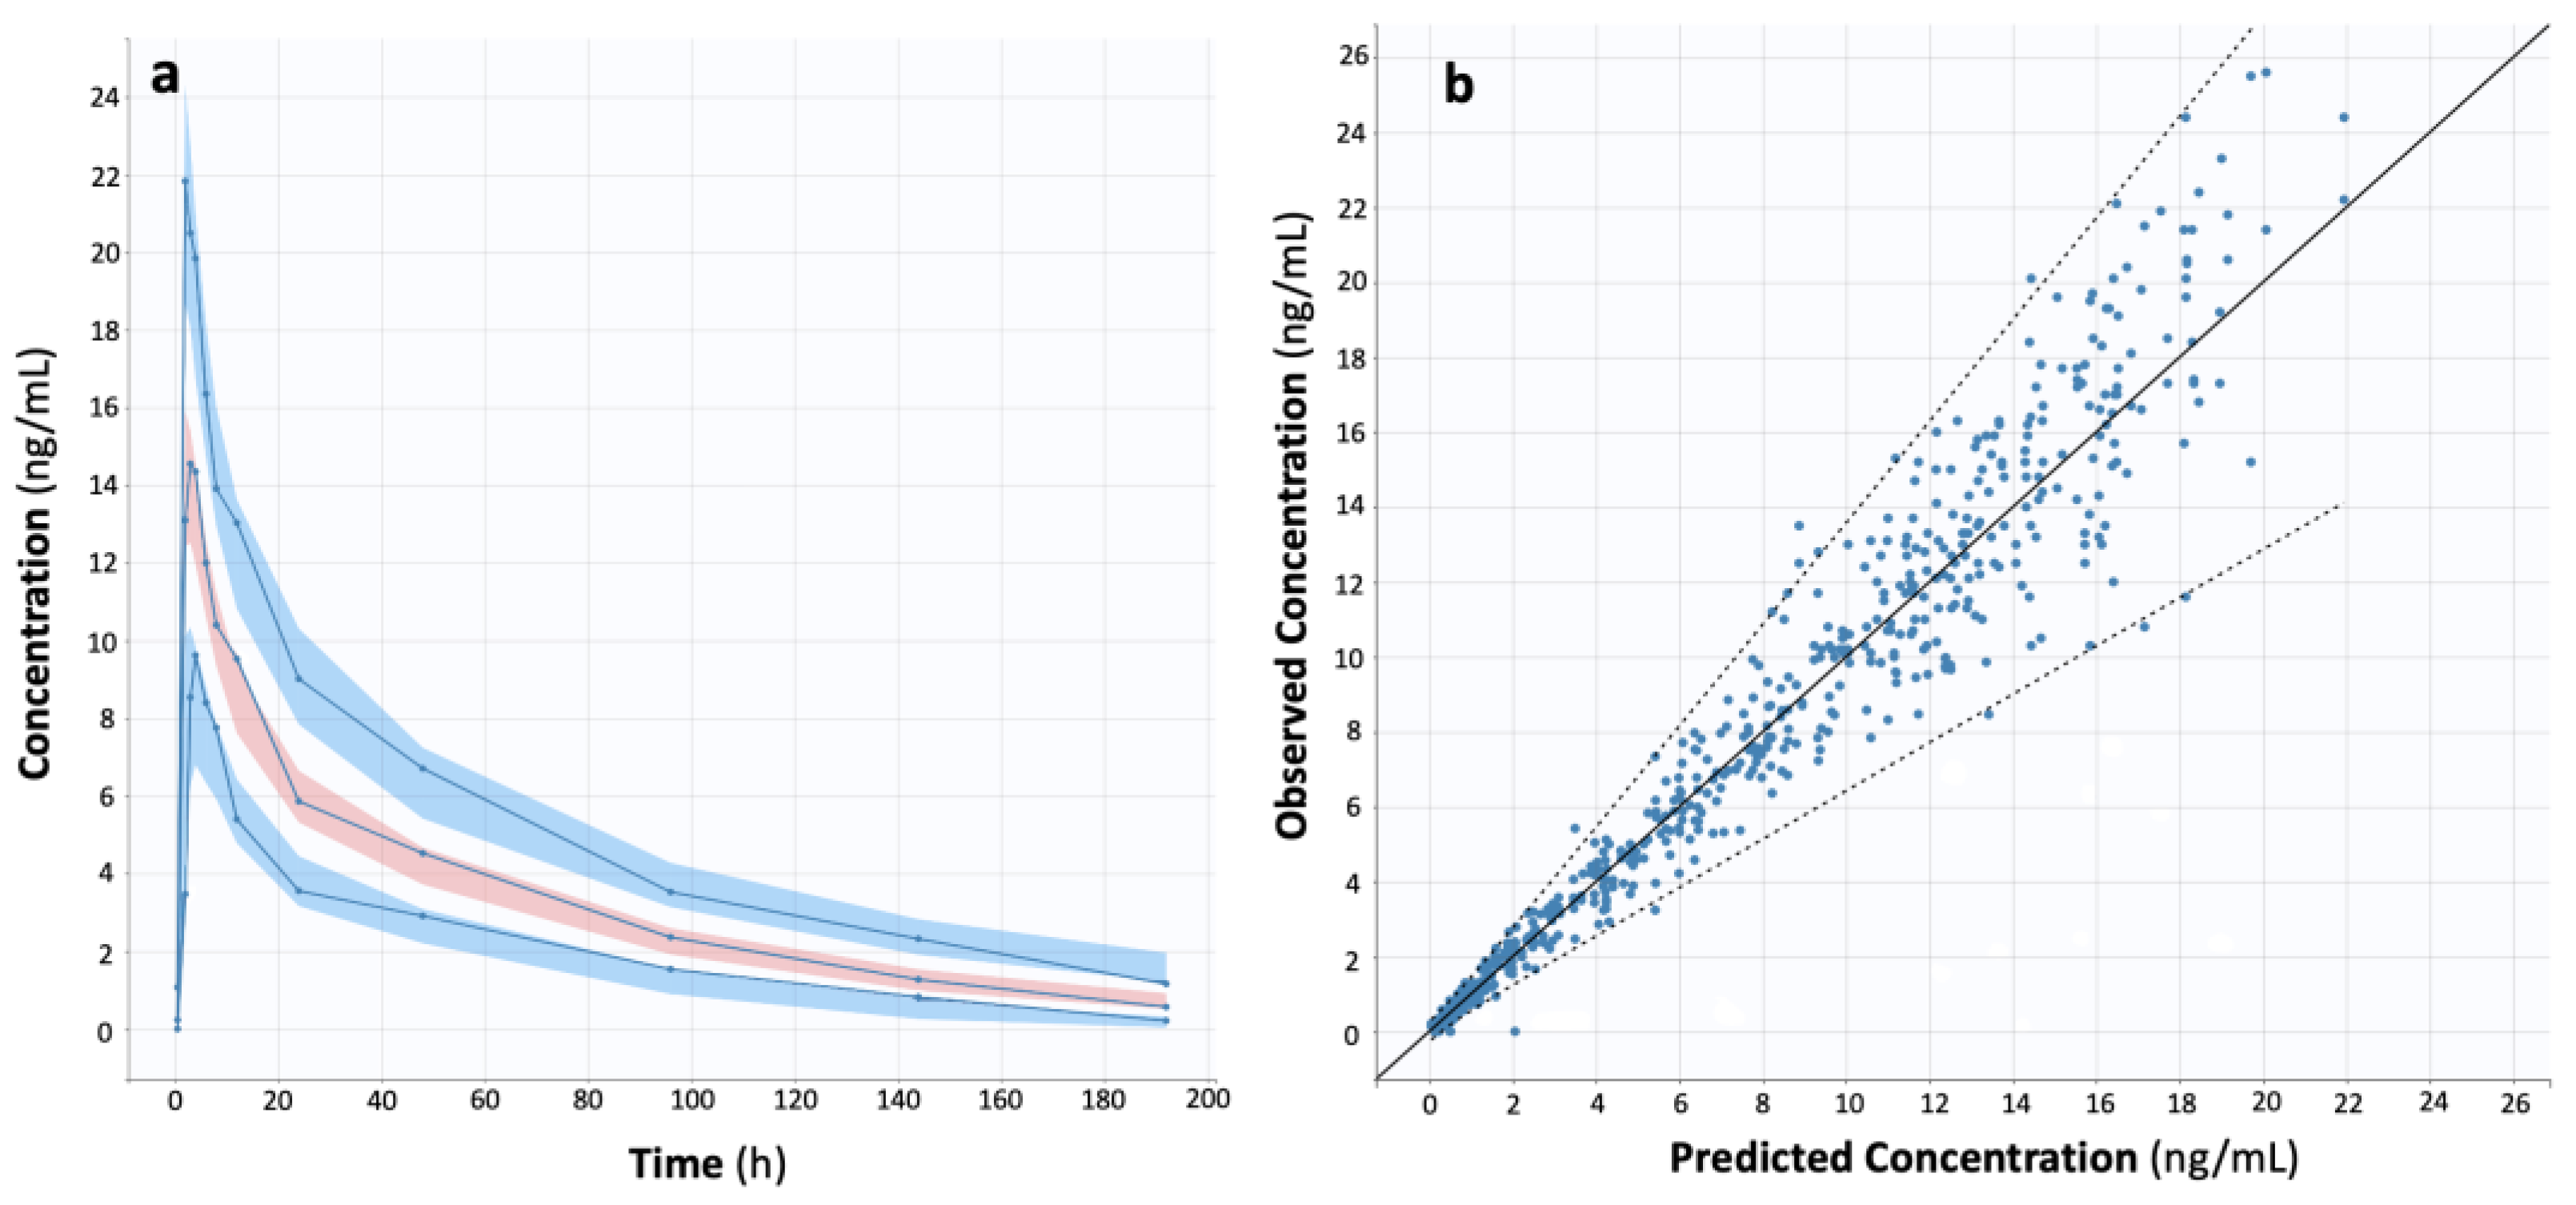
23]. All pharmacokinetic parameters were assumed to have a lognormal distribution. Many residual error models were examined, e.g., constant, proportional, and combinations of constant and proportional error models. The selection of the final best model was based on goodness-of-fit plots and OVF comparisons. Visual analysis of the resulting goodness of fit plots enabled the detection of potential biases or issues in the structural model, random effects, and statistical techniques. Plots of observed values versus individual projected values, individual weighted residuals versus time, and individual weighted residuals versus concentration were used to assess goodness of fit.
One of the advantages of non-linear mixed effect modeling relies on the fact that relatively small numbers of subjects are required and sparse sample size. In this study, 26 subjects participated in a 2 × 2 clinical design. This sample size allows the reliable estimation of the population estimates as well as their variabilities; either between-subject (i.e., the omega estimates) or the residual error [24,25].
MonolixTM 2021R2 (Simulation Plus) was used for the population pharmacokinetic analysis.

2.7. Simulated Bioequivalence Datasets

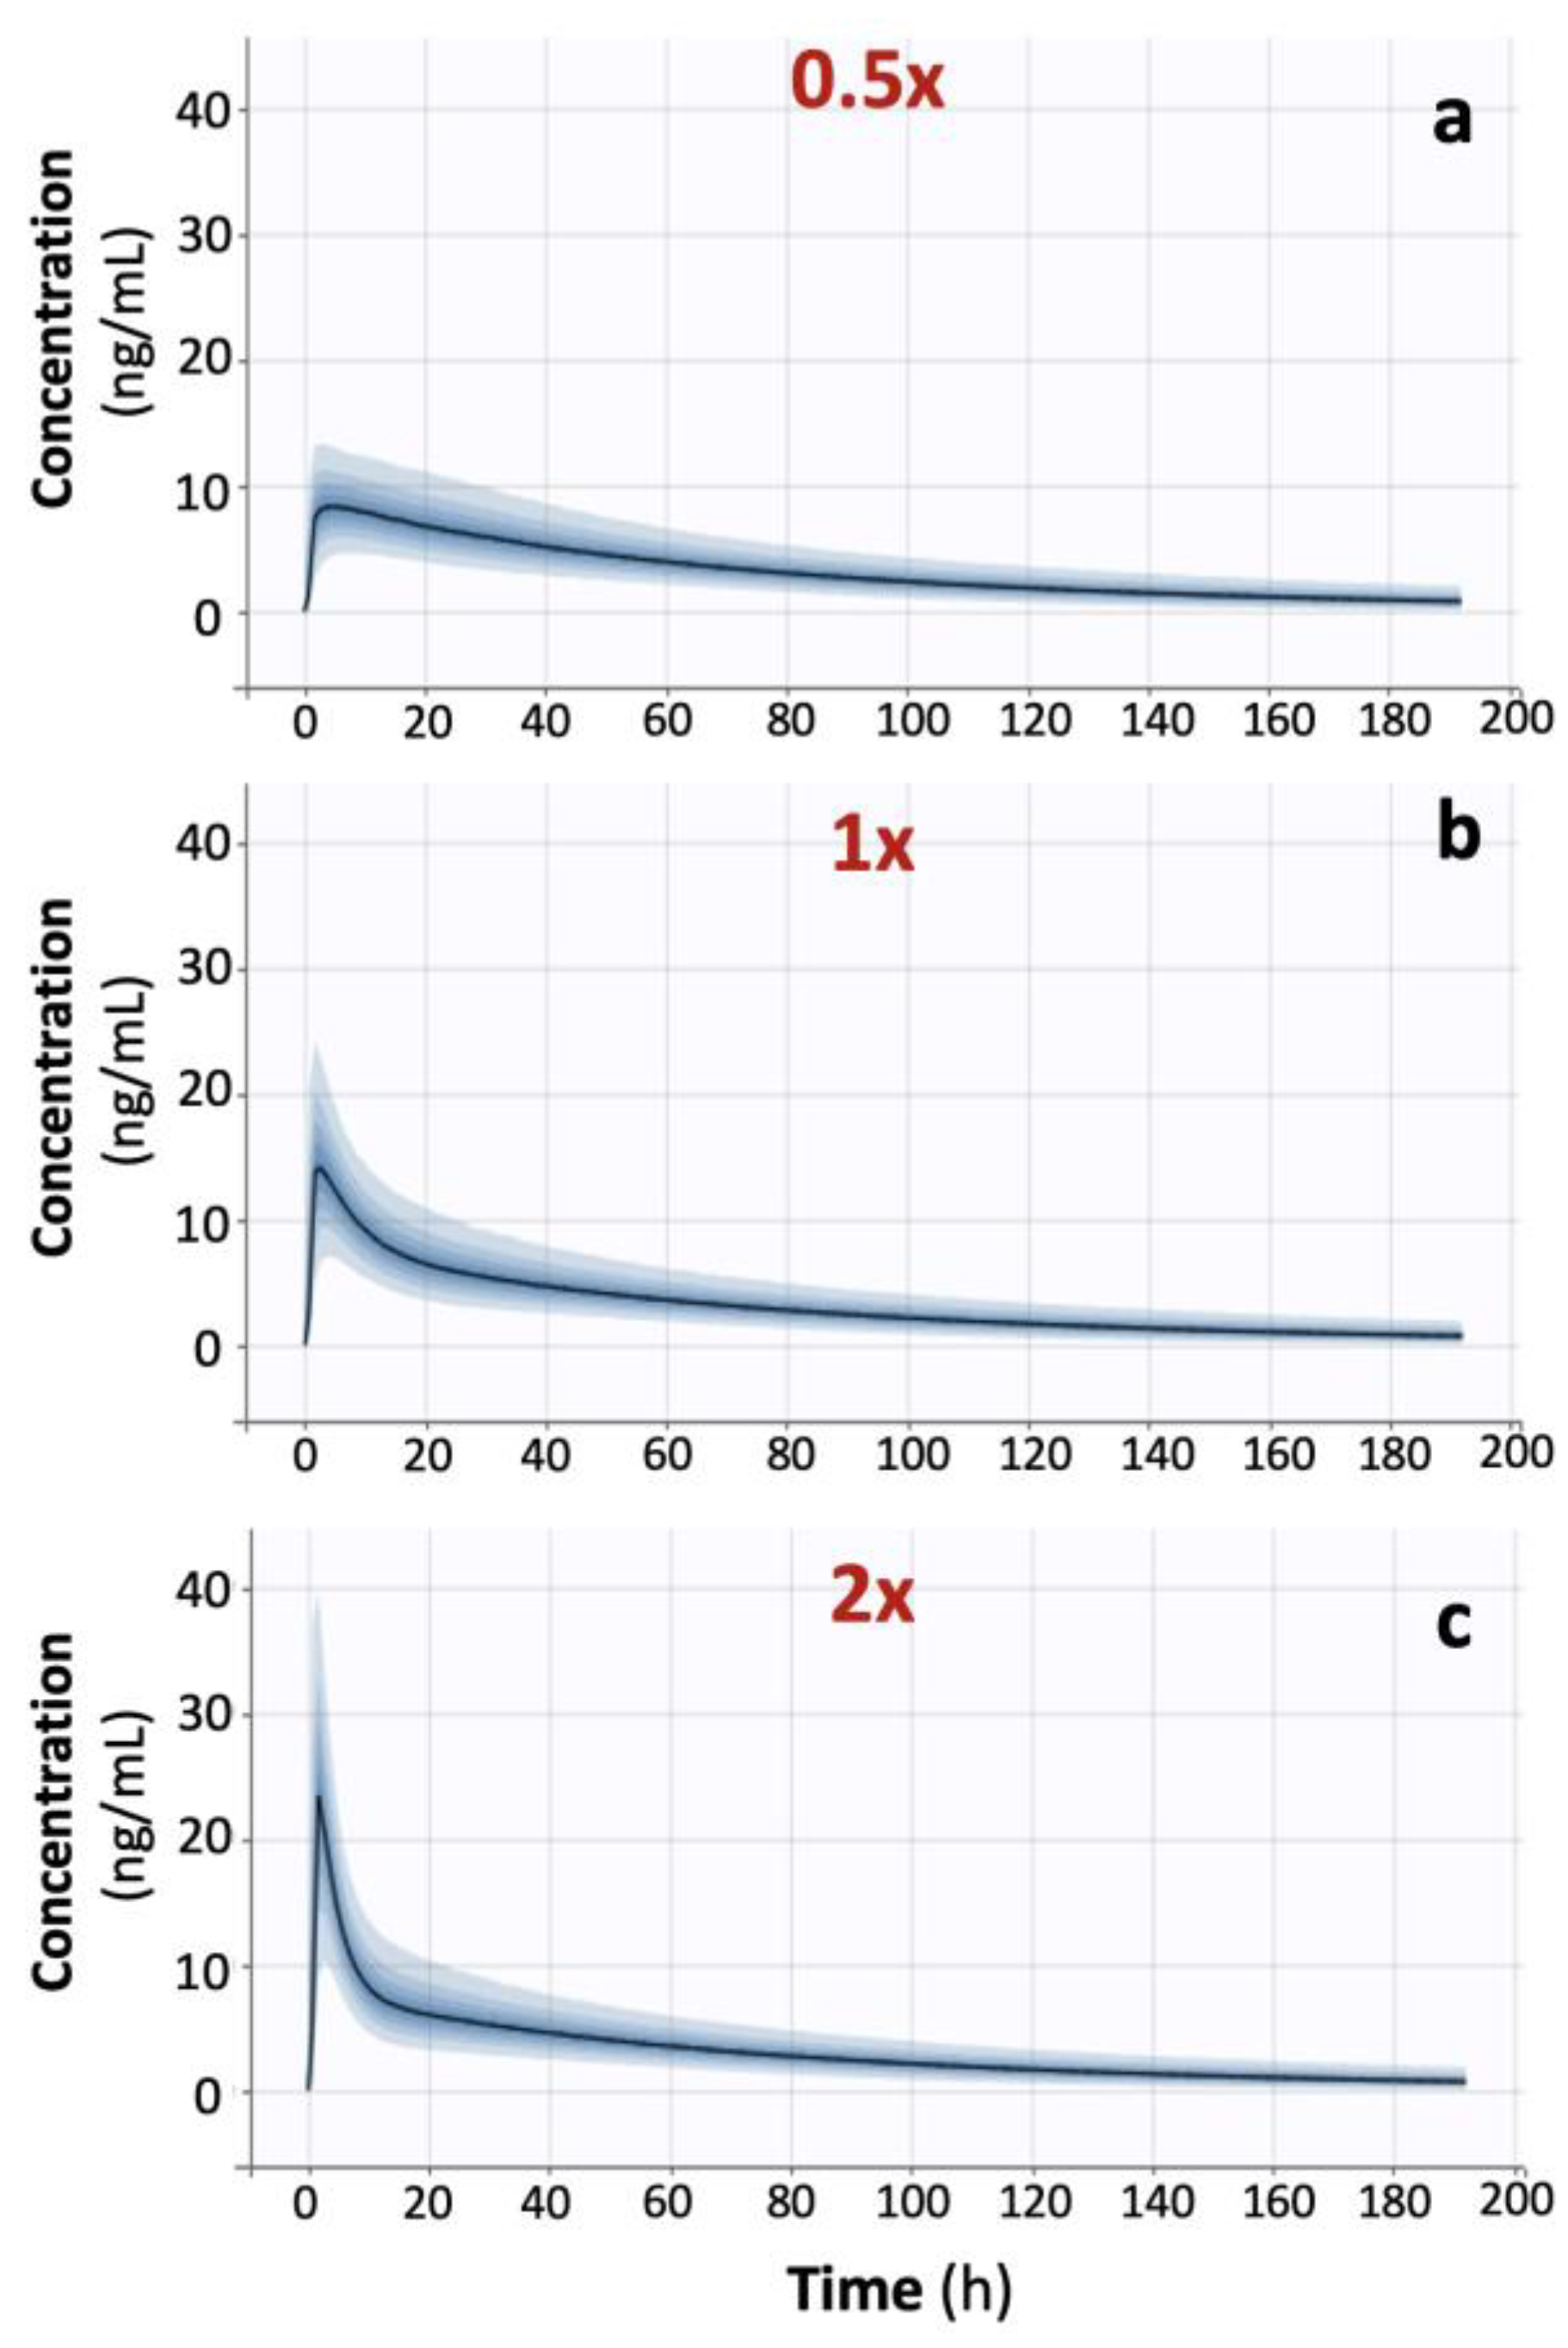
Using the population PK estimates from the NLME analysis, three BE datasets (2 × 2 crossover) of 26 subjects each were simulated: (a) slower absorption by setting the absorption rate constant to be half of the original (0.5x-), (b) equal to the original Ka (i.e., 1x-), and (c) quicker absorption by setting Ka to be twice the original (2x-). As a result, three donepezil BE datasets were simulated and the two ML approaches (PCA and RF) were re-applied. The latter allowed the investigation of relationships between the PK variables and the contribution of each to another, under varying absorption rates. The sampling schedule was set every 15 min in order to avoid adding bias to the estimations of the PK parameters.

3. Results

3.1. Relationships among the PK Variables

The analysis started by estimating the PK variables of donepezil according to the strategy shown in Figure 1. The actual C-t data used in this study came from a two-sequence, two-period, crossover BE study in 26 healthy volunteers who were given a single dosage of donepezil. The PK parameters of donepezil were calculated using non-compartmental techniques. Therefore, estimates of AUC, Cmax, Tmax, lambda, and AUCinf were found. Then, the previously estimated PK data were subjected to principal component analysis.

3.1.1. PCA and Correlation Analysis

Principal component analysis was used to extract information from participants and analyze the relationships among the PK variables (Figure 2). The observations (study participants) are represented by dots in the plane produced by the two initial principal components, while the lines represent the vectors of the variables, such as AUC, Cmax, AUCinf, Tmax, etc. The loadings (l1 and l2 for the 1st and 2nd principal components) of all PK variables are shown next to the PCA plot.
Scree plots were developed in order to determine the ideal number of main components (Figure A1). The eigenvalues (proportion of variance explained) are shown on the y-axis, while the number of components is shown on the x-axis. The scree plot criterion searches for the curve’s “elbow” and chooses all components shortly before the line flattens out. In our case, the first and second principal components account for 74.5% of the overall variability (41.6% and 32.9%, respectively). Figure 2 reveals that AUC and AUCinf are adjacent next to each other, on the right side of the plot near the first principal component (both share the same l1 value of 0.56). Among the other variables, Cmax (l1 = 0.45) is closer to AUC, indicating their strong association. Cmax/Tmax is located farther away from AUC, although it shows a positive association in terms of the first principal component (l1 = 0.25). The Cmax/AUC metric is also located far from AUC, but with a negative association (l1 = −0.14). The terminal slope, lambda, is on the opposite part of the plot (l1 = −0.31), indicating an almost completely different behavior with AUC (or AUCinf). Finally, the kinetic term, Tmax, is placed on the negative part of the second principal component (l1 = −0.017, l2 = −0.51).
A correlation analysis was conducted in order to further explore the bivariate relationships between the PK variables. The Pearson’s correlation coefficient (R) values were estimated (Table 1). It becomes obvious that AUC and AUCinf are fully linearly correlated, having an R very close to 1 (i.e., 0.986). In terms of the other variables, the following ranking of correlations with AUC was found: Cmax (R = 0.632), Cmax/AUC (R = −0.425), lambda (R = −0.375), Cmax/Tmax (R = 0.236), and Tmax (R = 0.114). Firstly, it should be underlined that Tmax has quite a different performance compared to the measures of extent of absorption (AUC and AUCinf). Moreover, it becomes obvious that Cmax shows a high correlation with AUC (or AUCinf) and a low correlation with the kinetic term Tmax. The Cmax/AUC ratio is related more to AUC (R = −0.425) than Tmax (R = 0.341), while Cmax/Tmax shows no association with the measures of extent of absorption but is strongly (negatively) related to Tmax (R = −0.719).

3.1.2. Random Forest Analysis

To determine the contribution of PK characteristics to each potential absorption rate metric (Cmax, Cmax/AUC, and Cmax/Tmax), a random forest classifier was used. Before applying RF, it was necessary to have the response variable in the ordinal scale. Thus, the continuous scale variables Cmax, Cmax/AUC, and Cmax/Tmax were transformed into ordinal scales. The most rationale approach was to split each variable into its quartiles. Then, four groups were initially created with an equal number of observations within each one of them, allowing balanced representation of all attributes (very high, high, medium, and low value of the variable). Other groupings, with two-, three-, and five- classes were also investigated. The categorization results obtained from the 4-group sorting were at least as good as those obtained from the 3-group. Other types (e.g., two or five groups) resulted in inferior categorization. Thus, the 4-group classification was finally selected. The quartile values of the three variables (Cmax, Cmax/AUC, and Cmax/Tmax) are listed in Table A1.
Application of the RF algorithm to the three response variables separately is shown in Figure 3. The variable importance plot for Cmax (Figure 3a) reveals that AUC (50.1%) contributes mostly to Cmax values, followed by lambda (34.6%), and lastly by the kinetic term Tmax (15.3%). A similar pattern was observed for Cmax/AUC (Figure 3b). However, a completely different performance was detected for Cmax/Tmax (Figure 3c), where Tmax contributes the most (36.5%), followed by AUC (34.1%) and lambda (29.4%). To express how many of the predictions of a random forest classifier were correct and when they were incorrect (i.e., when the RF classifier becomes “confused”), a confusion matrix was created for each case. In all cases, the developed RF models were able to correctly classify more than 70% of observations (74.2%, 72.6%, 76.1% for Cmax, Cmax/AUC, and Cmax/Tmax, respectively), which shows that the models are good at making predictions. The confusion matrix plots are not shown due to space limitations.
Figure A2 presents additional results where both AUC and AUCinf are analyzed (i.e., not only AUC as done before) for their contributions to Cmax, Cmax/AUC, and Cmax/Tmax. Again, in this case, similar results were obtained. AUC and AUCinf were the major contributors to Cmax, accounting together for 67.4%, while the contribution of Tmax was only 9.93% (Figure A2a). A similar pattern was also observed for Cmax/AUC (Figure A2b). However, the performance of Cmax/Tmax (Figure A2c) was radically different, compared to the two previous PK metrics, with Tmax contributing the most (38.1%) and the other three factors contributing approximately equally (around 20% each).

3.2. Relationships among the PK Variables, under Different Absorption Kinetic Conditions

In the following phase of the analysis, the aim was to investigate the performance of PK metrics under different kinetic scenarios. Therefore, simulations were performed with faster and slower absorption rates.

3.2.1. Development of a Population Pharmacokinetic Model for Donepezil

The initial step in completing this assignment was to create a PK model that characterizes the kinetics of donepezil. A NLME analysis was performed to the real C-t data, and a population PK model for donepezil was developed. A two-compartment model with first-order absorption and elimination kinetics best characterized the kinetics of donepezil (Table 2). The residual variability was estimated using a combined error model. The mean value of donepezil’s first-order absorption rate constant was 0.18 h−1, the mean apparent clearance was 14,466.77 mL/h, and the mean apparent intercompartmental clearance was 80,120.11 mL/h. Furthermore, the mean apparent volume of distribution of the central compartment was 44,386.59 mL, while it was 905,886.42 mL for the peripheral compartment. In addition, the between-subject variability estimates were reasonable for all parameters, and the highest estimate of the percent relative standard error did not exceed the value of 22.5%.
The good descriptive and predictive ability of the model is depicted in Figure 4, where the visual prediction check plots (Figure 4a) are shown alongside the individual predicted versus observed concentration values (Figure 4b). The visual prediction check (Figure 4a) demonstrates that, despite the high heterogeneity of the C-t data, the created model’s prediction interval contains the experimental concentration data in all circumstances. In Figure 4b, the individual predicted vs. observed concentration values are linearly correlated, and almost every observation is included within the 90% prediction interval (the outliers’ proportion was 2.13%). Thus, a robust population PK model was constructed, suitable for the needs of this study.

3.2.2. Simulate Different Absorption Kinetics

In order to explore how absorption rate affects the above-mentioned findings, simulated BE datasets (2 × 2 crossover, with N = 26 subjects each) were additionally used. Based on the population estimates and all variables derived from the NLME analysis, three conditions were simulated: (a) slower absorption by adjusting the mean Ka to be half of the original (0.5x-), (b) equal to the original Ka (i.e., 1x-), and (c) faster absorption by adjusting the mean ka to be twice the original (2x-). As a result, three donepezil BE datasets were simulated. The simulated donepezil C-t data for these three datasets are illustrated in Figure 5.
Using the simulated C-t data, the PK parameters (Cmax, Tmax, AUC, AUCinf, lambda, Cmax/AUC, Cmax/Tmax) were estimated using non-compartmental approaches. Then, the analysis continued by re-applying the two ML algorithms (PCA and RF) to each BE dataset. Thus, it was possible to study the effect of the absorption rate directly on the relationship among the PK parameters and how each one of them is influenced by absorption rate.

3.2.3. PCA Applied to the Simulated Bioequivalence Datasets

In all three cases (0.5x-, 1x-, and 2x-) of the simulated BE datasets, PCA was used to extract information from participants and analyze the associations among the PK variables (Figure 6). Scree plots were developed in order to determine the ideal number of principal components. Two principal components were identified, explaining 73.7%, 74.1%, and 72.8% of total variability (Figure 6a–c, respectively). Initially, it can be observed from Figure 6b that the behavior of the “1x-” scenario is quite similar to the results obtained after applying PCA to the actual data (i.e., Figure 2).
The performance of Cmax is similar to that of AUC (or AUCinf), while Cmax/Tmax and Cmax/AUC are much less related to the AUC metrics. When absorption kinetics were assumed to be slower by 50% (Figure 6a), Cmax mainly, but also Cmax/Tmax and Cmax/AUC, were found to be less dependent on AUC. In the case where absorption was set to be faster (i.e., 2x-, Figure 6c), all three PK metrics (Cmax, Cmax/Tmax, and Cmax/AUC) discriminated more from AUC. It is worth mentioning that the loadings of the three kinetic PK metrics exhibit positive l1 values: 0.49, 0.52, and 0.51 for Cmax, Cmax/Tmax, and Cmax/AUC, respectively). On the contrary, the two AUC measures are located on the left side of the plot, exhibiting negative l1 values: −0.084 and −0.073 for AUC and AUCinf, respectively. The latter indicates the negative contribution of the extent of absorption in the kinetic metrics.

3.2.4. Random Forest Applied to the Simulated Bioequivalence Datasets

The random forest algorithm was used to determine the contribution of PK features to each candidate absorption rate measure (Cmax, Cmax/AUC, and Cmax/Tmax). Since it was necessary to have the response variable in terms of ordinal scale in order to apply the RF, Cmax, Cmax/AUC, and Cmax/Tmax were split into the four classes of their quartiles (very high, high, medium, and low). Table A2 lists these quartile estimates.
Figure 7 shows the findings when the random forest algorithm was used for each of the three response variables (Cmax, Cmax/AUC, and Cmax/Tmax) separately.
The variable importance plots for Cmax (Figure 7a) and Cmax/AUC (Figure 7b) reveal the similar performance of these two PK metrics. For the low absorption rate (0.5x), AUC and Tmax contribute nearly equally to Cmax (34.7% and 35.4%, respectively) and Cmax/AUC (35.7% and 35.9%, respectively), while the term lambda contributes slightly less (29.9% for Cmax and 28.4% for Cmax/AUC). However, as the absorption rate increases (e.g., 1x- and 2x-), the contribution of AUC becomes predominant, whereas that of Tmax gets less. The opposite behavior was observed for Cmax/Tmax (Figure 7c). At low absorption rates (0.5x-), Tmax is the major contributor to Cmax/Tmax (55.9% contribution), while the influences of AUC and lambda are less than half that of Tmax (23.0% and 21.1%, respectively). As the absorption rate increases, the input of AUC and lambda increases, but Tmax still has the predominant role (e.g., 40.0% for the “2x-” condition). In all cases, the RF models that were made were able to correctly classify more than 70% of the observations, implying their adequate prediction ability.

4. Discussion

The objective of this study was to explore the relationships among the PK parameters used in BE assessment and identify the most appropriate metric for characterizing absorption rate. This task was accomplished using two machine learning algorithms (PCA and RF) and the use of actual BE data from 26 healthy volunteers, as well as three simulated BE studies. To the best of knowledge, this is the first study that utilizes machine learning in the field of bioequivalence assessment.
Over the last few years, it has been agreed that AUC indicates the extent of exposure, whereas Cmax (the maximum plasma concentration or peak exposure) and Tmax refer to absorption rate-dependent characteristics [1,2,4]. Even though there are no doubts about the use of AUC as a measure of the extent of absorption, the choice of Cmax as a metric for the rate of absorption has raised many concerns [6,11,12,14,16,17]. First of all, it has to be reminded why Cmax was preferred over other PK metrics, e.g., Tmax, partial AUC areas, or mean residence time for reflecting the kinetic aspects of absorption. The requirement to evaluate “rate” in bioequivalence tests using indirect metrics comes from the ambiguity about whether such testing is meant to ensure pharmaceutical quality (in terms of drug release characteristics) as well as clinical safety and efficacy [12]. Thirty years ago, scientists using simple simulations demonstrated the danger of evaluating the performance of several indirect rate measures using a fixed universal acceptability interval for bioequivalence [12]. However, because rate, as indicated by a rate constant, cannot be accurately assessed using indirect metrics and may have little clinical relevance, regulatory guidelines supported the use of Cmax as an empirical index of safety and efficacy.
However, Cmax inherently carries two problems: first, the fact that concentration measurements are only taken at discrete time intervals complicates the direct determination of Cmax (as well as Tmax). Secondly, and most importantly, Cmax is known to be greatly influenced by the extent of absorption. Hence, Cmax should be better used to measure high drug exposure rather than absorption rate. This implies that the ineffective use of Cmax as an indirect parameter for absorption rate contributes to the unpredictable and uncertain outcome of BE studies [11]. In this context, Tmax and the ratio Cmax/AUC have been proposed as possible alternatives to Cmax for assessing the absorption rate characteristics of immediate-release formulations [14]. Studies comparing the absorption rates of two drug formulations have shown that Tmax and the Cmax/AUC ratio share similar features [14]. This observation provided a compelling justification for using the observed Cmax/AUC ratio as a measure of absorption rate rather than Tmax because Cmax/AUC was easier to handle statistically and could be measured with more precision than Tmax [14,18].
Even though the limitations of Cmax as an absorption rate metric have been acknowledged since its initial adoption, the use of Cmax in BE studies has been traditionally used for more than 30 years. In this study, the modern tool of machine learning is used to address an old problem from another perspective. Two ML methods, principal component analysis and random forest, are used to identify the relationships between the PK parameters. The underlying meaning of this task was to unveil the relationships among all possible pharmacokinetic measures used in bioequivalence studies. In general, in bioequivalence testing, pharmacokinetic parameters are calculated to express two characteristics: extent and rate of absorption. The traditional way in pharmacokinetics to explore the properties of a pharmacokinetic parameter is to find its relationships with the bioavailable fraction and absorption rate constant assuming a certain type of kinetics (e.g., a one-compartment model with first-order absorption and elimination) and using simple simulations. In this study, for the first time, ML algorithms are applied instead of a simple simulation exercise, and all pharmacokinetic features are explored together. The PCA analysis identifies proximities between PK characteristics, whereas the RF analysis identifies the nature of each parameter, specifically whether it is influenced by the extent or rate of absorption.
In addition, a new metric, the ratio Cmax/Tmax, is introduced and explored together with the traditional PK parameters. We assess the contribution of PK characteristics to each one of the potential absorption rate metrics (i.e., Cmax, Cmax/AUC, and Cmax/Tmax). In this analysis, ML techniques were applied to two different types of data (
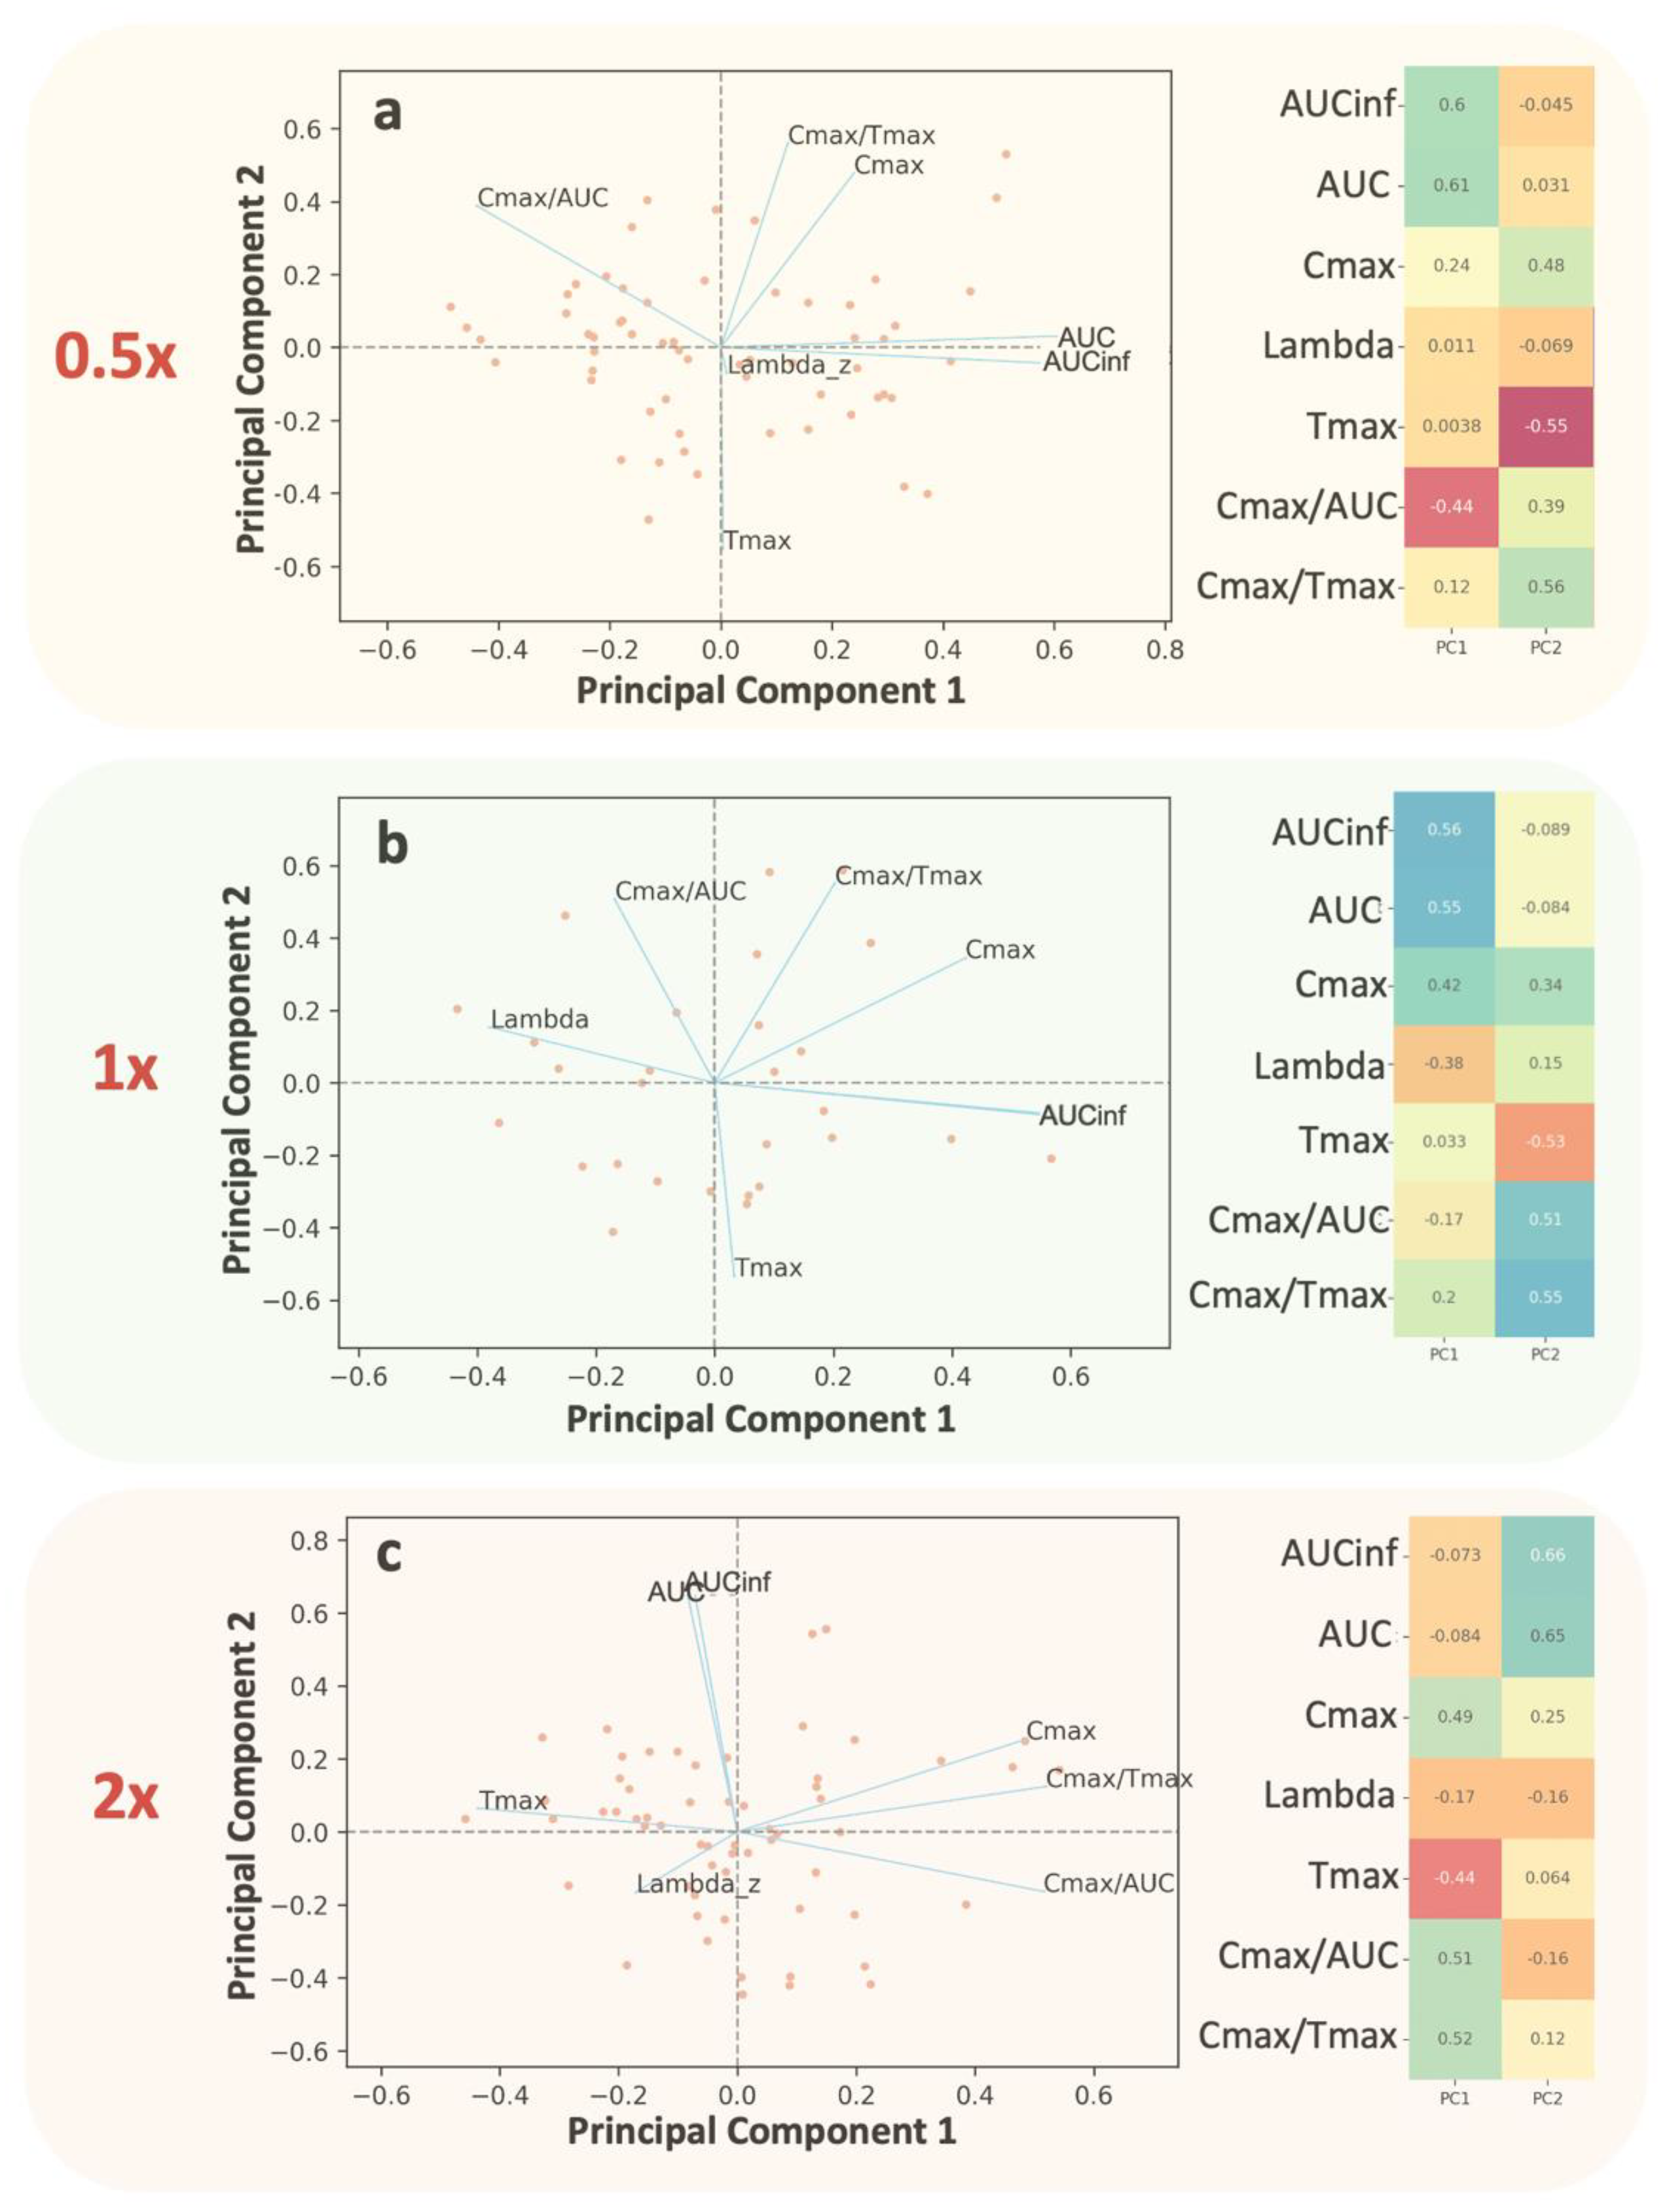
Figure 1): (a) actual data on donepezil obtained from a 2 × 2 BE study in 26 volunteers, and (b) simulated donepezil BE data assuming a slower (0.5x-), similar (1x-), and faster (2x-) absorption rate. An overview of the analyses taken in this study and the main findings are summarized in Table 3. Initially, it was shown, as was expected, that AUC and AUCinf show almost identical behavior. Moreover, Cmax is strongly related to AUC and AUCinf, while Cmax/AUC and Cmax/Tmax are not much related to AUC or AUCinf. Besides, Cmax/AUC and Cmax/Tmax have opposite behavior compared to Tmax because they are spotted in opposite directions relevant to the second principal component (
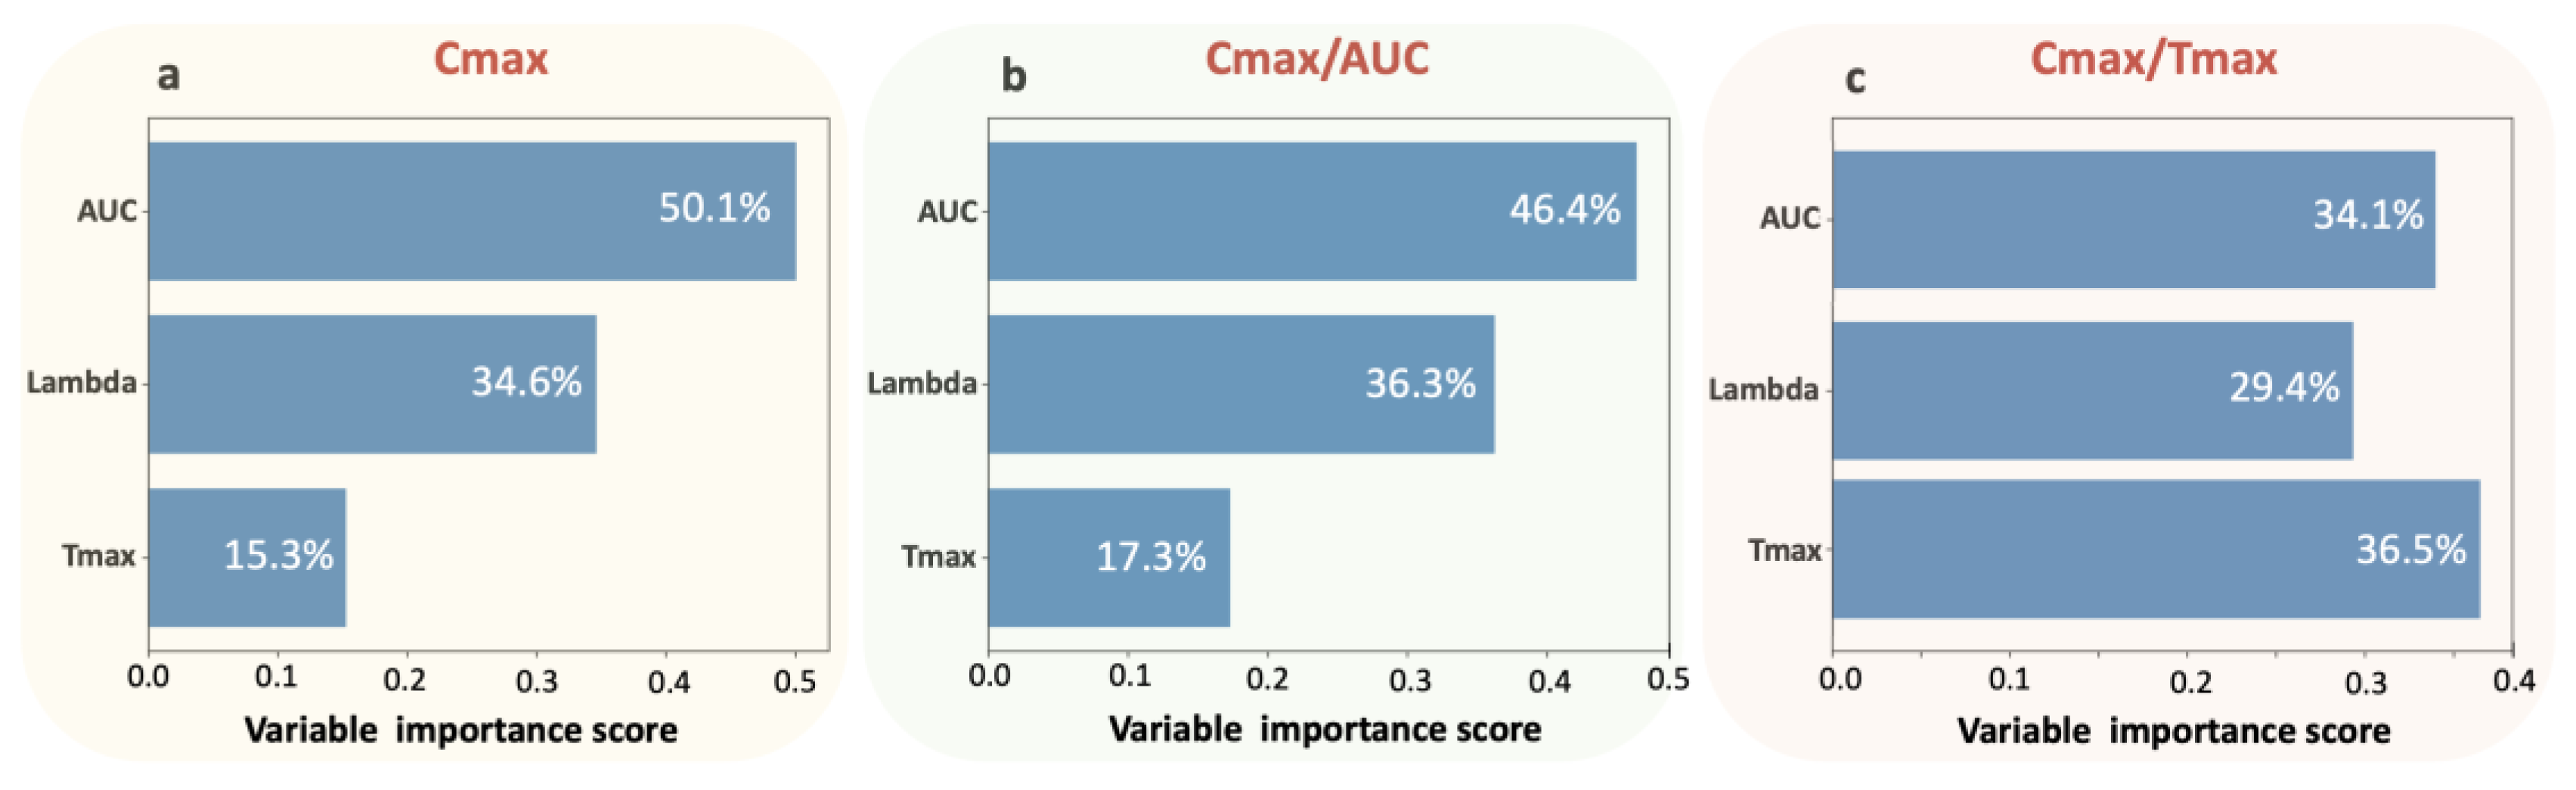
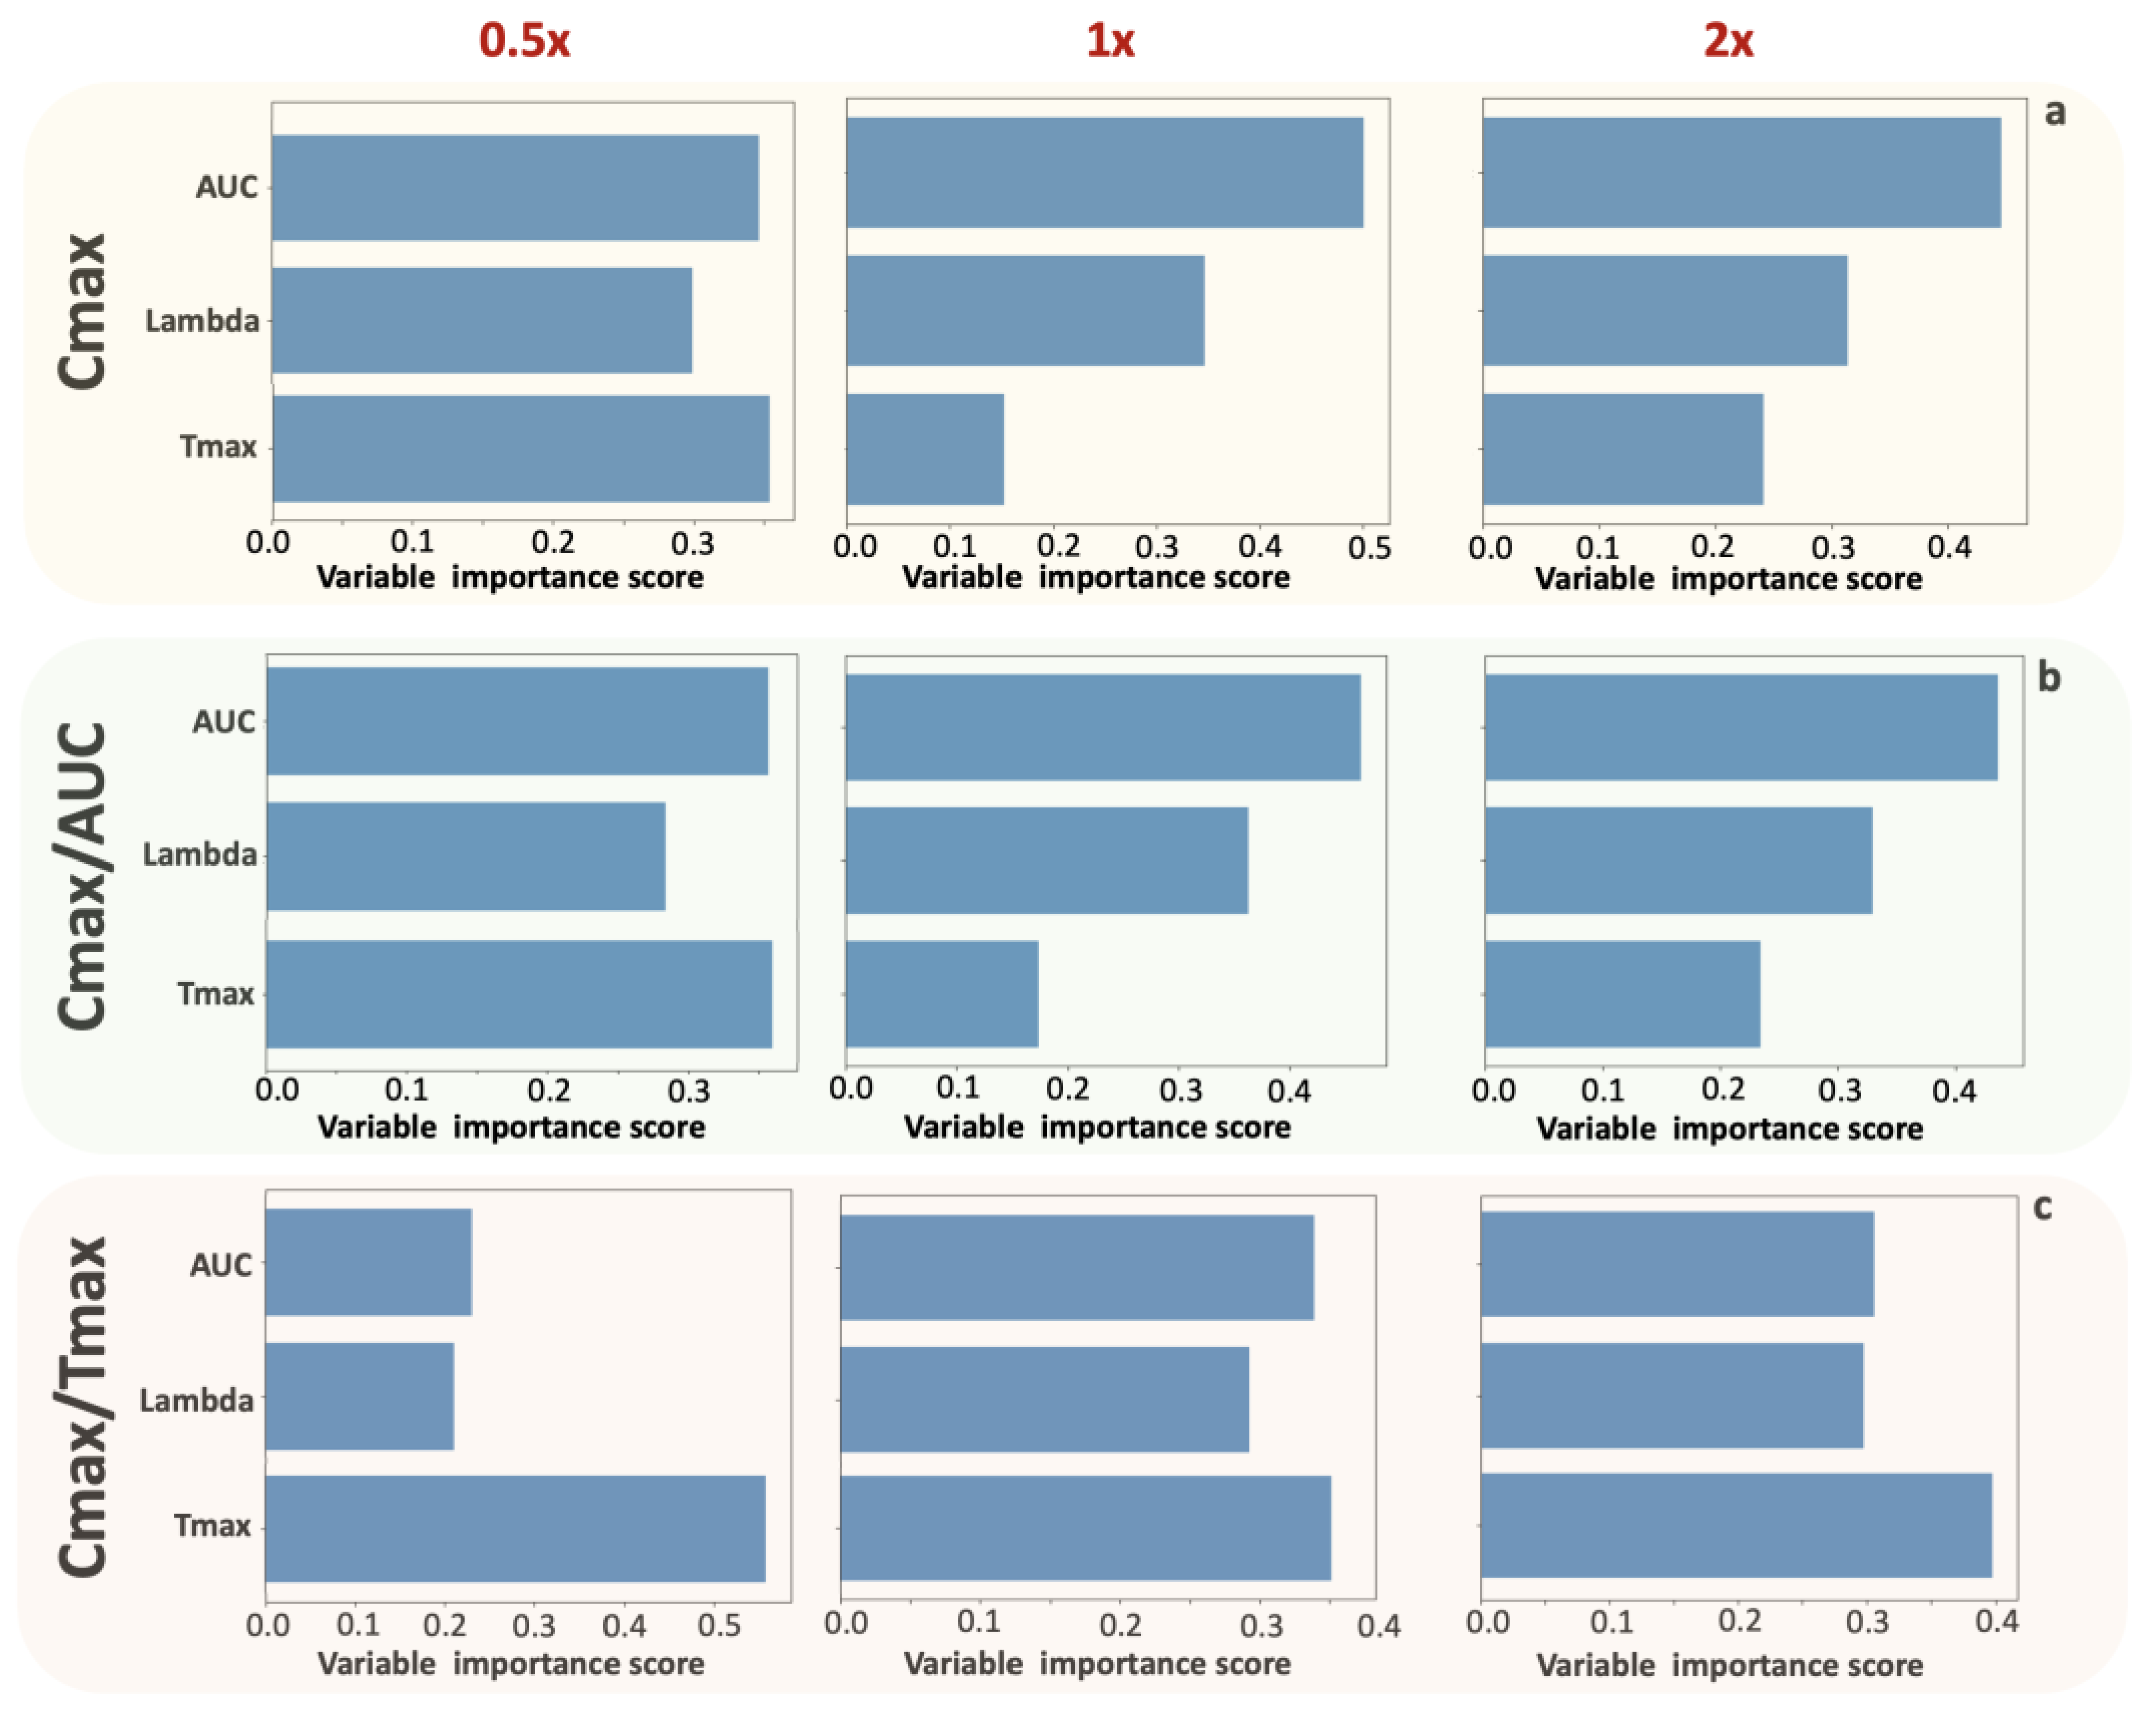
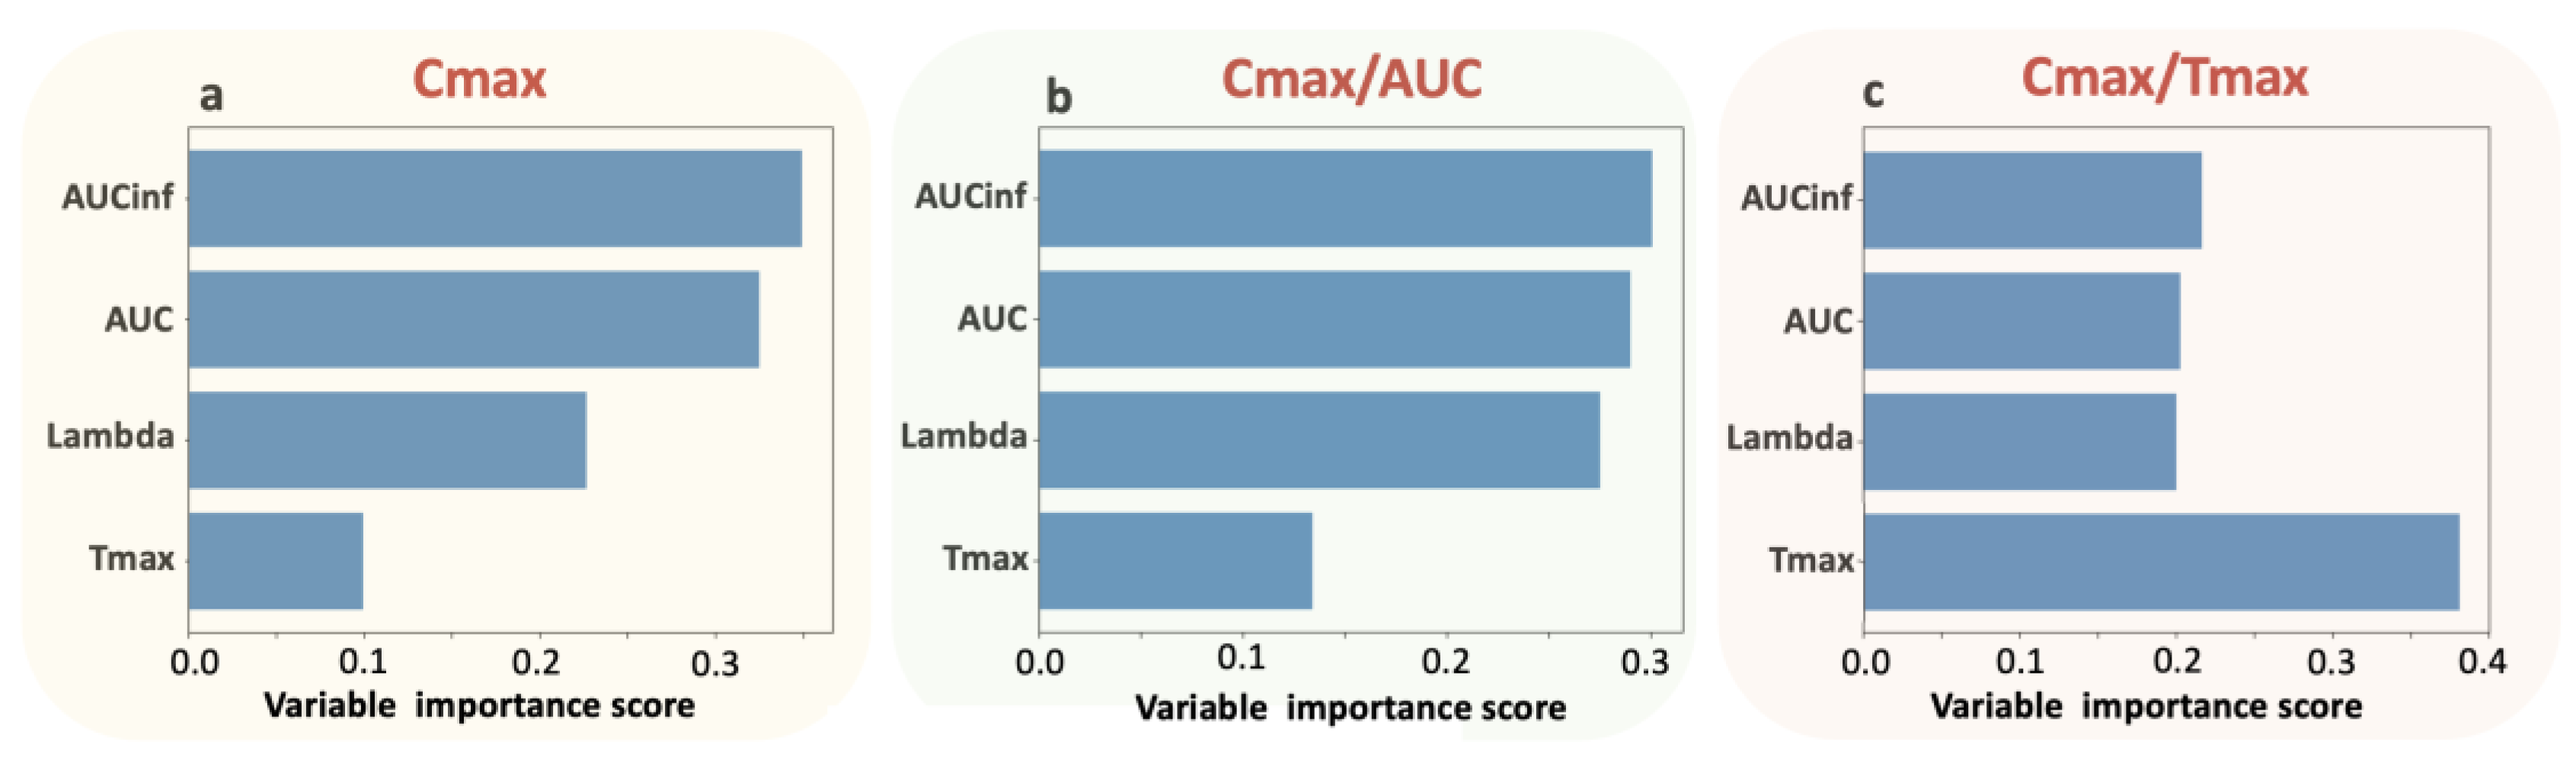
Figure 2). The application of the random forest algorithm showed that the contribution of Tmax properties to the parameters is the least for Cmax, slightly higher for Cmax/AUC, and highest for Cmax/Tmax (Table 3 and Figure 3). The latter implies the “kinetic nature” of the Cmax/Tmax ratio as it better reflects the kinetic properties of absorption rate.
In order to validate the findings from the analysis of actual BE data, simulations were also performed using scenarios with faster or slower absorption rates than those originally estimated from the donepezil BE data. As a result, three donepezil BE datasets were simulated, with N = 26 for each study. All pharmacokinetic properties of donepezil were kept unaltered, except for the absorption rate, and NCA was applied to each simulated dataset (Table 3). The impact of absorption kinetics on the choice of the most suitable PK metric was assessed. The application of PCA to each of the three simulated datasets verified the findings identified in the case of actual BE data (Figure 6). Especially for the simulations in the “1x-” case (Figure 6b), the obtained results are quite similar to those derived from analyzing the actual dataset (Figure 2). Moreover, it was possible to observe that as absorption kinetics became faster, the relationship between AUC (or AUCinf) and the three other metrics (Cmax, Cmax/AUC, and Cmax/Tmax) became less strong (Table 3 and Figure 6). The use of the RF algorithm (Figure 7) verified the findings found in the simple case of actual donepezil data. In addition, RF uncovered the pattern where the contribution of Tmax into Cmax or Cmax/AUC becomes less as absorption kinetics get faster. Similarly, the contribution of Tmax to Cmax/Tmax remains the predominant characteristic under all kinetic conditions.
It should be stated that for the needs of this study, a population PK model of donepezil was developed as an intermediate step (Table 2, Figure 4). Even though the development of a population PK model was not the primary goal of this study, it was necessary in order to simulate BE datasets with different absorption kinetic characteristics and provide additional evidence. The use of ML approaches in the actual data allowed identifying the relationships among the PK variables and the contribution of each one to another. However, the additional use of simulated BE datasets offered the opportunity to verify the previous results and explore the role of absorption rate. Because the donepezil BE data were already available, the rationale way was to create a population model characterizing donepezil kinetics (Table 2, Figure 4) and then use this model to simulate different absorption conditions. This method has the advantage of retaining all donepezil PK parameters from the original dataset in the simulated datasets, whereas only the absorption rate constant was changed. As a result, the absorption rate’s impact could be isolated and assessed in the ML analysis. Setting the absorption rate constant to be “0.5x” and “2x” of what was originally estimated from the NLME analysis was considered a rational choice for slower and faster absorption, respectively. Slower or faster absorption kinetics, compared to those above, would not offer any advantage or alter the results. Moreover, the use of simulated conditions for the actual data (i.e., the “1x-” scenario) allowed to verify the findings obtained from the original dataset.
From the analysis made in this study, it was shown that the metric best reflecting the rate of absorption, among those examined, is the Cmax/Tmax ratio. The latter was found to better reflect the absorption rate, regardless of the absolute kinetic properties of absorption. It should be underlined that Cmax/Tmax is not proposed to be the best measure for absorption rate, but the two machine learning algorithms uncovered its better suitability compared to the other PK metrics explored (e.g., Cmax, Cmax/AUC).
A possible argument against the use of Cmax/Tmax could arise from the fact that the latter relies on Tmax, which is known to have some limitations due to the fact that it is measured on a discrete scale and can be highly variable due to insufficient sampling. For this reason, it was actually stated in the EMA 2001 guideline that Tmax should be analyzed as a discrete attribute using the non-parametric 90% confidence interval [26]. The existing EMA guideline states that a statistical analysis of Tmax, which is only necessary when a rapid release is clinically relevant for the initiation of action or linked to adverse events, should compare the median values and its variability between test and reference products [1]. However, the possible problems due to sampling are counterbalanced with a frequent sampling schedule at early time points, before Tmax, which is actually required by the guidelines [1,2]. In this study, the simulated BE datasets were generated assuming a sampling interval of 15 min in order to avoid adding bias to the estimations of the PK parameters. The frequency of this sampling scheme was adequate not only for the typical case (“1x-”) and the slow absorption (“0.5x-”), but also for the fast absorption scenario (“2x-”). It should be reminded that typically the Tmax of donepezil is anticipated to appear between 3–4 h post dose [27]. The fact that Tmax is a discrete variable, since it is dependent on sampling, has already been addressed in the literature [11,28]. It has been reported that Tmax defines a count process that encompasses the rate of absorption if it is acquired at equally spaced sample periods during the suspected absorption phase. Furthermore, such count data appear to follow the single parameter Poisson distribution, which characterizes the rate of many discrete processes and so provides the appropriate theoretical foundation for comparing two or more formulations for differences in absorption rate. Besides, the sampling schedule at early time points is already frequent, so Tmax can be easily converted into a count variable. These observations have revealed the usefulness of Tmax as an absorption rate measure [11,28].
This study has some limitations, one of which was the application of the machine learning algorithms to one actual dataset. In order to overcome this drawback, the two simulated datasets were generated and analyzed. However, further investigation is required into the performance of the PK metrics in drugs with different pharmacokinetics and in particular different absorption kinetics. Another possible future exploration refers to the analysis of additional PK metrics, either existing or newly proposed, as potential measures for the rate of absorption. The newly proposed Cmax/Tmax ratio was found to have the optimal behavior among those investigated. However, this finding does not exclude the fact that other pharmacokinetic metrics might be more suitable.

5. Conclusions

In this study, the modern tool of machine learning was used to address an old problem from a new perspective. Despite the fact that the limitations of Cmax as an absorption rate parameter have been recognized since its inception more than 30 years ago, Cmax is still used in BE studies. Two machine learning algorithms (principal component analysis and random forest) were used to explore the relationships among the PK parameters and to identify the most suitable metric for absorption rate. One actual and three simulated donepezil BE datasets were utilized. Moreover, for the needs of this study, a robust population PK model of donepezil was developed and further used for generating the three simulated BE datasets. Among the PK metrics explored, a new metric, the Cmax/Tmax ratio, was introduced and investigated together with the existing measures for their usefulness in characterizing absorption rate. The ML analysis showed that the metric best reflecting the rate of absorption was Cmax/Tmax. The latter better reflected the absorption rate, regardless of the absolute kinetic properties of absorption. To the best of knowledge, this is the first study that applies machine learning in the field of bioequivalence.
This study is dedicated to the memory of Professor Laszlo Endrenyi for his outstanding contribution to the fields of bioequivalence and pharmacokinetics.

Funding

This research received no external funding.

Institutional Review Board Statement

Not applicable.

Informed Consent Statement

Not applicable.

Data Availability Statement

Not applicable.

Acknowledgments

The author would like to thank Verisfield UK Ltd. for providing the C-t data used in this computational study.

Conflicts of Interest

The author declares no conflict of interest.

Appendix A

Table A1. Quartiles of the distribution of the Cmax, Cmax/AUC, and Cmax/Tmax estimates from the original bioequivalence dataset of donepezil.
QuartileCmaxCmax/AUCCmax/Tmax
Q113.080.023.85
Q217.200.035.30
Q320.180.038.43
Q1, first quartile; Q2, second quartile (or median); Q3, third quartile.
Table A2. Quartiles of the distribution of the Cmax, Cmax/AUC, and Cmax/Tmax estimates from the three simulated datasets. Simulations were performed assuming three different (mean) absorption rate constant (Ka) values: (a) half of the true Ka estimated from the population modeling, (b) equal to the true Ka, (c) twice the value of the actual Ka.
Absorption Rate Constant: 0.5×
QuartileCmaxCmax/AUCCmax/Tmax
Q110.950.020.94
Q212.310.021.70
Q313.710.023.36
Absorption Rate Constant: 1×
QuartileCmaxCmax/AUCCmax/Tmax
Q114.960.023.14
Q219.080.035.97
Q322.560.0410.35
Absorption Rate Constant: 2×
QuartileCmaxCmax/AUCCmax/Tmax
Q122.520.037.20
Q226.540.0411.37
Q331.220.0519.64
Q1, first quartile; Q2, second quartile (or median); Q3, third quartile.
Figure A1. Scree (elbow) plot to determine the number of principal components (PC).
Applsci 13 00418 g0a1
Figure A2. Variable importance scores for the feature parameters (AUC, AUCinf, lambda, Tmax) of the pharmacokinetic parameters in the case of the actual bioequivalence study. Three random forest models were developed each one referring to Cmax (a), Cmax/AUC (b), and Cmax/Tmax (c).
Applsci 13 00418 g0a2

References

  1. European Medicines Agency 2010; Committee for Medicinal Products for Human Use (CHMP). Guideline on the Investigation of Bioequivalence. CPMP/EWP/QWP/1401/98 Rev. 1/Corr **. London. 20 January 2010. Available online: https://www.ema.europa.eu/en/documents/scientific-guideline/guideline-investigation-bioequivalence-rev1_en.pdf (accessed on 9 November 2022).
  2. Food and Drug Administration (FDA). Guidance for Industry. Bioavailability and Bioequivalence Studies Submitted in NDAs or INDs—General Considerations. Draft Guidance. U.S. Department of Health and Human Services Food and Drug Administration Center for Drug Evaluation and Research (CDER). December 2013. Available online: https://www.fda.gov/media/88254/download (accessed on 9 November 2022).
  3. Niazi, S. Handbook of Bioequivalence Testing (Drugs and the Pharmaceutical Sciences), 2nd ed.; CRC Press, Taylor & Francis Group: Boca Raton, FL, USA, 2014. [Google Scholar]
  4. Karalis, V. Modeling and Simulation in Bioequivalence. In Modeling in Biopharmaceutics, Pharmacokinetics and Pharmacodynamics. Homogeneous and Heterogeneous Approaches, 2nd ed.; Macheras, P., Iliadis, A., Eds.; Springer International Publishing: Cham, Switzerland, 2016; pp. 227–255. [Google Scholar]
  5. Bois, F.; Tozer, T.; Hauck, W.; Chen, M.; Patnaik, R.; Williams, R. Bioequivalence: Performance of several measures of extent of absorption. Pharm. Res. 1994, 11, 715–722. [Google Scholar] [CrossRef] [PubMed]
  6. Reppas, C.; Lacey, L.F.; Keene, O.N.; Macheras, P.; Bye, A. Evaluation of different metrics as indirect measures of rate of drug absorption from extended-release dosage forms at steady-state. Pharm. Res. 1995, 2, 103–107. [Google Scholar] [CrossRef]
  7. Chen, M.; Lesko, L.; Williams, R. Measures of exposure versus measures of rate and extent of absorption. Clin. Pharmacokinet. 2001, 40, 565–572. [Google Scholar] [CrossRef]
  8. Jackson, A. Determination of in vivo bioequivalence. Pharm. Res. 2002, 19, 227–228. [Google Scholar] [CrossRef] [PubMed]
  9. Endrenyi, L.; Tothfalusi, L. Metrics for the evaluation of bioequivalence of modified-release formulations. AAPS J. 2012, 14, 813–819. [Google Scholar] [CrossRef] [PubMed] [Green Version]
  10. Stier, E.; Davit, B.; Chandaroy, P.; Chen, M.; Fourie-Zirkelbach, J.; Jackson, A.; Kim, S.; Lionberger, R.; Mehta, M.; Uppoor, R.; et al. Use of partial area under the curve metrics to assess bioequivalence of methylphenidate multiphasic modified release formulations. AAPS J. 2012, 14, 925–926. [Google Scholar] [CrossRef] [Green Version]
  11. Basson, R.; Cerimele, B.; DeSante, K.; Howey, D. Tmax: An unconfounded metric for rate of absorption in single dose bioequivalence studies. Pharm. Res. 1996, 13, 324–328. [Google Scholar] [CrossRef]
  12. Rostami-Hodjegan, A.; Jackson, P.; Tucker, G. Sensitivity of indirect metrics for assessing “rate” in bioequivalence studies: Moving the “goalposts” or changing the “game”. J. Pharm. Sci. 1994, 83, 1554–1557. [Google Scholar] [CrossRef]
  13. Chen, M. An alternative approach for assessment of rate of absorption in bioequivalence studies. Pharm. Res. 1992, 9, 1380–1385. [Google Scholar] [CrossRef]
  14. Schall, R.; Luus, H. Comparison of absorption rates in bioequivalence studies of immediate release drug formulations. Int. J. Clin. Pharmacol. Ther. Toxicol. 1992, 30, 153–159. [Google Scholar]
  15. Lacey, L.; Keene, O.; Duquesnoy, C.; Bye, A. Evaluation of different indirect measures of rate of drug absorption in comparative pharmacokinetic studies. J. Pharm. Sci. 1994, 83, 212–215. [Google Scholar] [CrossRef] [PubMed]
  16. Endrenyi, L.; Al-Shaikh, P. Sensitive and specific determination of the equivalence of absorption rates. Pharm. Res. 1995, 12, 1856–1864. [Google Scholar] [CrossRef]
  17. Tothfalusi, L.; Endrenyi, L. Without extrapolation, Cmax/AUC is an effective metric in investigations of bioequivalence. Pharm. Res. 1995, 12, 937–942. [Google Scholar] [CrossRef] [PubMed]
  18. Schall, R.; Luus, H.G.; Steinijans, V.W.; Hauschke, D. Choice of characteristics and their bioequivalence ranges for the comparison of absorption rates of immediate-release drug formulations. Int. J. Clin. Pharmacol. Ther. 1994, 32, 323–328. [Google Scholar] [PubMed]
  19. Shamout, F.; Zhu, T.; Clifton, D.A. Machine Learning for Clinical Outcome Prediction. IEEE Rev. Biomed. Eng. 2021, 14, 116–126. [Google Scholar] [CrossRef] [PubMed]
  20. James, G.; Hastie, T.; Tibshirani, R.; Witten, D. An Introduction to Statistical Learning with Applications in R, 7th ed.; Springer: Berlin/Heidelberg, Germany, 2017. [Google Scholar]
  21. Halko, N.; Martinsson, P.G.; Tropp, J.A. Finding structure with randomness: Probabilistic algorithms for constructing approximate matrix decompositions. SIAM Rev. 2011, 53, 217–288. [Google Scholar] [CrossRef]
  22. Savic, R.; Lavielle, M. Performance in population models for count data, part II: A new SAEM algorithm. J. Pharmacokin. Pharmacodyn. 2009, 36, 367–379. [Google Scholar] [CrossRef] [Green Version]
  23. Noetzli, M.; Guidi, M.; Ebbing, K.; Eyer, S.; Wilhelm, L.; Michon, A.; Thomazic, V.; Stancu, I.; Alnawaqil, A.M.; Bula, C.; et al. Population pharmacokinetic approach to evaluate the effect of CYP2D6, CYP3A, ABCB1, POR and NR1I2 genotypes on donepezil clearance. Br. J. Clin. Pharmacol. 2014, 78, 135–144. [Google Scholar] [CrossRef] [Green Version]
  24. Ette, E.I.; Williams, P.J. Population pharmacokinetics I: Background, concepts, and models. Ann. Pharmacother. 2004, 38, 1702–1706. [Google Scholar] [CrossRef]
  25. Mahmood, I.; Duan, J. Population pharmacokinetics with a very small sample size. Drug Metabol. Drug Interact. 2009, 24, 259–274. [Google Scholar] [CrossRef]
  26. European Medicines Agency; Committee for Proprietary Medicinal Products (CPMP). Note for Guidance on the Investigation of Bioavailability and Bioequivalence. CPMP/EWP/QWP/1401/98. London, 26 July 2001. Available online: https://www.ema.europa.eu/en/documents/scientific-guideline/note-guidance-investigation-bioavailability-bioequivalence_en.pdf (accessed on 9 November 2022).
  27. Donepezil Hydrochloride 10 mg Film-Coated Tablets. Summary of Product Characteristics (SmPC). Available online: https://www.medicines.org.uk/emc/product/6140/smpc#gref (accessed on 9 November 2022).
  28. Basson, R.P.; Ghosh, A.; Cerimele, B.J.; DeSante, K.A.; Howey, D.C. Why rate of absorption inferences in single dose bioequivalence studies are often inappropriate. Pharm. Res. 1998, 15, 276–279. [Google Scholar] [CrossRef] [PubMed]
Figure 1. Strategy of the analysis. The basic purposes, actions, and software utilized for each phase of the analysis. Actual (steps: A1 and A2) and simulated (steps: B1–B4) bioequivalence data are used.
Applsci 13 00418 g001
Figure 2. Principal component analysis of the pharmacokinetic parameters from the actual bioequivalence study. Left panel: Biplot of the two principal components showing the individual scores and the loadings (blue lines) of the pharmacokinetic parameters. Right panel: Loading values for the two initial principal components.
Applsci 13 00418 g002
Figure 3. Variable importance scores for the feature parameters (AUC, lambda, Tmax) of the actual bioequivalence study. Three random forest models were developed each one referring to Cmax (a), Cmax/AUC (b), and Cmax/Tmax (c).
Applsci 13 00418 g003
Figure 4. Goodness of fit plots for the finally selected population pharmacokinetic model for donepezil. (a) Visual predictive check plot where the blue lines show the 10th, 50th, and 90th percentiles of the empirical data, while the shaded areas represent the anticipated 90% confidence intervals. A number of 1000 Monte Carlo simulations were utilized. (b) Individual observed vs. predicted individual concentrations of donepezil. Closed circles refer to (predicted, observed) pairs, solid lines denote the ideal condition of unity (i.e., y = x), and dotted lines represent the 90% prediction interval.
Applsci 13 00418 g004
Figure 5. Simulated concentration vs. time profiles of donepezil using three different absorption rate constant average (Ka) values: (a) half of the true Ka estimated from the population modeling, (b) equal to the true Ka, (c) twice the value of the actual Ka. In each group, 26 subjects were generated in a 2 × 2 crossover bioequivalence study, while the sampling scheme was assumed to take place every 15 min. With the exception of Ka, all other pharmacokinetic parameters were those derived from the population modeling.
Applsci 13 00418 g005
Figure 6. Principal component analysis of the three simulated bioequivalence studies. Depending on the assumed absorption rate constant (Ka), PCA was applied separately the following three cases: (a) Setting Ka equal to the half of the true Ka (i.e., 0.5x-), (b) equal to the true Ka (i.e., 1x-), (c) twice the value of the actual Ka (i.e., 2x-). The left panels refer to the biplot of the two principal components (PC), where the individual scores and the loadings (blue lines) of the pharmacokinetic parameters are shown. The right panels denote the “loadings” for the two first PCs.
Applsci 13 00418 g006
Figure 7. Variable importance scores for the feature parameters for the simulated bioequivalence studies. The response variable was either Cmax (a), Cmax/AUC (b), or Cmax/Tmax (c). Three levels of the simulated absorption rate constant were assumed: 0.5x, 1x, and 2x. Thus, in total, nine Random Forest models were developed.
Applsci 13 00418 g007
Table 1. Pearson correlation coefficients for the bivariate relationships between the pharmacokinetic parameter estimates of the actual donepezil bioequivalence study.
Correlation Coefficient
AUCinfAUCCmaxTmaxCmax/AUCCmax/TmaxLambda
AUCinf1.0000.9860.5880.106−0.4320.209−0.478
AUC0.9861.0000.6320.114−0.4250.236−0.375
Cmax0.5880.6321.000−0.1420.380.617−0.213
Tmax0.1060.114−0.1421.000−0.341−0.719−0.137
Cmax/AUC−0.432−0.4250.38−0.3411.0000.4180.201
Cmax/Tmax0.2090.2360.617−0.7190.4181.000−0.011
Lambda−0.478−0.375−0.213−0.1370.201−0.0111.000
Table 2. Parameter estimates of the final population pharmacokinetic model of donepezil.
Parameters (Units)EstimateStandard ErrorRelative Standard Error (%)
Fixed Effects
Ka (h−1)0.180.016.2
Cl/F (mL/h)14,466.77785.845.43
V1/F (mL)44,386.599454.3421.3
Q/F (mL/h)80,120.115805.657.25
V2/F (mL)905,886.4259,624.176.58
Random Effects
omega_Tlag0.01022.5
omega_ka0.070.0118.2
omega_Cl0.270.0414.6
omega_V11.160.1815.5
omega_Q0.250.0520.1
omega_V20.310.0516.4
Error Model Parameters
a0.170.0212.5
b0.220.013.77
Ka: absorption rate constant, F: bioavailable fraction of dose, Cl/F: apparent clearance, V1/F: apparent volume of distribution of the central compartment, V2/F: apparent volume of distribution of the peripheral compartment, Q/F: apparent inter-compartment clearance, omega: between-subject variability for each pharmacokinetic parameter, a: additive component of the residual error model, b: proportional component of the error model.
Table 3. An overview of the analyses took place in this study (see Figure 1) and the main findings.
PurposeActionMain Findings
A. Identify Relationships Among the PK Variables
A1. Identify relationships among the PK variablesNCA to the dataset of Donepezil BE study- Estimate the PK parameters (Cmax, AUC, AUCinf, Tmax, lambda, Cmax/AUC, Cmax/Tmax) from the C-t data
PCA to the calculated PK parameters- AUC and AUCinf show almost identical behavior
- Cmax is strongly related to AUC (and AUCinf)
- Cmax/AUC and Cmax/Tmax are not much related to AUC (or AUCinf)
- Cmax/AUC and Cmax/Tmax have an opposite behavior compared to Tmax
Correlation analysis of the PK parameters- Bivariate correlations verify the abovementioned findings
A2. Contribution of PK variables to Cmax, Cmax/AUC, Cmax/TmaxRandom forest to Cmax, Cmax/AUC, Cmax/TmaxThe contribution of Tmax properties into the parameters is:
- the least for Cmax
- slightly higher for Cmax/AUC
- the most for Cmax/Tmax
- It appears that Cmax/Tmax reflects better the kinetic properties of absorption rate
B. Identify relationships among the PK variables, under different absorption kinetic conditions
B1. Develop a population pharmacokinetic model for donepezilApply non-linear mixed effect modeling to the actual C-t data of donepezil (from the BE study)A robust population pharmacokinetic model is developed for donepezil
B2. Simulate different absorption kineticsSimulate three 2 × 2 BE datasets, by setting the absorption rate constant at 0.5x-, 1x-, 2x- the observed value- Three different BE datasets, with N = 26 for each study, were simulated
- All pharmacokinetic properties of donepezil were kept unaltered, except from the absorption rate constant
- The kinetics of slower (0.5x-), the same (1x-), and faster (2x-) absorption were simulated
- The impact of absorption kinetics, on the choice of the most suitable PK metric, was assessed
B3. Identify relationships among the PK variablesNCA to each simulated dataset - Estimate the PK parameters (Cmax, AUC, AUCinf, Tmax, lambda, Cmax/AUC, Cmax/Tmax) for each simulated dataset
PCA to each of the three simulated datasets- The findings identified in A1 are verified
- As absorption kinetics becomes faster, the relationship between AUC (or AUCinf) and the three other metrics (Cmax, Cmax/AUC, Cmax/Tmax) becomes less strong
B4. Contribution of PK variables to Cmax, Cmax/AUC, Cmax/TmaxRandom forest to Cmax, Cmax/AUC, Cmax/Tmax for each of the 3 simulated datasets (0.5x-, 1x-, 2x-)- Verified the findings identified in A2
- As absorption kinetics becomes faster, the contribution of Tmax into Cmax or Cmax/AUC becomes less
- As absorption kinetics becomes faster, the contribution of Tmax into Cmax/Tmax remains the predominant characteristic
- Cmax/Tmax reflects better the kinetic properties of absorption rate, regardless the kinetic properties of absorption
BE: bioequivalence, PK: pharmacokinetic, NCA: non-compartmental analysis, PCA: principal component analysis.
Disclaimer/Publisher’s Note: The statements, opinions and data contained in all publications are solely those of the individual author(s) and contributor(s) and not of MDPI and/or the editor(s). MDPI and/or the editor(s) disclaim responsibility for any injury to people or property resulting from any ideas, methods, instructions or products referred to in the content.

