
A Study on the Prediction of Electrical Energy in Food Storage Using Machine Learning

Department of Plant and Food Sciences, Sangmyung University, Cheonan 31066, Republic of Korea
Appl. Sci. 2023, 13(1), 346; https://doi.org/10.3390/app13010346
Submission received: 8 December 2022
/
Revised: 24 December 2022
/
Accepted: 24 December 2022
/
Published: 27 December 2022
(This article belongs to the Topic Machine and Deep Learning)
Abstract
:Featured Application
In the future, the application of this study can be used to optimize the electrical energy of various food processing machines using machine learning technology.
Abstract
This study discusses methods for the sustainability of freezers used in frozen storage methods known as long-term food storage methods. Freezing preserves the quality of food for a long time. However, it is inevitable to use a freezer that uses a large amount of electricity to store food with this method. To maintain the quality of food, lower temperatures are required, and therefore more electrical energy must be used. In this study, machine learning was performed using data obtained through a freezer test, and an optimal inference model was obtained with this data. If the inference model is applied to the selection of freezer control parameters, it turns out that optimal food storage is possible using less electrical energy. In this paper, a method for obtaining a dataset for machine learning in a deep freezer and the process of performing SLP and MLP machine learning through the obtained dataset are described. In addition, a method for finding the optimal efficiency is presented by comparing the performances of the inference models obtained in each method. The application of such a development method can reduce electrical energy in the food manufacturing equipment related industry, and accordingly it will be possible to achieve carbon emission reductions.
1. Introduction
The use of industrial refrigeration technology for food preservation is known to be an efficient and widely used technology from crop harvesting to final consumption by customers. The transport systems to operate these cold chain systems must maintain optimal food storage temperatures to ensure optimal safety and high-quality shelf life. The sustainability of cooling systems is also increasingly considered due to their excellent properties for preserving food. When considering the sustainability of a cold chain system, an approach from a total cost aspect is required. For example, maintaining lower temperatures for food preservation may require more energy consumption, but it can significantly extend shelf life and reduce waste, so energy costs are high but environmental costs are low. Thus, it can lead to a sustainable system [1]. The technology used for long-running cooling storage systems is mostly based on a vapor compression cooling system to generate cold air. The vapor compression cycle method requires a considerable amount of electrical energy. In particular, if an appropriate energy-efficient design is not implemented in the storage space, the energy consumption increases.
Refrigerators, which play an important role in terms of household appliances and are used as the most efficient method to store food, account for a large portion of electrical energy consumption in the home, with a rate of 14–19%. Therefore, in a reality where resource depletion and global warming are reaching serious levels, refrigerator energy efficiency has emerged as an important issue in the efficient management of electrical energy in the home [2].
According to the research results of Gutberlet [3], it was concluded that improving the energy efficiency of household refrigerators can bring significant energy savings, and it was estimated that if ecologically beneficial recycling designs and energy label policies were successfully implemented, they could save 6 TWh of energy per year. Brito [4] selected external temperature, enclosure, insulation, door opening time, etc., as parameters that affect thermal energy gain, and energy consumption was simulated from the point of the design of the cooling chamber in order to organize and implement the correct efficiency measurement method for production facilities using cold storage. In addition, a methodology for optimizing energy consumption was developed by applying the results.
Sakallı [5] reported an experimental study considering the parameters affecting the percentage of operating time in the freezer compartment of a domestic refrigerator. In the experiment, it was confirmed that the energy consumption of the refrigerator changes according to parameters such as the evaporator temperature, air flow rate, insulation, and internal volume adjustment, and a mathematical model calculated based on these results was presented. Meneghetti [6] conducted simulations that also reflected the influence of the surface material and the internal volume of the refrigerator compartment to create a sustainable design for the automated refrigeration warehouse. To minimize the total annual cost of a refrigerated automatic storage facility, a model was developed that considers the influence of the temperature of the stored food and the energy loss caused by opening the door during operation. By applying the storage temperature and incoming product temperature using the model presented in this method, it is possible to analyze and optimize the impacts of actual operation variables on costs. Through this method, the energy use and carbon dioxide emissions of the entire food supply chain were controlled, and the storage facility properties of the supply chain design model were properly evaluated, so the entire cold chain system was able to be optimized.
Yilmaz [7] studied the effects of the cold storage capacity and various refrigerants on the total power consumption of the cooling system and the payback period, according to the capacity design, in order to design a sustainable cold storage warehouse. According to the results, it was confirmed that the calculated power consumption per unit volume decreased as the capacity increased. It was found that the larger the capacity, the faster the profit was able to be recovered from the investment in the refrigerated warehouse.
Tian [8] reported that large-scale cold storage, which accounts for about 80% of China’s total cold storage volume, accounts for more than 60% of the refrigeration energy demand used in buildings, so optimizing refrigeration energy consumption can provide incentives for decarbonization. To do this, an equation was created by measuring the internal cooling load and the thermal energy penetrating from the outside using the 3R2C (composed of three resistances and two capacitances) heat transfer modeling method, and the transient prediction of the energy consumption of the building and thermal modeling were studied using this equation.
Nunes [9] developed an energy estimation method to evaluate the energy efficiency of the cooling process used during food manufacturing and storage in Portugal. This method was designed with parameters such as the amounts of raw materials processed per year, the annual energy consumption, and the volume of the cooling chamber. In order to create this prediction tool, a database was built by receiving data from 87 agri-food companies, including 33 meat processing factories, 31 dairy factories, and 23 horticultural orchard farms on the central coast of Portugal, and a prediction program was created based on these data. In order to verify the significance of this prediction tool, it was applied to three other companies.
Using the Taguchi methodology, Mukhopadhyay [10] studied the optimal design through a heat gain measurement based on the parameters of the side wall insulation thickness, side wall area, and roof insulation thickness factor of the cold storage.
Hovgaard [11] proposed a management technique using model predictive control (MPC) to make model predictions for efficient and flexible power consumption in cooling systems. It was estimated that if this technique was applied to a supermarket refrigeration system, significant power savings of 9–30% could be achieved. MPC was able to select the optimal cooling strategy from various predicted results. For example, food with a heat capacity was designed to be transported to another location within a specified time without wasting energy while maintaining its temperature within a specified range. Importantly, it was said that the moving range setting was selected within the limit that does not affect food quality.
To optimize energy traditionally, a method of improving hardware, a method by structure design, and a method of statistical analysis of data and a method of reflecting it in design have been used, but looking at recent research papers, a prediction method based on machine learning has been reported. This trend started in 2016, when AlphaGo, developed by Google’s (Menlo Park, CA, USA) Deep Mind, beat Lee Se-dol (9th Dan) in Go [12]. After the confrontation of the century, all industries paid considerable attention to deep-learning-based artificial intelligence, and many experiments were conducted to apply it to industries in each unique field. This is also being attempted throughout the cold chain industry related to food storage and transportation [13].
In order to reduce the energy consumption of cooling storage in the past, a mechanical method of simply controlling the frequency of the compressor to reduce power consumption was used, but Kim [14] presented reported that aimed to reduce the power consumption of refrigeration equipment by using machine learning techniques based on data obtained from the IoT and consequently reduce the carbon energy footprint for food retailers. To implement this method, the temperature measured by connecting digital sensors was transmitted to a cloud server through a wireless network, and it was proven that optimal operating conditions could be created through the machine learning of cloud data.
Artificial intelligence will be able to be used not only for energy optimization in food refrigeration stores but also for maintaining food quality. Through reviews of many papers, Loisel [15] examined whether it was possible to solve the problem of microbial contamination that may occur during the cold chain process through artificial intelligence. In the review, various techniques on how to obtain cold chain system data were summarized, and through the data obtained in this method, several suggestions were made about the possibility of applying artificial intelligence in cold chain break analysis. Through these methods, it was argued that temperature control in the cold chain system was able to reduce food waste and health risks, and the application of artificial intelligence was essential to ensure the quality of food for consumers. Therefore, it was said that, in the long term, data analysis based on machine learning methods can enrich knowledge about cold chain break, optimize cold chain management, reduce food waste and operating costs, and ensure consumer safety. In addition, it was also used in the field of detecting or diagnosing failure in refrigeration systems using machine learning algorithms [16], and food drying model characteristics were able to be predicted through machine learning in food dryers. Microstructures during drying could be predicted through the prediction model, and it was also utilized for change characterization and process parameter optimization [17].
As such, the use of artificial intelligence in the field of food refrigeration and frozen storage is gradually increasing, and the final goal to be achieved through this is to lower the cost to the environment. This study aims to verify the similarity with actual results through the inference model obtained when machine learning was performed in two different techniques using data studied in the past and, through this, to prove that the optimization design of electrical energy consumption is possible.
2. Materials and Methods
2.1. Freezers and Data Acquisition Devices
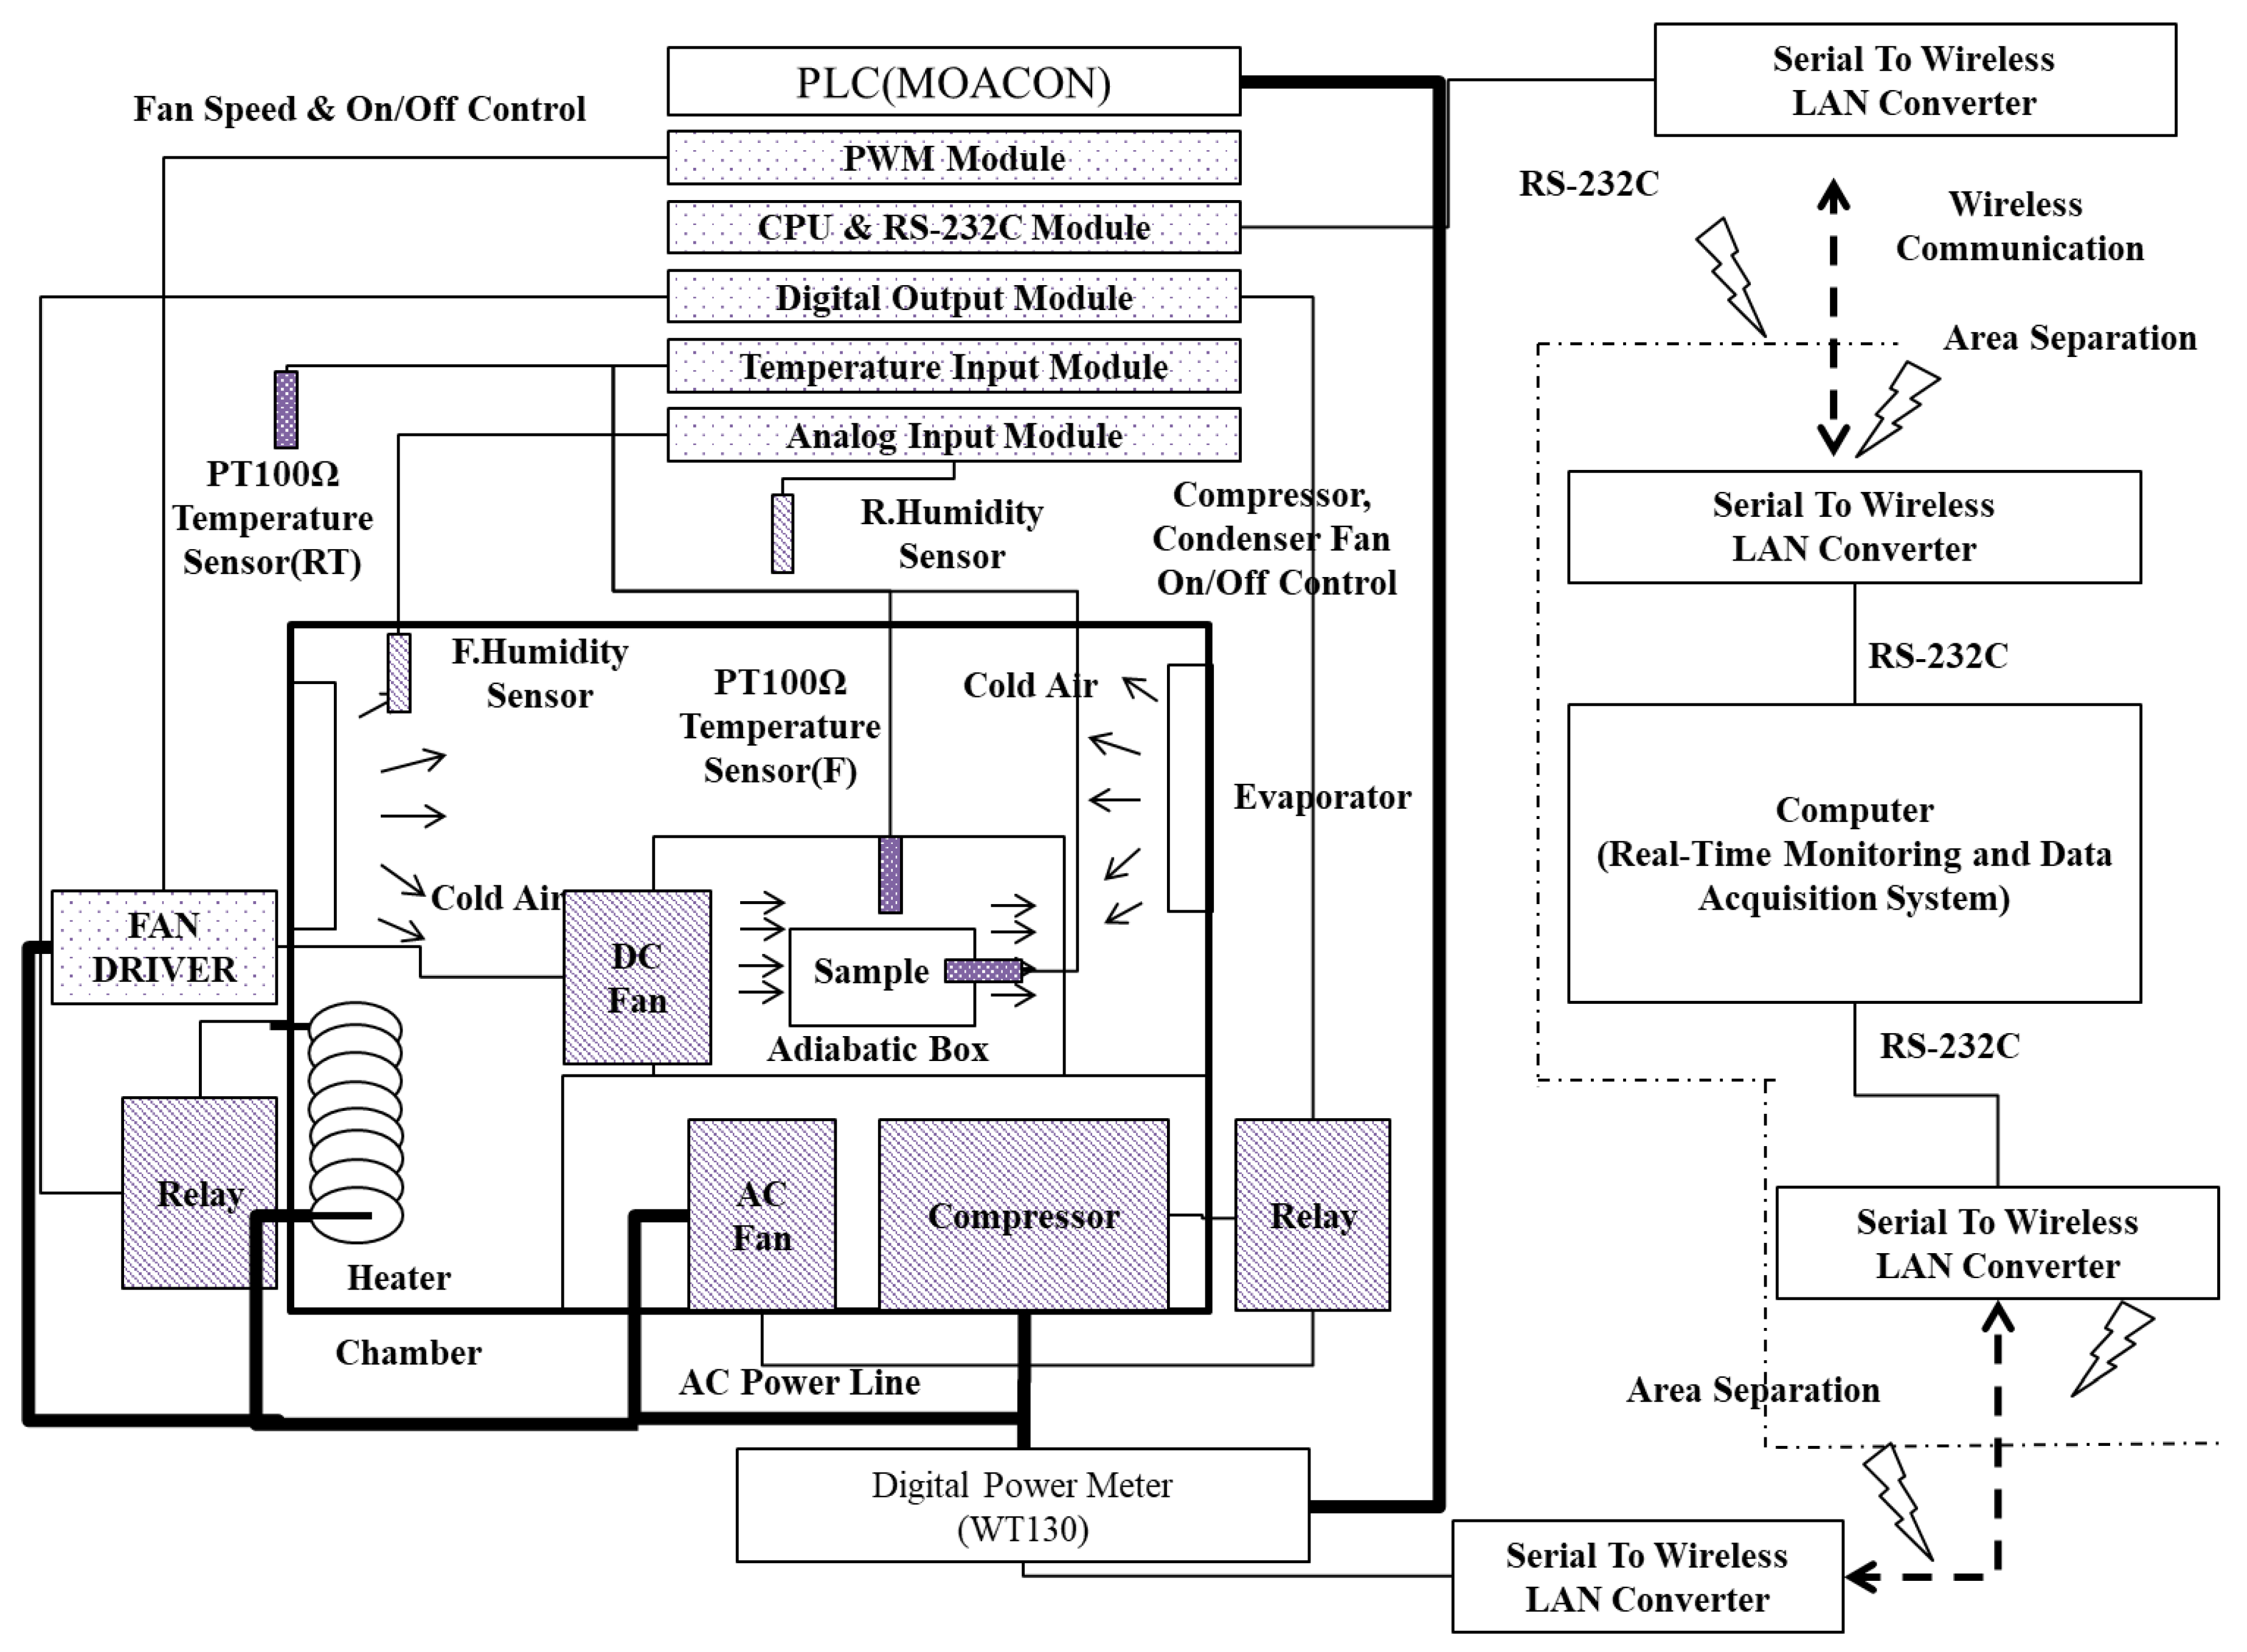
To measure and verify the data, an FD-170-SF cryogenic freezer (Unique daesung, Sungdong-gu, Seoul, Republic of Korea) was modified and used, as shown in Figure 1. The equipment added to control environmental variables and to obtain data from designed test cases was as follows: A MOACON PLC (Compile technology, Guro-gu, Seoul, Republic of Korea) was used for programming control, and a D12E-24PH (Nidec, Muko-shi, Kyoto, Japan) BLDC fan was used for air volume control. A CSW-H80 (Sollae system, Michuhol-gu, Incheon, Republic of Korea) was used to convert and transmit RS-232C communication to Wi-Fi, and an ePS80WL (Fujitsu, Minato-ku, Tokyo, Japan) power supply was used to variably supply BLDC fan power. To measure electrical energy, a WT130 (Yokogawa, Musashino, Tokyo, Tokyo) was used.
2.2. Software Development
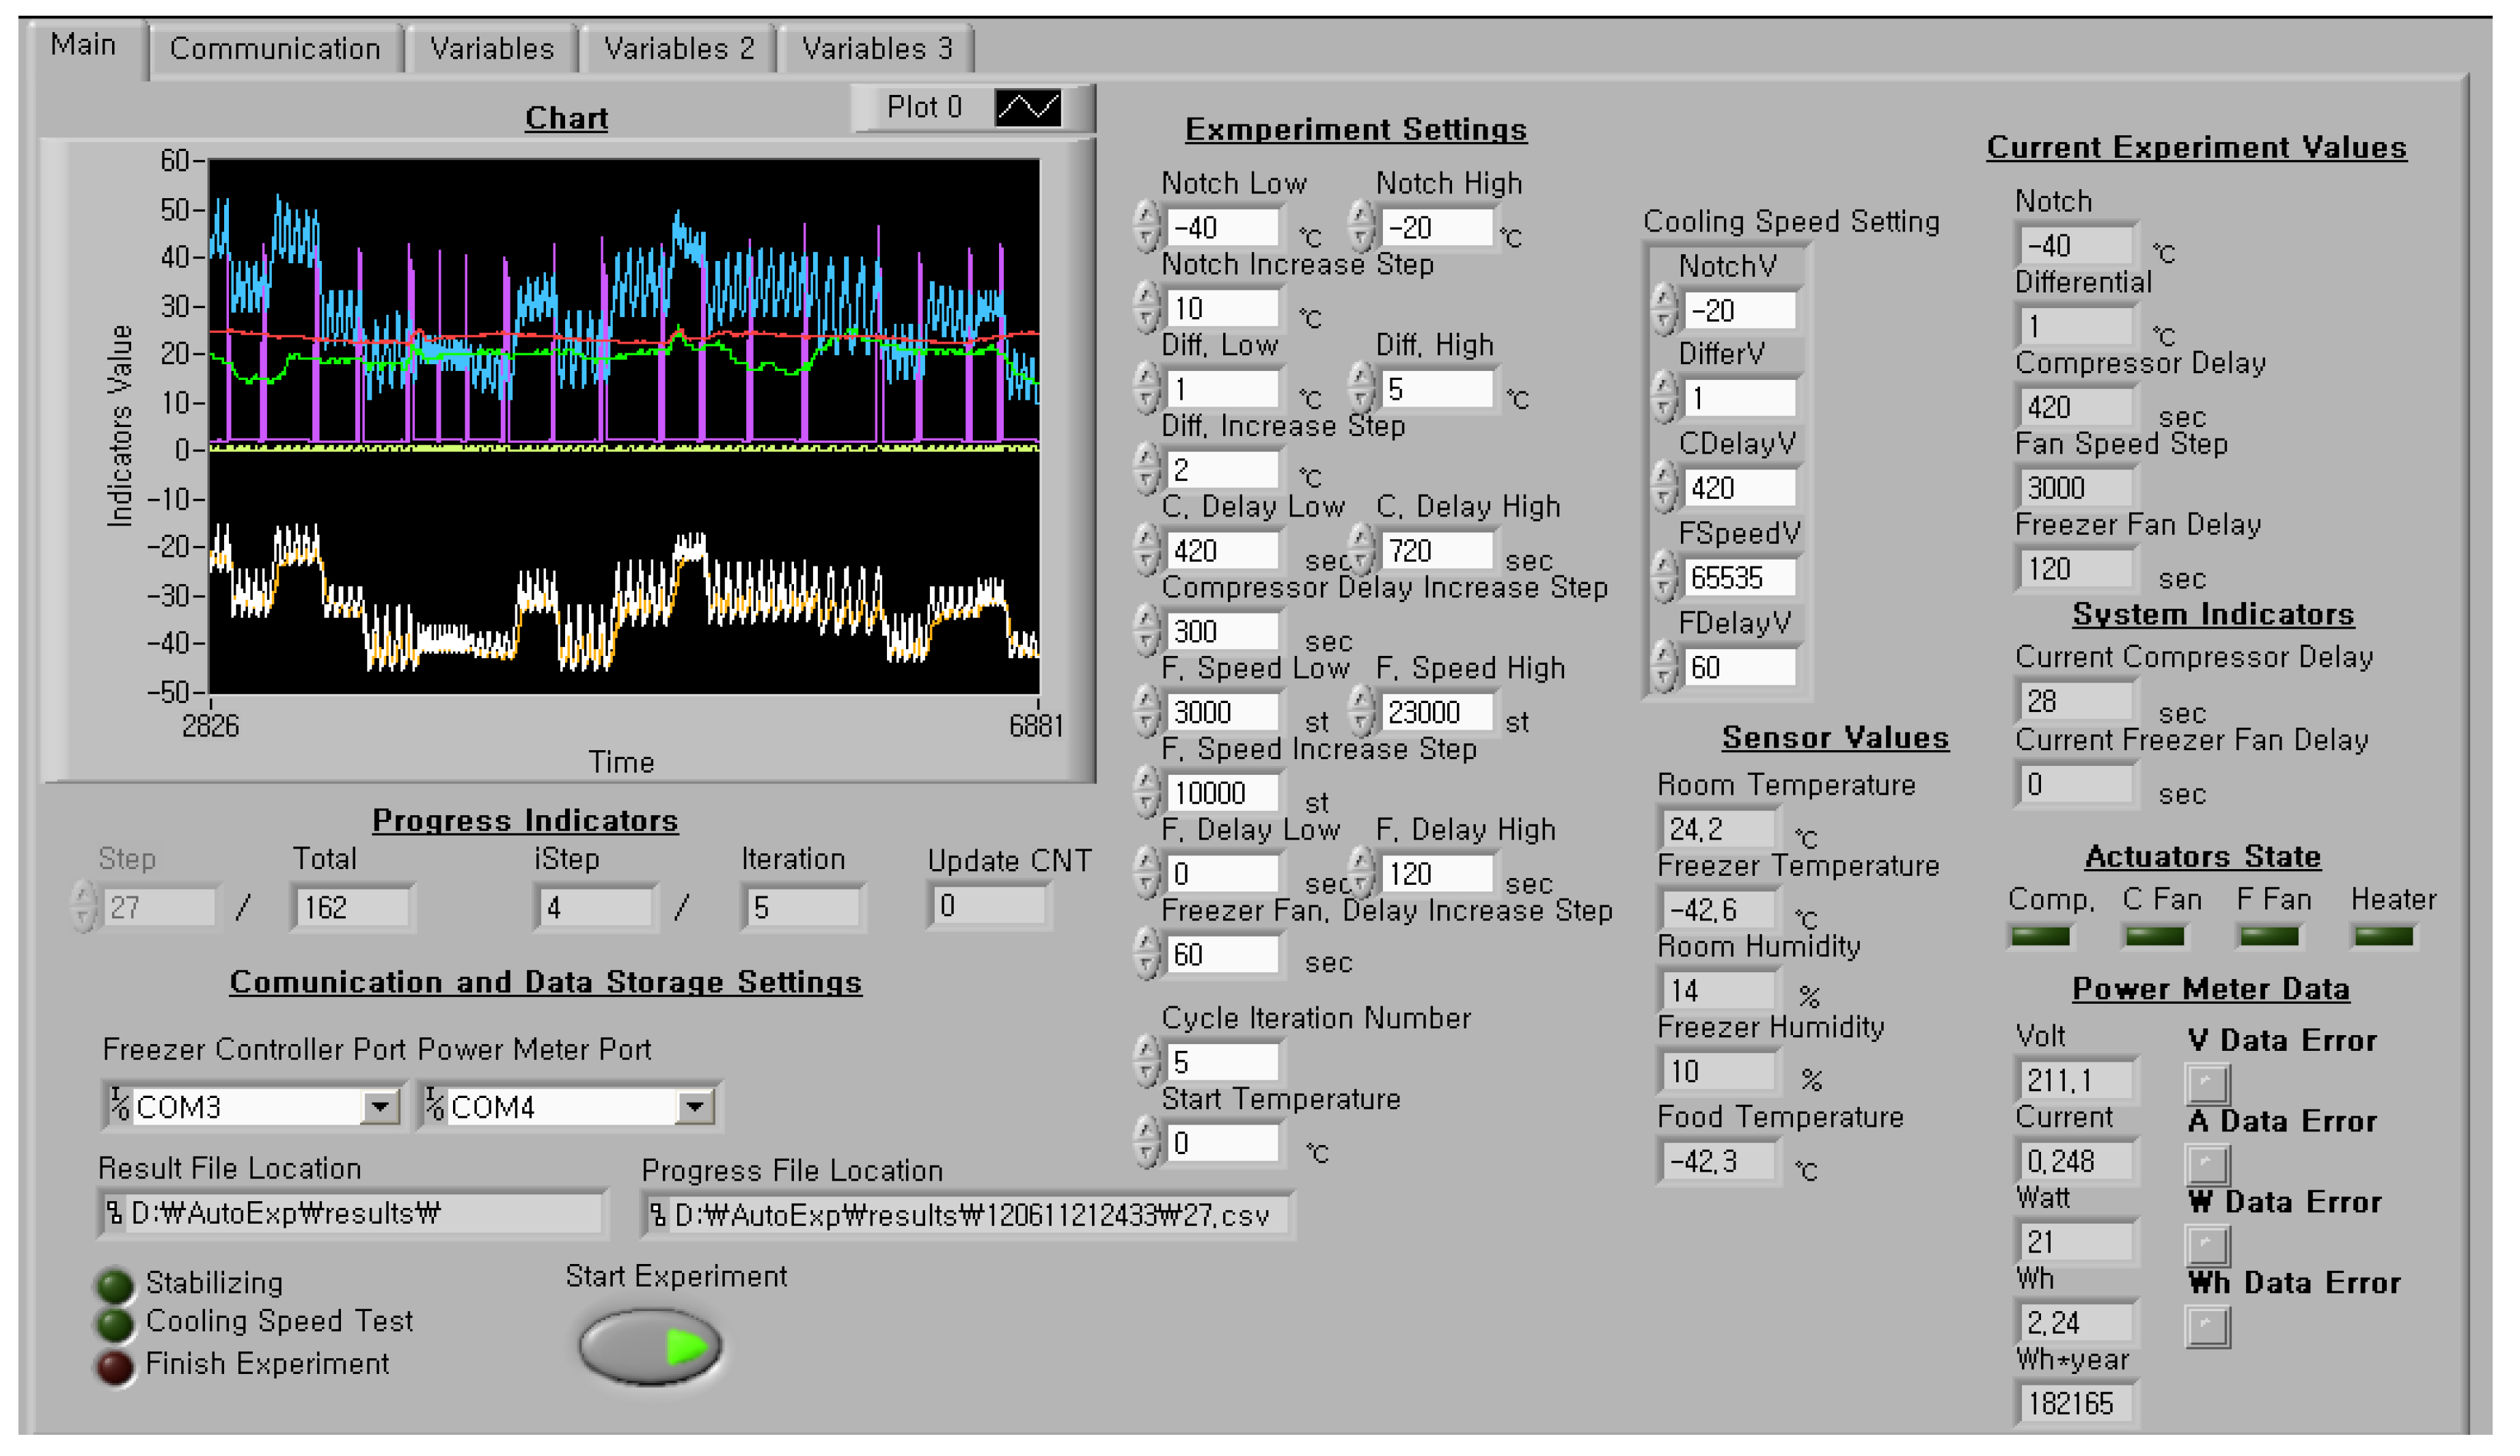
A test automation program that runs unmanned tests and collects test case data was developed using LabView (Version 2013, National Instruments, Austin, TX, USA). LabView is one of the most popular and widely used graphical programming environments in the engineering community [19]. The developed test automation program automatically performed planned tests and collected vast amounts of data until the test schedule was completed.
2.3. Test Case Composition
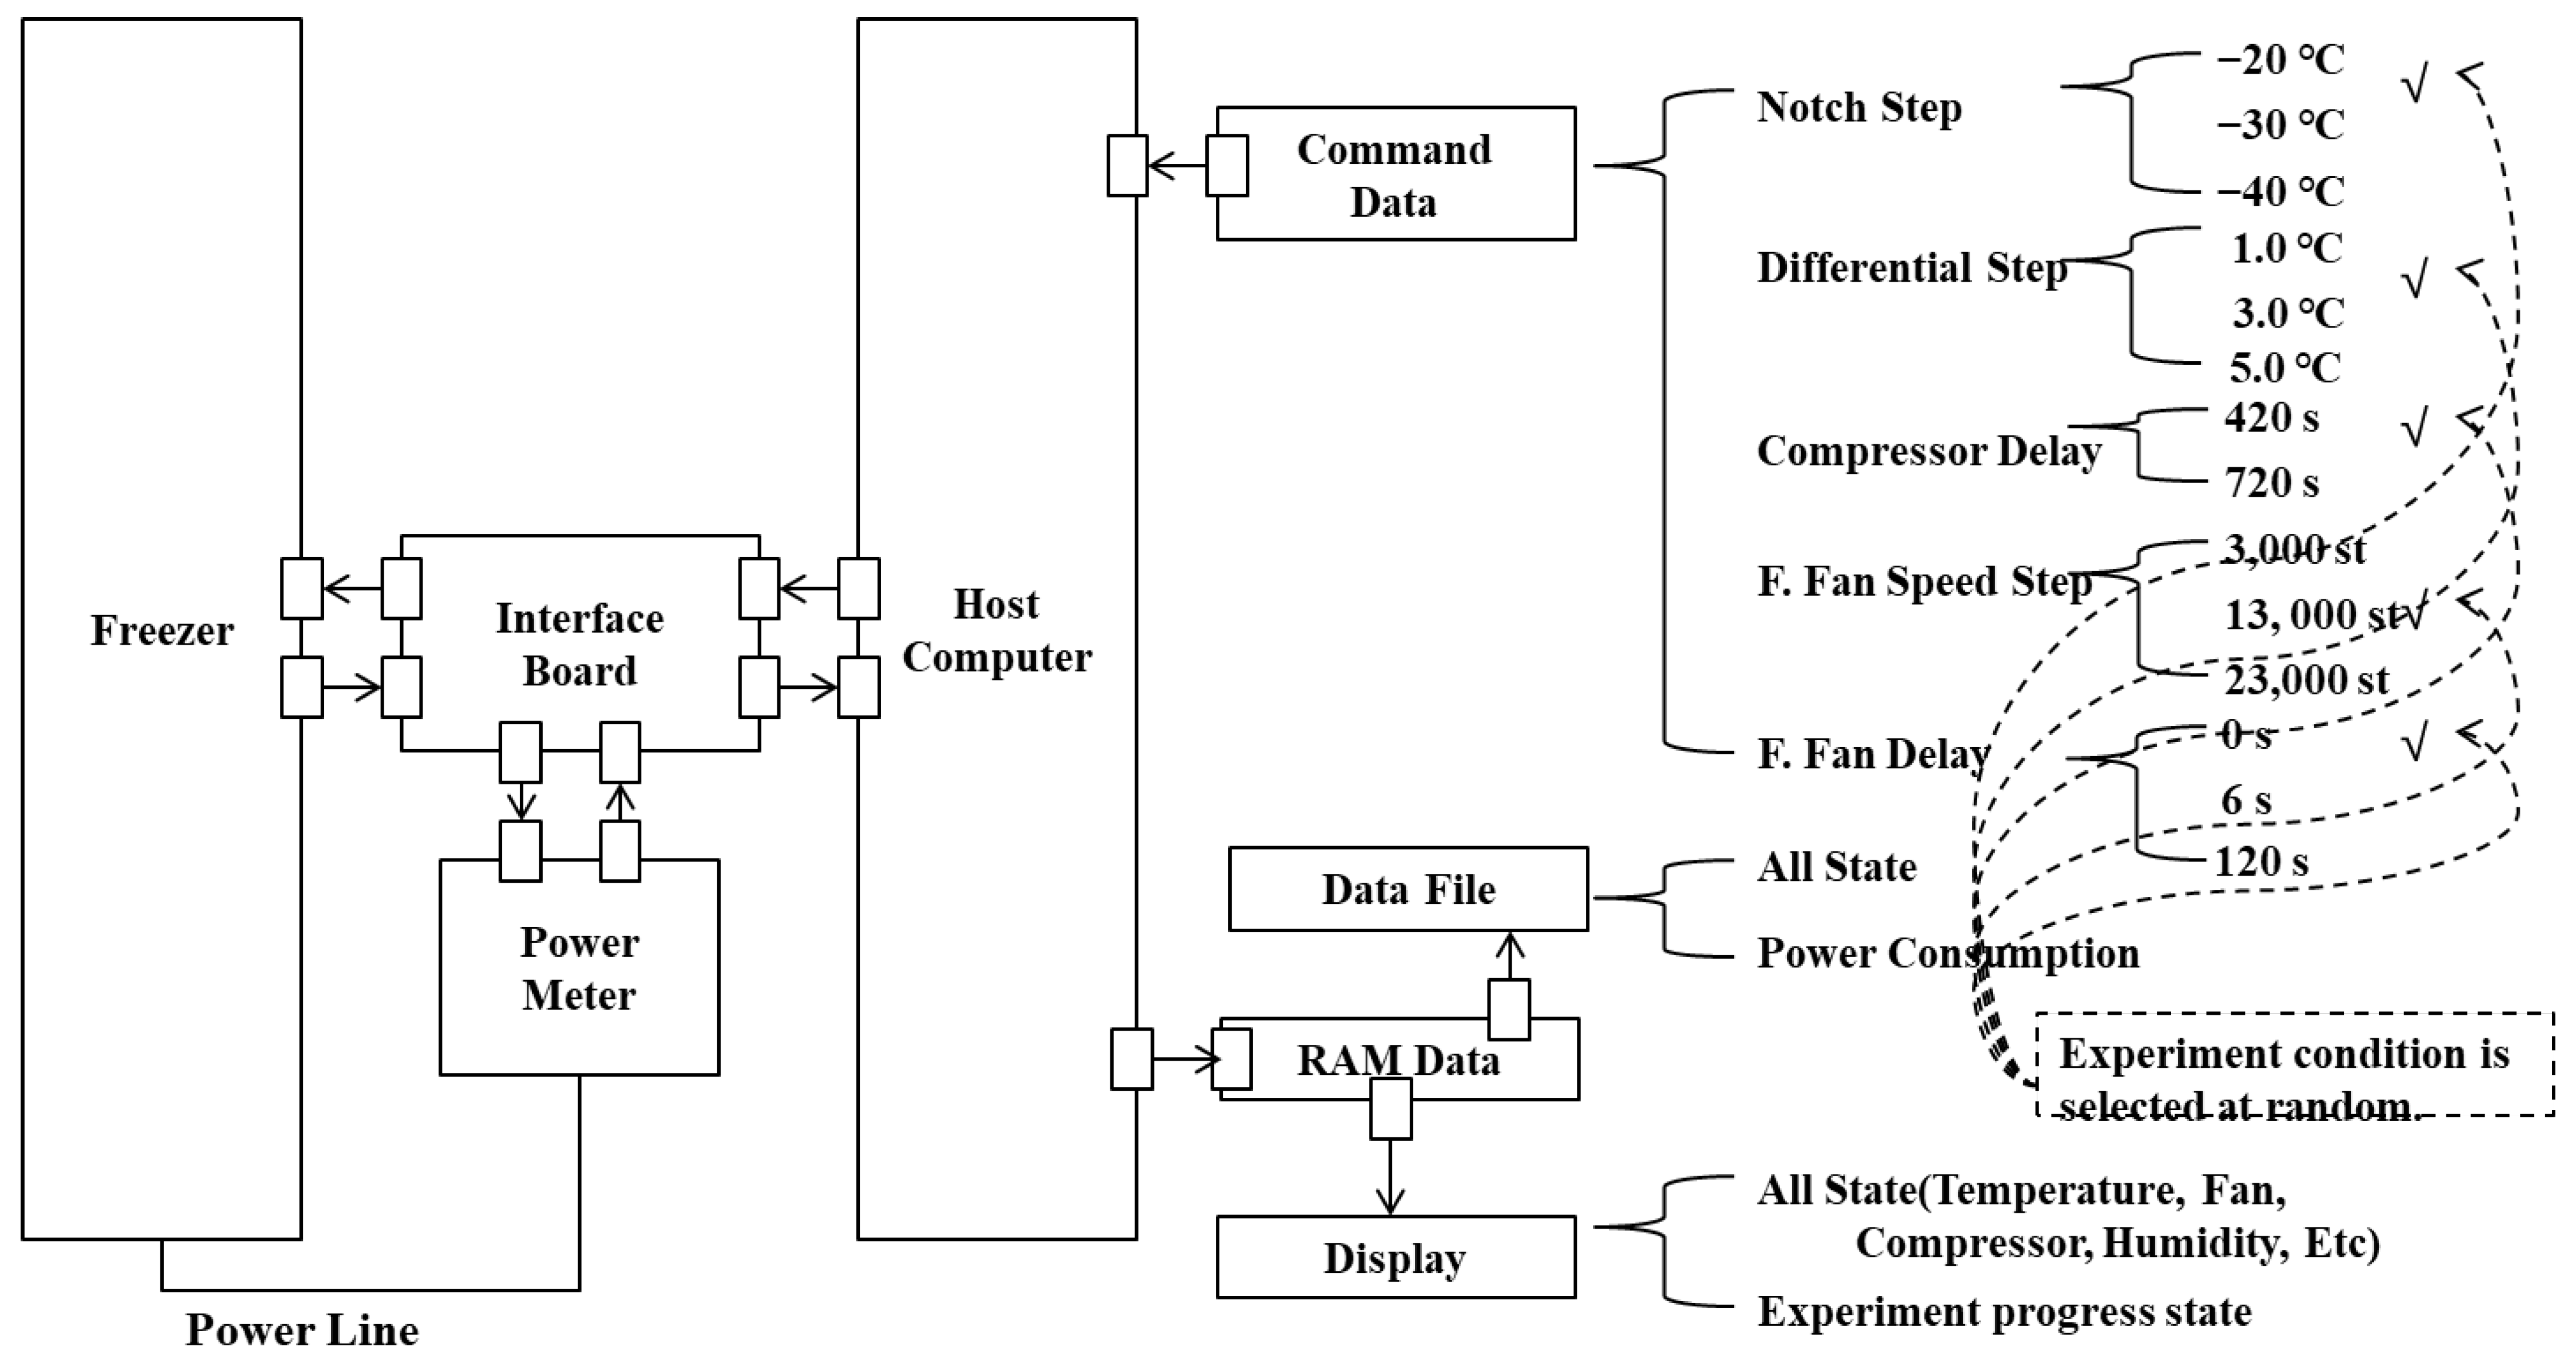
The electrical energy result data linked to test cases needed to be configured as a set in order to obtain data for machine learning. The test case was configured by adjusting the software variables of the controllable parts in the freezer to various parameters. As shown in Figure 2, control and setting parameters were divided into a total of five parameters. The “notch step”, the control temperature parameter of the freezer, was divided into −20, −30, and −40 °C, and the “differential step”, the hysteresis of the temperature control, was divided into 1.0, 3.0, and 5.0 °C. The “compressor delay time”, a parameter that forcibly delays the compressor after the operation is stopped, was divided into 420 and 720 s. In addition, the “freezer fan speed step”, a parameter related to the speed of the BLDC fan, was divided into 3000, 13,000, and 23,000 steps, and “freezer fan delay time”, a time parameter that forcibly prevents the fan from turning on again after stopping was constructed by dividing the steps into 0, 60, and 120 s. If the detailed steps of these parameters are combined, 162 test cases can be configured. All test cases were placed in a random order by the test automation program, and the beginning and end of each test were conducted by the “optimal method for reducing the measurement time” [18]. After completing 162 tests, 75% of the obtained data were used for training, and the remaining 25% were used for verification.
2.4. Machine Learning Modeling Methods
Python (Version 3.9.13) was used to develop the machine learning program and prediction service program. Python is a high-level programming language that was introduced in 1991 by Dutch software engineer Guido van Rossum. It is a platform-independent, interpreted, object-oriented, dynamically typed conversational language [20].
2.4.1. Single-Layer Perceptron (SLP)
Python and the Scikit-learn (Version 1.1.3) library were used for machine learning using the least squared method, which is SLP [21]. LinearRegression, included in Scikit-learn, fits a linear model with coefficients ω = (ω_1, …, ω_p) to minimize the residual sum of squares between the observed targets in the dataset and the targets predicted by the linear approximation. Mathematically, it solves a problem of the form:
Linear Regression takes in its fit method arrays (X and y) and stores the coefficients (ω) of the linear model in its coefficient member. The coefficient estimates for ordinary least squares rely on the independence of the features. When features are correlated and the columns of the design matrix (X) have an approximately linear dependence, the design matrix becomes close to singular, and as a result the least-squares estimate becomes highly sensitive to random errors in the observed target, producing a large variance. This situation of multicollinearity can arise, for example, when data are collected without an experimental design.
2.4.2. Multi-Layer Perceptron (MLP)
The experiment was designed using Python and Keras (Version 2.7), in order to use deep learning using MLP. Keras is an open-source neural network library written in Python. It can run on MXNet, Deeplearning4j, TensorFlow, Microsoft Cognitive Toolkit, or Theano. It was designed to enable rapid experimentation with deep neural networks (DNN) and focuses on minimal modular extensibility. In this study, a rectified linear unit (ReLU) method was used for the activation of the input and intermediate layers, and a linear method was used for the activation of the output. It was optimized with a method for stochastic optimization (ADAM), and the loss was calculated using the mean absolute percentage error (MAPE) [22]. It was trained by setting 30,000 epochs and 20 batch sizes to fit the inference model.
2.5. Web-Based Power Electrical Energy Prediction Service
This experiment was programmed using the Flask (Version 2.2.2) library to provide a web-based electrical energy prediction service that anyone can easily access. Flask is a micro web framework that was written in Python and is based on the Werkzeug tool kit and the Jinja2 template engine [23].
2.6. Statistics
Prediction by the tracking signal method (TSM) was used to confirm the reliability of the prediction values, and if the tolerance was out of range, it meant that the prediction method was inappropriate. Therefore, the validity of this study could be confirmed [24]. Mathematically, this method solves a problem with the following form:
2.7. Electrical Energy Optimization
For an example of the optimization method, the optimal power consumption was inferred at the freezer setting temperature of −20 °C using a prediction model created through deep learning machine learning. When using a predictive model, it has the advantage of being able to combine all ranges of variables that have not been tested.
A predictive test was conducted for all combinations of the following variables:
- Target (°C) = −20;
- Hysteresis (°C) = 1, 2, 3, 4, or 5;
- Compressor delay (s) = 0, 20, 120, 220, 320, 420, 520, 620, or 720;
- Fan speed (step) = 3000, 4000, 5000, 6000, 7000, 8000, 9000, 10,000, 11,000, 12,000, 13,000, 14,000, 15,000, 16,000, 17,000, 18,000, 19,000, 20,000, 21,000, 22,000, or 23,000;
- Fan delay (s) = 0, 10, 20, 30, 40, 50, 60, 70, 80, 90, 100, 110, or 120;
- Room temperature average (°C) = 24.
All combinations for each item result in 12,284 cases. This means that the electric energy values of 12,284 tests could be derived through virtual tests using predictive models.
3. Results
3.1. Test Automation Program and Data Collection
A long-term automated test was conducted using the test automation program in Figure 3, developed using LabView, and 11,436 data records were obtained. To summarize, it was organized as in Table 1. Two prediction models were developed by inputting the vast amount of data obtained in the test automation program into the SLP and MLP machine learning program.
3.2. Web-Based Prediction Service and TS Calculation
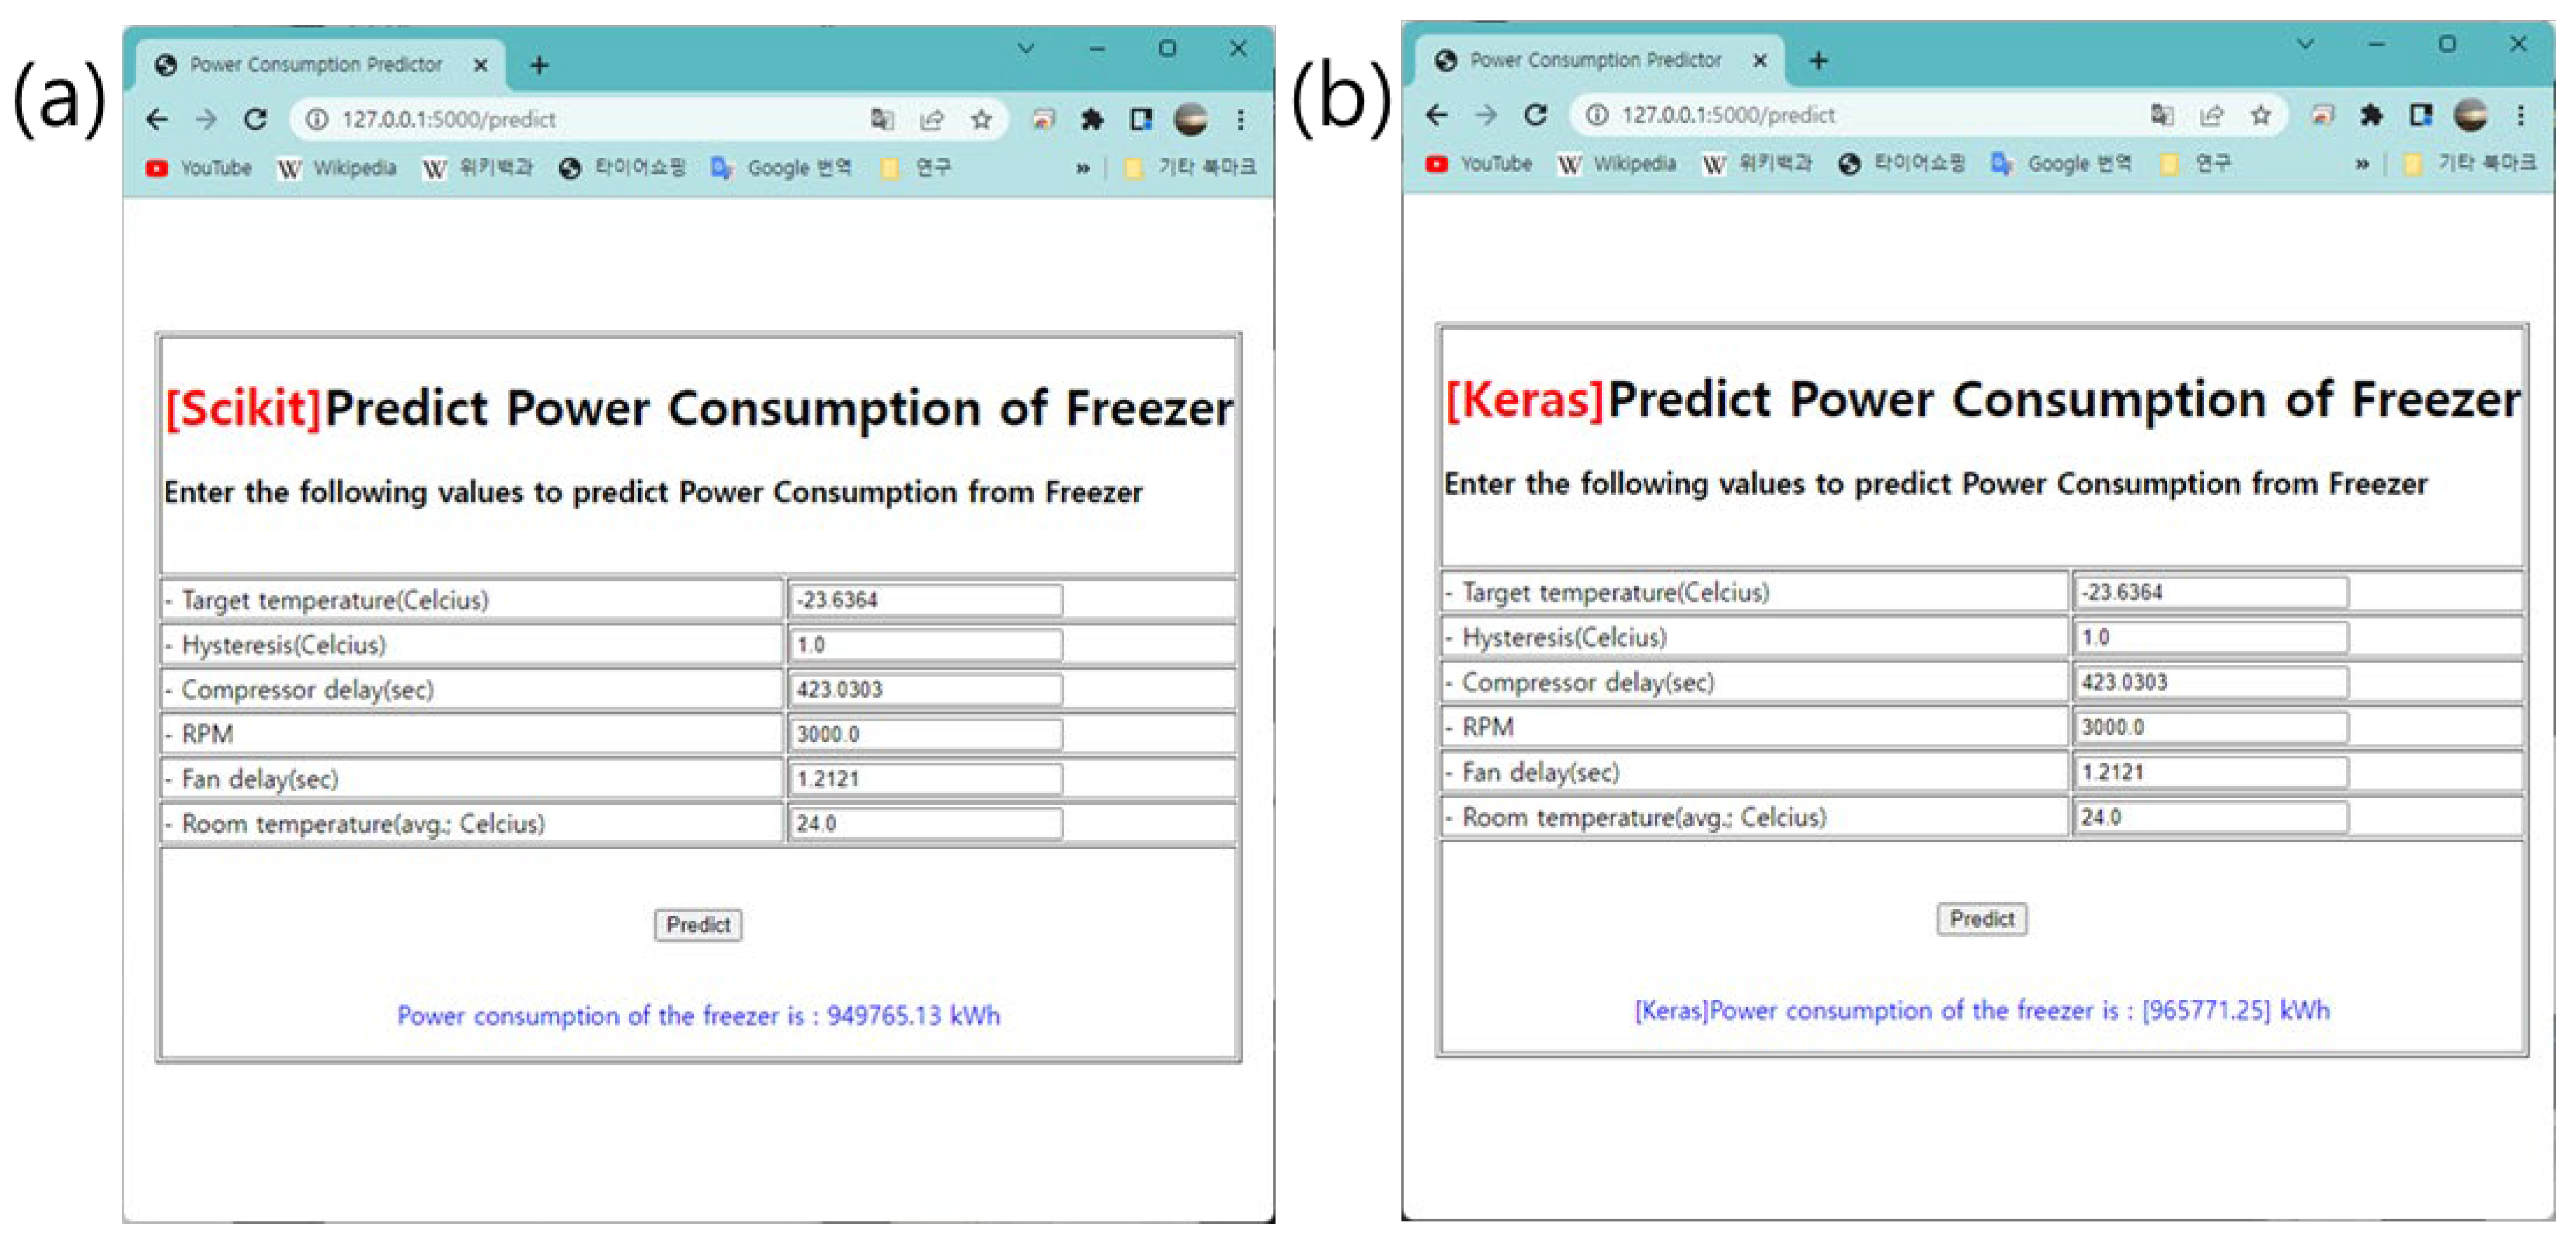
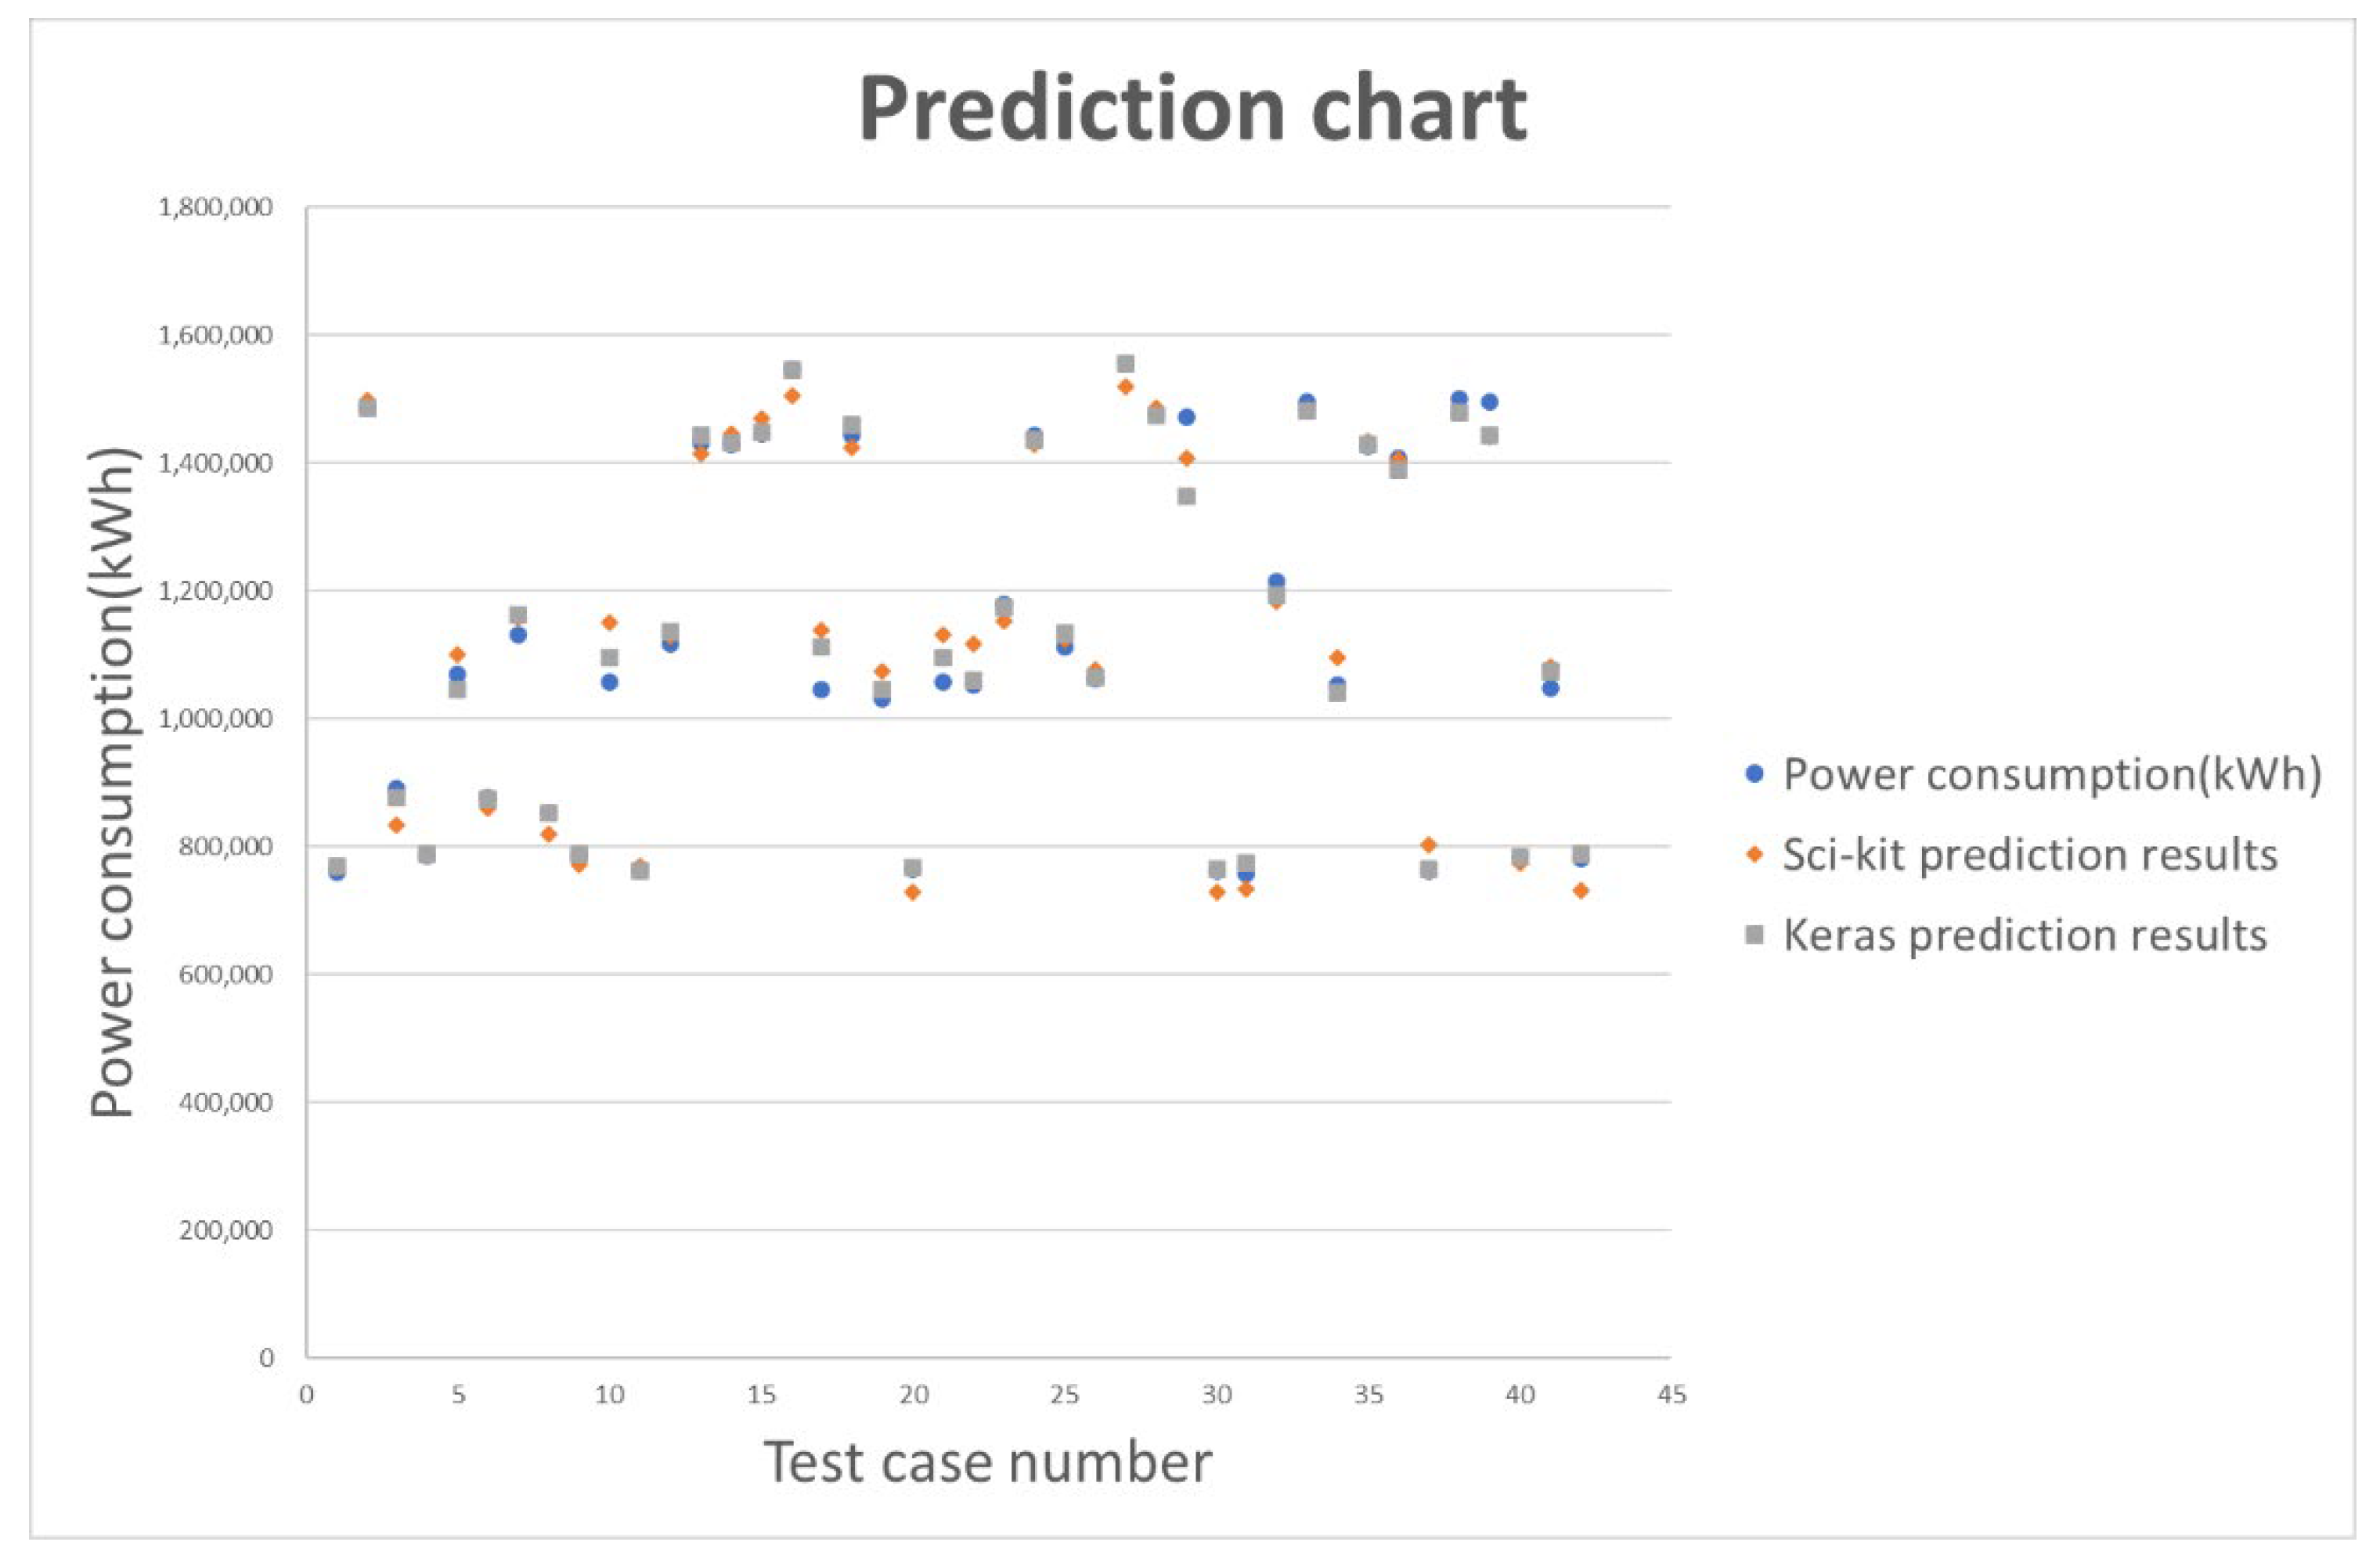
As shown in Figure 4, a web-based service based on two inference models obtained by the machine learning of the test results was built. Through this web service, the predicted value for each model was calculated, and a graph, as shown in Figure 5, which can visually compare the measured value and the predicted value, is presented.
The TS was calculated using TSM using each obtained predicted value, where 1.910 was calculated for Scikit-learn and 0.541 was calculated for Keras.
3.3. The Combination of Items for Minimum Electrical Energy
The electrical energy prediction results for the freezer setting temperature of −20 °C using a deep learning inference model are shown in Table 2. Using the results of 12,284 virtual tests obtained through all the proposed combinations, the maximum and minimum values of electrical energy and each set item value were summarized, as shown in Table 3.
Comparing the maximum and minimum values, it can be known that a maximum of 362,834 kWh of electrical energy consumption can be reduced simply by optimizing the control value for each item to maintain the freezer at the same temperature of −20 °C. Using the same method, it is possible to optimize the freezer set temperatures of −30 °C and −40 °C, and the predictability can be checked, even for temperatures, such as −50 °C, that were not tested.
4. Discussion
The TS is a simple indicator that forecasts bias present in a forecast model. It is most often used when the validity of the forecasting model might be in doubt.
If the value of the TS is between −4 and +4, the accuracy of the prediction method is regarded as acceptable and can be continuously applied. However, if it is outside of this range, there is a problem with the fitness of the currently applied prediction model, so it must be relearned with new data or new algorithms. If the TS is ±4, it means that the cumulative error is ±4 MAD, which corresponds to ±3.2 s. Since s ≒ 1.25 MAD, 1 MAD = 0.8 s. The probability that the normal TS value is within the range of ±4 is 99.8%, and the probability that the abnormal TS value is outside of the range of ±4 is 0.2%. Therefore, there is little possibility of an outlier.
This means that 99.8% of normal prediction errors will be in the range between ±4 MAD, and if the TS value of an inference model is outside of ±4 MAD, it becomes an abnormal error, and it means that the machine learning algorithm needs corrective action.
In the results of this study, comparing the TS values of Scikit-learn using SLP machine learning and Keras using MLP machine learning, it was found that the learning results of MLP were more predictive. However, Scikit-learn also had a TS value within the range of ±4, so there would be no problem in applying it to food processing equipment with few parameters. In this study, learning was conducted using the deep learning method using the data obtained by Kim [18], and through TS verification it was confirmed that it was possible to create a predictive model with over 99.8% predictive power.
Reliable predictive models can be applied to virtual tests to optimize electrical energy consumption, and the results can be predicted in advance by approaching areas that are not actually tested. The application of such a development method can reduce electrical energy to achieve the same effect in the food manufacturing equipment related industry. As a result, it will be possible to contribute carbon emission reductions without spending money.
Funding
This research was funded by a 2020–2021 Research Grant from Sangmyung University.
Conflicts of Interest
The authors declare no conflict of interest.
References
- James, C. Food Transportation and Refrigeration Technologies—Design and Optimization; Sustainable Food Supply Chains; Elsevier: Amsterdam, The Netherlands, 2019; pp. 185–199. [Google Scholar]
- Bertoldi, P.; Atanasiu, B. Electricity Consumption and Efficiency Trends in the Enlarged European Union; IES–JRC, European Union: Brussels, Belgium, 2007. [Google Scholar]
- Gutberlet, K.L. Domestic Appliances: Progress & Potential. In Proceedings of the 5th International Conference on Energy Efficiency in Domestic Appliances and Lighting EEDAL, Berlin, Germany, 16–18 June 2009; p. 9. [Google Scholar]
- Brito, P.; Lopes, P.; Reis, P.; Alves, O. Simulation and optimization of energy consumption in cold storage chambers from the horticultural industry. Int. J. Energy Environ. Eng. 2014, 5, 88. [Google Scholar] [CrossRef] [Green Version]
- Sakallı, Ö.; Kerpiççi, H.; Kuddusi, L. A study on optimizing the energy consumption of a cold storage cabinet. Appl. Therm. Eng. 2017, 112, 424–430. [Google Scholar] [CrossRef]
- Meneghetti, A.; Monti, L. Greening the food supply chain: An optimisation model for sustainable design of refrigerated automated warehouses. Int. J. Prod. Res. 2014, 53, 6567–6587. [Google Scholar] [CrossRef]
- Yilmaz, I.C.; Yilmaz, D. Optimal capacity for sustainable refrigerated storage buildings. Case Stud. Therm. Eng. 2020, 22, 100751. [Google Scholar] [CrossRef]
- Tian, S.; Shao, S.; Liu, B. Investigation on transient energy consumption of cold storages: Modeling and a case study. Energy 2019, 180, 1–9. [Google Scholar] [CrossRef]
- Nunes, J.; Neves, D.; Gaspar, P.D.; Silva, P.D.; Andrade, L.P. Predictive tool of energy performance of cold storage in agrifood industries: The Portuguese case study. Energy Convers. Manag. 2014, 88, 758–767. [Google Scholar] [CrossRef]
- Mukhopadhyay, N.; Das, R. Optimization of different control parameters of a cold storage using Taguchi Methodology. AMSE J. 2014 Ser. Model. D 2015, 36, 1–9. [Google Scholar]
- Hovgaard, T.G.; Larsen, L.F.; Edlund, K.; Jørgensen, J.B. Model predictive control technologies for efficient and flexible power consumption in refrigeration systems. Energy 2012, 44, 105–116. [Google Scholar] [CrossRef]
- Granter, S.R.; Beck, A.H.; Papke, D.J., Jr. AlphaGo, deep learning, and the future of the human microscopist. Arch. Pathol. Lab. Med. 2017, 141, 619–621. [Google Scholar] [CrossRef] [PubMed] [Green Version]
- Kim, S.; Kim, S. Impact and prospect of the fourth industrial revolution in food safety: Mini-review. Food Sci. Biotechnol. 2022, 31, 399–406. [Google Scholar] [CrossRef] [PubMed]
- Koritsoglou, K.; Papadopoulou, M.S.; Boursianis, A.D.; Sarigiannidis, P.; Nikolaidis, S.; Goudos, S.K. Smart Refrigeration Equipment based on IoT Technology for Reducing Power Consumption. In Proceedings of the 2022 11th International Conference on Modern Circuits and Systems Technologies (MOCAST), Bremen, Germany, 8–10 June 2022; pp. 1–4. [Google Scholar]
- Loisel, J.; Duret, S.; Cornuéjols, A.; Cagnon, D.; Tardet, M.; Derens-Bertheau, E.; Laguerre, O. Cold chain break detection and analysis: Can machine learning help? Trends Food Sci. Technol. 2021, 112, 391–399. [Google Scholar] [CrossRef]
- Soltani, Z.; Sørensen, K.K.; Leth, J.; Bendtsen, J.D. Fault detection and diagnosis in refrigeration systems using machine learning algorithms. Int. J. Refrig. 2022, 144, 34–45. [Google Scholar] [CrossRef]
- Khan, I.H.; Sablani, S.S.; Joardder, M.U.H.; Karim, M.A. Application of machine learning-based approach in food drying: Opportunities and challenges. Dry. Technol. 2020, 40, 1051–1067. [Google Scholar] [CrossRef]
- Kim, S.O.; Choi, Y.J. Firmware development process for food refrigeration system. Food Sci. Biotechnol. 2014, 23, 1159–1167. [Google Scholar] [CrossRef]
- Bitter, R.; Mohiuddin, T.; Nawrocki, M. LabVIEW™ Advanced Programming Techniques; CRC Press: Boca Raton, FL, USA, 2017. [Google Scholar]
- De Smedt, T.; Daelemans, W. Pattern for python. J. Mach. Learn. Res. 2012, 13, 2063–2067. [Google Scholar]
- Géron, A. Hands-on Machine Learning with Scikit-Learn, Keras, and TensorFlow; O’Reilly Media, Inc.: Newton, MA, USA, 2022. [Google Scholar]
- Ramasubramanian, K.; Singh, A. Deep Learning using Keras and Tensorflow. In Machine Learning Using R; Apress: Berkeley, CA, USA, 2019; pp. 667–688. [Google Scholar]
- Relan, K. Beginning with flask. In Building REST APIs with Flask; Springer: Berlin/Heidelberg, Germany, 2019; pp. 1–26. [Google Scholar]
- Mele, M.; Secchiari, P.; Serra, A.; Ferruzzi, G.; Paoletti, F.; Biagioni, M. Application of the ‘tracking signal’ method to the monitoring of udder health and oestrus in dairy cows. Livest. Prod. Sci. 2001, 72, 279–284. [Google Scholar] [CrossRef]
Figure 1.
Device connection diagram for collecting electrical energy data [18].
Figure 1.
Device connection diagram for collecting electrical energy data [18].

Figure 2.
Parameter composition for freezer test and block diagram of data communication between devices: total experiment number (162 cases) = notch step (3) * differential step (3) * compressor delay (2) * fan speed step (3) * fan delay (3).
Figure 2.
Parameter composition for freezer test and block diagram of data communication between devices: total experiment number (162 cases) = notch step (3) * differential step (3) * compressor delay (2) * fan speed step (3) * fan delay (3).

Figure 3.
Test automation program developed for data collection and unmanned test progress.

Figure 4.
Web-based freezer electrical energy prediction service ((a) Sckit−learn and (b) Keras).

Figure 5.
Comparison graph of measured values and predicted values of electrical energy.


Table 1.
Validation dataset example obtained from test automation program.
| Test Number | Target (°C) | Hysteresis (°C) | Compressor Delay (s) | Fan Speed (Step) | Fan Delay (s) | Average Room Temperature (°C) | Electrical Energy (kWh) | Data Filename | Number of Records |
|---|---|---|---|---|---|---|---|---|---|
| 1 | −20 | 5 | 720 | 13,000 | 0 | 23.0 | 760,567.9 | 1.csv | 456 |
| 2 | −40 | 5 | 420 | 13,000 | 120 | 24.2 | 1,486,217.0 | 2.csv | 724 |
| 3 | −20 | 5 | 720 | 3000 | 60 | 23.6 | 890,658.1 | 3.csv | 920 |
| 4 | −20 | 1 | 720 | 13,000 | 60 | 24.6 | 786,036.6 | 4.csv | 213 |
| 5 | −30 | 3 | 720 | 23,000 | 60 | 24.8 | 1,070,131 | 5.csv | 182 |
| 6 | −20 | 3 | 420 | 3000 | 120 | 23.5 | 875,112.1 | 6.csv | 369 |
| 7 | −30 | 3 | 720 | 3000 | 120 | 22.5 | 1,130,707.0 | 7.csv | 294 |
| 8 | −20 | 1 | 720 | 3000 | 120 | 23.2 | 851,244.7 | 8.csv | 301 |
| 9 | −20 | 3 | 720 | 23,000 | 120 | 24.6 | 784,586.0 | 9.csv | 240 |
| 10 | −30 | 3 | 720 | 13,000 | 120 | 24.5 | 1,056,281.0 | 10.csv | 182 |
| 11 | −20 | 3 | 720 | 13,000 | 0 | 23.7 | 761,028.9 | 11.csv | 256 |
| 12 | −30 | 1 | 720 | 3000 | 60 | 22.8 | 1,116,712.0 | 12.csv | 219 |
| 13 | −40 | 5 | 420 | 23,000 | 60 | 22.6 | 1,432,057.0 | 13.csv | 250 |
| 14 | −40 | 1 | 720 | 13,000 | 120 | 23.7 | 1,428,087.0 | 14.csv | 136 |
| 15 | −40 | 1 | 420 | 13,000 | 120 | 23.7 | 1,445,620.0 | 15.csv | 128 |
| 16 | −40 | 1 | 420 | 3000 | 60 | 24.1 | 1,546,400.0 | 16.csv | 204 |
| 17 | −30 | 3 | 420 | 13,000 | 0 | 24.0 | 1,044,196.0 | 17.csv | 227 |
| 18 | −40 | 5 | 420 | 23,000 | 60 | 23.2 | 1,442,864.0 | 18.csv | 248 |
| 19 | −30 | 5 | 720 | 23,000 | 120 | 22.6 | 1,029,990.0 | 19.csv | 289 |
| 20 | −20 | 1 | 720 | 23,000 | 60 | 23.6 | 764,630.9 | 20.csv | 192 |
| 21 | −30 | 5 | 720 | 13,000 | 60 | 24.2 | 1,057,877.0 | 21.csv | 238 |
| 22 | −30 | 5 | 720 | 13,000 | 0 | 24.1 | 1,051,675.0 | 22.csv | 266 |
| 23 | −30 | 5 | 720 | 3000 | 0 | 23.7 | 1,179,404.0 | 23.csv | 370 |
| 24 | −40 | 3 | 420 | 23,000 | 120 | 23.2 | 1,442,853.0 | 24.csv | 194 |
| 25 | −30 | 1 | 720 | 3000 | 60 | 22.5 | 1,111,537.0 | 25.csv | 248 |
| 26 | −30 | 1 | 420 | 23,000 | 60 | 23.3 | 1,061,260.0 | 26.csv | 148 |
| 27 | −40 | 1 | 420 | 3000 | 120 | 24.2 | 1,553,932.0 | 27.csv | 206 |
| 28 | −40 | 5 | 420 | 13,000 | 60 | 24.2 | 1,475,870.0 | 28.csv | 275 |
| 29 | −40 | 5 | 720 | 23,000 | 60 | 23.5 | 1,471,280.0 | 29.csv | 274 |
| 30 | −20 | 1 | 720 | 23,000 | 120 | 22.9 | 761,361.0 | 30.csv | 215 |
| 31 | −20 | 3 | 720 | 23,000 | 120 | 22.5 | 756,175.3 | 31.csv | 226 |
| 32 | −30 | 5 | 720 | 3000 | 120 | 23.9 | 1,214,821.0 | 32.csv | 344 |
| 33 | −40 | 5 | 720 | 13,000 | 120 | 24.7 | 1,495,908.0 | 33.csv | 268 |
| 34 | −30 | 3 | 720 | 23,000 | 120 | 23.7 | 1,051,823.0 | 34.csv | 225 |
| 35 | −40 | 3 | 720 | 13,000 | 60 | 23.2 | 1,425,506.0 | 35.csv | 191 |
| 36 | −40 | 1 | 720 | 13,000 | 0 | 22.9 | 1,406,442.0 | 36.csv | 132 |
| 37 | −20 | 3 | 420 | 13,000 | 120 | 22.7 | 761,447.4 | 37.csv | 281 |
| 38 | −40 | 5 | 720 | 13,000 | 120 | 24.4 | 1,499,554.0 | 38.csv | 257 |
| 39 | −40 | 3 | 420 | 23,000 | 0 | 25.4 | 1,494,355.0 | 39.csv | 208 |
| 40 | −20 | 5 | 420 | 23,000 | 0 | 24.4 | 782,610.8 | 40.csv | 340 |
| 41 | −30 | 3 | 420 | 23,000 | 0 | 23.1 | 1,046,752.0 | 41.csv | 176 |
| 42 | −20 | 5 | 720 | 23,000 | 0 | 23.3 | 780,575.7 | 42.csv | 324 |
Table 2.
Virtual test results using the inference model made by MLP.
| Sequence Number | Target (°C) | Hysteresis (°C) | Compressor Delay (s) | Fan Speed (Step) | Fan Delay (s) | Average Room Temperature (°C) | Electrical Energy Prediction Results (kWh) |
|---|---|---|---|---|---|---|---|
| 0 | −20 | 1 | 0 | 3000 | 0 | 24 | 915,796.8 |
| 1 | −20 | 1 | 0 | 3000 | 10 | 24 | 916,796.1 |
| 2 | −20 | 1 | 0 | 3000 | 20 | 24 | 917,795.3 |
| 3 | −20 | 1 | 0 | 3000 | 30 | 24 | 918,794.8 |
| 4 | −20 | 1 | 0 | 3000 | 40 | 24 | 919,794.0 |
| 5 | −20 | 1 | 0 | 3000 | 50 | 24 | 920,793.3 |
| 6 | −20 | 1 | 0 | 3000 | 60 | 24 | 921,792.6 |
| 7 | −20 | 1 | 0 | 3000 | 70 | 24 | 922,791.9 |
| 8 | −20 | 1 | 0 | 3000 | 80 | 24 | 923,791.2 |
| : | |||||||
| 12,276 | −20 | 5 | 720 | 23,000 | 40 | 24 | 783,313.6 |
| 12,277 | −20 | 5 | 720 | 23,000 | 50 | 24 | 781,319.5 |
| 12,278 | −20 | 5 | 720 | 23,000 | 60 | 24 | 779,325.5 |
| 12,279 | −20 | 5 | 720 | 23,000 | 70 | 24 | 777,331.5 |
| 12,280 | −20 | 5 | 720 | 23,000 | 80 | 24 | 775,337.5 |
| 12,281 | −20 | 5 | 720 | 23,000 | 90 | 24 | 773,343.4 |
| 12,282 | −20 | 5 | 720 | 23,000 | 100 | 24 | 771,349.4 |
| 12,283 | −20 | 5 | 720 | 23,000 | 110 | 24 | 769,355.4 |
| 12,284 | −20 | 5 | 720 | 23,000 | 120 | 24 | 768,018.1 |
Table 3.
Summary of predicted electrical energy values.
| Minimum Electrical Energy | Maximum Electrical Energy | Max.−Min. | |
|---|---|---|---|
| Sequence Number | 2054 | 10,088 | N/A |
| Target (°C) | −20 | −20 | N/A |
| Hysteresis (°C) | 1 | 5 | N/A |
| Compressor delay (s) | 620 | 0 | N/A |
| Fan speed (step) | 14,000 | 23,000 | N/A |
| Fan delay (s) | 0 | 0 | N/A |
| Average room temperature (°C) | 24 | 24 | N/A |
| Electrical energy prediction results (kWh) | 737,498 | 1,100,332 | 362,834 |
Disclaimer/Publisher’s Note: The statements, opinions and data contained in all publications are solely those of the individual author(s) and contributor(s) and not of MDPI and/or the editor(s). MDPI and/or the editor(s) disclaim responsibility for any injury to people or property resulting from any ideas, methods, instructions or products referred to in the content. |
© 2022 by the author. Licensee MDPI, Basel, Switzerland. This article is an open access article distributed under the terms and conditions of the Creative Commons Attribution (CC BY) license (https://creativecommons.org/licenses/by/4.0/).
Share and Cite
MDPI and ACS Style
Kim, S. A Study on the Prediction of Electrical Energy in Food Storage Using Machine Learning. Appl. Sci. 2023, 13, 346. https://doi.org/10.3390/app13010346
AMA Style
Kim S. A Study on the Prediction of Electrical Energy in Food Storage Using Machine Learning. Applied Sciences. 2023; 13(1):346. https://doi.org/10.3390/app13010346
Chicago/Turabian StyleKim, Sangoh. 2023. "A Study on the Prediction of Electrical Energy in Food Storage Using Machine Learning" Applied Sciences 13, no. 1: 346. https://doi.org/10.3390/app13010346
Note that from the first issue of 2016, this journal uses article numbers instead of page numbers. See further details here.