Article

Quantifying Total Phosphorus and Heavy Metals in Residential Septage

by
Guy Iverson
1,2,*,
Charles P. Humphrey, Jr.
1,2,
Michael O’Driscoll
2,3,
Jordan Jernigan
1,4,
Brent Serozi
1,5 and
Christa Sanderford
1,6
1
Environmental Health Sciences Program, Department Health Education & Promotion, East Carolina University, Carol Belk Building, Mail Stop 529, Greenville, NC 27858, USA
2
Water Resources Center, East Carolina University, Greenville, NC 27858, USA
3
Department of Coastal Studies, East Carolina University, Greenville, NC 27858, USA
4
Wilson County Environmental Health Department, 1801 Glendale Drive SW, Wilson, NC 27893, USA
5
Carolina Air Care, UNC Medical Center, 101 Manning Drive, Chapel Hill, NC 27514, USA
6
Shellfish Sanitation and Recreational Water Quality, Division of Marine Fisheries, NC Department Environmental Quality, 3441 Arendell St., Morehead City, NC 28557, USA
*
Author to whom correspondence should be addressed.
Appl. Sci. 2022, 12(7), 3336; https://doi.org/10.3390/app12073336
Submission received: 3 March 2022 / Revised: 21 March 2022 / Accepted: 22 March 2022 / Published: 25 March 2022

Abstract

:

Featured Application

The results from these studies apply to local environmental health departments, resource managers, scientists studying wastewater systems, and agricultural operations using land applications of septage, since there are few studies that have quantified phosphorus and heavy metal concentrations in residential septage collected from septic systems.

Abstract

Septic systems are used for wastewater treatment in rural areas. Septic tanks promote stratification of wastewater into solid (sludge and scum) and liquid layers. Pollutant concentrations in the layers of residential septic tanks may be highly variable, and thus septage pumped from tanks with different layer thicknesses may also be variable. The goal of this study was to quantify the total phosphorus (TP) and heavy metal concentrations and masses of residential septage. The solid and liquid layer thicknesses were measured in 37 septic tanks. Samples were collected from each layer for pollutant concentration analysis. The median TP concentration (10.6 mg L−1) was greatest in the sludge layer, followed by the scum (5.3 mg L−1) and liquid (1.8 mg L−1) layers. Concentrations of heavy metals were highly variable for each layer type. The masses of the TP, cadmium, copper, lead, nickel, and zinc contained median (range) values of 19.4 g (0.9–1041 g), <0.01 g (<0.01–1.99 g), 1.3 g (0.1–520 g), 1.8 g (<0.01–44.2 g), 1.3 g (<0.01–4.3 g), and 13.8 g (0.3–788 g), respectively. Since septage is typically applied on land as a soil amendment for crop growth, it is important that representative composite samples are collected to prevent excess buildup of TP and metals, which may harm yields or environmental health.

Graphical Abstract

1. Introduction

Many rural and suburban areas across the United States rely on septic systems as their primary method of wastewater treatment. For example, approximately 25% of US residents and half of the population of North Carolina utilize septic systems [1]. Conventional-style septic systems collect raw wastewater and discharge septic tank effluent to the subsurface. Pollutants in the effluent are treated in soil via various processes (e.g., adsorption, filtration, precipitation, and/or dilution), and the treated effluent eventually mixes with groundwater and may drain to adjacent surface water [2,3]. Primary treatment occurs in the septic tank, where raw wastewater stratifies into 3 layers—scum, liquid, and sludge—and collectively, these layers are called septage [3]. The scum and sludge layers gradually thicken overtime and, without routine maintenance (e.g., pumping the tank every 3–5 years), can potentially cause sewage backup or premature failure of the drainfield via clogging with solids [4]. In the United States, septic system malfunction rates are estimated to be <7–13% [5], whereas other work has estimated this range as typically being between 10 and 20% [3], and some communities have reported up to 70% failure rates [6]. Poorly operated or maintained septic systems increase the risk of hydraulic malfunctions, which may result in ponding of effluent at the surface. Common reasons for hydraulic malfunction include effluent loading rates that exceed the infiltration capacity of soils, presence and thickness of the biomat layer under drainfield trenches and the infiltration rate through the biomat, septic tanks that are damaged or overloaded with soils, and clogged drainfield trenches [5,7]. Hydraulic malfunctions resulting in surfaced effluent can greatly reduce the treatment of nutrients, since these failures bypass subsoils beneath the drainfield where most of the treatment occurs [2,7,8,9,10]. Septage pumped from tanks is often lime stabilized and later applied on agricultural, forested, pastoral, or disturbed lands for use as a soil amendment [11,12,13].
Land application of septage replenishes soil nutrients (e.g., nitrogen and phosphorus), organic matter, and micronutrients (e.g., nickel, zinc, and copper) and improves soil texture and water holding capacity [12]. To maximize the soil fertility benefits from land application, biosolids should be applied to agricultural or pastoral lands before or during the growing season [14]. In addition to organic compounds and nutrients, septage can contain trace elements including heavy metals [15,16,17,18,19,20], microorganisms, and micropollutants [15], which may pose an exposure risk for humans if attenuation of the pollutants does not occur in the soil beneath the application fields, or sediment-bound contaminants may be transported to local surface waters via overland flow. Repeated application of biosolids on agricultural lands can eventually result in the buildup of phosphorus and metals in the soil and increase the potential for leaching of these elements to groundwater [18,21,22,23]. Toxic concentrations of heavy metals in soil may also lead to elevated concentrations in crops, which can be harmful for humans upon consumption [15]. Therefore, it is important that the mass of phosphorus and metals in septage is accurately measured, especially for lands that have received biosolids for many years.
Wastewater contains elevated concentrations of total phosphorus (TP) [3,24,25,26,27,28,29], where 76–99% of TP occurs as orthophosphate (PO4-P) [24,28,29,30,31]. Previous studies [3,24,25,26,27] have shown that TP in raw wastewater and septic tank effluent can range between 2.90 and 39.5 mg L−1, though the concentrations in septic tank effluent tend to be lower than those of raw wastewater due to the primary treatment [29]. These studies characterized phosphorus concentrations in the liquid layer of septic tanks. Phosphorus and metal concentrations in the sludge and scum layers of the septic tank are currently underrepresented in the literature. Septic tanks are designed with baffles, sanitary tees, or effluent filters to retain sludge and scum. However, these solids are applied to agricultural fields via land application, along with the liquid portion of the wastewater [11,12,13]. Septage is periodically sampled prior to land application to assess the nutrient and metal contents and to gain perspective on the loading rate of phosphorus and metals via land application. If significant differences between phosphorus and metal concentrations are observed when comparing the liquid layer to the scum and sludge layers, then protocols for obtaining a representative composite sample will be important for accurate estimates of nutrient and metal loading to soil via land application of septage. Therefore, quantifying the nutrient and metal concentrations in these layers and the thickness of the layers may help improve the management of septage.
Septic tank pumping is one of the most important routine maintenance activities associated with owning a septic system [32,33]. The frequency that a tank needs to be pumped is based upon several factors, including the size of the septic tank and wastewater generation rates [4]. As the solid layers thicken, the liquid capacity is reduced, and the residence time of wastewater in the tank decreases, potentially reducing the primary treatment efficiency. Septic systems with inadequate clarification in the tank (i.e., primary treatment) may experience hydraulic malfunction as solid waste exits the tank and clogs the drainfield trenches. Pumping the tank removes most of the solid waste and re-establishes volume for the settling of solid waste in the tank, thereby facilitating more effective primary treatment. End-of-life management of pumped septage can also result in a net reduction in nutrients and metals at the watershed scale. For example, if a septic tank is pumped in one watershed, and the septage is land-applied to a different watershed, then there is a net reduction in nutrients and metals in the watershed of origin. Thus, septic tank pumping may be considered a best management practice for reducing nutrient and metal loading in instances where the septage is applied to lands in different watersheds.
The goal of this study was to improve understanding of phosphorus and metal characteristics in residential septage. Few studies have focused on quantifying phosphorus and metal concentrations in the scum and sludge layers in residential septic systems [34,35], and those that did were published decades ago. More specifically, the objectives of this study were to (1) determine the thickness of the scum, liquid, and sludge layers in residential septage, (2) quantify concentrations and masses of TP and metals in the scum, liquid, and sludge layers, (3) estimate the total mass of TP and metals present in residential septage within the studied sub-watershed to Lick Creek, and (4) discuss the broader implications of land application of septage. This project provided funds for various septic system maintenance activities including septic tank pumping, replacing broken system components, and cleaning sanitary tees and effluent filters.

2. Materials and Methods

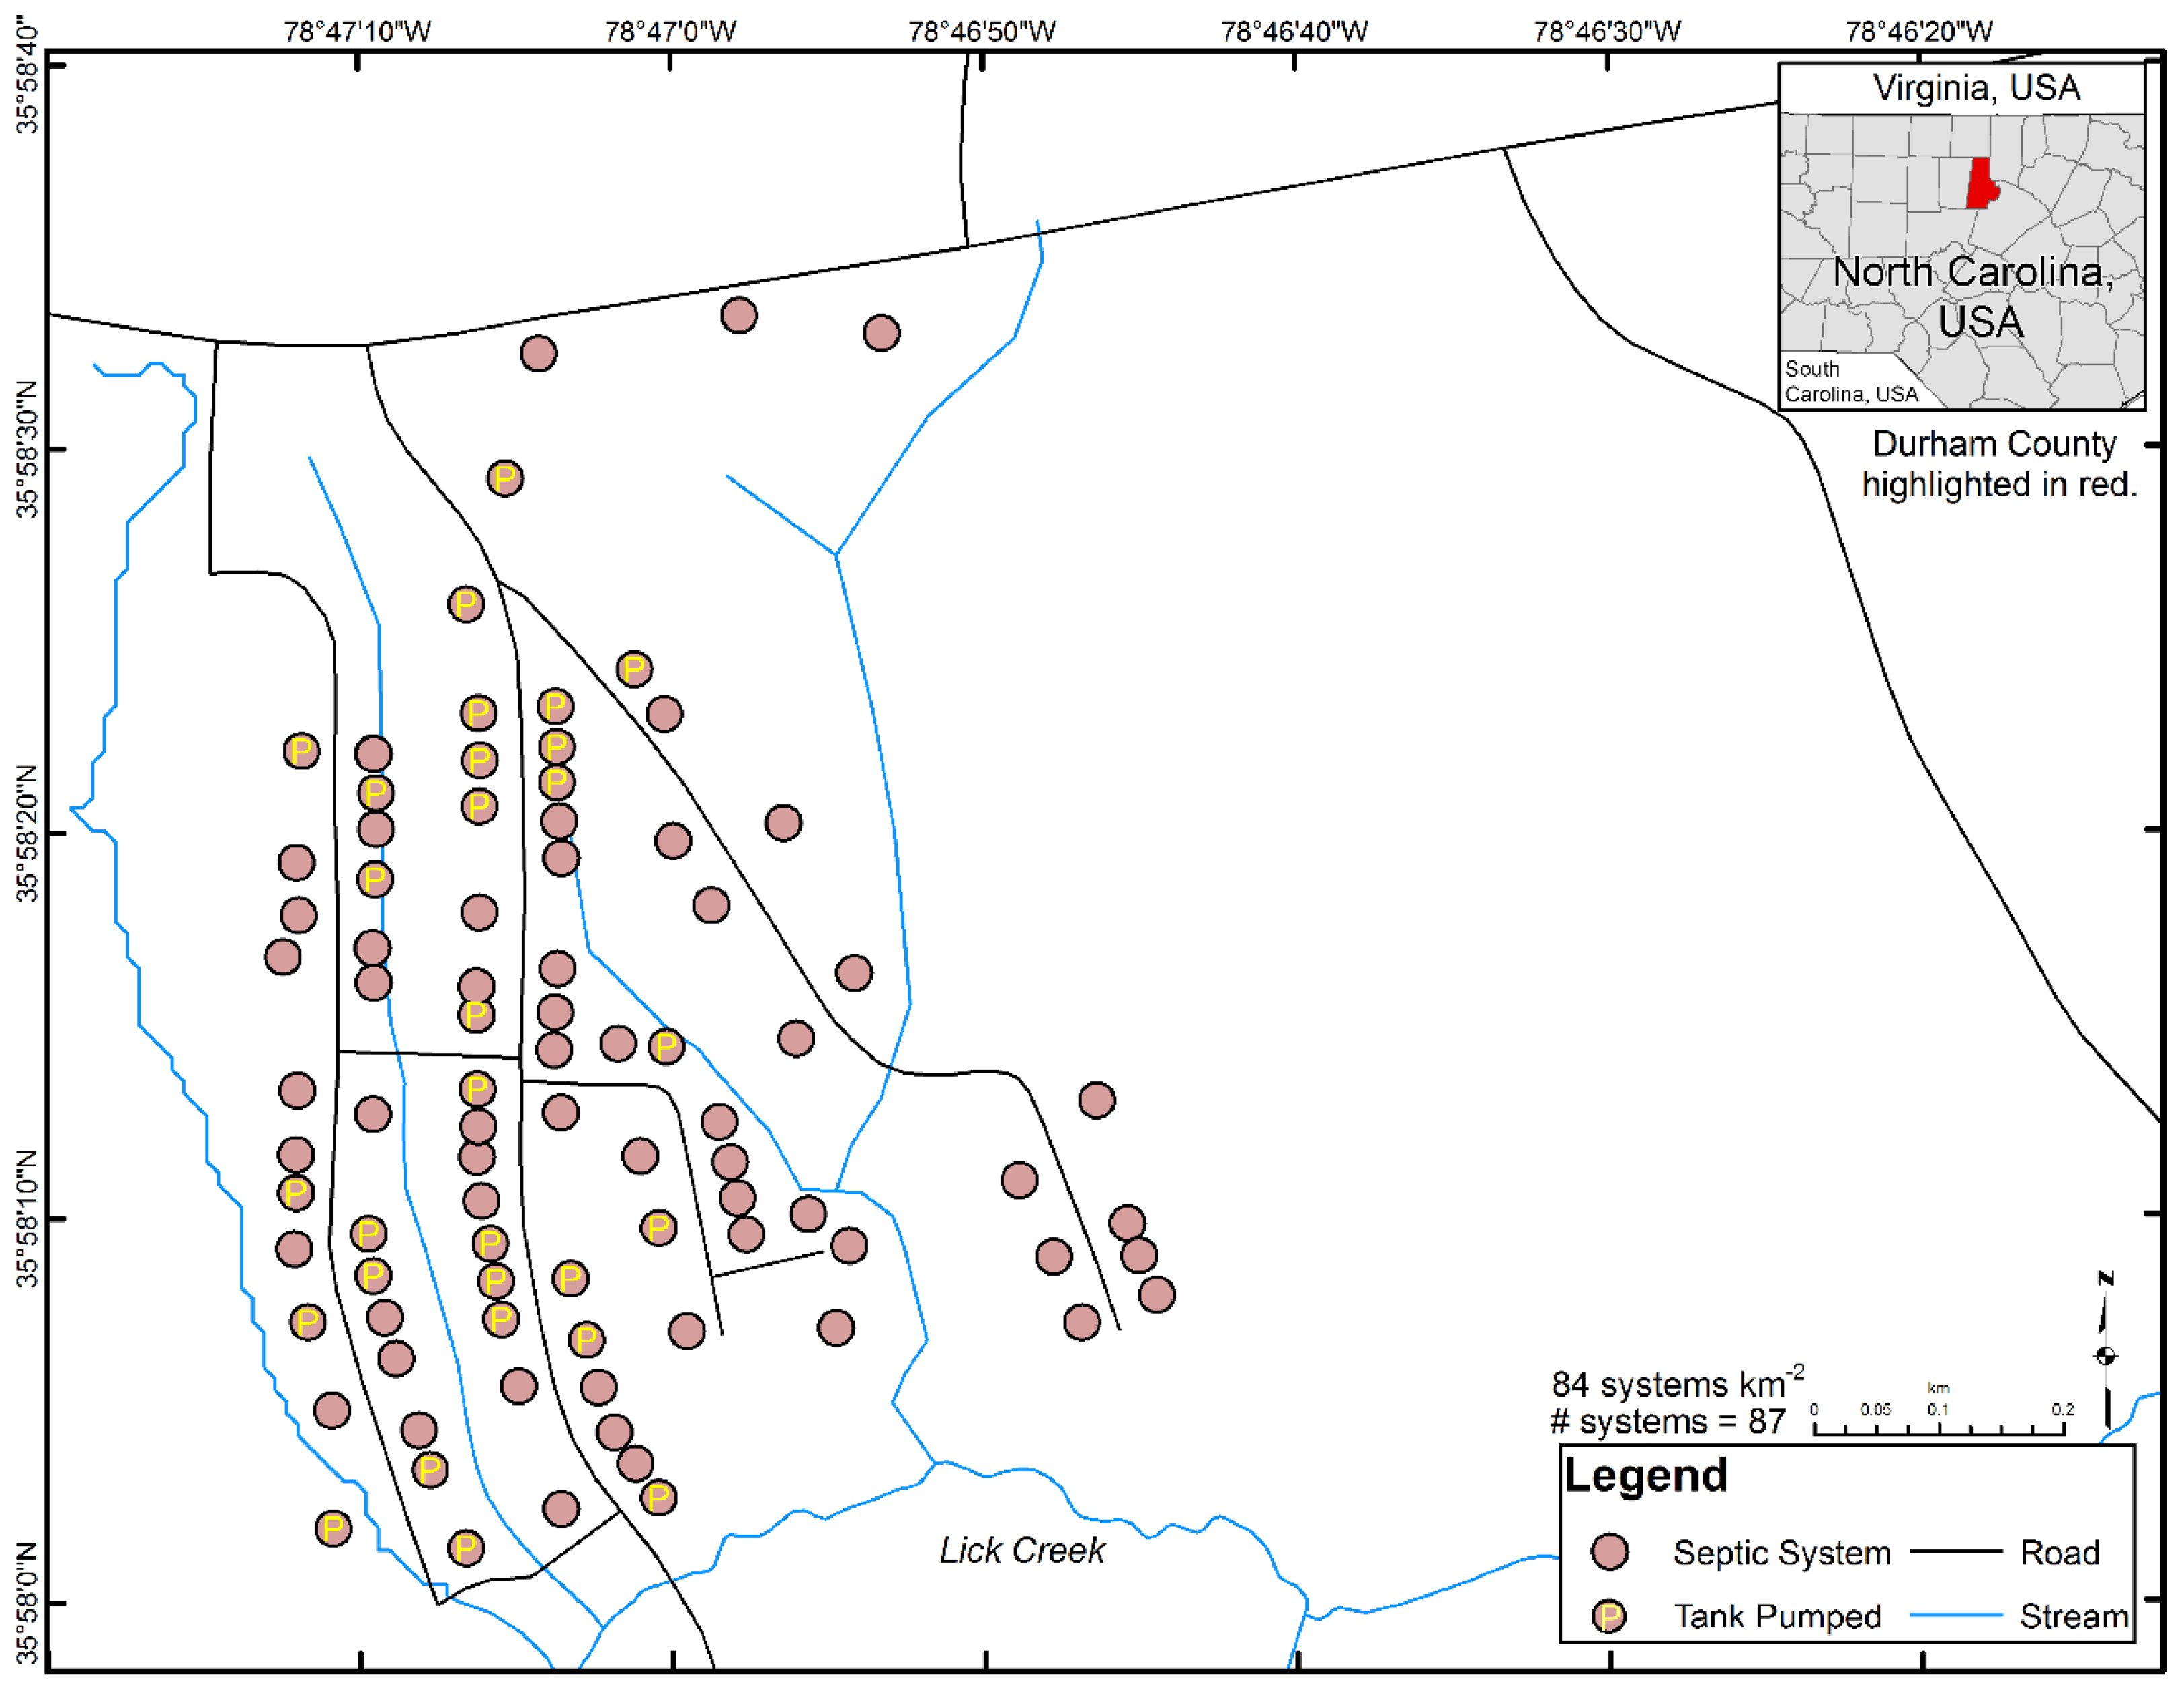
2.1. Study Area, Site Selection, and Tank Pumping

The current study occurred in the Lick Creek Watershed, which is 1 of 14 sub-watersheds that drain to the Falls Lake reservoir. The reservoir serves as a source of water, prevents flooding, mitigates downstream water quality issues during droughts, and provides recreational opportunities [36]. Lick Creek is a water supply watershed for more than 600,000 residents in Wake County and is also a nutrient-sensitive watershed, as designated by the state of North Carolina [37]. Water use impairment of Lick Creek has been an issue since 1998, when it was originally listed on the North Carolina 303(d) list for fair, poor, or severe bioclassification of benthic habitat [38]. Furthermore, the Lick Creek arm of Falls Lake exceeded the 40 µg L−1 standard for chlorophyll a, and the turbidity assessment was inconclusive [38], indicating that nutrients and sediment are potentially problematic pollutants in the Lick Creek Watershed.
The studied watershed contained a high-density (>1 system ha−1) of septic systems and was the focal point of a project to improve water quality via the improvement of wastewater management (Figure 1). Most of the septic systems in the Lick Creek Watershed have been in operation for at least 40 years. Septic tanks that received pump-outs were selected based on which homeowners volunteered for the project (n = 37). Eight of the 37 pumped tanks were not located within the selected high-density watershed, but these systems were located nearby. Local contractors were employed to provide tank pumping services. The studied septic systems were pumped from August 2015 to February 2017.

2.2. Septage Characterization and Sampling

Before pumping began, the scum, liquid, and sludge layers were measured using a Sludge Judge to determine the total thickness of each layer and the total depth of the septage in the tank. The Sludge Judge is a wastewater sampling device consisting of a plastic tube with graduated depth markings, and at the base of the tubing is a ball valve. The Sludge Judge was lowered into the septic tank until the bottom was reached, which engaged the valve and allowed septage to enter the sampler. The Sludge Judge was removed from the tank, and the thickness of each layer was measured. Physicochemical parameters (pH, dissolved oxygen, temperature, specific conductance, and oxidation-reduction potential) were determined in the field using a YSI-556 multiparameter meter for each septage layer. Samples from the scum, liquid, and sludge layers were transferred to a calibration cup and threaded onto a YSI-556 multiparameter meter. When the readings stabilized, the values were recorded onto field sheets. For each tank, the scum layer was analyzed first, followed by the liquid and then the sludge layers, and the calibration cup was flushed with tap water between each layer. Wastewater samples were collected in clean polypropylene bottles and were lime-stabilized to kill any pathogenic microorganisms present. The lime consisted of pulverized dolomitic limestone comprised of a combination of calcium, magnesium, calcium oxide, magnesium oxide, calcium carbonate, and magnesium carbonate and did not contain any of the analytes discussed later in this subsection. The samples were transported on ice to the NC Department of Agriculture and Consumer Services laboratory, where they were analyzed for TP and heavy metals (Cd, Cu, Pb, Ni, and Zn). These heavy metals were the only metals included in the laboratory’s suite of analytes at the time of the current study. This laboratory was selected based on its proximity to the monitoring sites and, more importantly, is commonly used by growers and land appliers to analyze septage samples to ensure compliance before land application.
TP and metals were analyzed using acid digestion according to EPA Method 200.7 using inductively coupled plasma-atomic emission spectrometry [39,40]. For TP, a 5.0-mL aliquot of liquid waste and a 0.5-g aliquot of dried and ground solid or semi-solid waste was digested in 10 mL of 15.6 N nitric acid. For heavy metals, liquid waste was analyzed in a similar manner to TP. However, for solid or semi-solid waste analysis, a 1.0-g aliquot of a dried and ground sample was digested in 15 or 10 mL of nitric acid, respectively. For TP and heavy metals, liquid waste was digested for 20 min at 180 °C in a Mars 6 microwave digestion system [41], whereas solid waste was digested for 30 min at 200 °C in the same microwave system [39,40,41]. The digested samples were mixed with deionized water up to 50 mL in volume and then filtered through acid-washed filter paper before measurement. After digestion and filtration, concentrations of TP and heavy metals were quantified using a Spectro Analytical Spectro Arcos EOP and Arcos II EOP spectrometer. The method detection limits for each pollutant in liquid and solid waste were the following: 0.22 and 1.10 mg L−1 for phosphorus; 0.020 and 0.100 mg L−1 for cadmium; 0.06 and 0.31 mg L−1 for copper; 0.060 and 0.300 mg L−1 for lead; 0.040 and 0.200 mg L−1 for nickel; and 0.10 and 0.50 mg L−1 for zinc.

2.3. Data and Statistical Analysis

TP and heavy metal concentration data were converted to masses (in grams) using Equation (1)
Mass = C × 0.00835   lbs 1000   gal × 453.592   g 1   lb × Tank size ( gal ) ,
where C is the pollutant concentration (mg L−1).
To determine the relative percent of scum, liquid, and sludge present, the thickness of each layer was divided by the total depth of the septage. The mass for each layer was calculated by multiplying the pollutant concentration by the volume. The relative percent of scum, liquid, and sludge for each tank was determined. A total mass was calculated for each tank by multiplying the mass of each layer by its percent thickness and adding these masses together. Watershed masses of TP and metals were estimated by multiplying the median mass by the total number of septic tanks in the watershed. A Kruskal–Wallis H-test was used to determine if statistical differences existed in concentrations and masses of TP, cadmium, copper, lead, nickel, and zinc between the scum, liquid, and sludge layers at a 95% confidence interval. If a significant result was found using the Kruskal–Wallis test, then post hoc Wilcoxon rank sum tests were used with the Holm p-adjustment factor. All statistical analyses were completed using the R statistical framework [42]. The data were compiled into figures using the R statistical framework [42] and the following packages: “ggplot2” [43], “readxl” [44], and “cowplot” [45].

3. Results and Discussion

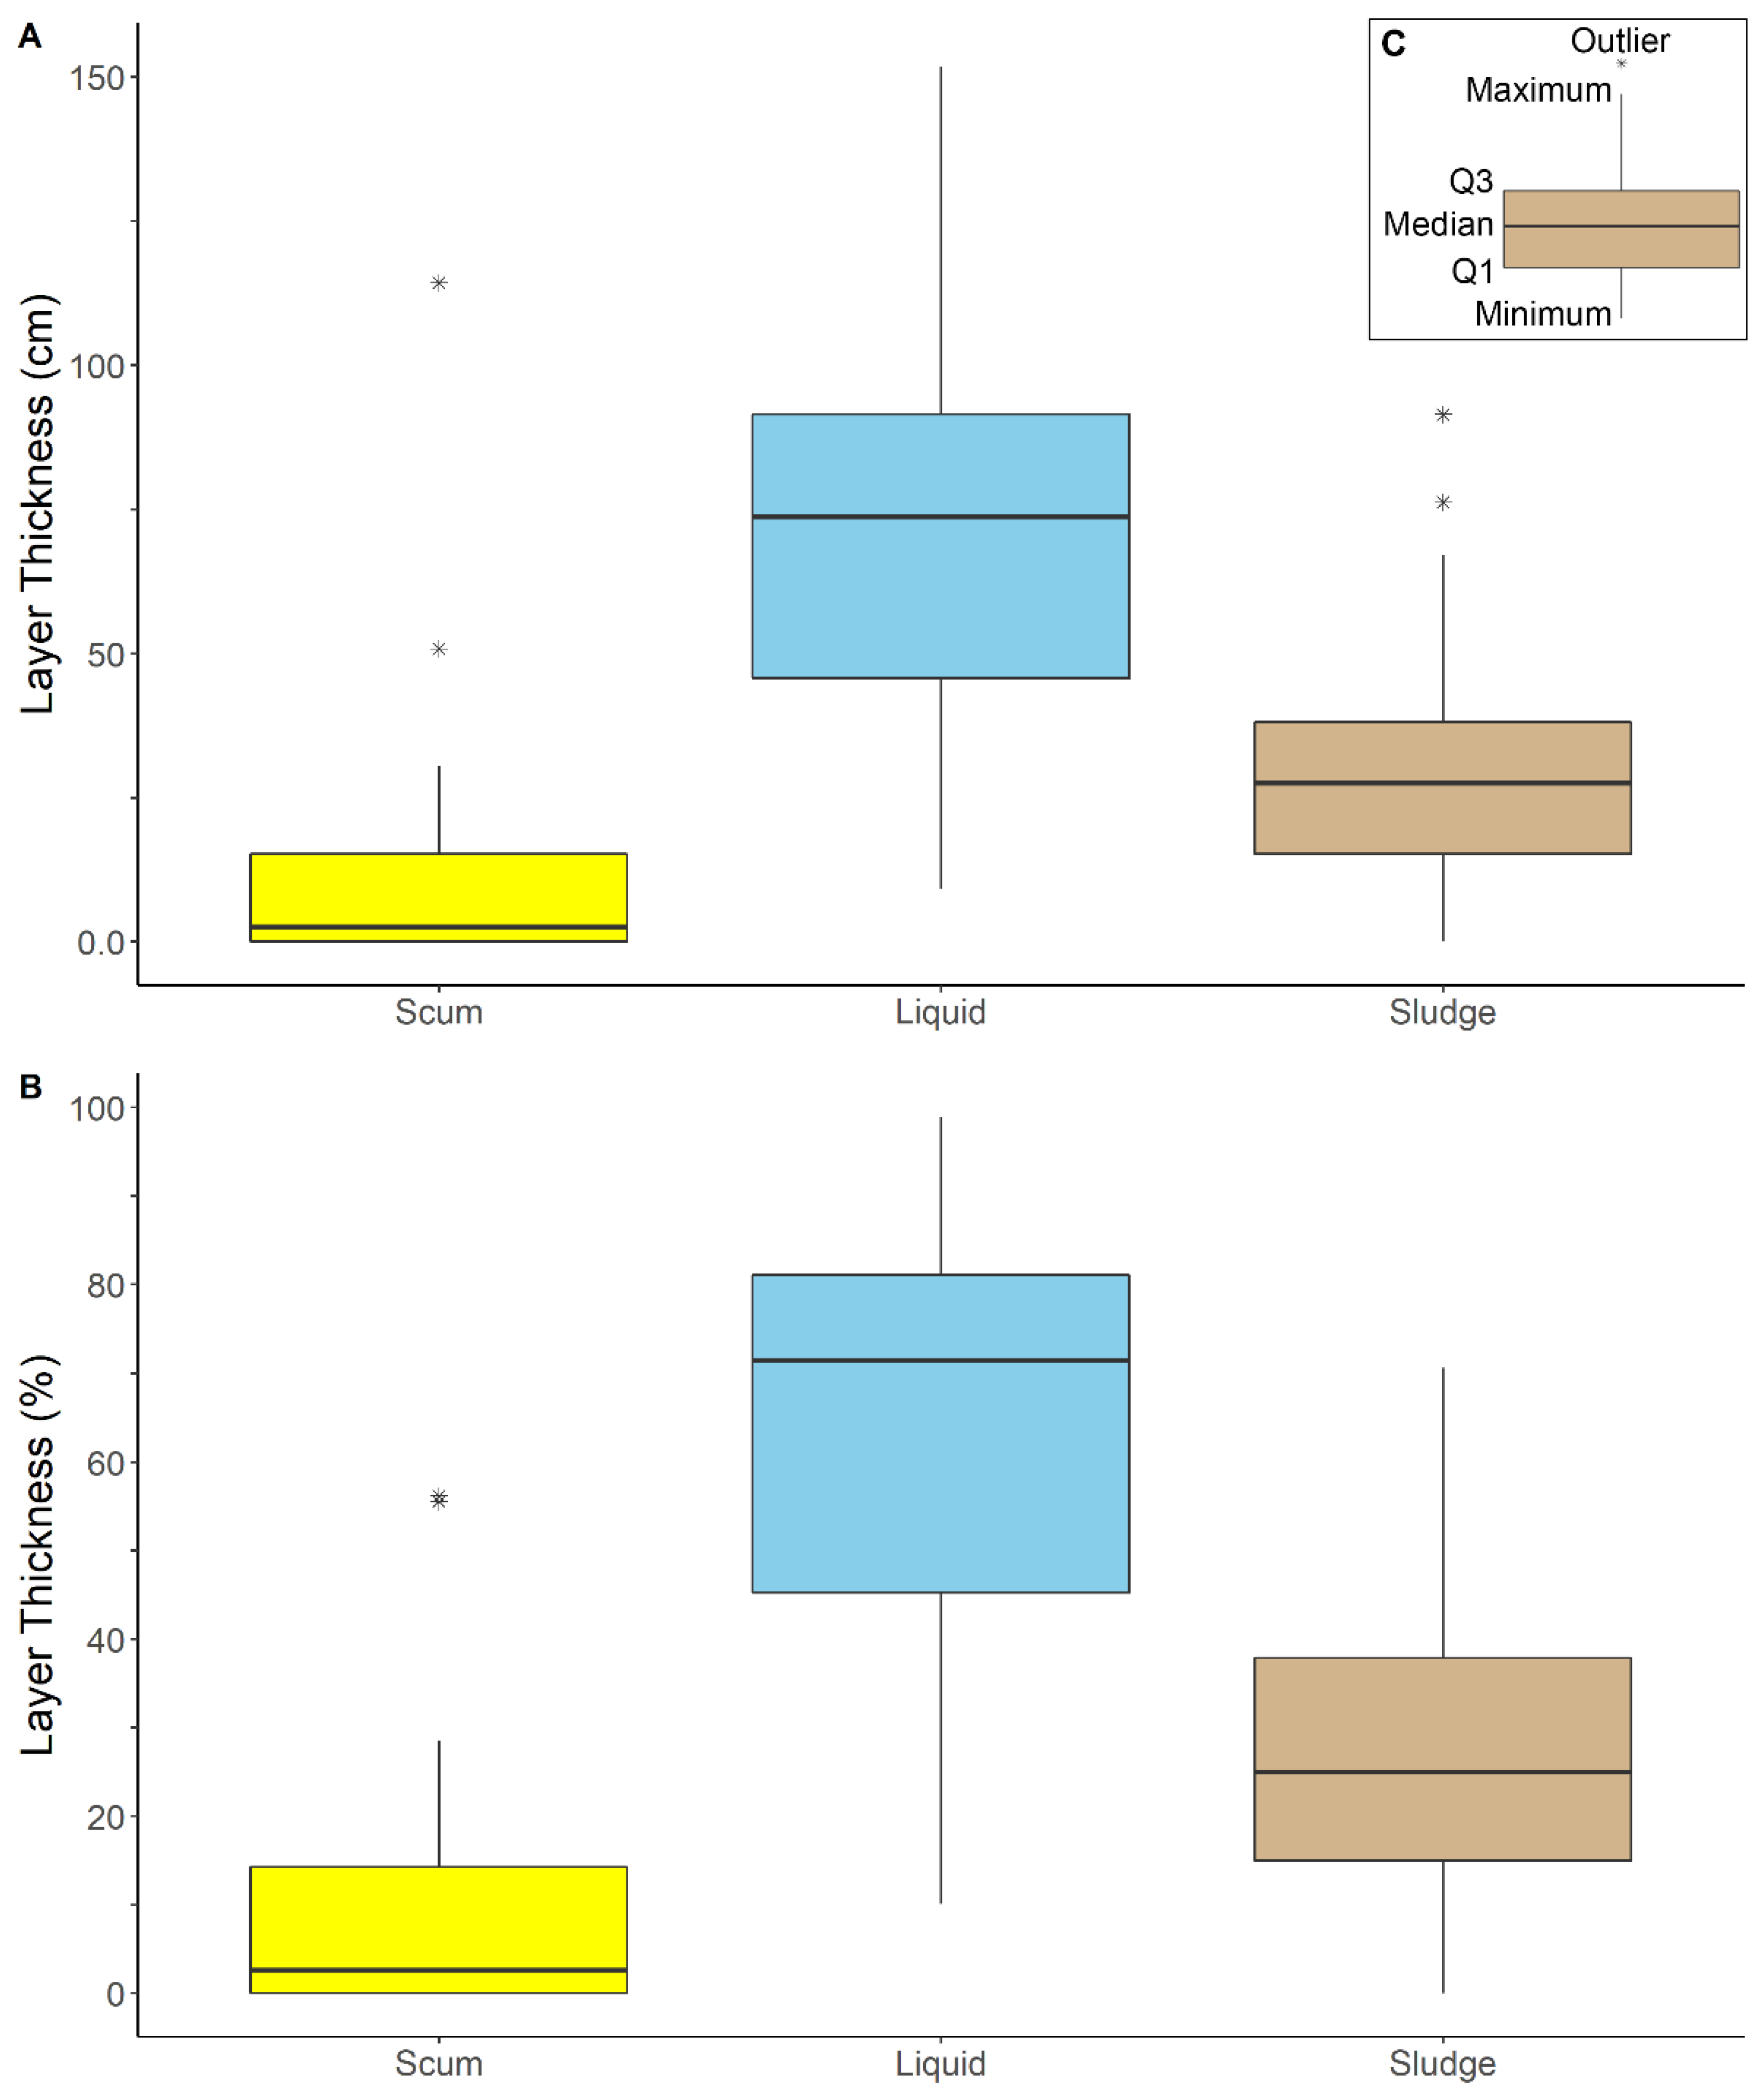
3.1. Physical and Chemical Characteristics of Septage

The liquid layer contained the greatest median thickness (73.66 cm) across all pumped tanks, followed by the sludge (27.43 cm) then scum (2.54 cm) layers (Figure 2). In some cases (n = 2), the scum and/or sludge layers were thicker than the liquid layer, likely from infrequent septic maintenance. The US EPA [46] suggests that homeowners should regularly pump their septic tank, typically every 3–5 years. However, depending on the size of the septic tank and the number of residents served by the system, the pumping frequency may need to be adjusted to maintain design performance. Households with smaller tank volumes and/or those with a greater number of occupants typically require more frequent pump-outs [4,47]. In the current study, the septic tanks were typically 3785 L (1000 US gallons), and the average person per household in Durham County, North Carolina was 2.36 people [48]. Assuming the US Census estimate was accurate for the study area, then the pumping frequency should be approximately 3.7–5.9 years for year-round residences [47].
The median septic tank contained a total septage thickness of 103.63 cm, with the scum, liquid, and sludge layers comprising approximately 2%, 72%, and 26%, respectively (Figure 2). The layer thickness data suggest that most of the tanks pumped in the current study likely followed routine maintenance guidance. Septic systems should be pumped whenever the solids level is >33% of the liquid depth in any compartment (15A NCAC 18A.1961(a)(2) [3]). The median septic system contained solid layers (e.g., scum and sludge) that were approximately 29% of the liquid layer, suggesting that most septic systems were near the recommended threshold for pumping. At the time of pumping, the percentage of solids in the tanks ranged from 1% to 90%. There were 4 residences that contained solids levels that were ≤10%. Therefore, approximately 11% (4 out of 37) of the homeowners that participated in the study pumped their tank before they needed to with regard to solids accumulation. The study area has a predominance of expansive clays with very low permeability rates that often lead to hydraulic malfunctions and the surfacing of effluent for conventional-style septic systems [10]. It is possible some system owners may have pumped their tanks to relieve the hydraulic pressure from saturated drainfield trenches. The homeowners were informed that the grant would cover expenses to pump the tank, and thus they may also have been motivated to participate earlier than necessary to pump their tanks. There were 18 residences with solid levels that exceeded 33% of these residences and 11 tanks that contained solid levels that constituted >50% of the liquid volume. These findings suggest that homeowners may benefit from planning tools or guidance to develop a routine maintenance schedule.
Physicochemical parameters were similar between the scum, liquid, and sludge layers (Table 1). Dissolved oxygen values indicated hypoxia and oxidation-reduction potential indicated a strongly reducing environment in all layers, though the liquid and sludge layers contained lower values for both parameters than the scum layer. These values were expected, since the septic tank is an anaerobic environment designed to facilitate primary treatment, digestion of organic matter, and conversion of organic nitrogen to ammonium [2]. The mean and median values of specific conductance were greatest in the sludge layer, followed by the liquid and scum layers, but these layers contained considerable overlap in their ranges.

3.2. Total Phosphorus and Metal in Septage

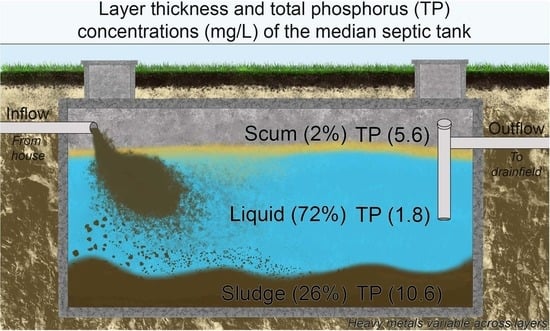
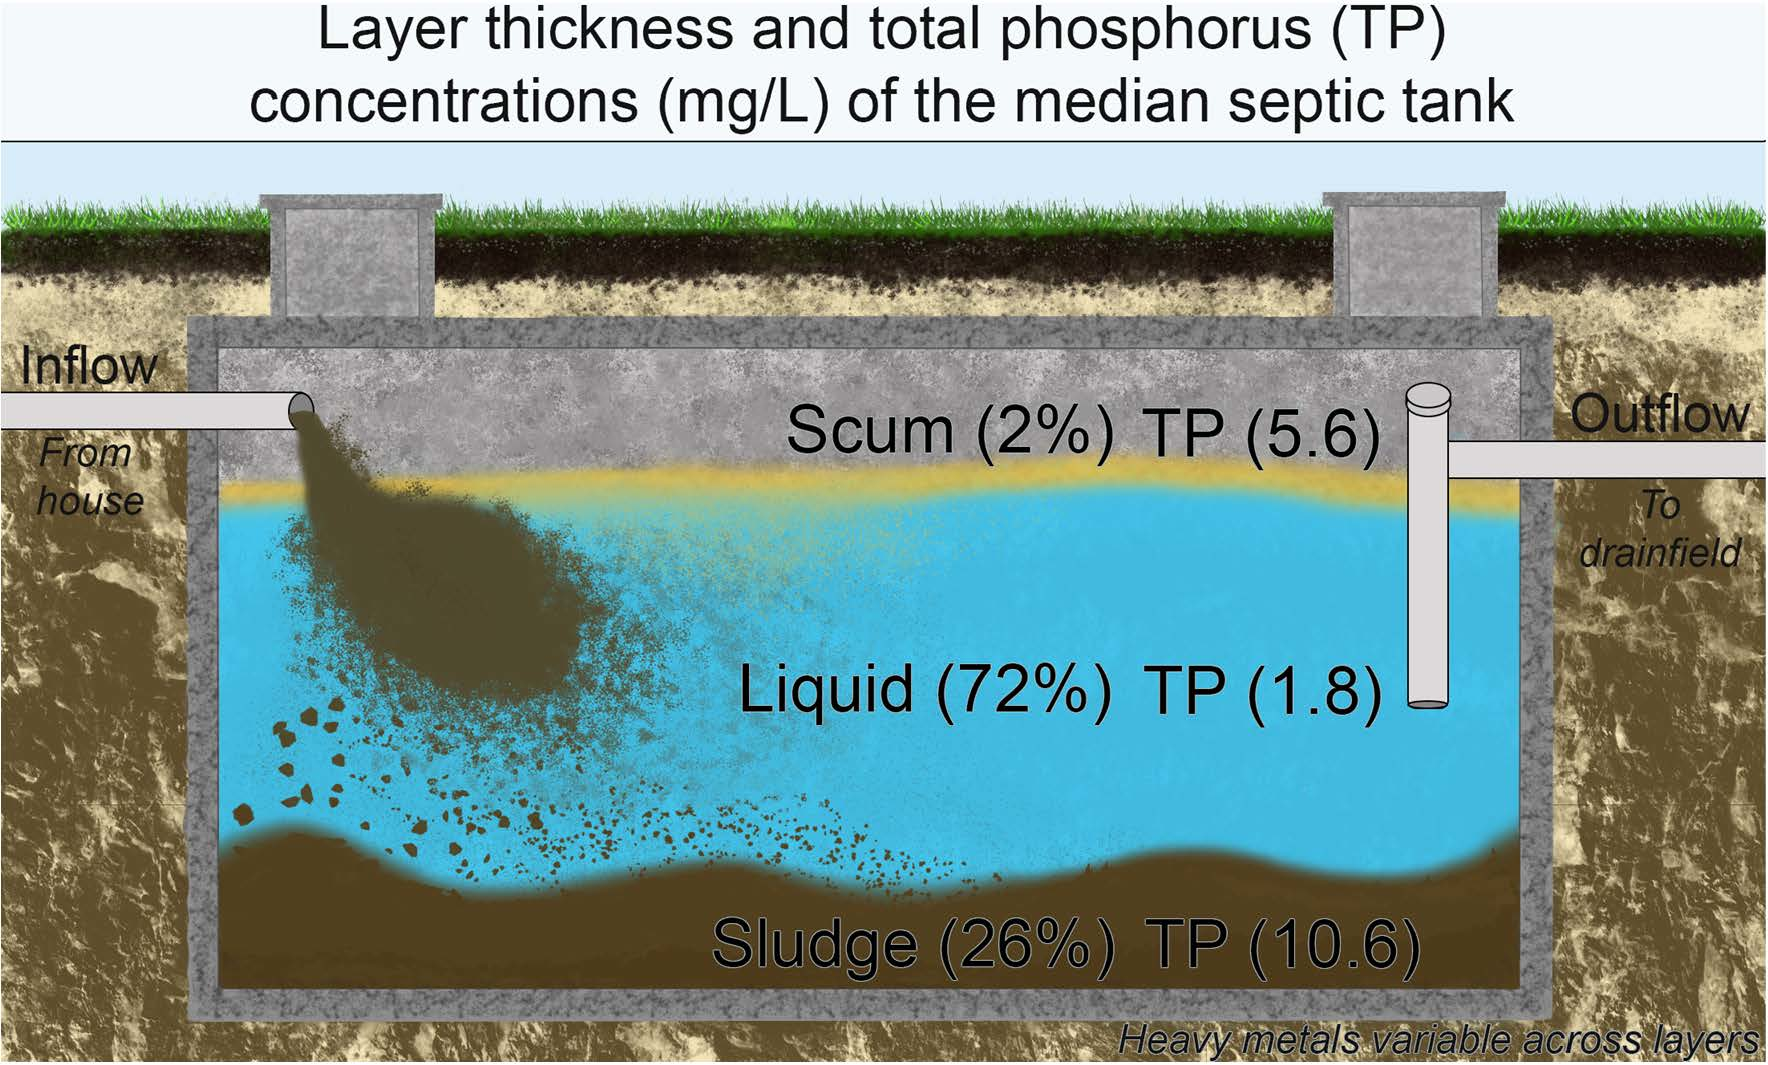
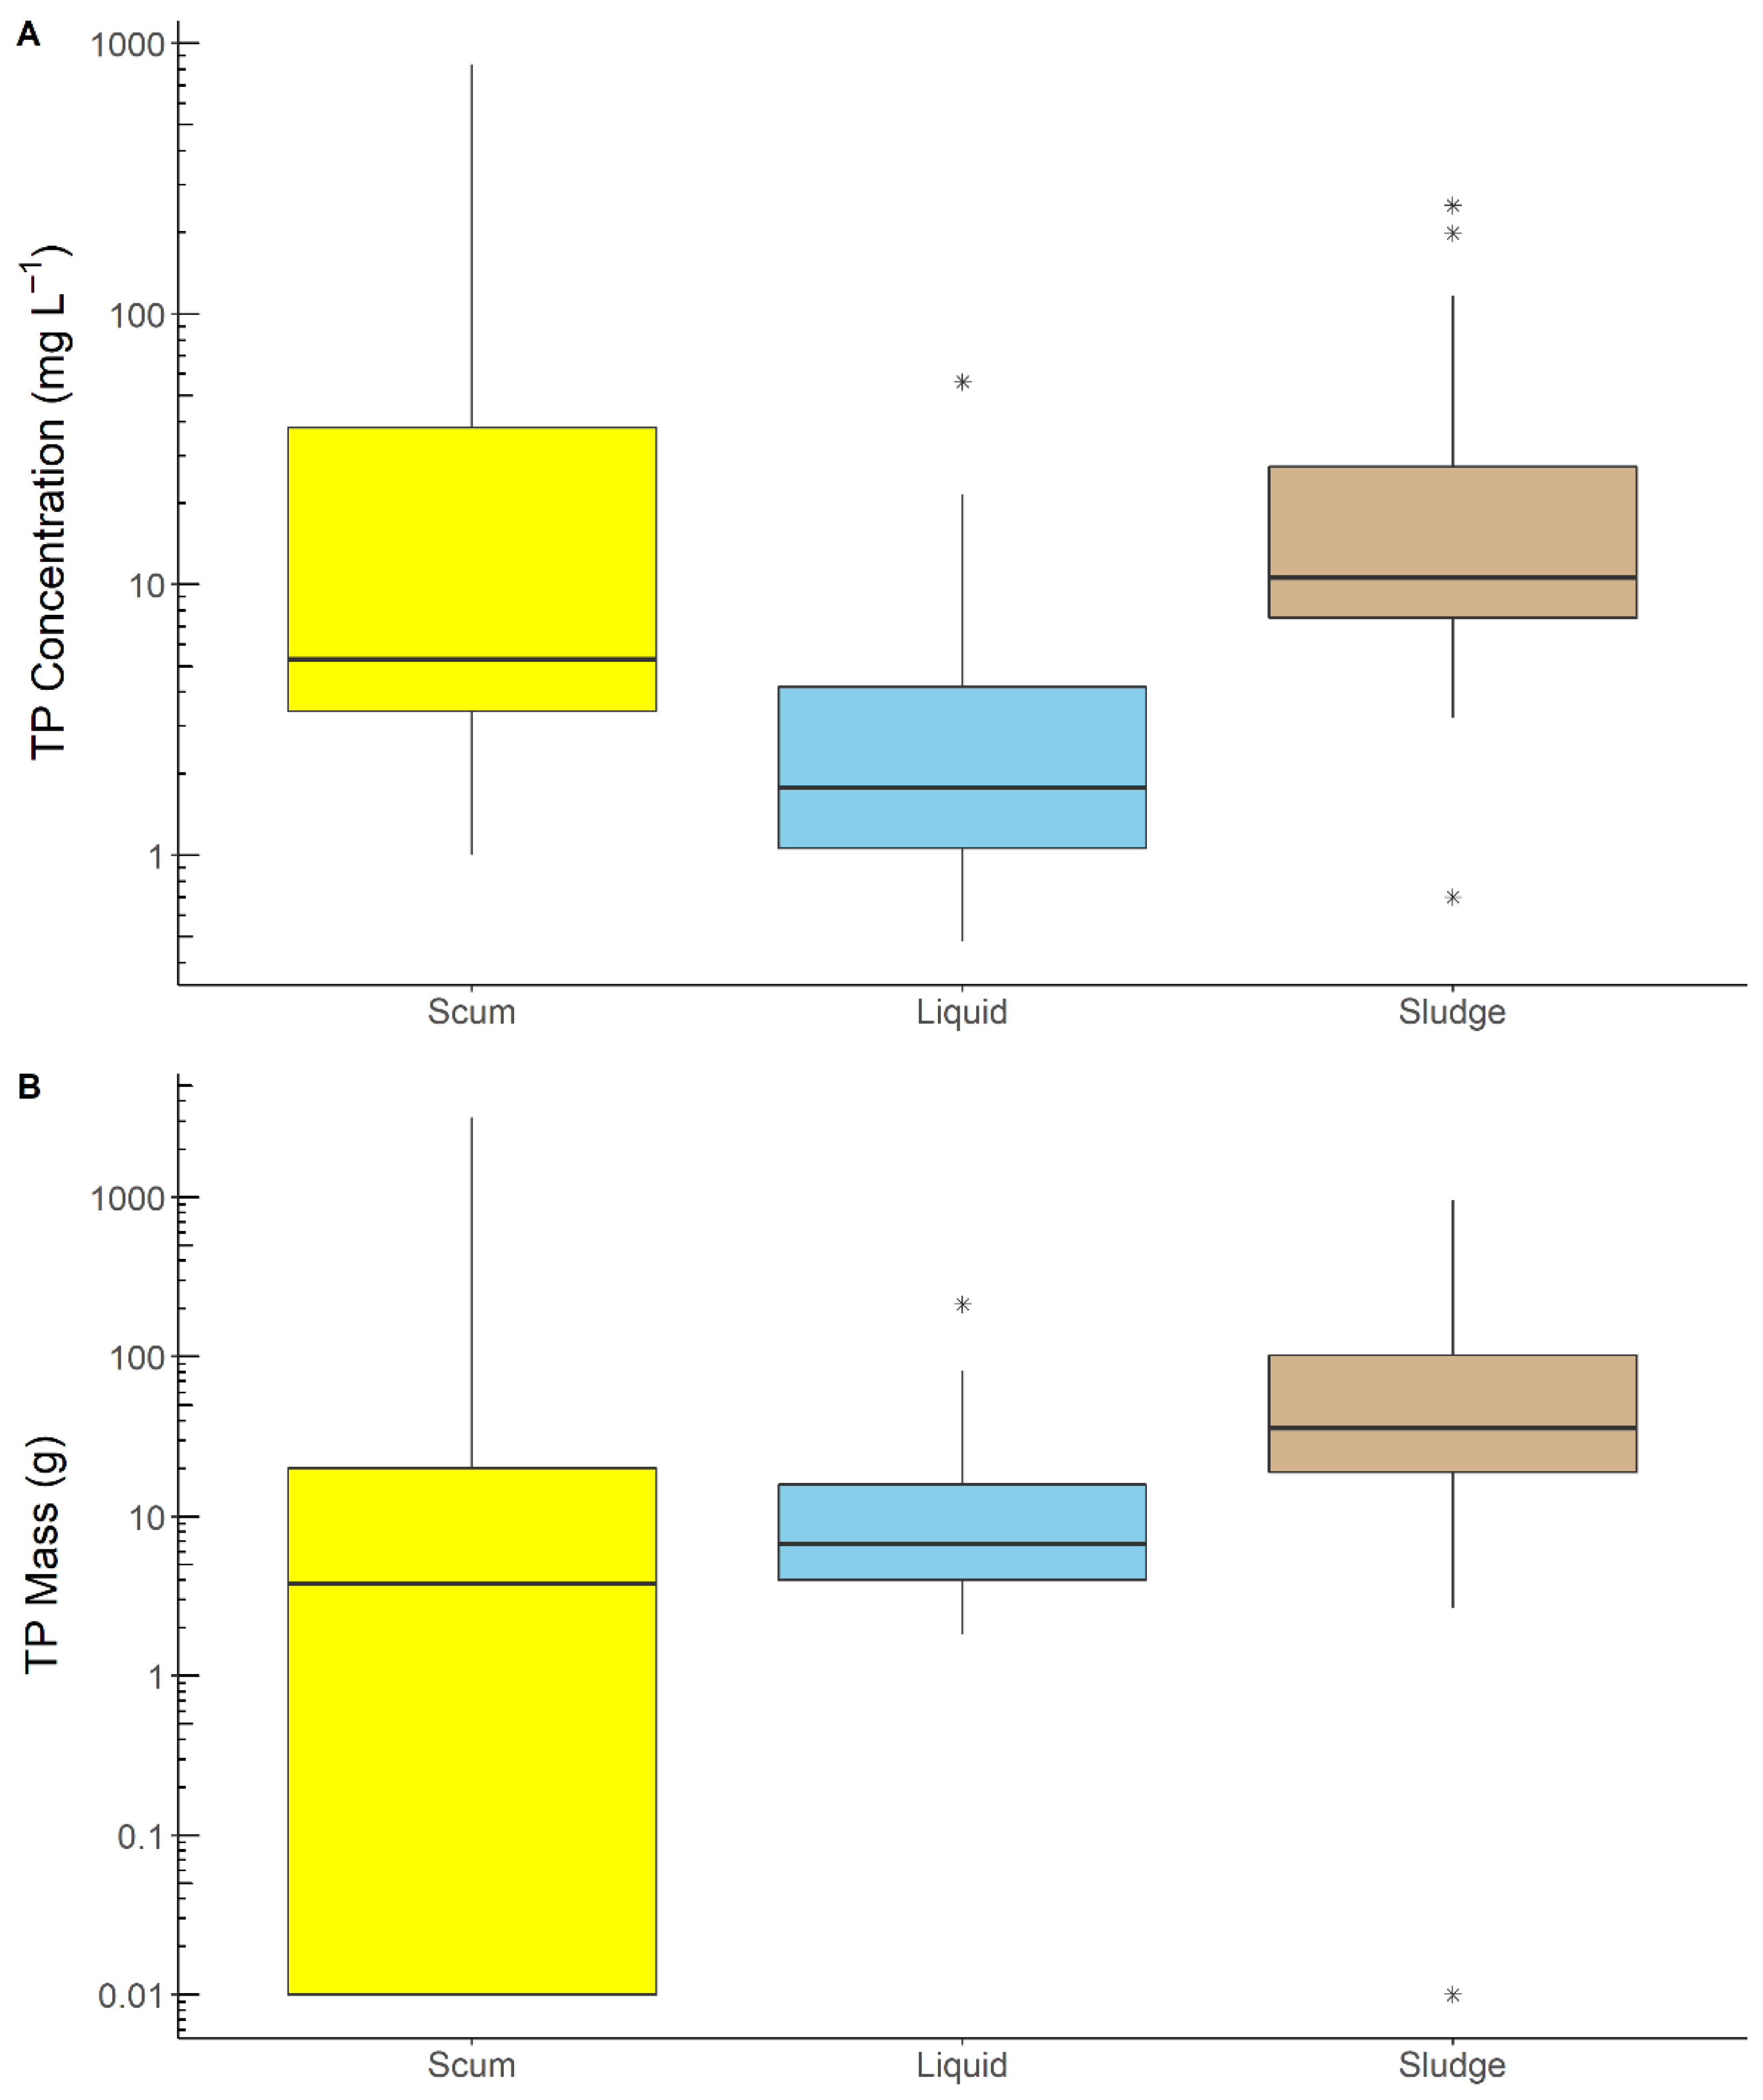
3.2.1. Total Phosphorus Concentrations and Masses

The results indicate that TP concentrations were elevated in the sludge and scum layers relative to the liquid layer (Figure 3). Median concentrations of TP in the sludge (10.60 mg L−1) were double the concentrations observed in the scum (5.30 mg L−1). Despite differences in median TP concentrations, this difference was not statistically significant (p = 0.44), which was likely due to the large variability in TP concentrations. The scum layer contained TP concentrations that ranged from 1.00 to 835 mg L−1, whereas sludge concentrations ranged from 0.70 to 252 mg L−1. The liquid layers typically contained the lowest concentrations of TP relative to the scum and sludge layers. The median TP concentration across all tanks in the liquid layer was 1.77 mg L−1, and the concentrations ranged from 0.48 to 56.20 mg L−1. The concentration differences were statistically significant when comparing the liquid to the sludge (p < 0.01) and scum (p = 0.01) layers.
The masses of TP tended to be elevated in the sludge layer, followed by the liquid and scum layers (Figure 3). The sludge layer contained the greatest median TP mass (35.60 g), which was approximately 5 and 9 times greater than the liquid (6.70 g) and scum (3.79 g) layers, respectively. These differences were statistically significant at p < 0.01. The median TP mass in the liquid layer was approximately double the median of the scum layer, although this difference was not significant (p = 0.18). Trends between the scum and liquid layers reversed for TP masses because there were 12 septic tanks (32% of the total) where the scum layer was less than 1 cm at the time of pumping, and thus there was little to no TP present. However, the scum layer contained the highest maximum TP value of 3162 g, which was about 3 and 15 times greater than the max values in the sludge and liquid layers, respectively.
The concentrations of TP in liquid wastewater measured by the current study overlapped with those of past studies [3,24,25,26,31,35,49,50,51,52]. These studies found that phosphorus concentrations in liquid wastewater can be variable, ranging from 1.20 to 39.5 mg L−1. In the current study, median TP concentration in liquid wastewater was within the low end of this range (1.77 mg L−1). Furthermore, 23 septic tanks were within this range of liquid TP concentrations. Of the 14 tanks that were outside this range, 11 were less than the range, 1 exceeded the range, and 2 were missing data due to laboratory error. For the tanks that were lower than the range, the median difference between their observed TP concentration and the minimum range value was 0.3 mg L−1 (0.03–0.72 mg L−1). The tank that exceeded the range exceeded it by 16.7 mg L−1. The current study found congruence in TP concentrations in liquid wastewater.
Concentrations of TP in the scum and sludge layers exhibited high variability and tended to have greater TP concentrations relative to the liquid wastewater. Municipal wastewater treatment facilities also contained TP concentrations in sludge that exhibited large variability [53,54]. Few studies have quantified the concentrations or masses of TP in domestic septage from septic systems [35], but more information is available from septage collected from municipal wastewater treatment facilities [55,56]. Brandes [35] reported mean TP concentrations of 281, 100, and 96 mg L−1 across 3 sites. Septage from municipal wastewater treatment facilities contained similar TP concentrations. The US EPA [56] reported a mean TP concentration of 210 mg L−1, and Krithika et al. [55] found a mean TP concentration of 77 mg L−1. The reported range of TP values was 7–760 mg L−1 across both studies. Assuming the range of TP concentrations was representative of septage from a 3785-L tank, the TP masses ranged from 18.94 to 2878.50 g. Brandes [35] reported mean TP masses of 957.86 g, 454.50 g, and 872.64 g across 3 different septic systems, which were similar to the TP masses estimated from septage collected from municipal wastewater facilities. In the current study, the median septic tank contained a TP mass of 46.09 g, which was within the range reported by these studies.

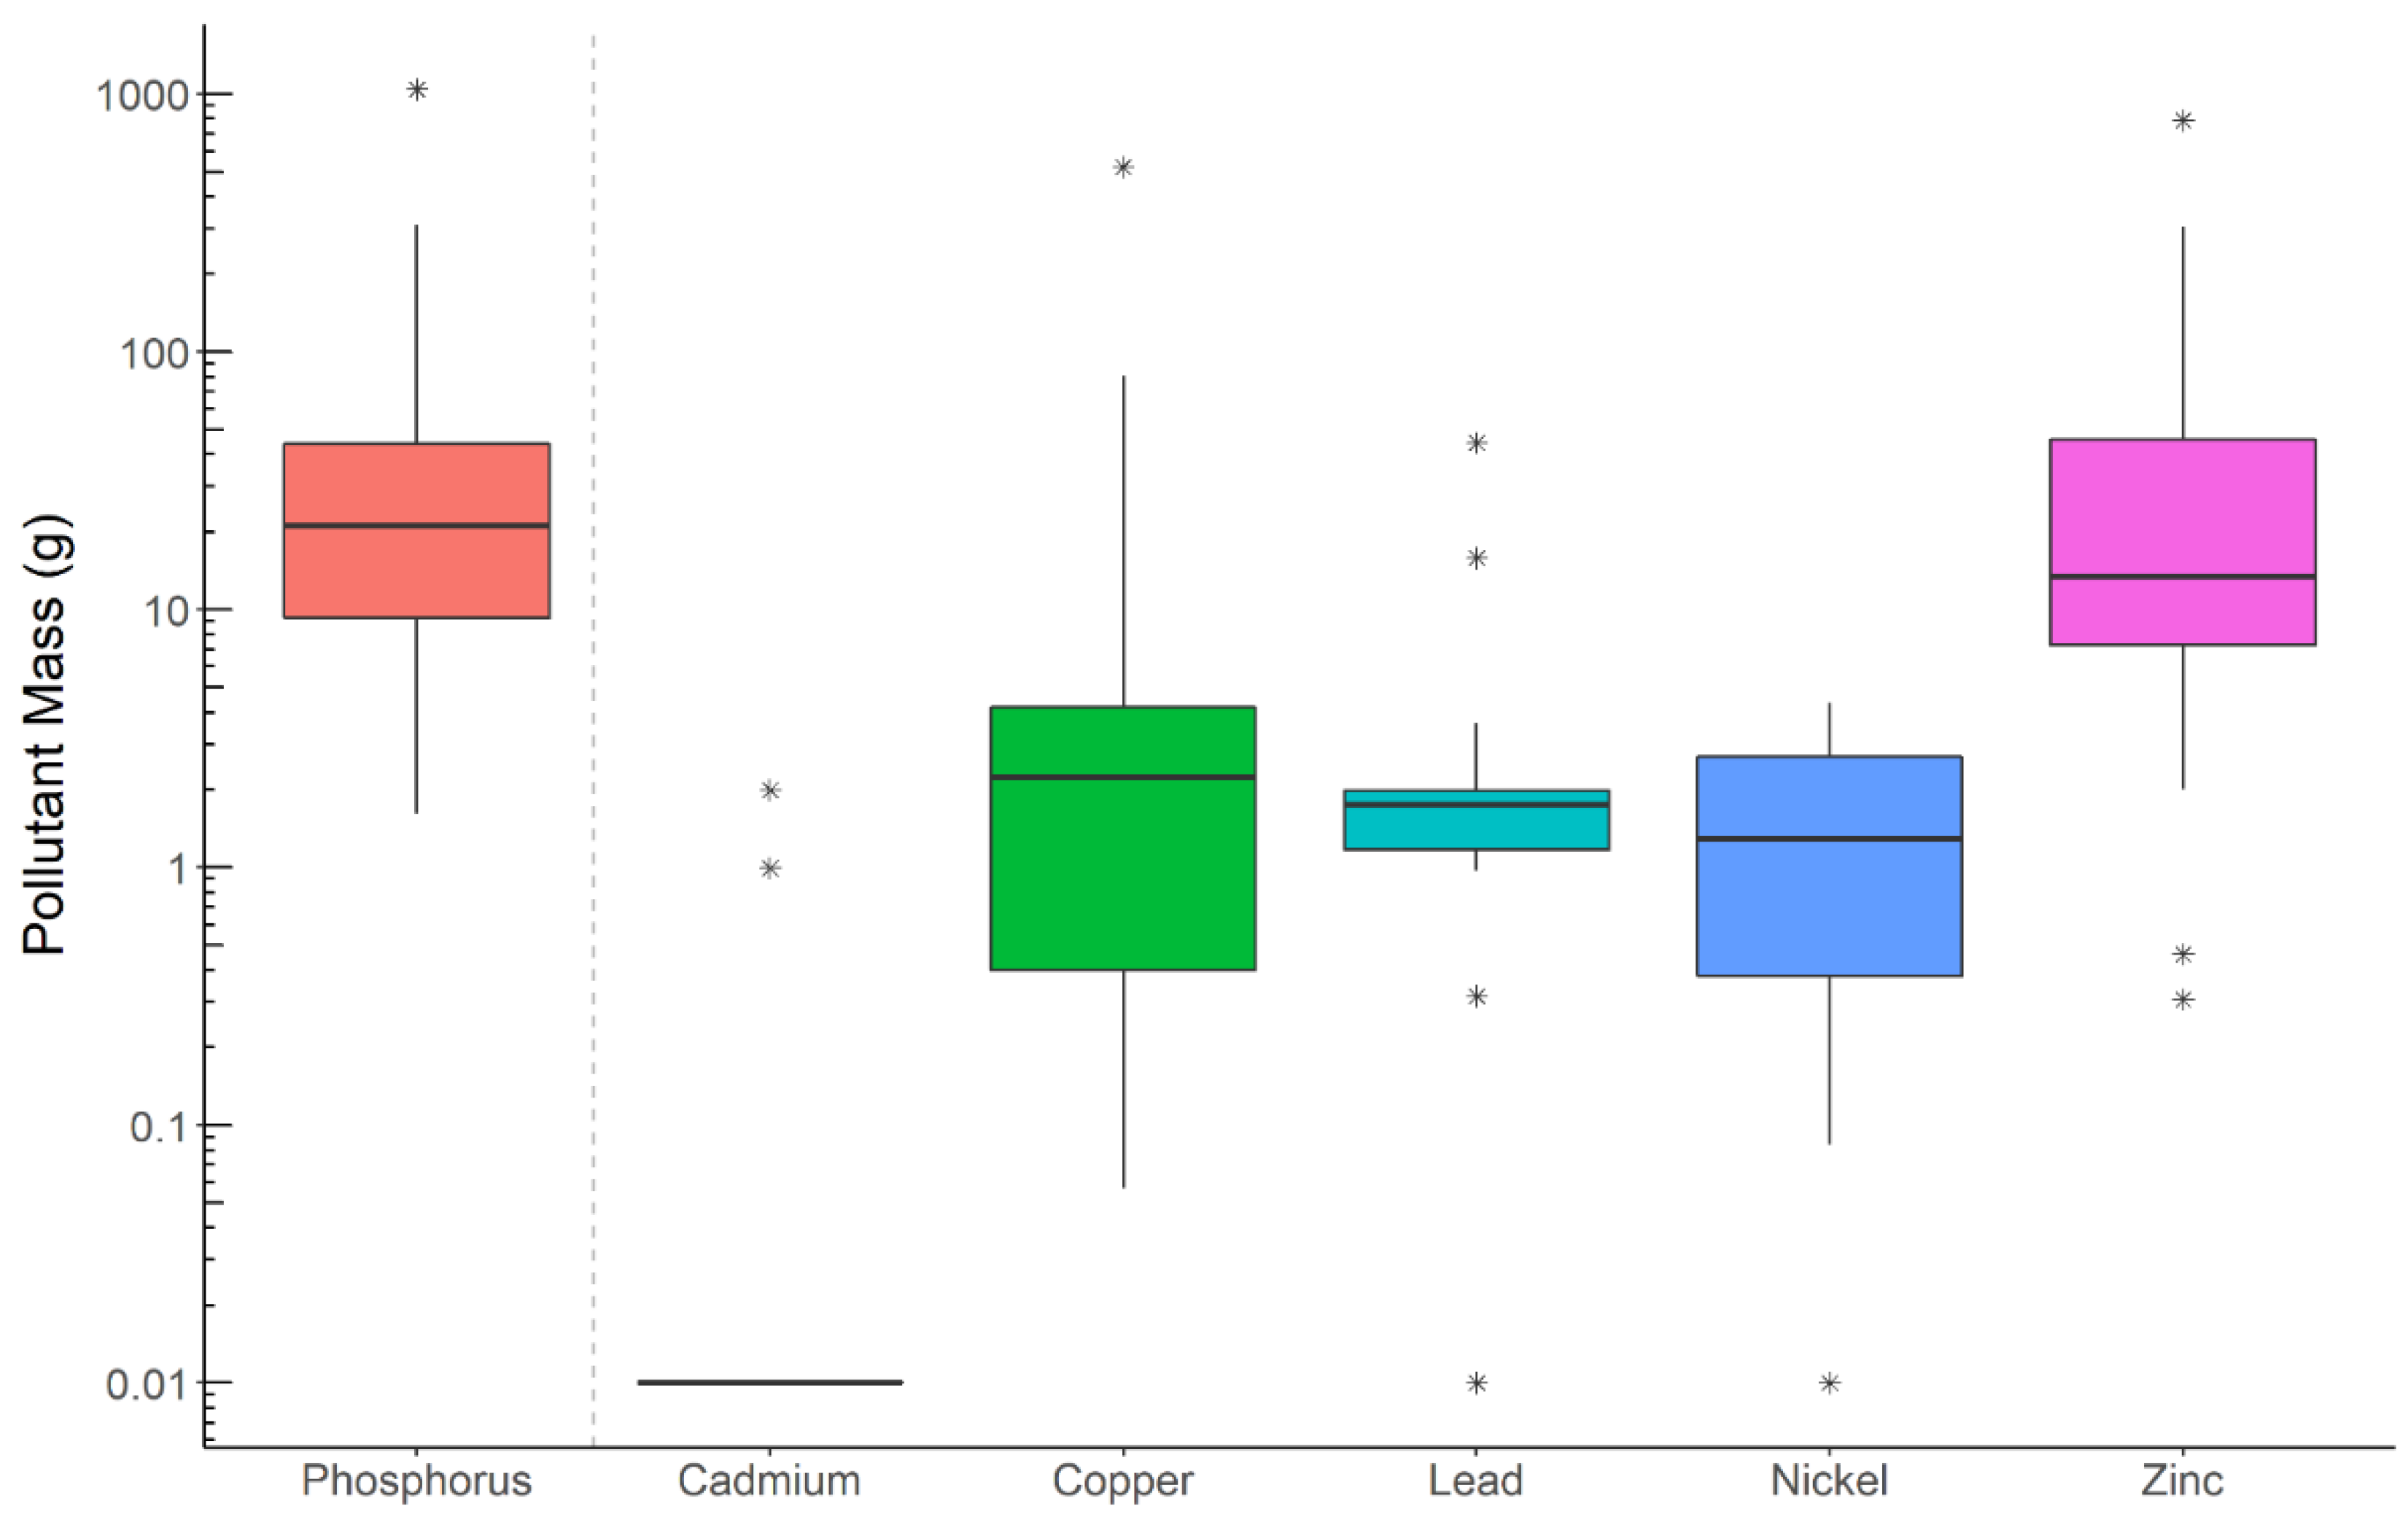
3.2.2. Metal Concentrations and Masses

Zinc, copper, and lead were the most prominent metals observed across all septage layers (Table 2). The median concentration of zinc was greatest in the liquid layer, which was approximately 2.5 and 3 times greater than the scum and sludge layers, respectively. This difference was not statistically significant (p = 0.13). The scum layer contained the greatest median value of copper and lead relative to the other septage layers (Table 2). Copper concentrations between the scum and liquid layers were statistically different (p = 0.05). There were no significant differences found in copper concentrations when comparing the sludge to the scum (p = 0.13) or liquid (p = 0.27) layers. While slight differences in the median concentrations of lead between septage layers were observed, there was no statistically significant difference (p = 0.56). Median concentrations of nickel were similar across all septage layers (Table 2). Cadmium concentrations were routinely below the detection limit in all septage layers, thus the median concentrations were <0.01 mg L−1 (Table 2). The concentrations of these metals were not statistically significant between the septage layers for both nickel (p = 0.79) and cadmium (p = 0.99).
Liquid and sludge layers exhibited similar trends in metal masses as those observed in the concentration data (Table 2). Similar to the TP data, scum layers exhibited a decline in median masses of metals, and since there were 12 septic tanks without a measurable scum layer, the metal mass was 0 g. Median masses for both zinc and lead were the greatest in the liquid layer (Table 2). The median mass of zinc in the liquid layer was approximately 4 times greater than that of the sludge layer (p = 0.04) and 13 times greater than the scum layer (p < 0.01), both of which were statistically significant differences. Furthermore, the median mass of zinc in the sludge layer was approximately 3 times greater than the scum layer (p = 0.04). Similar trends were observed in median masses of lead, but differences between the septage layers were not significantly different (p = 0.07). Copper masses tended to be elevated in the sludge layer relative to the liquid and scum layers (Table 2), but this difference was not statistically significant (p = 0.18). The median mass of nickel was identical between the liquid and sludge layers, both of which were elevated relative to the scum layer, but this difference was not statistically significant (p = 0.06). Cadmium masses were negligible in all septage layers and exhibited no statistical differences based on the layer (p = 0.76).
In the current study, the liquid layer contained median concentrations and masses of all metals (except cadmium) that were greater than the values reported by past studies that quantified trace metals in liquid wastewater (Table 2 and Table 3). The main mechanism in reducing metal concentrations in primary effluent is through sedimentation, which is controlled by factors that affect metal solubility and settling rates [57,58]. The elevated median concentration of zinc in the liquid layer and similarity of lead across all layers may be indicative of inadequate sedimentation in septic tanks. Copper, lead, and zinc can form fine particulates (0.2–35 µm), which may be too fine (typically <35 µm) to be removed during primary sedimentation [59]. Past research has found that heavy metal concentrations and masses tend to be elevated in sludge and septage relative to liquid wastewater regardless of the wastewater treatment approach (Table 3). Both septic and municipal wastewater treatment approaches contained a high degree of variability in pollutant concentrations in sludge and septage. Municipal wastewater treatment facilities contain pollutant concentrations that were typically greater than septic systems, which likely occurred due to differences in scale and wastewater characteristics (Table 3). Municipal wastewater treatment facilities generally receive higher volumes of wastewater given the larger communities that these facilities serve relative to residential septic systems. Furthermore, some municipal treatment plants receive industrial wastewater, which can substantially increase the concentrations of heavy metals in sludge or septage [60]. The current study did not find apparent differences in the median metal concentrations between scum, liquid, and sludge layers. This was not expected since past research has found that solid layers typically contain greater concentrations and masses of pollutants relative to the liquid layers (Table 3). However, the mean concentration for each pollutant in the sludge and scum layer was elevated compared with the mean concentration reported in the liquid layer (Table 2). This trend likely occurred because of the large variability in metal concentrations between septic tanks, which is discussed in greater detail in the next section.

3.3. Mass and Watershed Mass of Pollutants from Domestic Septage

The total masses for TP, zinc, and copper were elevated relative to the other measured pollutants (Figure 4). The median septic tank contained masses of TP, cadmium, copper, lead, nickel, and zinc of 20 g, <0.01 g, 2 g, 2 g, 2 g, and 14 g, respectively (Table 4). Total masses for all pollutants (except cadmium) contained a range that spanned several orders of magnitude. The estimates of the total pollutant mass in the studied sub-watershed are summarized in Table 5. The pollutant mass estimates based on median concentrations show that TP and zinc could have an excess of 1 kg in septic tanks throughout the watershed. The estimates of the sub-watershed masses based on the mean values suggest that there was 5.8 kg, 4.8 kg, and 1.7 kg of TP, zinc, and copper, respectively, in all septic tanks throughout the studied sub-watershed, which discharges to the Lick Creek Watershed. The difference between the median and mean values and the variability of the pollutant masses were likely due to individual differences across septic systems.
The studied septic tanks exhibited large variability in layer thickness and concentration, mass, and total mass of pollutants (Figure 2, Figure 3 and Figure 4 and Table 2 and Table 5). There may be several reasons for the variability in the data collected by the current study, which include but are not limited to the homeowner’s maintenance schedule, household wastewater practices, wastewater strength, and volume of wastewater generated. Routinely pumping septic tanks is necessary to maintain the design performance and prevent malfunction [3]. The solid accumulation rate in septic tanks may vary considerably [70], as it is affected by household wastewater practices. Using garbage disposals, plumbing greywater into septic tanks, and flushing household wastes (e.g., tissues, cigarette butts, food waste, oils, grease, or other cooking wastes) are household wastewater practices that can increase the scum and sludge accumulation rate. These practices can also increase mass loads of TP and metals to the septic tank, thereby increasing concentrations of contaminants and requiring additional treatment [3].
The most dominant sources of TP in septic tank septage are typically human feces, household cleaning products and detergents, and food wastes [2,71]. Most of these sources are contributed from toilets and baths, sinks, and appliances [2,3]. Human feces contain nucleic acids and adenosine tri-phosphate, which are organic forms of phosphorus [2]. Tjandraatmadja et al. [71] detected phosphorus in 97% of 156 household products. Food products also contain various sugars, phospholipids, and nucleotides that contribute to organic phosphorus levels in septic tanks. However, these contributions are typically much lower relative to fecal matter and household products. Most forms of phosphorus enter the tank as organics or polyphosphates until anaerobic processes convert these forms of phosphorus into orthophosphate [2,7]. Approximately 70–80% of the TP that enters the septic tank will leave as effluent [29,51,72,73], which is later discharged to subsoils, where adsorption and/or mineralization processes can reduce the TP concentrations further [10]. The remaining 20–30% of TP remains in the septic tank, where TP may settle out and accumulate in the sludge layer [2] or bind with dissolved iron to form vivianite in the tank [74,75]. These studies suggest that sources of TP are common in residential settings, where the generation of wastes from humans, household products, and food sources occurs daily.
Sources of heavy metals are more variable. Zinc and copper are essential micronutrients that catalyze enzymatic processes [76,77], thus food can often serve as a source of these metals. Nickel is another essential micronutrient [78] which is also important for growth of cereal crops [79]. Past studies have also quantified trace amounts of lead, nickel, and cadmium in food [80,81]. Older construction homes may have leaded pipe infrastructures and/or lead paints, which may leach into septic tanks. In the United States, lead-based paints were banned in 1978 [82], and the use of pipes, plumbing fixtures, solder, or flux containing lead was banned in 1986 [83]. Most of the residences in the current study were originally built between the 1950s and 1970s [84], thus it is possible that leaded materials were used and, if corroded, may have increased the lead loads to the septic tanks. Two septic tanks contained higher concentrations and masses of lead than others in the study, which could be due to corroded leaded pipes, but more investigation is warranted to confirm this. Corrosion of pipes and taps (i.e., pipe infrastructure constructed from copper alloy or galvanized steel) is also a potential source of copper or zinc [81,85,86]. Another possible source of trace metals is drinking water supplies [81], but metal loads may be highly variable based on the potable water source and surrounding land uses. Household products (e.g., cleaning products, detergents, soaps, sunscreen, deodorant) are common sources of zinc, and traces of lead and nickel can also be detected in many products. Copper and cadmium are typically not found in many household products. Improper disposal of paints (e.g., flushing down sinks or toilets) can increase copper, nickel, and zinc loads to wastewater systems [87]. Sörme and Lagerkvist [81] found that flushing artistic paints can be a source of cadmium. These studies suggest that sources of heavy metals are less common and more variable in TP. Therefore, the similarities in the median concentrations and masses of heavy metals could indicate that most households generated trace amounts of heavy metals.
Pollutant concentrations are generally not considered when planning septic tank maintenance schedules. The frequency of septic tank pumping is generally planned based on the household occupancy and tank size [4,47], which are used to estimate wastewater generation and solids accumulation rate. In the current study, information regarding the time since last pumping was not available for every septic tank. However, there were 4 septic tanks that had not been pumped for at least 8 years, which exceeded the typical 3–5-year pumping frequency [46]. The concentrations of TP and metals in the scum and sludge layers in these tanks were elevated relative to the liquid layer (Table 5). Furthermore, these data were similar to TP and heavy metal ranges in sludge and septage reported by past studies (Table 3). The median concentrations of contaminants in the liquid layers of these 4 septic tanks were elevated relative to the median concentrations of TP (Figure 3) and metals (Table 2) for the liquid layers of all septic tanks. Based on the layer thickness, Tank 2 was predominantly comprised of solids and typically had the greatest pollutant concentrations (Table 4). Tanks 3 and 4 were near the recommended maximum solid volume percent [3], whereas Tank 1 contained the lowest solid content (16%) of the 4 tanks. However, TP and metal concentrations in Tank 1 tended to be greater than those observed in Tanks 3 and 4. Therefore, the accumulation of solids alone may not be a reliable predictor of the pollutant concentrations in residential septage. Tanks 1 and 2 tended to contain elevated metal concentrations relative to Tanks 3 and 4 across all layers, which may have occurred from differences in the wastewater characteristics. Future work should incorporate a homeowner survey to ascertain the household wastewater practices, time since last pumping, water use, and other factors that affect wastewater characteristics. These data could then be used in conjunction with water quality indicators from domestic septage quality for further understanding between the septage pollutant concentrations and homeowner practices.

3.4. Land Application of Septage and Potential Environmental Impacts

Land application of domestic septage and sewage sludge is a common practice in the United States. One of the primary benefits of land application is to recycle nutrients and organic matter in the receiving soils [3]. Land application sites are determined by topography, soil characteristics, depth to groundwater, proximity to surface waters, floodplains, wetlands, and other environmentally sensitive areas. While land application of septage can replenish the nutrients in soils, there remain concerns about potential environmental impacts. Septage can contain elevated concentrations of phosphorus, heavy metals (Table 3), nitrogen, and pathogens [15,16,17,18,19,20]. Repeated application of septage may result in the accumulation of TP and heavy metals, which increases potential for leaching into the groundwater [18,21,22,23]. Groundwater can serve as a conduit for pollutants to enter surface waters, especially in locations with minimal riparian buffers [88]. Furthermore, land application should not occur during periods of inclement weather or when the ground is frozen or snow-covered because of the increased runoff potential and difficulty in using sludge application equipment [89]. Despite these environmental concerns, land application can provide watershed scale benefits.
Septage is commonly treated and applied on land [3]. If land application sites are outside of the watershed of origin, then pumping out tanks acts as a watershed benefit by exporting TP and heavy metals, especially if the original watershed is vulnerable to nutrients, heavy metals, or other pollutants. Nutrients and some heavy metals are essential to biological functioning, but excessive concentrations of these compounds can destabilize aquatic habitats. Lick Creek is classified as a nutrient-sensitive water [90], thus additions of nitrogen and/or phosphorus can degrade the aquatic habitat by facilitating eutrophication, harmful algal blooms, and/or fish kills [91,92]. Septage may also contain elevated concentrations of heavy metals, many of which (e.g., cadmium, chromium, cobalt, copper, mercury, lead, nickel, and zinc) are highly toxic both in their elemental and soluble salt forms [93]. An abundance of heavy metals in the biosphere endangers ecological functioning of terrestrial and aquatic habitats [94]. In the current study, removal of TP and heavy metals provided environmental benefits for Lick Creek. However, the end-of-life management of residential septage requires careful planning, lest these benefits result in translocation of environmental problems to other watersheds.
Land application is a common practice to supplement the use of commercial fertilizers and add value to a byproduct of wastewater treatment processes. Application rates are primarily designed around the crop’s nutrient needs compared to the fertility of the arable soil [89]. In the US, most states use soil phosphorus indices to identify fields at risk for phosphorus losses [95]. Soils that exceed the critical level are rated as “high” or “very high” indicating that these soils will not likely respond to additions of fertilizer [96]. Despite the adoption of soil phosphorus indices, many southern states were unable to limit phosphorus application despite soils being classified as “very high”, thereby increasing the potential for phosphorus runoff [97]. In North Carolina, a significant relationship was found between higher soil phosphorus index ratings and increased masses of TP and dissolved phosphorus in agricultural runoff [98]. These studies suggest that the application of septage (which may contain up to 760 mg L−1 of TP (Table 3)) to soils with critical soil phosphorus indices increases the potential for transport of TP to downstream water resources via agriculture runoff. This is a particular concern for land application sites located within nutrient-sensitive waters, since eutrophication can result in environmental [91,92] and economic [99] damages.
Similar concerns exist regarding the accumulation of heavy metals in land application sites and the potential environmental and public health impacts. Of the heavy metals analyzed in the current study, copper, nickel, and zinc are essential plant micronutrients, whereas cadmium and lead are not essential elements [94]. The long-term use of septage at application sites may cause an accumulation of highly persistent toxic metals in soils that may inhibit crop growth and eventually translocate into plant tissues [15,94,100]. Consuming crops grown in metal-contaminated soils can endanger human health [15], potentially resulting in the development of acute or chronic diseases [100]. To mitigate environmental and public health damages from land application, the US EPA [69] mandates (40 CFR 503.13) that any biosolid material applied must not exceed the ceiling concentrations for heavy metals that pose a risk. The ceiling concentrations and mass loads for the 5 heavy metals focused on by the current study are summarized in Table 3.
In the current study, heavy metal concentrations were substantially lower than the ceiling concentrations mandated by the US EPA (Table 3), indicating that it may take long-term application of septage to exceed these concentrations. Septage is monitored before it can be applied to land to ensure compliance. Compliance samples should be a homogenized sample of septage (scum, liquid, and sludge). If the compliance sample only contains the liquid portion of wastewater, past studies and data from the current study suggest that the concentrations of TP and heavy metals may be underestimated. Continued application of septage with underestimated pollutant concentrations and masses may likely result in environmental health risks (e.g., eutrophication from TP leaching, metal accumulation in the soil profile, or leaching to water resources). Toxic metal accumulation in the tilled horizon of agricultural soils could result in lower crop yields or bioaccumulation in plant matter, resulting in human health risks. Currently, the US EPA’s [13] guide for land appliers contains a monitoring section with general recommendations, but it does not emphasize the importance of collecting a representative composite sample of all septage layers in the context of environmental and public health. By excluding the scum and sludge layers in compliance samples, the mean concentrations and masses of TP could be underestimated by up to 15 times. Similarly, the mean concentrations and masses of heavy metals may be underestimated by between 1.4 and 21 times depending on the metal and the source of septage.

4. Conclusions

The goal of this study was to measure the layer thicknesses of the scum, liquid, and scum layers and quantify concentrations and masses of TP and heavy metals in septage collected from residential septic tanks. The median percent thickness of the liquid layer was 72%, suggesting that most septic tanks received adequate maintenance. The sludge and scum layers contained a median percent thickness of 25% and 3%, respectively. Median concentrations and masses of TP were greatest in the sludge layer, containing median values of 10.6 mg L−1 and 35.6 g, respectively. Except for zinc, the median concentrations of heavy metals were similar across all layers. The layer thickness, pollutant concentration, and pollutant masses all exhibited large variability, suggesting that household behaviors, wastewater strength, the volume of wastewater generation, and frequency of maintenance may have differed substantially between tanks. These factors in turn have the potential to affect TP and heavy metal concentrations observed in septage. Masses and watershed estimates indicate that the septic tanks in the current study may have been a substantial source of TP, zinc, and copper.
The broader implications of this work highlight the importance of residential septage management. Land appliers base application rates on a combination of soil fertility, crop needs, and the concentrations of pollutants in the septage. Therefore, it is imperative that compliance samples are collected after homogenizing septage to ensure that a solid-liquid mixture is sampled and analyzed. Otherwise, TP and metal concentrations may be vastly underestimated. Underestimating these concentrations may endanger environmental and public health through the accumulation of TP and heavy metals in the topsoil of arable lands. Future work should consider focusing on quantifying other traditional water pollutants (e.g., nitrogen and pathogens), other heavy metals with established ceiling concentrations by the US EPA (e.g., arsenic, mercury, molybdenum, and selenium), organic pollutants (e.g., pesticides, plasticizers, detergents, etc.), pharmaceutical and personal care products (e.g., estrogen compounds, caffeine, lofepramine, etc.), and other emerging contaminants (e.g., per- and poly-fluoralkyl substances) in residential septage. Additionally, partnering water quality data with septic system age data and household wastewater behaviors and practices would provide further insights into how these factors impact solid accumulation rates and pollutant concentrations in residential septage.

Author Contributions

Conceptualization, C.P.H.J., M.O. and G.I.; methodology, G.I., J.J., B.S., C.S. and C.P.H.J.; software, G.I.; validation, G.I., C.P.H.J., M.O., J.J., B.S. and C.S.; formal analysis, G.I. and C.P.H.J.; investigation, G.I., J.J., B.S., C.S. and C.P.H.J.; resources, C.P.H.J. and M.O.; data curation, G.I.; writing—original draft preparation, G.I. and C.P.H.J.; writing—reviewing and editing, G.I., C.P.H.J., M.O., J.J., B.S. and C.S.; visualization, G.I.; supervision, C.P.H.J., M.O. and G.I.; project administration, C.P.H.J. and M.O.; funding acquisition, C.P.H.J. and M.O. All authors have read and agreed to the published version of the manuscript.

Funding

This research was funded by the North Carolina Department of Environmental Quality 319 Non-Point Source Program, contract 6201.

Institutional Review Board Statement

Not applicable.

Informed Consent Statement

Not applicable.

Data Availability Statement

Not applicable.

Acknowledgments

The authors acknowledge and thank the North Carolina Department of Environmental Quality for their support and sponsorship of this research. Furthermore, we wish to extend our gratitude to the following individuals for their assistance in project development, field support, laboratory analysis, and any other contribution or support given: Eban Bean, Caitlin Skibiel, and Sushama Pradhan.

Conflicts of Interest

The authors declare no conflict of interest. The funders had no role in the design of the study; in the collection, analyses, or interpretation of data; in the writing of the manuscript, or in the decision to publish the results.

References

  1. US EPA. Septic Systems Overview. 2020. Available online: https://www.epa.gov/septic/septic-systems-overview (accessed on 16 February 2022).
  2. Lusk, M.G.; Toor, G.S.; Yang, Y.; Mechtensimer, S.; De, M.; Obreza, T.A. A review of the fate and transport of nitrogen, phosphorus, pathogens, and trace organic chemicals in septic systems. Crit. Rev. Environ. Sci. Technol. 2017, 47, 455–541. [Google Scholar] [CrossRef]
  3. US EPA. Onsite Wastewater Treatment Systems Manual; United States Environmental Protection Agency: Washington, DC, USA, 2002.
  4. Noss, R.R.; Billa, M. Septic System Maintenance Management. J. Urban Plan. Dev. 1988, 114, 73–90. [Google Scholar] [CrossRef]
  5. Withers, P.J.; Jordan, P.; May, L.; Jarvie, H.P.; Deal, N.E. Do septic tank systems pose a hidden threat to water quality? Front. Ecol. Environ. 2014, 12, 123–130. [Google Scholar] [CrossRef]
  6. US EPA. Draft EPA Guidelines for Management of Onsite/Decentralized Wastewater Systems; Report # EPA-832-F-00-012; United States Environmental Protection Agency: Washington, DC, USA, 2000.
  7. Beal, C.D.; Gardner, E.A.; Menzies, N.W. Process, performance, and pollution potential: A review of septic tank-soil absorption systems. Aust. J. Soil Res. 2005, 43, 781. [Google Scholar] [CrossRef] [Green Version]
  8. Efroymson, R.A.; Jones, D.S.; Gold, A.J. An Ecological Risk Assessment Framework for Effects of Onsite Wastewater Treatment Systems and Other Localized Sources of Nutrients on Aquatic Ecosystems. Hum. Ecol. Risk Assess. 2007, 13, 574–614. [Google Scholar] [CrossRef]
  9. Humphrey, C.; Jernigan, J.; Iverson, G.; Serozi, B.; O’Driscoll, M.; Pradhan, S.; Bean, E. Field Evaluation of Nitrogen Treatment by Conventional and Single-Pass Sand Filter Onsite Wastewater Systems in the North Carolina Piedmont. Water Air Soil Pollut. 2016, 227, 255. [Google Scholar] [CrossRef]
  10. Humphrey, C.; Serozi, B.; Iverson, G.; Jernigan, J.; Pradhan, S.; O’Driscoll, M.; Bean, E. Phosphate treatment by onsite wastewater systems in nutrient-sensitive watersheds of North Carolina’s Piedmont. Water Sci. Technol. 2016, 74, 1527–1538. [Google Scholar] [CrossRef]
  11. US EPA. Domestic Septage Regulatory Guidance; Report # EPA 832-B-92-005; United States Environmental Protection Agency: Washington, DC, USA, 1993.
  12. US EPA. Biosolids Technology Fact Sheet: Land Application of Biosolids; Report # EPA 832-F-00-064; United States Environmental Protection Agency: Washington, DC, USA, 2000.
  13. US EPA. Land Application of Sewage Sludge; Report # EPA/831-B-93-002b; United States Environmental Protection Agency: Washington, DC, USA, 1994.
  14. Wang, H.; Brown, S.; Magesan, G.; Slade, A.; Quintern, M.; Clinton, P.; Payn, T. Technological options for the management of biosolids. Environ. Sci. Pollut. Res. 2008, 15, 308–317. [Google Scholar] [CrossRef]
  15. Singh, R.P.; Agrawal, M. Potential benefits and risks of land application of sewage sludge. Waste Manag. 2008, 28, 347–358. [Google Scholar] [CrossRef]
  16. Fodor, L.; Szabó, L. Study of Heavy Metal Leaching in the Soil. In Proceedings of the 13th International Soil Conversation Organization Conference, Conserving Soil and Water for Society: Sharing Solutions, Brisbane, Australia, 4–8 July 2004; p. 4. [Google Scholar]
  17. Mata-González, R.; Sosebee, R.E.; Wan, C. Shoot and root biomass of desert grasses as affected by biosolids application. J. Arid Environ. 2002, 50, 477–488. [Google Scholar] [CrossRef]
  18. Stöven, K.; Schnug, E. Long term effects of heavy metal enriched sewage sludge disposal in agriculture on soil biota. Agri. For. Res. 2009, 59, 131–138. [Google Scholar]
  19. Sloan, J.J.; Dowdy, R.H.; Dolan, M.S. Recovery of Biosolids-Applied Heavy Metals Sixteen Years after Application. J. Environ. Qual. 1998, 27, 1312–1317. [Google Scholar] [CrossRef]
  20. Milinovic, J.; Vidal, M.; Lacorte, S.; Rigol, A. Leaching of heavy metals and alkylphenolic compounds from fresh and dried sewage sludge. Environ. Sci. Pollut. Res. 2014, 21, 2009–2017. [Google Scholar] [CrossRef] [PubMed]
  21. Wierzbowska, J.; Sienkiewicz, S.; Krzebietke, S.; Bowszys, T. Heavy Metals in Water Percolating Through Soil Fertilized with Biodegradable Waste Materials. Water Air Soil Pollut. 2016, 227, 456. [Google Scholar] [CrossRef] [Green Version]
  22. McLaren, R.G.; Clucas, L.M.; Taylor, D.M. Leaching of macronutrients and metals from undisturbed soils treated with metal-spiked sewage sludge. 3. Distribution of residual metals. Aust. J. Soil Res. 2005, 43, 159–170. [Google Scholar] [CrossRef]
  23. Heckrath, G.; Brookes, P.C.; Poulton, P.R.; Goulding, K.W.T. Phosphorus leaching from soils containing different phosphorus concentrations in the Broadbalk Experiment. J. Environ. Qual. 1995, 24, 904–910. [Google Scholar] [CrossRef]
  24. Humphrey, C.P.; O’Driscoll, M.A. Biogeochemistry of groundwater beneath onsite wastewater systems in a coastal watershed. Univer. J. Environ. Res. Technol. 2011, 1, 320–328. [Google Scholar]
  25. Humphrey, C.P.; O’Driscoll, M.A.; Mallinson, D.; Hardison, S. Geophysical and Water Quality Characterization of On-Site Wastewater Plumes; Report # UNC-WRRI-445; The University of North Carolina: Raleigh, NC, USA, 2013. [Google Scholar]
  26. Humphrey, C.; O’Driscoll, M.; Deal, N.; Lindbo, D. Fate and Transport of Phosphate from an Onsite Wastewater System in Beaufort County, North Carolina. J. Environ. Health 2014, 76, 28–33. [Google Scholar]
  27. Humphrey, C.; Pradhan, S.; Bean, E.; O’Driscoll, M.; Iverson, G. Preliminary Evaluation of a Permeable Reactive Barrier for Reducing Groundwater Nitrate Transport from a Large Onsite Wastewater System. Am. J. Environ. Sci. 2015, 11, 216–226. [Google Scholar] [CrossRef] [Green Version]
  28. Gold, A.J.; Sims, J.T. Research needs in decentralized wastewater treatment and management: A risk-based approach to nutrient contamination. In Proceedings of the National Research Needs Conference Proceedings: Risk-Based Decision Making for Onsite Wastewater Treatment, St. Louis, MO, USA, 19–20 May 2000; pp. 1–37. [Google Scholar]
  29. Lowe, K.S.; Tucholke, M.B.; Tomaras, J.M.B.; Conn, K.; Hoppe, C.; Drewes, J.E.; McCray, J.E.; Munakata-Marr, J. Influent Constituent Characteristics of the Modern Waste Stream from Single Sources: Literature Review; Water Environment Research Foundation: London, UK, 2007. [Google Scholar]
  30. Wilhelm, S.R.; Schiff, S.L.; Robertson, W.D. Chemical fate and transport in a domestic septic system: Unsaturated and saturated zone geochemistry. Environ. Toxicol. Chem. 1994, 13, 193–203. [Google Scholar] [CrossRef]
  31. Humphrey, C.; Anderson-Evans, E.; O’Driscoll, M.; Manda, A.; Iverson, G. Comparison of Phosphorus Concentrations in Coastal Plain Watersheds Served by Onsite Wastewater Treatment Systems and a Municipal Sewer Treatment System. Water Air Soil Pollut. 2015, 226, 2259. [Google Scholar] [CrossRef]
  32. Hoover, M.T.; Disy, T.A.; Pfieffer, M.A.; Dudley, N.; Mayer, R.B.; Buffington, B. North Carolina Subsurface Wastewater Operators Training School Manual, 1st ed.; Department of Environment, Health and Natural Resources, North Carolina State University: Raleigh, NC, USA, 1996; pp. 4.1–4.31. [Google Scholar]
  33. Pradhan, S.S.; Hoover, M.T.; Austin, R.E.; Devine, H.A. Potential Nitrogen Contributions from On-Site Wastewater Treatment Systems to North Carolina’s River Basins and Sub-Basins; Technical Bulletin 324; NC State University: Raleigh, NC, USA, 2007. [Google Scholar]
  34. Sauer, P.A.; Tyler, E.J. Heavy metal and volatile organic chemical removal and treatment in on-site wastewater infiltration systems. I. Catch basins and septic tanks. Water Air Soil Pollut. 1996, 89, 221–232. [Google Scholar] [CrossRef]
  35. Brandes, M. Accumulation rate and characteristics of septic tank sludge and septage. J. Water Pollut. Control Fed. 1978, 50, 936–943. [Google Scholar]
  36. City of Durham. Falls Lake Watershed. 2021. Available online: https://durhamnc.gov/716/Falls-Lake (accessed on 16 February 2022).
  37. UNRBA. Lick Creek Watershed Restoration Plan; North Carolina Division of Water Quality: Raleigh, NC, USA, 2009.
  38. NC DEQ. Integrated Report Files for NC 303(d) and 305(b) Files. 2021. Available online: https://deq.nc.gov/about/divisions/water-resources/planning/modeling-assessment/water-quality-data-assessment/integrated-report-files (accessed on 16 February 2022).
  39. US EPA. Method 200.7 Trace Elements in Water, Solids, and Biosolids by Inductively Coupled Plasma-Atomic Spectrometry, Revision 5.0; Report # EPA-821-R-01-010; United States Environmental Protection Agency: Washington, DC, USA, 2001.
  40. Donohue, S.J.; Aho, D.W. Determination of P, K, Ca, Mg, Mn, Fe, Al, B, Cu, and Zn in plant tissue by inductively coupled plasma (ICP) emission spectroscopy. In Plant Analysis Reference Procedures for the Southern Region of the United States; Plank, C.O., Ed.; Southern Cooperative Series Bulletin 368; Georgia Cooperative Extension Service: Athens, GA, USA, 1992; pp. 34–37. [Google Scholar]
  41. Campbell, C.R.; Plank, C.O. Sample preparation. In Plant Analysis Reference Procedures for the Southern Region of the United States; Plank, C.O., Ed.; Southern Cooperative Series Bulletin 368; Georgia Cooperative Extension Service: Athens, GA, USA, 1992; pp. 1–12. [Google Scholar]
  42. R Core Team. R: A Language and Environment for Statistical Computing; R Foundation for Statistical Computing: Vienna, Austria, 2020; Available online: https://www.R-project.org/ (accessed on 6 April 2021).
  43. Wickham, H. Ggplot2: Elegant Graphics for Data Analysis; Springer: New York, NY, USA, 2016. [Google Scholar]
  44. Wickham, H.; Bryan, J. Readxl: Read Excel Files. 2019. Available online: https://CRAN.R-project.org/package=readxl (accessed on 6 April 2021).
  45. Wilke, C.O. Cowplot: Streamlined Plot Theme and Plot Annotations for ‘ggplot2’. 2019. Available online: https://CRAN.R-project.org/package=cowplot (accessed on 6 April 2021).
  46. US EPA. How to Care for Your Septic System. 2021. Available online: https://www.epa.gov/septic/how-care-your-septic-system#:~:text=Maintain%20Your%20Drainfield-,Inspect%20and%20Pump%20Frequently,every%20three%20to%20five%20years (accessed on 21 January 2022).
  47. Mancl, K. Estimating Septic Tank Pumping Frequency. J. Environ. Eng. 1984, 110, 283–285. [Google Scholar] [CrossRef]
  48. US Census. QuickFacts for Durham County, North Carolina, USA. 2021. Available online: https://www.census.gov/quickfacts/durhamcountynorthcarolina (accessed on 22 January 2022).
  49. Robertson, W.D. Development of steady-state phosphate concentrations in septic system plumes. J. Contam. Hydrol. 1995, 19, 289–305. [Google Scholar] [CrossRef]
  50. Robertson, W.D.; Blowes, D.W. Major ion and trace metal geochemistry on an acidic septic-system plume in silt. Groundwater 1995, 33, 275–283. [Google Scholar] [CrossRef]
  51. McCray, J.E.; Kirkland, S.L.; Siegrist, R.L.; Thyne, G.D. Model Parameters for Simulating Fate and Transport of On-Site Wastewater Nutrients. Groundwater 2005, 43, 628–639. [Google Scholar] [CrossRef]
  52. Schellenger, F.L.; Hellweger, F.L. Phosphorus loading from onsite wastewater systems to a lake (at long time scales). Lake Reserv. Manag. 2019, 35, 90–101. [Google Scholar] [CrossRef]
  53. Schroder, J.L.; Zhang, H.; Zhou, D.; Basta, N.; Raun, W.R.; Payton, M.E.; Zazulak, A. The Effect of Long-Term Annual Application of Biosolids on Soil Properties, Phosphorus, and Metals. Soil Sci. Soc. Am. J. 2008, 72, 73–82. [Google Scholar] [CrossRef]
  54. Barbarick, K.A.; Ippolito, J.A.; Westfall, D.G. Extractable Trace Elements in the Soil Profile after Years of Biosolids Application. J. Environ. Qual. 1998, 27, 801–805. [Google Scholar] [CrossRef]
  55. Krithika, D.; Thomas, A.R.; Iyer, G.R.; Kranert, M.; Philip, L. Spatio-temporal variation of septage characteristics of a semi-arid metropolitan city in a developing country. Environ. Sci. Pollut. Res. 2017, 24, 7060–7076. [Google Scholar] [CrossRef] [PubMed]
  56. US EPA. Guide to Septage Treatment and Disposal; Report # EPA/625/R-94/002; United States Environmental Protection Agency: Washington, DC, USA, 1994.
  57. Lester, J.N. Significance and behaviour of heavy metals in waste water treatment processes I. Sewage treatment and effluent discharge. Sci. Total Environ. 1983, 30, 1–44. [Google Scholar] [CrossRef]
  58. Goldstone, M.E.; Kirk, P.W.W.; Lester, J.N. The behaviour of heavy metals during wastewater treatment II. Lead, nickel and zinc. Sci. Total Environ. 1990, 95, 253–270. [Google Scholar] [CrossRef]
  59. Kempton, S.; Sterritt, R.M.; Lester, J.N. Heavy metal removal in primary sedimentation I. The influence of metal solubility. Sci. Total Environ. 1987, 63, 231–246. [Google Scholar] [CrossRef]
  60. Wang, M.; Chen, C.; Ju, Y.; Tsai, M.; Chen, C.; Dong, C. Distribution and environmental risk assessment of trace metals in sludge from multiple sources in Taiwan. J. Environ. Sci. Health Part A 2021, 56, 481–491. [Google Scholar] [CrossRef]
  61. Whelan, B.R.; Titamnis, Z.V. Daily chemical variability of domestic septic tank effluent. Water Air Soil Pollut. 1982, 17, 131–139. [Google Scholar] [CrossRef]
  62. Ptacek, C.J. Geochemistry of a septic-system plume in a coastal barrier bar, Point Pelee, Ontario, Canada. J. Contam. Hydrol. 1998, 33, 293–312. [Google Scholar] [CrossRef]
  63. Sotirakou, E.; Kladitis, G.; Diamantis, N.; Grigoropoulou, H. Ammonia and Phosphorous removal in municipal wastewater treatment plant with extended aeration. Glob. Nest J. 2013, 1, 47–53. [Google Scholar]
  64. Chen, K.Y.; Young, C.S.; Jan, T.K.; Rohatgi, N. Trace metals in wastewater effluents. J. Water Pollut. Control Fed. 1974, 46, 2663–2675. [Google Scholar]
  65. Firfilionis, G.; Paraskevopoulou, V.; Vilioti, G.; Dassenakis, M. The removal of trace metals at the wastewater treatment plant of Psyttalia. Mediterr. Mar. Sci. 2004, 5, 71–82. [Google Scholar] [CrossRef] [Green Version]
  66. Mapanda, F.; Mangwayana, E.N.; Nyamangara, J.; Giller, K.E. The effect of long-term irrigation using wastewater on heavy metal contents of soils under vegetables in Harare, Zimbabwe. Agric. Ecosyst. Environ. 2005, 107, 151–165. [Google Scholar] [CrossRef]
  67. Milik, J.; Pasela, R.; Lachowicz, M.; Chalamoński, M. The concentration of trace elements in sewage sludge from wastewater treatment plant in Gniewino. J. Ecol. Eng. 2017, 18, 118–124. [Google Scholar] [CrossRef] [Green Version]
  68. Healy, M.G.; Barrett, M.; Lanigan, G.J.; João Serrenho, A.; Ibrahim, T.G.; Thornton, S.F.; Rolfe, S.A.; Huang, W.E.; Fenton, O. Optimizing nitrate removal and evaluating pollution swapping trade-offs from laboratory denitrification bioreactors. Ecol. Eng. 2015, 74, 290–301. [Google Scholar] [CrossRef] [Green Version]
  69. US EPA. Regulatory Determinations for Pollutants in Biosolids. 2022. Available online: https://www.epa.gov/biosolids/regulatory-determinations-pollutants-biosolids (accessed on 7 February 2022).
  70. Lossing, H.; Champagne, P.; McLellan, P.J. Examination of sludge accumulation rates and sludge characteristics for a decentralized community wastewater treatment systems with individual primary clarifier tanks located in Wardsville (Ontario, Canada). Water Sci. Technol. 2010, 62, 2944–2952. [Google Scholar] [CrossRef] [Green Version]
  71. Tjandraatmadja, G.; Pollard, C.; Sheedy, C.; Gozukara, Y. Sources of Contaminants in Domestic Wastewater: Nutrients and Additional Elements from Household Products; CSIRO Publishing: Clayton, Australia, 2010. [Google Scholar]
  72. Lowe, K.S.; Tucholke, M.B.; Tomaras, J.M.B.; Conn, K.; Hoppe, C.; Drewes, J.E.; McCray, J.E.; Munakata-Marr, J. Influent Constituent Characteristics of the Modern Waste Stream from Single Sources, 1st ed.; IWA Publishing: London, UK, 2009. [Google Scholar]
  73. Crites, R.W.; Tchobanoglous, G. Small and Decentralized Wastewater Management Systems, 1st ed.; McGraw-Hill: Boston, MA, USA, 1998; p. 1104. [Google Scholar]
  74. Chen, X.; Cheng, X.; Chen, B.; Sun, D.; Ma, W.; Wang, X. Phosphorus precipitation in septic systems induced by iron reduction: A process for phosphorus removal under anaerobic conditions. Desalin. Water Treat. 2015, 54, 2891–2901. [Google Scholar] [CrossRef]
  75. Robertson, W.D.; Schiff, S.L.; Ptacek, C.J. Review of phosphate mobility and persistence in 10 septic system plumes. Groundwater 1998, 36, 1000–1010. [Google Scholar] [CrossRef]
  76. Olivares, M.; Uauy, R. Copper as an essential nutrient. Am. J. Clin. Nutr. 1996, 63, 791S–796S. [Google Scholar] [CrossRef]
  77. Saper, R.B.; Rash, R. Zinc: An Essential Micronutrient. Am. Fam. Physician 2009, 79, 768–772. [Google Scholar]
  78. Anke, M.; Groppel, B.; Kronemann, H.; Grün, M. Nickel—An essential element. IARC Sci. Publ. 1984, 53, 339–365. [Google Scholar]
  79. Brown, P.H.; Welch, R.M.; Cary, E.E. Nickel: A Micronutrient Essential for Higher Plants. Plant Physiol. 1987, 85, 801–803. [Google Scholar] [CrossRef]
  80. Naturvardsverket. Vad Innehaller Avlopp fran Hushall; Report 4425; Swedish Environment Protection Agency: Stockholm, Sweden, 1995. (In Swedish)
  81. Sörme, L.; Lagerkvist, R. Sources of heavy metals in urban wastewater in Stockholm. Sci. Total Environ. 2002, 298, 131–145. [Google Scholar] [CrossRef]
  82. US CDC. Lead in Paint. 2022. Available online: https://www.cdc.gov/nceh/lead/prevention/sources/paint.htm (accessed on 8 February 2022).
  83. US EPA. Use of Lead Free Pipes, Fittings, Fixtures, Solder, and Flux for Drinking Water. 2021. Available online: https://www.epa.gov/sdwa/use-lead-free-pipes-fittings-fixtures-solder-and-flux-drinking-water (accessed on 8 February 2022).
  84. Iverson, G.; Humphrey, C.P.; O’Driscoll, M.A.; Sanderford, C.; Jernigan, J.; Serozi, B. Nutrient exports from watersheds with varying septic system densities in the North Carolina Piedmont. J. Environ. Manag. 2018, 211, 206–217. [Google Scholar] [CrossRef] [PubMed]
  85. Nyamukamba, P.; Moloto, M.; Tavengwa, N.; Ejidike, I. Evaluating Physicochemical Parameters, Heavy Metals, and Antibiotics in the Influents and Final Effluents of South African Wastewater Treatment Plants. Pol. J. Environ. Stud. 2019, 28, 1305–1312. [Google Scholar] [CrossRef] [Green Version]
  86. Mohlander, U. Tungmetaller i Tappvatten; The Environmental Administration: Stockholm, Sweden, 1992. (In Swedish) [Google Scholar]
  87. Tiruneh, A.T.; Fadiran, A.O.; Mtshali, J.S. Evaluation of the risk of heavy metals in sewage sludge intended for agricultural application in Swaziland. Int. J. Environ. Sci. 2014, 5, 197–216. [Google Scholar]
  88. O’Driscoll, M.; DeWalle, D.; Humphrey, C.; Iverson, G. Groundwater Seeps: Portholes to Evaluate Groundwater’s Influence on Stream Water Quality. J. Contemp. Water Res. Ed. 2019, 166, 57–78. [Google Scholar] [CrossRef] [Green Version]
  89. US EPA. Land Application of Sewage Sludge and Domestic Septage; Report # EPA/625/R-95/001; United States Environmental Protection Agency: Washington, DC, USA, 1995.
  90. NC DEQ. NC Surface Water Classifications. 2022. Available online: http://ncdenr.maps.arcgis.com/apps/webappviewer/index.html?id=6e125ad7628f494694e259c80dd64265 (accessed on 11 February 2022).
  91. Brooks, B.W.; Lazorchak, J.M.; Howard, M.D.A.; Johnson, M.V.; Morton, S.L.; Perkins, D.A.K.; Reavie, E.D.; Scott, G.I.; Smith, S.A.; Steevens, J.A. Are harmful algal blooms becoming the greatest inland water quality threat to public health and aquatic ecosystems? Environ. Toxicol. Chem. 2016, 35, 6–13. [Google Scholar] [CrossRef]
  92. Conley, D.J.; Paerl, H.W.; Howarth, R.W.; Boesch, D.F.; Seitzinger, S.P.; Havens, K.E.; Lancelot, C.; Likens, G.E. Controlling Eutrophication: Nitrogen and Phosphorus. Science 2009, 323, 1014–1015. [Google Scholar] [CrossRef]
  93. Jadia, C.D.; Fulekar, M.H. Phytoremediation of heavy metals: Recent techniques. Afr. J. Biotechnol. 2010, 8, 921–928. [Google Scholar]
  94. Wuana, R.A.; Okieimen, F.E. Heavy Metals in Contaminated Soils: A Review of Sources, Chemistry, Risks and Best Available Strategies for Remediation. ISRN Ecol. 2011, 2011, 402647. [Google Scholar] [CrossRef] [Green Version]
  95. Sharpley, A.N.; Weld, J.L.; Beegle, D.B.; Kleinman, P.J.A.; Gburek, W.J.; Moore, P.A.; Mullins, G. Development of phosphorus indices for nutrient management planning strategies in the United States. J. Soil Water Conserv. 2003, 58, 137–152. [Google Scholar]
  96. Gatiboni, L.; Hardy, D.; Osmond, D. Changes in the Phosphorus Fertilizer Recommendations for Corn, Soybean, and Small Grains in North Carolina. 2021. Available online: https://content.ces.ncsu.edu/changes-in-phosphorus-fertilizer-recommendations-for-corn-soybean-and-small-grains (accessed on 11 February 2022).
  97. Osmond, D.L.; Cabrera, M.L.; Feagley, S.E.; Hardee, G.E.; Mitchell, C.C.; Moore, P.A.J.; Mylavarapu, R.S.; Oldham, J.L.; Stevens, J.C.; Thom, W.O. Comparing ratings of the southern phosphorus indices. J. Soil Water Conserv. 2006, 61, 325–337. [Google Scholar]
  98. Osmond, D.; Sharpley, A.; Bolster, C.; Cabrera, M.; Feagley, S.; Lee, B.; Mitchell, C.; Mylavarapu, R.; Oldham, L.; Walker, F.; et al. Comparing Phosphorus Indices from Twelve Southern U.S. States against Monitored Phosphorus Loads from Six Prior Southern Studies. J. Environ. Qual. 2012, 41, 1741–1749. [Google Scholar] [CrossRef] [PubMed] [Green Version]
  99. Dodds, W.K.; Bouska, W.W.; Eitzmann, J.L.; Pilger, T.J.; Pitts, K.L.; Riley, A.J.; Schloesser, J.T.; Thornbrugh, D.J. Eutrophication of U.S. Freshwaters: Analysis of Potential Economic Damages. Environ. Sci. Technol. 2009, 43, 12–19. [Google Scholar] [CrossRef] [Green Version]
  100. Schmidt, U. Enhancing Phytoextraction: The Effect of Chemical Soil Manipulation on Mobility, Plant Accumulation, and Leaching of Heavy Metals. J. Environ. Qual. 2003, 32, 1939–1954. [Google Scholar] [CrossRef] [PubMed] [Green Version]
Figure 1. Map showing the relative locations of septic systems within the studied high-density watershed located within Durham County, North Carolina. Approximately 33% of the subdivision agreed to volunteer, and their tanks were pumped.
Applsci 12 03336 g001
Figure 2. Boxplots of scum, liquid, and sludge with measured thickness (cm, A) and relative percentage (%, B) for each septage layer. The inset boxplot (C) displays and defines the summary statistics provided by the boxplots. The lower limit denotes the minimum value, the bottom border of the box denotes the first quartile (Q1), the bar denotes the median (or second quartile), the top border of the box denotes the third quartile (Q3), and the upper limit denotes the maximum value. The area between Q1 and Q3 is the interquartile range (IQR). The lower limit is calculated by subtracting the Q1 value from the product of 1.5 and the IQR, whereas the upper limit is calculated by adding the Q3 value to the product of 1.5 and the IQR. Asterisks (*) denote observations that fell outside the lower and upper limits and show the true minimum or maximum value for the range.
Applsci 12 03336 g002
Figure 3. Boxplots of total phosphorus (TP) concentrations (A) and masses (B) for scum, liquid, and sludge layers from septic tanks. Mass values of “0 g” were coded as “0.01 g” to represent values that were below detection or layers that were absent at time of sampling. Asterisks (*) represent outliers.
Applsci 12 03336 g003
Figure 4. Boxplot of total masses for total phosphorus, cadmium, copper, lead, nickel, and zinc in the studied septic tanks (n = 37). Asterisks (*) represent outliers.
Applsci 12 03336 g004
Table 1. Mean ± standard deviation of layer thickness and environmental readings for domestic septage. DO = dissolved oxygen; ORP = oxidation-reduction potential; SC = specific conductance.
Tank LayerpHTemperature (°C)DO (mg L−1)ORP (mV)SC (µS cm−1)
Median (Range)Mean (SD)Median (Range)Mean (SD)Median (Range)Mean (SD)Median (Range)Mean (SD)Median (Range)Mean (SD)
Scum6.79
(3.91–7.40)
6.45
(1.06)
27.12
(12.40–32.04)
24.14
(6.72)
1.47
(0.45–9.31)
2.72
(2.90)
−174
(−491–−15)
−184
(154)
1038
(226–2426)
1193
(855)
Liquid6.87
(5.36–8.04)
6.89
(0.52)
26.79
(11.36–34.90)
25.05
(5.83)
0.85
(0.17–10.07)
1.75
(2.43)
−296
(−554–14)
−278
(127)
1380
(129–2742)
1414
(718)
Sludge6.69
(5.66–7.77)
6.68
(0.44)
25.07
(12.39–32.07)
23.26
(5.53)
0.63
(0.17–8.8)
1.60
(2.37)
−275
(−508–−1)
−262
(121)
1797
(184–3325)
1810
(981)
Table 2. Median (range) and mean (standard deviation (SD)) of trace metal concentration (Conc) and mass in each septage layer.
MetalMedian (Range)Mean (SD)
ScumLiquidSludgeScumLiquidSludge
Cadmium
  Conc (mg L−1)<0.01
(<0.01–0.80)
<0.01
(<0.01–0.30)
<0.01
(<0.01–0.60)
0.09 (0.27)0.03 (0.08)0.07 (0.20)
  Mass (g)<0.01
(<0.01–3.03)
<0.01
(<0.01–1.14)
<0.01
(<0.01–2.27)
0.14 (0.66)0.11 (0.32)0.24 (0.72)
Copper
  Conc (mg L−1)1.15
(0.06–206.00)
0.40
(0.04–4.80)
0.60
(0.05–222.00)
18.21 (56.53)0.85 (1.28)11.63 (43.87)
  Mass (g)0.23
(<0.01–780.22)
1.51
(0.15–18.18)
1.89
(<0.01–840.82)
35.86 (155.43)3.24 (4.85)41.39 (161.22)
Lead
  Conc (mg L−1)0.60
(<0.01–24.50)
0.50
(<0.01–4.30)
0.40
(<0.01–12.50)
3.19 (8.00)0.79 (1.17)1.61 (3.51)
  Mass (g)<0.01
(<0.01–92.79)
1.89
(<0.01–16.29)
1.51
(<0.01–47.34)
5.18 (20.11)2.99 (4.43)5.44 (12.66)
Nickel
  Conc (mg L−1)0.20
(<0.01–3.70)
0.20
(<0.01–1.50)
0.20
(<0.01–4.00)
0.79 (1.27)0.31 (0.39)0.52 (0.94)
  Mass (g)<0.01
(<0.01–14.01)
0.76
(<0.01–5.68)
0.76
(<0.01–15.15)
1.28 (3.40)1.16 (1.46)1.77 (3.43)
Zinc
  Conc (mg L−1)3.00
(0.60–358.00)
7.92
(<0.01–76.80)
2.14
(0.30–256.00)
33.90 (97.65)13.50 (16.86)18.62 (55.88)
  Mass (g)2.27
(<0.01–1355.92)
30.00
(<0.01–290.88)
7.76
(<0.01–969.60)
66.76 (269.60)51.15 (63.87)66.25 (205.64)
Table 3. Ranges of concentrations (mg L−1) and masses (g) of phosphorus and trace metals from past studies. The ceiling concentration refers to the maximum concentration of a trace metal at the biosolids application site.
SourceTotal PhosphorusCadmiumCopper
Conc (mg L−1)Mass (g)Conc (mg L−1)Mass (g)Conc (mg L−1)Mass (g)
Septic, liquid 11.20–39.54.54–149.61 a<0.01–0.04<0.03–0.15 b0.01–0.120.03–0.45 b
Septic, sludge 218–61061.36–2079.33 a0.06–0.350.23–1.33 a--
Sewer, liquid 34–180-0.56–11-52.2–102-
Sewer, sludge 48000–59,500-0.49–30-0.66–1160-
Septage, composite 55–76075.75–2879 a0.005–110.07–42 a0.01–6402.18–2424 a
Ceiling conc 6 853943001500
SourceLeadNickelZinc
Conc (mg L−1)Mass (g)Conc (mg L−1)Mass (g)Conc (mg L−1)Mass (g)
Septic, liquid 10.01–0.190.04–0.72 a<0.02<0.060.04–0.180.12–0.68 b
Septic, sludge 21.01–7.703.83–29.16 a----
Sewer, liquid 328.6–98-32.2–191-0.46–182-
Sewer, sludge 42.72–1600-3.37–177-79–1980-
Septage, composite 5<0.025–791<0.09–2996 a0.01–370.04–140.14 a<0.01–1273<0.01–4821 a
Ceiling conc 684030042042075002800
a Entire range estimated assuming a 3785-L tank. b Upper endmember estimated assuming a 3785-L tank. 1 Values of phosphorus [3,24,25,26,31,35,49,50,51,52] and trace metals [34,50,61,62] in liquid layer of septic tank. 2 Values of phosphorus [35] and trace metals [34] in sludge layer of septic tank. 3 Values of phosphorus [31,63] and trace metals [64,65] in primary effluent. 4 Values of phosphorus [53,54] and trace metals [53,54,60,66,67] in sludge or biosolids. 5 Values of phosphorus [55,56] and trace metals [55,56,68] in composited septage samples from sewer. 6 Trace metals [69], with masses reported as cumulative mass (kg ha−1).
Table 4. Estimated mass in all septic systems in the studied sub-watershed (n = 87) based on the median and mean concentrations of total phosphorus (TP) and trace metals from the studied septic tanks (n = 37).
PollutantMedian (Range)Mean (SD)
Weighted Mass (g)Watershed a Mass (g)Weighted Mass (g)Watershed a Mass (g)
TP19.5
(0.9–1041)
1694
(76.3–90587)
66.6
(178)
5792
(15,483)
Cadmium<0.01
(<0.01–2.0)
<0.9
(<0.9–173)
0.2
(0.5)
15.3
(45.7)
Copper1.3
(0.1–520)
117
(4.7–45,238)
19.3
(86.9)
1681
(7562)
Lead1.8
(<0.01–44.2)
152
(<0.9–3847)
4.8
(10.8)
419
(937)
Nickel1.3
(<0.01–4.3)
112
(<0.9–378)
1.5
(1.4)
129
(121)
Zinc13.8
(0.3–788)
1202
(26.8–68,514)
55.6
(136)
4838
(11,865)
a These estimates were based on the studied sub-watershed that drains to Lick Creek and not the entire Lick Creek Watershed.
Table 5. Individual, median (range), and mean (standard deviation (SD)) concentrations of total phosphorus (TP) and trace metals in septic tanks that had not been pumped in at least 8 years.
TankLayerLayer ThicknessPollutant Concentration (mg L−1)
(%)TPCadmiumCopperLeadNickelZinc
1Scum0%
2Scum19%8350.820624.52.1358
3Scum4%54.409001.4
4Scum0%
1Liquid84%8.50.24.53.30.160
2Liquid38%21.60.34.14.30.376.8
3Liquid72%8.204.8000.8
4Liquid72%9.801.600.23.8
1Sludge16%1990.611294192
2Sludge44%2520.622212.51.1256
3Sludge24%3.208.2001.1
4Sludge28%45.702.80.30.12.8
Median (Range)Scum2%
(0–19%)
444
(54.4–835)
0.4
(<0.01–0.8)
108
(9–206)
12.3
(<0.01–24.5)
1.1
(<0.01–2.1)
180
(1.4–358)
Liquid72%
(38–84%)
9.2
(8.2–21.6)
0.1
(<0.01–0.3)
4.3
(1.6–4.8)
1.7
(<0.01–4.3)
0.2
(<0.01–0.3)
31.9
(0.8–76.8)
Sludge26%
(16–44%)
122
(3.2–252)
0.3
(<0.01–0.6)
60.1
(2.8–222)
4.7
(<0.01–12.5)
0.6
(<0.01–4.0)
97.4
(1.1–256)
Mean (SD)Scum6%
(9%)
444
(552)
0.4
(0.6)
108
(139)
12.3
(17.3)
1.1
(1.5)
180
(252)
Liquid66%
(20%)
12.0
(6.4)
0.1
(0.2)
3.8
(1.5)
1.9
(2.2)
0.2
(0.1)
35.4
(38.8)
Sludge28%
(12%)
125
(119)
0.3
(0.3)
86.3
(104)
5.5
(6.3)
1.3
(1.9)
113
(131)
Publisher’s Note: MDPI stays neutral with regard to jurisdictional claims in published maps and institutional affiliations.

