Article

Cross-Channel Dynamic Weighting RPCA: A De-Noising Algorithm for Multi-Channel Arterial Pulse Signal

1
School of Computer Science and Engineering, Sun Yat-Sen University, Guangzhou 510006, China
2
Sniow Research and Development Laboratory, Foshan 528000, China
3
Department of Electrical Engineering, National Cheng Kung University, Tainan 70101, Taiwan
*
Author to whom correspondence should be addressed.
Appl. Sci. 2022, 12(6), 2931; https://doi.org/10.3390/app12062931
Submission received: 31 January 2022 / Revised: 10 March 2022 / Accepted: 11 March 2022 / Published: 13 March 2022
(This article belongs to the Topic Engineering Mathematics)

Abstract

:

Featured Application

This study proposes a novel cross-channel DWRPCA algorithm for multi-channel pulse signal de-noising. This algorithm can extract features from multiple cycles in each channel with dynamic weighting according to the signal patterns of channels in a single sensor. This algorithm can separate noise from the main frequency band of the input pulse signal.

Abstract

Pulse wave analysis (PWA) has been widely used in the medical field. A novel multi-channel sensor is employed in arterial pulse acquisition and brings richer physiological information to PWA. However, the noise of this sensor is distributed in the main frequency band of the pulse signal, which seriously interferes with subsequent analyses and is difficult to eliminate by existing methods. This study proposes a cross-channel dynamic weighting robust principal component analysis algorithm. A channel-scaled factor technique is used to manipulate the weighting factors in the nuclear norm. This factor can adaptively adjust the weights among the channels according to the signal pattern of each channel, optimizing the feature extraction in multi-channel signals. A series of performance evaluations were conducted, and four well-known de-noising algorithms were used for comparison. The results reveal that the proposed algorithm achieved one of the best de-noising performances in the time and frequency domains. The mean of h1 in the amplitude relative error (ARE) was 23.4% smaller than for the WRPCA algorithm. Moreover, our algorithm could accelerate convergence and reduce the computational time complexity by approximately 34.6%. These results demonstrate the performance and efficiency of the algorithm. Meanwhile, the idea can be extended to other multi-channel physiological signal de-noising and feature extraction fields.

1. Introduction

Pulse waves (PW) are propagating waves generated by heart pulsation in blood circulation. Pulse wave analysis (PWA) is one of the earliest vital analyses in modern medicine [1,2,3]. Some cardiac outputs (COs), such as arterial stiffness, can be measured and estimated by key physiological points in the arterial blood pressure (ABP) waveform, which has considerable clinical significance [4]. In recent years, multi-channel signal acquisition has been applied in complex physiological signal acquisition studies. The acquired signals are also called three-dimensional pulse images (3DPIs) and are arranged in a matrix form. The 3DPI can provide multiple accurate temporal pulse waves [5] and provide three-dimensional spatial features of pulse waves. The shapes and trends of the pulse waves reflect more physiological information, such as arterial stiffness [6,7].
Today, researchers employ tactile sensors to obtain multi-channel pulse wave signals. Chung developed a pulse diagnosis instrument (PDI) with 12-channel (3 × 4 channels) tactile sensors [8]. Kong and his colleague designed an arterial palpation instrument with 24-channel (4 × 6 channels) tactile sensors [9]. Peng developed a wrist pulse acquisition device with 24-channel (5 × 5 − 1 channels) tactile sensors [6]. These studies above used the tactile sensor systems developed by PPS (Pressure Profile Systems Inc., Los Angeles, CA, USA), which are recommended tools for biomedical signal acquisition with hundreds of peer-reviewed papers. A typical PPS sensor system has 12 or 24 sensing elements arranged on a near 1 cm2 sensor tip, with over 4 cm conductive leads on a flexible substrate to the circuits (amplifier, filter, analog-to-digital converter, and so on), which can be used independently [10] or assembled on the robot finger [6].
Due to crosstalk and material properties of the sensing elements in the multi-channel sensor, more consequent background noises in 3DPI may be generated or enlarged [11,12,13]. In addition, the sensor also has contact noise while measuring pulse waves. Furthermore, the relatively long conductive leads further disturb the signals before entering the amplifier and filter circuits, which is unavoidable due to the requirements for flexible use. Hence, these noises cannot be completely eliminated by the system. Aimed at reducing these noises of tactile sensors in pulse wave acquisition, researchers have proposed several de-noising methods. Hu et al. used a wavelet transform algorithm to remove motion artefacts and background noise from pulse waves acquired by a 12-channel tactile sensor [14]. Other methods such as variational mode decomposition (VMD) were applied to 3DPI de-noising and achieve a noticeable effect [15]. However, some of the noises are mixed with signals in the frequency domain and are, therefore, difficult to eliminate using these traditional methods.
Principal component analysis (PCA) is a statistical method employed for data dimensionality reduction and de-noising [16]. The PCA method can extract the pulse characteristics for multiple pulse cycles in a specific channel. Previous studies have found that pulse signals between cycles in a short period have small nonlinearity [5,16,17,18]. Hence, the PCA method can be used in pulse signal feature extraction and de-noising fields. However, the weak robustness of PCA restricts the application of signal de-noising in PWA. Another modified method named robust principal component analysis (RPCA) has better robustness than PCA in the field of multi-channel arterial pulse signal de-noising [19]. He et al. developed an RPCA-based method named weighted robust principal component analysis (WRPCA) to process multi-channel pulse signals and indicated that WRPCA could achieve better three-dimensional visual performance than RPCA [20]. However, these researchers extracted signal features separately for every channel without taking advantage of the internal associations between these channels. Since 3DPI is a pulse signal with a spatial and temporal correlation of each channel [6], this study introduces a new de-noising algorithm called cross-channel DWRPCA, which produces a channel-scaled factor (CSF) technique to manipulate the weights of WRPCA. This paper uses a convolutional neural network to adaptively tune the CSF; therefore, the factors can adjust the weights in the nuclear norms according to the signal pattern of each channel. This technique can optimize the feature extraction for multi-channel signals such as 3DPI to eliminate the noise in the original signals. In addition, this paper employed a complete and standard pulse signal processing system, including preprocessing, de-noising algorithm implementation, signal reconstruction, and display. Then, we evaluate the performance in the time domain and frequency domain. The idea of the proposed cross-channel DWRPCA algorithm can be generalized to other biomedical signal de-noising cases. In other words, our work provides a novel and promising thought to de-noise biomedical signals [21,22,23,24,25,26].
The remainder of this paper is structured as follows: Section 2 introduces the dataset employed in this work and the overall signal processing framework; Section 3 describes our de-noising algorithm cross-channel DWRPCA, as well as the evaluation method used throughout the experiments; Section 4 mainly presents the time-domain and frequency-domain analysis results of the experiments. The final two sections discuss the experimental results and present the conclusions of this paper.

2. Data and Overall System

2.1. Dataset

The dataset was provided by National Cheng Kung University using a pulse diagnosis instrument with 24-channel (5 × 5 − 1) tactile sensors and a data acquisition system [6]. There were 37 subjects (including four females and 33 males) aged 62.52 ± 11.85 years (mean ± SD). All subjects were hypertensive patients and their family members in National Cheng Kung University Hospital, who were selected randomly. Specifically, 24 subjects of the dataset were hypertensive patients (systolic/diastolic blood pressure: 148.08/85.08 ± 17.51/11.69), and the other 13 subjects were healthy persons (sp/dp: 118.68/73.62 ± 8.69/6.90). The multi-channel pulse wave signals were recorded under IRB approval (IRB#: B-ER-103-263). The recording length was about 8–9 s per subject with a sampling rate of 50 Hz. The information details of the dataset can be found in a previous study [6].
An example of a 3DPI with stereoscopic (upper left) and planar (upper right) views is shown in Figure 1. The PPS 5 × 5 tactile sensor records spatiotemporal information of the radial artery. The x-axis of the 3DPI represents the pulse length along the artery blood flow direction, while the y-axis is perpendicular to the artery blood flow direction. Pulse amplitude on the z-axis is normalized to 0–1 with color settings (red = 1 and violet = 0). The amplitude changes periodically to form a dynamic 3DPI.

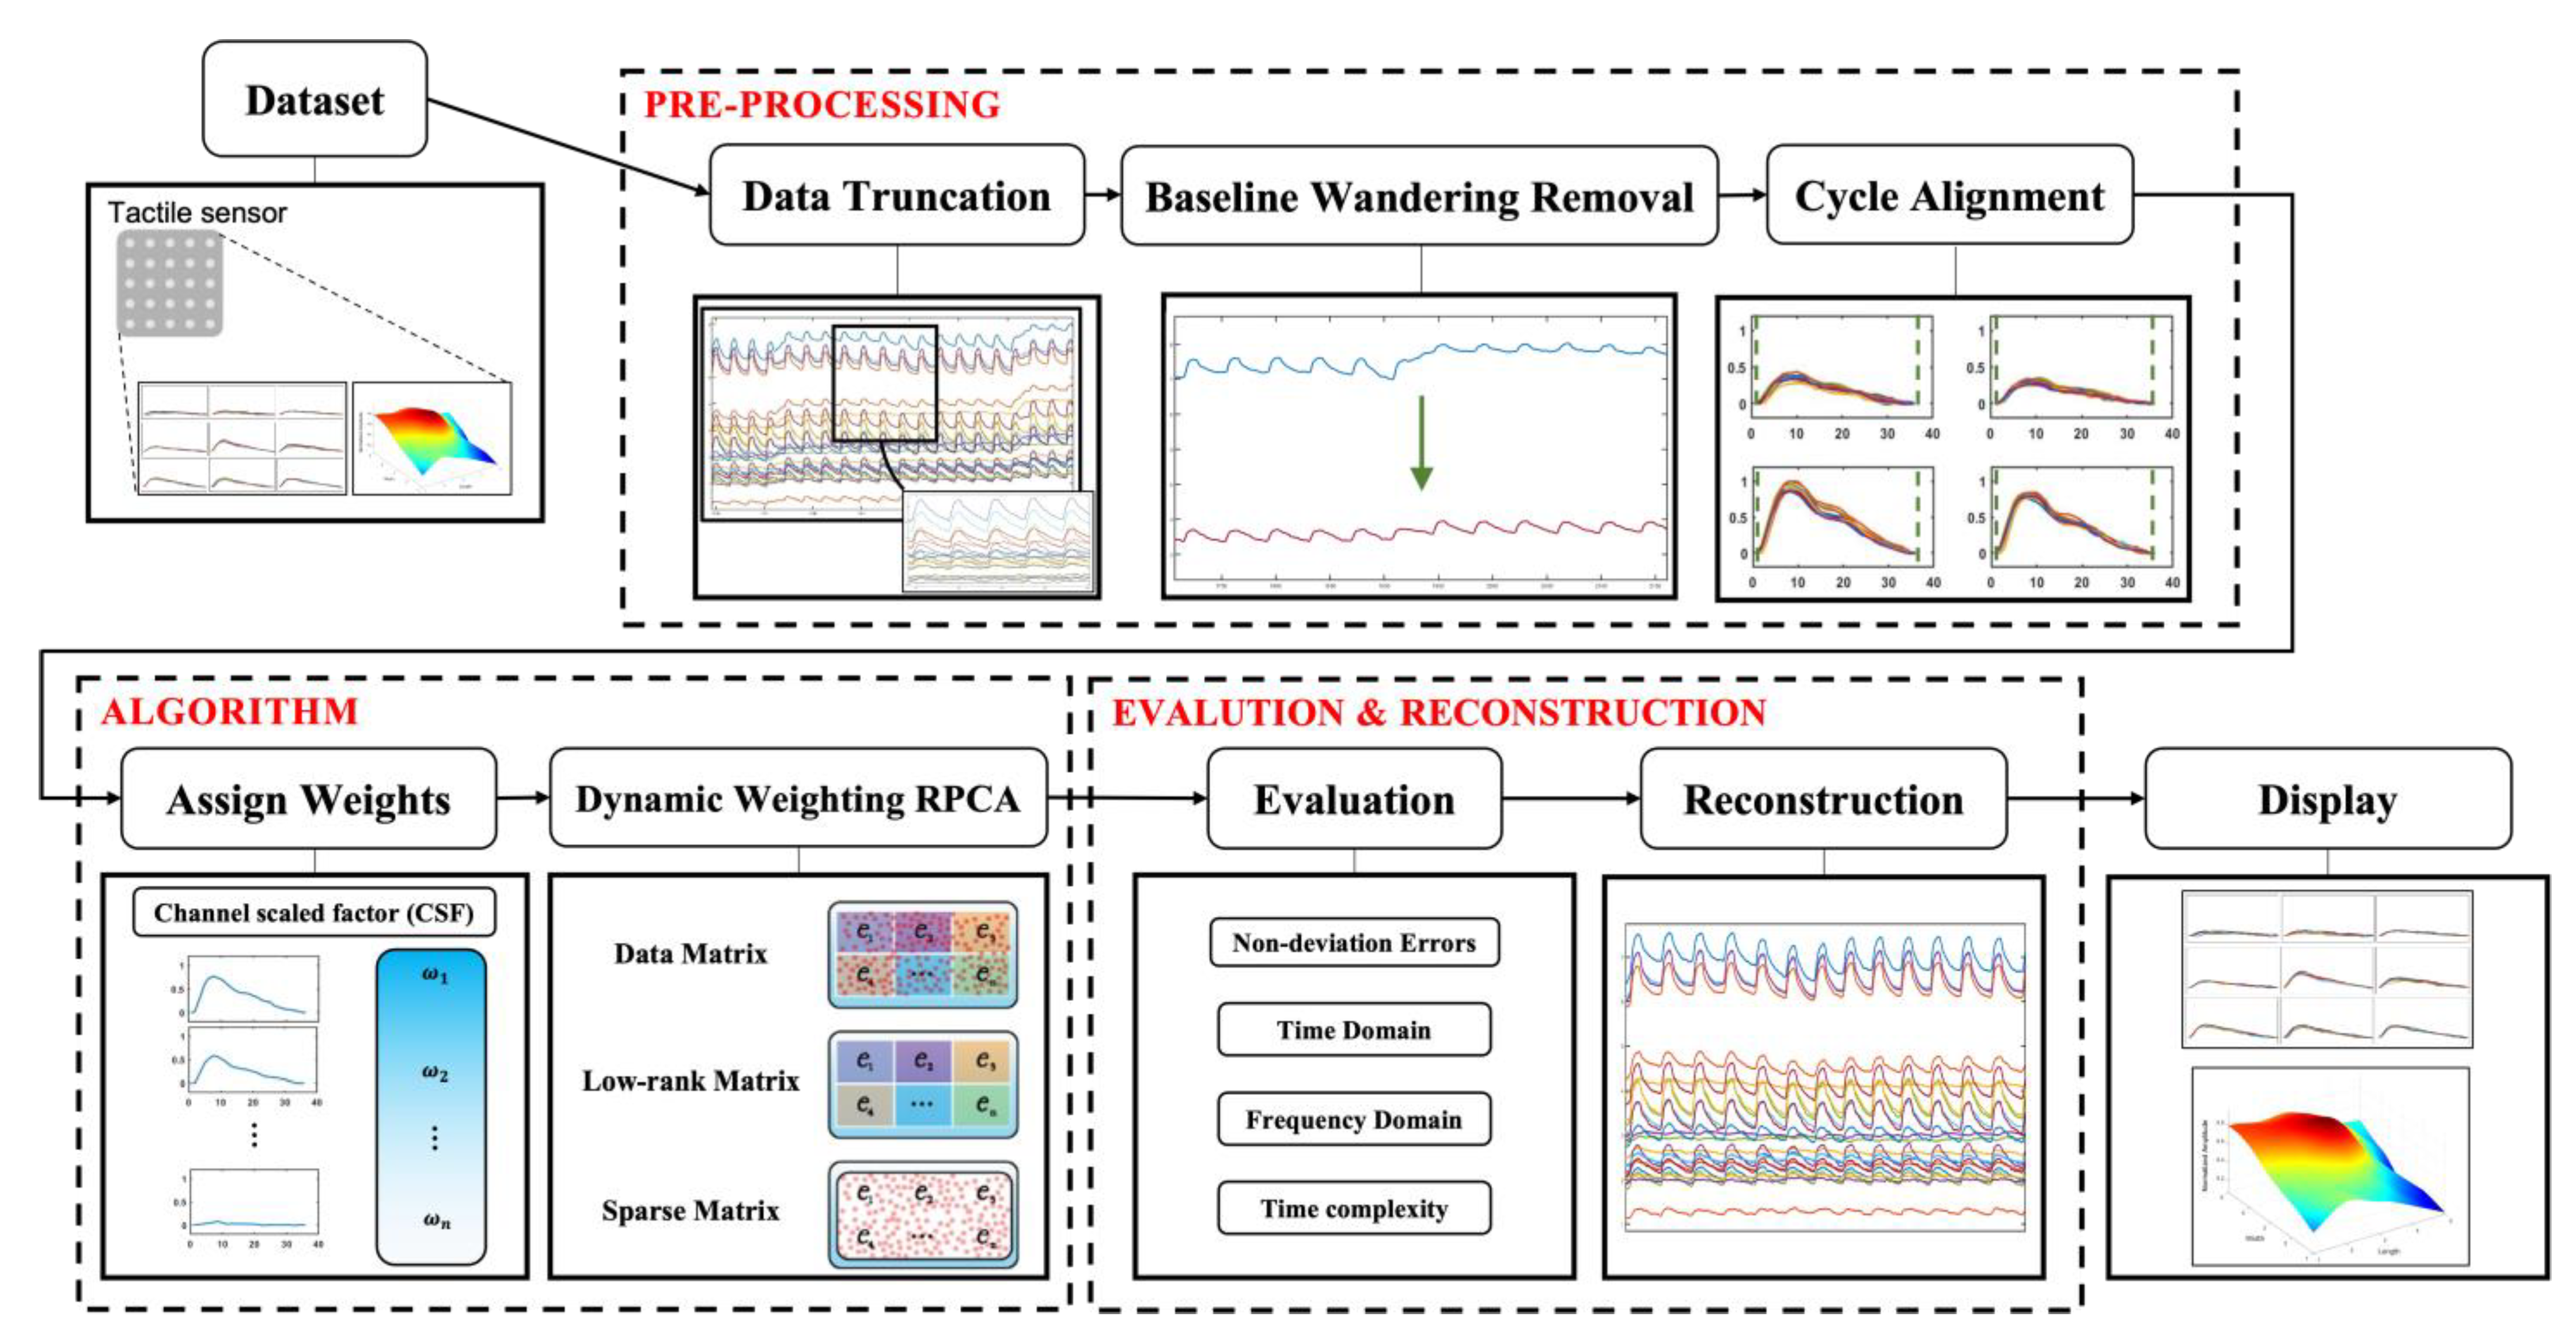
2.2. Signal Processing Framework

A complete and standard framework was employed in this study. The overall framework included the following steps (shown in Figure 2): raw data acquisition, pre-processing (including data truncation, baseline wandering removal, and cycle alignment), algorithm implementation, signal reconstruction, and display. Data from different pulse-taking depths were truncated and selected before pre-processing. Then, a Butterworth high-pass filter (cutoff frequency: 0.5 Hz) was performed to remove the low-frequency noise of the measured multi-channel signals, and the baseline drift was mainly eliminated by cubic spline estimation [27]. Multi-channel raw data were partitioned into segments, each corresponding to a complete heartbeat cycle. For every channel, these segments were scaled and aligned along the time axis and composed into a group. After pre-processing, multiple groups of one-dimensional temporal pulse waves were sent into the algorithm implementation module. The algorithm implementation module proposes a signal de-noising and feature extraction algorithm with interchannel weights to decompose input data matrices into signal and noise matrices. Subsequently, to evaluate the performance of the proposed cross-channel DWRPCA algorithm, we analyzed the signal features and noises extracted from the original signals from the aspects of the time domain and frequency domain. Finally, the filtered signals were reconstructed into a complete multi-channel signal with less noise and displayed in the form of 3DPI.

3. Proposed De-Noising Algorithm and Evaluation Method

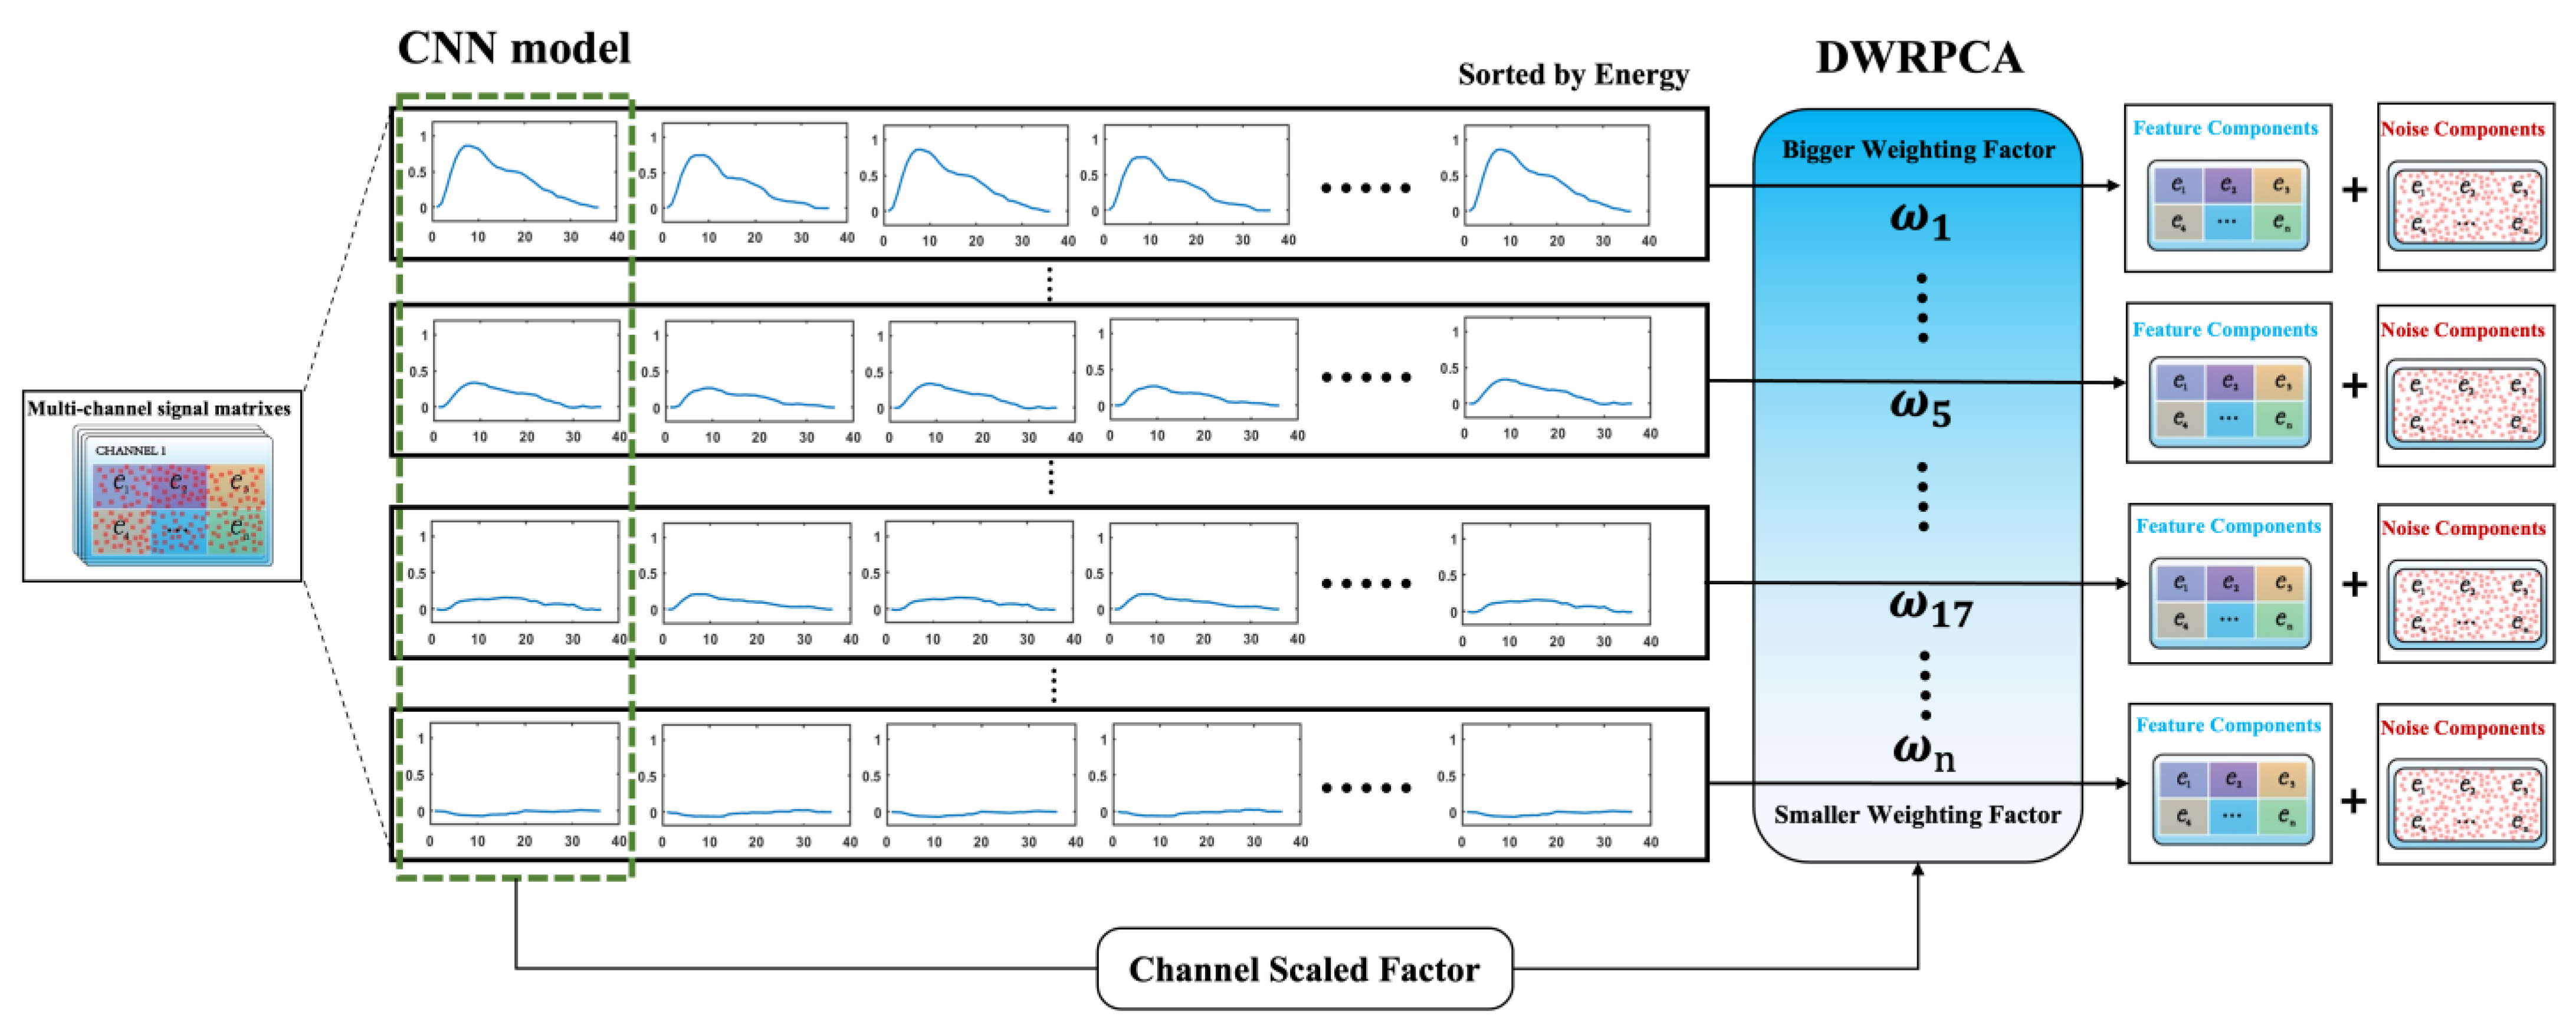
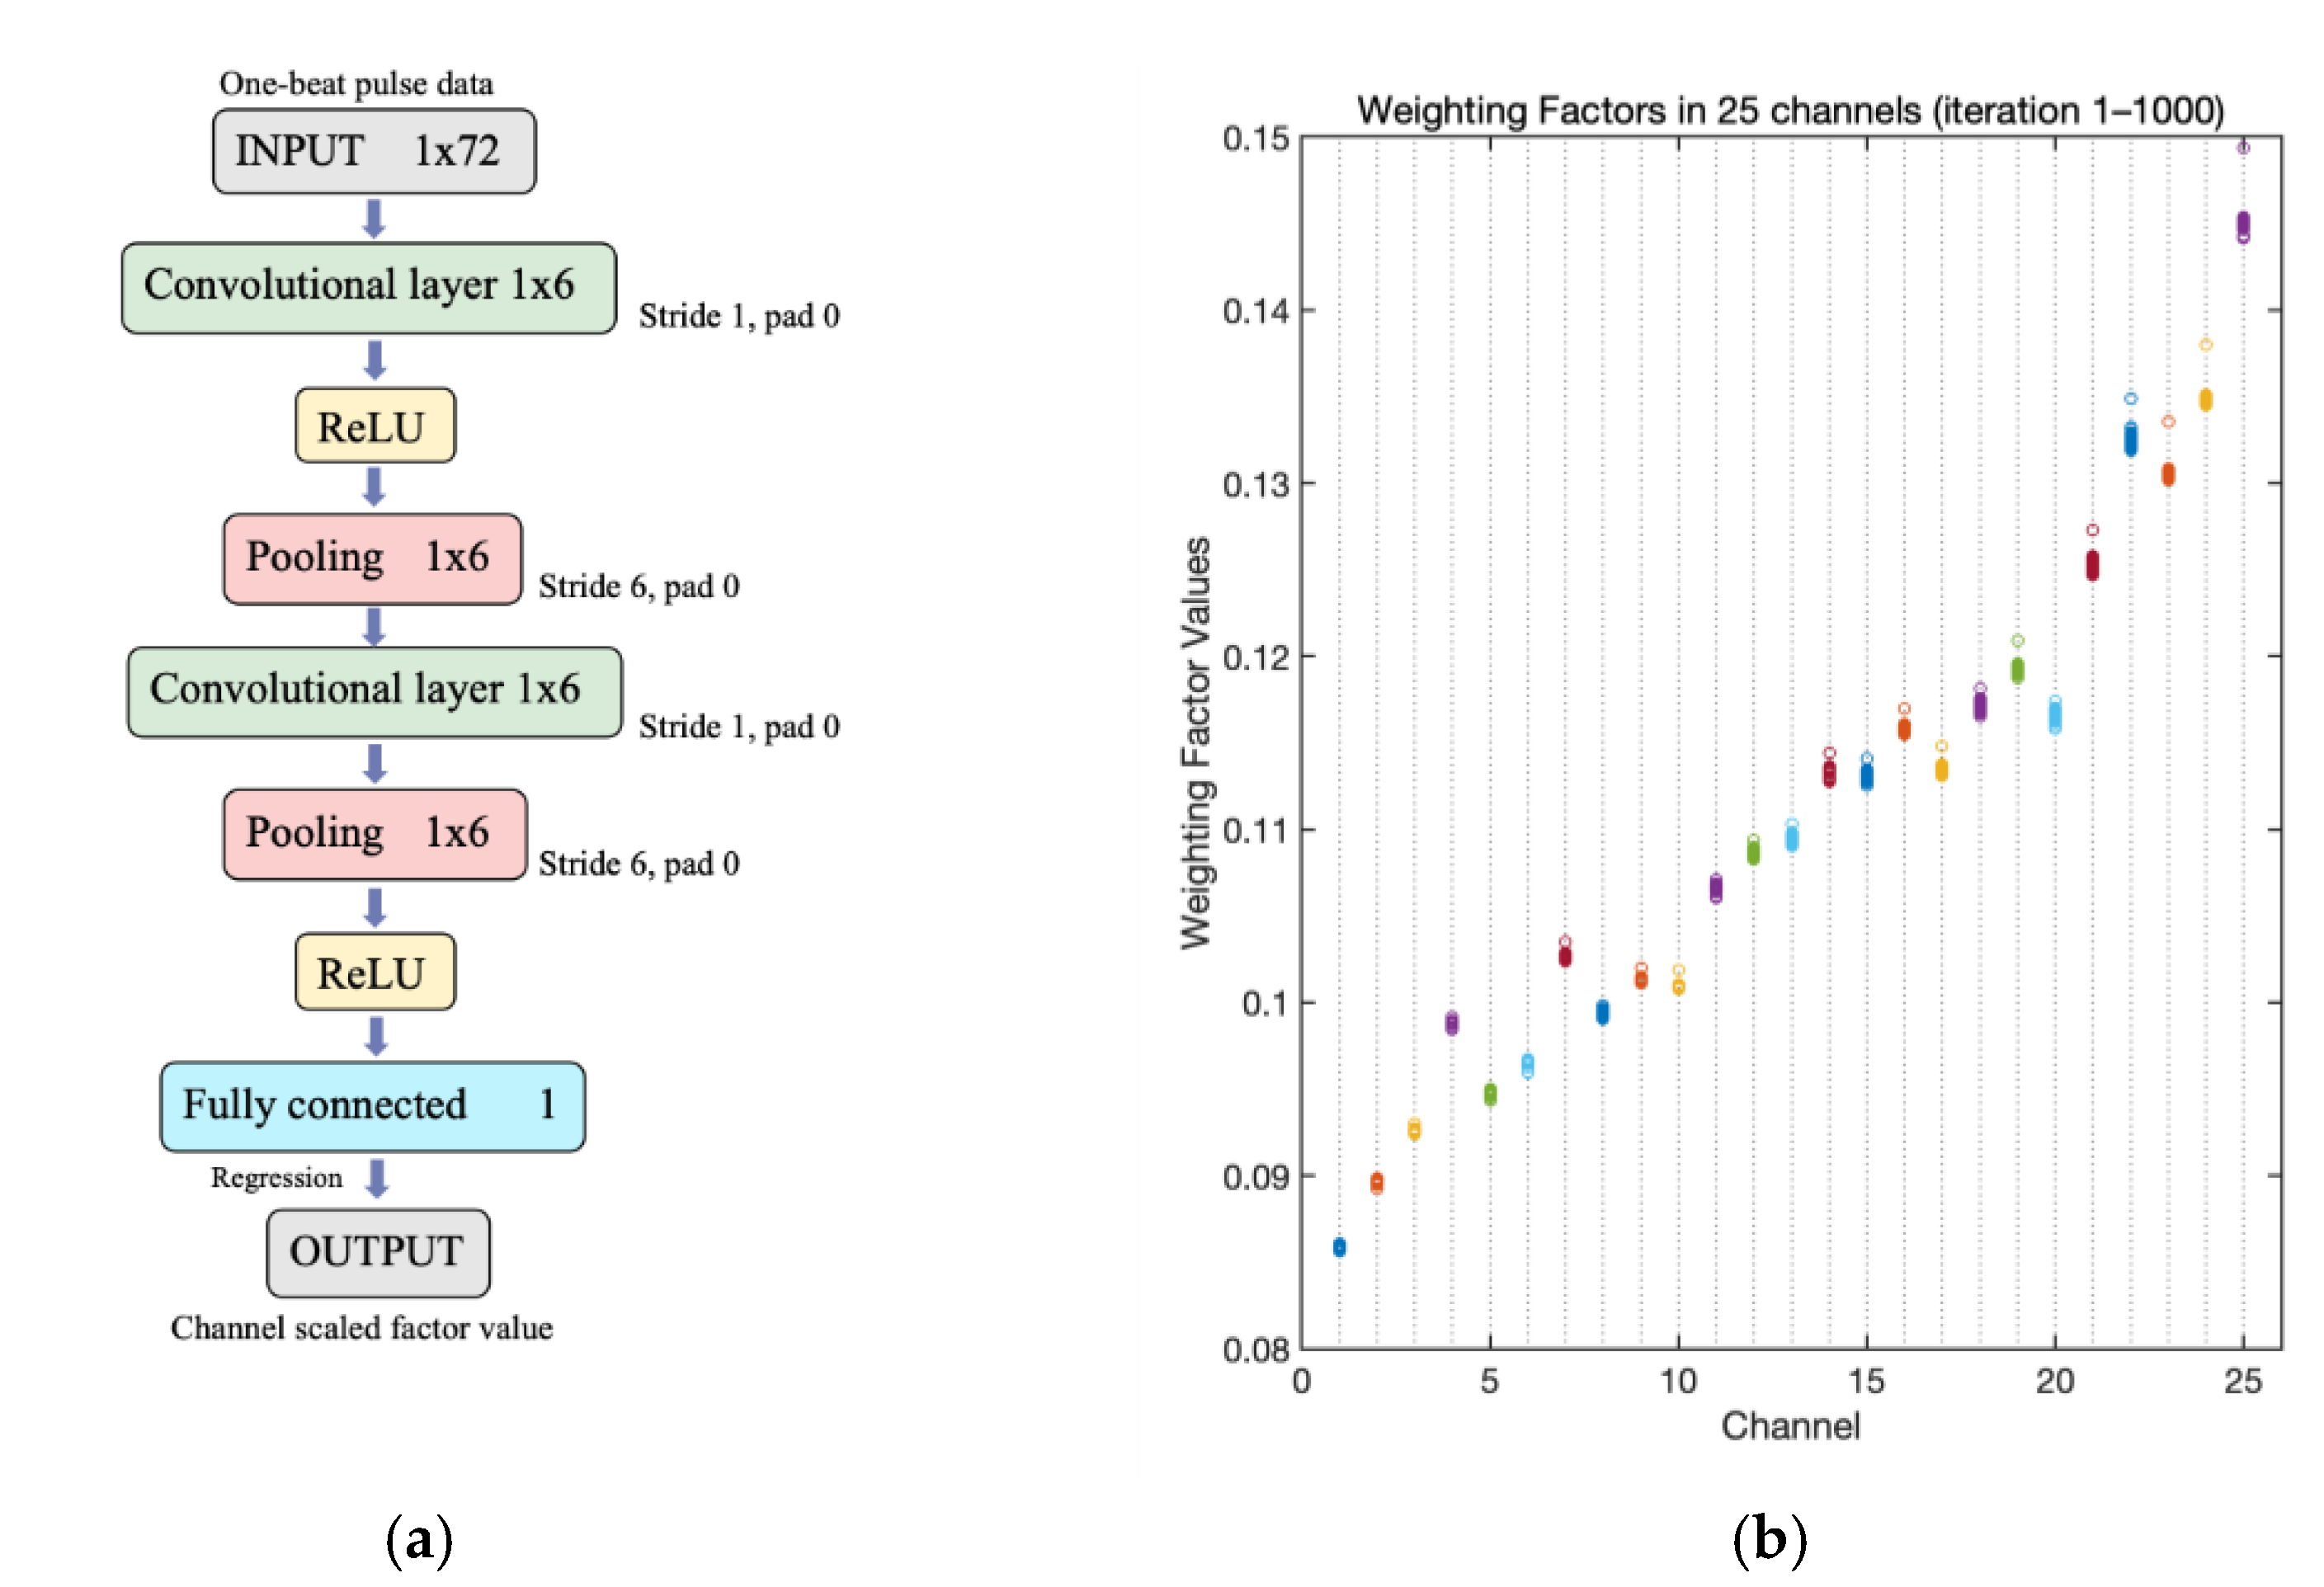
3.1. Cross-Channel Dynamic Weighting RPCA

Robust principal component analysis has been universally applied in many research fields [28], such as video surveillance, face recognition, latent semantic indexing, ranking and collaborative filtering, low-rank representation, target detection, signal de-noising, and classification [19,29,30,31,32,33,34].
The main idea of RPCA is that a data matrix D can be decomposed as a low-rank component L and a sparse component S [15], defined as
m i n L * + λ S 1 ,   subject   to   D = L + S ,
where L * denotes the nuclear norm (sum of singular values), and S 1 is the L1-norm (sum of absolute values of matrix entries). In the field of arterial pulse signal de-noising and decomposition, D m × n is an input pulse matrix, where m and n (rows and columns of D ) are the number of horizontally and vertically arranged channels in a tactile sensor, respectively. λ is a positive constant parameter set to 1 / max ( m , n ) [19].
Weighted robust principal component analysis, as an extension of RPCA, has been a mature and versatile method in the video frame interpolation [34], low-level vision [35], and singing voice separation fields [36]. WRPCA can be defined as follows:
m i n L ω , * + λ S 1 ,   s u b j e c t   t o   D = L + S ,
where L ω , * is the low-rank matrix with different weighted values. An efficient inexact version of the augmented Lagrange multiplier is used to solve the convex model [30]. The corresponding augmented Lagrange function is defined as
Y ( D , L , S , μ ) = L ω , * + λ S 1 + Y , D L S + μ 2 D L S F 2 ,
where Y is the Lagrange multiplier, μ is a positive scaler, and D L S F 2 = D L S , D L S . Specifically, D L S , D L S   is the Euclidean inner product of D L S , and D is the observation data.
The proposed cross-channel DWRPCA uses a channel-scaled factor technique to manipulate the weights of the WRPCA algorithm. We construct a convolutional neural network (CNN) to adaptively tune the channel-scaled factor according to the signal pattern of each channel. The pre-processed signals (not the extracted features) are used as the input, and the channel-scaled factor values are used as the target. Hence, the calculated CSF can dynamically adjust the weights among channels according to the signal patterns, which can optimize the de-noising effect in multi-channel signals like 3DPI.
Figure 3 illustrates the whole process of the cross-channel DWRPCA algorithm. Multi-channel pulse data matrices are normalized and transformed into D M × T . The convolutional neural network constructed in this paper can predict a specific factor value for each channel. Therefore, the CSF can adaptively adjust the weight of a particular channel in a single sensor. In the context of this paper, we represent the signal input as a matrix D M × T (M is the number of beats in the dataset, and T is the signal vector length). The details of the constructed neural network are discussed in Section 4. As the initial weighting factors for each channel in WRPCA vary, we named this method dynamic weighting RPCA. The DWRPCA method is repeated for each channel with different CSFs and extracts corresponding low-rank and sparse matrices. The low-rank matrix in a channel represents the feature components extracted from multiple cycles in that channel.
Thus, the cross-channel DWRPCA algorithm is described below.
In Algorithm 1, ρ is a positive numerical constant and is usually small enough to prevent μ k from increasing too fast. After DWRPCA processing, a low-rank matrix L and a sparse matrix S can be obtained.
Algorithm 1: Cross-Channel DWRPCA
Input: D m × n × T : Multi-beat pulse signal
     M A X _ I t e r : the maximum number of iterations
Output:L: Low-rank matrix (de-noised pulse signal)
     S: Sparse matrix
1: normalize input data matrix D
2: transform D into D M × T
3: for n = 1 to length ( m × n ) do
4:  Use D as the input of the trained CNN model
5:  Compute the CSF of n-th channel using the model
6:  Initialize μ 0 , ρ , L 0 = D , Y 0 = 0 ;
7:While not convergence or  i t e r M A X _ I t e r     do
8:   repeat
9:   decomposed singular value σ i t e r ( D ) =   max ( max ( svd ( L 0 ) ) )
10:   weighting factor ω n = η n σ i t e r ( D )
11:    S k + 1 = argmin S S 1 + μ k 2 D + μ k 1 Y k L k S F 2 ;
12:    L k + 1 = argmin L L ω ,   * + μ k 2 D + μ k 1 Y k S k + 1 L F 2 ;
13:    Y k + 1 = Y k + μ k ( D L k + 1 S k + 1 ) ;
14:    μ k + 1 = ρ μ k ;
15:    k = k + 1 ;
16:end while
17: end for
The detailed calculation of weighting factors ω n of the cross-channel DWRPCA is defined below.
Lemma 1.
Let D = U Σ V T be the singular value decomposition (SVD) of D m × n , where
Σ = ( d i a g ( σ 1 ( D ) , σ 2 ( D ) , , σ n ( D ) ) 0 ) ,
where σ i ( D ) denotes the i-th singular value of D . If the positive regularization parameter C exists and the positive value ε < m i n ( C ,   C σ i ( D ) ) holds, by using the reweighting formula ω i = C σ i ( L ) + ε [31] with initial estimation L 0 = D , the reweighted problem has the closed-form solution:   L * = U Σ V T , where
  Σ   = ( d i a g ( σ 1 ( L * ) , σ 2 ( L * ) , , σ n ( L * ) ) 0 ) ,
and
σ n ( L * ) = { 0 c 1 + c 2 2 ,
where   c 1 = σ i ( D ) ε and   c 2 = ( σ i ( D ) + ε ) 2 4 C . C is set to max ( m , n ) . Gu et al. [35] described a more specific proof of Lemma 1.
The weighted value ω n of the proposed algorithm is defined as follows:
σ n ( L * ) = max ( σ n ( D ) ω n γ , 0 ) ,
where
ω n = η σ n ( D ) + ε ,
where η denotes the n-th channel-scaled factor (CSF) of D in the n-th resorted channel. The regularization parameter γ is set to 1 / max ( m , n ) , and reconstruction error tolerance ε is set to 1.0 × 10 6 .
In Equation (8), the weighting factor ω n , also called the weight of the nuclear norm, is determined by the CSF and dynamically updated during iterations until convergence. The CSF is computed through a convolutional neural network, which considers the signal patterns among channels. The CSF is the numerator of Equation (8) and, therefore, constructs the initial value of weighting factor ω n . σ n ( D ) , part of the denominator of Equation (8), is adjusted dynamically in iterations of each channel to significantly optimize low-rank estimation performances. The major difference between WRPCA and our cross-channel DWRPCA can be specified at ω n . In WRPCA, ω n is identical in every channel, while, in our algorithm, ω n is adaptively adjusted by CSF η .
Hence, the cross-channel DWRPCA can extract features from multiple cycles in each sensor channel and consider energy differences in different channels.

3.2. Performance Evaluation Method

The performance of this algorithm was evaluated in the time domain and frequency domain. Four well-known de-noising algorithms were used for comparison with our algorithm in the experiments: wavelet transform, VMD, RPCA, and WRPCA, introduced in the previous section. In this paper, the maximum number of iterations was set to 1000.
Time domain analysis for extracted signals focuses on comparing low-rank matrices before and after de-noising by different de-noising algorithms. Four examples in channels with different energy (maximum, medium, low, and minimum) are given in this section. We also employ time domain analysis for extracted noise, which gives us an intuitive impression of the noise amplitude.
Then, non-deviation errors of key physiological points are evaluated. Figure 4 shows the positions of the key physiological points of the radial pulse wave in a complete heartbeat cycle. In the beginning, the aortic valve opens (onset) as the ventricular pressure rises. The ventricle continues to contract, and the systolic pressure rises to a peak (P1) during ejection [37]. Due to the diastole of the ventricle and backward wave from periphery branches, the attenuated arterial pressure reaches the second peak (P2) of the pulse wave [38]. The closure and opening of the arterial valve cause the dicrotic notch (P3) and diastolic wave (P4) [27]. In clinics, the augmentation index (Aix) is formulated as h 2 / h 1 , which is an important metric of arterial stiffness estimation [39]. The positions and amplitudes of these key points should not be affected after de-noising, which is the primary premise of all de-noising algorithms. Thus, the time absolute error (TAE) and amplitude relative error (ARE) at key points P1 and P2 are used to evaluate the non-deviation performance, defined as follows:
T A E = | t i t o i | ,
A R E = | h i h o i | | h o i | × 100 % ,
where t i or t o i is the sampling number of processed or original i-th key points, and h i or h o i is the amplitude of processed or original i-th key points.
Frequency-domain analysis for extracted noises uses power spectral density (PSD) to show the distribution of noises. A reference noise is recorded using a PPS 5 × 5 tactile sensor. Noise-dominant frequency bands of PPS tactile sensors are compared with extracted noises by five de-noising algorithms.
Furthermore, run-time complexities are tested in this paper. The total calculation amount and run time required by our algorithm must be at acceptable levels for practical de-noising applications. A host PC can be the recommended experimental environment for our study. The host PC was equipped with four Intel Xeon Platinum 2.10 GHz CPUs, 384 GB memory, and an Inventec KQ80G4 Motherboard (C620 series chipset running Windows Server 2016 Datacenter). All programs were run in Matlab2020b.

4. Results

Figure 5 shows that all sensor channels of original signals formed a subject after baseline wandering removal, data truncation, and cycle alignment. Each subfigure represents data in multiple cycles of every channel of a PPS sensor. Channel 11 with a red subtitle has the maximum calculated energy. All channels were then reordered according to the signal energy from high to low. For example, channel 11 on the spatial arrangement was renumbered as channel no. 1.
As described in the above section, a convolutional neural network was constructed to determine the channel-scaled factors of each sensor channel. The neural network architecture of the CSF estimation module is shown in Figure 6a. We implemented a custom nine-layer CNN to predict the CSF values. The size of the input pulse data was 1 × 72. Train sets and test sets selected from our 3DPI dataset were split into 80/20 ratio, respectively. In addition, we use the Adam (Kingma and Ba 2014) optimizer with a mini-batch size of 27 for a fixed number of training epochs.
Figure 6b shows the value ranges of weighting factors in each channel during the iteration of our algorithm. As the channel number increased from 1 to 25, the signal pattern of each channel varied. Meanwhile, the weighting factors of each channel showed an increasing trend along the channel axis.

4.1. Time-Domain Analysis

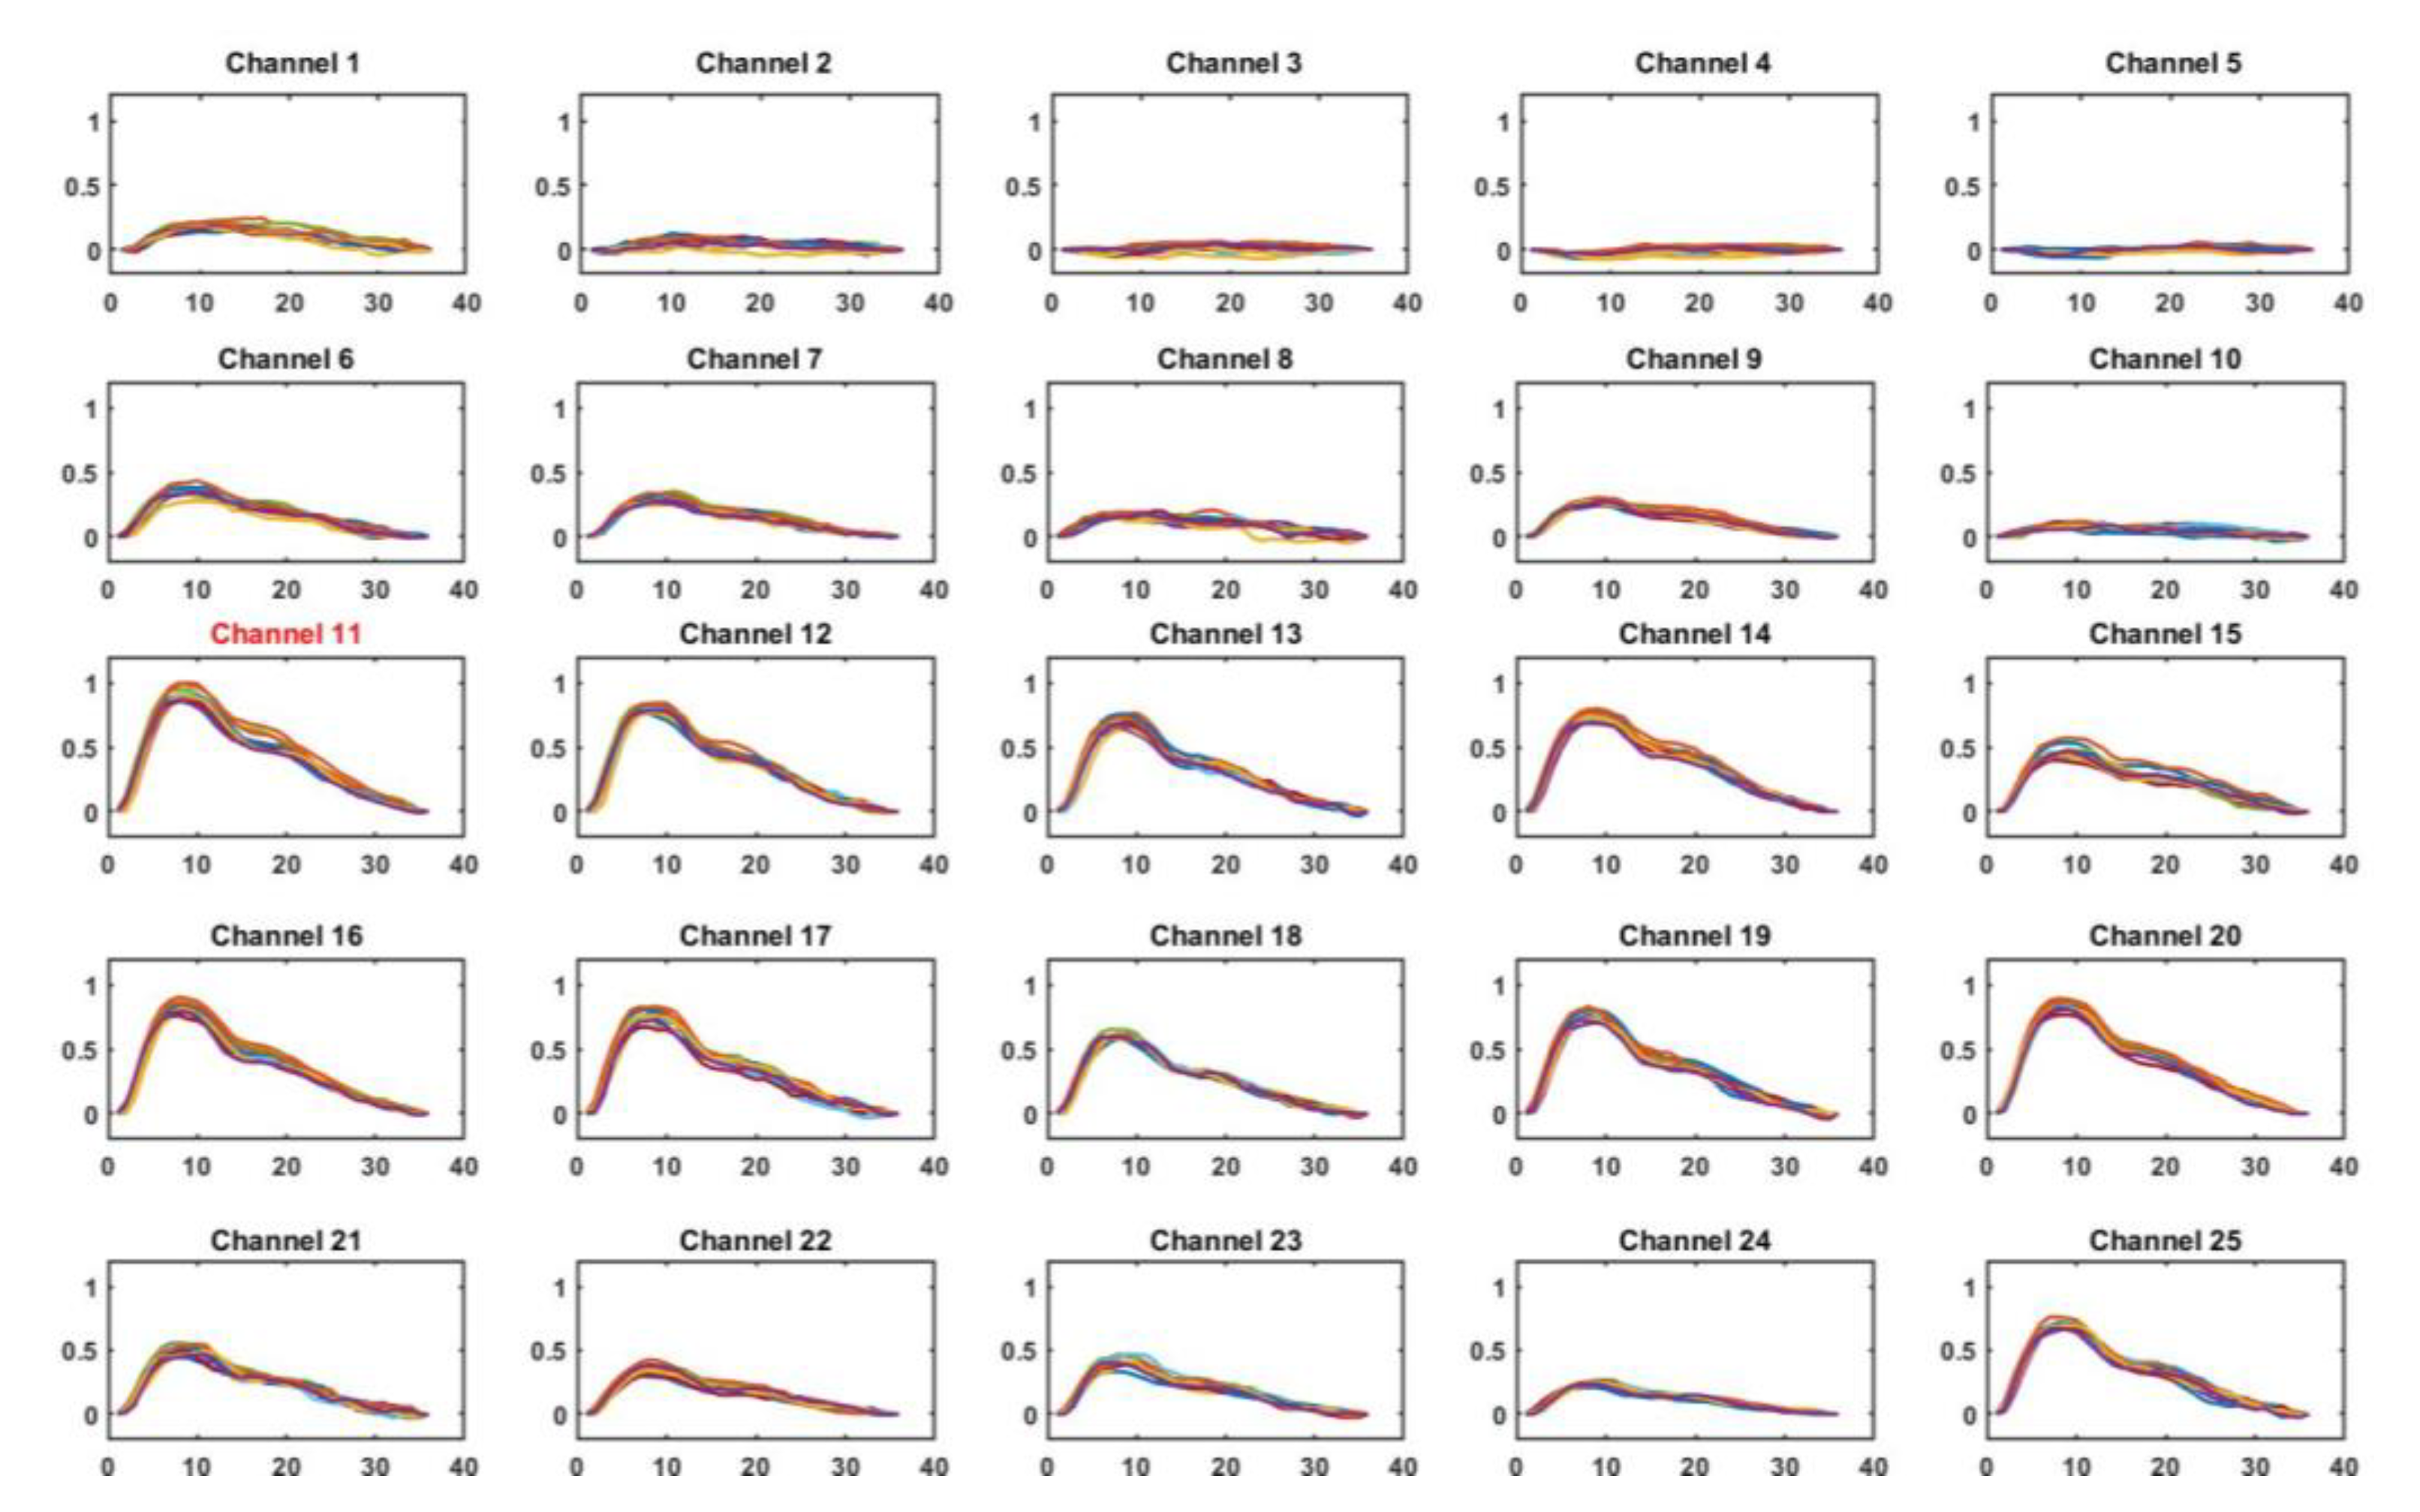
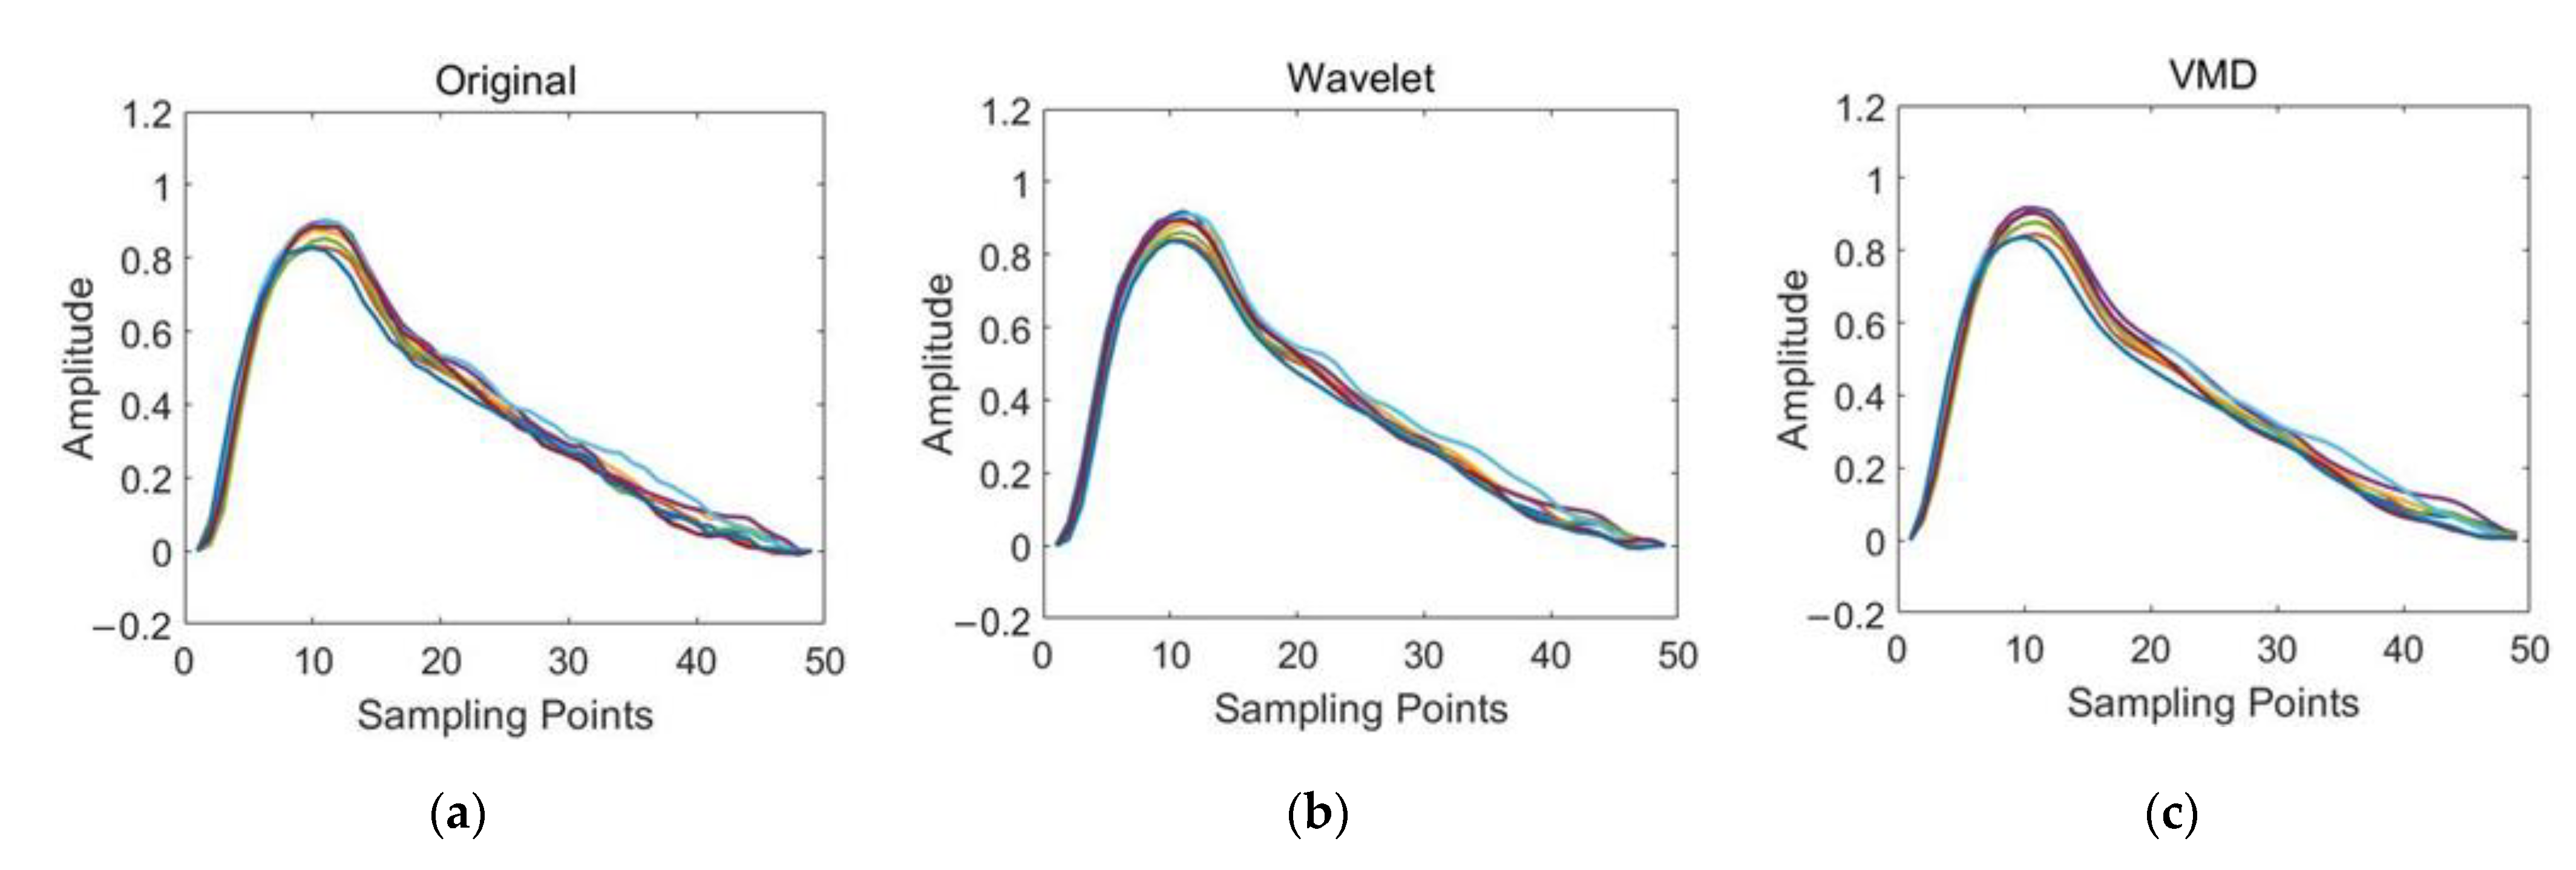
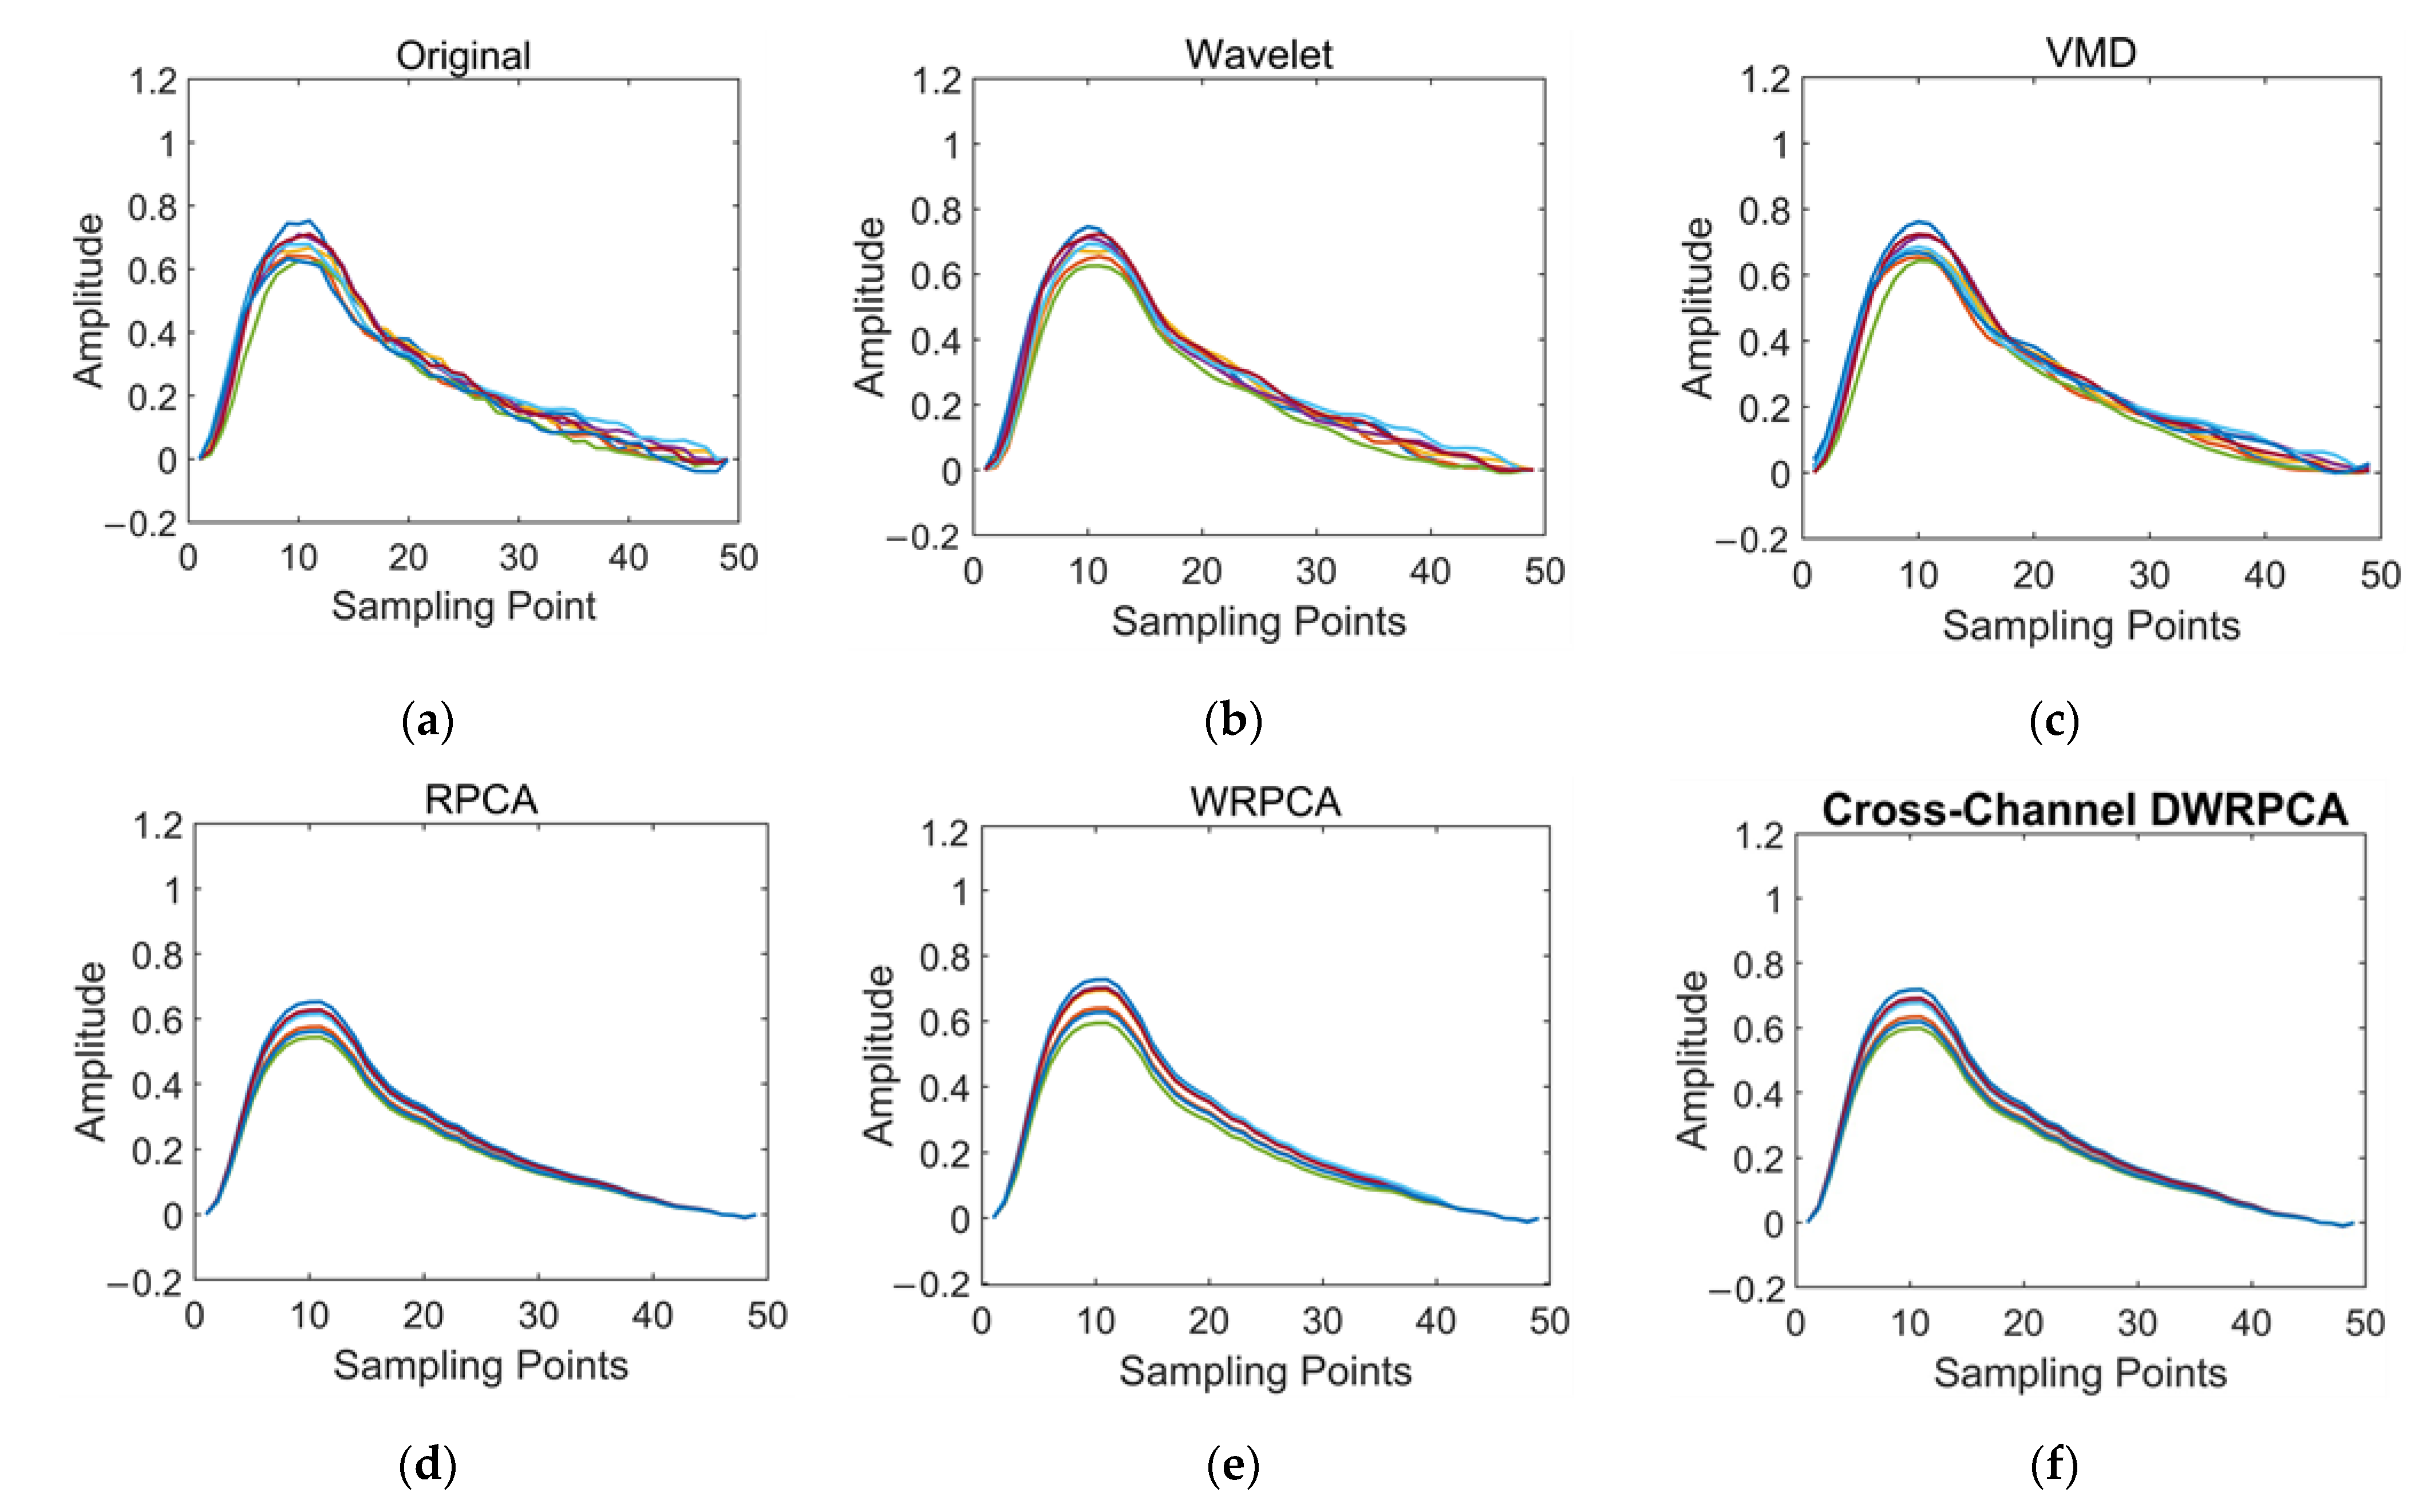
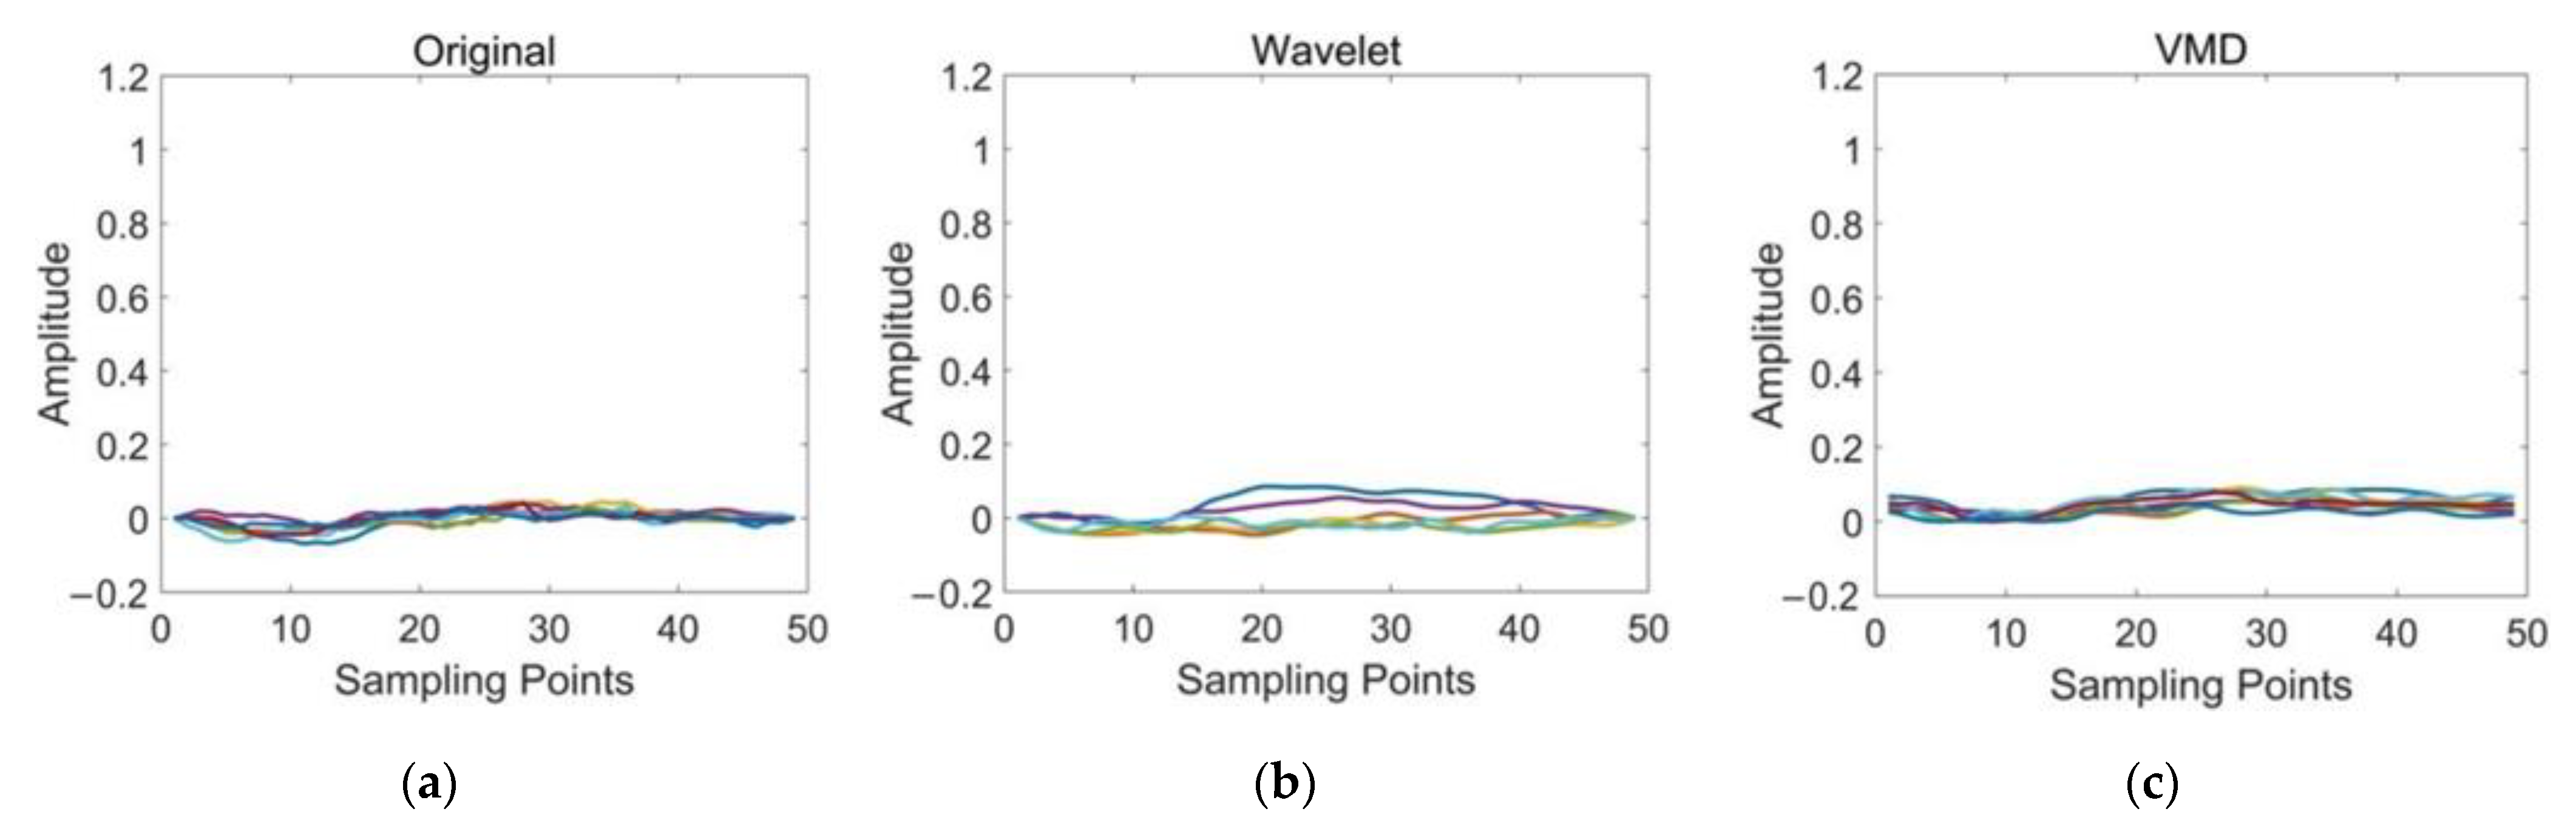
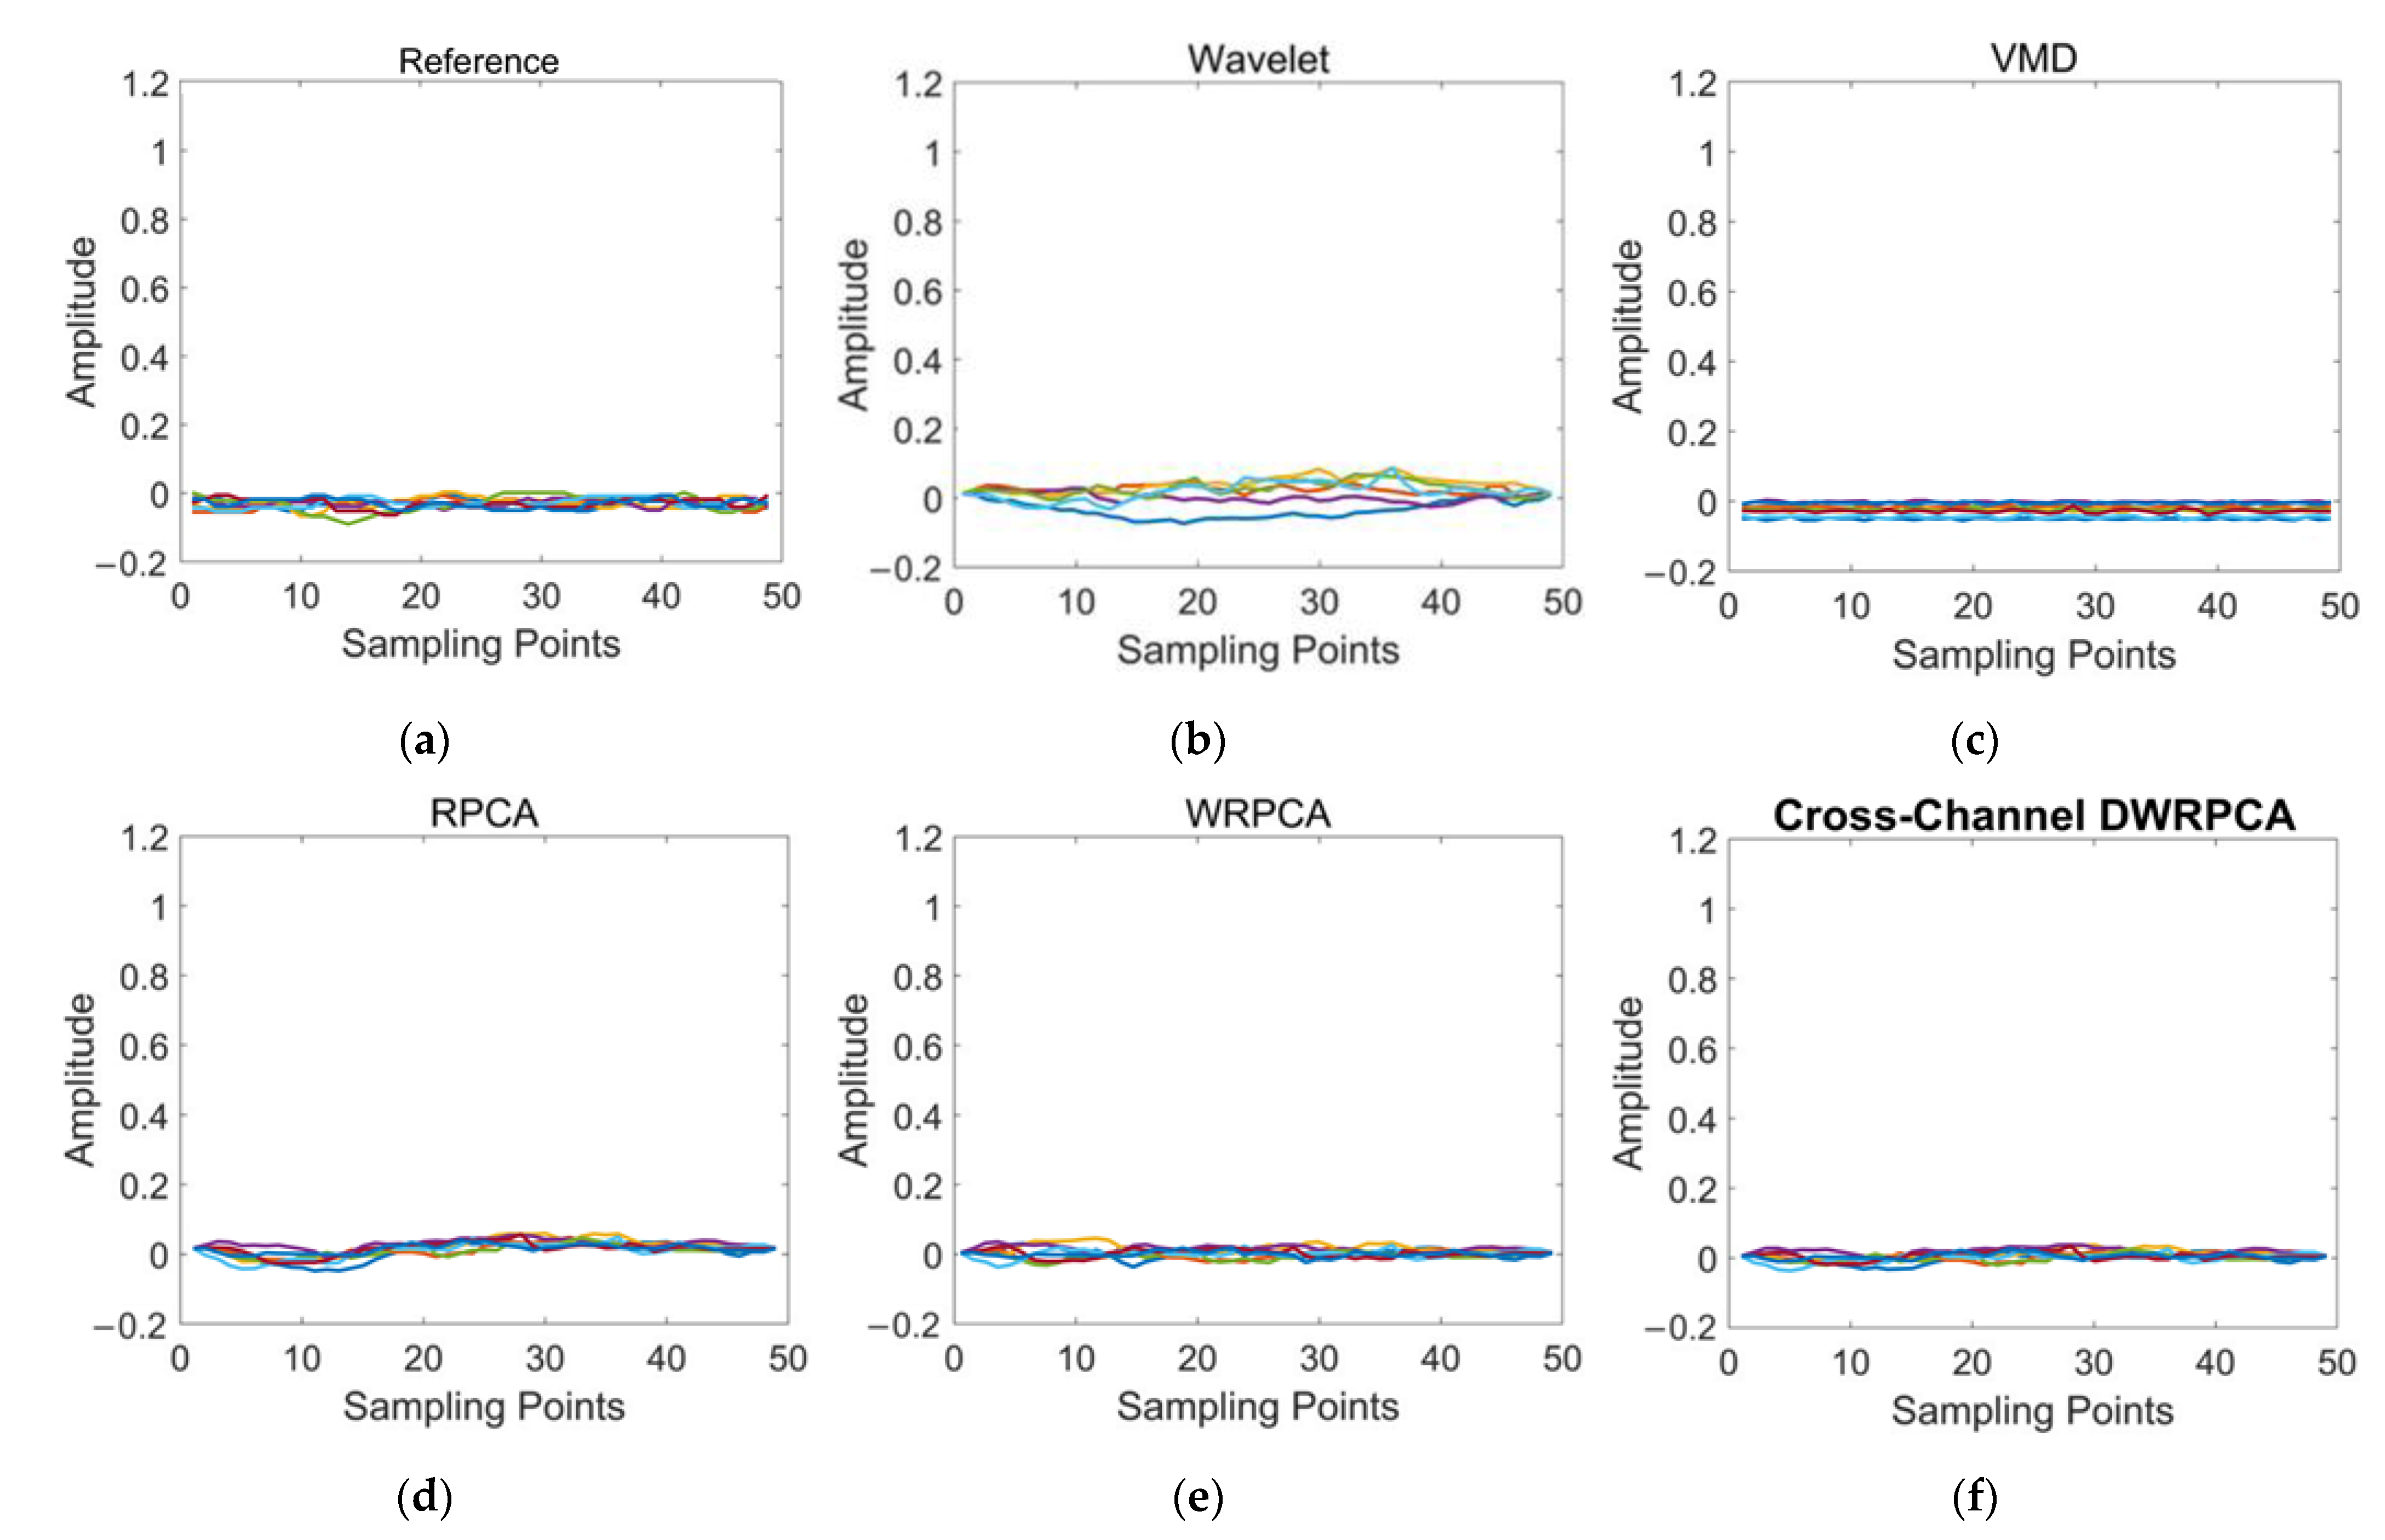
4.1.1. Time-Domain Analysis for Extracted Signals

Figure 7a shows the original data in channel no. 1, which is the input D matrix (data matrix) of de-noising algorithms. Figure 7b–f show the extracted pulse wave signals by five de-noising methods, which are the computed low-rank matrices. Compared with traditional wavelet transform and VMD methods, RPCA based methods, particularly the proposed and PRCA methods, had better performance on the feature extraction of pulse wave signals from multiple cycle data. Furthermore, our algorithm outperformed RPCA in terms of accurate amplitude peaks.
The de-noising and feature extraction effects shown in Figure 8 were similar to channel no. 1. RPCA-based algorithms could retain more information with significant de-noising performance. It is worth noting that there was a slight jitter of key physiological point P1 in the original signal. All algorithms could successfully remove the jitter and restore the signal’s physiological information.
Figure 9 shows the original and extracted signals from five de-noising algorithms in channel no. 17. Obviously, the signal-to-noise ratio (SNR) of the original signal was low. Wavelet transform and VMD could not eliminate the noise well. On the contrary, RPCA eliminated some informative signals, while WRPCA caused distortion in some cycles (see the red curve flattening in subfigure WRPCA).
Figure 10 shows the results in channel no. 25. Similarly to channel no. 17, RPCA eliminated some informative signals mixed with noises. The de-noising effect of wavelet transform and VMD was not obvious, while RPCA overprocessed the signal. WRPCA distorted the signal slightly and was inferior to the proposed method.

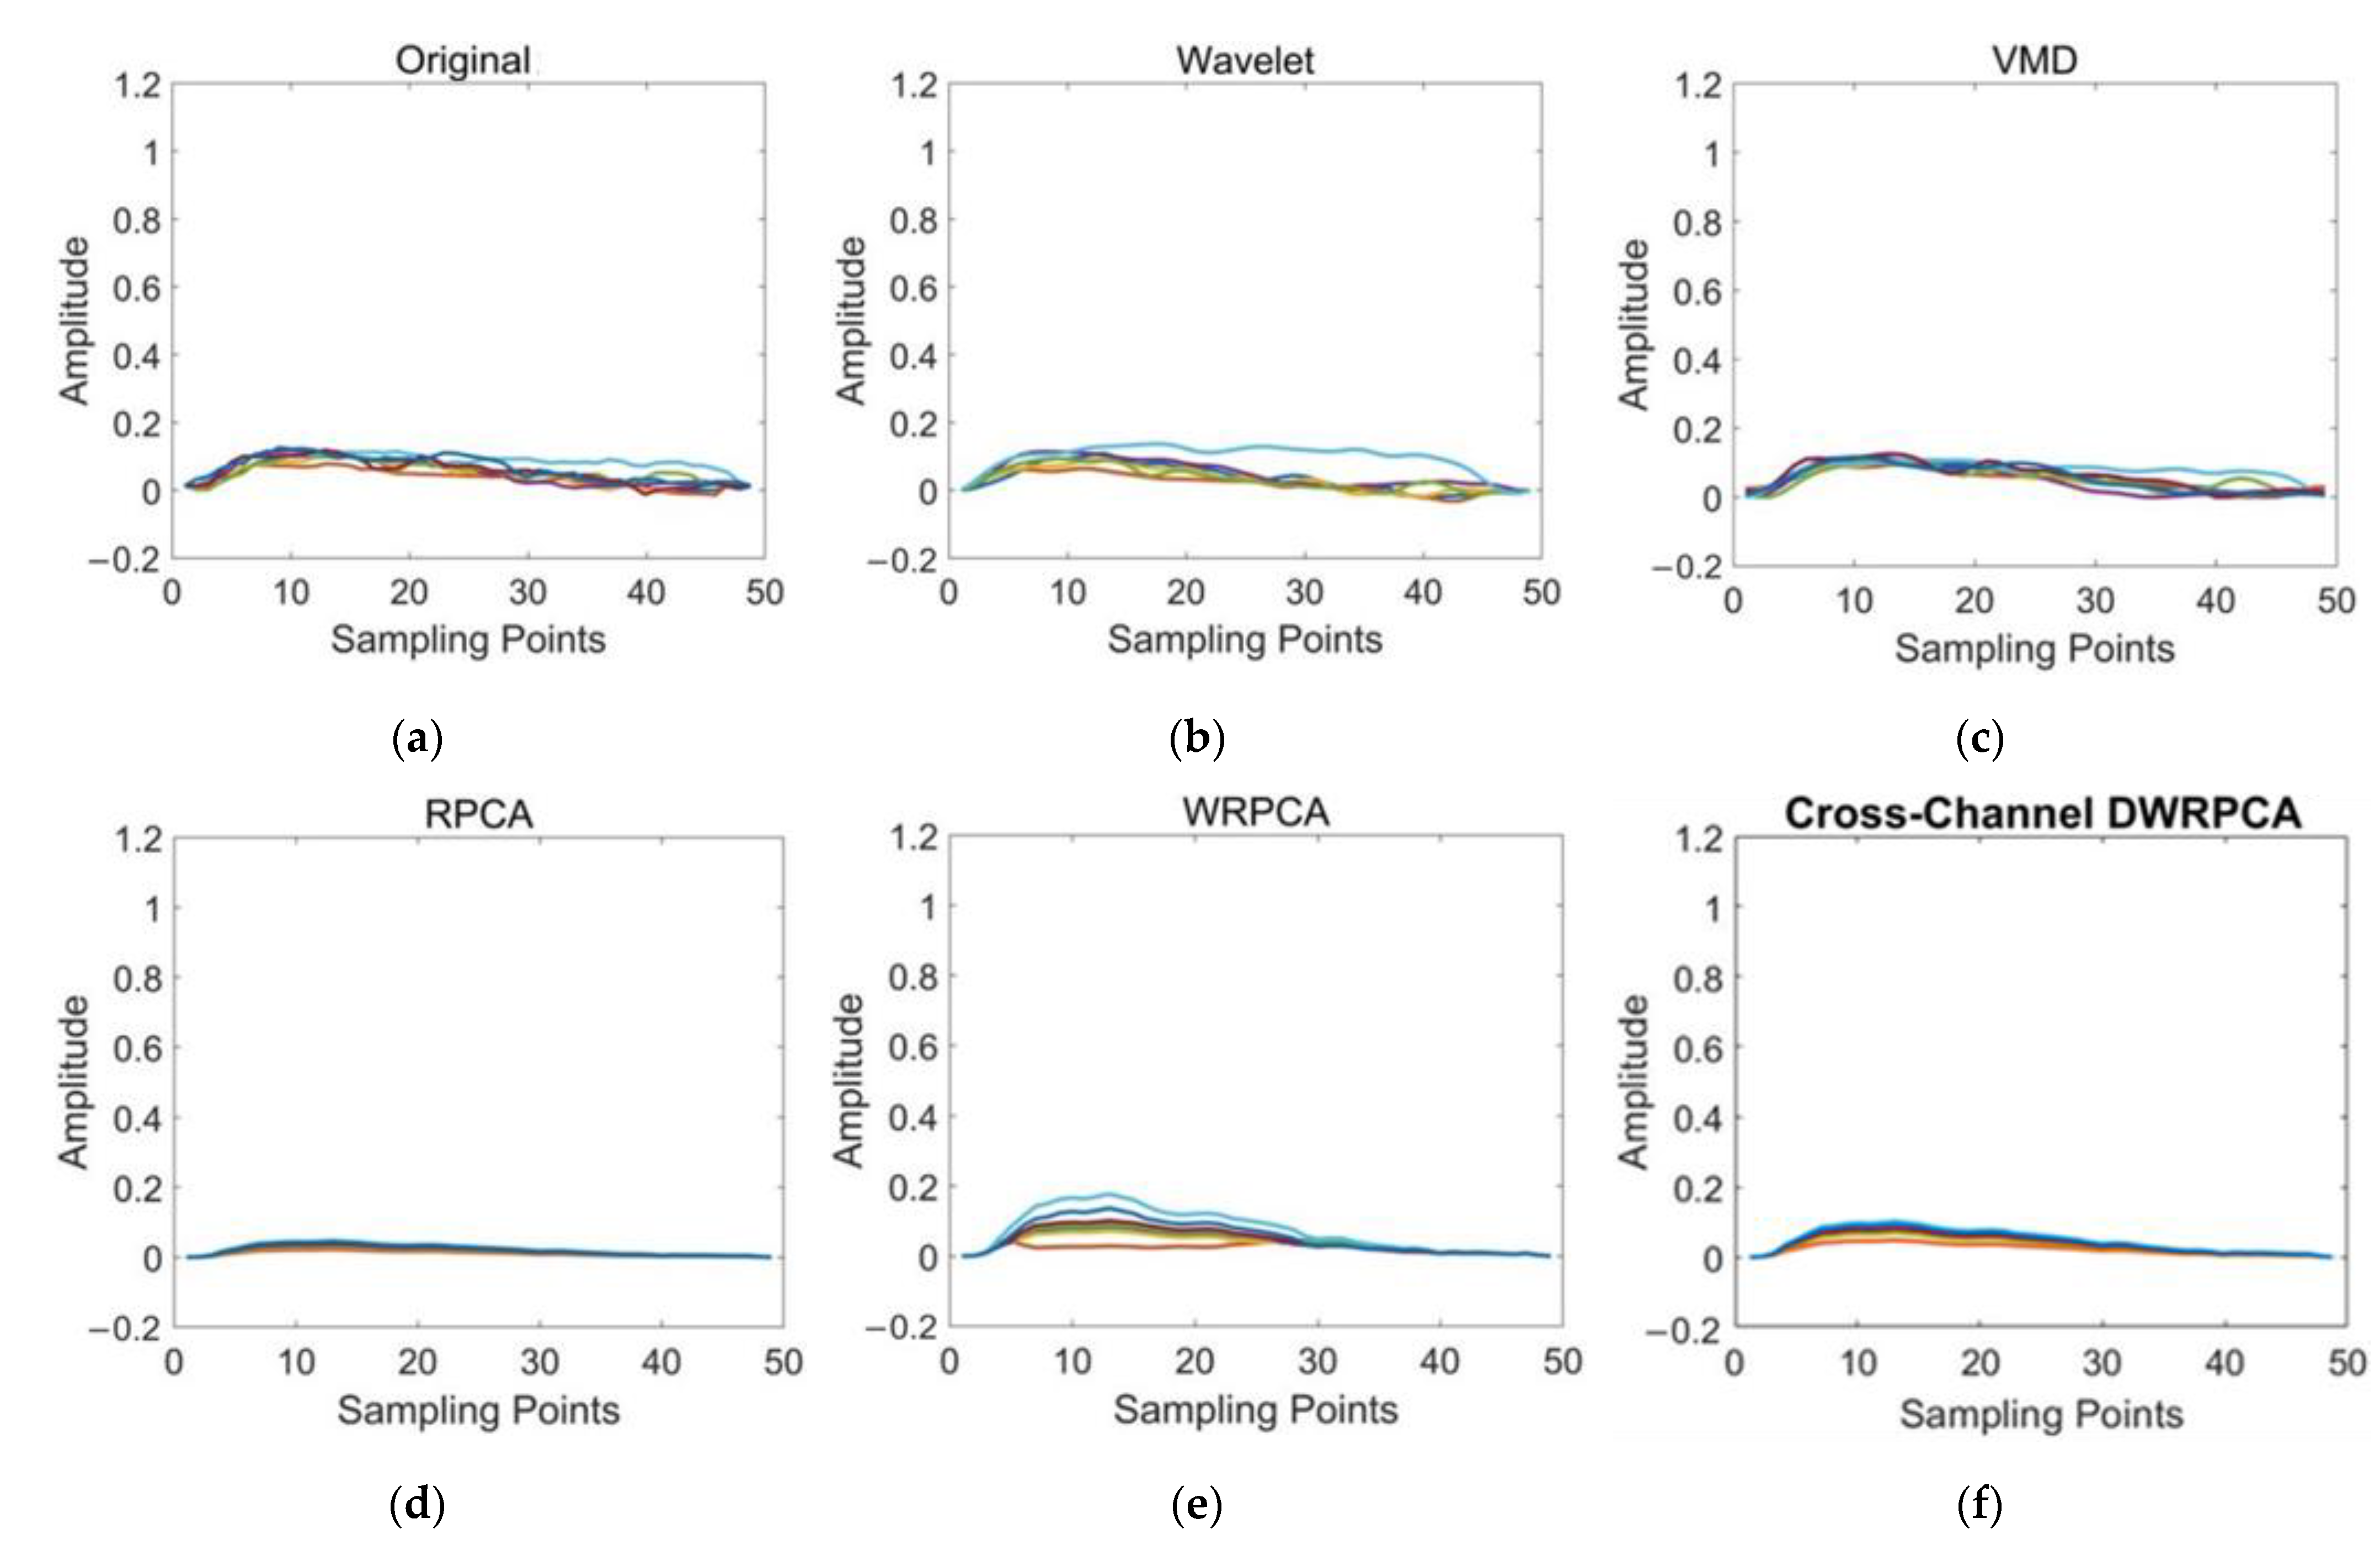
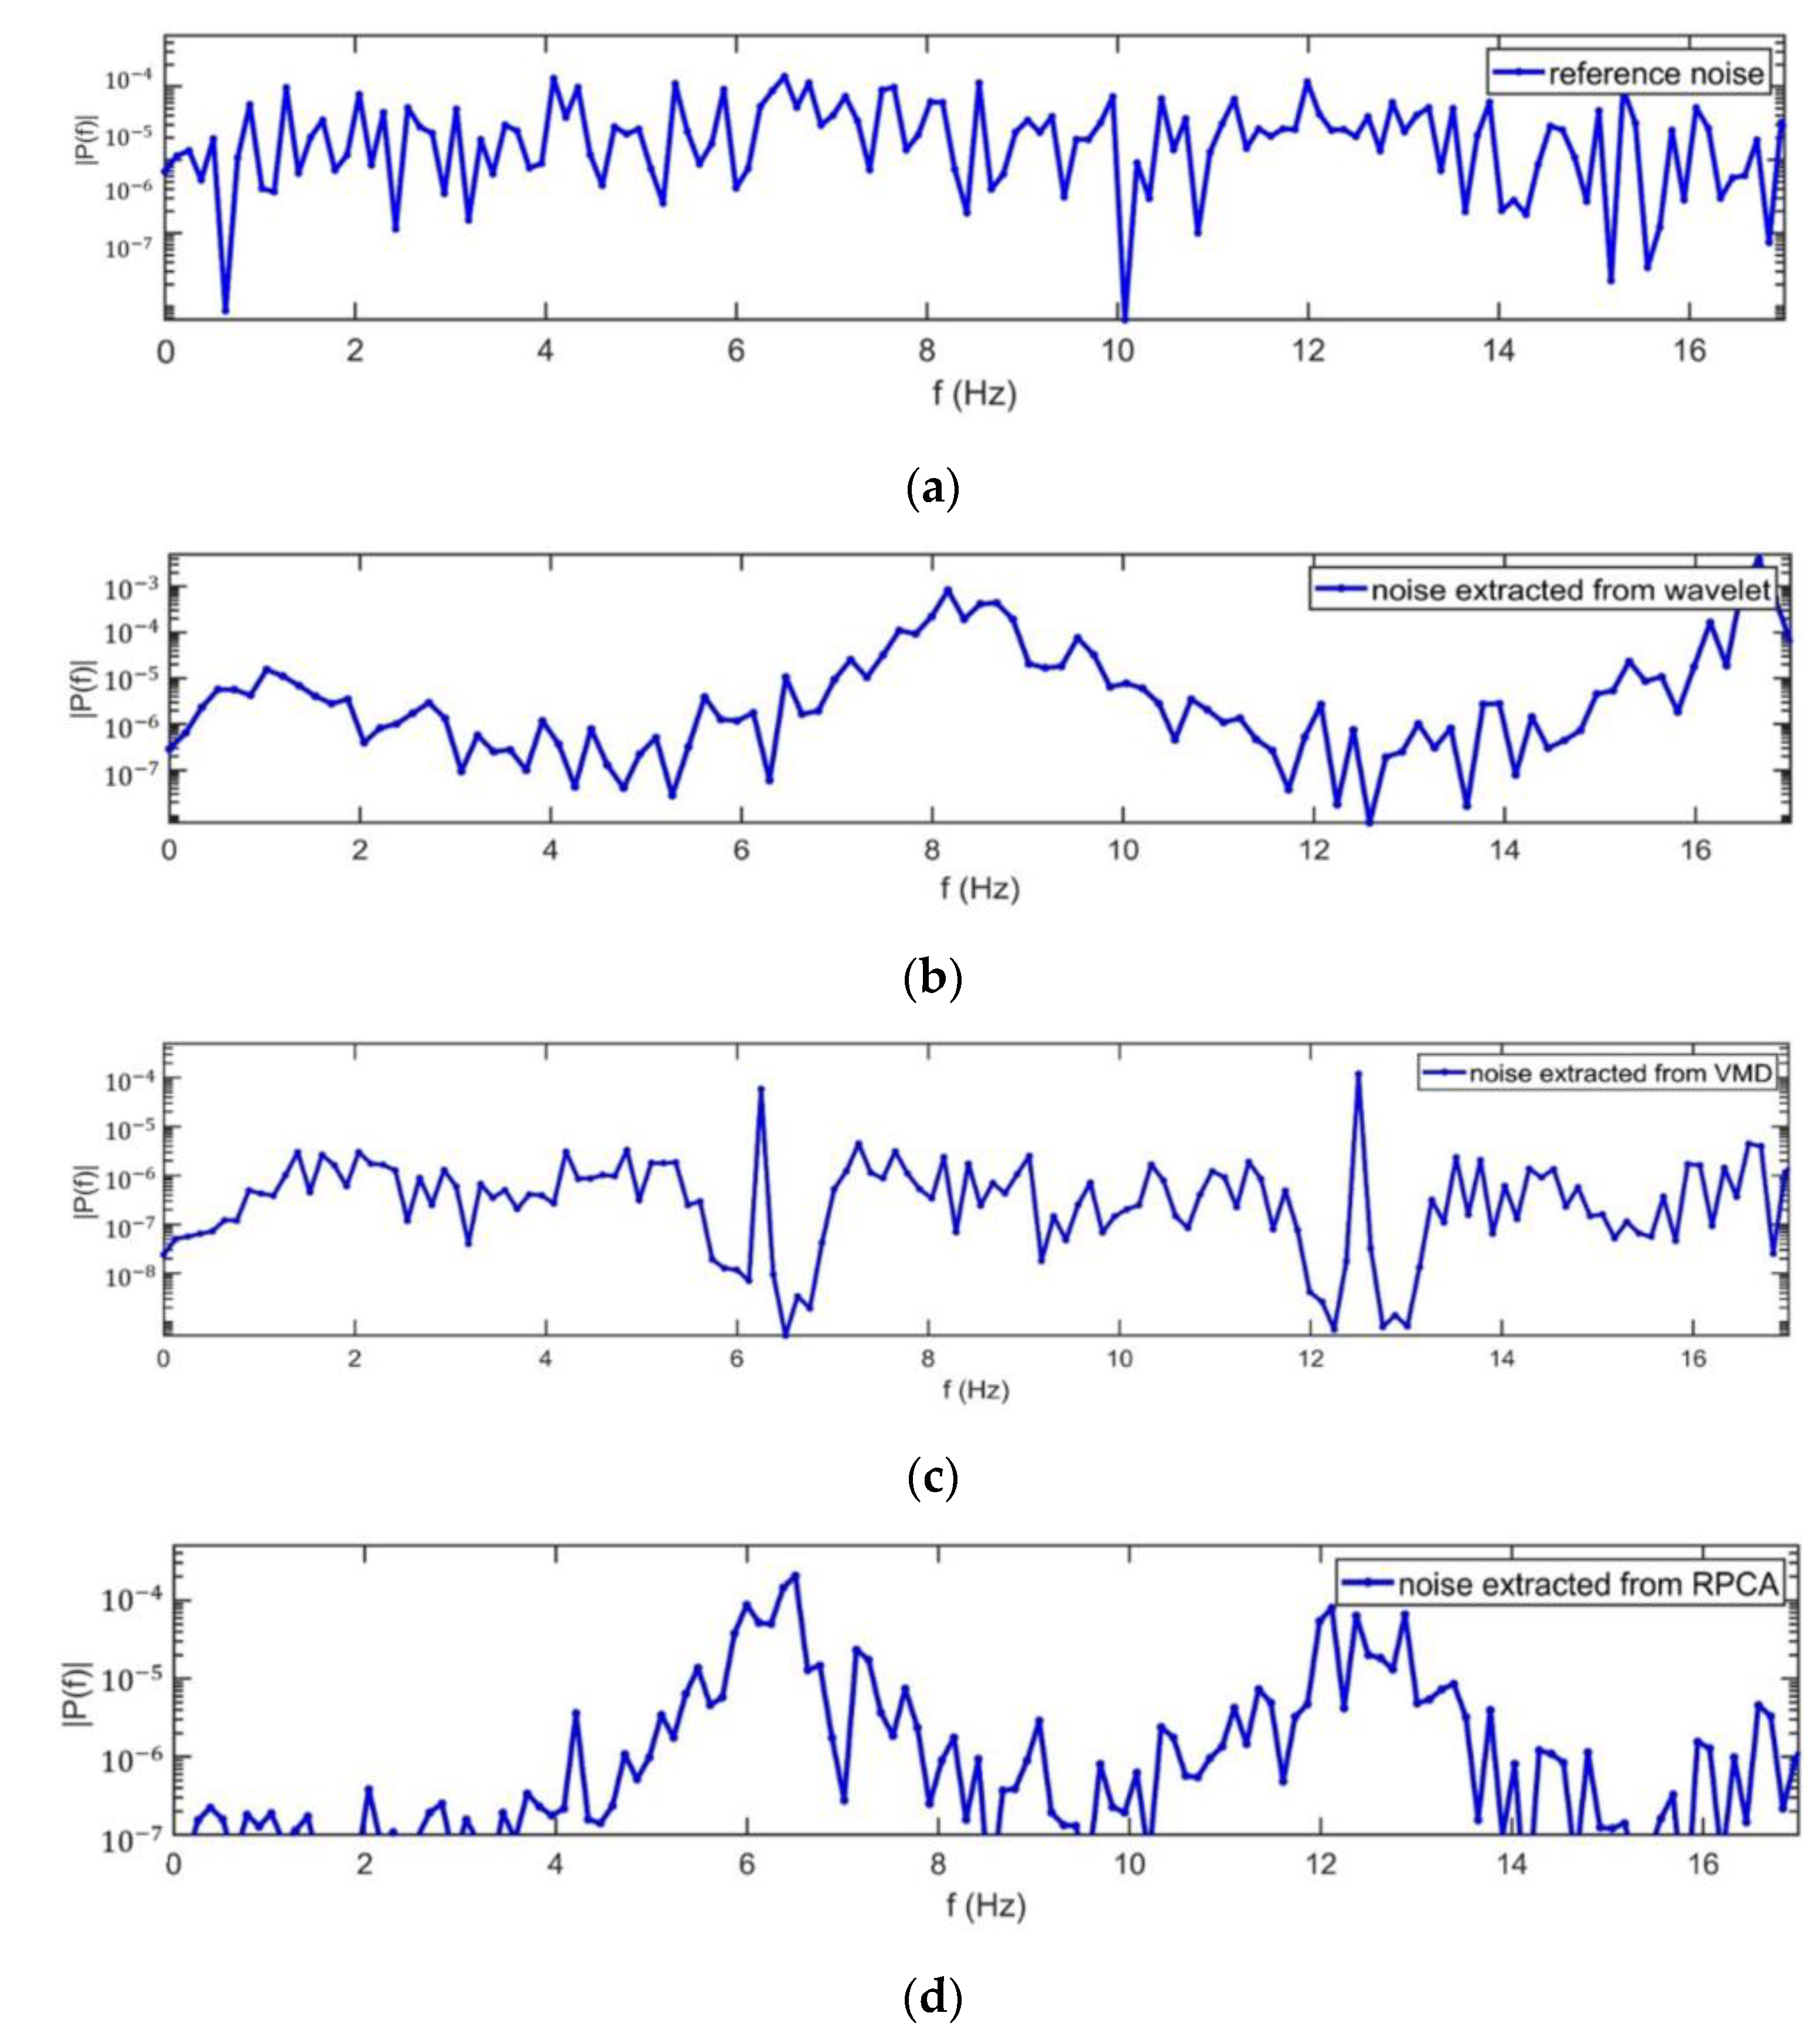
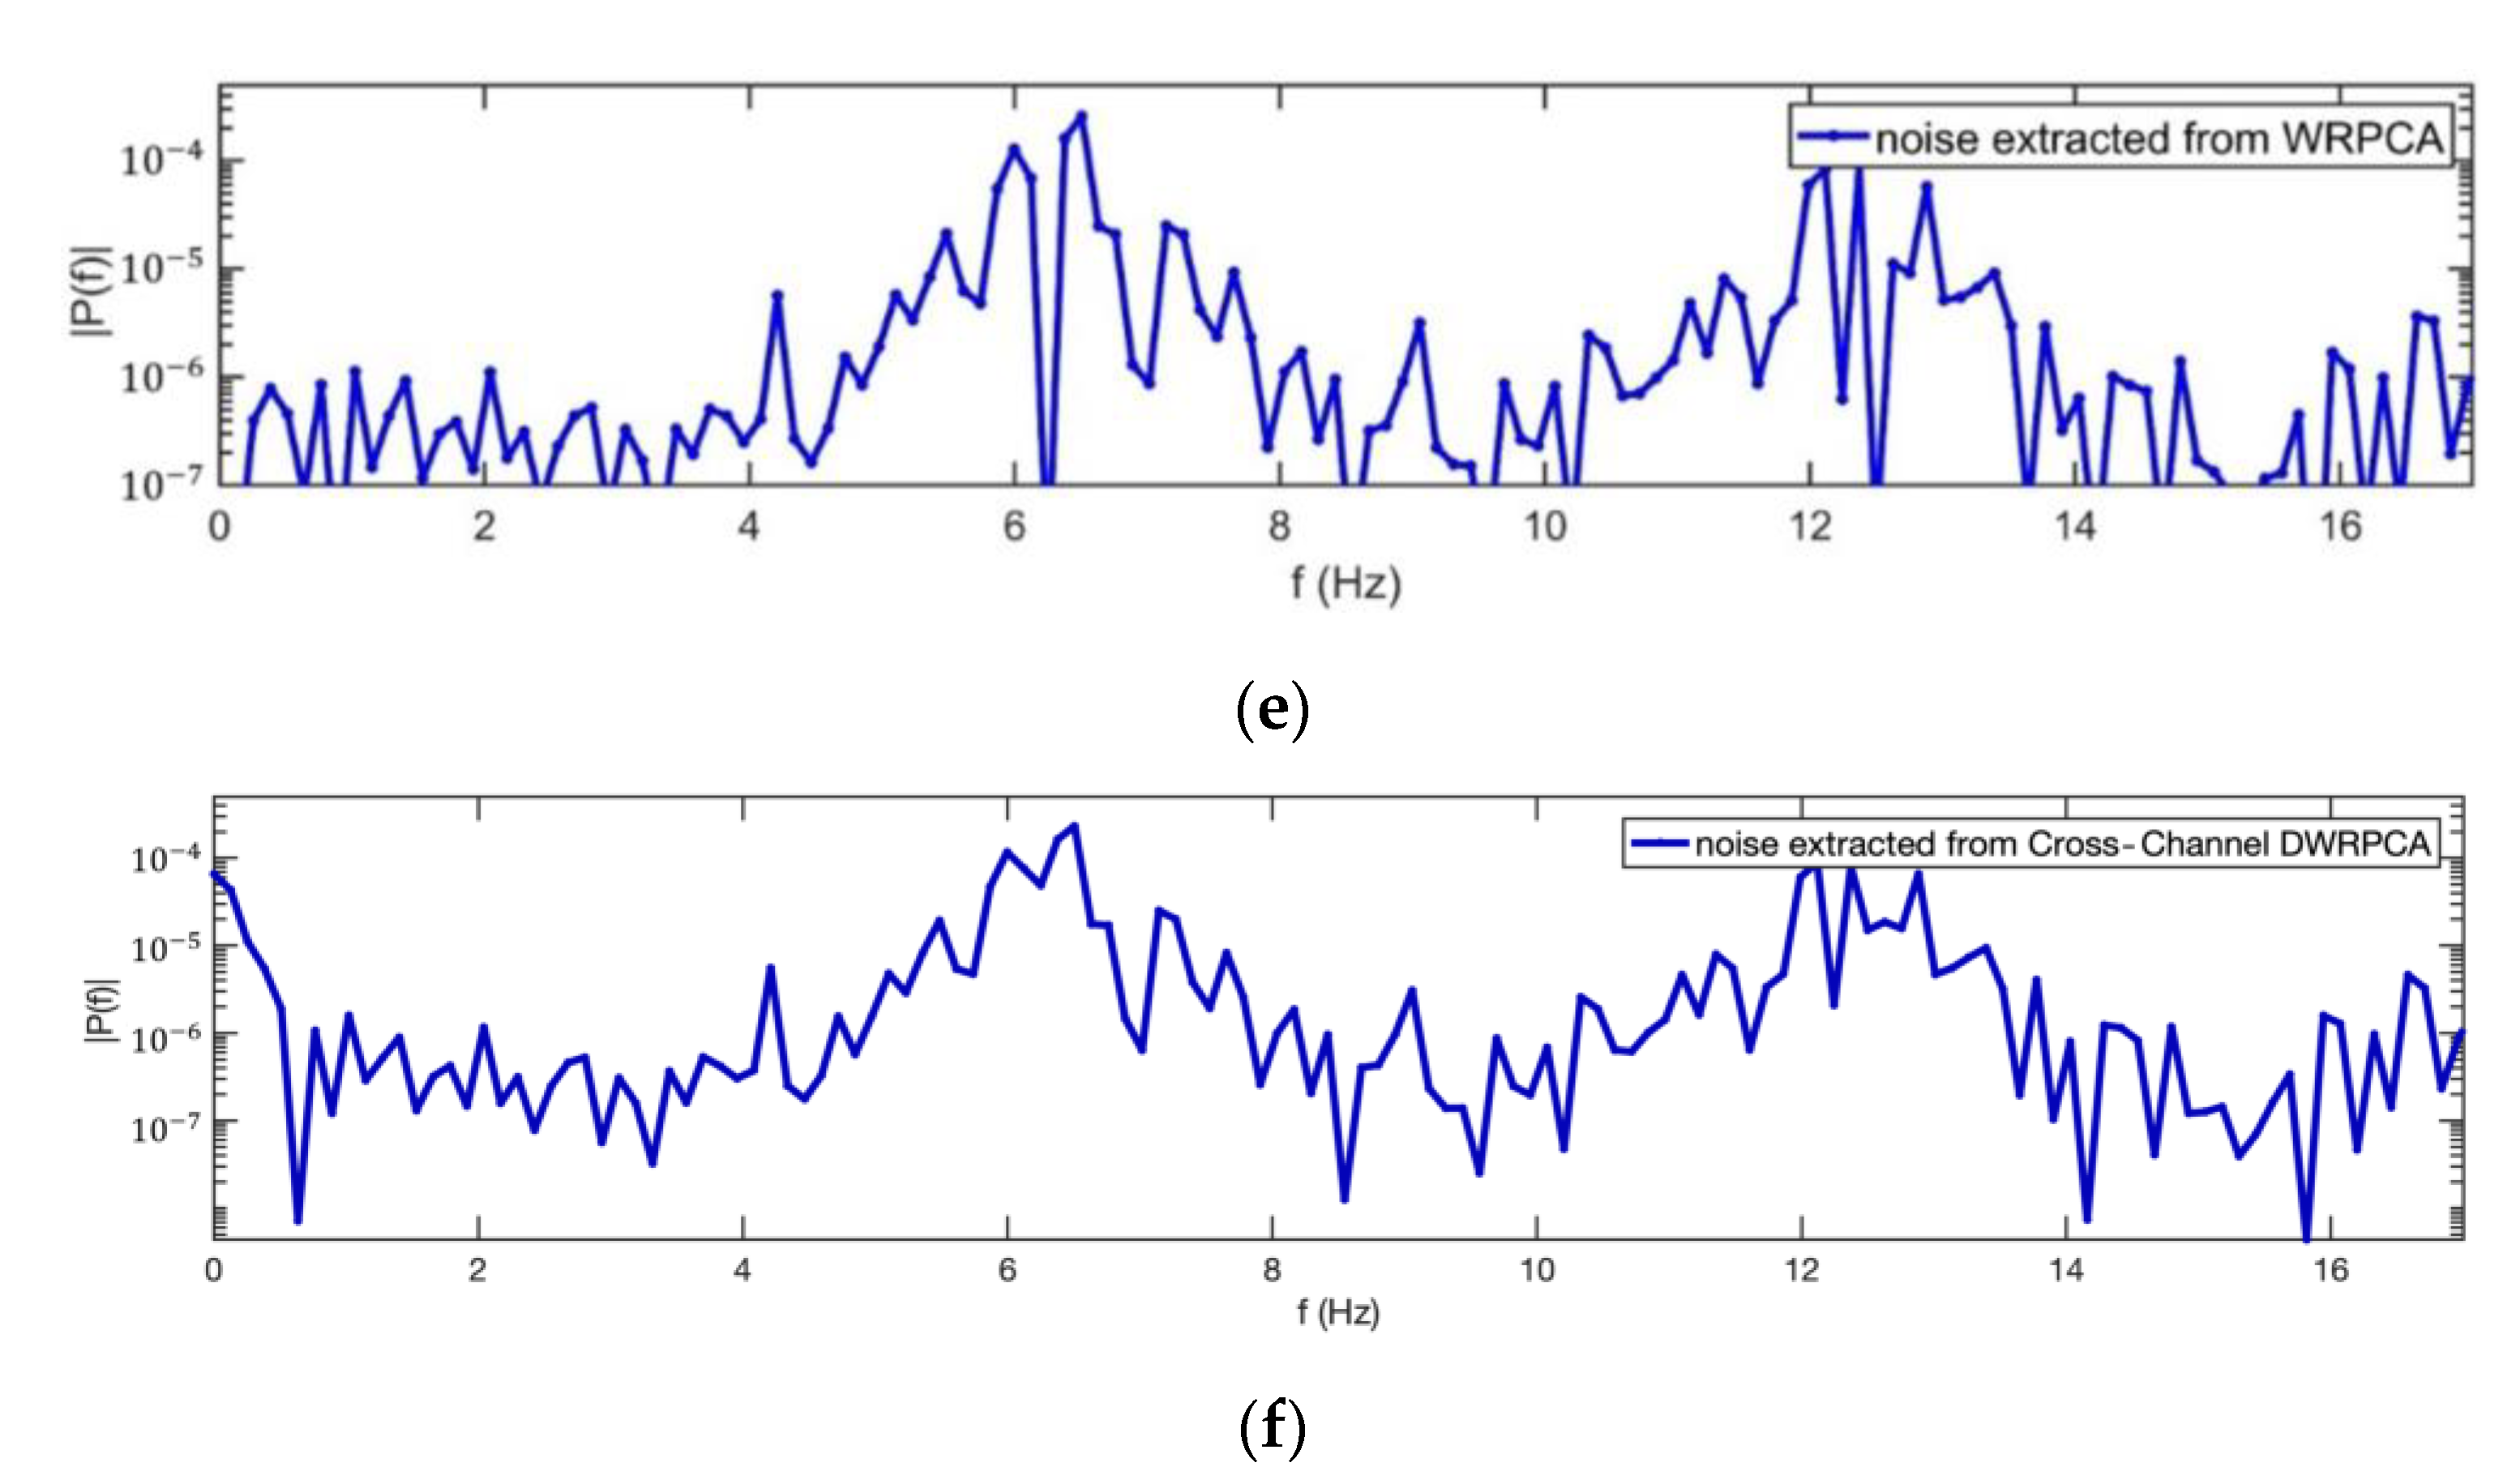
4.1.2. Time-Domain Analysis for Extracted Noise

Figure 11a shows the reference noise gauged in the time domain. Figure 11b–f show noises extracted by five de-noising algorithms in channel no. 25. The results suggest that noises extracted by WRPCA and cross-channel DWRPCA had similar amplitudes to the reference noise.

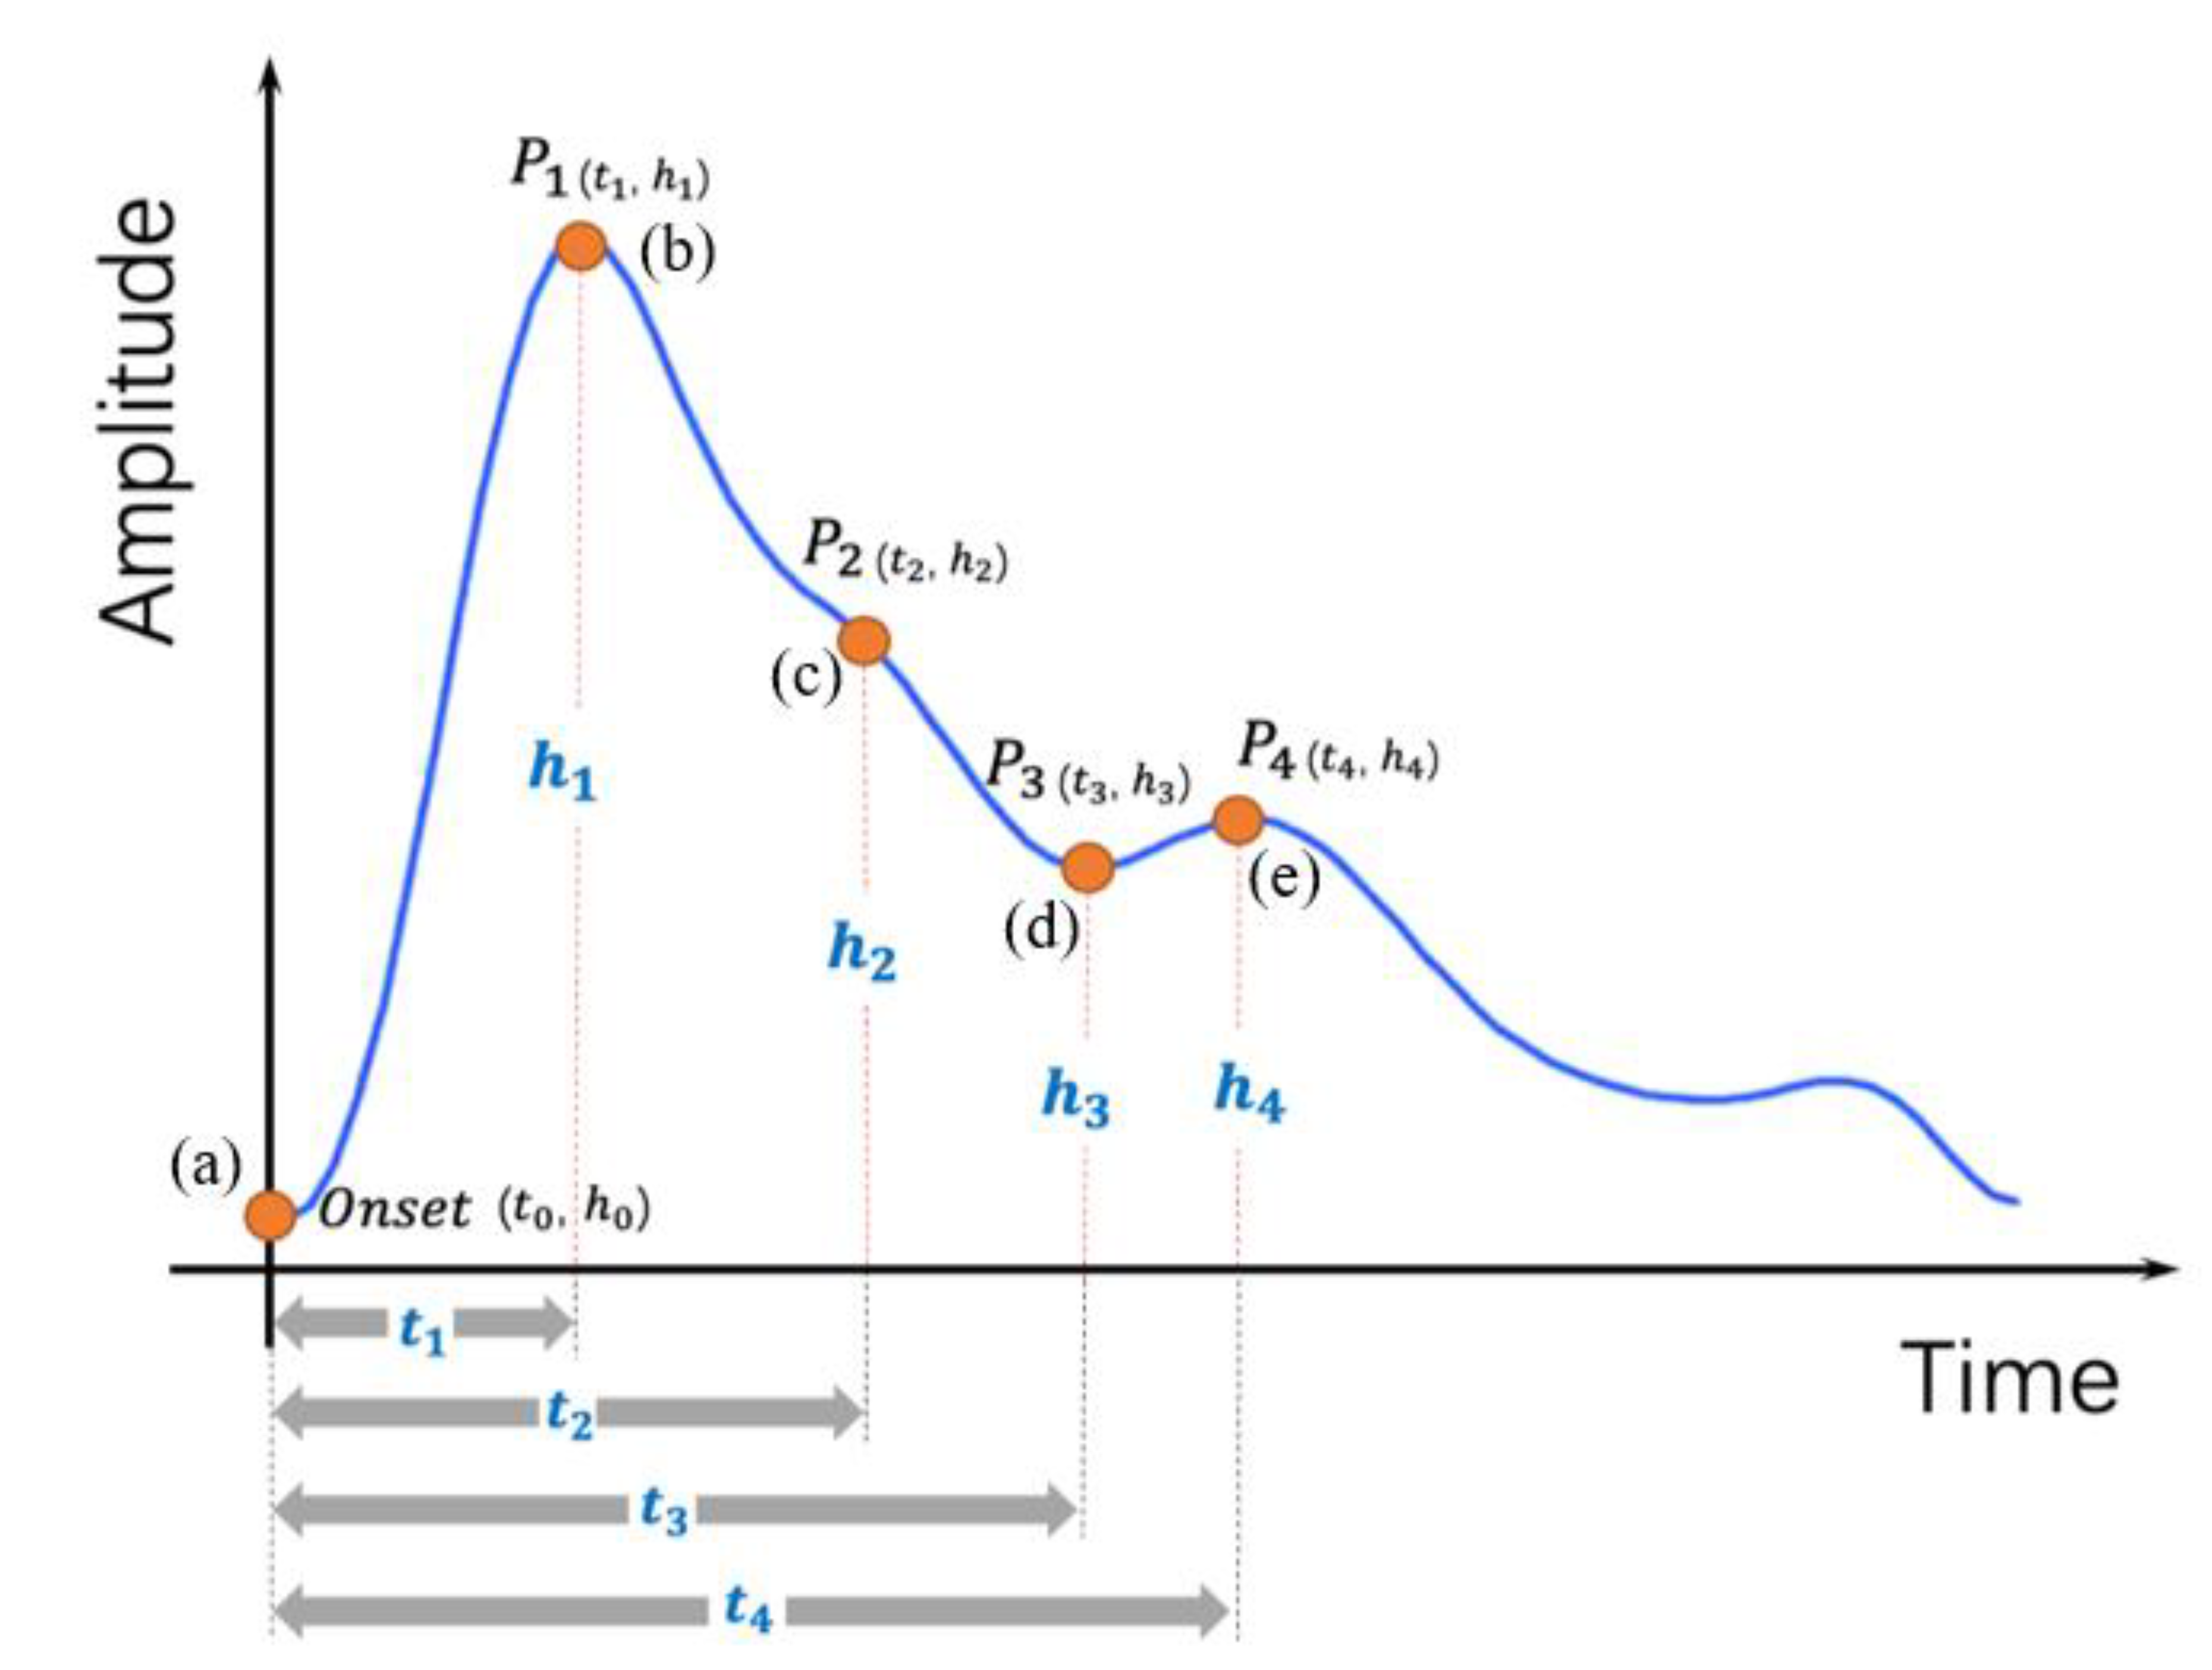
4.1.3. Non-Deviation Errors of Key Physiological Points

We selected the channel (containing several complete heartbeat cycles) with maximal energy of each subject to evaluate the errors of key physiological points after five de-noising methods. A total of 259 heartbeat cycles from 37 subjects were evaluated in this experiment. Ventricular contraction P1( t 1 , h 1 ), reflected wave P2( t 2 , h 2 ), and the augmentation index (AIx) were regarded as essential evaluation indicators for further calculation and analysis.
The time absolute error (TAE) and amplitude relative error (ARE) calculated before and after de-noising are shown in Table 1. Results with small errors are shown in bold. It can be seen that the cross-channel DWRPCA performed well, along with WRPCA, in almost all TAEs and AREs. The ARE of h 1 for the cross-channel DWRPCA and WRPCA was much smaller than that for wavelet transform, VMD, and RPCA. Moreover, the ARE for the cross-channel DWRPCA was 23.4% smaller than that for the WRPCA.
Since the key physiological data obeyed a normal distribution with homogeneous variance according to the k–s test, we paired every two indices and compared each matched pair with a two-tailed paired t-test. The t-test results in Table 2 show that AREs for the proposed algorithm were significantly smaller compared to the others, especially VMD and wavelet transform. At the same time, the AREs of h 2 and AIx for RPCA and WRPCA showed no significant differences. In addition, the TAEs for the cross-channel DWRPCA, RPCA, and WRPCA were significantly smaller than those for the VMD and wavelet transform methods.

4.2. Frequency-Domain Analysis

From the power spectral density subfigure of reference noise (Figure 12a), frequency bands of 6–7 Hz and 12–13 Hz should be considered the noise-dominant frequency bands of PPS tactile sensors. Figure 12b shows that the traditional wavelet de-noising method could not filter noise in these two frequency bands. The VMD method correctly found the distribution of the noise (Figure 12c), but the noise in particular frequency bands was only partly filtered out. However, all RPCA-based methods (Figure 11d–f) could successfully filter out the main frequency bands of the noise. In addition, it is worth noting that our method could eliminate the noise better in a lower-frequency band (0–2 Hz) compared with other RPCA-based methods. Other noise frequency bands were strongly mixed with pulse signals, which are considerably hard to eliminate.

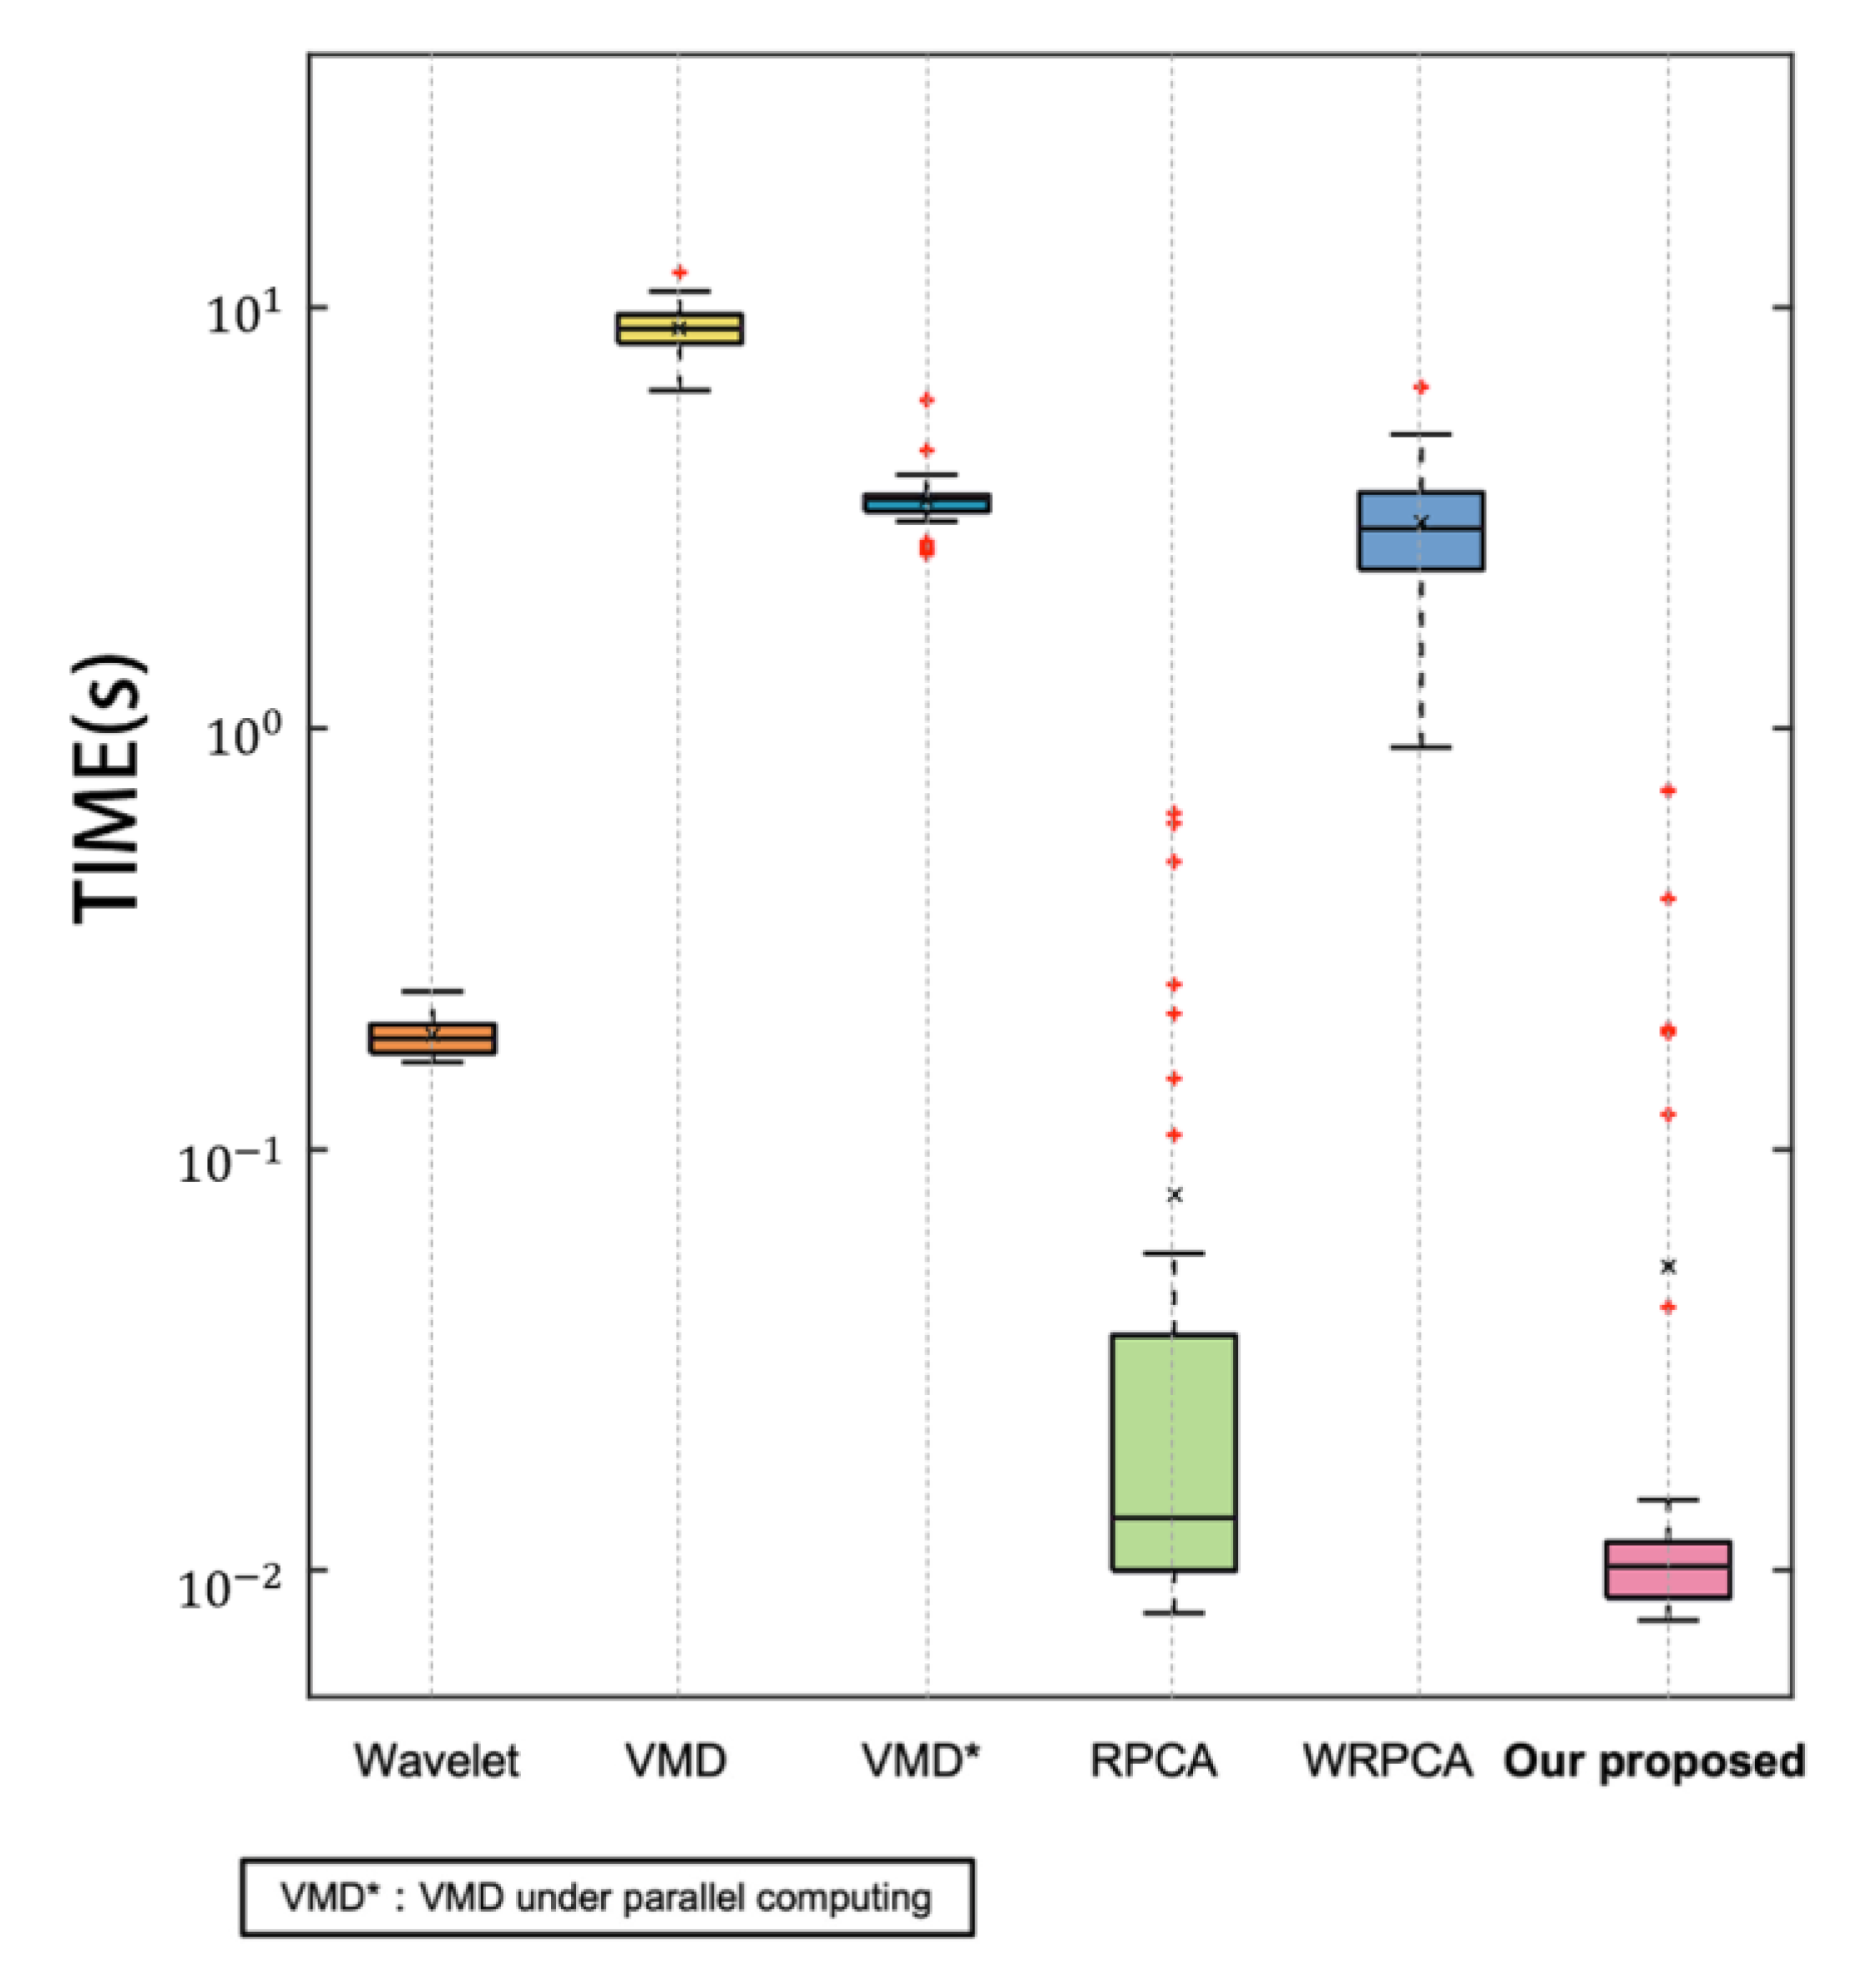
4.3. Run-Time Complexities

The results of the time complexity experiment are shown in Figure 13. Each run-time result was the total time for all subject trials. As the total run time of the cross-channel DWRPCA and RPCA algorithms was substantially lower compared to other algorithms, the y-axis is demonstrated on a log scale. The run-time result of the cross-channel DWRPCA does not include the CNN model training time, since the model no longer needs to be updated when constructed for a specific sensor type. Owing to the dynamic adjustment of weighting factors ω , the computational time complexity of the cross-channel DWRPCA was strongly reduced and was even slightly lower than the conventional RPCA algorithm.

5. Discussion

This paper proposed a cross-channel dynamic weighting RPCA algorithm to improve the de-noising performance of a multi-channel pulse wave processing procedure. Wavelet transform, VMD, RPCA, WRPCA, and the proposed cross-channel DWRPCA were evaluated for 3DPI noise removal performance with time-domain and frequency-domain analysis, run-time complexity analysis, and non-deviation error evaluation.
The de-noising results show that the RPCA-based methods are better than the traditional wavelet transform and VMD methods, whereby smooth and consistent periodic signals were extracted from the original signal at every energy level (see Figure 6, Figure 7, Figure 8 and Figure 9). Since the energy distribution of noise is mixed with that of the physiological signal, the results processed by the traditional methods are not much different from the original ones. While the noise is always random in tactile sensors, we strengthen the periodicity of the signal by segmenting and aligning it by heartbeat cycles, which enables RPCA-based method to better de-noise the original signal.
Compared with the cross-channel DWRPCA and WRPCA, RPCA overprocessed the signals and reduced the amplitudes of extracted signals, even approaching a straight line in Figure 10d. In the cross-channel DWRPCA and WRPCA, the weighted nuclear norm (WNN) replaced the nuclear norm used in RPCA to apply different thresholds for different features. This WNN technique prevents the main features of the pulse signal from being removed.
Furthermore, by applying the corresponding CSF to different channels, the weighting factors estimated in the cross-channel DWRPCA were smaller compared to the WRPCA in sensor channels with relatively low signal energy, thus performing better (see Figure 9 and Figure 10). Notably, the CSF values were predicted from our custom nine-layer CNN. The CNN structure was basic but decent enough for this study, and we can naturally expect that different sensor types require different neural network designs for appropriate CSF estimation. In brief, the basic CNN model used in this paper is one of the solutions for CSF estimation and can be developed in further studies.
The non-deviation errors of key physiological points revealed that, with different individuals and heartbeat cycles, the TAEs and AREs of the cross-channel DWRPCA and WRPCA algorithm were significantly smaller compared to other algorithms. This result indicates that the physiological information of these two methods was relatively less distorted. In the analysis of noise comparison, we found that the amplitude of the noise extracted by RPCA (Figure 11d) was not constant, indicating that some of the signal features were still mixed with noise. Moreover, a time complexity experiment was conducted to evaluate the total run time required by our algorithms. Our method was the least time-consuming in this experiment since the dynamic weighing technique could save compute time.
Overall, the proposed cross-channel DWRPCA achieved better performance than other well-known algorithms through several evaluation studies, such as evaluation in the time and frequency domains. There exist hardware and software modules for de-noising in a standard multi-channel sensor system; however, for the reasons mentioned earlier, it is difficult to eliminate noise that is mixed with the signal. Despite not being the focus of this paper, a redesigned hardware is expected to fundamentally improve de-noising performance and deserves further study. Now that the system has output the noise mixed with signal, this study makes a novel contribution by proposing and verifying a generalizable de-noising method considering inter-channel correlation.
A limitation of the current research is the relatively small sample size, and some sharp noises (e.g., the jitter in Figure 7) were rarely collected. Since RPCA-based algorithms are very good at removing such sharp noises in image processing [40], in follow-up studies, we would like to quantitatively evaluate the effect of the proposed method on removing these kinds of noise in multi-channel physiological signals. In addition, various waveform signals with different physiological features or at different measurement locations (e.g., carotid artery) should be evaluated in the future to verify the generality of the proposed method. Nevertheless, the present study is the first step in determining the generality of the cross-channel DWRPCA, applied to signals collected from both healthy and hypertensive subjects. Given that energy distribution differences are ubiquitous in multi-channel tactile sensors [6,8,9], which are used for the weight calculation of the proposed method, the positive results of this study provide confidence for future studies on the de-noising of different kinds of physiological signals.

6. Conclusions

This study proposed the cross-channel DWRPCA algorithm for de-noising multi-channel arterial pulse signals. A channel-scaled factor technique is used to manipulate the weighting factors of WRPCA. This channel-scaled factor can adjust the weights among the channels according to their signal patterns, optimizing the feature extraction in multi-channel signals. By assigning weights of different channels, the noise mixed with the physiological signal can be eliminated quantitatively without signal distortion. The results of a series of performance evaluations in the time and frequency domains reveal that, compared with other existing de-noising algorithms such as wavelet transform, VMD, RPCA, and WRPCA, the proposed cross-channel DWRPCA could achieve better de-noising performance with less time consumed.
Therefore, a complete multi-channel pulse wave processing system was constructed and recommended with the novel de-noising algorithm. The system includes data truncation, baseline wandering removal, cycle alignment, the de-noising algorithm, and signal reconstruction. The outcome data are preferable for future analytical research with less noise and distortion.
In short, the proposed cross-channel DWRPCA algorithm is recommended for radial arterial pulse acquisition and analysis systems to ensure the quality of the extracted pulse signal. Furthermore, the idea of this algorithm by assigning weights to different channels can benefit other multi-channel physiological signal de-noising and feature extracting fields.

Author Contributions

Data curation, C.-C.T.; methodology, Z.C.; supervision, B.P. and X.X.; validation, C.C. and X.C.; writing—original draft, Z.Z.; writing—review and editing, B.P., K.G. and Z.C. All authors have read and agreed to the published version of the manuscript.

Funding

This research was funded by the National Natural Science Foundation of China, grant number 62071497.

Institutional Review Board Statement

The study was conducted in accordance with the Declaration of Helsinki and approved by the Institutional Review Board of National Cheng Kung University (approval#B-ER-103-263; the study protocol was approved on 17 November 2014).

Informed Consent Statement

Informed consent was obtained from all subjects involved in the study.

Data Availability Statement

The data used to support the findings of this study are available from the corresponding author upon reasonable request.

Conflicts of Interest

The authors declare no conflict of interest.

References

  1. Korpas, D.; Hálek, J.; Doležal, L. Parameters describing the pulse wave. Physiol. Res. 2009, 58, 473–479. [Google Scholar] [CrossRef] [PubMed]
  2. Hu, X.-J.; Zhang, L.; Xu, J.-T.; Liu, B.-C.; Wang, J.-Y.; Hong, Y.-L.; Tu, L.-P.; Cui, J. Pulse Wave Cycle Features Analysis of Different Blood Pressure Grades in the Elderly. Evid.-Based Complement. Altern. Med. 2018, 2018, 1–12. [Google Scholar] [CrossRef] [PubMed]
  3. Huang, Y.-C.; Chang, Y.-H.; Cheng, S.-M.; Lin, S.J.-S.; Lin, C.-J.; Su, Y.-C. Applying Pulse Spectrum Analysis to Facilitate the Diagnosis of Coronary Artery Disease. Evid.-Based Complement. Altern. Med. 2019, 2019, 1–10. [Google Scholar] [CrossRef] [PubMed] [Green Version]
  4. Avolio, A.P.; Kuznetsova, T.; Heyndrickx, G.R.; Kerkhof, P.L.M.; Li, J.K.-J. Arterial Flow, Pulse Pressure and Pulse Wave Velocity in Men and Women at Various Ages. In Sex-Specific Analysis of Cardiovascular Function; Kerkhof, P.L.M., Miller, V.M., Eds.; Springer International Publishing: Cham, Switzerland, 2018; pp. 153–168. [Google Scholar] [CrossRef]
  5. Peng, B.; Luo, C.-H.; Sinha, N.; Tai, C.-C.; Xie, X.; Xie, H. Fourier Series Analysis for Novel Spatiotemporal Pulse Waves: Normal, Taut, and Slippery Pulse Images. Evid.-Based Complement. Altern. Med. 2019, 2019, 1–9. [Google Scholar] [CrossRef] [PubMed] [Green Version]
  6. Peng, B.; Luo, C.-H.; Chan, W.Y.; Shieh, M.-D.; Su, C.-J.; Tai, C.-C. Development and Testing of a Prototype for 3D Radial Pulse Image Measurement and Compatible with 1D Pulse Wave Analysis. IEEE Access 2019, 7, 182846–182859. [Google Scholar] [CrossRef]
  7. Butlin, M.; Qasem, A. Large Artery Stiffness Assessment Using SphygmoCor Technology. Pulse 2017, 4, 180–192. [Google Scholar] [CrossRef] [Green Version]
  8. Chung, Y.-F.; Hu, C.-S.; Yeh, C.-C.; Luo, C.-H. How to standardize the pulse-taking method of traditional Chinese medicine pulse diagnosis. Comput. Biol. Med. 2013, 43, 342–349. [Google Scholar] [CrossRef]
  9. Kong, K.W.; Lau, W.M.; Wong, K.S.; Chan, H.Y.; Lee, F.C.; Shen, J.; Wong, V.T.; Li, W.J. A Pulse-sensing Robotic Hand for Tactile Arterial Palpation. In Proceedings of the 2016 IEEE International Conference on Cyber Technology in Automation, Control, and Intelligent Systems (CYBER), Chengdu, China, 19–22 June 2016; IEEE: Piscataway, NJ, USA, 2016. [Google Scholar] [CrossRef]
  10. Cui, J.; Tu, L.-P.; Zhang, J.-F.; Zhang, S.-L.; Zhang, Z.-F.; Xu, J.-T. Analysis of Pulse Signals Based on Array Pulse Volume. Chin. J. Integr. Med. 2019, 25, 103–107. [Google Scholar] [CrossRef]
  11. Tiwana, M.I.; Redmond, S.; Lovell, N.H. A review of tactile sensing technologies with applications in biomedical engineering. Sensors Actuators A: Phys. 2012, 179, 17–31. [Google Scholar] [CrossRef]
  12. Saugel, B.; Kouz, K.; Scheeren, T.W.; Greiwe, G.; Hoppe, P.; Romagnoli, S.; de Backer, D. Cardiac output estimation using pulse wave analysis—physiology, algorithms, and technologies: A narrative review. Br. J. Anaesth. 2021, 126, 67–76. [Google Scholar] [CrossRef] [PubMed]
  13. Zhang, J.; Wang, R.; Lu, S.; Gong, J.; Zhao, Z.; Chen, H.; Cui, L.; Wang, N.; Yu, Y. EasiCPRS:Design and Implementation of a Portable Chinese Pulse-wave Retrieval System. In Proceedings of the 9th ACM Conference on Embedded Networked Sensor Systems, New York, NY, USA, 1–4 November 2011. [Google Scholar] [CrossRef]
  14. Hu, C.S.; Chung, Y.F.; Luo, C.H.; Yeh, C.C.; Si, X.C. Pulse Differences and 3D PulseMappingin TPNI Displacements. In Proceedings of the 2011 4th International Conference on Biomedical Engineering and Informatics, Shanghai, China, 15–17 October 2011. [Google Scholar] [CrossRef]
  15. Dragomiretskiy, K.; Zosso, D. Variational Mode Decomposition. IEEE Trans. Signal Process. 2014, 62, 531–544. [Google Scholar] [CrossRef]
  16. Vlachopoulos, C.; O’Rourke, M.; Nichols, W.W. McDonald’s Blood Flow in Arteries, 6th ed.; Hodder Arnold: London, UK, 2011. [Google Scholar]
  17. Attinger, E.O.; Anne, A.; McDonald, D.A. Use of Fourier Series for the Analysis of Biological Systems. Biophys. J. 1966, 6, 291–304. [Google Scholar] [CrossRef] [Green Version]
  18. Dick, D.E.; Kendrick, J.E.; Matson, G.L.; Rideout, V.C. Measurement of Nonlinearity in the Arterial System of the Dog by a New Method. Circ. Res. 1968, 22, 101–111. [Google Scholar] [CrossRef] [Green Version]
  19. Candès, E.J.; Li, X.; Ma, Y.; Wright, J. Robust principal component analysis? J. ACM 2011, 58, 1–37. [Google Scholar] [CrossRef]
  20. He, L.; Luo, C.-H.; Xie, X.; Peng, B. De-noising of 3D Pulse Images by Channel-Weighted Robust Principal Component Analysis. In Proceedings of the 2019 IEEE 11th International Conference on Advanced Infocomm Technology (ICAIT), Jinan, China, 18–20 October 2019; pp. 19–23. [Google Scholar] [CrossRef]
  21. Mehrizi, A.A.; Moini, M.; Afshari, E.; Kadkhodapour, J.; Sadjadian, A.; Najarian, S. Application of artificial palpation in vascular surgeries for detection of peripheral arterial stenosis. J. Med Eng. Technol. 2014, 38, 169–178. [Google Scholar] [CrossRef]
  22. Messas, E.; Pernot, M.; Couade, M. Arterial wall elasticity: State of the art and future prospects. Diagn. Interv. Imaging 2013, 94, 561–569. [Google Scholar] [CrossRef] [PubMed] [Green Version]
  23. Hao, Z.; Wang, D. Arterial Pulse Signal Amplification by Adding a Uniform PDMS Layer to a Pyrex-Based Microfluidic Tactile Sensor. IEEE Sensors J. 2020, 20, 2164–2172. [Google Scholar] [CrossRef]
  24. Duarte, R.; Stainthorpe, A.; Greenhalgh, J.; Richardson, M.; Nevitt, S.; Mahon, J.; Kotas, E.; Boland, A.; Thom, H.; Marshall, T.; et al. Lead-I ECG for Detecting Atrial Fibrillation in Patients with An Irregular Pulse using Single Time Point Testing: A Systematic Review and Economic Evaluation; Health Technology Assessment: Winchester, UK, 2020; Volume 24. [Google Scholar] [CrossRef]
  25. Kimura, K.; Watanabe, Y.; Umeda, M.; Arima, Y.; Watsuji, T.; Shinohara, S. Quantitative analysis of the relation between soft tissue stiffness palpated from the body surface and tissue hemodynamics in the human forearm. Physiol. Meas. 2007, 28, 1495–1505. [Google Scholar] [CrossRef] [PubMed]
  26. Bruyninckx, R.; Aertgeerts, B.; Bruyninckx, P.; Buntinx, F. Signs and symptoms in diagnosing acute myocardial infarction and acute coronary syndrome: A diagnostic meta-analysis. Br. J. Gen. Pr. 2008, 58, e1–e8. [Google Scholar] [CrossRef] [PubMed] [Green Version]
  27. Su, C.J.; Huang, T.-Y.; Luo, C.-H. Arterial Pulse Analysis of Multiple Dimension Pulse Mapping by Local Cold Stimulation for Arterial Stiffness. IEEE Sensors J. 2016, 16, 8288–8294. [Google Scholar] [CrossRef]
  28. Berg, A.C.; Malik, J. (Eds.) Shape Matching and Object Recognition. Workshop on toward Category-Level Object Recognition; Springer: Taormina, Italy, 2006. [Google Scholar] [CrossRef]
  29. Shi, J.; Yang, W.; Yong, L.; Zheng, X. Low-Rank Representation for Incomplete Data. Math. Probl. Eng. 2014, 2014, 1–10. [Google Scholar] [CrossRef]
  30. Cao, L.; Li, H.; Guo, H.; Wang, B. Robust PCA for Face Recognition with Occlusion Using Symmetry Information. In Proceedings of the 2019 IEEE 16th International Conference on Networking, Sensing and Control (ICNSC), Banff, AB, Canada, 9–11 May 2019; pp. 232–328. [Google Scholar] [CrossRef]
  31. Wang, R.; Wang, Y.; Ma, Y. Application of Data Denoising and Classification Algorithm Based on RPCA and Multigroup Random Walk Random Forest in Engineering. Math. Probl. Eng. 2019, 2019, 1–15. [Google Scholar] [CrossRef]
  32. Fang, H.; Chen, M.; Liu, X.; Yao, S. Infrared Small Target Detection with Total Variation and Reweighted ℓ1 Regularization. Math. Probl. Eng. 2020, 2020, 1–19. [Google Scholar] [CrossRef] [Green Version]
  33. Yue, H.; Li, X.; Wang, H.; Chen, H.; Wang, X.; Cai, K. A New Approach for Noncontact Imaging Photoplethysmography Using Chrominance Features and Low-Rank in the IoT Operating Room. IEEE Access 2019, 7, 112284–112294. [Google Scholar] [CrossRef]
  34. Dao, M.; Suo, Y.; Chin, S.; Tran, T. (Eds.) Video Frame Interpolation via Weighted Robust Principal Component Analysis. In Proceedings of the 2013 IEEE International Conference On Acoustics, Speech And Signal Processing (ICASSP), Vancouver, BC, Canada, 26–31 May 2013; IEEE: Piscataway, NJ, USA, 2013. [Google Scholar] [CrossRef]
  35. Gu, S.; Xie, Q.; Meng, D.; Zuo, W.; Feng, X.; Zhang, L. Weighted Nuclear Norm Minimization and Its Applications to Low Level Vision. Int. J. Comput. Vis. 2016, 121, 183–208. [Google Scholar] [CrossRef]
  36. Li, F.; Akagi, M. Weighted Robust Principal Component Analysis with Gammatone Auditory Filterbank for Singing Voice Separation. In Neural Information Processing; Lecture Notes in Computer Science 2017; Springer: Berlin/Heidelberg, Germany, 2017; pp. 849–858. [Google Scholar] [CrossRef]
  37. Liu, J.; Pahlevan, N.M. The underlying mechanism of intersite discrepancies in ejection time measurements from arterial waveforms and its validation in the Framingham Heart Study. Am. J. Physiol. Circ. Physiol. 2021, 321, H135–H148. [Google Scholar] [CrossRef]
  38. Kaya, M.; Balasubramanian, V.; Ge, Y.; Li, J.K.-J. Energetically wasteful wave reflections due to impedance mismatching in hypertension and their reversal with vasodilator: Time and frequency domain evaluations. Comput. Biol. Med. 2019, 104, 117–126. [Google Scholar] [CrossRef]
  39. Zhang, Z.; Peng, B.; Luo, C.-H.; Tai, C.-C. ANFIS-GA system for three-dimensional pulse image of normal and string-like pulse in Chinese medicine using an improved contour analysis method. Eur. J. Integr. Med. 2021, 42, 101301. [Google Scholar] [CrossRef]
  40. Li, D.; Yan, E. An Improved GPR Method Based on BP and RPCA for Tunnel Lining Defects Detection and Its Application in Qiyue Mountain Tunnel, China. Appl. Sci. 2021, 11, 10234. [Google Scholar] [CrossRef]
Figure 1. A three-dimensional pulse image (3DPI) at peak amplitude. Upper left: stereoscopic 3DPI; upper right: planar 3DPI; lower: data acquisition by a PPS tactile sensor.
Applsci 12 02931 g001
Figure 2. Flowchart of overall multi-channel pulse signal processing system.
Applsci 12 02931 g002
Figure 3. Illustration of proposed cross-channel dynamic weighting RPCA algorithm.
Applsci 12 02931 g003
Figure 4. Four key physiological points of the radial pulse wave in a complete heartbeat cycle: (a) onset: aortic valve open; (b) P1: ventricular contraction; (c) P2: reflected wave; (d) P3: aortic valve closure; (e) P4: diastolic wave. t represents time, and h represents the amplitude of each key physiological point.
Applsci 12 02931 g004
Figure 5. Original signals of 25 channels. Each subplot represents aligned and scaled cycles of each channel. Channel 11 shown in red has the maximum energy.
Applsci 12 02931 g005
Figure 6. Overview of our CSF estimation module and the calculated weighting factors of each reordered channel in iterations 1–1000. (a) Model architecture; (b) the calculated weighting factors for 25 channels.
Applsci 12 02931 g006
Figure 7. Original and extracted signals from five de-noising algorithms in sorted channel no. 1. (a) Original signal; (b) wavelet transform; (c) variational mode decomposition (VMD); (d) robust principal component analysis (RPCA); (e) weighted robust principal component analysis (WRPCA); (f) cross-channel DWRPCA (proposed method).
Applsci 12 02931 g007aApplsci 12 02931 g007b
Figure 8. Original and extracted signals from five de-noising algorithms in channel no. 5 (medium energy). (a) Original signal; (b) wavelet transform; (c) VMD; (d) RPCA; (e) WRPCA; (f) cross-channel DWRPCA (proposed method).
Applsci 12 02931 g008
Figure 9. Original and extracted signals from five de-noising algorithms in channel no. 17 (low energy). (a) Original signal; (b) wavelet transform; (c) VMD; (d) RPCA; (e) WRPCA; (f) cross-channel DWRPCA (proposed method).
Applsci 12 02931 g009
Figure 10. Original and extracted signals from five de-noising algorithms in channel no. 25 (minimum energy). (a) Original signal; (b) wavelet transform; (c) VMD; (d) RPCA; (e) WRPCA; (f) cross-channel DWRPCA (proposed method).
Applsci 12 02931 g010aApplsci 12 02931 g010b
Figure 11. Reference noise and noises extracted by five de-noising algorithms. (a) Reference noise; (b) wavelet transform; (c) VMD; (d) RPCA; (e) WRPCA; (f) cross-channel DWRPCA (proposed method).
Applsci 12 02931 g011
Figure 12. Power spectral density of reference noise and extracted noise. (a) Reference noise; (b) wavelet transform; (c) VMD; (d) RPCA; (e) WRPCA; (f) cross-channel DWRPCA (proposed method). The y-axis is in a log scale.
Applsci 12 02931 g012aApplsci 12 02931 g012b
Figure 13. Boxplot of time complexity comparison for five algorithms. The y-axis is in a log scale.
Applsci 12 02931 g013
Table 1. Errors of key physiological points of data after five de-noising methods.
Method WaveletVMDRPCAWRPCAProposed Method
TAE (s)t14.267 ± 1.9643.000 ± 1.8640.784 ± 0.8540.784 ± 0.8540.784 ± 0.854
t211.375 ± 4.49814.286 ± 3.9542.757 ± 2.9102.730 ± 2.9412.730 ± 2.891
ARE (%)h18.330 ± 6.1401.770 ± 0.8801.090 ± 0.5000.470 ± 0.4100.366 ± 0.286
h216.760 ± 9.21012.740 ± 6.8102.760 ± 2.7102.280 ± 2.7402.348 ± 2.704
AIx0.113 ± 0.0560.1340 ± 0.0730.020 ± 0.0250.022 ± 0.0270.022 ± 0.026
Table 2. p-Values of TAEs and AREs of key physiological points from the paired t-test.
p-ValueWaveletVMDRPCAWRPCAOur Proposed
TAE (s)t1Wavelet
VMD0.0295 *
RPCA0.0000 *0.0000 *
WRPCA0.0000 *0.0000 *1.0000
Proposed method0.0000 *0.0000 *1.00001.0000
t2Wavelet
VMD0.0487 *
RPCA0.0000 *0.0000 *
WRPCA0.0000 *0.0000 *0.9684
Proposed method0.0000 *0.0000 *0.96841.0000
ARE (%)h1Wavelet
VMD0.0000 *
RPCA0.0000 *0.0000 *
WRPCA0.0000 *0.0000 *0.0000 *
Proposed method0.0000 *0.0000 *0.0000 *0.2086
h2Wavelet
VMD0.0954
RPCA0.0000 *0.0000 *
WRPCA0.0000 *0.0000 *0.4464
Proposed method0.0000 *0.0000 *0.51550.9114
AIxWavelet
VMD0.2420
RPCA0.0000 *0.0000 *
WRPCA0.0000 *0.0000 *0.7563
Proposed method0.0000 *0.0000 *0.80650.9462
* p < 0.05, significant difference.
Publisher’s Note: MDPI stays neutral with regard to jurisdictional claims in published maps and institutional affiliations.

