
Optimizing the Minimum Detectable Difference of Gamma Camera SPECT Images via the Taguchi Analysis: A Feasibility Study with a V-Shaped Slit Gauge


Abstract
:1. Introduction
2. Materials and Methods
2.1. Taguchi Methodology
2.2. The Orthogonal Arrays
2.3. The Analysis of Variance: ANOVA
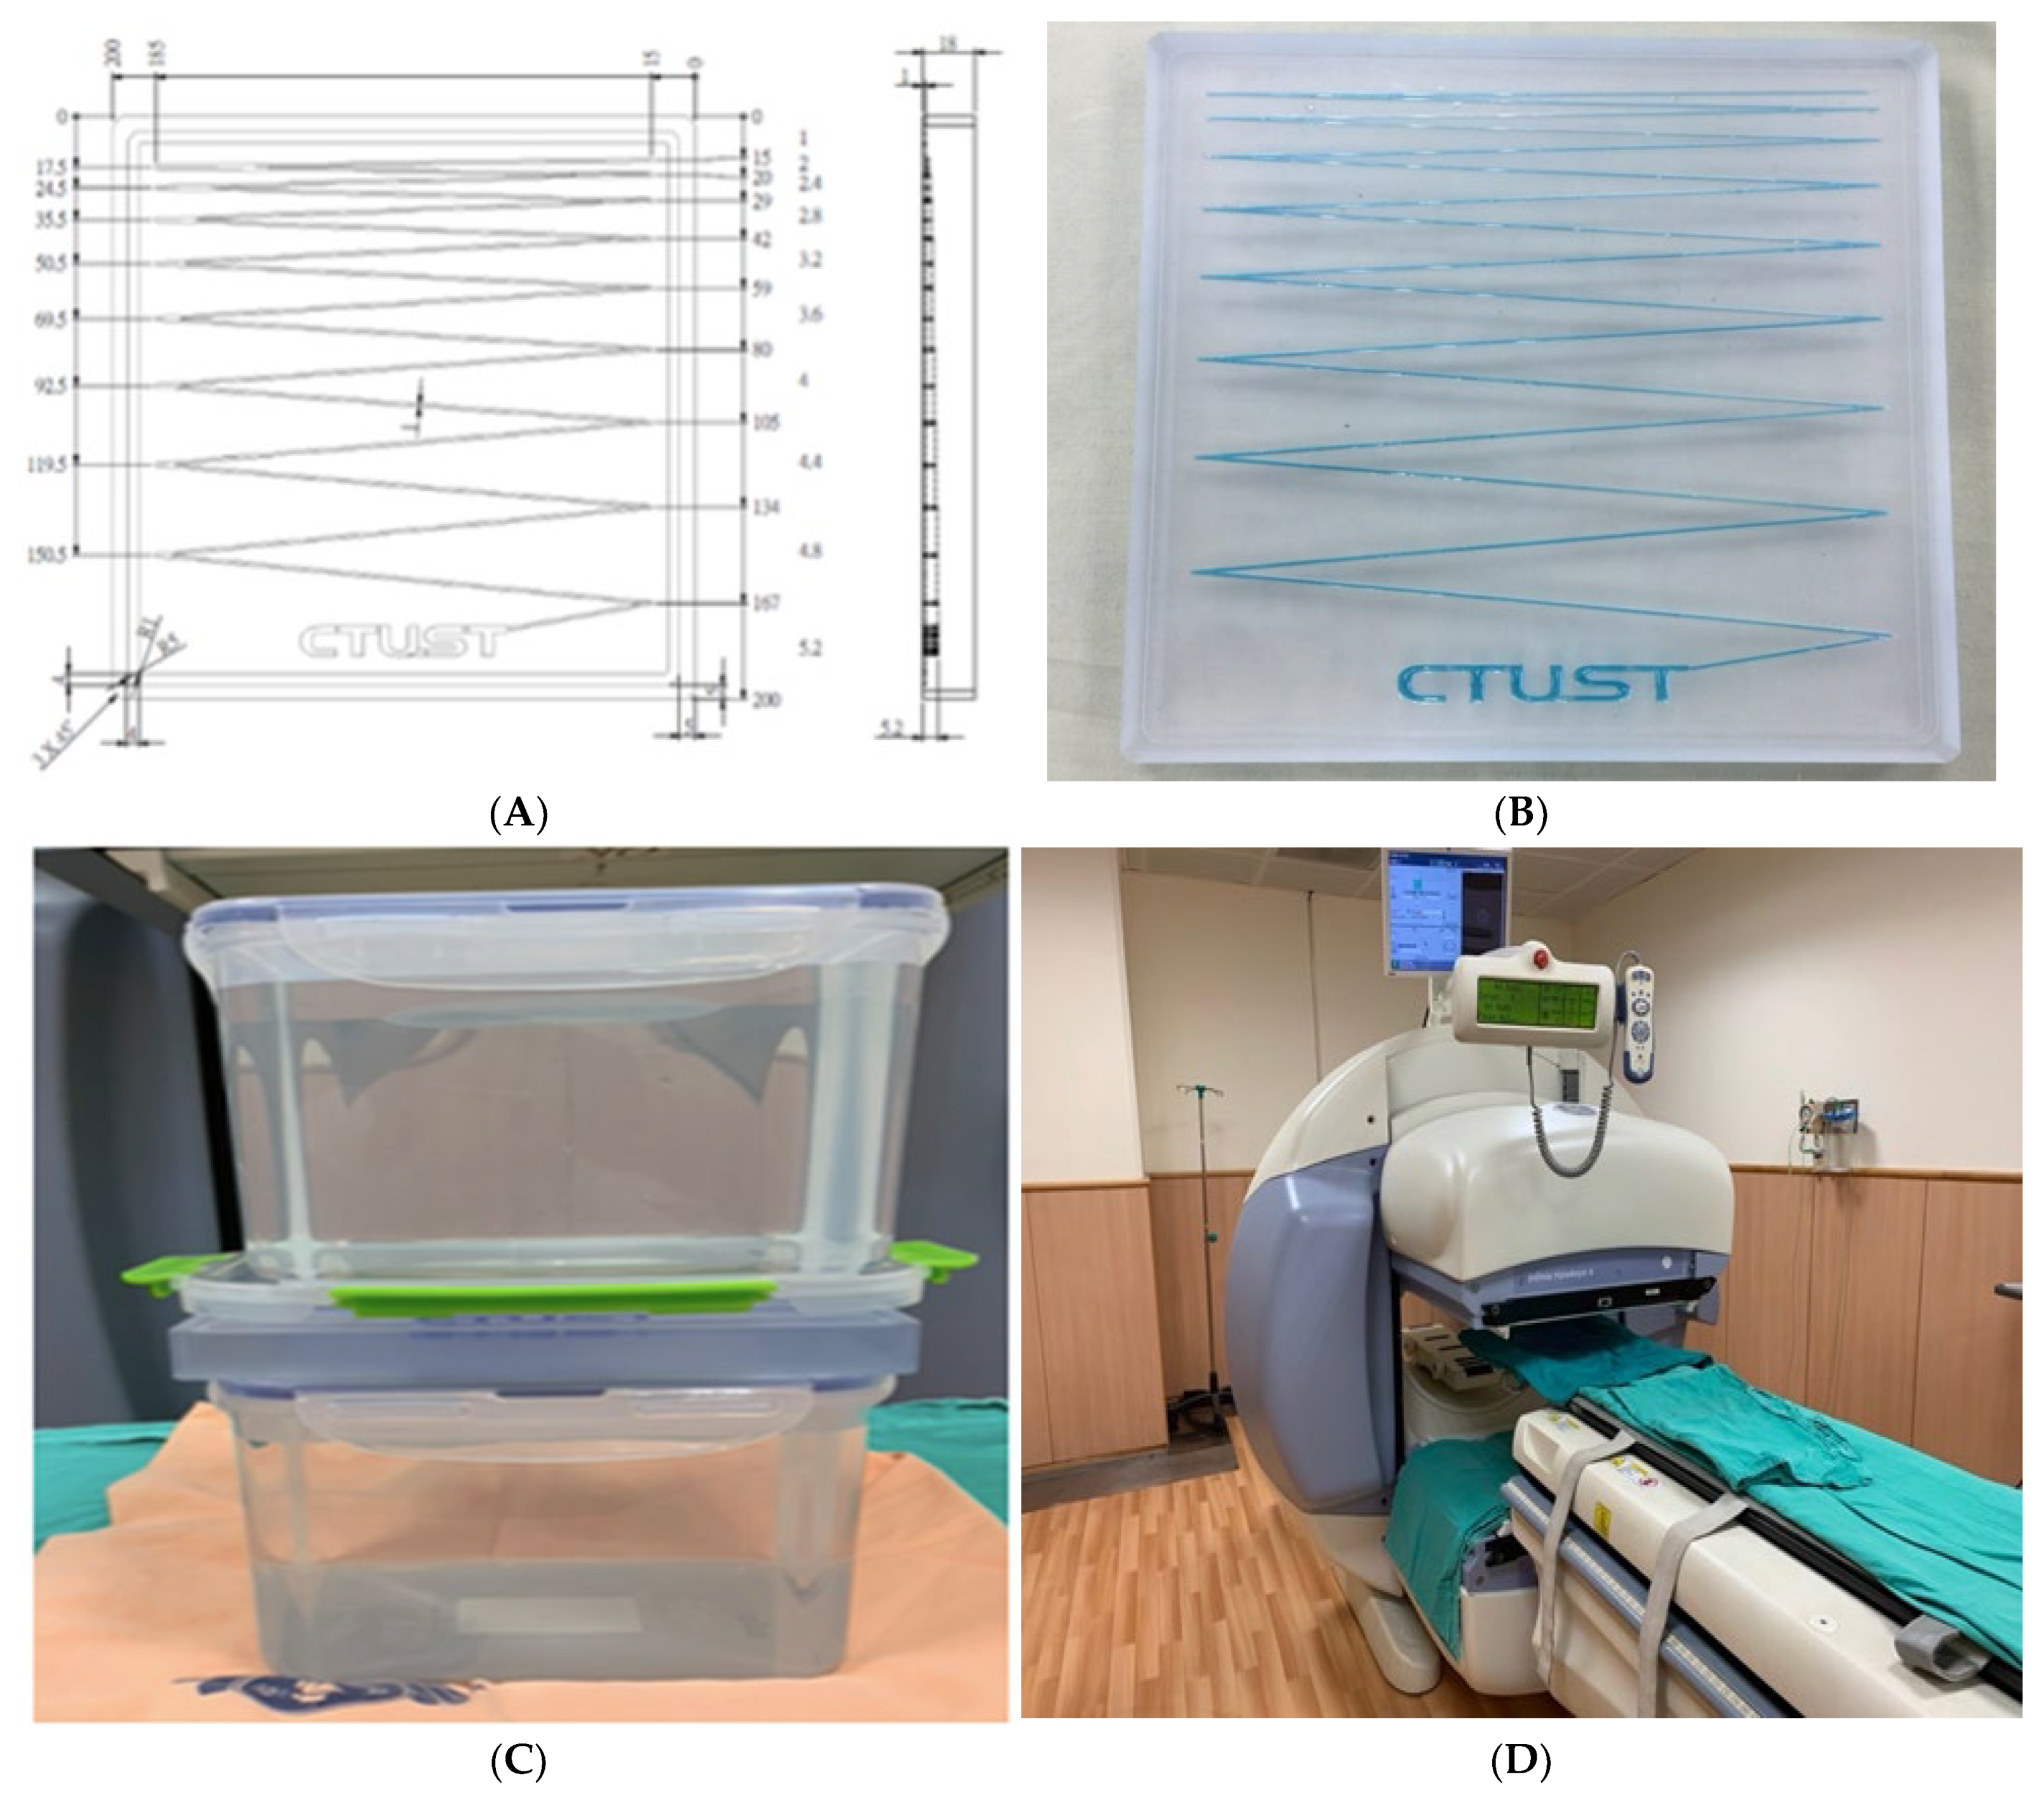
2.4. V-Shaped Slit Gauge and Gamma Camera
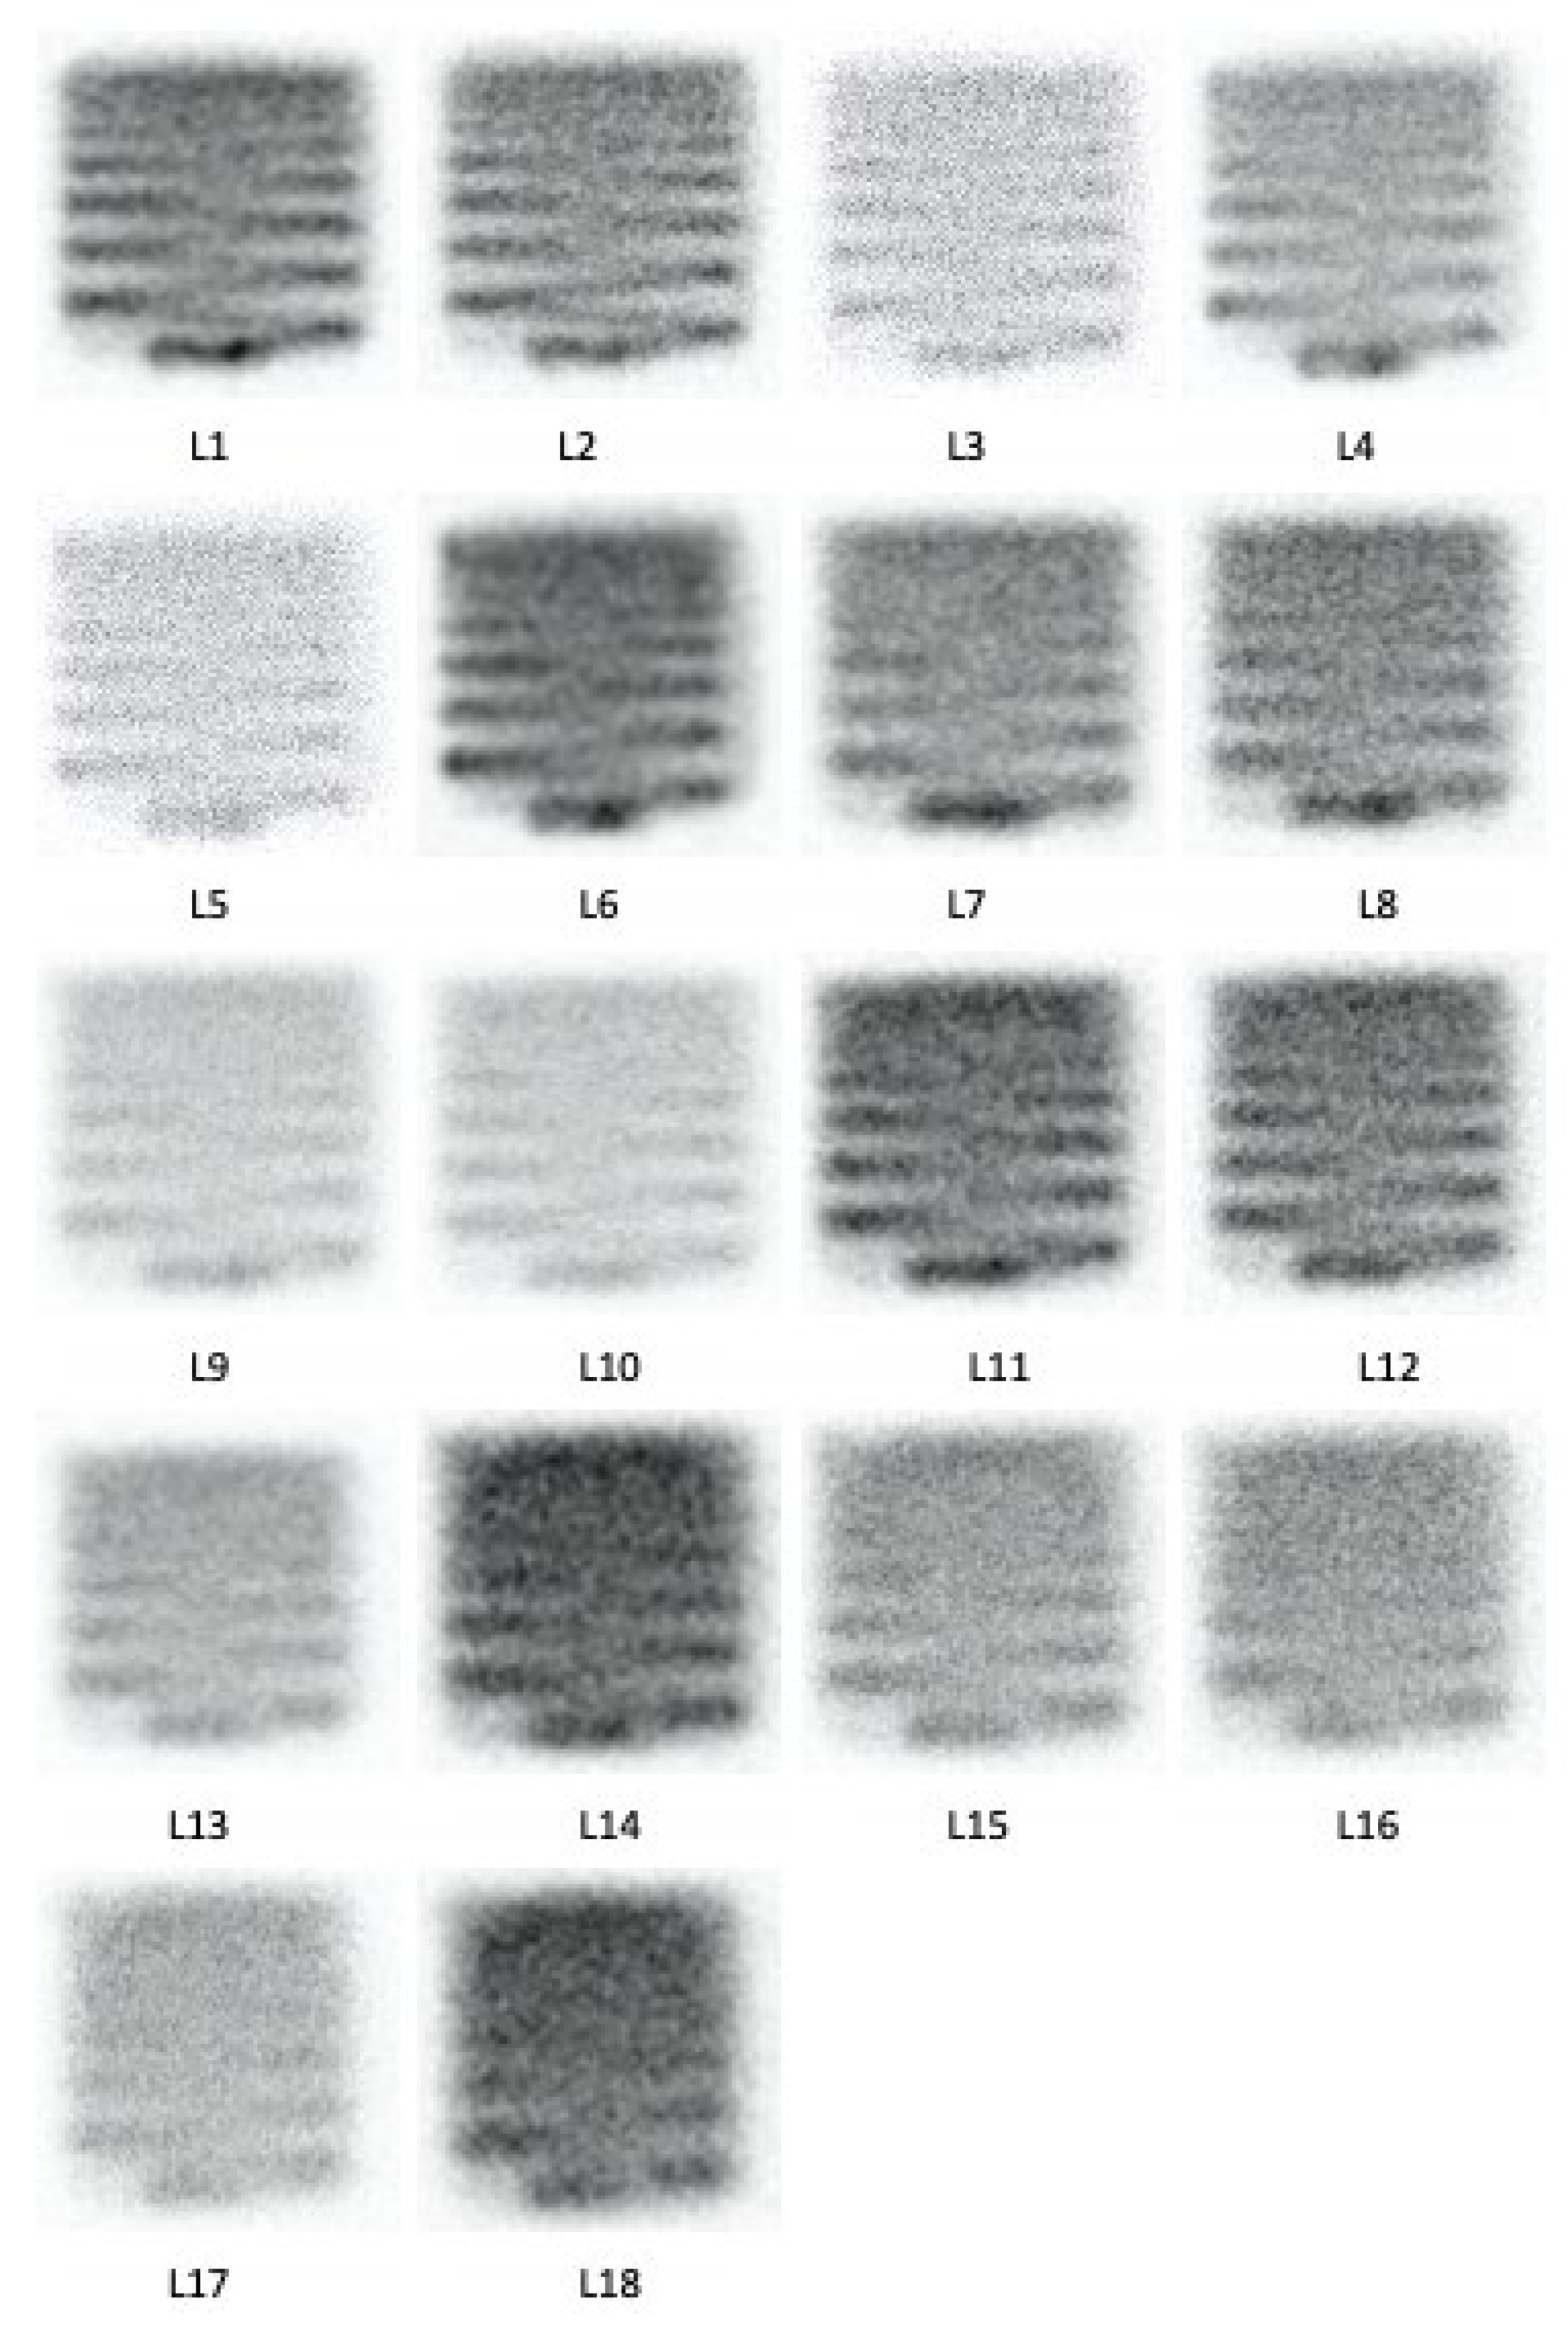
2.5. To Rank the V-Shaped Slit Gauge
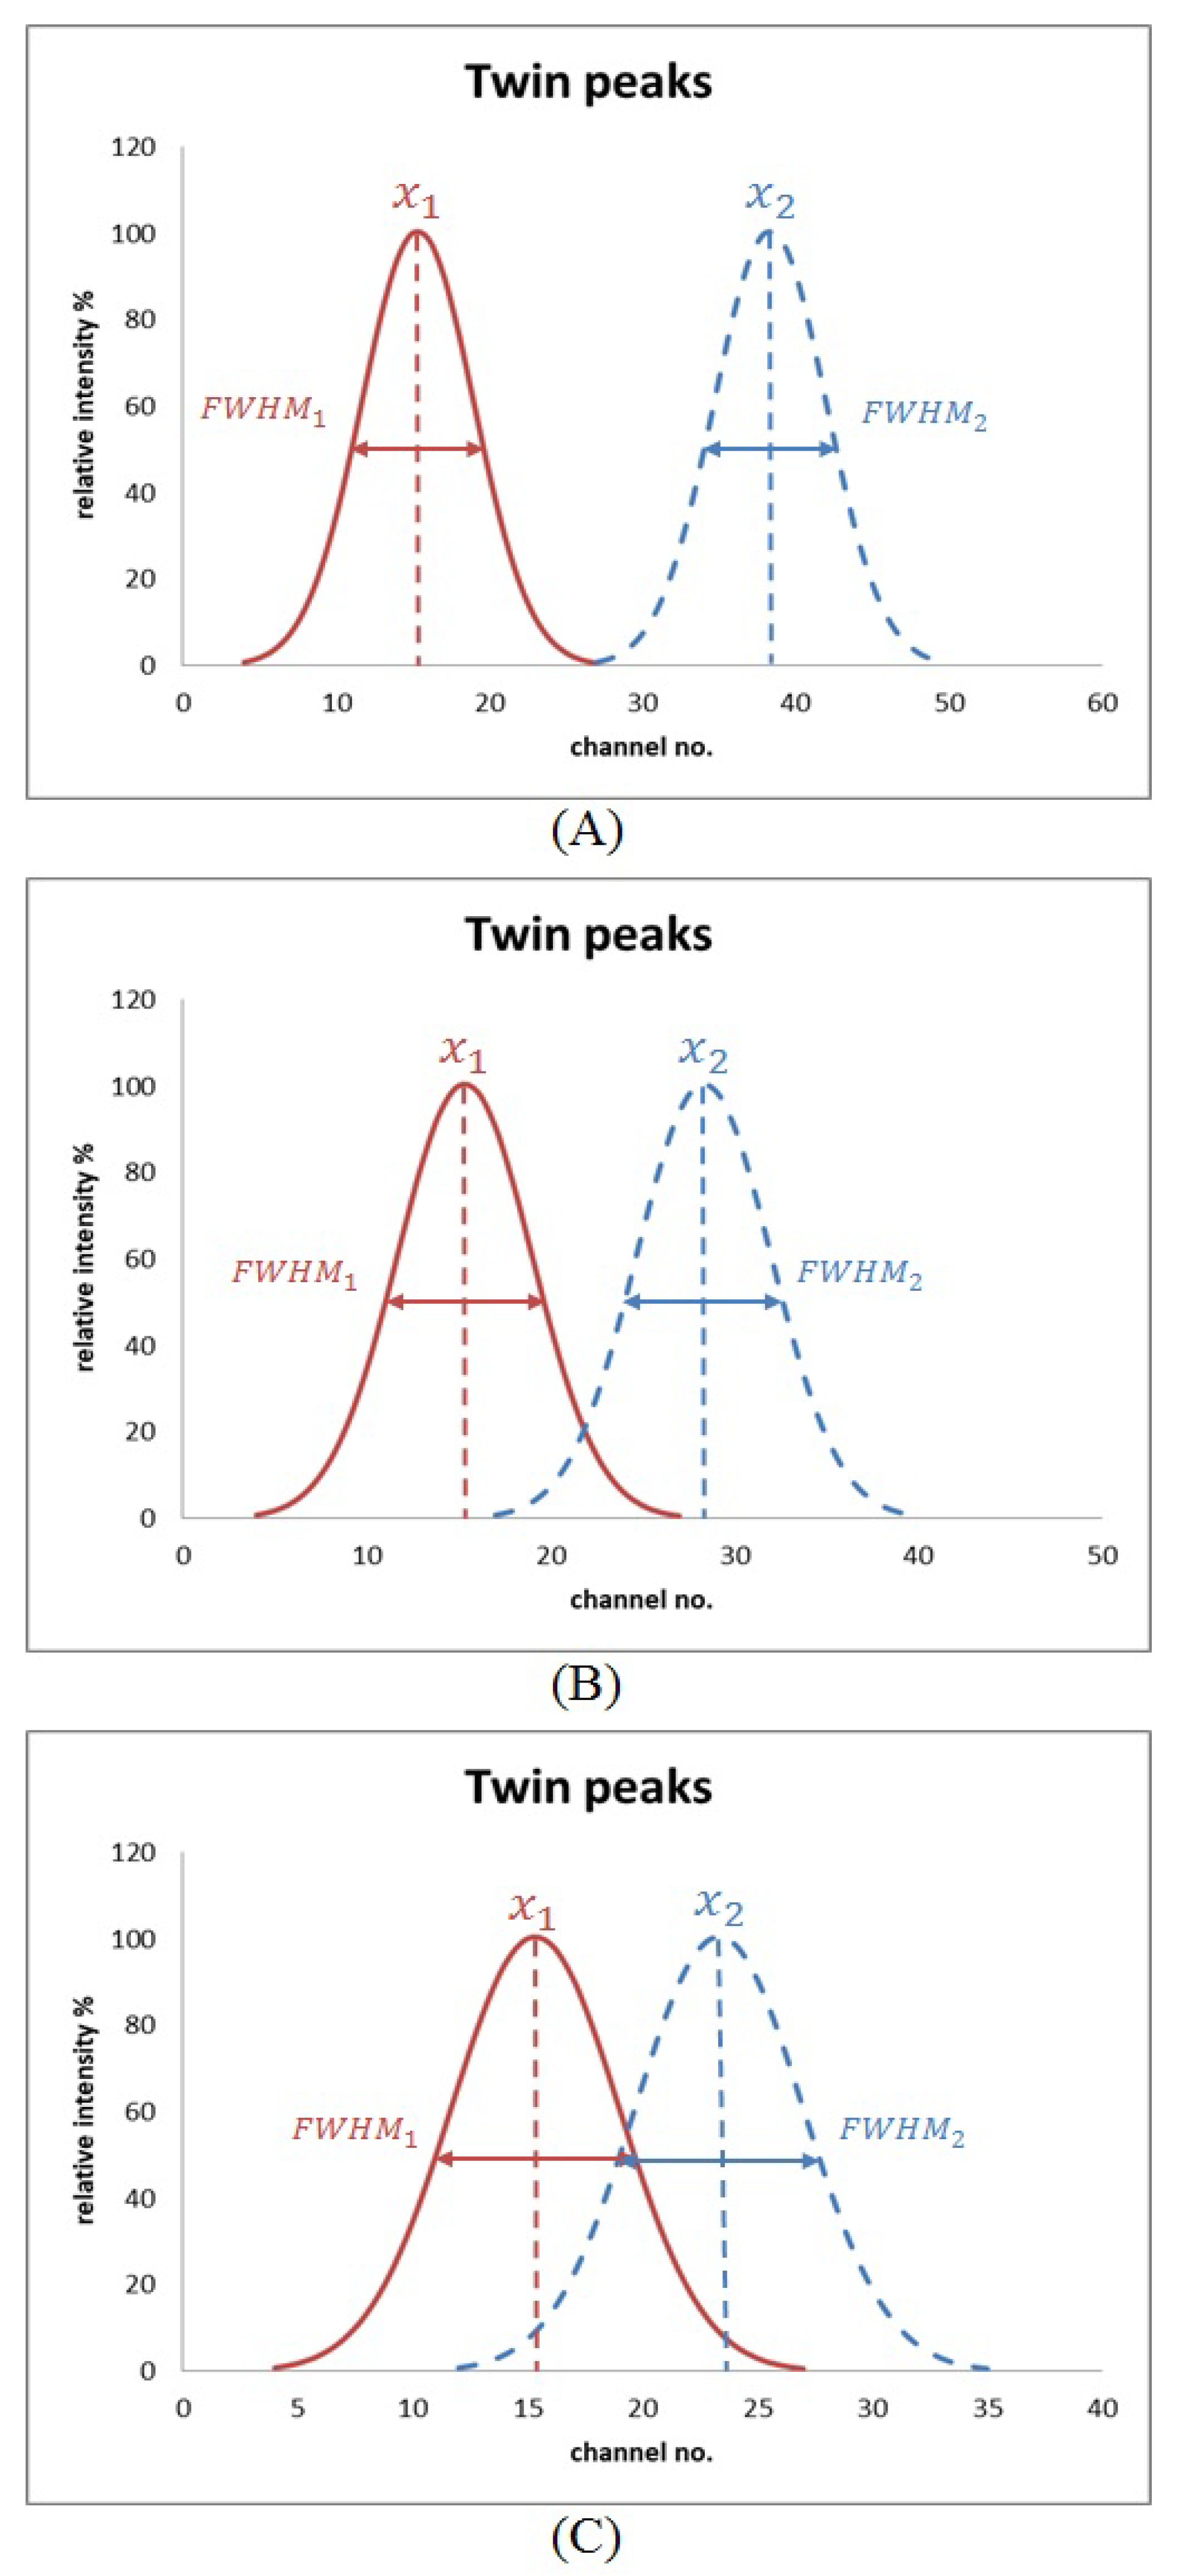
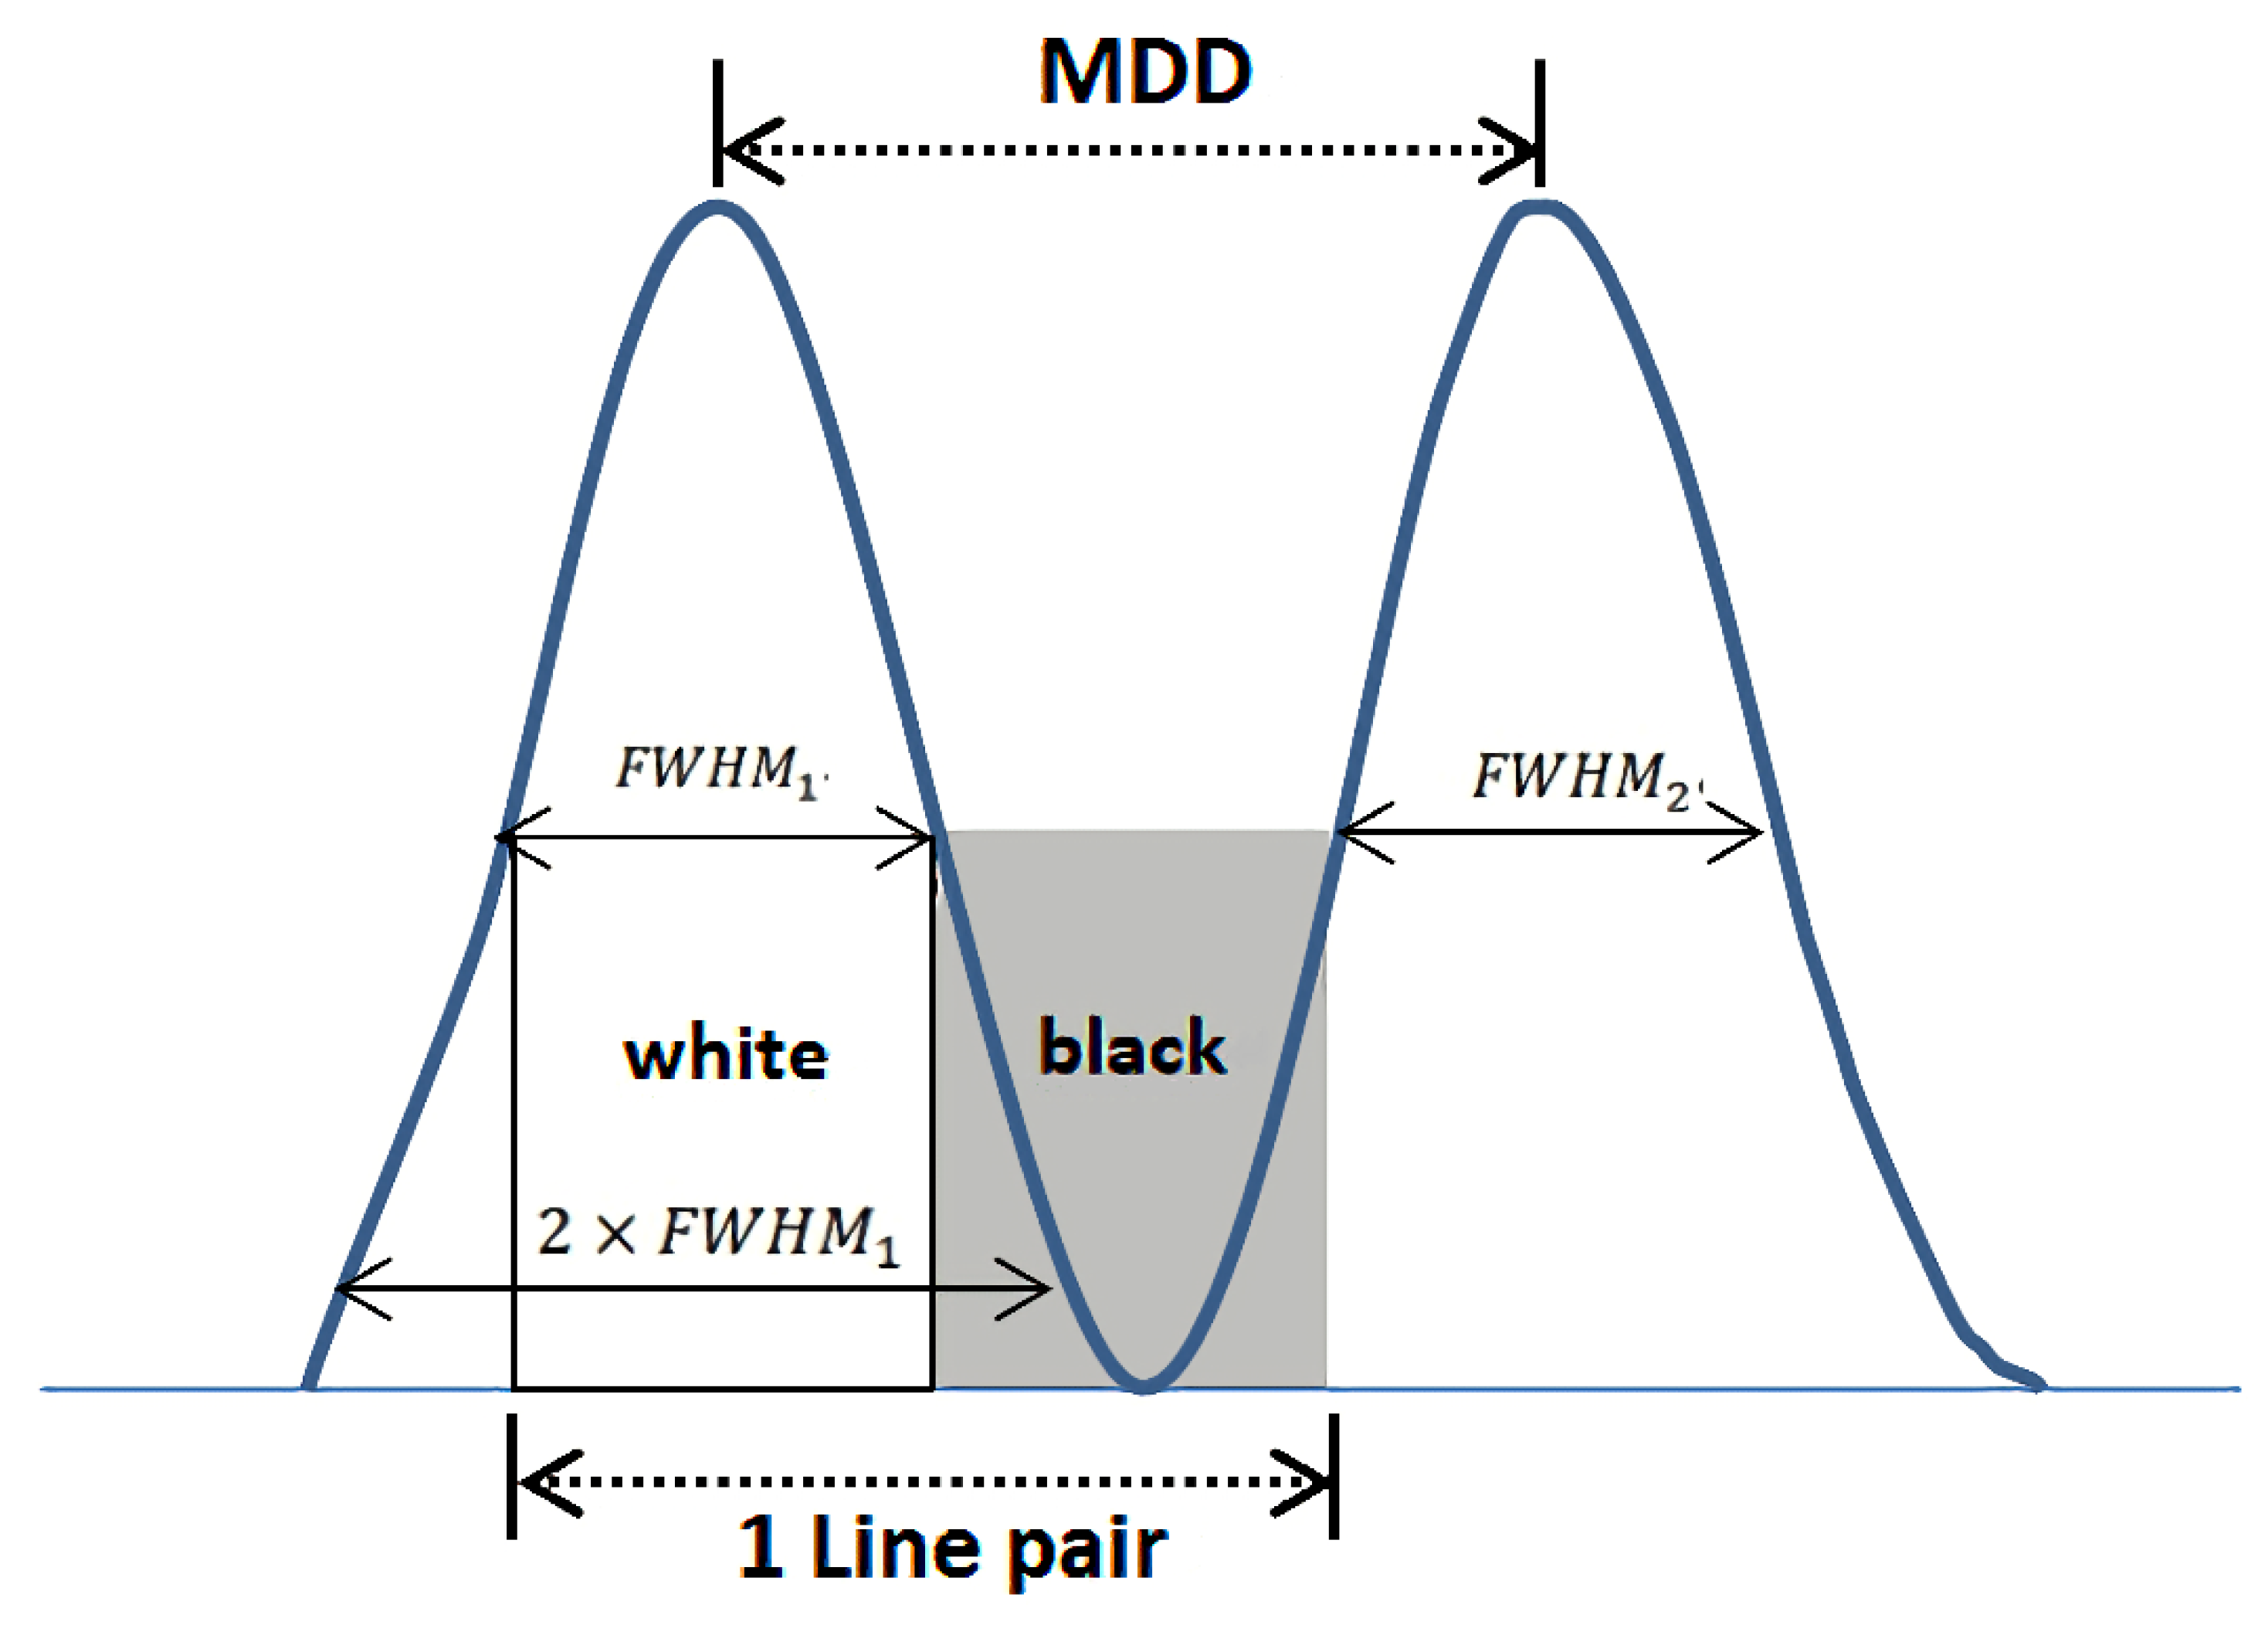
2.6. Minimum Detectable Difference and Student’s t-Test Analysis
3. Results
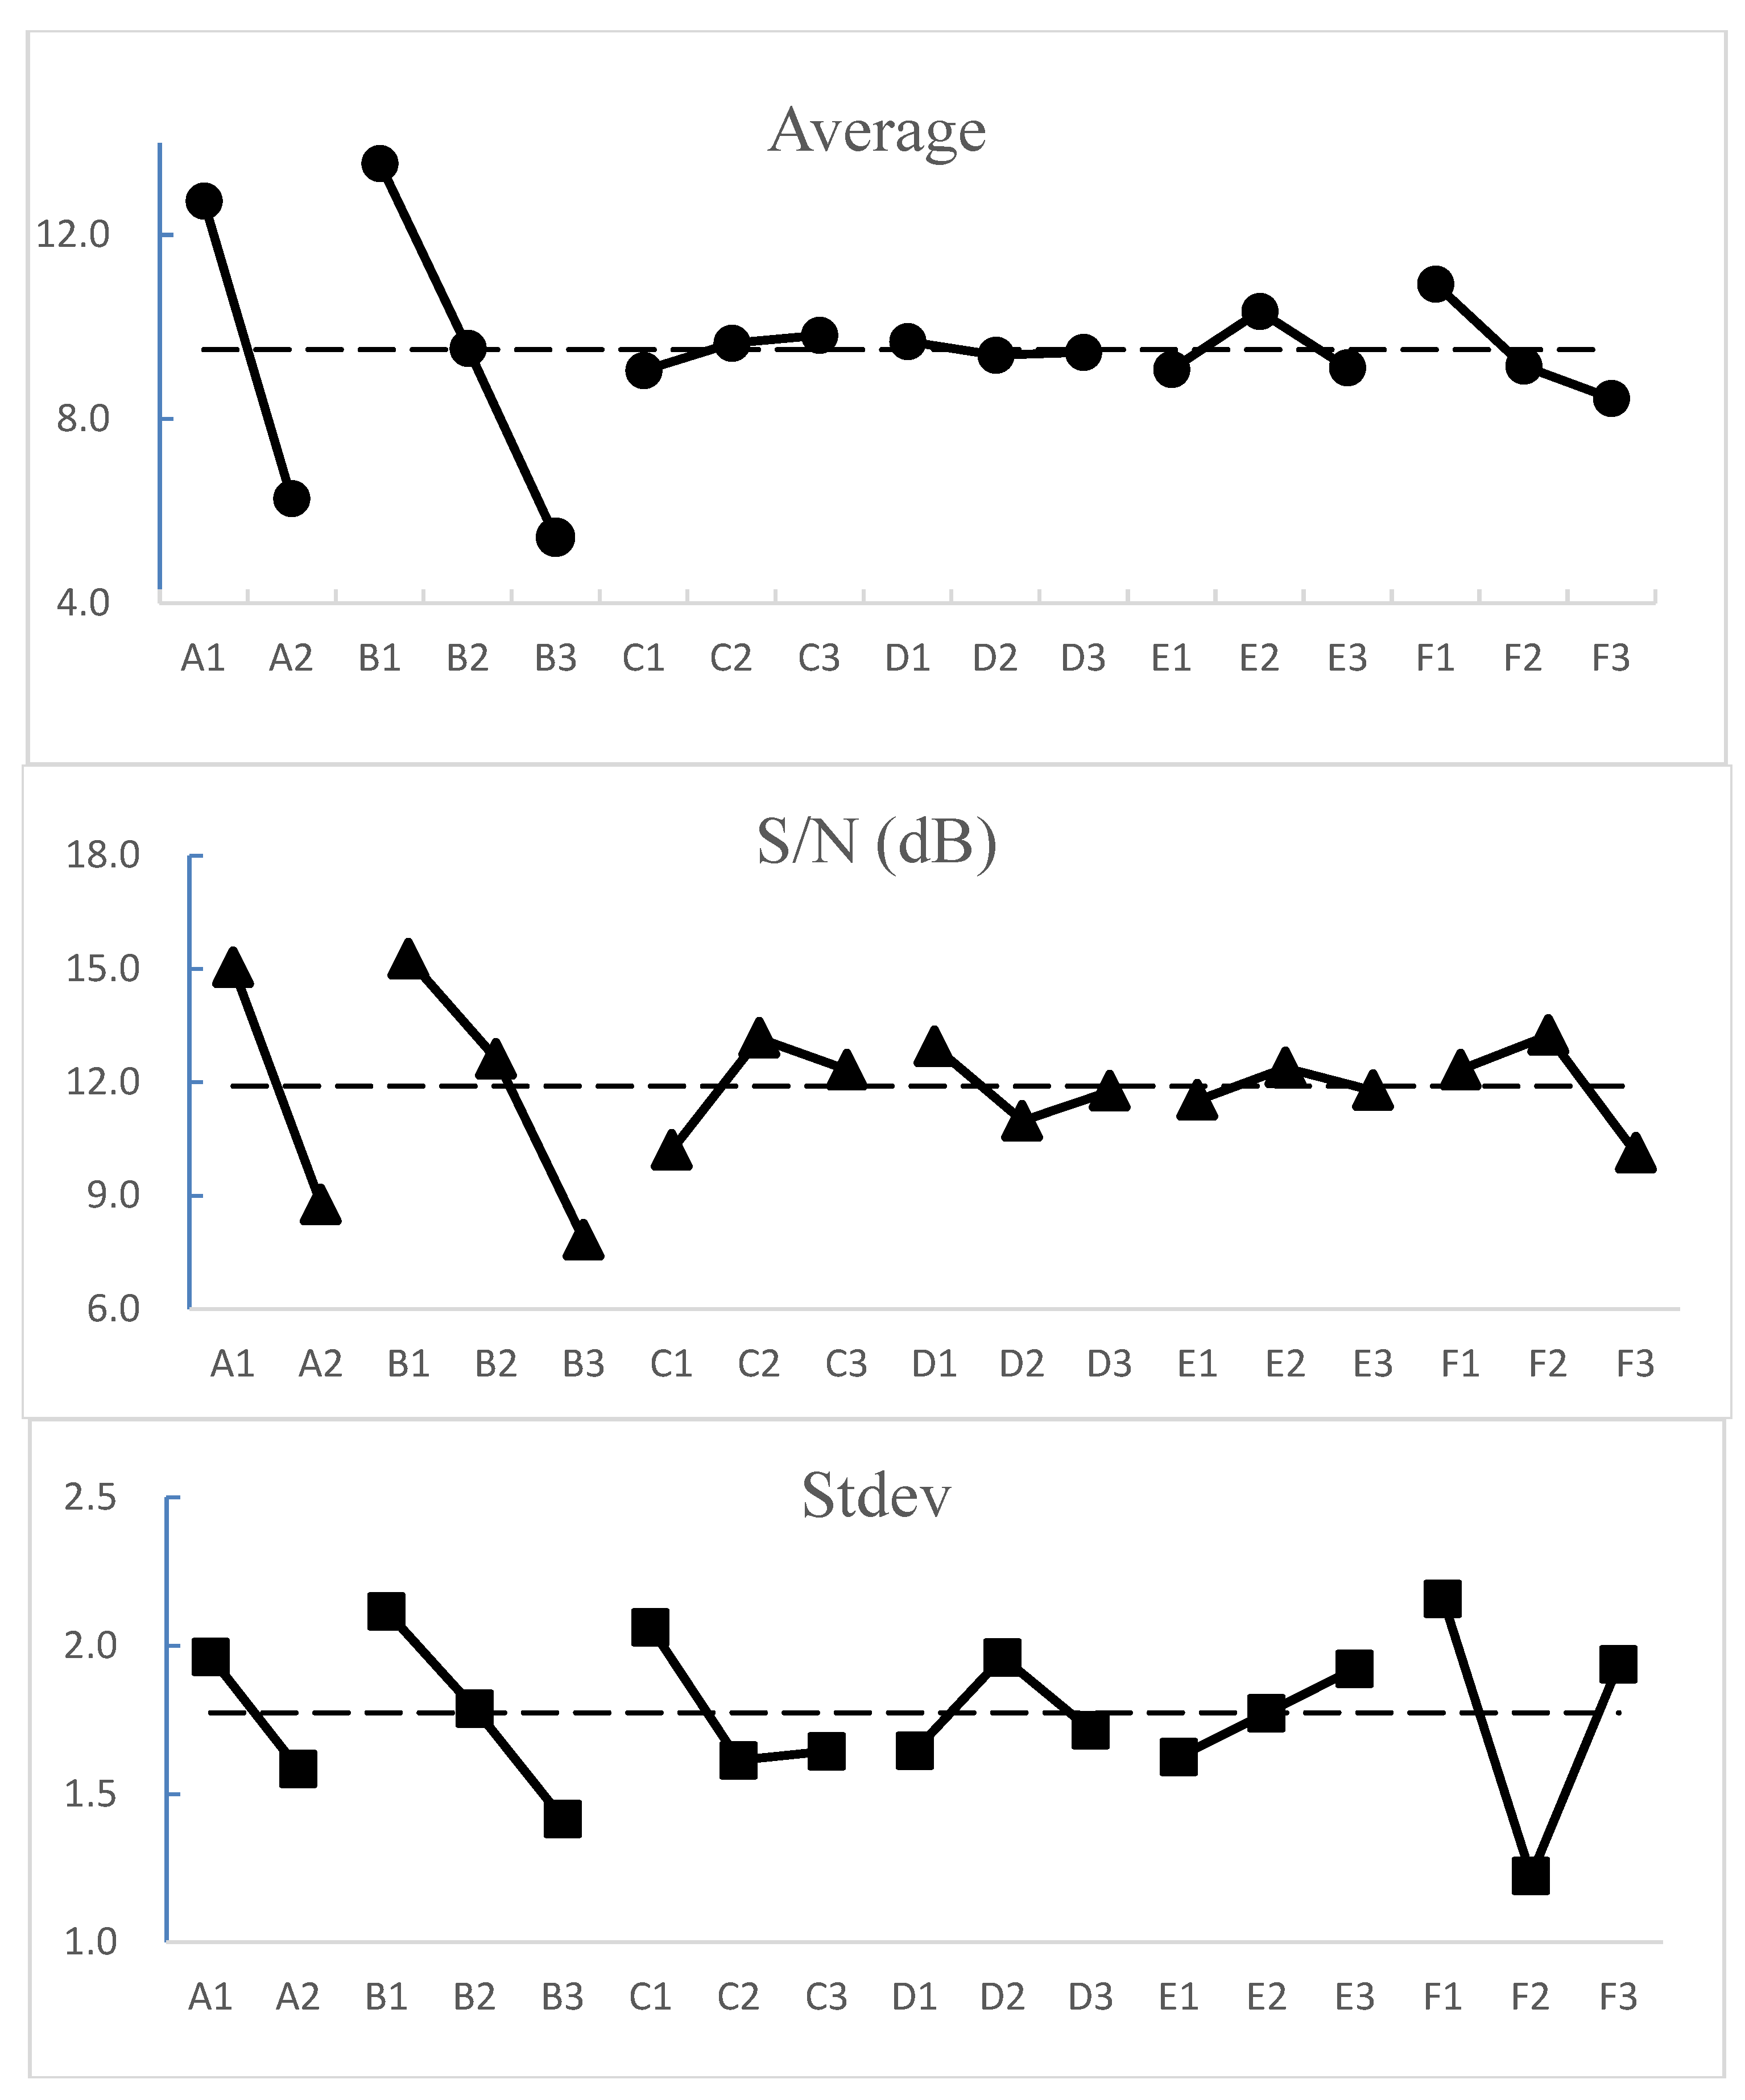
3.1. Data Analysis
3.2. ANOVA, Analysis of Variance
4. Discussion
4.1. Verifying the Taguchi Recommendation by Quantified MDD
4.2. Quantified MDD Superior to Line/Pair
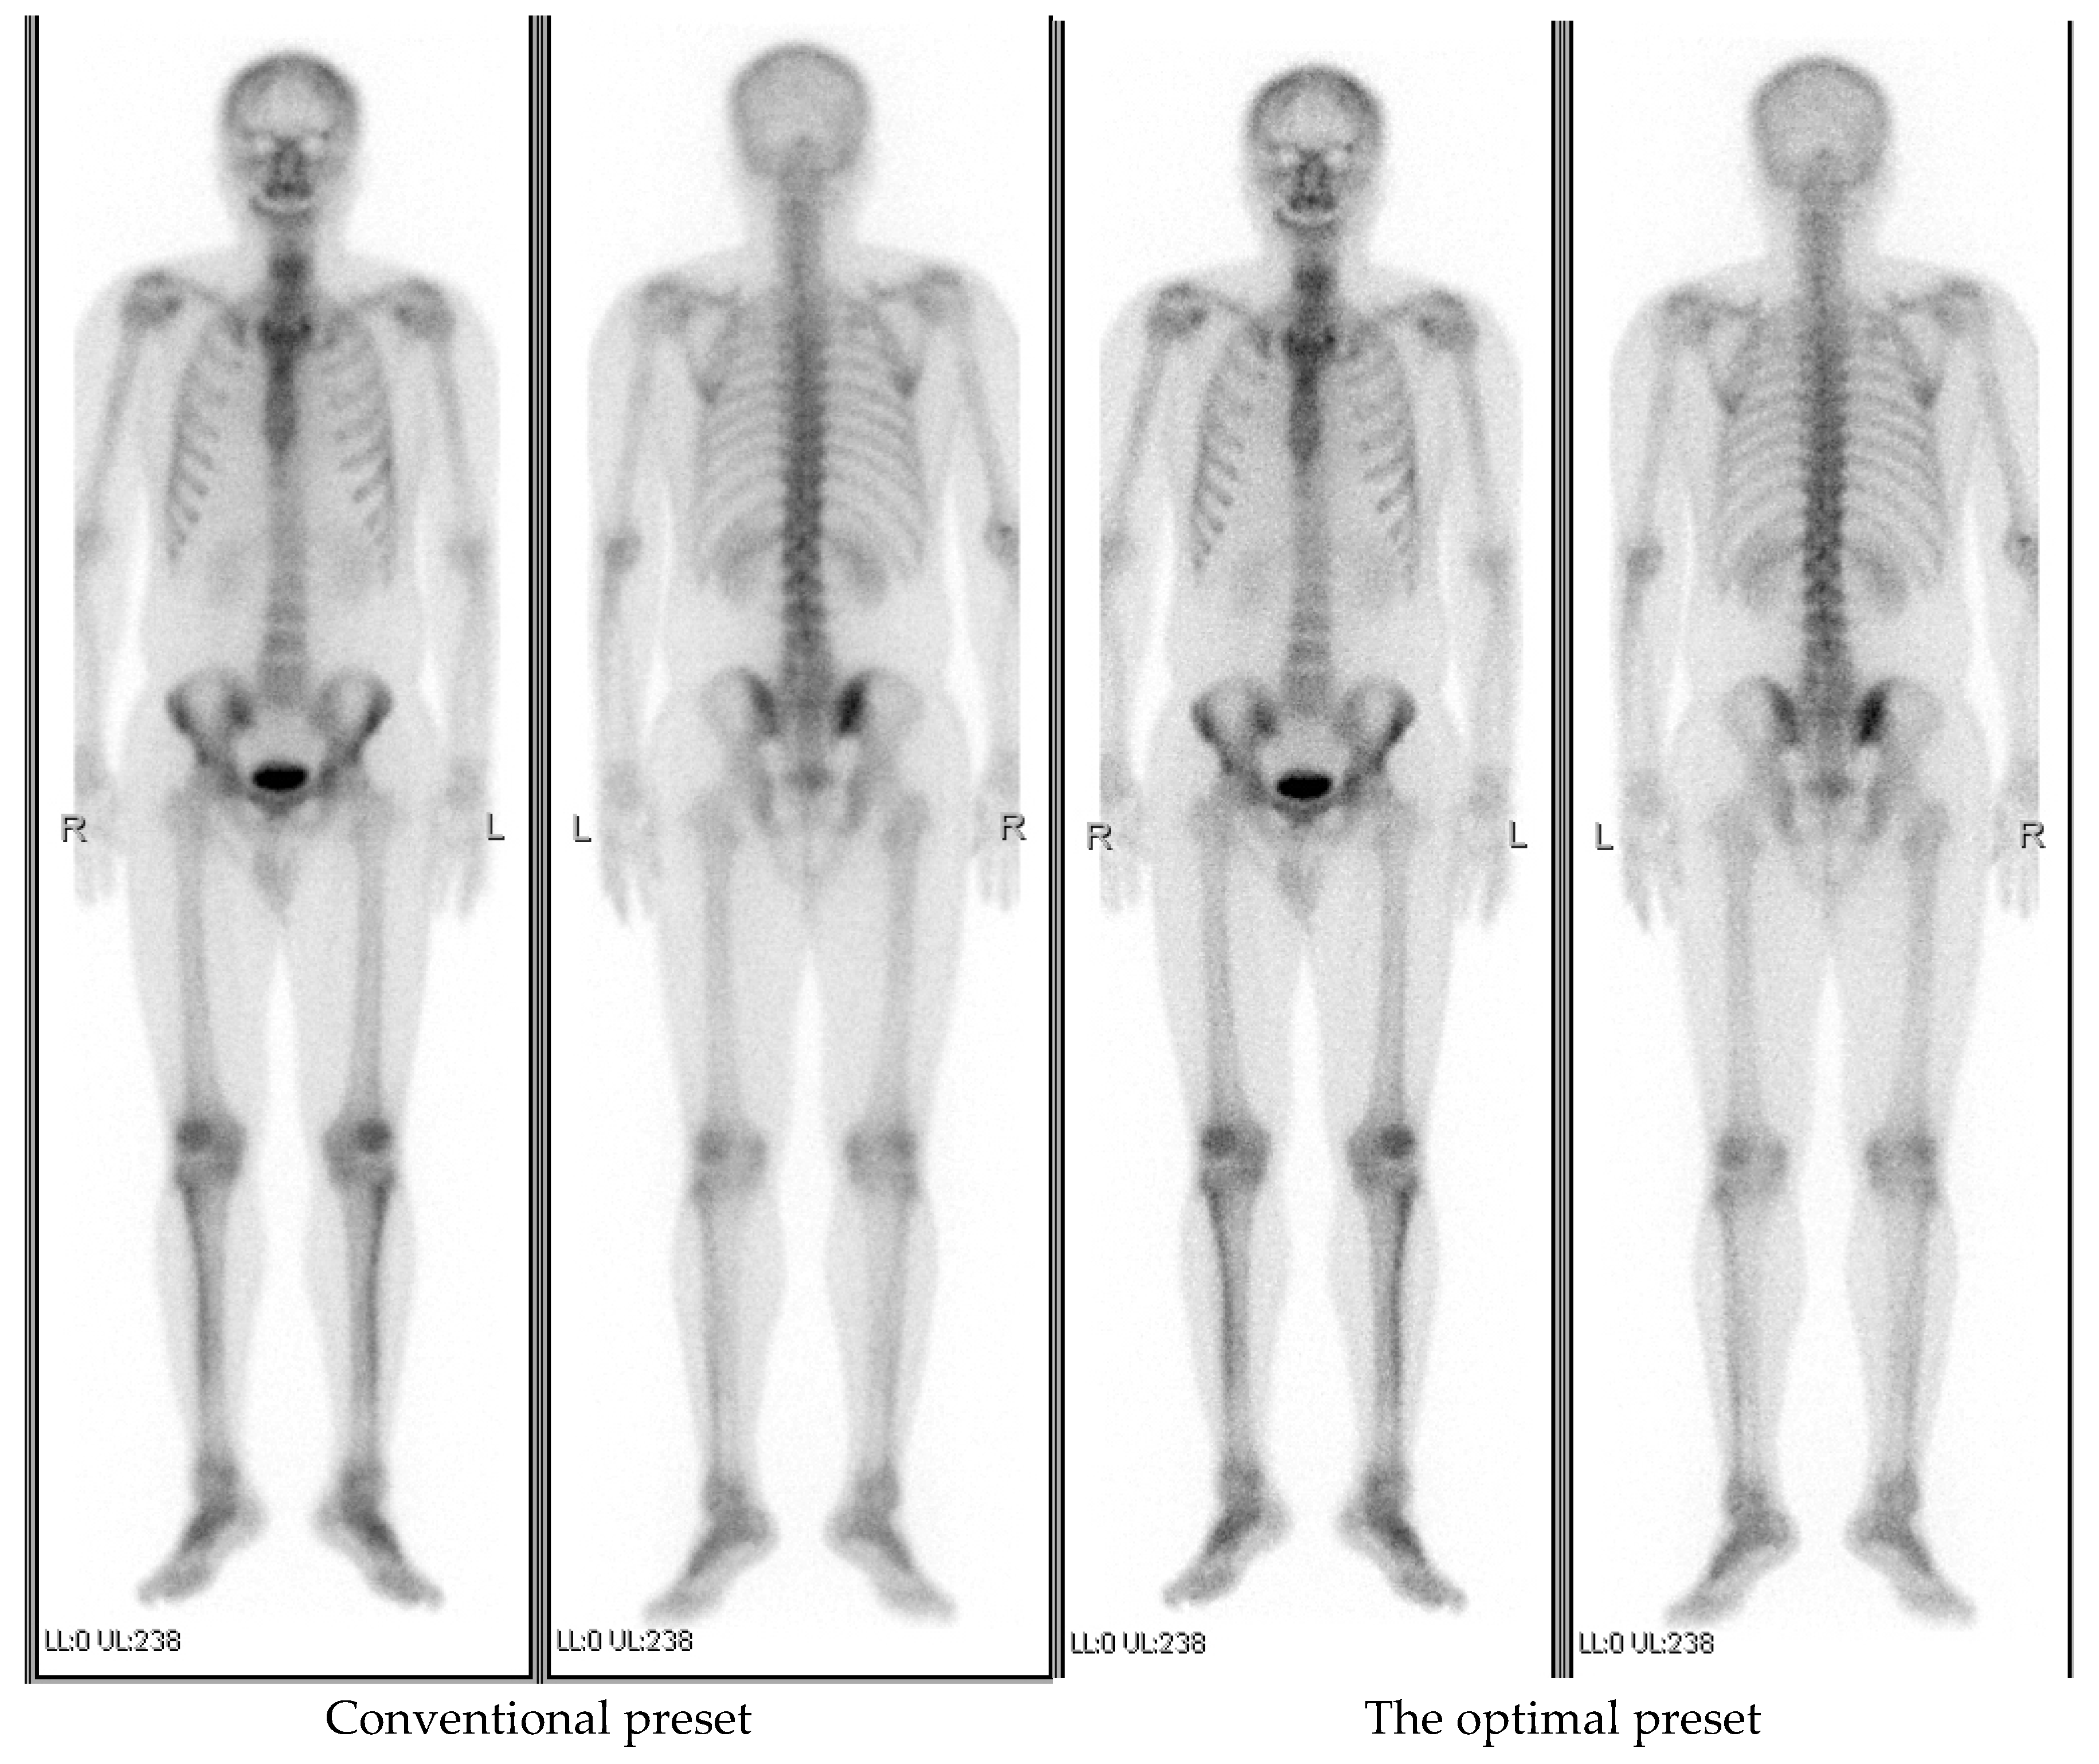
4.3. Clinical Testification of Gamma Camera Optimal Preset
5. Conclusions
Author Contributions
Funding
Institutional Review Board Statement
Informed Consent Statement
Data Availability Statement
Conflicts of Interest
References
- Yu, C.-C.; Ting, C.-Y.; Yang, M.-H.; Chan, H.-P. Comparison of irregular flux viewer system with BONENAVI version for identification of Tc-99m MDP whole body bone scan metastasis images. J. X-ray Sci. Technol. 2021, 29, 617–633. [Google Scholar] [CrossRef] [PubMed]
- Pawar, S.U.; Dharmalingam, A.; Bhatt, B.M.; Shetye, S.S.; Ghorpade, M.K. Role of Tc-99m MDP bone scan in evaluation of osteoid osteoma at varied locations. Int. J. Res. Med. Sci. 2018, 6, 2711–2716. [Google Scholar] [CrossRef]
- Das, D.; Das, M. Vegetation Ecology of Coastal belt of Khejuri area of Purba Medinipur District with special reference to Hijli coast, West Bengal, India. IOSR J. Pharm. 2014, 4, 56–77. [Google Scholar]
- Archi, A.; Prafulla, J.; Nilendu, P.; Sneha, S.; Venkatesh, R. Rare splenic metastasis of renal cell carcinoma detected on 99m Tc-MDP bone scan. Indian J. Nucl. Med. 2014, 29, 60–61. [Google Scholar]
- Araz, M.; Aras, G.; Kucuk, N.O. The role of 18F–NaF PET/CT in metastatic bone disease. J. Bone Oncol. 2015, 4, 92–97. [Google Scholar] [CrossRef] [Green Version]
- Iagaru, A.; Mittra, E.; Dick, D.; Gambhir, S.S. Prospective Evaluation of 99mTc MDP Scintigraphy, 18F NaF PET/CT, and 18F FDG PET/CT for Detection of Skeletal Metastases. Mol. Imaging Biol. 2012, 14, 252–259. [Google Scholar] [CrossRef]
- Zhang, L.; He, Q.; Zhou, T.; Zhang, B.; Li, W.; Peng, H.; Zhong, X.; Ma, L.; Zhang, R. Accurate characterization of 99mTc-MDP uptake in extraosseous neoplasm mimicking bone metastasis on whole-body bone scan: Contribution of SPECT/CT. BMC Med. Imaging 2019, 19, 44. [Google Scholar] [CrossRef] [Green Version]
- Oumar, A.A.; Erçelebi, E. Assessment of an in-house phantom for the quality control of a clinical gamma camera. J. X-ray Sci. Technol. 2020, 28, 461–470. [Google Scholar] [CrossRef]
- Robert, C.; Montémont, G.; Rebuffel, V.; Buvat, I.; Guérin, L.; Verger, L. Simulation-based evaluation and optimization of a new CdZnTe gamma-camera architecture (HiSens). Phys. Med. Biol. 2010, 55, 2709–2726. [Google Scholar] [CrossRef]
- Hruska, C.B.; Weinmann, A.L.; O’Connor, M.K. Proof of concept for low-dose molecular breast imaging with a dual-head CZT gamma camera. Part I. Evaluation in phantoms. Med. Phys. 2012, 39, 3466–3475. [Google Scholar] [CrossRef] [Green Version]
- Dickerscheid, D.; Lavalaye, J.; Romijn, L.; Habraken, J. Contrast-noise-ratio (CNR) analysis and optimisation of breast-specific gamma imaging (BSGI) acquisition protocols. EJNMMI Res. 2013, 3, 21. [Google Scholar] [CrossRef] [PubMed] [Green Version]
- Yeh, D.M.; Chang, P.J.; Pan, L.K. The optimum Ga-67-citrate gamma camera imaging quality factors as first calculated and shown by the Taguchi’s analysis. Hell. J. Nucl. Med. 2013, 16, 25–32. [Google Scholar] [CrossRef]
- Kittipayak, S.; Pan, L.-K.; Chiang, F.-T.; Lin, C.-H. The Optimization of the Single Photon Emission Computed Tomography Image Quality via Taguchi Analysis: A Feasibility Study of a V-Shaped Phantom. J. Med. Imaging Health Inform. 2017, 7, 143–148. [Google Scholar] [CrossRef]
- Chen, C.Y.; Liu, K.C.; Chen, H.H.; Pan, L.-K. Optimizing the TLD-100 readout system for various radiotherapy beam doses using the Taguchi methodology. Appl. Radiat. Isot. 2010, 68, 481–488. [Google Scholar] [CrossRef] [PubMed]
- Pan, L.K.; Chang, B.D.; Chou, D.S. Optimization for solidification of low-level-radioactive resin using Taguchi analysis. Waste Manag. 2001, 21, 767–772. [Google Scholar] [CrossRef]
- Roy, R.K. A Primer on the Taguchi Method, 2nd ed.; Society of Manufacturing Engineering: Southfield, MI, USA; ISBN 13:978-0-87263-864-8.
- Yoo, S.K.; Cotton, S.L.; Sofotasios, P.C.; Matthaiou, M.; Valkama, M.; Karagiannidis, G.K. The Fisher–Snedecor F distribution: A simple and accurate composite fading model. IEEE Commun. Lett. 2017, 21, 1661–1664. [Google Scholar] [CrossRef] [Green Version]
- Nakanishi, K.; Yamamoto, S.; Kataoka, J. Performance comparison of finely channeled LYSO- and GAGG-based Si-PM gamma cameras for high-resolution SPECT. NIMA A 2017, 872, 107–111. [Google Scholar] [CrossRef]
- Noori-Asl, M.; Sadremomtaz, A.; Bitarafan-Rajabi, A. Evaluation of three scatter correction methods based on estimation of photopeak scatter spectrum in SPECT imaging: A simulation study. Phys. Med. 2014, 30, 947–953. [Google Scholar] [CrossRef]
- Misra, S. Randomized double blind placebo control studies, the “Gold Standard” in intervention based studies. Indian J. Sex. Transm. Dis. AIDS 2012, 33, 131–134. [Google Scholar] [CrossRef] [Green Version]
- MATLAB. Matrix Laboratory Developed by MathWorks. V7.0.1.24704 (R14). 2004. Available online: http://www.mathworks.com/products/matlab/whatsnew.html (accessed on 4 October 2004).
- Kenny, D.A.; Mannetti, L.; Pierro, A.; Livi, S.; Kashy, D.A. The statistical analysis of data from small groups. J. Pers. Soc. Psychol. 2002, 83, 126–137. [Google Scholar] [CrossRef]
- Pan, L.-K.; Wu, K.-Y.; Chen, K.-L.; Kittipayak, S. Taguchi method-based optimization of the minimum detectable difference of a cardiac X-ray imaging system using a precise line pair gauge. J. Mech. Med. Biol. 2019, 19, 1940030. [Google Scholar] [CrossRef] [Green Version]
- Lee, T.-M.; Lin, C.-C.; Peng, B.-R.; Pan, L.-F. Integration of Taguchi analysis with phantom and innovative gauges: Optimization of the CT scan protocol for peripheral arterial occlusive disease (paod) syndrome. J. Mech. Med. Biol. 2020, 20, 2040005. [Google Scholar] [CrossRef]
- Chiang, C.-Y.; Chen, Y.-H.; Pan, L.-F.; Cho, C.-C.; Peng, B.-R. Minimum detectable difference of CT angiography scans at various cardiac beats: Evaluation via a customized oblique V-shaped line gauge and pmma phantom. J. Mech. Med. Biol. 2021, 21, 2140066. [Google Scholar] [CrossRef]


| Group | Factor | |||||
|---|---|---|---|---|---|---|
| A | B | C | D | E | F | |
| 1 | 1 | 1 | 1 | 1 | 1 | 1 |
| 2 | 1 | 1 | 2 | 2 | 2 | 2 |
| 3 | 1 | 1 | 3 | 3 | 3 | 3 |
| 4 | 1 | 2 | 1 | 1 | 2 | 2 |
| 5 | 1 | 2 | 2 | 2 | 3 | 3 |
| 6 | 1 | 2 | 3 | 3 | 1 | 1 |
| 7 | 1 | 3 | 1 | 2 | 1 | 3 |
| 8 | 1 | 3 | 2 | 3 | 2 | 1 |
| 9 | 1 | 3 | 3 | 1 | 3 | 2 |
| 10 | 2 | 1 | 1 | 3 | 3 | 2 |
| 11 | 2 | 1 | 2 | 1 | 1 | 3 |
| 12 | 2 | 1 | 3 | 2 | 2 | 1 |
| 13 | 2 | 2 | 1 | 2 | 3 | 1 |
| 14 | 2 | 2 | 2 | 3 | 1 | 2 |
| 15 | 2 | 2 | 3 | 1 | 2 | 3 |
| 16 | 2 | 3 | 1 | 3 | 2 | 3 |
| 17 | 2 | 3 | 2 | 1 | 3 | 1 |
| 18 | 2 | 3 | 3 | 2 | 1 | 2 |
| Factor | Level 1 | Level 2 | Level 3 |
|---|---|---|---|
| (A) collimator | LEHR | LEGP | |
| (B) detector to target distance (DTD) | 5 cm | 10 cm | 15 cm |
| (C) Total counts (TT) | 135 k | 150 k | 165 k |
| (D) acquired energy width (EW) | 16% | 20% | 24% |
| (E) Matrix size | 128 × 128 | 256 × 256 | 512 × 512 |
| (F) Zoom of ROI | 1.00 | 1.28 | 1.50 |
| Group | Radiologist-1 | Radiologist-2 | Radiologist-3 | Ave. | Sd | S/N | ||||||
|---|---|---|---|---|---|---|---|---|---|---|---|---|
| 1 | 16 | 18 | 18 | 11 | 17 | 14 | 18 | 15 | 18 | 16.11 | 2.42 | 15.78 |
| 2 | 18 | 17 | 17 | 16 | 16 | 16 | 15 | 17 | 17 | 16.56 | 0.88 | 21.88 |
| 3 | 13 | 16 | 16 | 18 | 13 | 18 | 12 | 18 | 14 | 15.33 | 2.40 | 15.42 |
| 4 | 12 | 14 | 11 | 17 | 15 | 17 | 13 | 16 | 14 | 14.33 | 2.12 | 15.72 |
| 5 | 11 | 12 | 14 | 15 | 7 | 12 | 8 | 13 | 12 | 11.56 | 2.60 | 12.35 |
| 6 | 15 | 15 | 15 | 13 | 18 | 15 | 16 | 12 | 15 | 14.89 | 1.69 | 17.59 |
| 7 | 6 | 5 | 3 | 8 | 8 | 7 | 3 | 9 | 8 | 6.33 | 2.24 | 8.25 |
| 8 | 8 | 9 | 12 | 12 | 14 | 10 | 14 | 10 | 9 | 10.89 | 2.20 | 13.06 |
| 9 | 9 | 8 | 8 | 9 | 11 | 9 | 9 | 8 | 7 | 8.67 | 1.12 | 15.24 |
| 10 | 10 | 10 | 9 | 10 | 6 | 11 | 7 | 7 | 11 | 9.00 | 1.87 | 12.55 |
| 11 | 14 | 11 | 10 | 14 | 9 | 8 | 10 | 11 | 10 | 10.78 | 2.05 | 13.50 |
| 12 | 17 | 13 | 13 | 7 | 12 | 13 | 17 | 14 | 16 | 13.56 | 3.09 | 12.42 |
| 13 | 7 | 6 | 7 | 6 | 10 | 5 | 11 | 6 | 3 | 6.78 | 2.44 | 8.21 |
| 14 | 5 | 4 | 4 | 4 | 5 | 6 | 6 | 4 | 5 | 4.78 | 0.83 | 11.29 |
| 15 | 4 | 7 | 5 | 5 | 4 | 4 | 4 | 5 | 6 | 4.89 | 1.05 | 10.54 |
| 16 | 1 | 2 | 1 | 1 | 2 | 1 | 5 | 1 | 2 | 1.78 | 1.30 | 0.69 |
| 17 | 3 | 3 | 6 | 3 | 3 | 3 | 2 | 3 | 4 | 3.33 | 1.12 | 6.94 |
| 18 | 2 | 1 | 2 | 2 | 1 | 2 | 1 | 2 | 1 | 1.56 | 0.53 | 2.77 |
| Average | 9.5 | 1.78 | 11.90 | |||||||||
| Factor | SS | DOF | Contribution | Var | F | Probability | Confidence Level | Significant * |
|---|---|---|---|---|---|---|---|---|
| A | 1694.91 | 1 | 38.5% | 1694.9 | 463.42 | 0.0% | 100.0% | Yes |
| B | 1784.53 | 2 | 41% | 892.3 | 243.96 | 0.0% | 100.0% | Yes |
| C | 17.20 | 2 | 0.4% | 8.6 | 2.35 | 9.9% | 90.1% | No |
| D | 2.68 | 2 | 0.06% | 1.3 | 0.37 | 69.4% | 30.6% | No |
| E | 55.46 | 2 | 1.4% | 27.7 | 7.58 | 0.07% | 99.9% | Yes |
| F | 176.64 | 2 | 4.0% | 88.3 | 24.15 | 0.0% | 100.0% | Yes |
| Others | 110.41 | 6 | 2.5% | 18.4 | 5.03 | 0.01% | 100.0% | Yes |
| Error | 526.67 | 144 | 12.1% | 3.7 | S = 1.91 | |||
| Total | 4368.49 | 161 | 100% | |||||
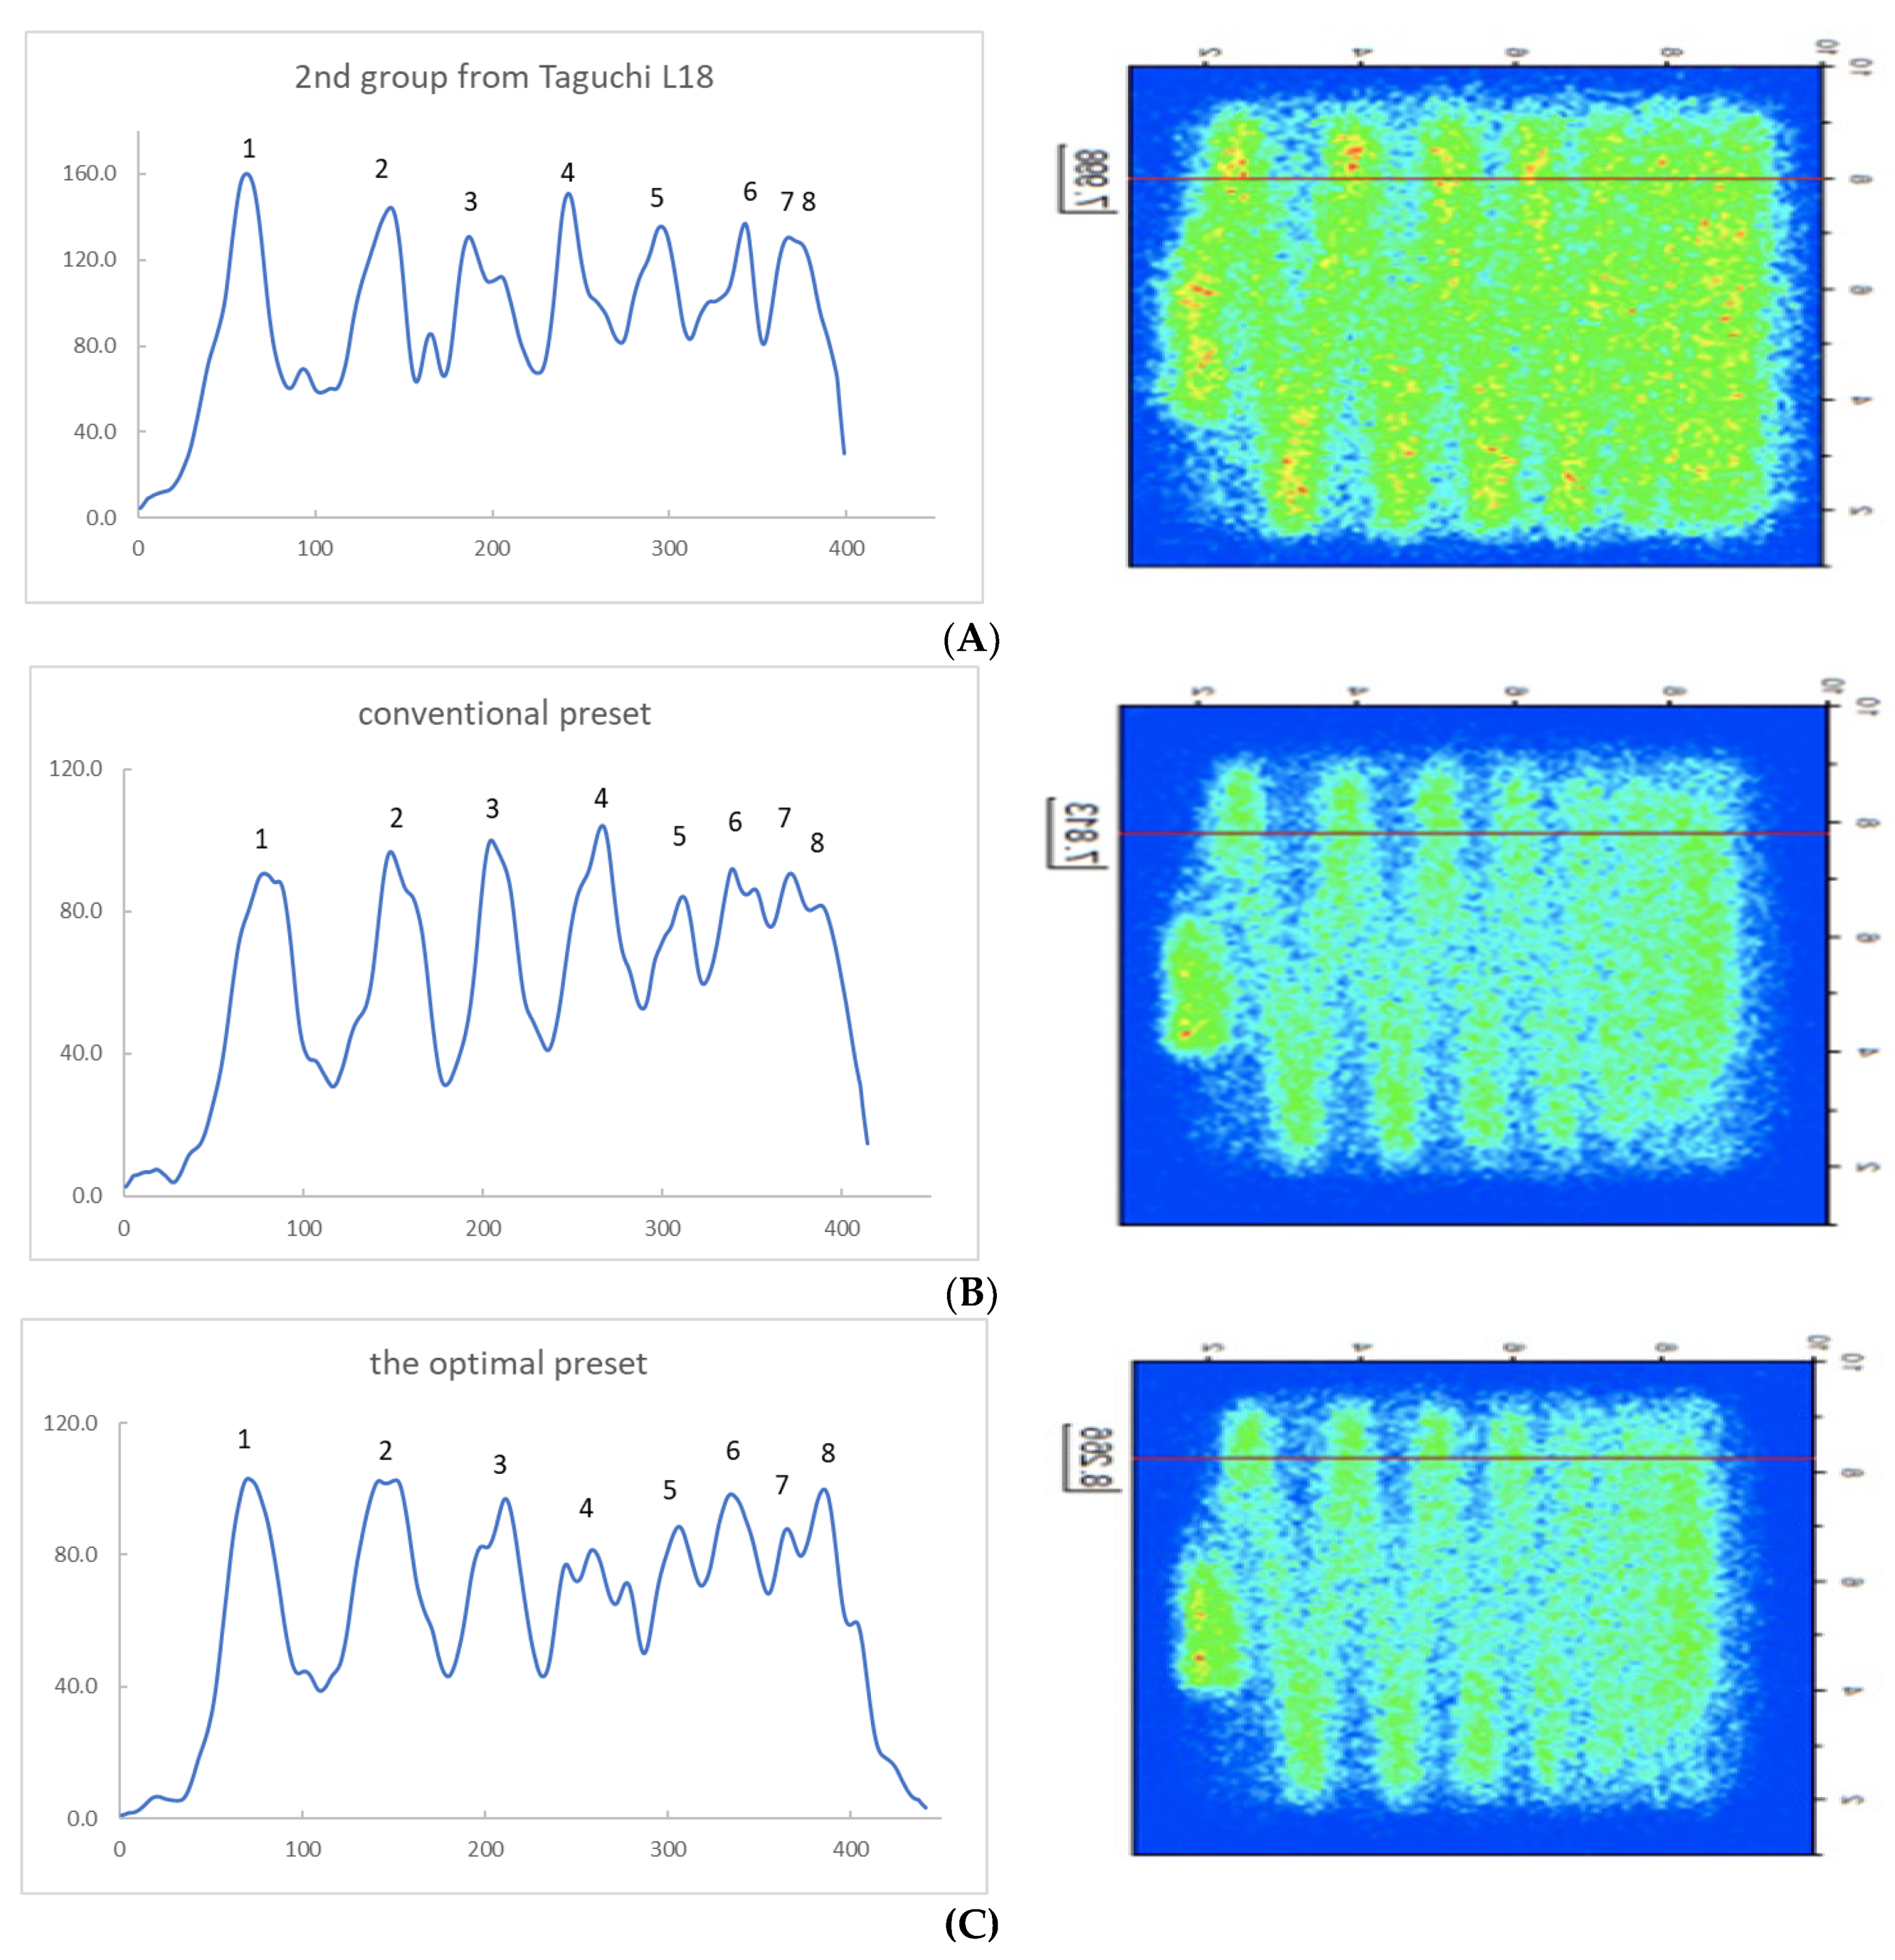
| Channel No. of the Derived SPECT | |
|---|---|
| 2nd group | |
| Conventional | |
| The Optimal |
| Factor | 2nd Group | Conventional | Optimal |
|---|---|---|---|
| LEHR | LEHR | LEHR |
| 5 cm | 5 cm | 5 cm |
| 150 k | 165 k | 150 k |
| 20% | 16% | 16% |
| 256 × 256 | 256 × 256 | 256 × 256 |
| 1.28 | 1.28 | 1.28 |
| MDD | 8.4 mm | 7.9 mm | 7.1 mm |
| Reference | MDD [mm] or lp/cm | Phantom | Facility |
|---|---|---|---|
| [12] | ~1.0 lp/cm | Semi-quantitative plate phantom | Gamma camera |
| [13] | 1.45 mm | Simplified water phantom | Gamma camera |
| [23] | 0.16 mm | Commercial slit gauge | Cardiac X-ray |
| [24] | 1.43 mm | Indigenous slit gauge in Limb phantom | CT |
| [25] | 1.71 mm@0 BPM | Slit gauge in dynamic water phantom | CT angiography |
| 2.12 mm@60 BPM | |||
| 2.44 mm@75 BPM | |||
| 2.58 mm@90 BPM | |||
| This work | 7.1 mm | PMMA slit gauge | Gamma camera |
Publisher’s Note: MDPI stays neutral with regard to jurisdictional claims in published maps and institutional affiliations. |
© 2022 by the authors. Licensee MDPI, Basel, Switzerland. This article is an open access article distributed under the terms and conditions of the Creative Commons Attribution (CC BY) license (https://creativecommons.org/licenses/by/4.0/).
Share and Cite
Ke, C.-H.; Liu, W.-J.; Peng, B.-R.; Pan, L.-F.; Pan, L.-K. Optimizing the Minimum Detectable Difference of Gamma Camera SPECT Images via the Taguchi Analysis: A Feasibility Study with a V-Shaped Slit Gauge. Appl. Sci. 2022, 12, 2708. https://doi.org/10.3390/app12052708
Ke C-H, Liu W-J, Peng B-R, Pan L-F, Pan L-K. Optimizing the Minimum Detectable Difference of Gamma Camera SPECT Images via the Taguchi Analysis: A Feasibility Study with a V-Shaped Slit Gauge. Applied Sciences. 2022; 12(5):2708. https://doi.org/10.3390/app12052708
Chicago/Turabian StyleKe, Ching-Hsiu, Wan-Ju Liu, Bing-Ru Peng, Lung-Fa Pan, and Lung-Kwang Pan. 2022. "Optimizing the Minimum Detectable Difference of Gamma Camera SPECT Images via the Taguchi Analysis: A Feasibility Study with a V-Shaped Slit Gauge" Applied Sciences 12, no. 5: 2708. https://doi.org/10.3390/app12052708