
Motion Simulation and Human–Computer Interaction System for Lunar Exploration


School of Instrument Science and Engineering, Southeast University, Nanjing 210096, China
*
Author to whom correspondence should be addressed.
Appl. Sci. 2022, 12(5), 2312; https://doi.org/10.3390/app12052312
Submission received: 27 December 2021
/
Revised: 14 February 2022
/
Accepted: 17 February 2022
/
Published: 23 February 2022
(This article belongs to the Topic Human–Machine Interaction)
Abstract
:When planning lunar rover missions, it is important to develop intuition and driving skills for unfamiliar environments before incurring the costs of reaching the moon. Simulators make it possible to operate in environments that have the physical characteristics of target locations without the expense of extensive physical tests. This paper proposes a motion simulation and human–computer interaction system based on a parallel mechanism to realize high-fidelity manned lunar rover simulations. The system consists of an interactive operating platform and a lunar surface simulation environment based on Unity3D. To make the 6-DOF platform simulate the posture changes of the rover, we improved the motion simulation algorithm. We designed a posture adjustment system and built virtual sensors to help astronauts perceive the lunar environment. Finally, this paper discusses the method for the realization of the multi-channel human–computer interaction system; astronauts can interactively control the rover through five channels. Experiments show that this system can realize high-fidelity rover simulation and improve the efficiency of human-computer interaction.
1. Introduction
Rovers are indispensable in deep space exploration and can be used to perform scientific tasks over long distances. China’s Jade Rabbit rover has successfully completed its work on the moon. However, compared with unmanned rovers, the operation of a manned rover is quite different. The only manned lunar rovers used so far have been on the Apollo 15, 16, and 17 missions of the early 1970s [1]. When planning lunar rover missions, it is important to develop intuition and driving skills for alien environments before incurring the cost of reaching the moon. Simulators make it possible to operate in environments that have the physical characteristics of target locations without the expense and overhead of extensive physical tests.
Research on manned rover simulators was carried out in the 1960s and 1970s, including the simulator in the US Apollo program and the manned rover simulator in the former Soviet Union [2]. In the Apollo project, simulator training accounted for one-third of total training time. It is an important and irreplaceable part of training to develop the driving skills of astronauts. Restricted by computer technology, these simulators adopted semi-physical simulations and physical simulations—thereby reproducing the visual and motion states of lunar driving [3]. Researchers have developed space-based suspension technology or ground-based motion platforms to realize the simulation of motion perception [4]. Training can also be carried out in environments on the earth similar to the moon, such as deserts, gravel deserts, and other areas, causing high costs.
In recent years, lunar rover simulation has mainly focused on lunar environment simulations and rover motion simulations. Allan et al. constructed a simulated lunar environment with high resolution terrain suitable for rover driving, using the open-source Gazebo platform and tools from the ROS ecosystem [5]. Xie et al. produced a 100 m × 100 m digital terrain using the random diameters method, in the form of a digital evaluation model (DEM) containing 25 × grid points [6]. The Boeing Company developed a terrain simulation system consisting of a 9-square-kilometer “lunar surface”, according to the data obtained from the experiments of the Apollo 15 [7]. Ju et al. developed a real-time 3D visualization system to study the dynamics modeling and control problem of a six-wheel rocker-bogie lunar rover, and simulated the rover’s motion and wheel–terrain interactions [8]. Tian et al. established a model of a lunar rover based on plastoelastic terramechanics and multibody dynamics, simulating the relationship between the wheels and the terrain [9]. ROAMS (Rover Analysis, Modeling and Simulation) developed by the Jet Propulsion Laboratory of the California Institute of Technology is a multi-mission rover simulation software capable of modeling a closed-loop system and establishing terrain/vehicle interactions [10].
This paper proposes a lunar exploration motion simulation and human–computer interaction system with low cost, strong immersion, rich interactive functions, and convenient training. This paper introduces this proposal from a systems perspective and is divided into five parts. Section 2 briefly introduces the hardware of the system—which is the interactive operating platform—and the virtual environment, including the creation of the rover and terrain model, the motion simulation algorithm and its realization, the creation of the posture adjustment system, and the realization of path planning. Section 2 introduces the human–computer interaction method of the system. Section 3 discusses the testing of the motion simulation and human–computer interaction method. Finally, Section 4 gives the conclusions and discusses future work.
This paper’s main contributions lie in the following:
- We designed a motion simulation method based on a 6-DOF platform. We improved the somatosensory feedback algorithm to ensure that the platform can simulate the motion state of the rover over a limited motion range. This method enables training to be carried out in an environment with the physical characteristics of the lunar surface without the need for extensive physical testing.
- We designed a multi-channel human–computer interaction method. Natural and efficient interactions between the human and the rover were realized through the cooperation of five channels: vision, force feedback, body feeling, voice, and touch.
- We integrated multi-channel human-computer interaction methods and motion simulation methods, and designed mechanisms such as the 6-DOF platform to form a system. This system enables astronauts to master the driving skills for manned rovers and familiarize themselves with the lunar environment. Finally, the system realizes the interactive integration of astronauts’ actual operations and lunar rover operations in a virtual environment. Combining the above links, we have realized the innovative application of the hardware in the loop simulation system in the field of lunar rover simulation.
2. Materials and Methods
2.1. System Architecture and Interactive Operating Platform
To achieve high-fidelity lunar exploration simulation and meet training needs, the core of the system is the creation of lunar scenes and the motion simulation of a rover. The physical effects of objects on the moon are different from those on the earth. We built a simulation environment with Unity3D, adding elements such as gravity and interactions between objects to form a physical system.
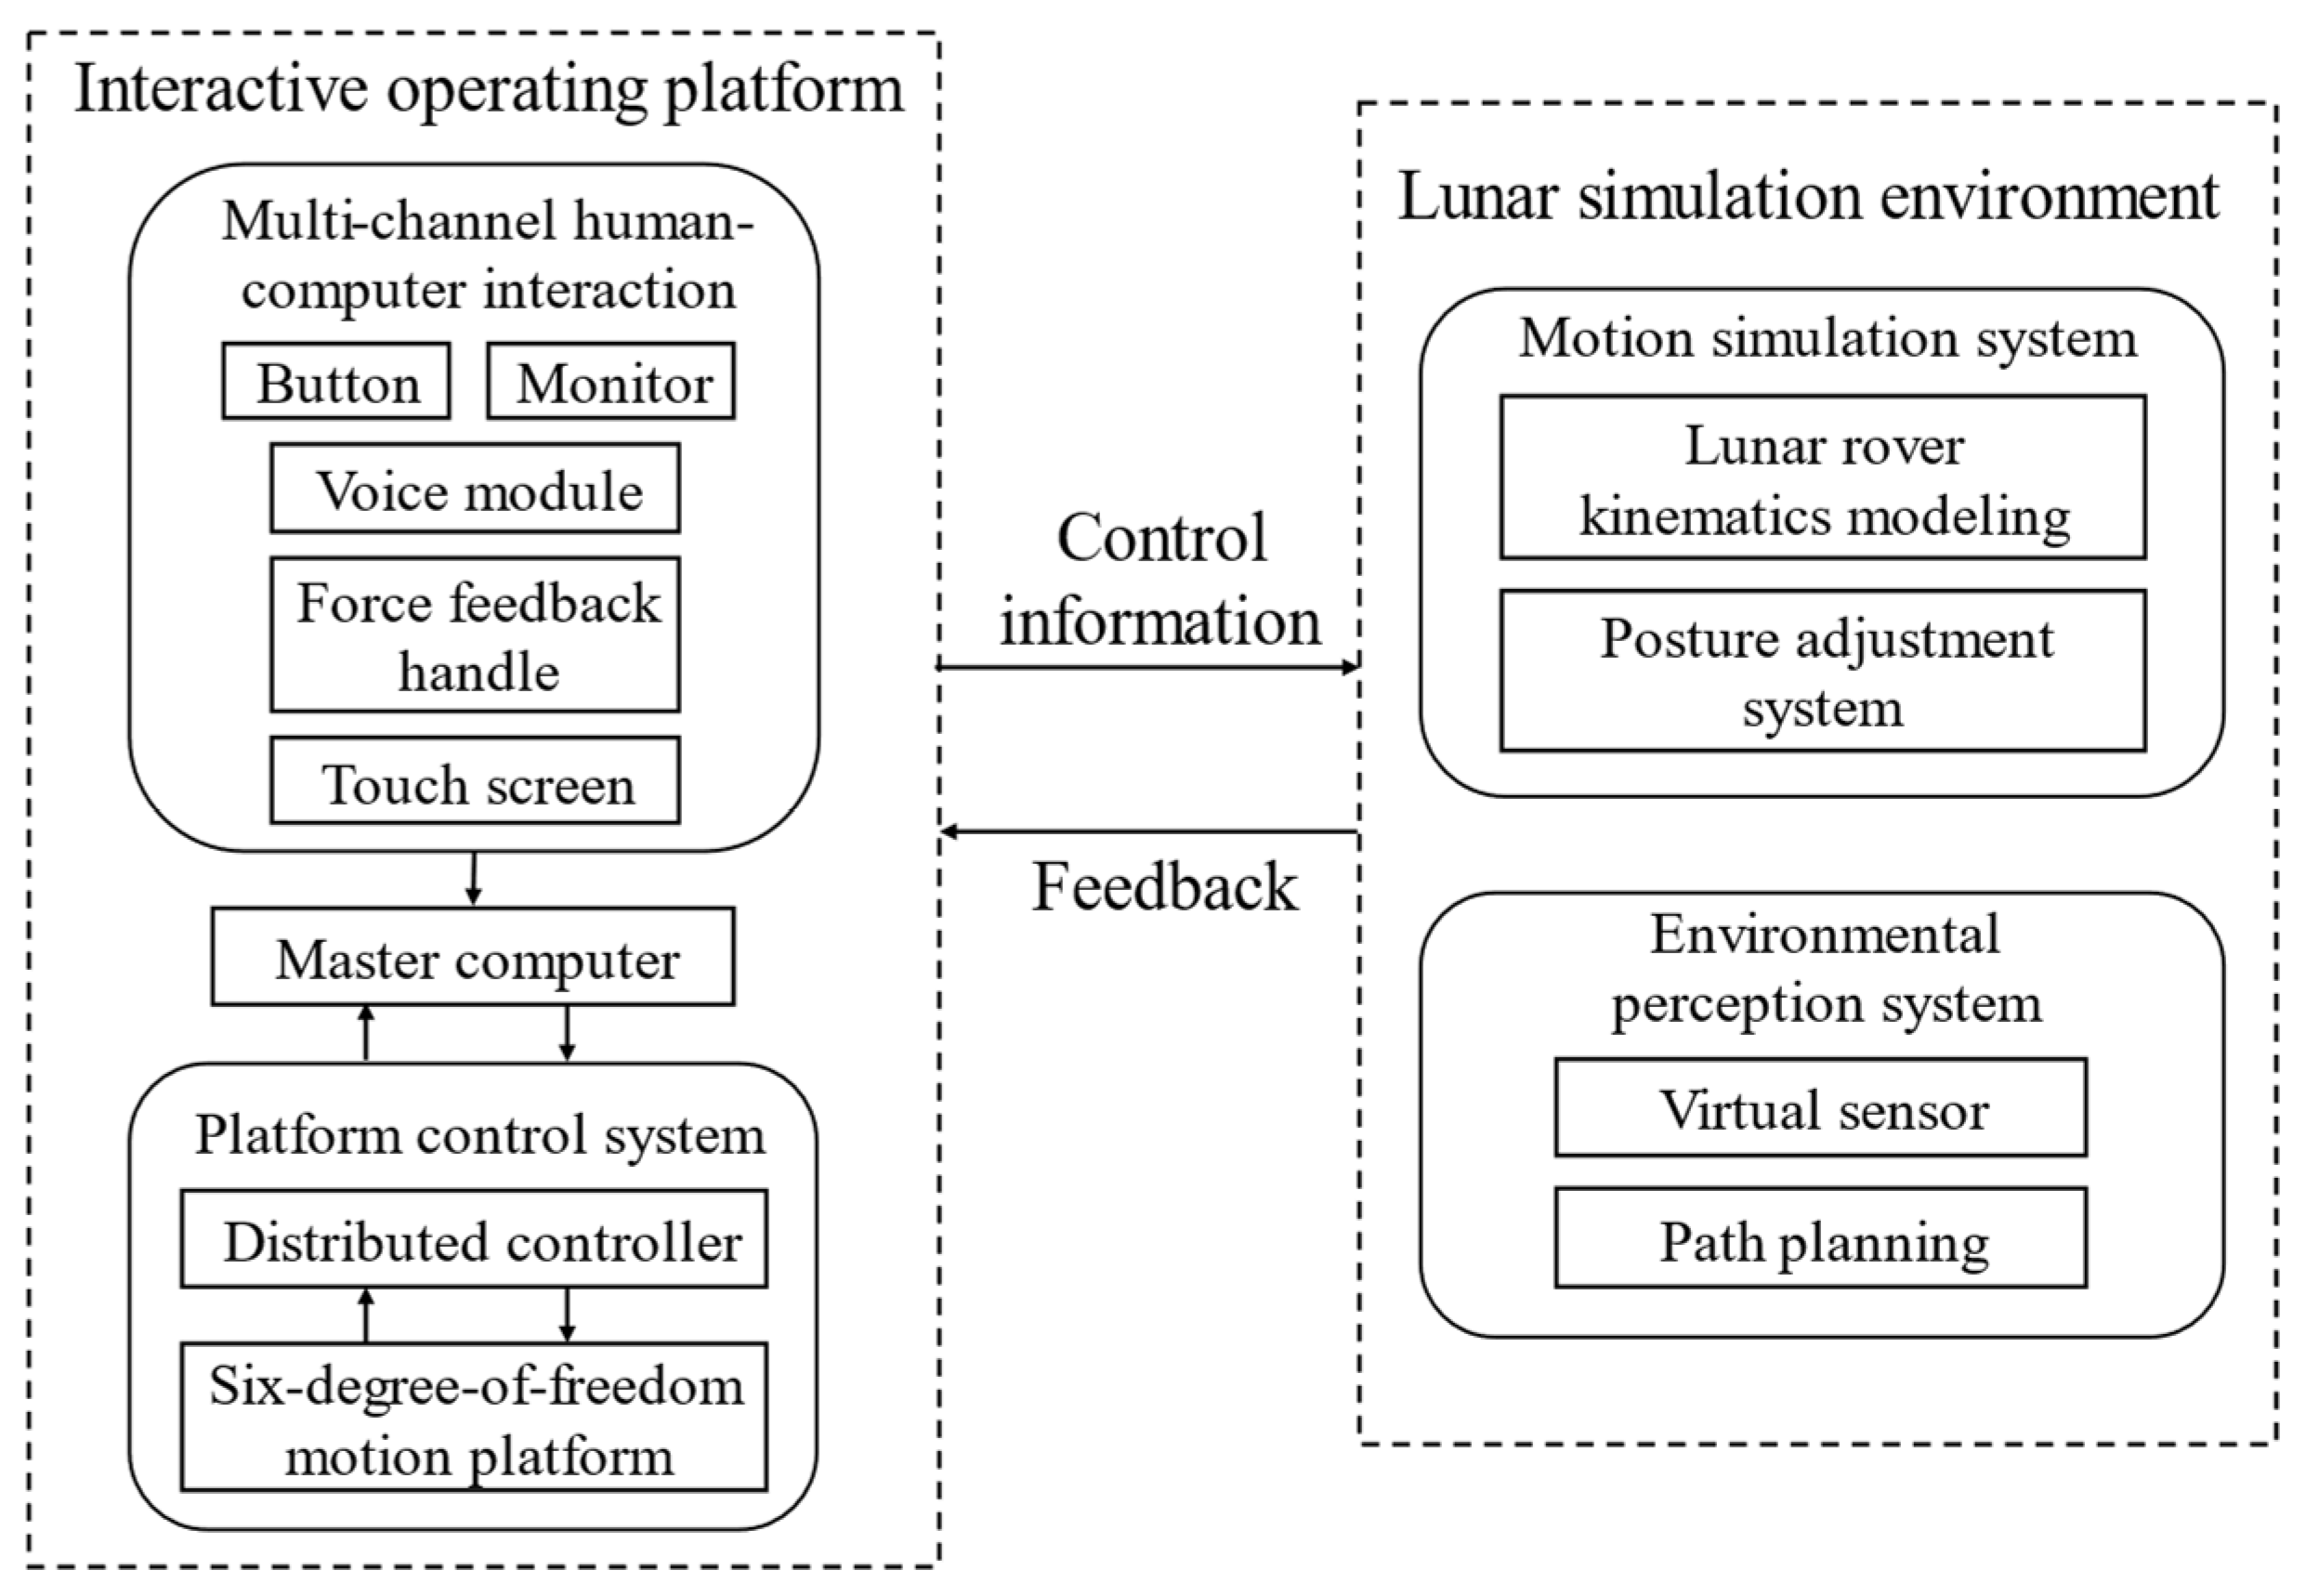
As shown in Figure 1, the system includes an interactive operating platform and a lunar surface simulation environment.
The interactive operation platform is composed of a human–computer interaction module, a master computer, and a platform control module. The master computer receives data from the interactive operation platform and sends the posture information of the rover to the platform control module. The distributed controller controls the motion of the 6-DOF platform and simulates the tilt, vibration, acceleration, and deceleration of the rover.
The interactive operation platform can accurately reflect the motion state felt by astronauts. The hardware component includes a 6-DOF motion platform at the bottom and a console at the top. The 6-DOF platform is shown in Figure 2.
The size of the 6-DOF motion platform is 1000 × 1000 × 740 mm, which can carry a load of 400 kg. Six hydraulic cylinders drive the platform to move. The pitch, roll, and yaw angles of the platform can reach up to 26°; the maximum displacement in the X and Y directions is 280 mm, and in the Z direction is 300 mm. We choose an LJ-EC-80-300 electric cylinder, which has a displacement accuracy of 0.1 mm and an angular accuracy of 0.1°. The platform has a response speed of 0.01 s, which can provide astronauts with a high-fidelity and continuous driving experience.
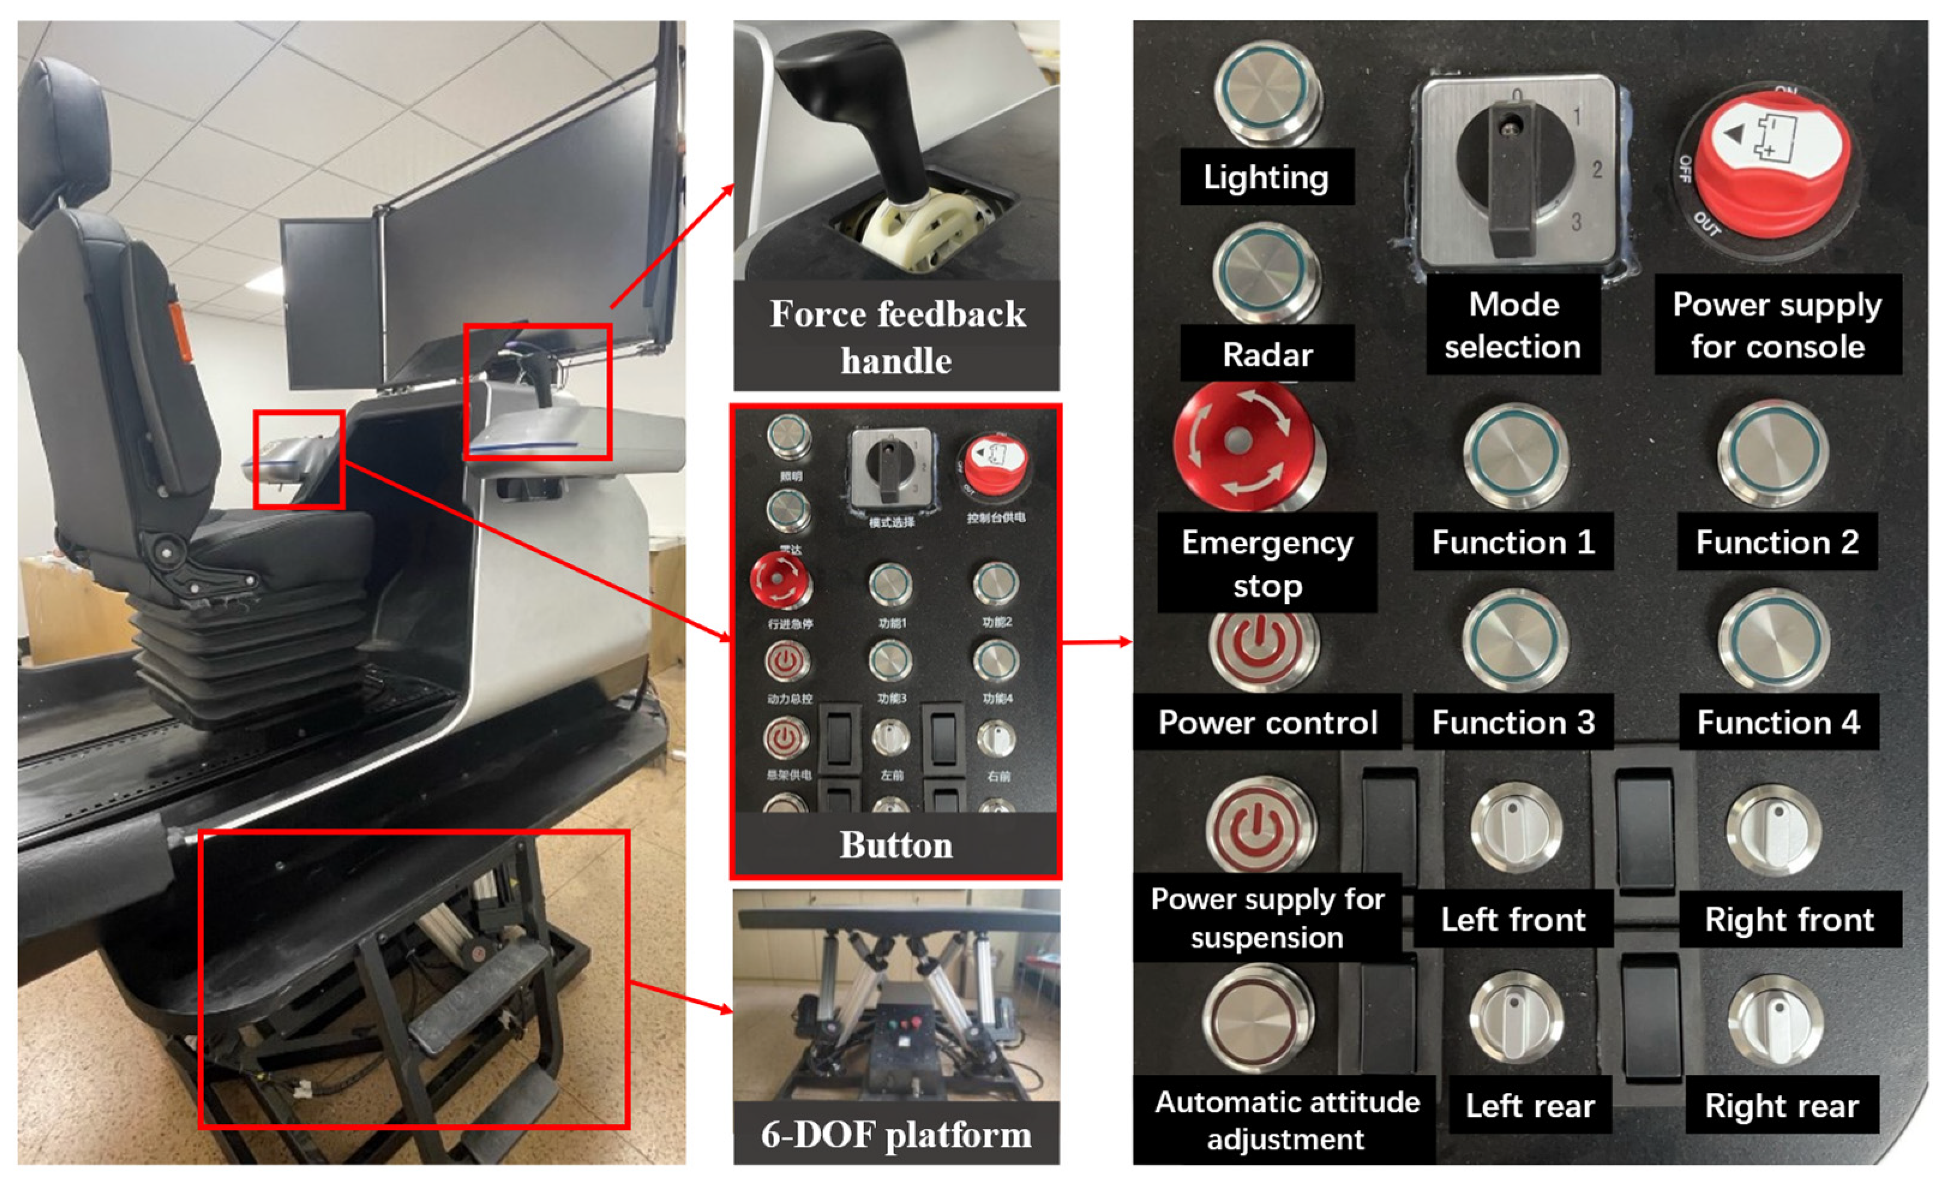
Astronauts use a force feedback handle to control the forward, backward, acceleration, deceleration, steering, and braking of the rover. We designed and implemented the force feedback method. The handle generates feedback force according to the slope of the terrain and generates damping according to the resistance received when turning. The above functions can provide astronauts with intuitive feedback on the terrain, allowing astronauts to clearly know the terrain conditions around the rover.
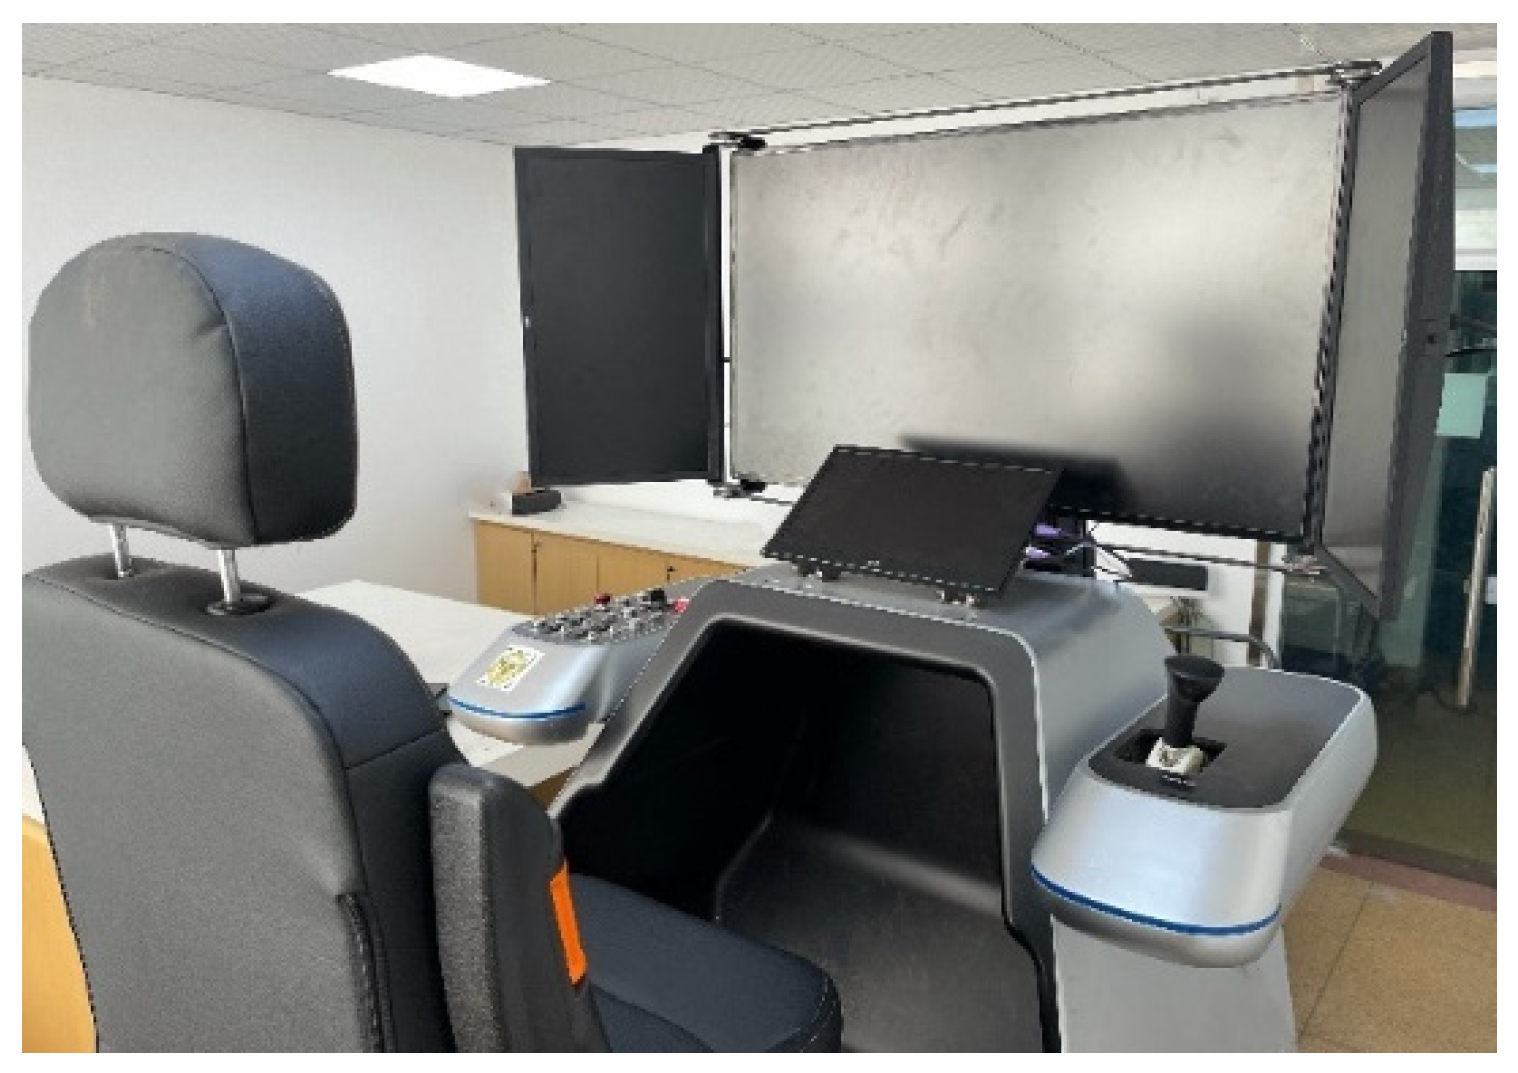
As shown in Figure 3, the operating platform is built on a 6-DOF platform. We designed a vision system to provide real-time wide-angle vision and driving information such as speed and path planning. To improve the interaction efficiency, we designed a touch screen, buttons, and voice modules to form a multi-channel human–computer interaction module.
2.2. Modeling of Lunar Environment and Rover
To produce a real lunar driving experience, the simulated world must represent the target physical environment. To restore the dynamic characteristics of the lunar rover, we established a manned lunar rover simulation model and a virtual environment based on Unity3D. We built a four-wheel independent semi-active posture adjustment mechanism, and built a sensor model to simulate the movement, posture adjustment, path planning, and other operations of the rover.
2.2.1. Lunar Environment Generation
The lunar environment includes the lunar terrain and the geometric and kinematics model of the manned lunar rover. On the moon, the main obstacles of interest to the lunar rover are rocks and craters. The distribution of obstacles has a significant impact on the simulation effect [11]. We tried to simulate this effect by procedurally placing rocks and craters and using the latest orbital information to simulate the formation of the lunar terrain.
The topographic data are from the Lunar Reconnaissance orbit satellite LRO, which is located 3 km south of the Apollo 15 landing site [12,13]. Craters were added through the transformation of the height map. represents the coordinates of the sampling point. The two-dimensional coordinates of the height map corresponded to the of the sampling point, and the relationship between the brightness value and the of the sampling point is shown in Formula (1):
where is the maximum height of the lunar surface. The luminance value of is .
The depth and diameter of the crater met the following formula [14]:
where H is the depth of the crater and D is the diameter of the crater.
The height map was loaded into Unity3D as a terrain model to generate a simulation environment.
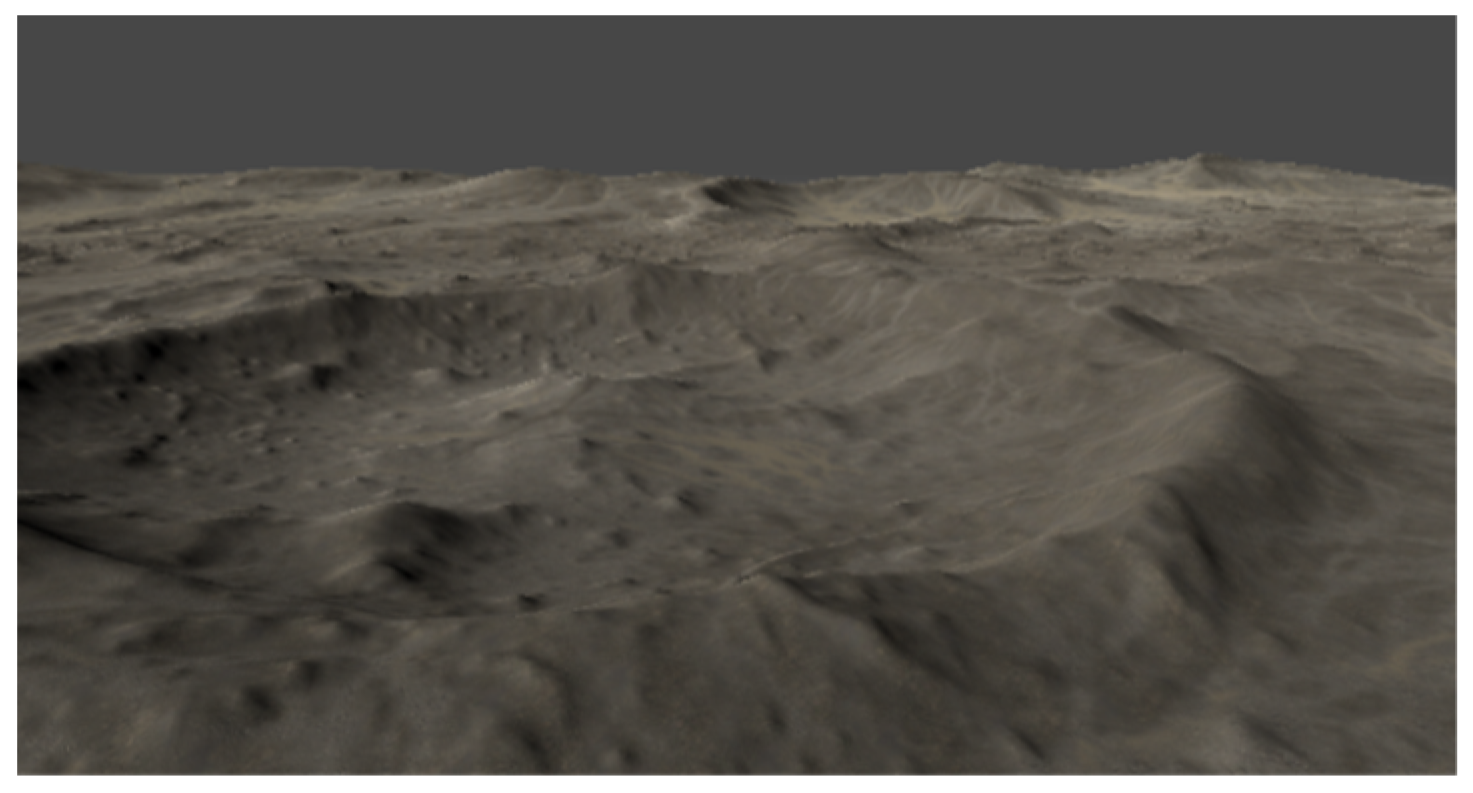
The shapes of the lunar rocks included circular, rectangular, concave, and so on. Rocks were generated on the terrain according to the distribution density of rocks with different diameters on the moon. The shape, size, quantity, and spatial distribution of rocks can be adjusted in Unity3D. The final lunar surface model is shown in Figure 4.
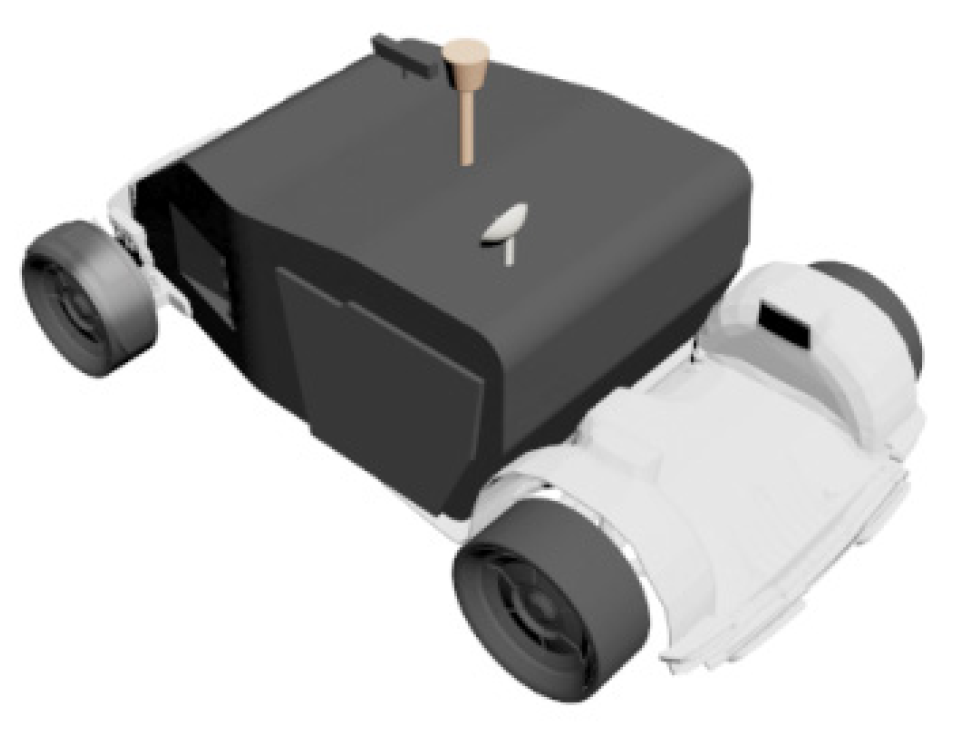
Referring to the Apollo manned lunar rover, we designed a symmetrical springless suspension model, including two single-sided rocker arms and four bogies. The rocker arms on both sides had rotational freedom and were connected by a differential device. The pitch angle of the body was the average of the pitch angles of the rocker arms. The four wheels were independently driven and combined for steering [15,16]. The model of the rover is shown in Figure 5.
2.2.2. Motion Simulation of the Rover
Due to the limitations of the mechanical structure, the translation range of the 6-DOF platform is limited [17]. Therefore, in the process of simulating the actual movement of the rover, the platform cannot track the 6-DOF attitude. To achieve high-fidelity posture following, the output data needs to be processed.
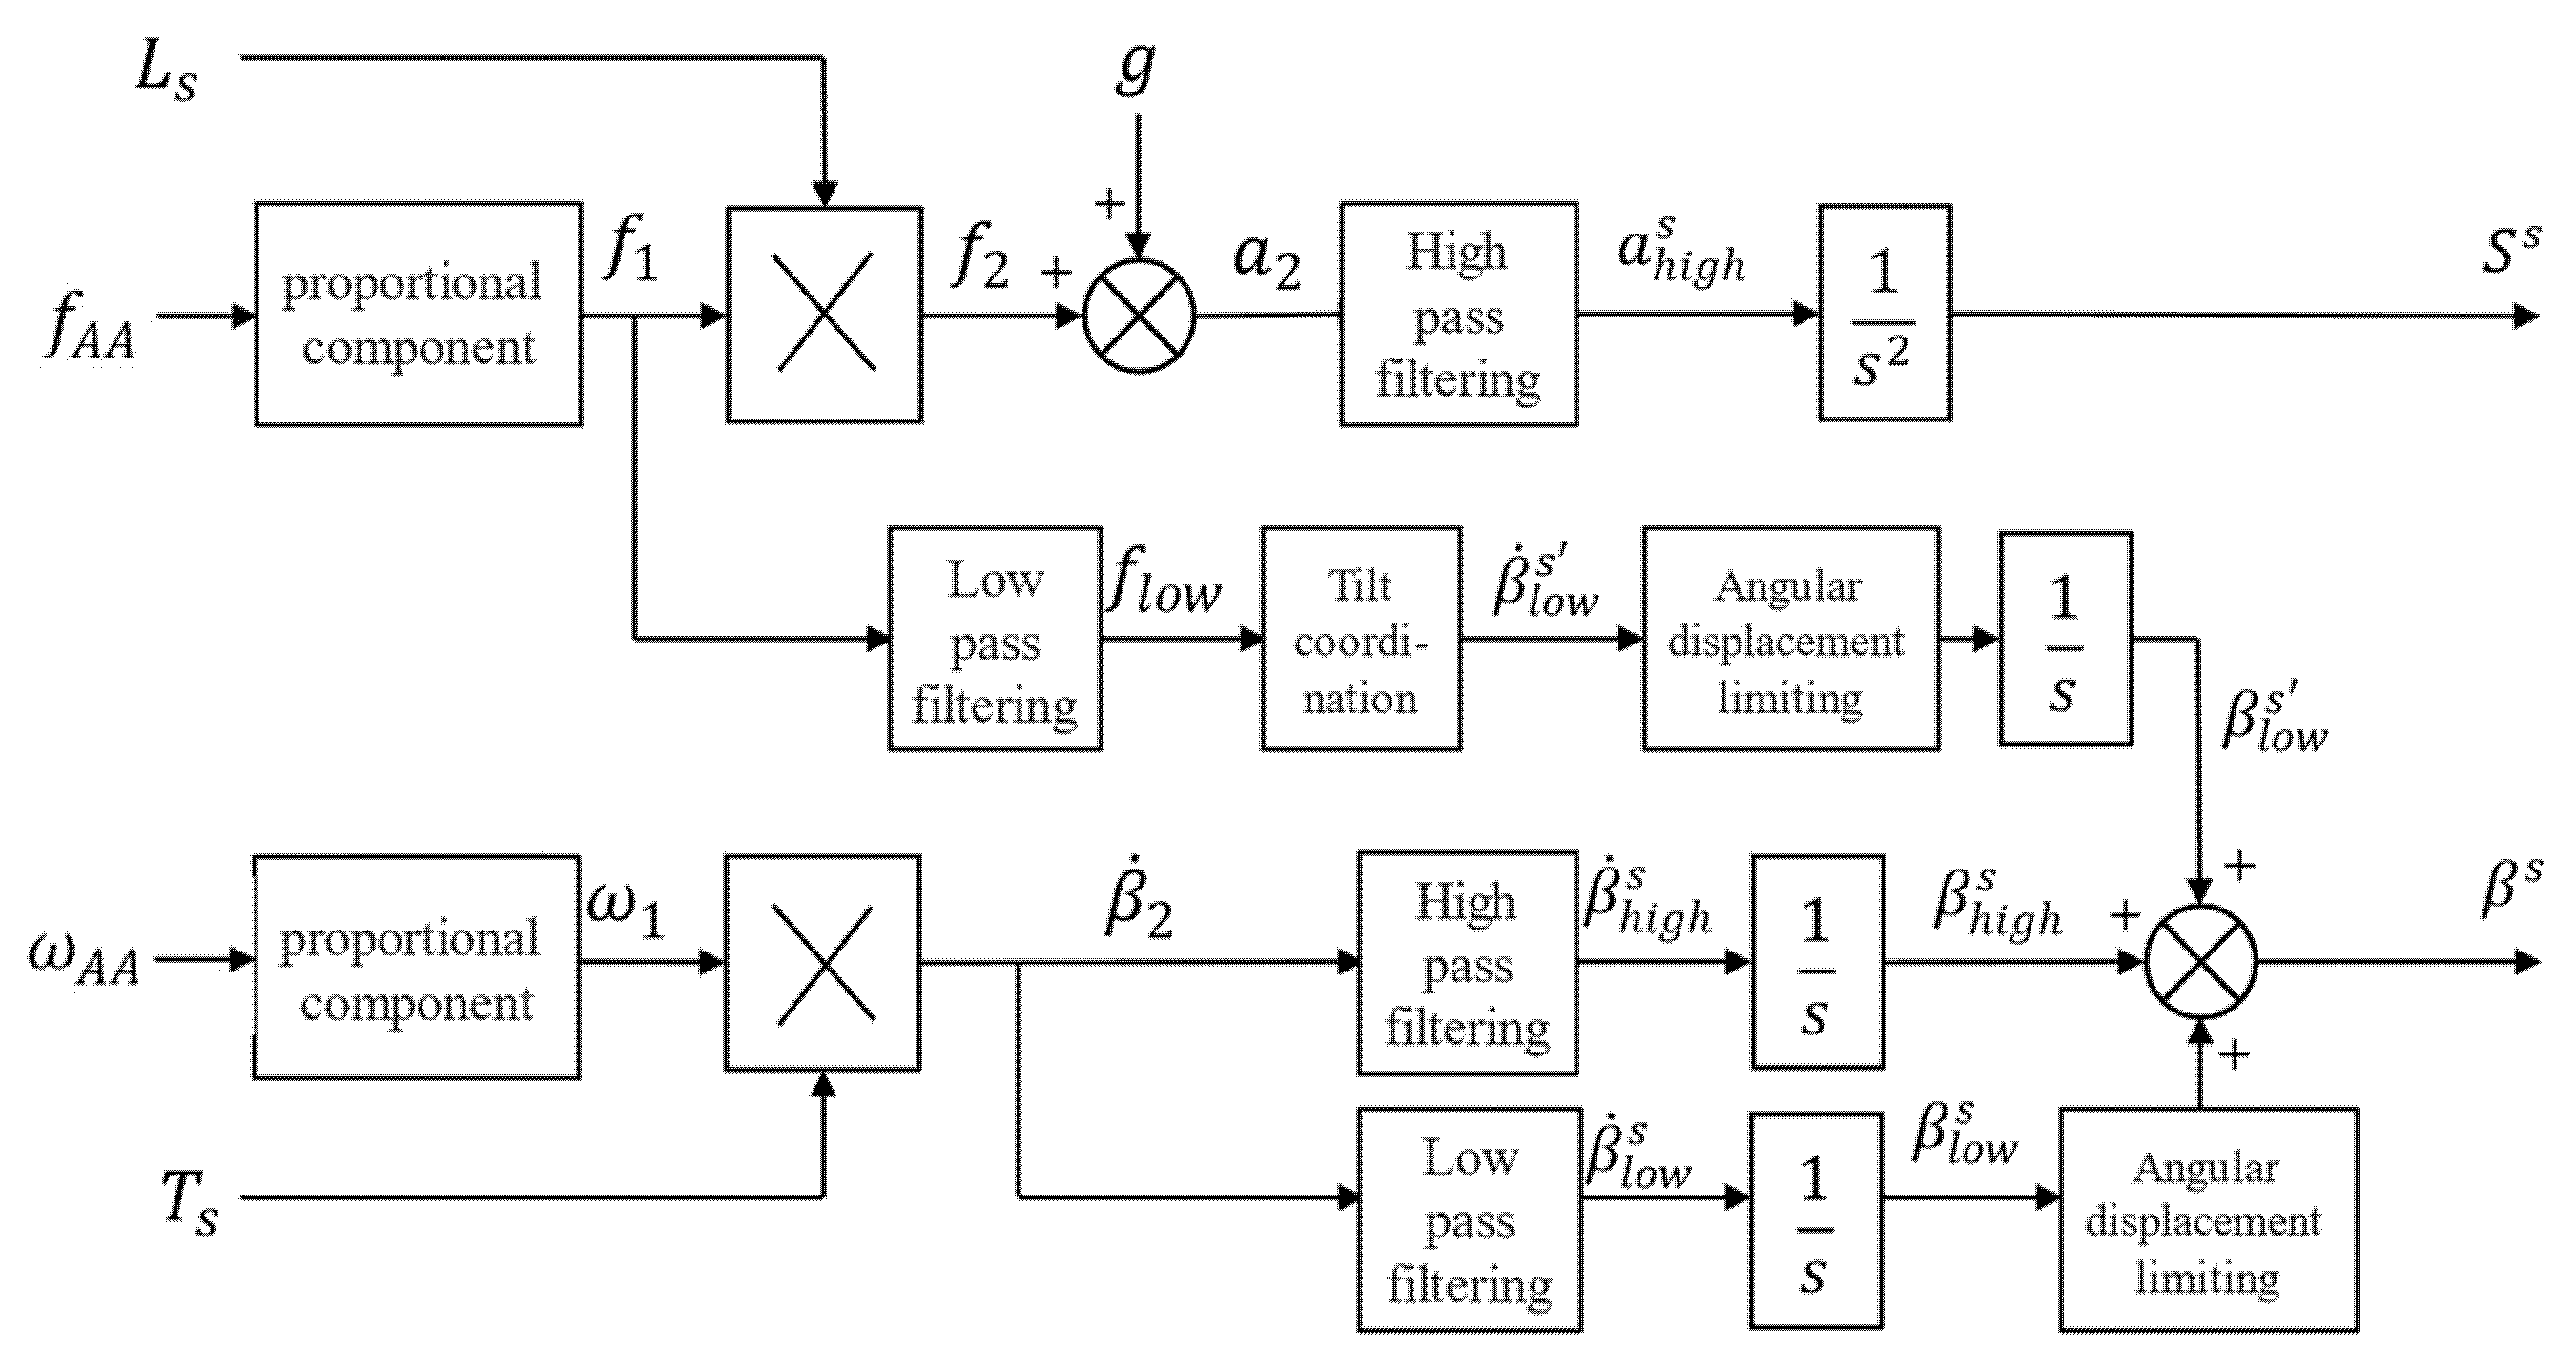
The human vestibular perception system is composed of otoliths and semicircular canals. The driver feels linear acceleration through otoliths, and angular velocity through semicircular canals. When the data is greater than the threshold, the driver will sense movement. To be perceived by humans, the longitudinal and lateral acceleration must be greater than 0.17 m/s2, the vertical acceleration must be greater than 0.28 m/s2, and the pitch, roll, and yaw angular velocity must be greater than 3.6°/s, 3.0°/s, 2.6°/s. The platform moves at an angular velocity lower than the human perception threshold, and the longitudinal and lateral linear acceleration are simulated by the gravity component. Based on this principle, we designed a motion simulation system. The motion parameters of the rover and the linear acceleration perceived by the otolith were used as the input data of the algorithm to obtain the displacement and attitude angle. The flow of the somatosensory feedback algorithm is shown in Figure 6.
Otoliths cannot distinguish the influence of gravity on motion, and the perceived linear acceleration exists in the form of the specific force :
where is the absolute linear acceleration of human body and is the gravitational acceleration.
It is difficult for the human body to perceive tiny angular velocities, so tilt coordination cannot simulate excessively high linear acceleration. It is necessary to scale the kinematic parameters through the scale link. Taking into account the relative position of the vehicle centroid and the vestibule, is the coordinate transformation matrix from the human body coordinate system to the inertial coordinate system, and represents the transformation matrix from the angular velocity to the Euler angle change rate. The linear acceleration and angular acceleration in the human body coordinate system was converted to the inertial coordinate system:
where are the specific force in the human body coordinate system and the inertial coordinate system, respectively. are the angular velocity signals in the human body coordinate system and the inertial coordinate system.
The speed of the rover was low, and the posture change was small. The 6-DOF platform could easily track the high-frequency components of linear acceleration and angular velocities. The motion simulation system tracked high-frequency linear acceleration and used tilt coordination to simulate longitudinal and lateral linear acceleration. We designed the angular velocity-limiting link to ensure that it would be difficult for the human body to perceive posture changes caused by tilt coordination. We limited the angular displacement caused by the low-frequency angular velocity to ensure that the 6-DOF platform was not affected by interference factors.
It is necessary to ensure that the platform returned to the initial position without being perceived after the pose change occurred. We designed a third-order high-pass filter to filter the linear acceleration in the inertial coordinate system. The transfer function is as follows:
is the input line acceleration, is the filtered acceleration, and are the natural cut-off frequencies of the first and second order links respectively, and is the damping ratio; here, .
We used a second-order low-pass filter to construct the tilt coordination link. The transfer function is as follows:
is the specific force in the human body coordinate system, is the output of low-pass filter, is the natural cut-off frequency of the second-order low-pass filter, and is the damping ratio—which was set as 1.
When the vehicle is driving on the moon, the posture angle changes in various directions are quite different. The yaw angle has a large variation range, so we used a first-order filter to filter the pitch and roll angles, and a second-order filter to filter the yaw angle. The transfer functions of the first-order high-pass filter and low-pass filter are as follows:
is the angular velocity in the inertial coordinate system and and are the output of the first-order high pass filter and low-pass filter, respectively. and are the natural cut-off frequencies.
The transfer functions of the second-order high-pass filter and low-pass filter are as follows:
and are the natural cut-off frequencies of the high-pass filter and the low-pass filter, and and are the damping ratios—set here is 1.
After each component is obtained through the filter, the tilt coordination link converts the low-frequency linear acceleration component into the tilt angle. The formula is:
is the low frequency vertical and horizontal component of the proportional input, and is the pitch angle and roll angle of the tilt coordination (in Figure 6, they are uniformly represented by ).
We passed each component through the limiting and integration link and superimposed it. We calculated the angular displacement and linear displacement of 3-DOF. The extension of each hydraulic cylinder was obtained through the inverse kinematics solution to drive the motion platform.
2.2.3. Posture Adjustment Module
The rover’s posture adjustment module—that is, the suspension—is a mechanism that connects the wheels and the body of the rover. Its functions include power transmission, buffering, and vibration reduction [18], which affect the performance, stability, ride comfort, and anti-overturning ability of the rover. We designed the posture adjustment module. Through the above work, it was ensured that the astronauts will have a stable and comfortable driving experience when the rover works on the rugged lunar surface.
According to the connection between the wheels and the body, the suspension was divided into independent and non-independent suspensions. We used four-wheel independent semi-active suspension to ensure comfort and reliability while reducing energy consumption.
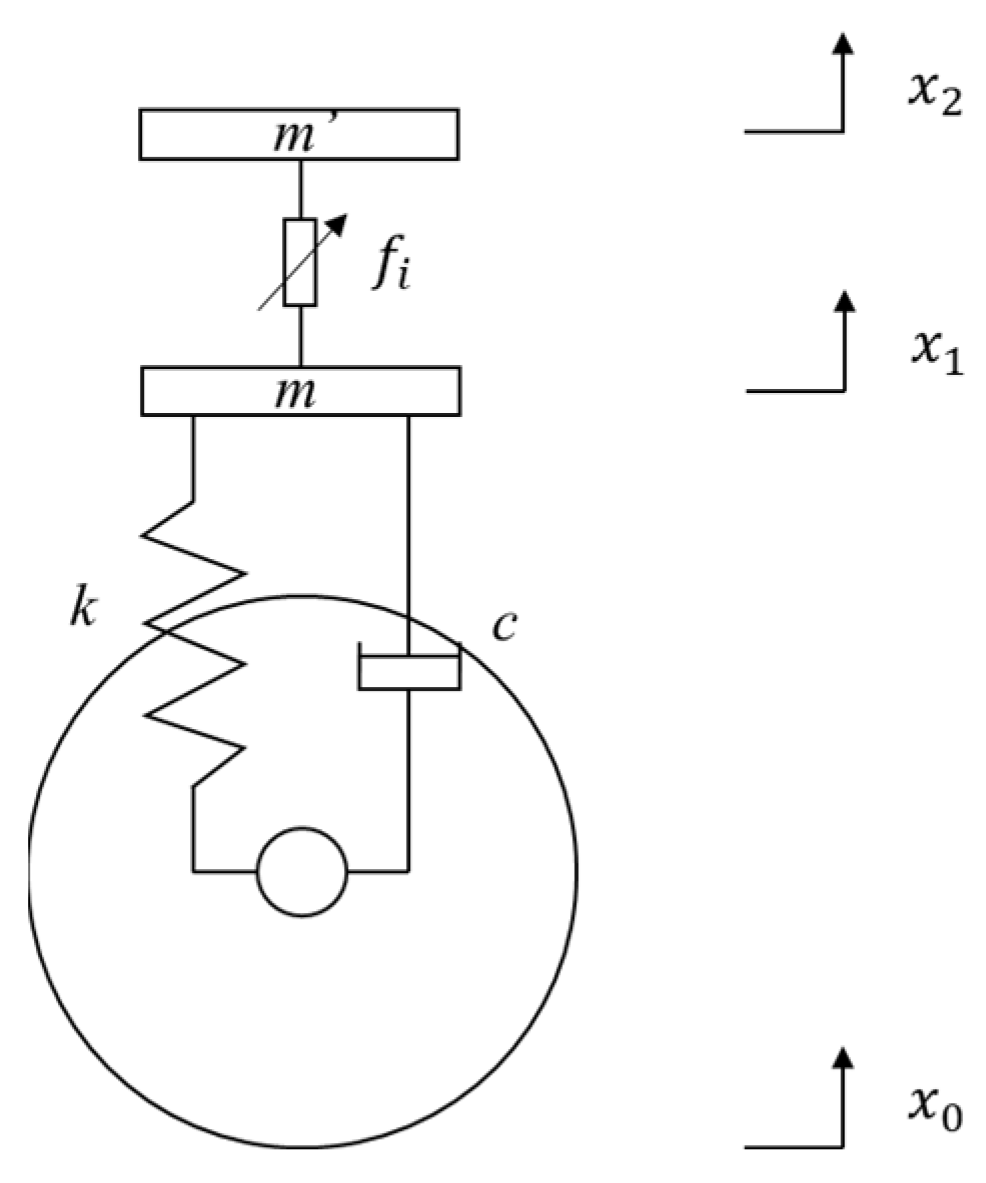
The PID control model of the semi-active posture adjustment system is shown in Figure 7. is the spring stiffness, is the damping coefficient of the shock absorber, is the driving force of the wheel generated by PID adjustment, is the excitation displacement, is the displacement of the suspension connection, and is the body displacement.
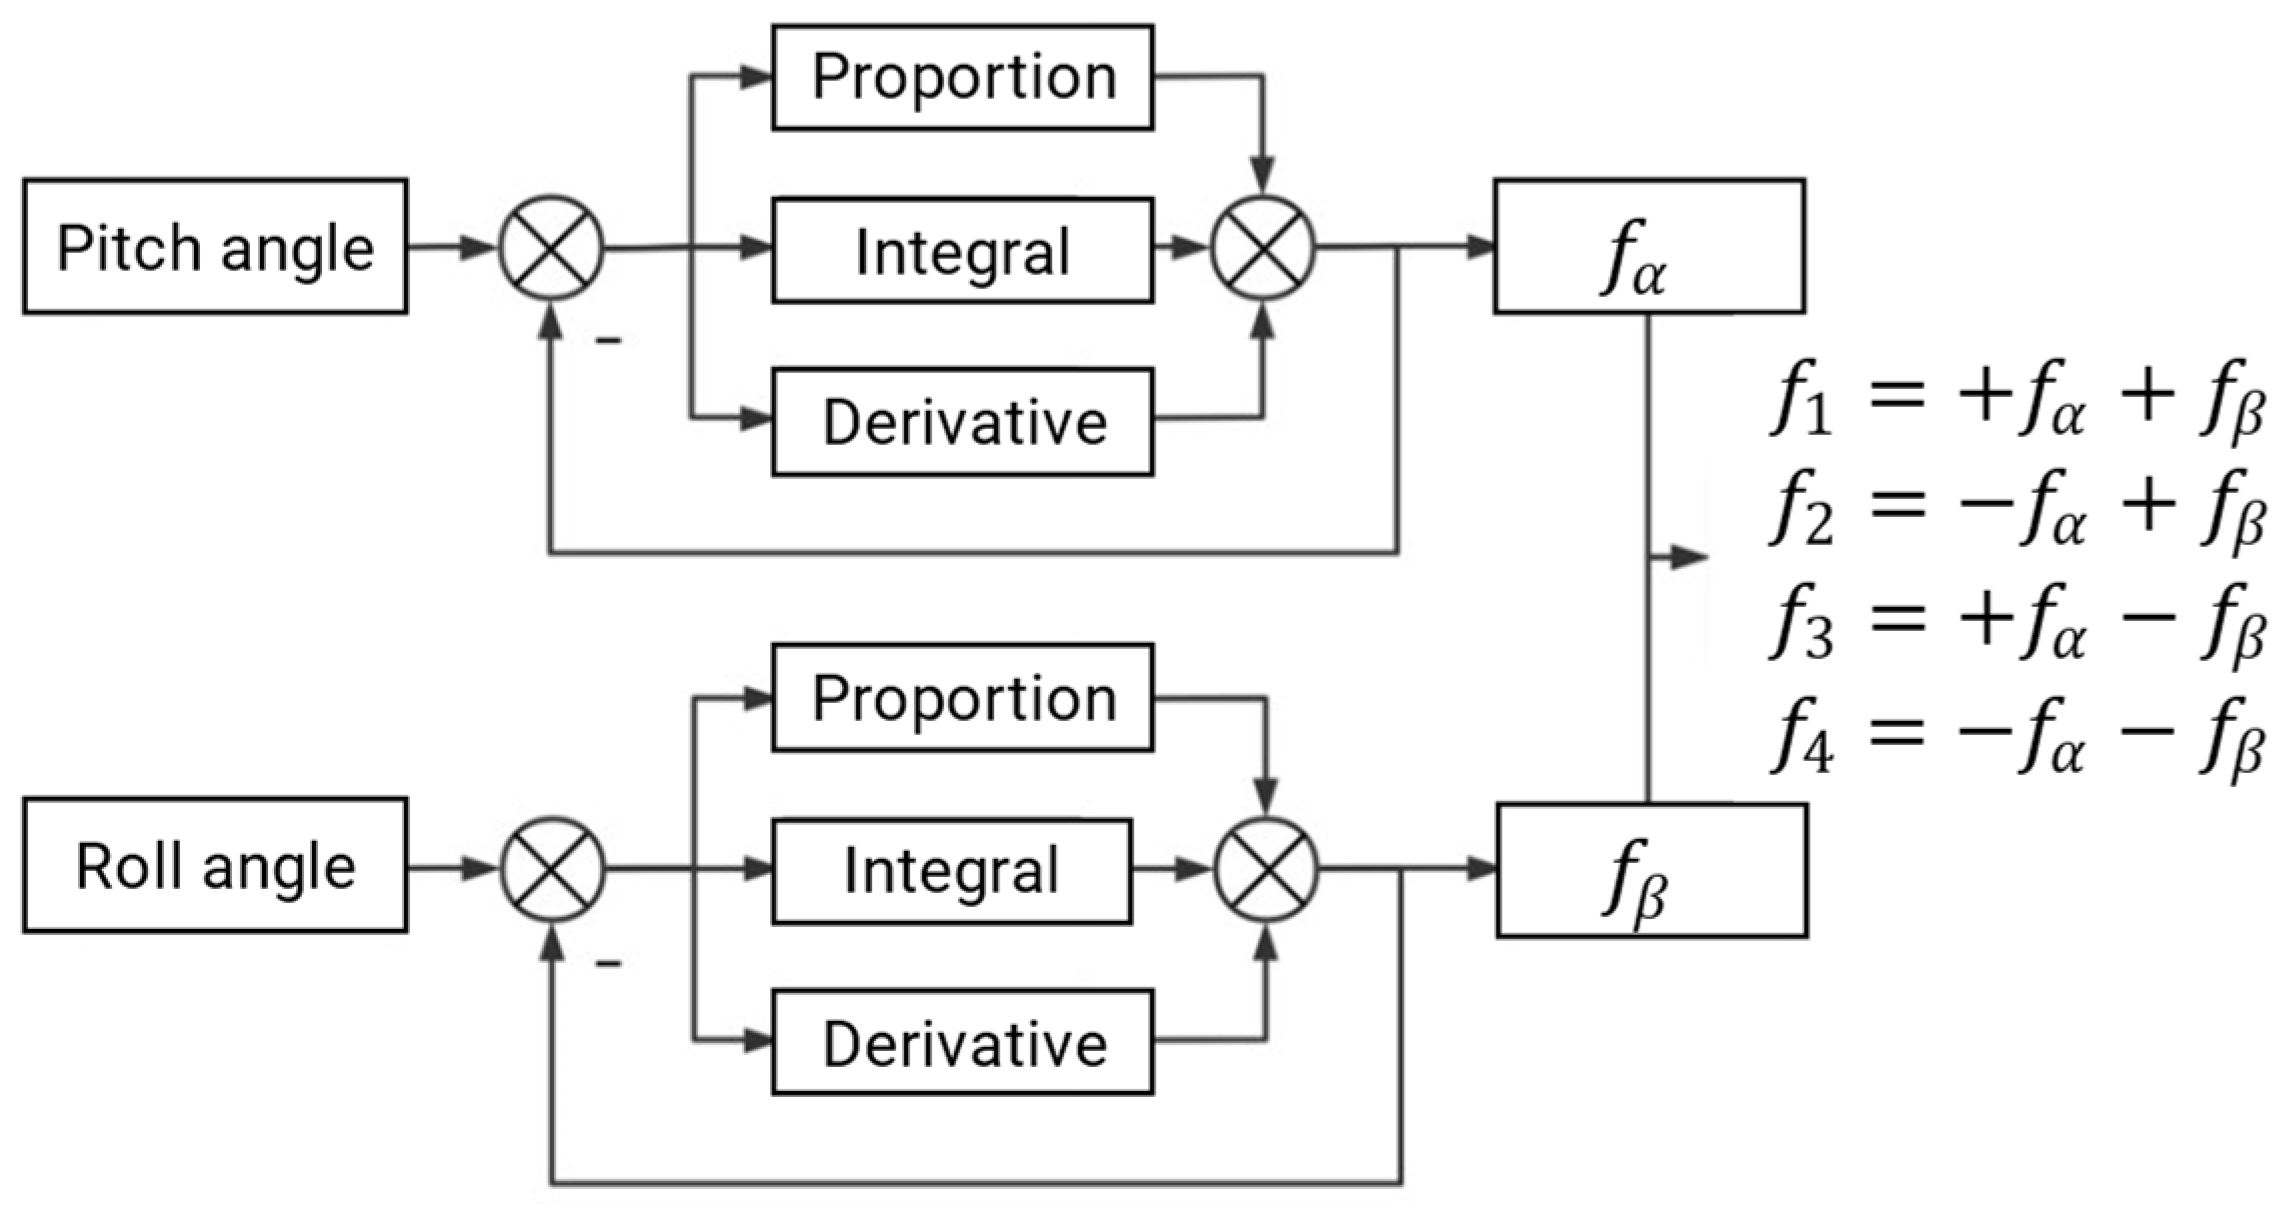
To realize the leveling of the car body, the car body inclination was regarded as the object of PID control to reduce turbulence. PID control is a commonly used control method in semi-active suspensions and has strong applicability. Its structural framework is shown in Figure 8. In Unity 3D, we used the collider component and wrote PID adjustment scripts to carry out the simulation:
We took the pitch angle and roll angle of the car body as the input of the PID control, and generated the driving force of the wheel as the output of the system. The output was and , which obtained after different linear combinations. The structure diagram of the PID control is shown in Figure 8.
2.2.4. Virtual Sensors and Driving Warning
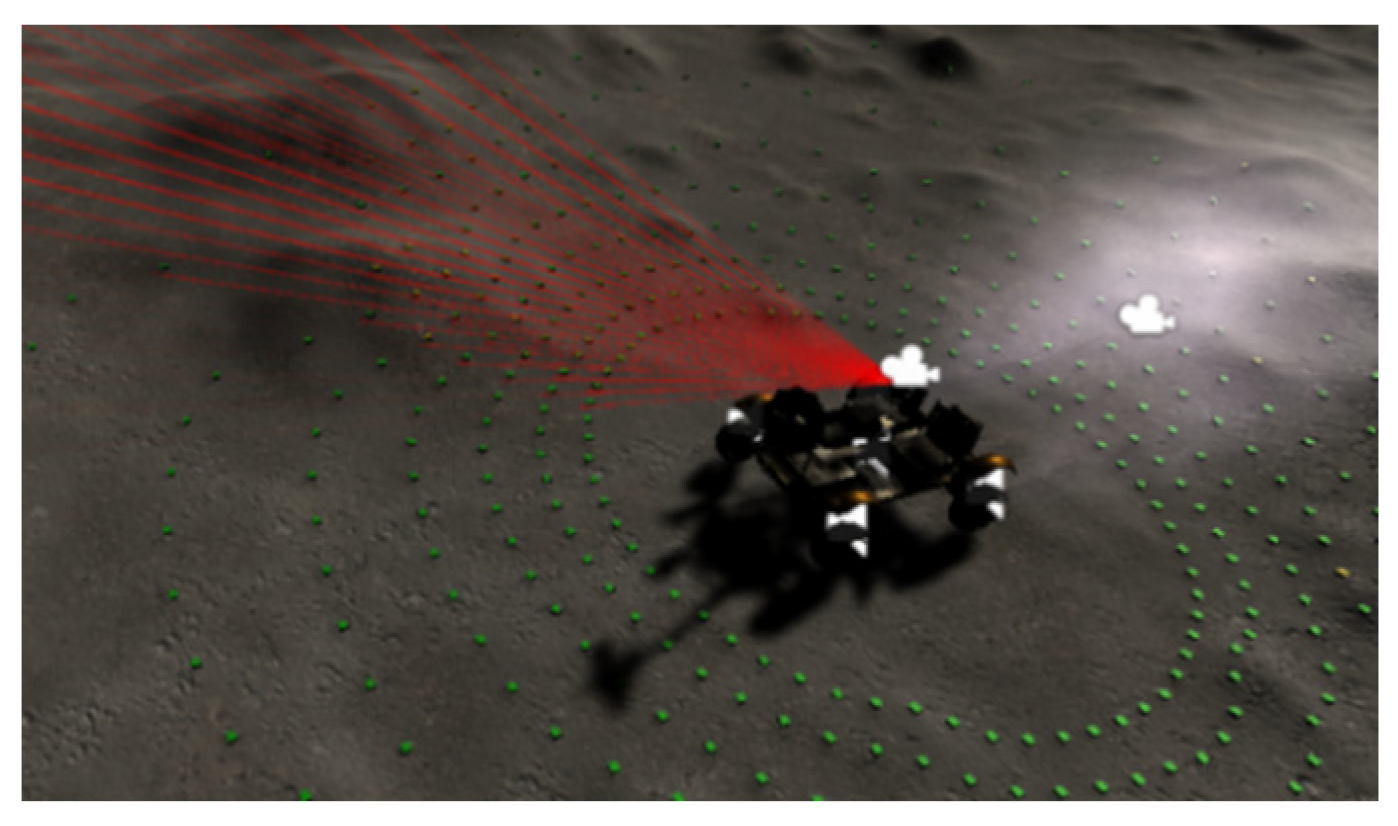
We installed virtual sensors on the lunar rover to collect the terrain data of the surrounding environment. The sensor model was based on the VLP-32 three-dimensional lidar developed by Velodyne and implemented using the ray detection function in Unity.
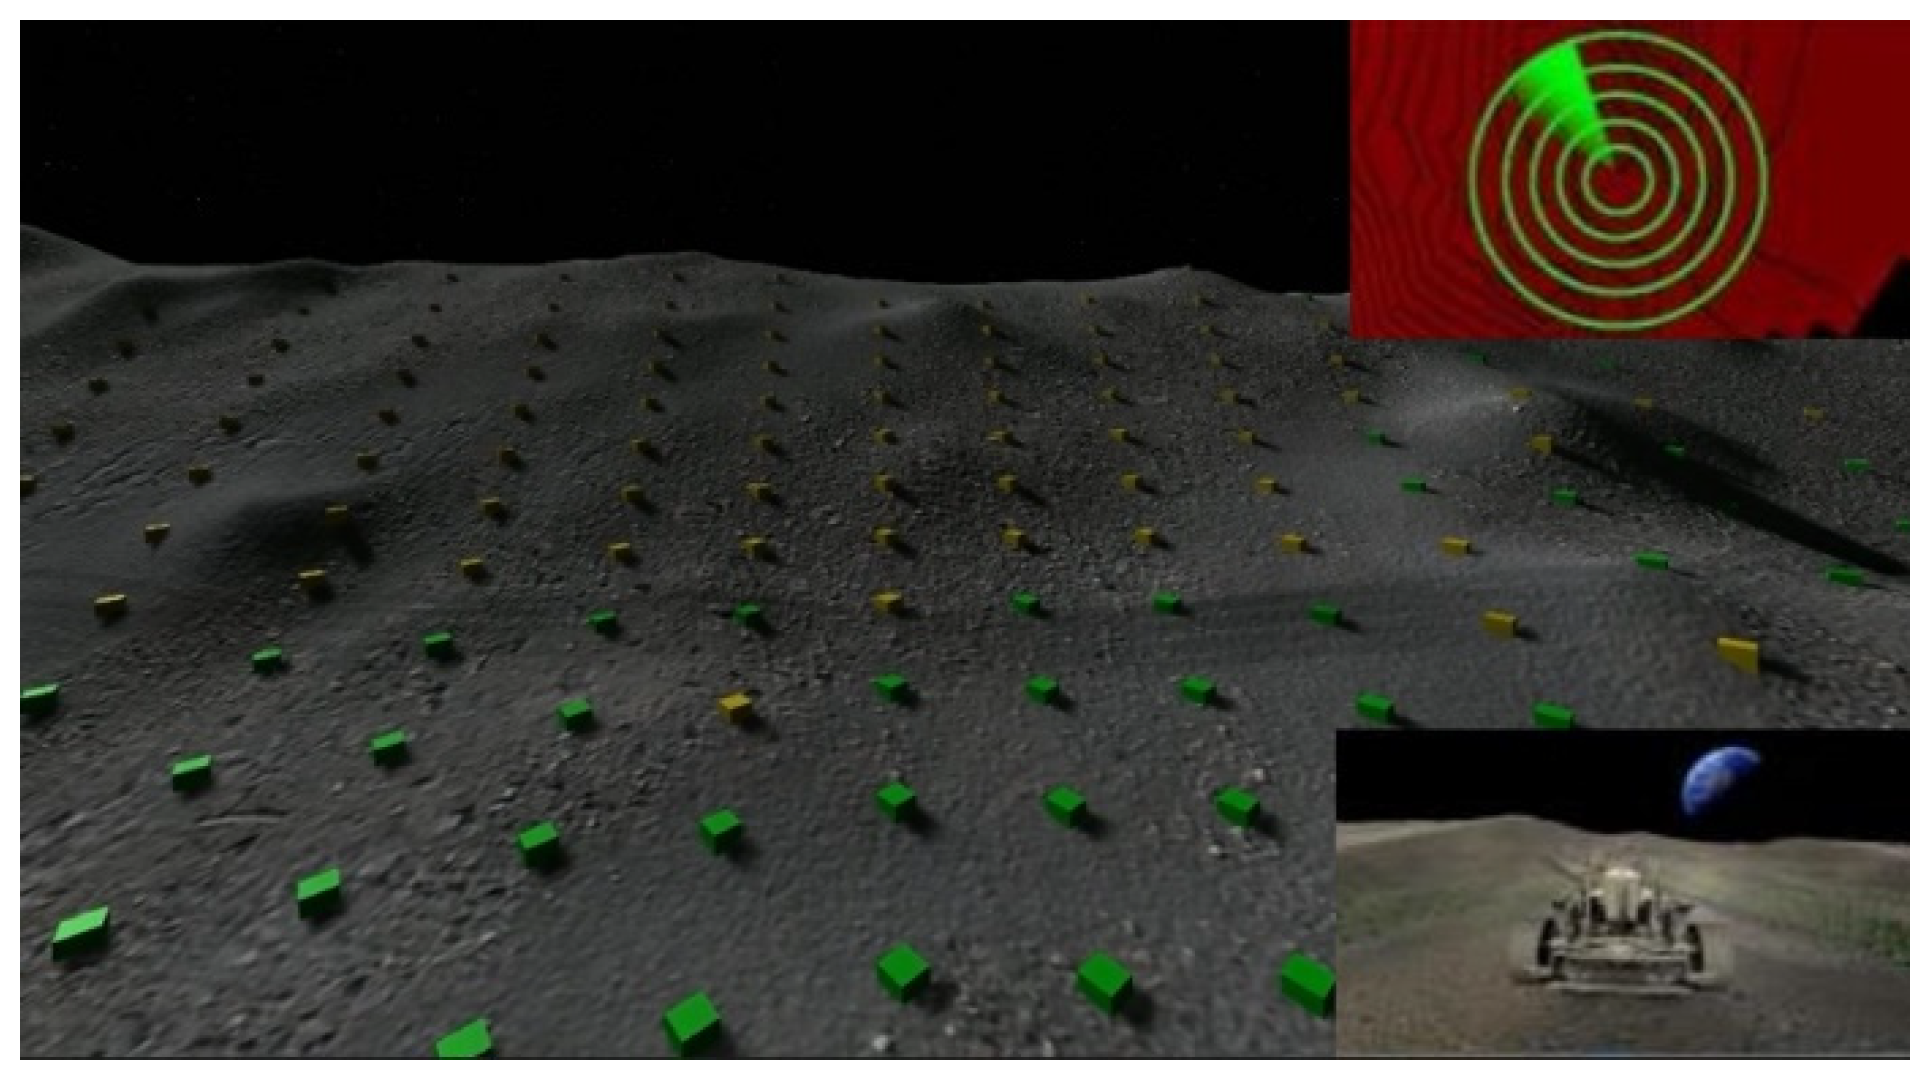
The VLP-32 lidar scanned the lunar terrain with a fixed angular resolution. After scanning for a week, the angle and distance data of a set of points were obtained and converted into coordinates in the global coordinate system. We generated squares of different colors according to the difficulty of driving on the terrain, and used this as a marker. The rendering effect of the virtual sensor is shown in Figure 9.
We generated mark points according to actual operation requirements, and the classification method is shown in Table 1. The effect of driving warnings is shown in Figure 10.
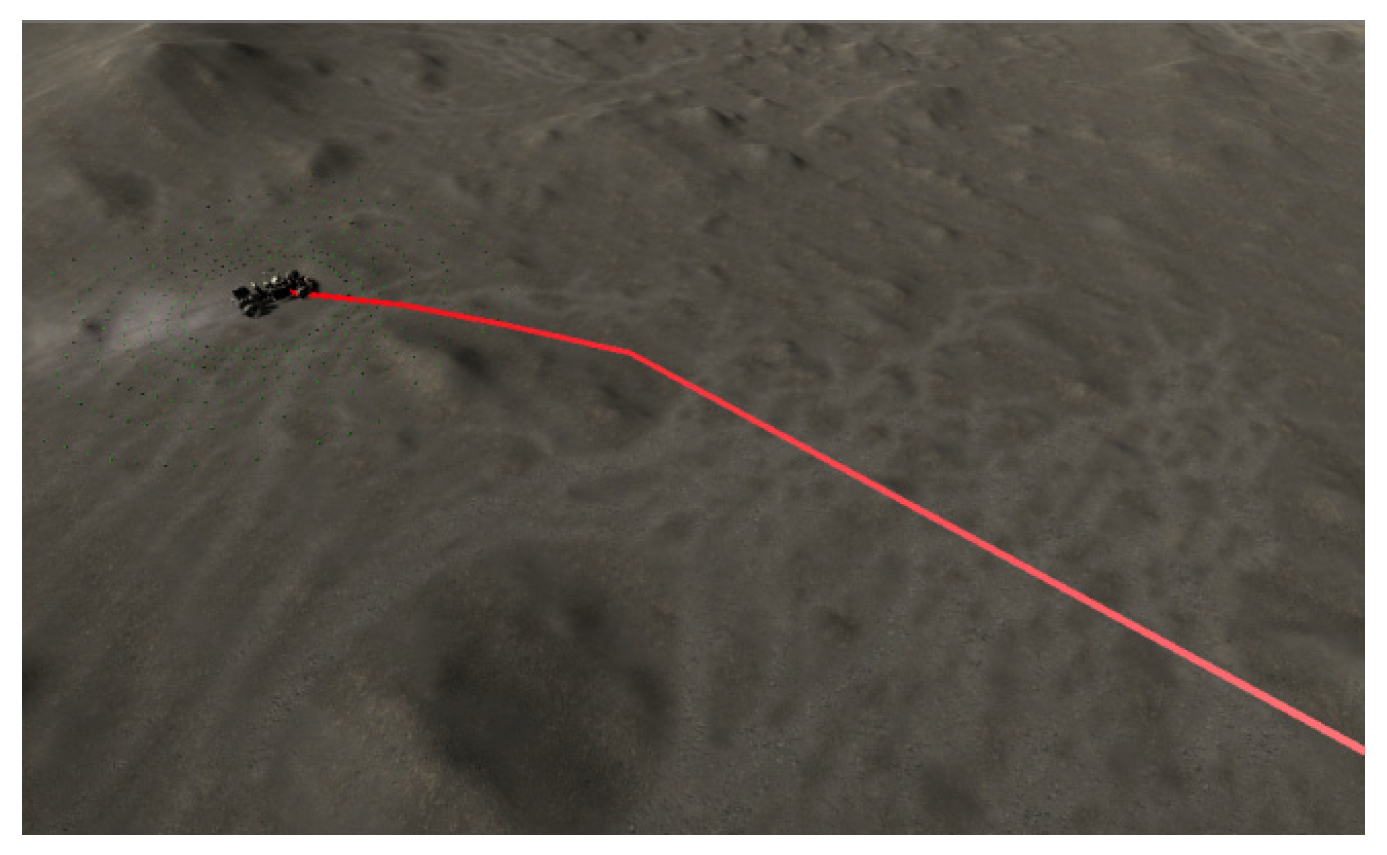
With the completion of the detection, the system carried out path planning according to the terrain data obtained by lidar and calculated the best scheme to reach the target point. We used the A* algorithm for path planning [21]. The algorithm considers the distance cost and the slope cost calculated from radar data, and constantly searches for unknown nodes according to the heuristic function . The formula is as follows:
where represents the exact path from the starting point to node n, is the estimated remaining path from node n to the target point, is the horizontal distance from the starting point to node n, is the vertical distance from the starting point to node n, and is the slope parameter. The results of the path planning are shown in Figure 11.
2.3. Multi-Channel Human–Computer Interactions
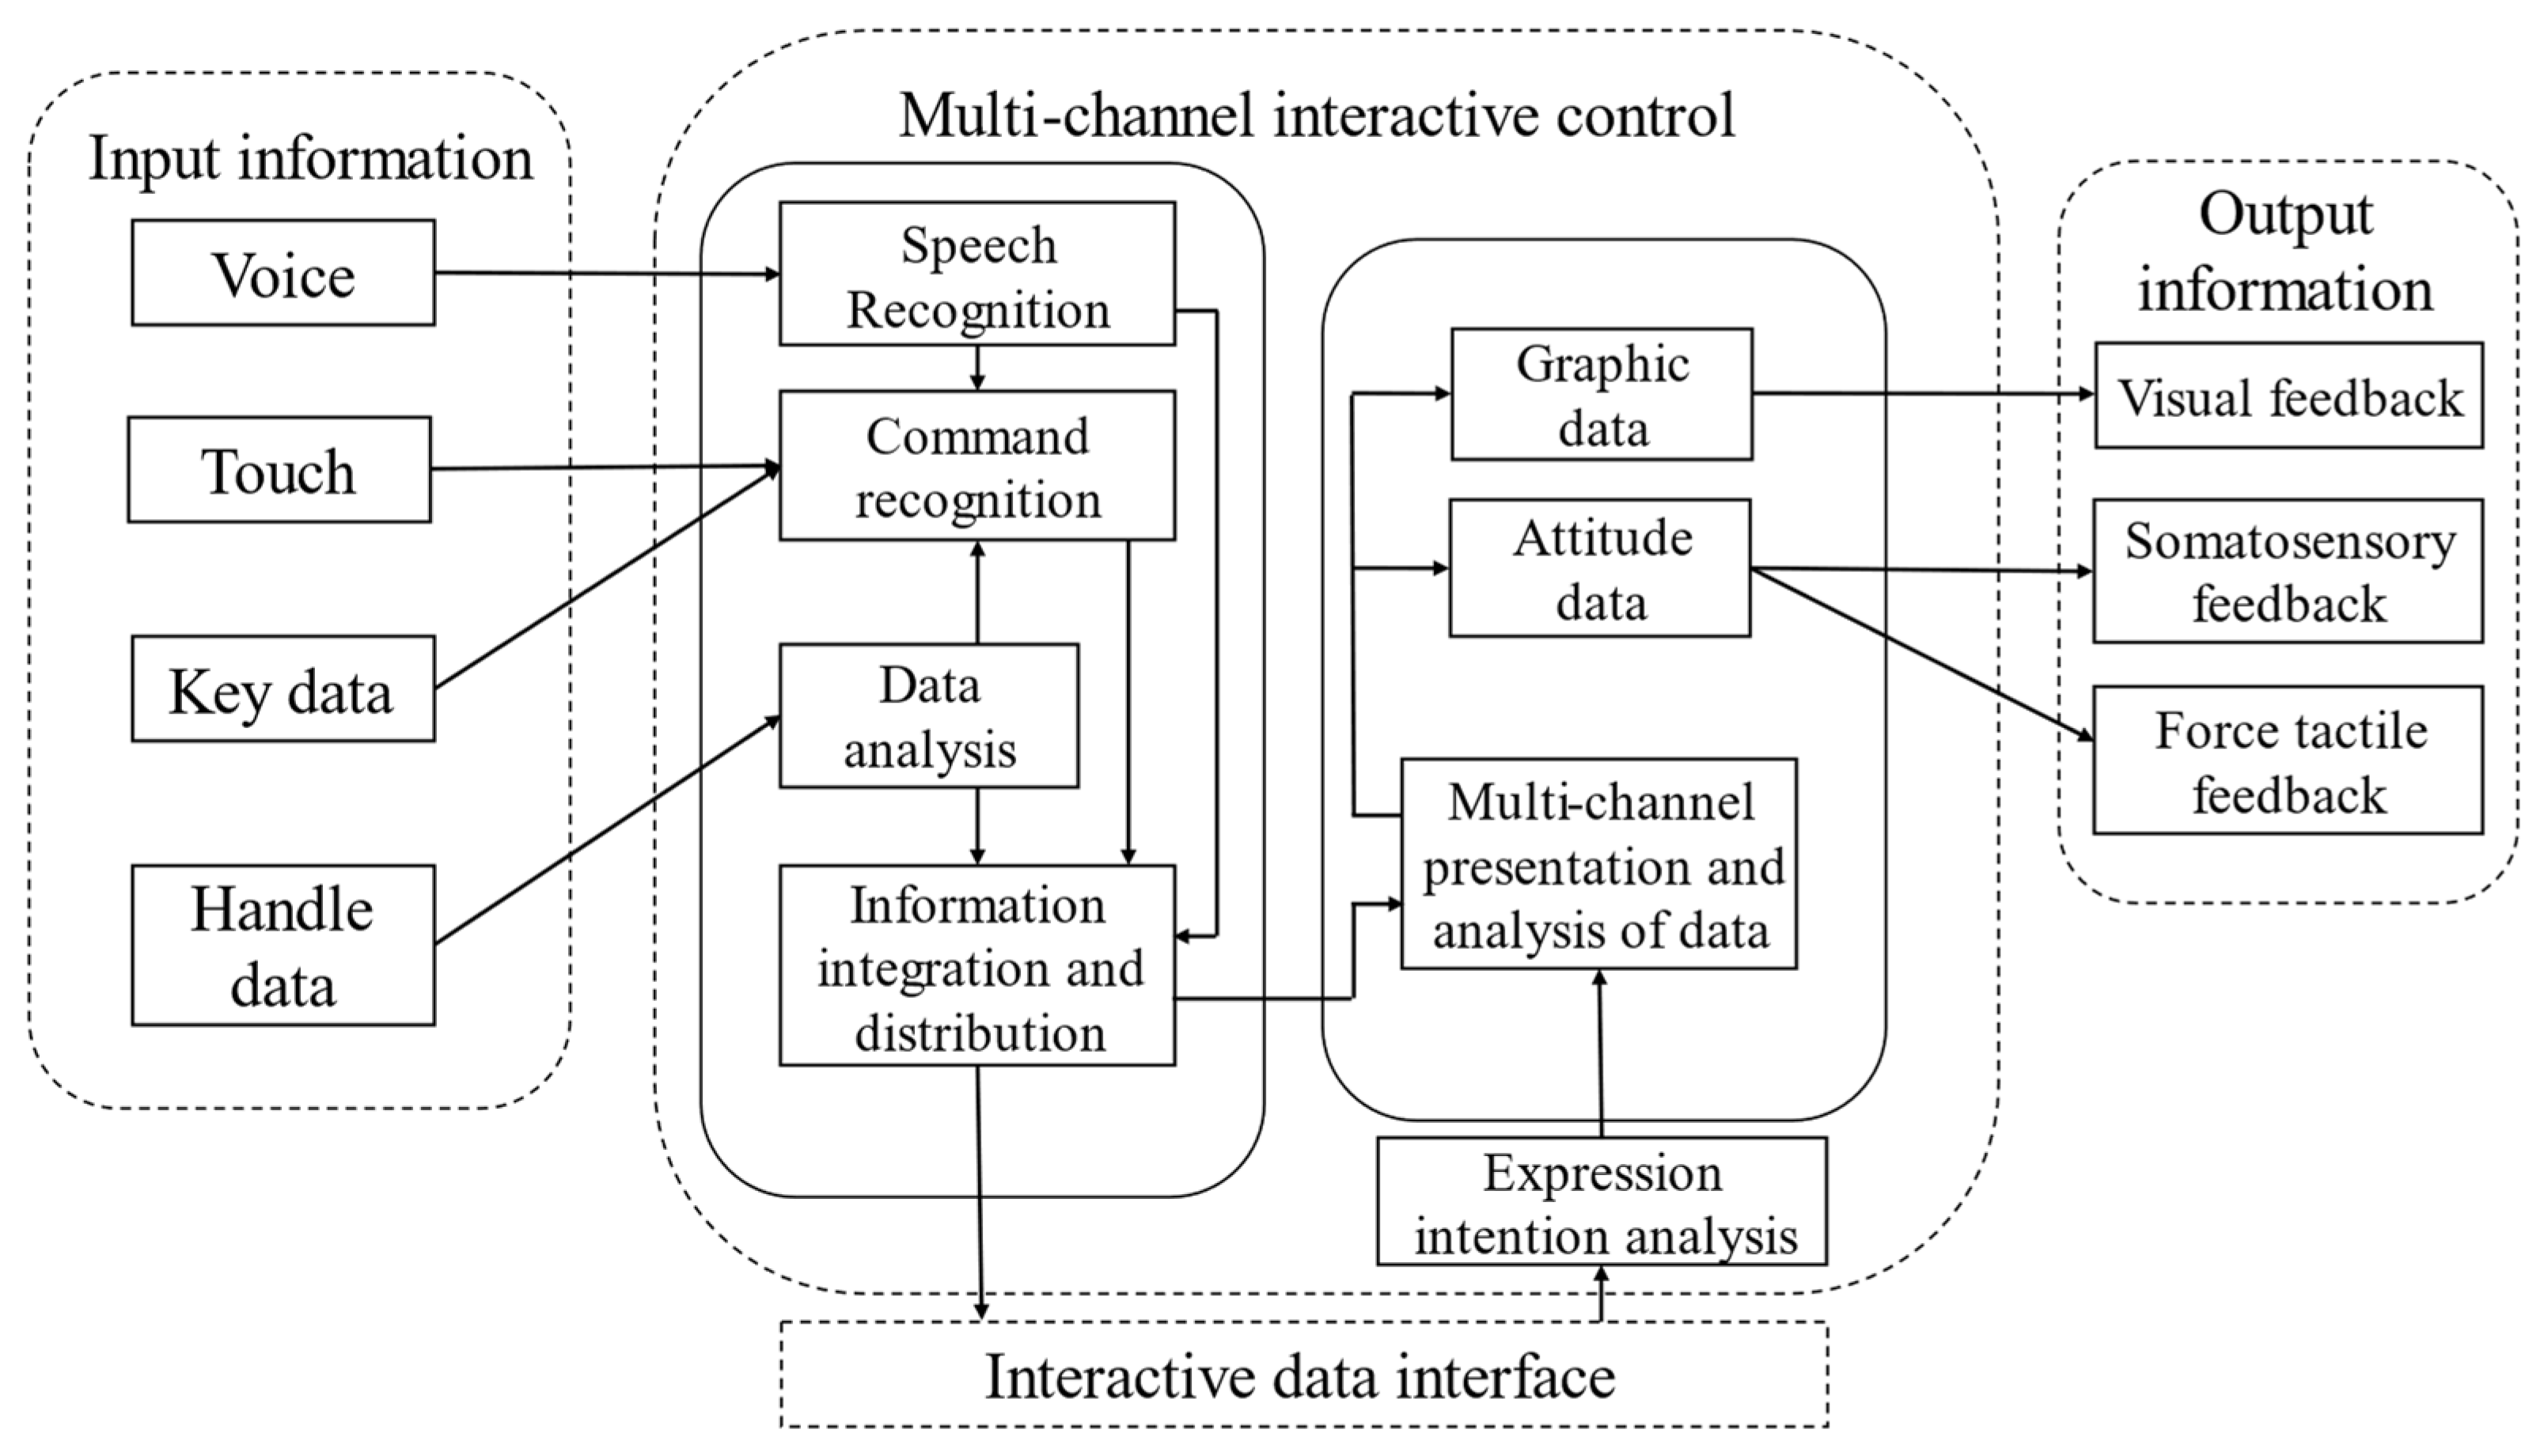
To improve the efficiency of interactive control in the enclosed cockpit, we designed a human–computer interaction module. Astronauts could interact with the rover through the integration of five channels of vision, force, voice, touch, and somatosensory perception. The process is shown in Figure 12.
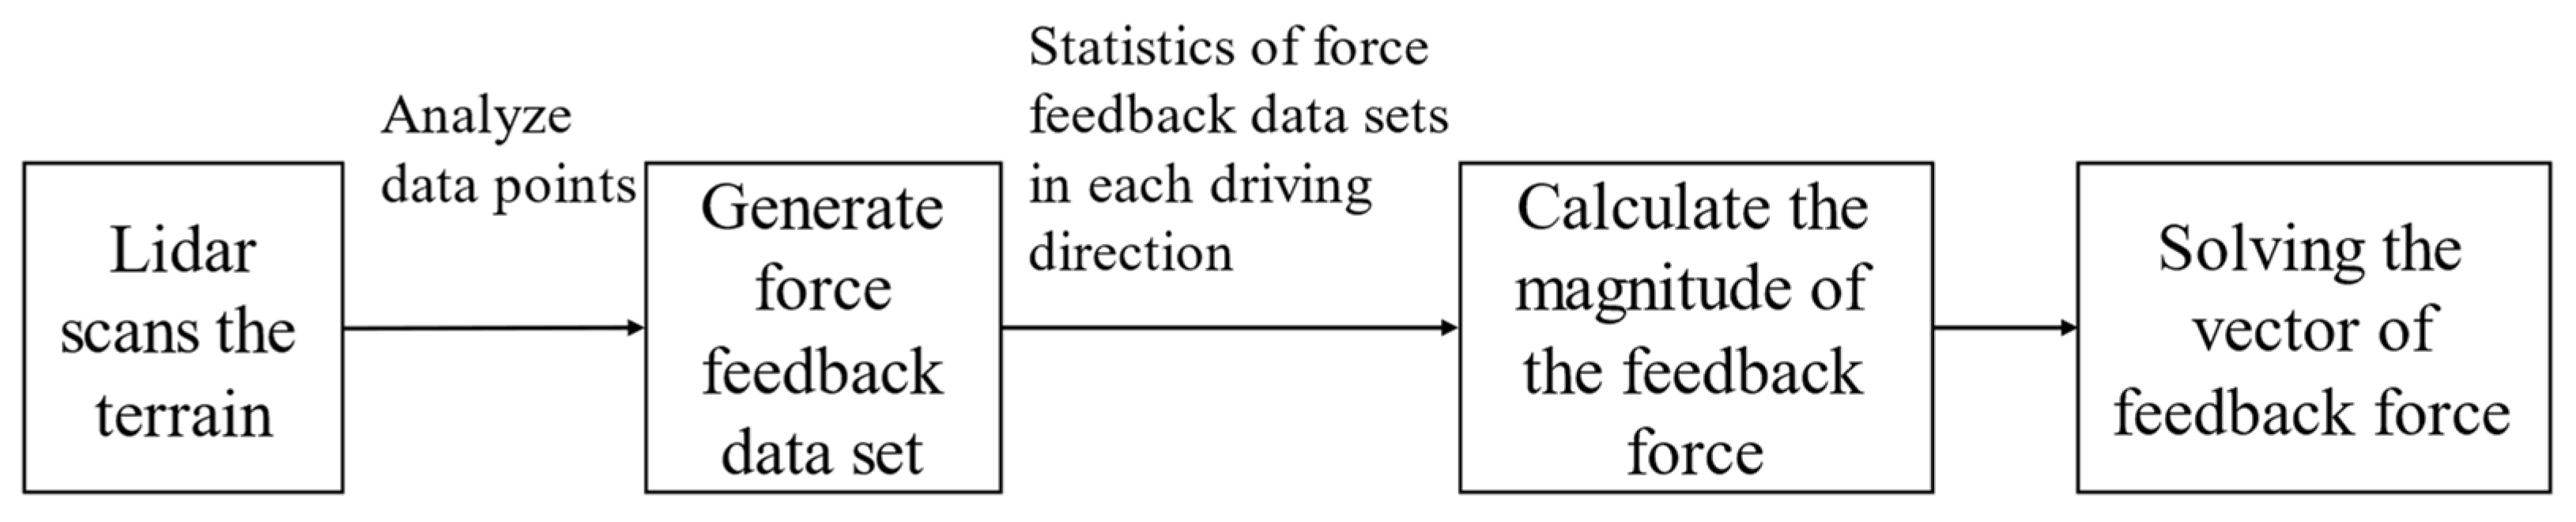
The handle feedbacks the force and damping based on the terrain data obtained by the virtual sensor. This function can effectively assist astronauts in driving, ensuring driving safety and operating efficiency. The flow of the force feedback solution algorithm is shown in Figure 13.
In Section 2.2.4, we marked the data points with different colors and generated a color set (purple; blue; green; yellow; red). When calculating the feedback force, we mapped the five colors to the force feedback level (−2; −1; 0; 1; 2). We divided the driving direction into 5 areas, as shown in Figure 14.
Within 15 m around the rover, we counted and summed the force feedback levels of all data points in five driving directions. Feedback force was calculated as follows:
where , representing each driving direction. K is the proportional coefficient of force feedback, and is the force feedback level of terrain data points.
According to the horizontal and vertical position values of the handle, we calculated the expected travel direction and speed of the rover. The target driving area was judged according to the expected value of the travel direction, and the feedback force calculated as:
where N is the total number of driving areas, and are unit vectors in the horizontal and vertical directions, and the range of and is [−1, 1].
We decomposed the feedback force along the driving direction and its vertical direction, and fed it back to the horizontal and vertical directions of the handle, respectively. Combining force feedback and visual information, astronauts could intuitively judge the terrain and choose a safe driving direction.
The vision system was composed of three displays, which provided the astronauts with driving perspective, overhead perspective, vehicle parameters, and operating information. The voice module recognized the voice of the astronaut and parsed instructions. The console was equipped with buttons and knobs. We used a touch screen and designed a user interface to realize touch functions. The above interaction methods were combined to realize the start and emergency stop of the rover, the control of the posture adjustment module, the control of the lidar, and the adjustment of the functional parameters.
We integrated multiple interactive methods including voice, touch, and traditional buttons to enable astronauts to complete their operations more conveniently and effectively, according to mission requirements and their conditions. The above research has improved the safety and reliability of rover control. We combined visual and force feedback to provide intuitive lunar terrain feedback and rich interactive information for astronauts in a closed cockpit, which helps astronauts to perceive the environment.
3. Simulation Results
3.1. Real Time Capability of the System
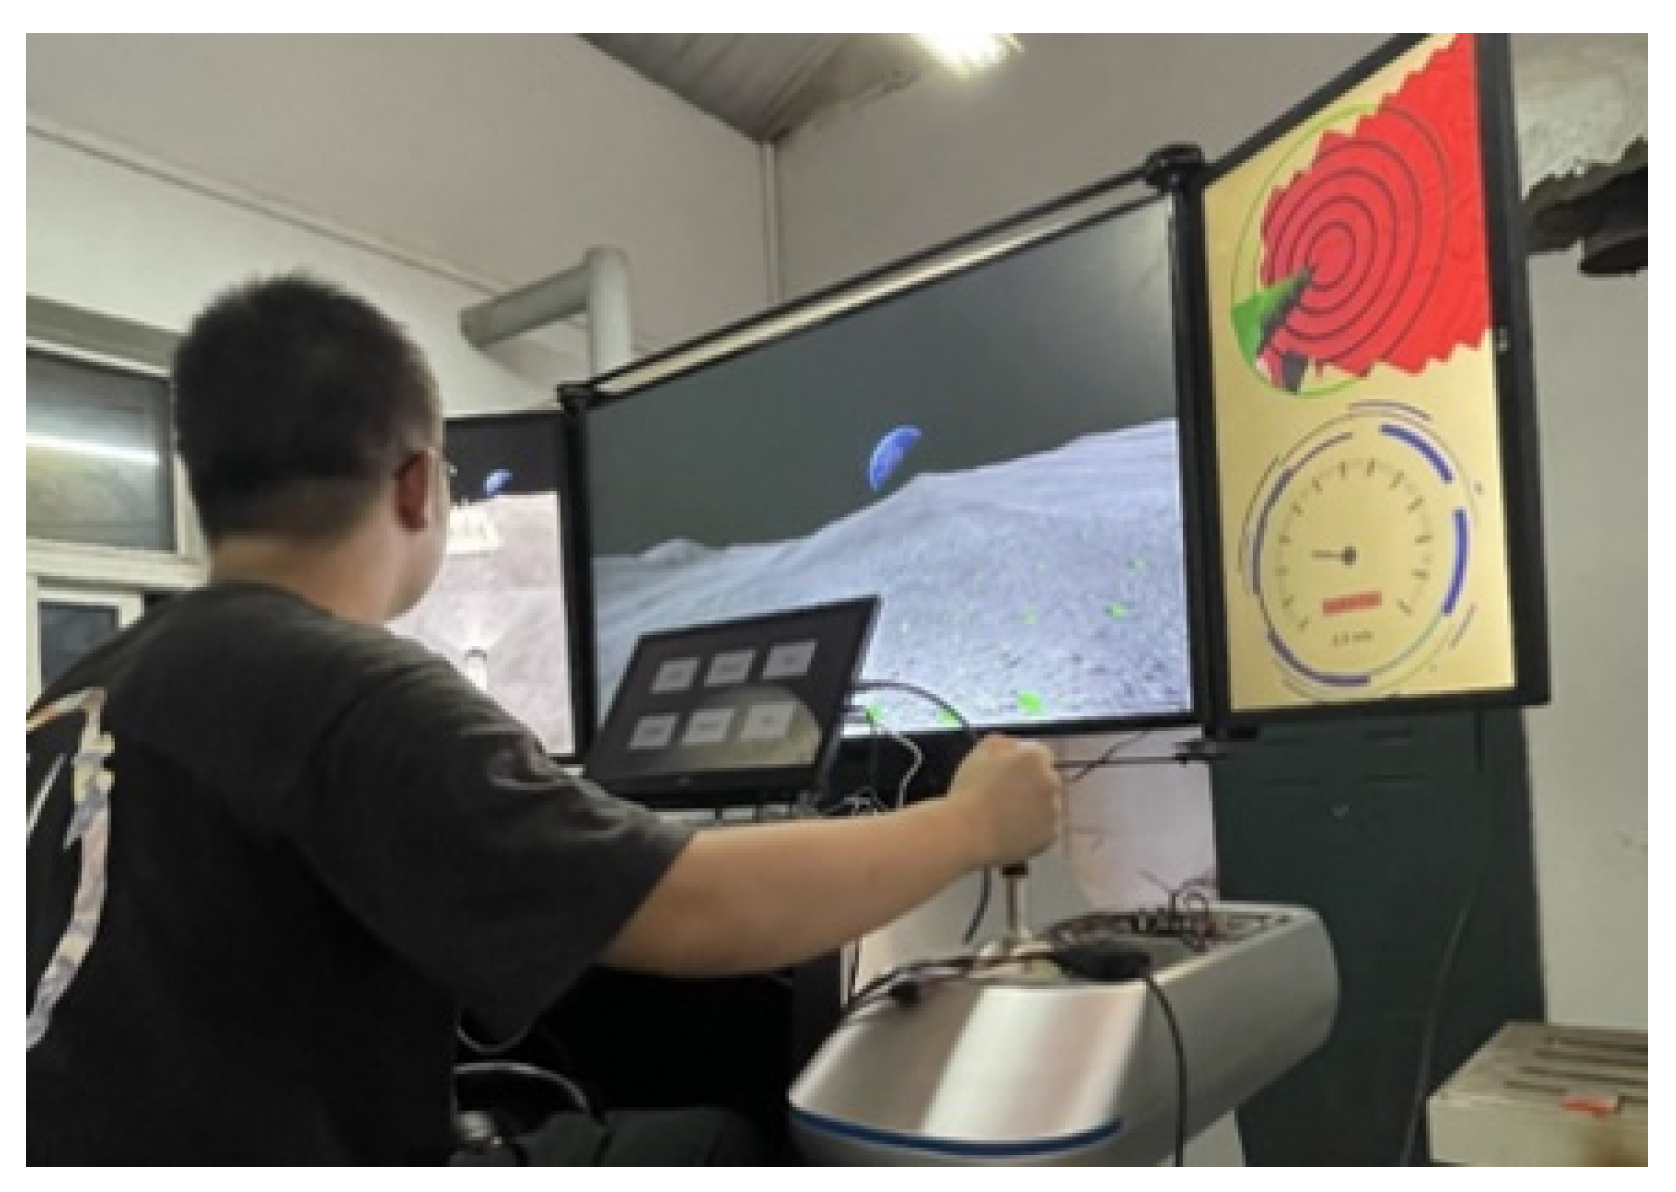
The hardware of this system consisted of a 6-DOF platform and a console, as shown in Figure 15. An operating platform was built above the 6-DOF platform, which included a vision system, a force feedback handle, a touch screen, and buttons. The system provided a realistic and tangible sensory simulation environment for the astronauts.
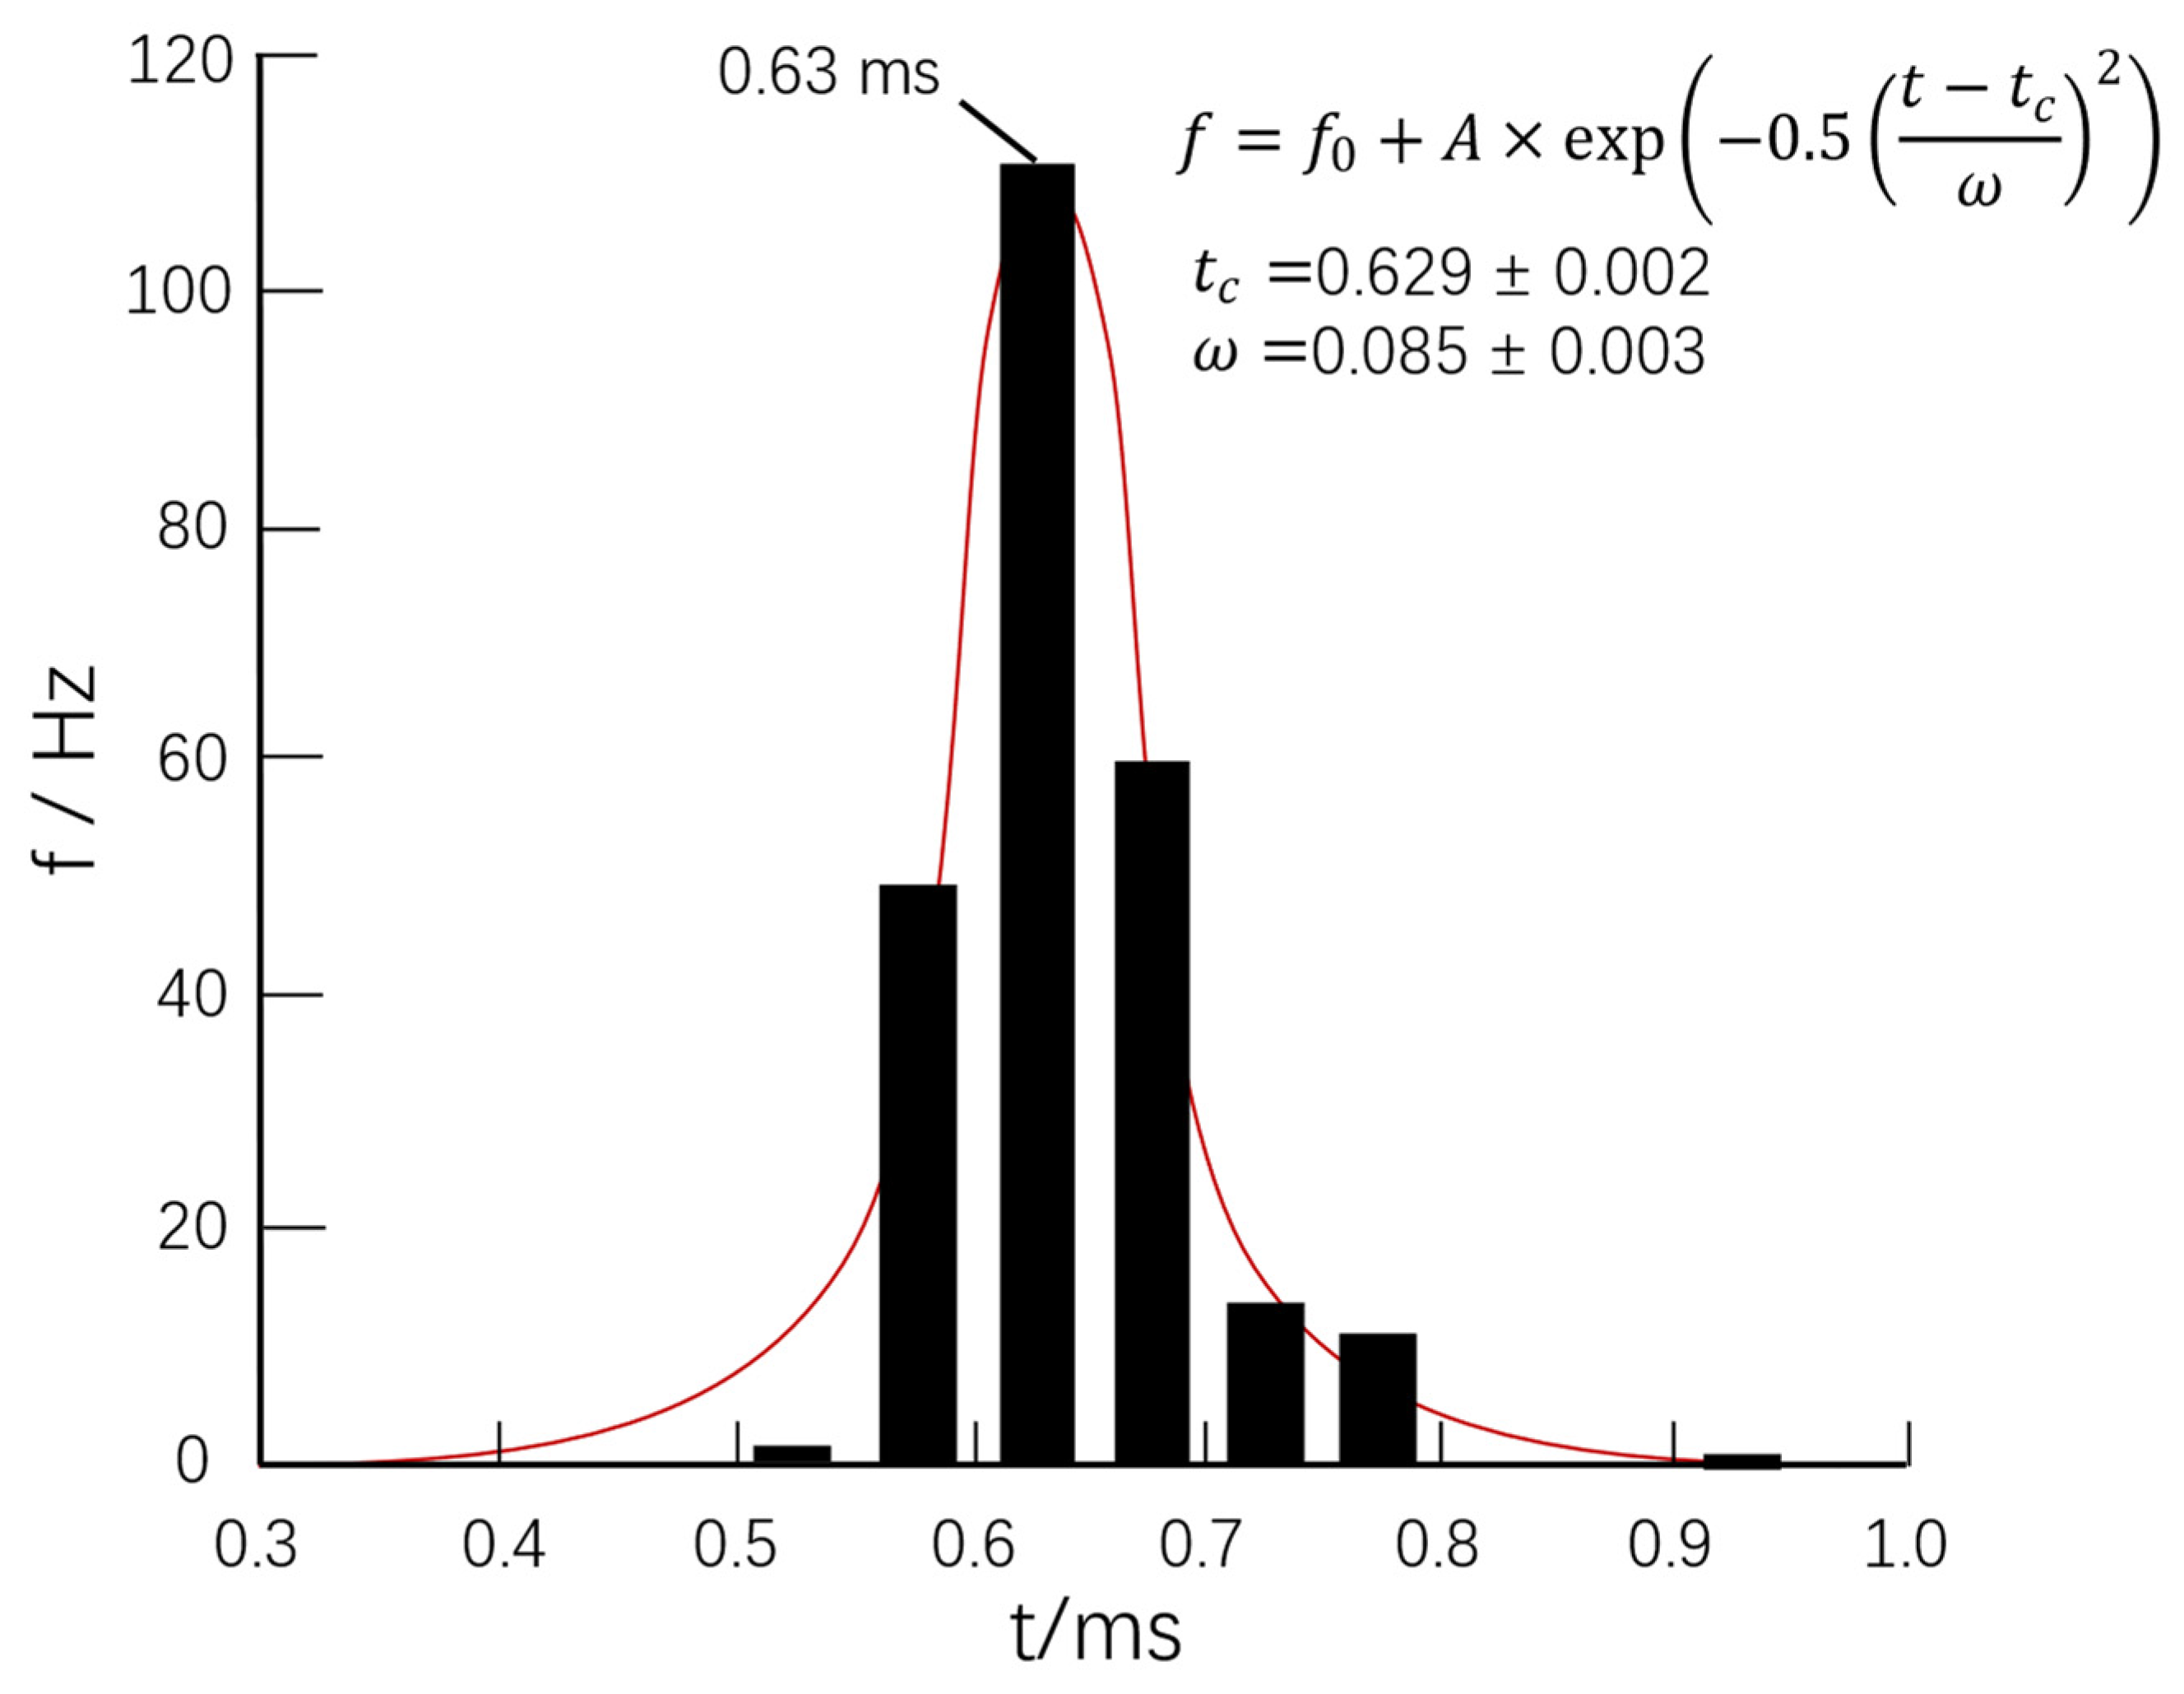
The real-time performance of the simulation system directly affected the timing control and the confidence of the whole simulation results. Generally, the real-time performance can be characterized by the time-consuming of one-step simulation. is the time interval between the computer starting the motion simulation of the rover and the steering gear parameters sent back to the simulation computer. The test objects in the system form a simulation closed loop, and record the time-consuming results of the single step in the simulation process. The statistical analysis results are shown in Figure 16.
It can be seen that the single-step simulation time of the simulation system was in the range of 0.5–0.95 ms—strictly less than 1 ms—and that the average value was 0.63 ms. The system was able meet the requirements of the hardware in the loop simulation with a simulation step of 1 ms.
3.2. Posture-Following Experiment
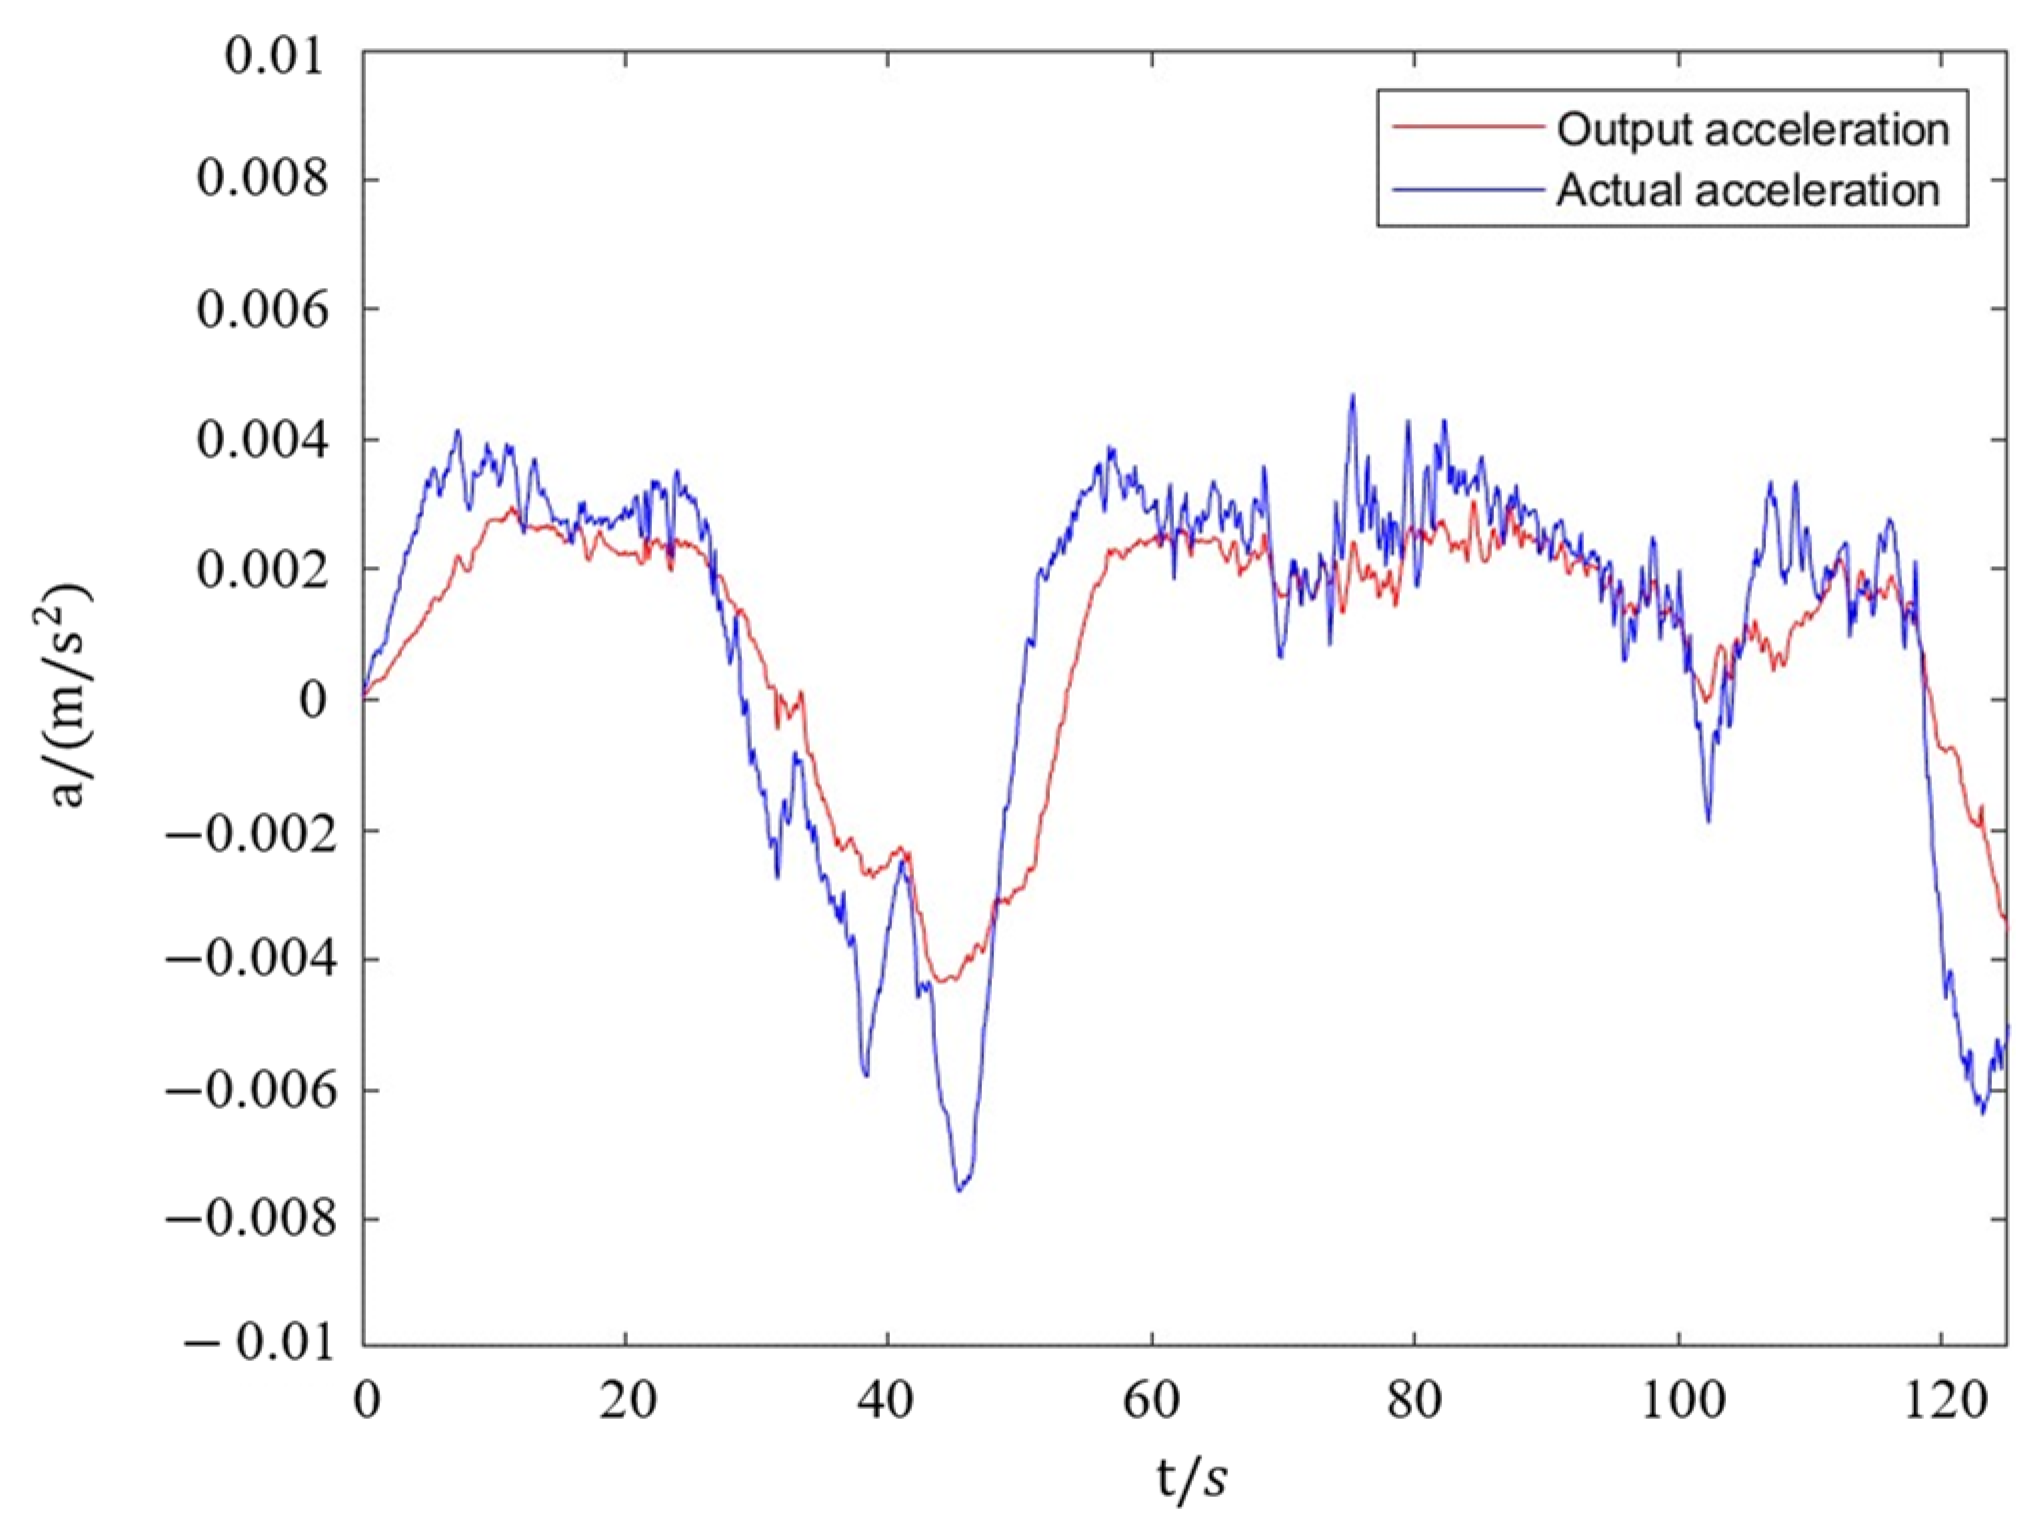
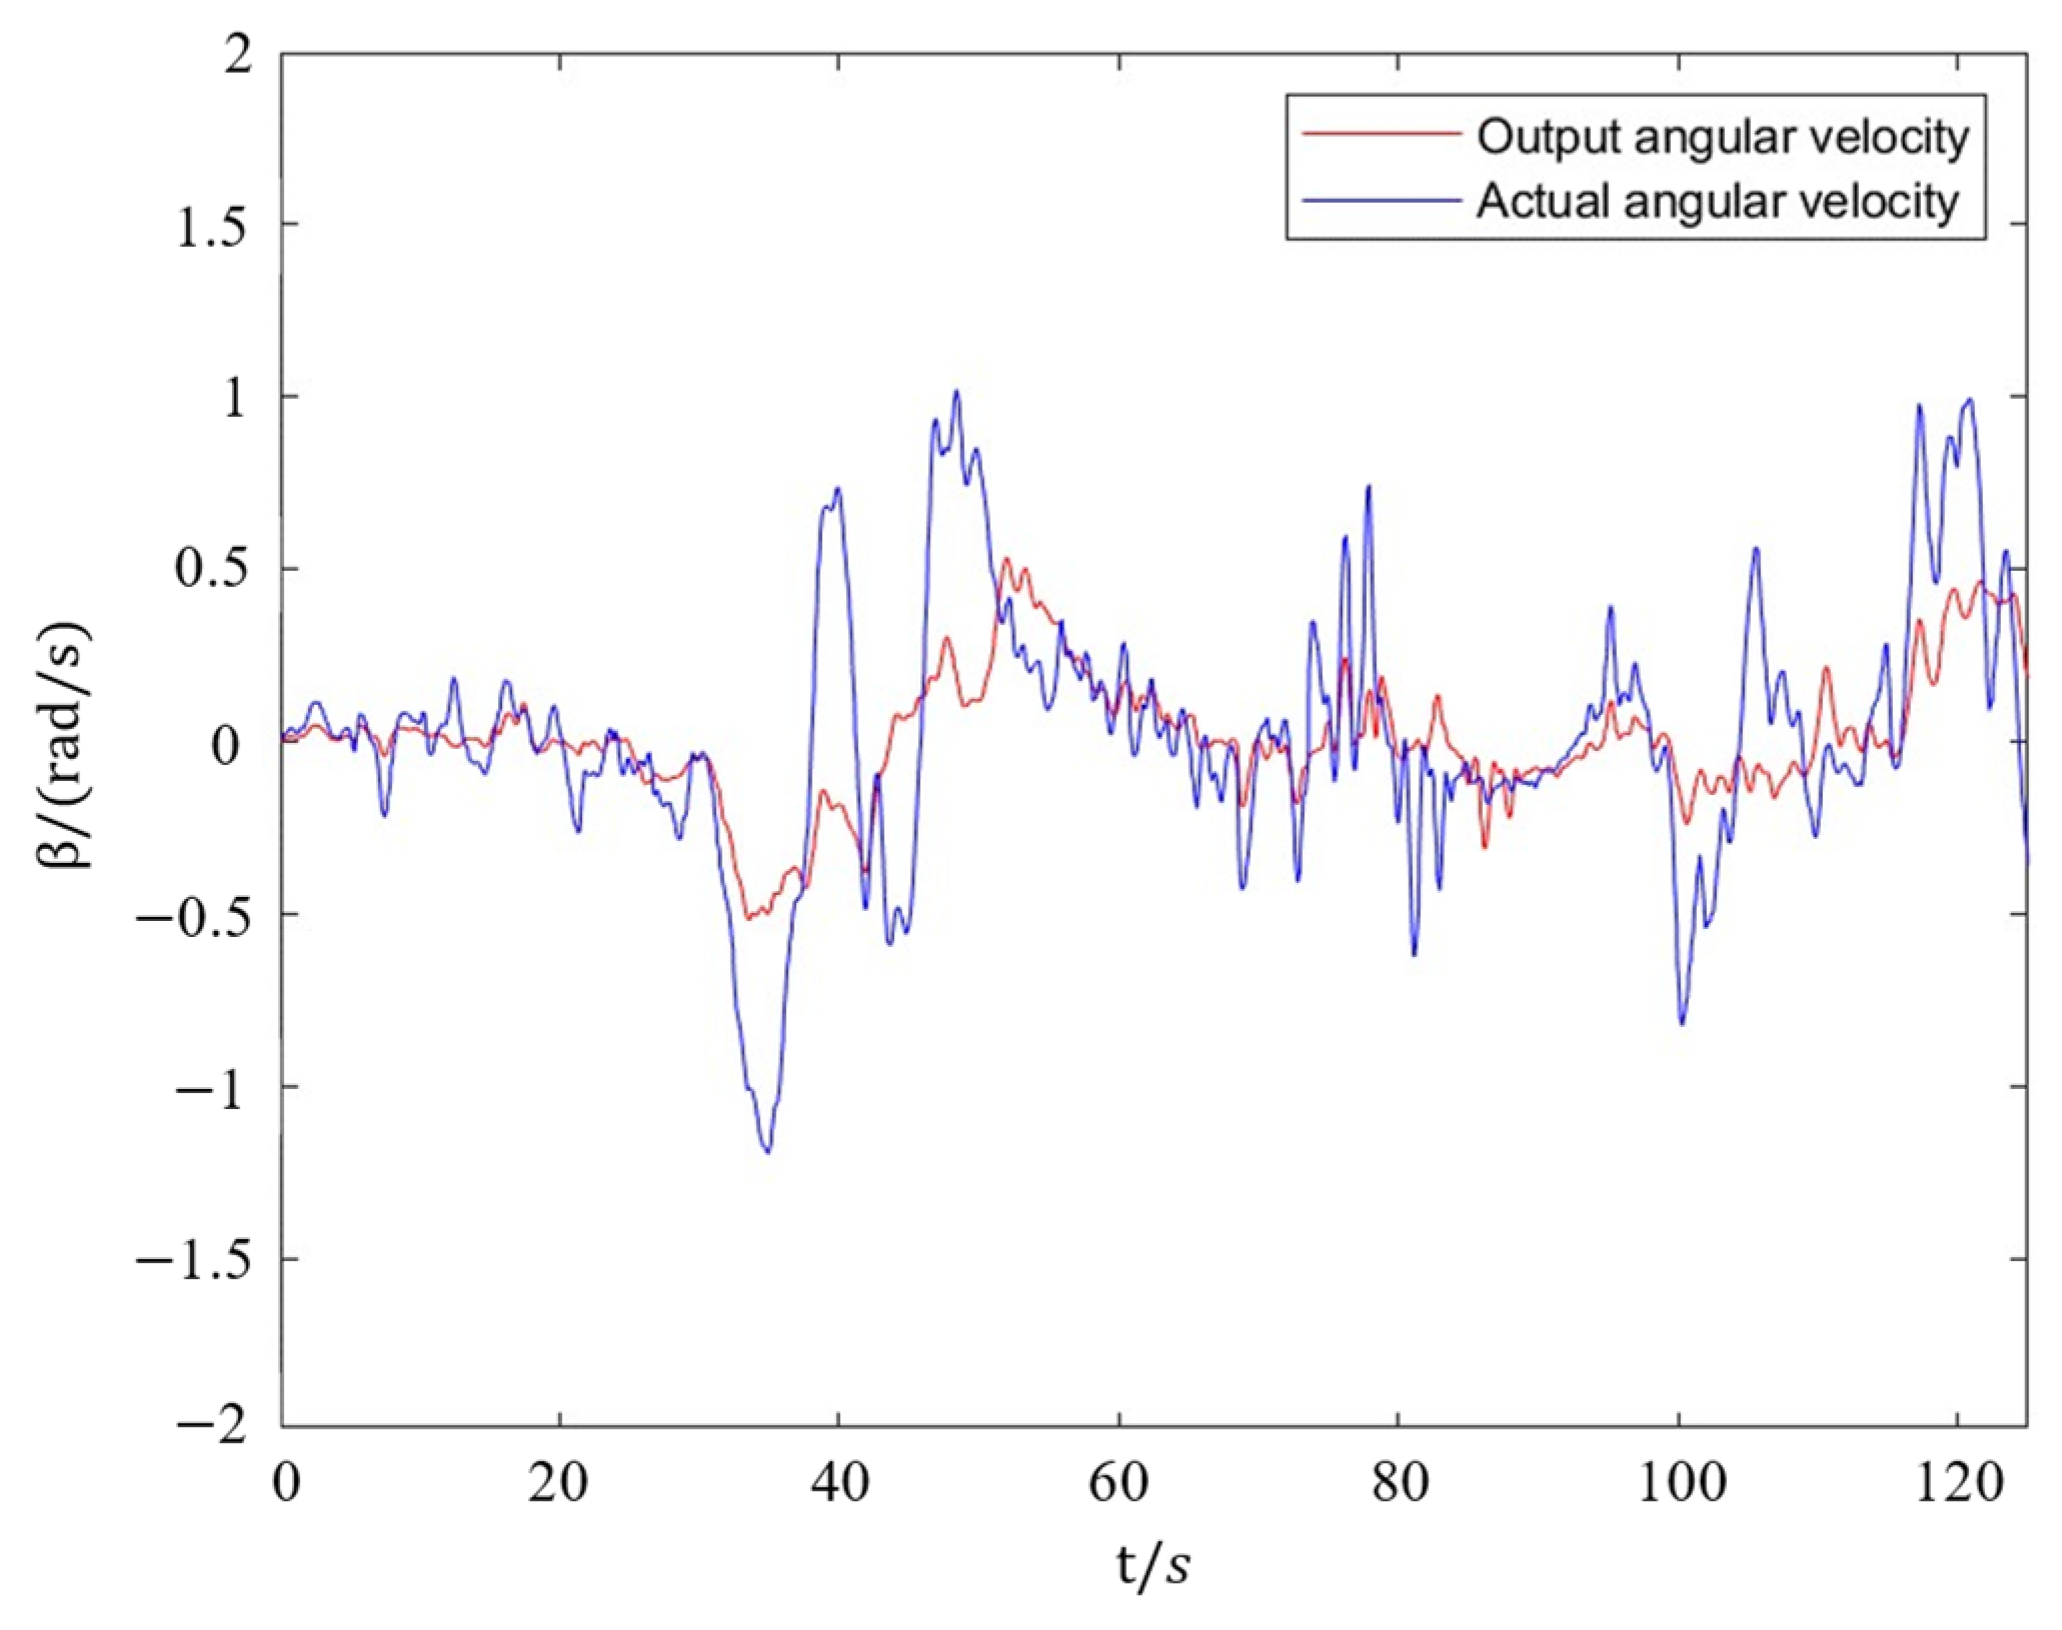
We conducted real-time simulation experiments of the posture following of the 6-DOF platform. The experiment lasted for 120 s. Figure 17 and Figure 18 show the results for the acceleration and angular velocity. In the figure, Actual acceleration represents the actual motion parameters of the rover in the simulation environment, and Output acceleration represents the 6-DOF platform motion parameters processed by the somatosensory feedback algorithm.
As shown in the figure, the system could basically simulate the acceleration, deceleration, and other motion states of the rover, and limit the motion range to the safety range of the 6-DOF platform.
3.3. Suspension Effectiveness Test
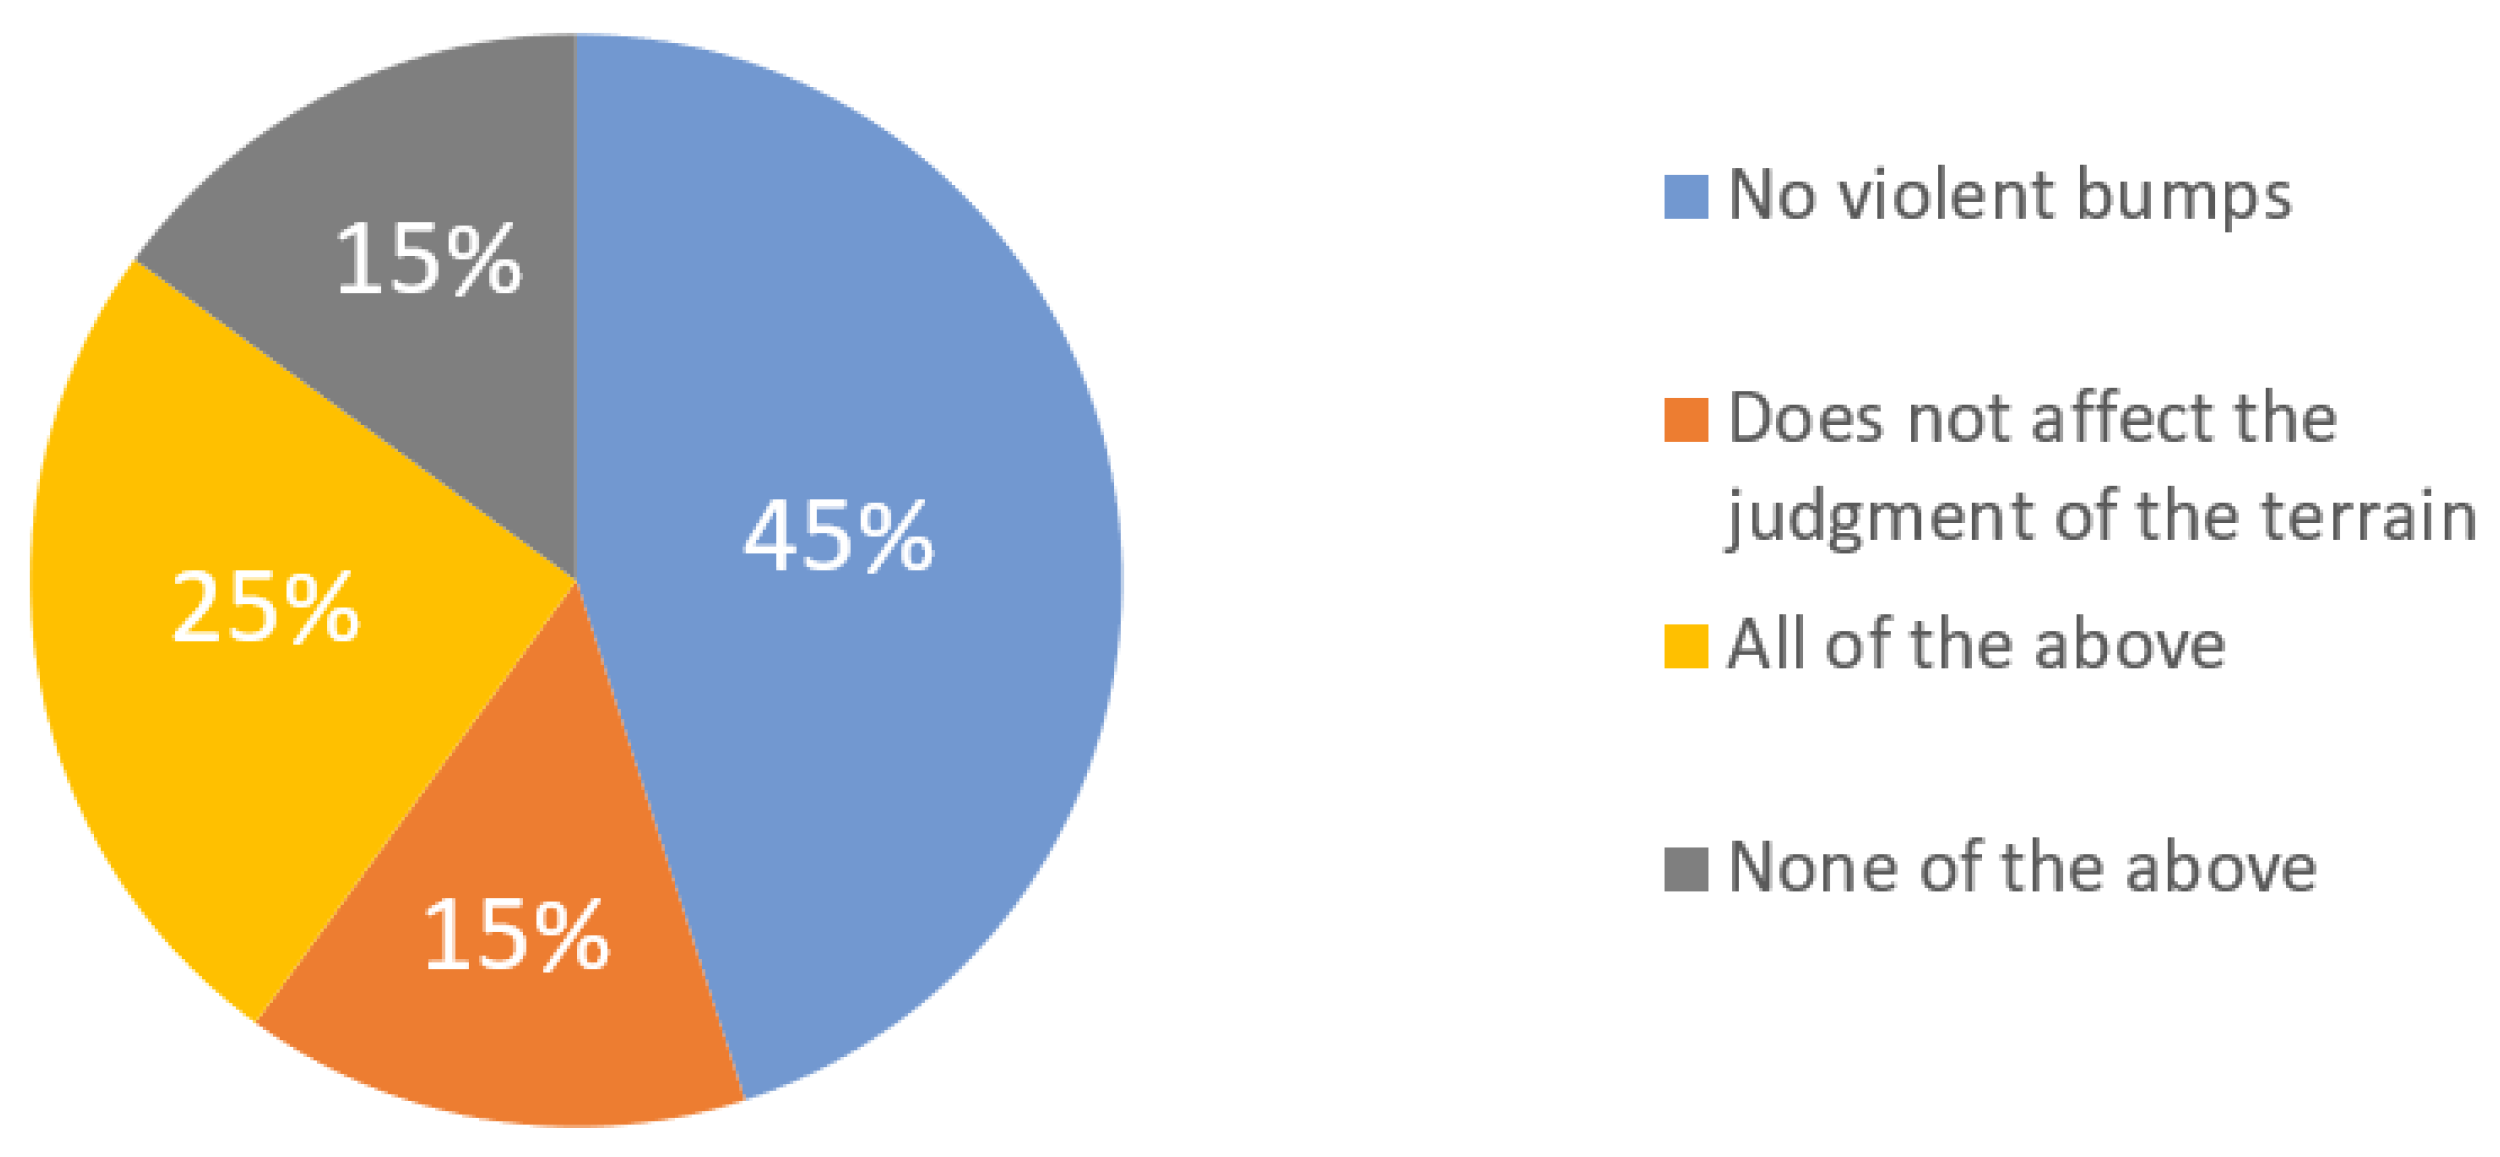
We invited 20 volunteers without driving experience with this device to conduct a comparative test, which lasted 20 min. The experimenters drove when the posture adjustment system was turned on and off, and we handed out questionnaires to them. The results analysis is shown in Figure 19. The conclusions are as follows:
After the posture adjustment system was turned on, the bumps of the vehicle were significantly reduced, and the impact on terrain judgment was small. The design goal was achieved.
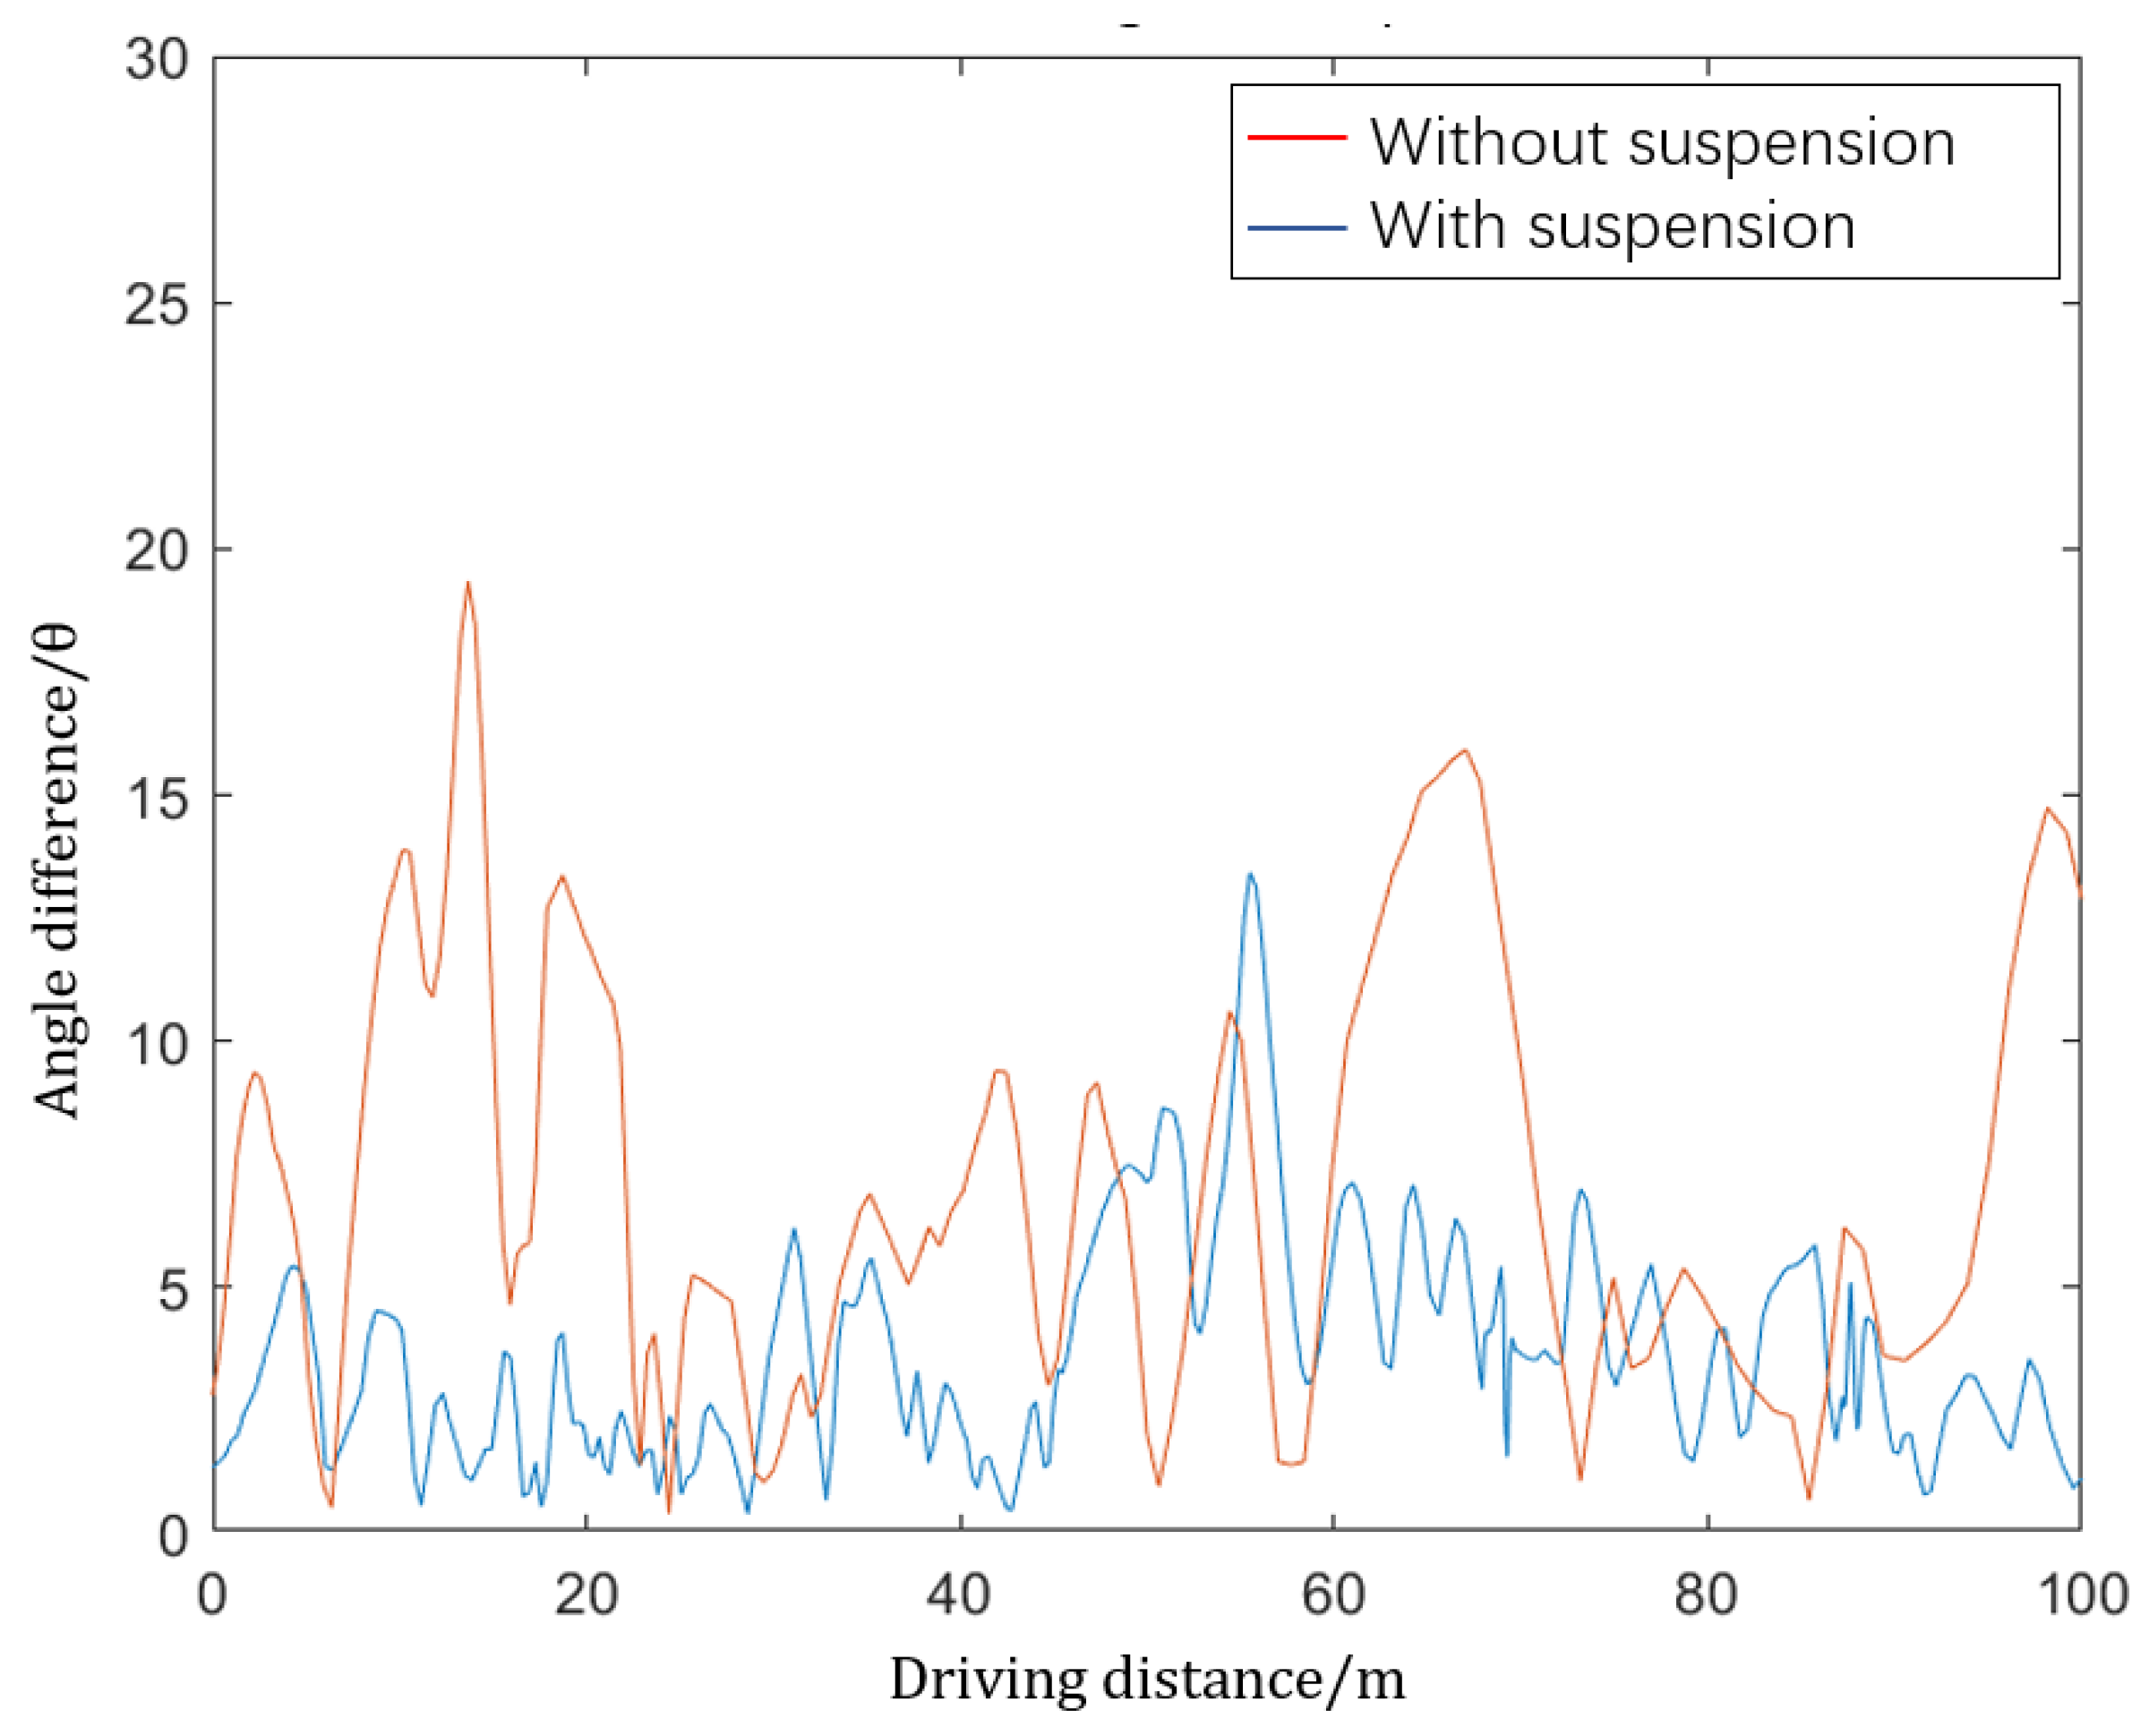
During the experiment, we recorded the angle between the vertical line of the ground and the rover, as shown in Figure 20.
It can be seen that the suspension reduced the angle between the vertical direction and the vertical line of the rover body, and ensured the stability of the attitude of the lunar rover.
3.4. Multi-Channel Interactive System Experiment
3.4.1. Visual and Force Interaction
We invited seven volunteers who had no experience in driving this device to participate in the experiment.
In the preparation of the experiment, we designed six routes of similar length on the simulated terrain and optimized the routes according to the terrain slope and the frequency of undulations. To ensure the validity of the experimental results, the experimenters learned and practiced driving with the simulation platform. Three routes were randomly selected from the preset routes for the training. During the training, each experimenter needed to drive the rover along three routes.
In the experiment, we randomly selected one of the remaining routes as the experimental route. First, the selected route was blurred to obtain a recommended driving area, which is visually displayed on the terrain as a driving reference. Each volunteer operated the platform with a single-channel interaction method that only included vision and an interaction method that combined the two channels of vision and force feedback. As shown in Figure 21, the experimenter drove twice along the same route, and we recorded the driving path and time (Figure 21).
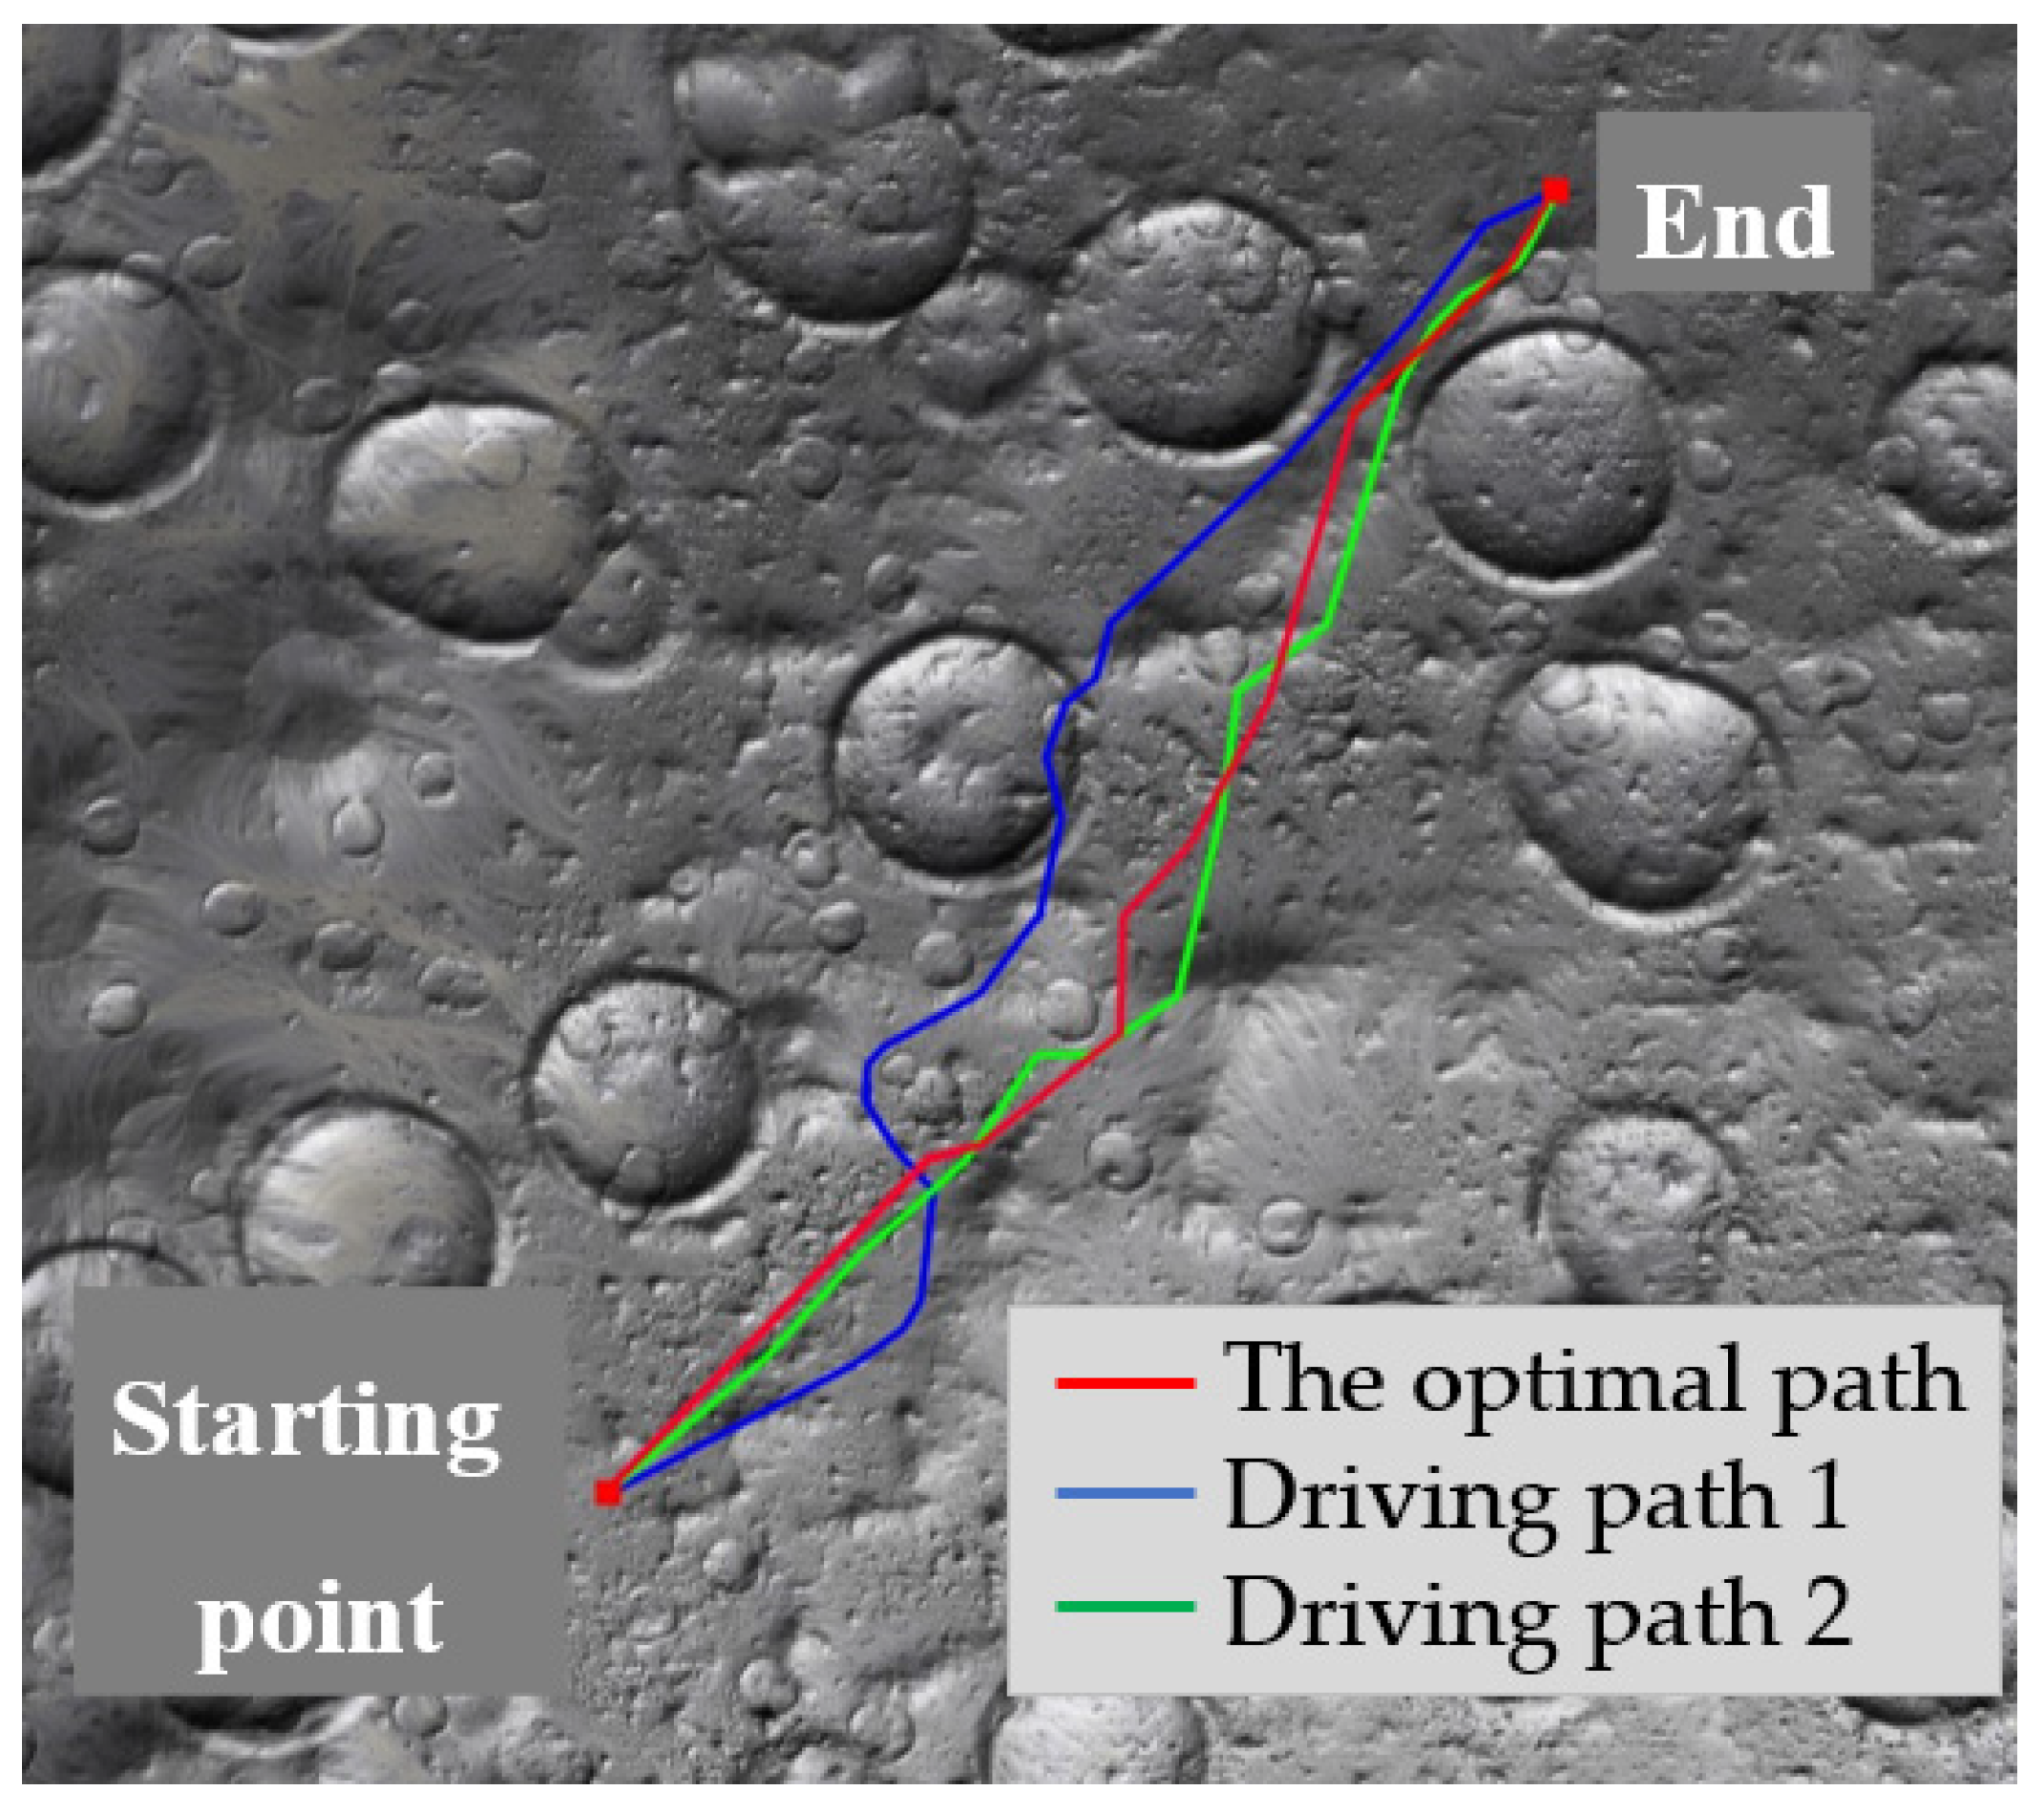
Figure 22 shows the path traveled by the experimenter driving the rover. Among the paths shown, the red path is the optimal path calculated by the system. The blue path indicates the one taken by the experimenter with only visual judgments during driving. The green path indicates when the experimenter was able to judge the terrain through a combination of vision and the force feedback of the handle.
We found that when the experimenters considered the force feedback information, the driving route was closer to the optimal route. This shows that in this study, the force feedback handle helped astronauts choose a safer driving route. Table 2 shows the data under two driving modes.
From the above data, it can be seen that when the experimenter judged the terrain through a combination of vision and the force feedback, the posture of the rover was more stable and the route was closer to the optimal path. Although the experiment time was generally increased, after interviews, we reached the following conclusion: When the number of channels increased, the factors that affect the experimenter’s judgment increased. Therefore, the judgment time increased, which eventually led to a longer operation time. However, the increase in time was not significant, and the impact on work efficiency was small.
3.4.2. Voice Control–Touch–Button Three-Channel Interactions
To test the effect of voice control, touch screens, and buttons on improving the work efficiency of the driver, we designed an experiment. The specific process is as follows:
- Experiment 1: Starting the rover. The experimenter needed to complete the four operations of powering the console, turning on the attitude adjustment system, turning on the radar, and turning on the simulation system.
- Experiment 2: The experimenter turned on the radar and adjusted the suspension during driving.
- Control method: a. Button control; b. A combination of buttons, voice, and touch.
Each experimenter used two control methods to conduct experiments. We recorded the duration of the experiment and the evaluation of operating comfort. The experimental data is shown in Table 3, Table 4, Table 5 and Table 6:
From the above data, it can be seen that the three-channel combination of buttons, touch, and voice control could shorten the operation time, and experimenters generally believed that the multi-channel combination was more comfortable and convenient.
3.5. System Effectiveness Evaluation
Considering that the effectiveness of the system is related to human factors, human factor K was entered into the traditional ADC model [22]. The evaluation model was as follows:
where K represents the human factor, A is the availability vector, D is the reliability matrix, and C is the system performance matrix.
where and are the probability that the platform is in effective state and fault state, is the average working time without failure (38 min and 2 s), and is the average time for repairing equipment (39 s). The formula for reliability matrix D was as follows:
where T is the duration of the task.
Next, we calculated the system performance matrix C. The system performance could be divided into three sub-indexes, including authenticity, real-time, and interactivity. The fuzzy comprehensive evaluation factor was set as .
The weights of each index obtained by the analytic hierarchy process were . The questionnaire was distributed to the subjects, and the index value of platform capability was . C was calculated according to the following formula:
Next, we calculated the human factor K:
where is the manpower availability, is the manpower credibility, is the average working hours, is the average non-working hours, and λ is the probability of error of the experimenters. From Equation (27), K was equal to 0.9722. According to Formula (22), E was equal to 82.103.
It can be seen that the personnel participating in the experiment had a high evaluation on the interactive design of the system. After considering human factors, the system efficiency score was about 82, which meets various requirements.
4. Conclusions
This paper represents the integration of virtual reality software and an actual operating platform, resulting in a high-fidelity lunar rover driving simulation. It provides a method for the rapid development of visual and physical simulation, and verifies the authenticity of the lunar rover simulation and the effectiveness of the interactive operation platform design.
We developed and tested three main areas: First, we simulated the physical environment that the lunar rover would be operating in. This included a high-fidelity visual simulation of the moon and a motion simulation of the lunar rover. Secondly, due to the improvement of physical fidelity, we could test the path planning and perception algorithms of the lunar rover on the simulation data—thereby increasing confidence in the real-life applicability of the simulation. Thirdly, we proposed a multi-channel fusion human–computer interaction method, which improved the astronauts’ ability to perceive the operating environment; it enabled astronauts to work in the most convenient and effective way according to the mission requirements and their conditions, which improved the safety and reliability of control of the rover. Future work will mainly focus on the further fusion of data between multiple channels and research into the environmental perception systems.
Author Contributions
Conceptualization, Y.X.; validation, Z.T.; investigation and analysis, A.S.; writing and editing, all authors. All authors have read and agreed to the published version of the manuscript.
Funding
This project is supported by the National Natural Science Foundation of China, grant number: No. U1713210.
Institutional Review Board Statement
All procedures performed in studies involving human participants were in accordance with the ethical standards of the institutional and/or national research committee and with the 1964 Helsinki declaration and its later amendments or comparable ethical standards. And this study is approved by the ethics committee of Jiangsu Province Hospital. Informed and written consent was obtained from all individual participants included in the study.
Informed Consent Statement
Not applicable.
Data Availability Statement
All data are contained within this manuscript.
Conflicts of Interest
The authors declare no conflict of interest.
References
- Trimble, J.; Carvalho, R. Lunar prospecting: Searching for volatiles at the south pole. In Proceedings of the SpaceOps 2016 Conference, Daejeon, Korea, 16–20 May 2016; pp. 2482–2490. [Google Scholar] [CrossRef] [Green Version]
- Andrews, D.; Colaprete, A.; Quinn, J.; Chavers, D.; Picard, M. Introducing the resource prospector (RP) mission. In Proceedings of the AIAA SPACE 2014 Conference and Exposition, San Diego, CA, USA, 4–7 August 2014. [Google Scholar] [CrossRef]
- Hooey, B.L.; Toy, J.J.N.T.; Carvalho, R.E.; Fong, T.; Gore, B.F. Modeling operator workload for the resource prospector lunar rover mission. In Advances in Human Factors in Simulation and Modeling; Advances in Intelligent Systems and Computing; Springer: Los Angeles, CA, USA, 2018; pp. 183–194. [Google Scholar] [CrossRef]
- Hambuchen, K.; Roman, M.C.; Sivak, A.; Herblet, A.; Koenig, N.; Newmyer, D.; Ambrose, R. AIAA SPACE and Astronautics Forum and Exposition; SPACE: San Diego, CA, USA, 2017; pp. 5120–5129. [Google Scholar] [CrossRef]
- Allan, M.; Wong, U.; Furlong, P.M.; Rogg, A.; McMichael, S.; Welsh, T.; Chen, I.; Peters, S.; Gerkey, B.; Quigley, M.; et al. Planetary Rover Simulation for Lunar Exploration Missions. In Proceedings of the 2019 IEEE Aerospace Conference, Big Sky, MT, USA, 2–9 March 2019; pp. 1–19. [Google Scholar] [CrossRef]
- Xie, Y.; Zhou, J.; Wang, Y. Environment modeling for mission planning of lunar rovers. Dongnan Daxue Xuebao (Ziran Kexue Ban)/J. Southeast Univ. (Nat. Sci. Ed.) 2010, 40, 292–296. [Google Scholar]
- Rao, N.S.; Appleby, M.H. The role of terrain modeling in lunar rover simulation. Simulation 1993, 61, 60–68. [Google Scholar] [CrossRef]
- Ju, H.H.; Tian, X.E. Real-time dynamics modeling and traction control for lunar rover. Yuhang Xuebao/J. Astronaut. 2014, 35, 743–752. [Google Scholar] [CrossRef]
- Tian, X.; Ju, H. Modeling and simulation for lunar rover based on terramechanics and multibody dynamics. In Proceedings of the 32nd Chinese Control Conference, Xi’an, China, 26–28 July 2013; pp. 8687–8692. [Google Scholar]
- Jain, A.; Balaram, J.; Cameron, J.; Guineau, J.; Lim, C.; Pomerantz, M.; Sohl, G. Recent developments in the ROAMS planetary rover simulation Environment. In Proceedings of the 2004 IEEE Aerospace Conference Proceedings, Big Sky, MT, USA, 6–13 March 2004; Volume 2, pp. 861–876. [Google Scholar] [CrossRef]
- Neukum, G.; Ivanov, B.A.; Hartmann, W.K. Cratering records in the inner solar system in relation to the lunar reference system. Space Sci. Rev. 2001, 96, 55–86. [Google Scholar] [CrossRef]
- Shankar, U.J.; Shyong, W.J.; Criss, T.B.; Adams, D. Lunar terrain surface modeling for the ALHAT program. In Proceedings of the IEEE Aerospace Conference Proceedings, Big Sky, MT, USA, 1–8 March 2008. [Google Scholar] [CrossRef]
- Goddard, E.N.; Halt, M.H.; Larson, K.K. Preliminary Geologic Investigation of the Apollo 12 Landing Site. Apollo 12-Preliminary Science Report, NASA-SP-235. 1970; p. 113. Available online: https://pubs.er.usgs.gov/publication/70044160 (accessed on 20 December 2021).
- Pike, R.J. Depth/diameter relations of fresh lunar craters: Revision from spacecraft data. Geophys. Res. Lett. 1974, 1, 291–294. [Google Scholar] [CrossRef]
- Zhang, H.H.; Liang, J.; Huang, X.Y. Chang’e 3 autonomous obstacle avoidance soft landing control technology. China Sci. Technol. Sci. 2014, 44, 559–568. [Google Scholar]
- Yoshida, K.; Hamano, H. Motion dynamics of a rover with slip-based traction model. In Proceedings of the IEEE International Conference on Robotics and Automation, Washington, DC, USA, 11–15 May 2002; pp. 3155–3160. [Google Scholar] [CrossRef]
- Asadi, H.; Mohammadi, A.; Mohamed, S.; Lim, C.P.; Khatami, A.; Khosravi, A.; Nahavandi, S. A Particle Swarm Optimization-based washout filter for improving simulator motion fidelity. In Proceedings of the 2016 IEEE International Conference on Systems, Man, and Cybernetics (SMC), Budapest, Hungary, 9–12 October 2016; pp. 1963–1968. [Google Scholar] [CrossRef]
- Guo, L.X.; Zhang, L.P. Constrained Active Suspension Control with Parameter Uncertainty for Non-stationary Running Based on LMI Optimization. J. Vib. Eng. Technol. 2018, 6, 441–451. [Google Scholar] [CrossRef]
- Chen, G.; Lv, S.; Dai, J. Study on pid control of vehicle semi-active suspension based on genetic algorithm. Int. J. Innov. Comput. Inf. Control 2019, 15, 1093–1114. [Google Scholar] [CrossRef]
- Carvajal, J.; Chen, G.; Ogmen, H. Fuzzy PID controller: Design, performance evaluation, and stability analysis. Inf. Sci. 2000, 123, 249–270. [Google Scholar] [CrossRef]
- Zhang, Y.; Li, L.L.; Lin, H.C.; Ma, Z.; Zhao, J. Development of path planning approach using improved a-star algorithm in AGV system. J. Internet Technol. 2019, 20, 915–924. [Google Scholar] [CrossRef]
- Luo, J.; Su, B.; Chi, M.; Huang, S.H. Operational Effectiveness Evaluation of Unmanned Aerial Communication Platform Based on Improved ADC Model. Fire Control Command. Control 2021, 9, 83–88. [Google Scholar]
Figure 1.
Schematic diagram of the system.

Figure 2.
6-DOF motion platform.

Figure 3.
Diagram of the operating platform.

Figure 4.
Simulation model of the lunar environment.

Figure 5.
Simulation model of the lunar rover.

Figure 6.
Flow chart of the somatosensory feedback algorithm.

Figure 7.
PID control model of semi-active suspension.

Figure 8.
Structure diagram of PID control.

Figure 9.
Virtual sensor development rendering.

Figure 10.
Virtual environment rendering.

Figure 11.
Schematic diagram of the safe return route.

Figure 12.
Structure of the multi-channel interactive system.

Figure 13.
Flow chart of force feedback solution.

Figure 14.
Direction division of the driving area.

Figure 15.
Motion simulation and human–computer interaction system.

Figure 16.
Time-consuming histogram of the single step.

Figure 17.
Platform output acceleration.

Figure 18.
Platform output angular velocity.

Figure 19.
Results of the questionnaire.

Figure 20.
Comparison of rover attitude.

Figure 21.
Experiment procedure.

Figure 22.
Comparison of experimenters’ driving routes.


Table 1.
Mark point classification.
| Angle | Color | Explain |
|---|---|---|
| Less than −25° | Purple | Dangerous slope, no passage |
| From −25° to 110° | Blue | The brakes need to be applied |
| From −10° to 10° | Green | Safe passage |
| From 10° to 25° | Yellow | A certain pre-acceleration is required to pass |
| Greater than 25° | Red | Dangerous slope, no passage |
Table 2.
Driving hours of visual and force interaction experiment.
| Number | 1 | 2 | 3 | 4 | 5 | 6 | 7 | 8 |
|---|---|---|---|---|---|---|---|---|
| Vision | 37.2 | 32.6 | 40.5 | 39.2 | 33.6 | 31.3 | 42.3 | 35.5 |
| Vision and force perception | 39.2 | 34.1 | 44.1 | 37.8 | 35.6 | 36.1 | 42.9 | 34.8 |
Table 3.
Data of Experiment 1 (Key control).
| Number | 1 | 2 | 3 | 4 | 5 | 6 | 7 | 8 |
|---|---|---|---|---|---|---|---|---|
| Time (s) | 9.8 | 10.5 | 11.1 | 8.5 | 8.9 | 9.5 | 7.7 | 10.7 |
| Evaluation of comfort | 6 | 7 | 7 | 9 | 7 | 8 | 8 | 7 |
Table 4.
Data of Experiment 1 (Combination of three channels).
| Number | 1 | 2 | 3 | 4 | 5 | 6 | 7 | 8 |
|---|---|---|---|---|---|---|---|---|
| Time (s) | 8.3 | 7.2 | 9.5 | 8.7 | 7.4 | 7.9 | 7.5 | 6.9 |
| Evaluation of comfort | 8 | 9 | 8 | 8 | 8 | 10 | 8 | 8 |
Table 5.
Data of Experiment 2 (Key control).
| Number | 1 | 2 | 3 | 4 | 5 | 6 | 7 | 8 |
|---|---|---|---|---|---|---|---|---|
| Time (s) | 24.7 | 23.4 | 19.8 | 21.6 | 19.9 | 22.3 | 26.2 | 18.8 |
| Evaluation of comfort | 6 | 6 | 7 | 5 | 6 | 5 | 5 | 6 |
Table 6.
Data of Experiment 2 (Combination of three channels).
| Number | 1 | 2 | 3 | 4 | 5 | 6 | 7 | 8 |
|---|---|---|---|---|---|---|---|---|
| Time (s) | 23.4 | 23.0 | 20.7 | 20.6 | 18.3 | 19.5 | 23.6 | 18.5 |
| Evaluation of comfort | 7 | 9 | 7 | 8 | 10 | 9 | 8 | 10 |
Publisher’s Note: MDPI stays neutral with regard to jurisdictional claims in published maps and institutional affiliations. |
© 2022 by the authors. Licensee MDPI, Basel, Switzerland. This article is an open access article distributed under the terms and conditions of the Creative Commons Attribution (CC BY) license (https://creativecommons.org/licenses/by/4.0/).
Share and Cite
MDPI and ACS Style
Xie, Y.; Tang, Z.; Song, A. Motion Simulation and Human–Computer Interaction System for Lunar Exploration. Appl. Sci. 2022, 12, 2312. https://doi.org/10.3390/app12052312
AMA Style
Xie Y, Tang Z, Song A. Motion Simulation and Human–Computer Interaction System for Lunar Exploration. Applied Sciences. 2022; 12(5):2312. https://doi.org/10.3390/app12052312
Chicago/Turabian StyleXie, Yuzhen, Zihan Tang, and Aiguo Song. 2022. "Motion Simulation and Human–Computer Interaction System for Lunar Exploration" Applied Sciences 12, no. 5: 2312. https://doi.org/10.3390/app12052312
Note that from the first issue of 2016, this journal uses article numbers instead of page numbers. See further details here.