Article

The Behavior of Hybrid Fiber-Reinforced Concrete Elements: A New Stress-Strain Model Using an Evolutionary Approach

by
Ali A. Abdulhameed
1,*,
Alaa Hussein Al-Zuhairi
2,
Salah R. Al Zaidee
2,
Ammar N. Hanoon
1,
Ahmed W. Al Zand
3,*,
Mahir M. Hason
4 and
Haider A. Abdulhameed
5
1
Department of Reconstruction and Projects, University of Baghdad, Baghdad 10071, Iraq
2
Department of Civil Engineering, University of Baghdad, Baghdad 10071, Iraq
3
Department of Civil Engineering, Universiti Kebangsaan Malaysia, Bangi 43600, Malaysia
4
Disaster Information Management Centre, Ministry of Science and Technology, Baghdad 10071, Iraq
5
Civil Engineering Department, University of Technology, Baghdad 10066, Iraq
*
Authors to whom correspondence should be addressed.
Appl. Sci. 2022, 12(4), 2245; https://doi.org/10.3390/app12042245
Submission received: 20 December 2021 / Revised: 18 February 2022 / Accepted: 19 February 2022 / Published: 21 February 2022
(This article belongs to the Special Issue Structural Application of Advanced Concrete Materials)

Abstract

:
Several stress-strain models were used to predict the strengths of steel fiber reinforced concrete, which are distinctive of the material. However, insufficient research has been done on the influence of hybrid fiber combinations (comprising two or more distinct fibers) on the characteristics of concrete. For this reason, the researchers conducted an experimental program to determine the stress-strain relationship of 30 concrete samples reinforced with two distinct fibers (a hybrid of polyvinyl alcohol and steel fibers), with compressive strengths ranging from 40 to 120 MPa. A total of 80% of the experimental results were used to develop a new empirical stress-strain model, which was accomplished through the application of the particle swarm optimization (PSO) technique. It was discovered in this investigation that the new stress-strain model predictions are consistent with the remaining 20% of the experimental stress-strain curves obtained. Case studies of hybrid–fiber–reinforced concrete constructions were investigated in order to better understand the behavior of such elements. The data revealed that the proposed model has the highest absolute relative error (ARE) frequencies (ARE 10%) and the lowest absolute relative error (ARE > 15%) frequencies (ARE > 15%).

1. Introduction

The use of high–strength concrete (HSC) in buildings is spreading as the cross-section of members can be actually reduced. With the low water/cementitious materials ratio for high strength concrete, concrete durability can be improved. Compressive strength, on the other hand, causes concrete to become more brittle [1]. Steel fibers can improve section behavior [2,3], since they provide a bridging action across matrix microcracks and improve crack opening resistance [4]. Steel fibers’ ability to cross microcracks is greatly influenced by the shear stress at the interface between the fibers and the matrix (bond strength between steel fibers and the matrix). Fibers and the matrix are held together by an interfacial connection as a result of this shear stress [4].
To increase the mechanical properties of concrete, numerous types of fibers are commonly used [5,6,7]. Hybrid fiber-reinforced concrete (HFRC) has been developed by combining different types of fibers in order to get the desired mechanical features of fiber-reinforced concrete. However, many fiber mixes, such as carbon and polypropylene, glass and polypropylene, and glass and carbon fibers, have been used to generate HFRC [8,9,10]. The hybrid steel–polypropylene fibers have been the subject of a lot of research. Because the fibers contribute to the toughness, which lowers brittle failure under static and dynamic stresses, HFRC exhibits an increased reaction. It also improves energy absorption.
It is well acknowledged that steel fibers can improve mechanical properties such as compressive and tensile strengths; ductility; impact resistance; toughness; and so on (ACI Committee 544 [11]). However, the effect of the combinations of hybrid fibers (two or more different types of fibers) on the concrete properties is not extensively addressed. Requirements for high–strength fiber reinforced concrete has been increasing significantly over the past few decades due to the need for design members that are small in size, which also decreases the mass of members, to lead to effective seismic-resistant concrete structure [12,13]. By extending the post-peak region of stress-strain diagrams, which is otherwise nearly nonexistent or steeply sloped in high-strength concrete (HSC), the fibers in FRC improve toughness [13]. This enhancement in structural response can only be considered once the stress-strain curves of the resulting FRC have been studied in detail. Stress-strain diagrams can be used to assess the toughness of FRC. By extending the post-peak region of stress-strain diagrams, which is otherwise nearly nonexistent or steeply sloped in high-strength concrete (HSC), the fibers in FRC improve toughness [13]. This enhancement in structural response can only be considered once the stress-strain curves of the resulting FRC have been studied in detail. Stress-strain diagrams can be used to assess the toughness of FRC. In addition, using the steel fibers for reinforcing the normal strength concrete (NSC) and reactive powder concrete (RPC) had been investigated [14]. Where, the study confirmed that the aggregate interlock, crack surface friction and steel fiber content are the main three factors influenced the shear strength of the NSC, meanwhile, on RPC, only the factors of crack surface friction and steel fibers are affected.
The effects of replacing Portland cement with pumice powder and nano-clay were studied [15]. The possibility of making pervious concrete with varied amounts of recycled concrete aggregate (RCA) was made with a combination of new and used materials, including recycled and industrial fibers. The author(s) recommends the usage of pervious concrete containing 50% RCA and 2% steel fiber in the constructions of structures. Other researchers investigated the use of recycled concrete aggregate and pozzolanic additives in fiber-reinforced pervious concrete reinforced with industrial and recycled fibers [16]. They discovered that introducing 2% steel fiber increased compressive and flexural strengths by up of 65% and 79%, respectively, over the unreinforced counterpart mix (STF). Additionally, it was reported that the use of 100% RCA with 2% STF and 2% nano-clay (NC) results in a previous concrete suited for structural purposes. Sinaei et al. [17] investigated the efficacy of composite fiber reinforced polymer (CFRP) layers for five exterior beam-column connections using a finite element model (FEM) based on previously collected experimental data. It was discovered that L-shaped FRP composite overlays at the beam-column interface were an appropriate method for increasing ductility. Additionally, U-shaped overlays beneath the beam and the use of FRP on both lateral sides of the beam were excellent reinforcing solutions for enhancing the RC joints’ strength and ductility.
Through the use of artificial neural networks (ANN) and extreme learning machines, scholars have evaluated the influence of fly ash and silica fume replacement content on the strength of concrete [18]. Various ratios of fly ash with (without) additional silica fume have been evaluated for this. The ratio of water to cement varies throughout the test. FA contributed less to the strength of concrete at younger ages, but significantly more at older ages. As a result, the increased effect of a small amount of SF on compressive strength was not statistically significant. In the short term, adding fly ash decreased compressive strength, but boosted it in the long run. Adding silica fume increases the strength in the short term but diminishes it over time. The behavior of angle shear connections was examined numerically by researchers [19]. Thermo-mechanical finite element modeling was done on push-out samples using the ABAQUS software, and the findings were compared to those obtained from laboratory tests. The research findings indicated that the numerically models were capable of effectively predicting laboratory results such as shear strength and slip. Additionally, data indicated that increasing the temperature to 850 °C results in a 56% reduction in the shear strength of the samples. Shariati et al. assessed the compressive strength of concrete combining furnace slag and fly ash in place of cement [20]. A database of 1030 data sets was used in the evaluation of the compressive strength of the modified concrete. The author(s) utilized a hybrid artificial neural network-genetic algorithm (ANN-GA) in the study. The ANN-GA model for concrete compressive strength prediction outperformed an ANN-BP model in terms of precision, the study’s findings revealed. Furthermore, the hybrid ANN technique was adopted for theoretically predicted the cohesion between the sand-soil that combined with fibers [21].
A uniaxial compression test was used to characterize the behavior of 48 cylindrical specimens prepared from fiber-reinforced concrete with end-hooked steel fibers and analytical model was proposed [22]. The test revealed a ductile behavior of steel fibre-reinforced concrete specimens even exceeding its compressive strength. Additionally, it was demonstrated that the strain at compressive strength generally increased as the fiber volumetric ratio and aspect ratio increased, although the elastic modulus reduced. Chalioris and Panagiotopoulos studied the flexural response of steel fibrous concrete cross-sections with a randomly chosen geometry through a computational approach [23]. Moreover, a compressive stress-strain graphs and 257 strength values were used to construct a new compressive stress-strain model for steel fibrous concrete. The proposed sectional analysis was validated against experimental data for 42 SFC beams, and it accurately predicts the flexural capacity and curvature ductility of SFC members. The behavior of double-ended hook steel fiber concrete elements with 80 MPa compressive strength was also investigated considering specimens dimensions, shape, content, aspect ratio, and tensile strength of the embedded steel fiber [24]. The mechanical testing-crack opening displacement test was used to determine the flexural performance of the specimens, and the findings were compared to code specifications. Further studies are concerned the cracking behavior of the fiber-reinforced concrete element with synthetic fibers [25], and steel fiber-reinforced beams under cyclic deformation [26]. In general, further researchers have been concerned the behaviors of the corroded concrete [27] and using hybrid extreme learning machine-grey wolf optimizer to predict concrete strength that partially replacement of cement [28]. A new technique off-site and self-form segmental concrete masonry was also experimentally studied [29].
Using the extended finite element method, Abbas and AlZuhairi investigated the behavior of simply supported reinforced concrete beams [30]. The experimental program includes two RC beams loaded in two points. It was found that the mesoscale numerical model produced findings that were closer to the experimental data, and that mesoscale modeling of reinforced concrete is most convenient when the maximum aggregate size is reduced. Hason et al. investigated the effects of numerous critical parameters on the energy absorption (EA) of torsional RC beams reinforced with external FRP [31]. Whereas, (81) gathered datasets for investigating (28) factors were studied and evaluated including the concrete compressive strength through using response surface methodology (RSM). They claimed that the proposed model has an acceptable correlation coefficient (R) of around 80% and is reasonably accurate and the EA also works as a safety index for FRP-strengthened RC beams exposed to torsional loads, preventing unexpected structural failure.
Analytical models for predicting the stress-strain diagram of steel fiber reinforced concrete that take into account the major properties of a single type of fibers have been proposed in current research. This is because, to date, a lack of information in predicting the compressive stress-strain relation of concrete with two or more different types of fibers has been reported. For this purpose, this study was suggested to carry the experimental program for testing varied concrete samples reinforced with hybrid fibers (polyvinyl alcohol and steel fibers). The majority of the experimental results were used to develop an empirical model to simulate the HFRC stress-strain relationship. The proposed model simulation was done using the particle swarm optimization (PSO). Besides, the validity of the proposed model was verified with the experimental test results. In addition, ten finite elements (FE) models have been developed using ABAQUS software to further prove the validity of the new proposed stress-strain model when adopted in the numerical analysis methods. Concrete cubes with hybrid–fibers and steel fiber–reinforced concrete columns are used as case studies for this numerical investigation. The findings that predicted using this newly proposed model substantially align with the balanced outcomes achieved in this analysis of the experimental stress-strain curves.

2. Research Significance
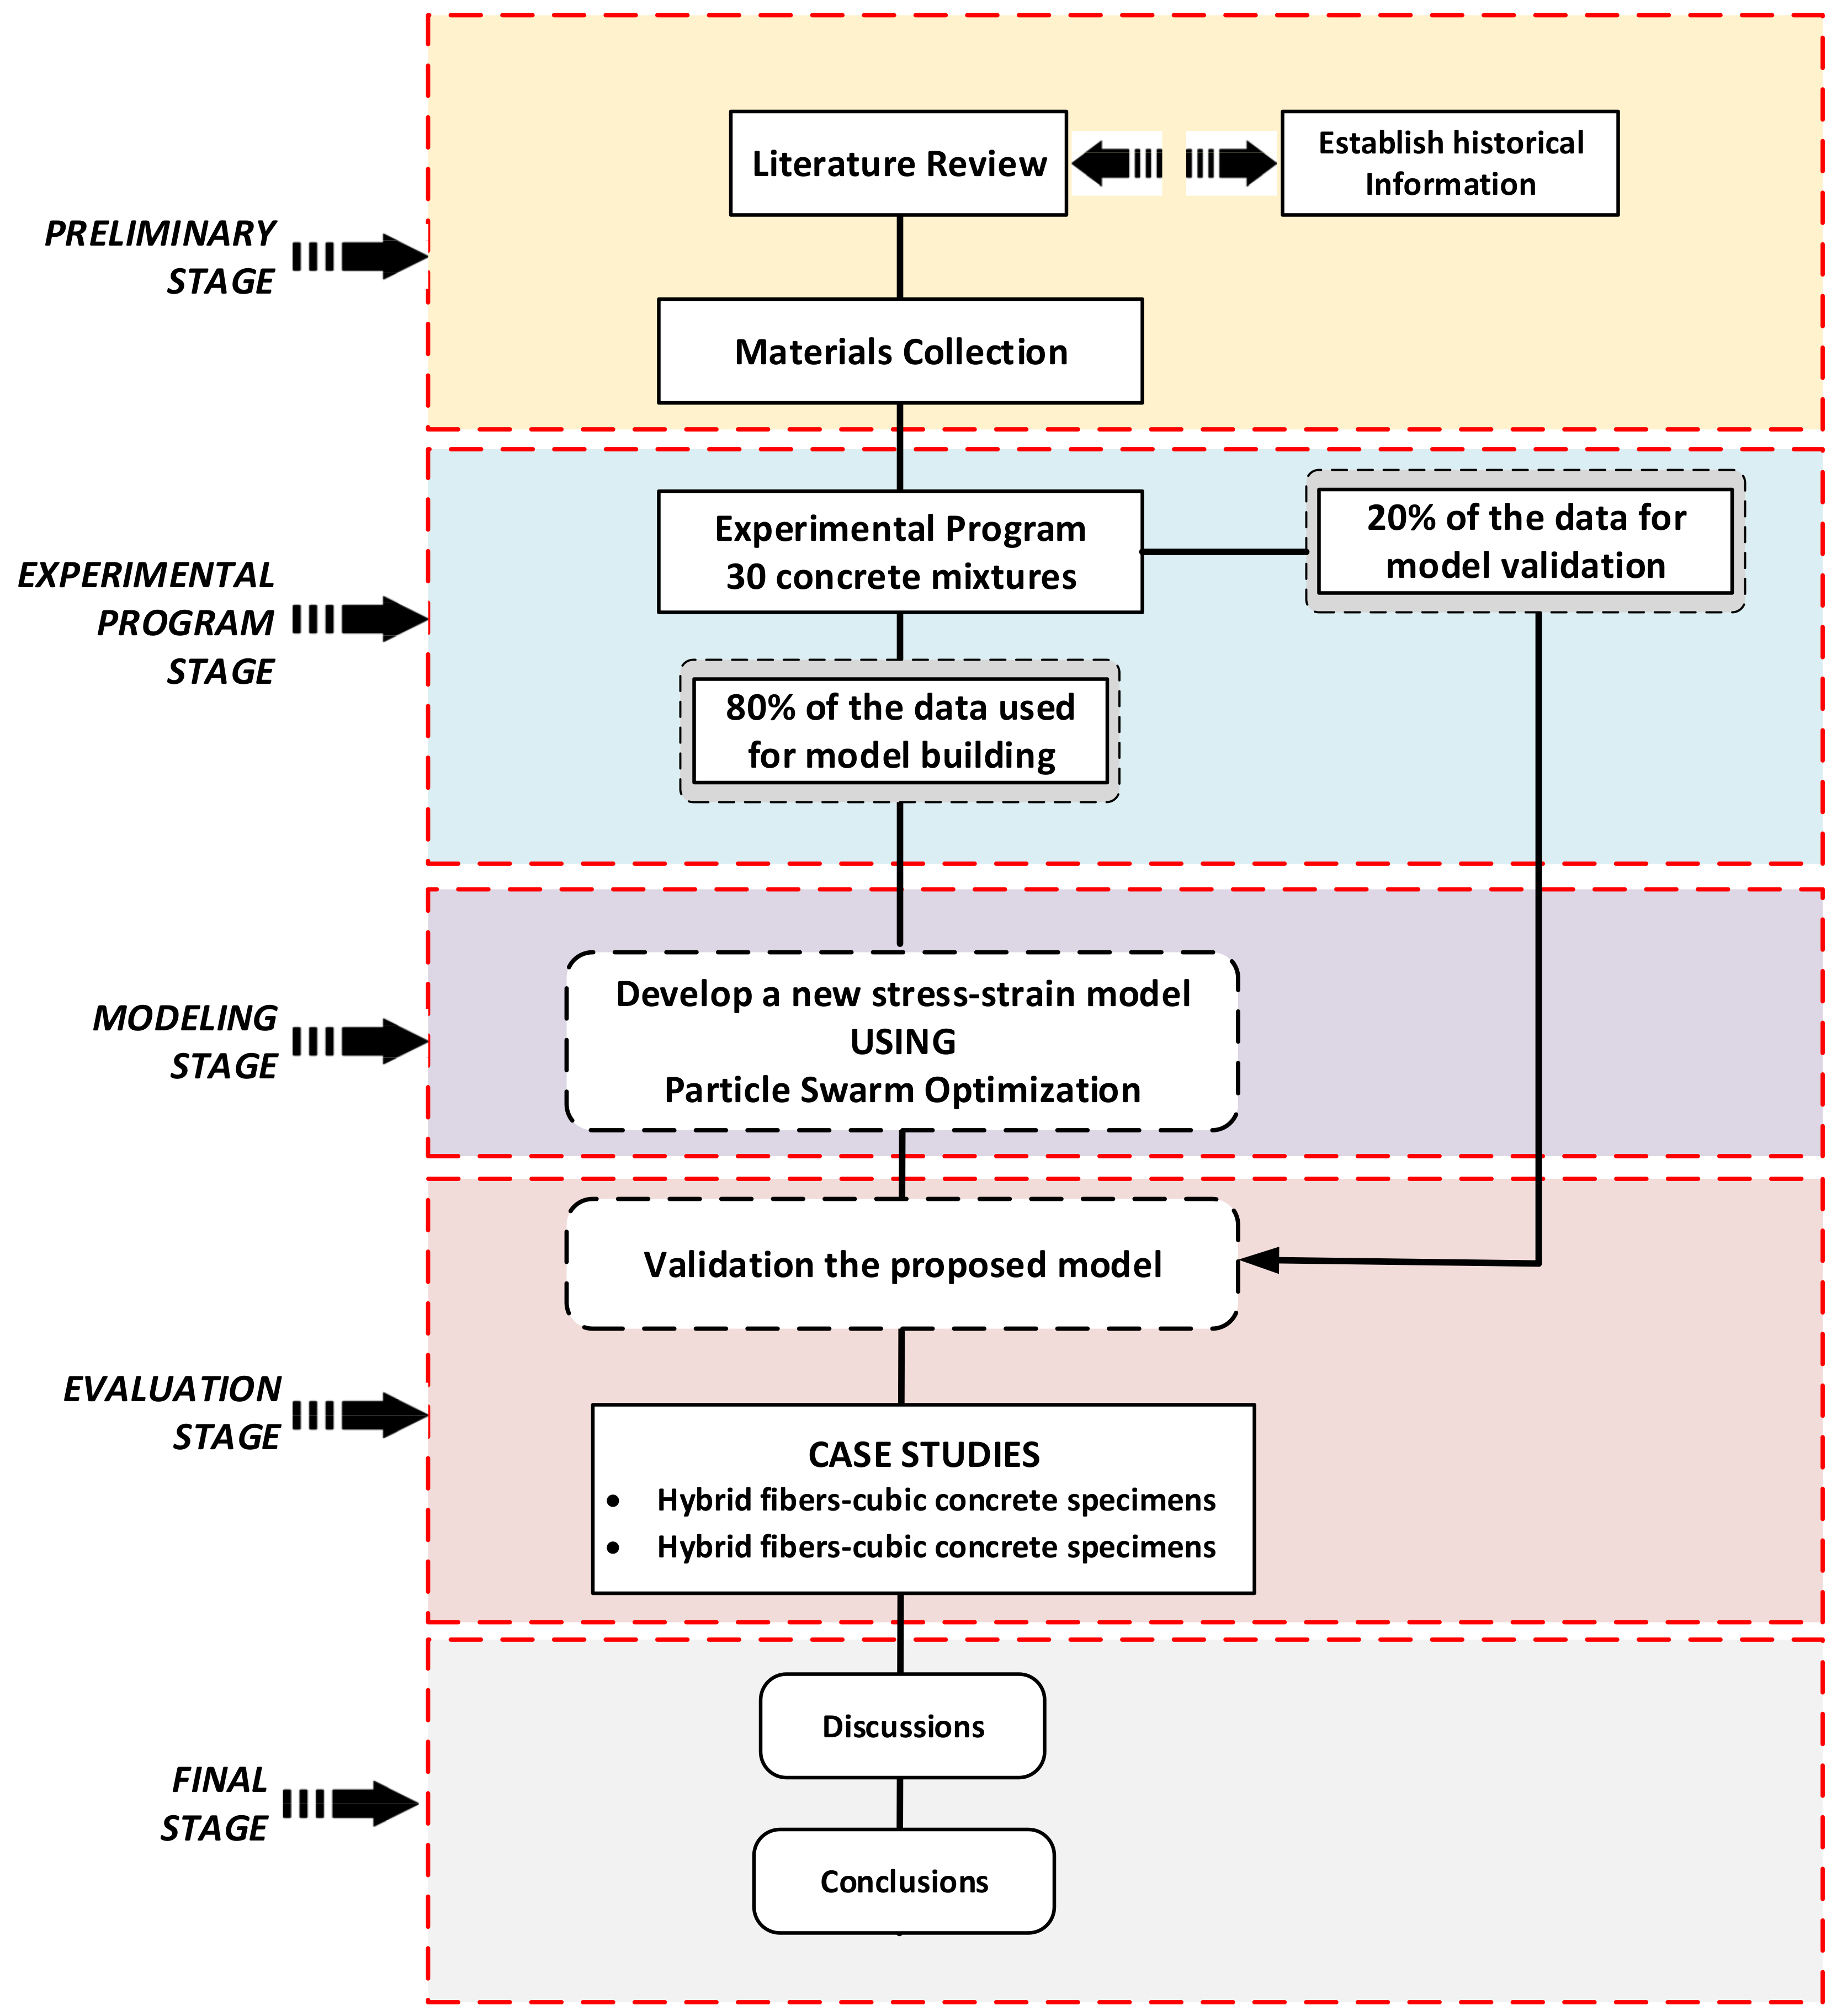
Fibers are frequently used in the construction industry to improve the mechanical properties of concrete parts. Given the fact that no single type of fiber can increase all the desired mechanistic characteristics of concrete, combinations of fibers (hybrid fibers) can have a higher effect, which is referred to as high-performance reinforced concrete (HFRC). The HFRC exhibits collaborative behavior as a result of the contributions of steel and polyvinyl alcohol fibers, among other factors. Steel fibers, on the other hand, add to the material’s crack resistance and toughness by increasing the material’s toughness. Polyvinyl alcohol fibers, on the other hand, are essential in order to prevent the formation and development of microcracks. The use of hybrid fibers in the manufacturing of high-strength HFRC improves toughness by altering the post-peak region of the stress-strain graphs, as seen in the figure. It is proposed in this paper that a stress-strain model for high-frequency reinforced concrete be utilized to improve the structural response in present design procedures.

3. Work Methodology

The methodology approach followed in the current study included a literature survey, experimental program, optimization analysis, and numerical simulations using finite element (FE) analysis. Figure 1 displays a schematic depiction of the methodology approach adopted in the current study.

3.1. Experimental Program

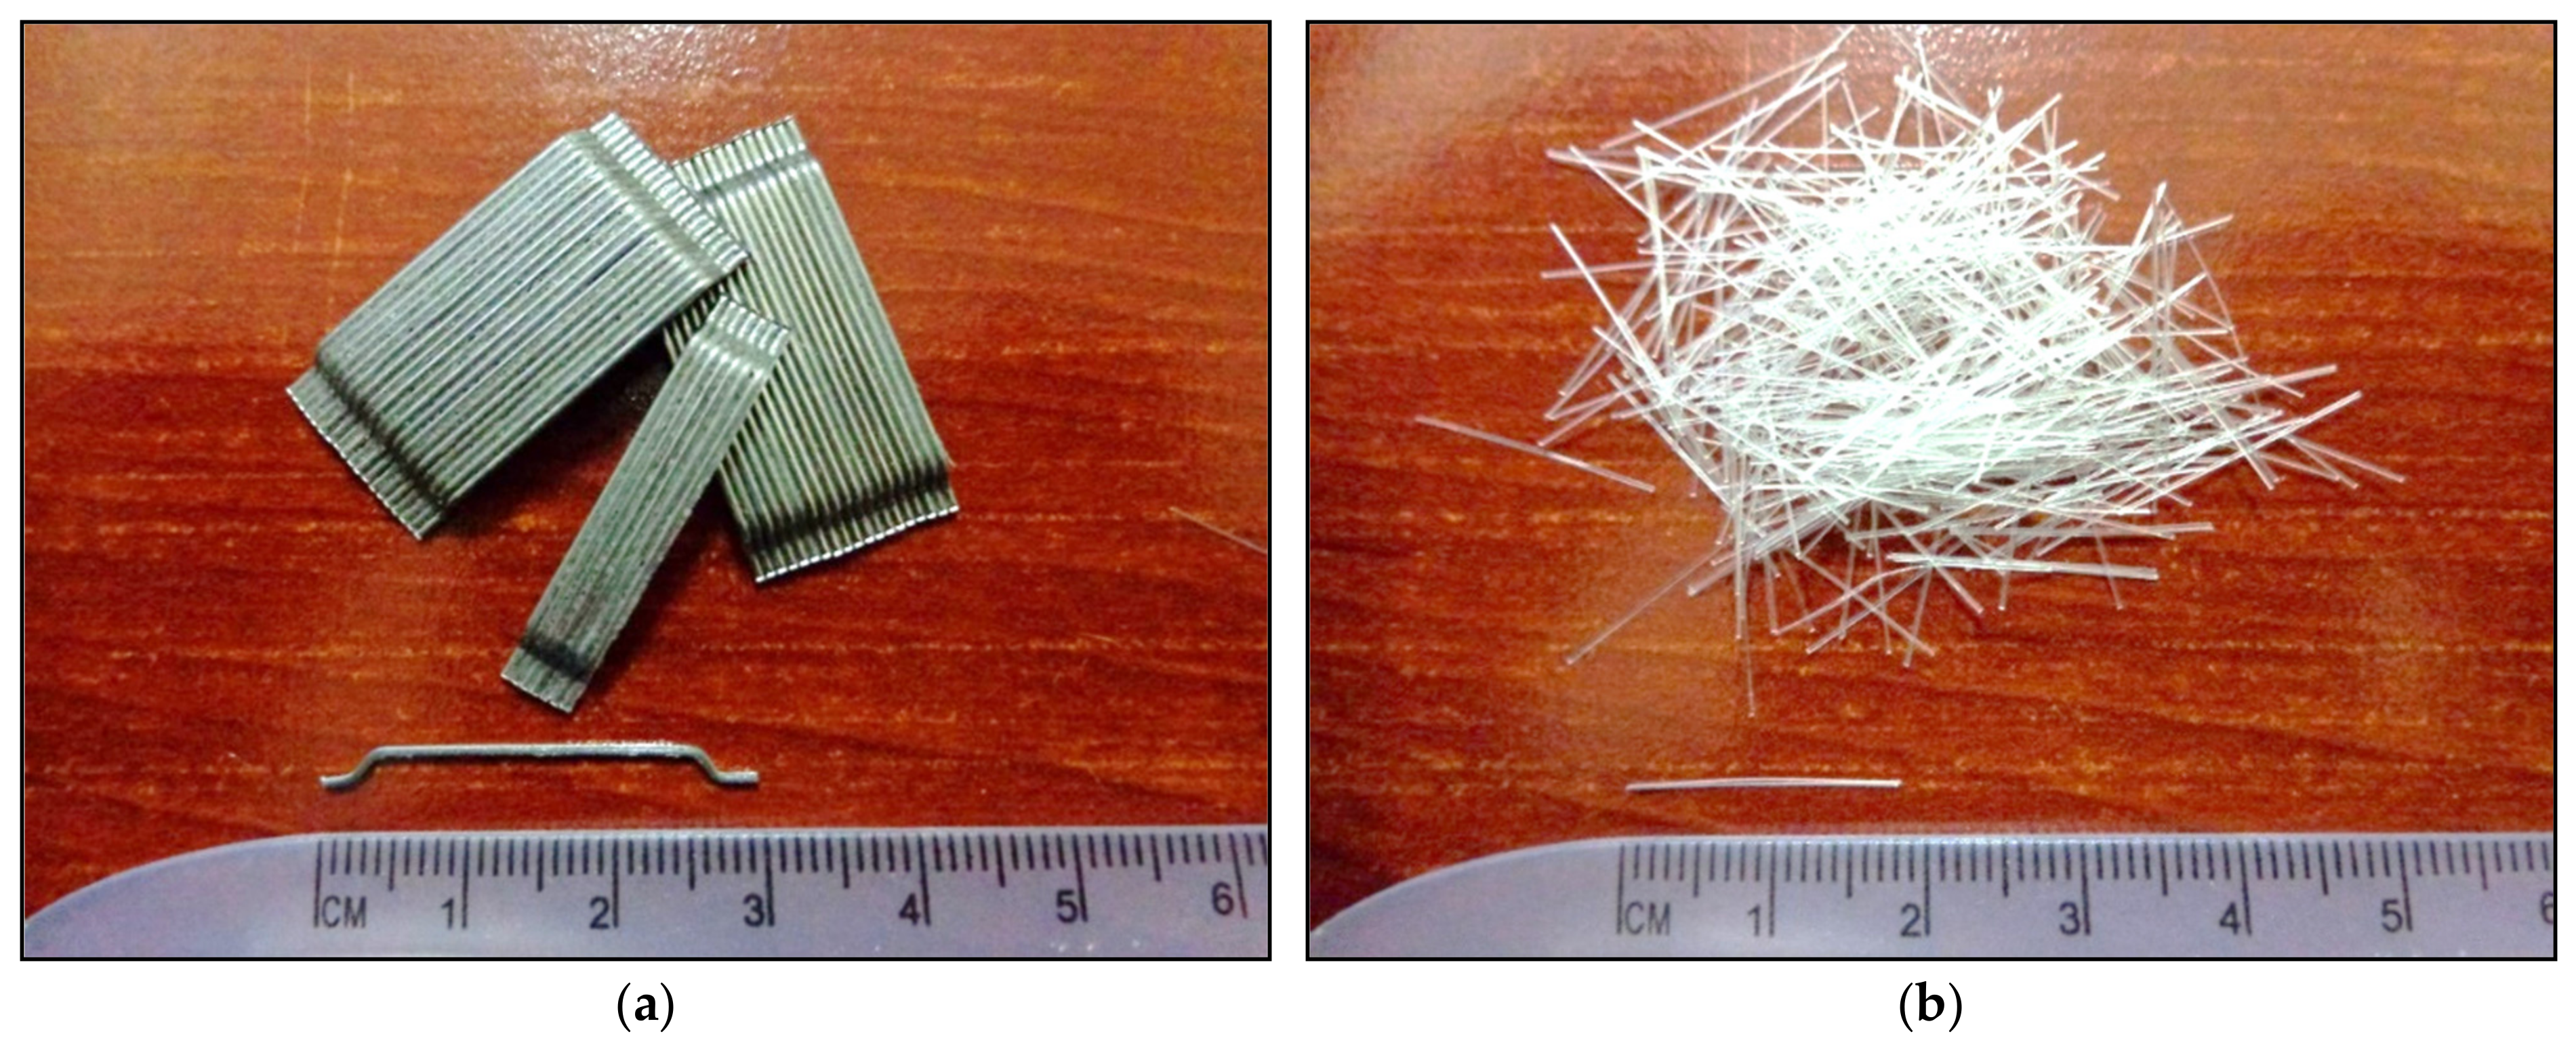
3.1.1. Testing Materials

Two kinds of Portland cement (PC) naming, type I (CEM I 42.5R) and II (CEM I 52.5R), were utilized in the batches. The use of supplementary cementing materials “silica fume SF” and coal combustion residue “fly ash (FA)” as cement substitutes has been widely accepted. Cementitious material’s chemical and physical properties are listed in Table 1. The addition of a chemical admixture, superplasticizer (SP), reduced the amount of water required to obtain the desired consistency of concrete mixture. It was decided to use river sand as both the fine and coarse aggregates, which had a finesse modulus of 2.67. A constant ratio of 3 has been adopted for water (w) to binder (B) (w/B = 0.3). In addition, the fraction of SF of 8% by weight has been adopted as a cement replacement. In order to reduce the amount of cement required, FA/B (15, 35, and 65%) was utilized as a fly ash binder with three ratios of aggregate (A/B) (1, 2, and 3). Two different fibers: polyvinyl alcohol (P) and hocked steel (S) have been used in this work, as shown in Figure 2 (length L = 18 mm, and diameter D = 0.4 mm, respectively). Table 2 lists the characteristics of the fibers that were employed. P and S Fiber have a maximum volume fiber fraction of 0.75% and 0.75%, respectively, while the maximum total fiber fraction is 1.5%.

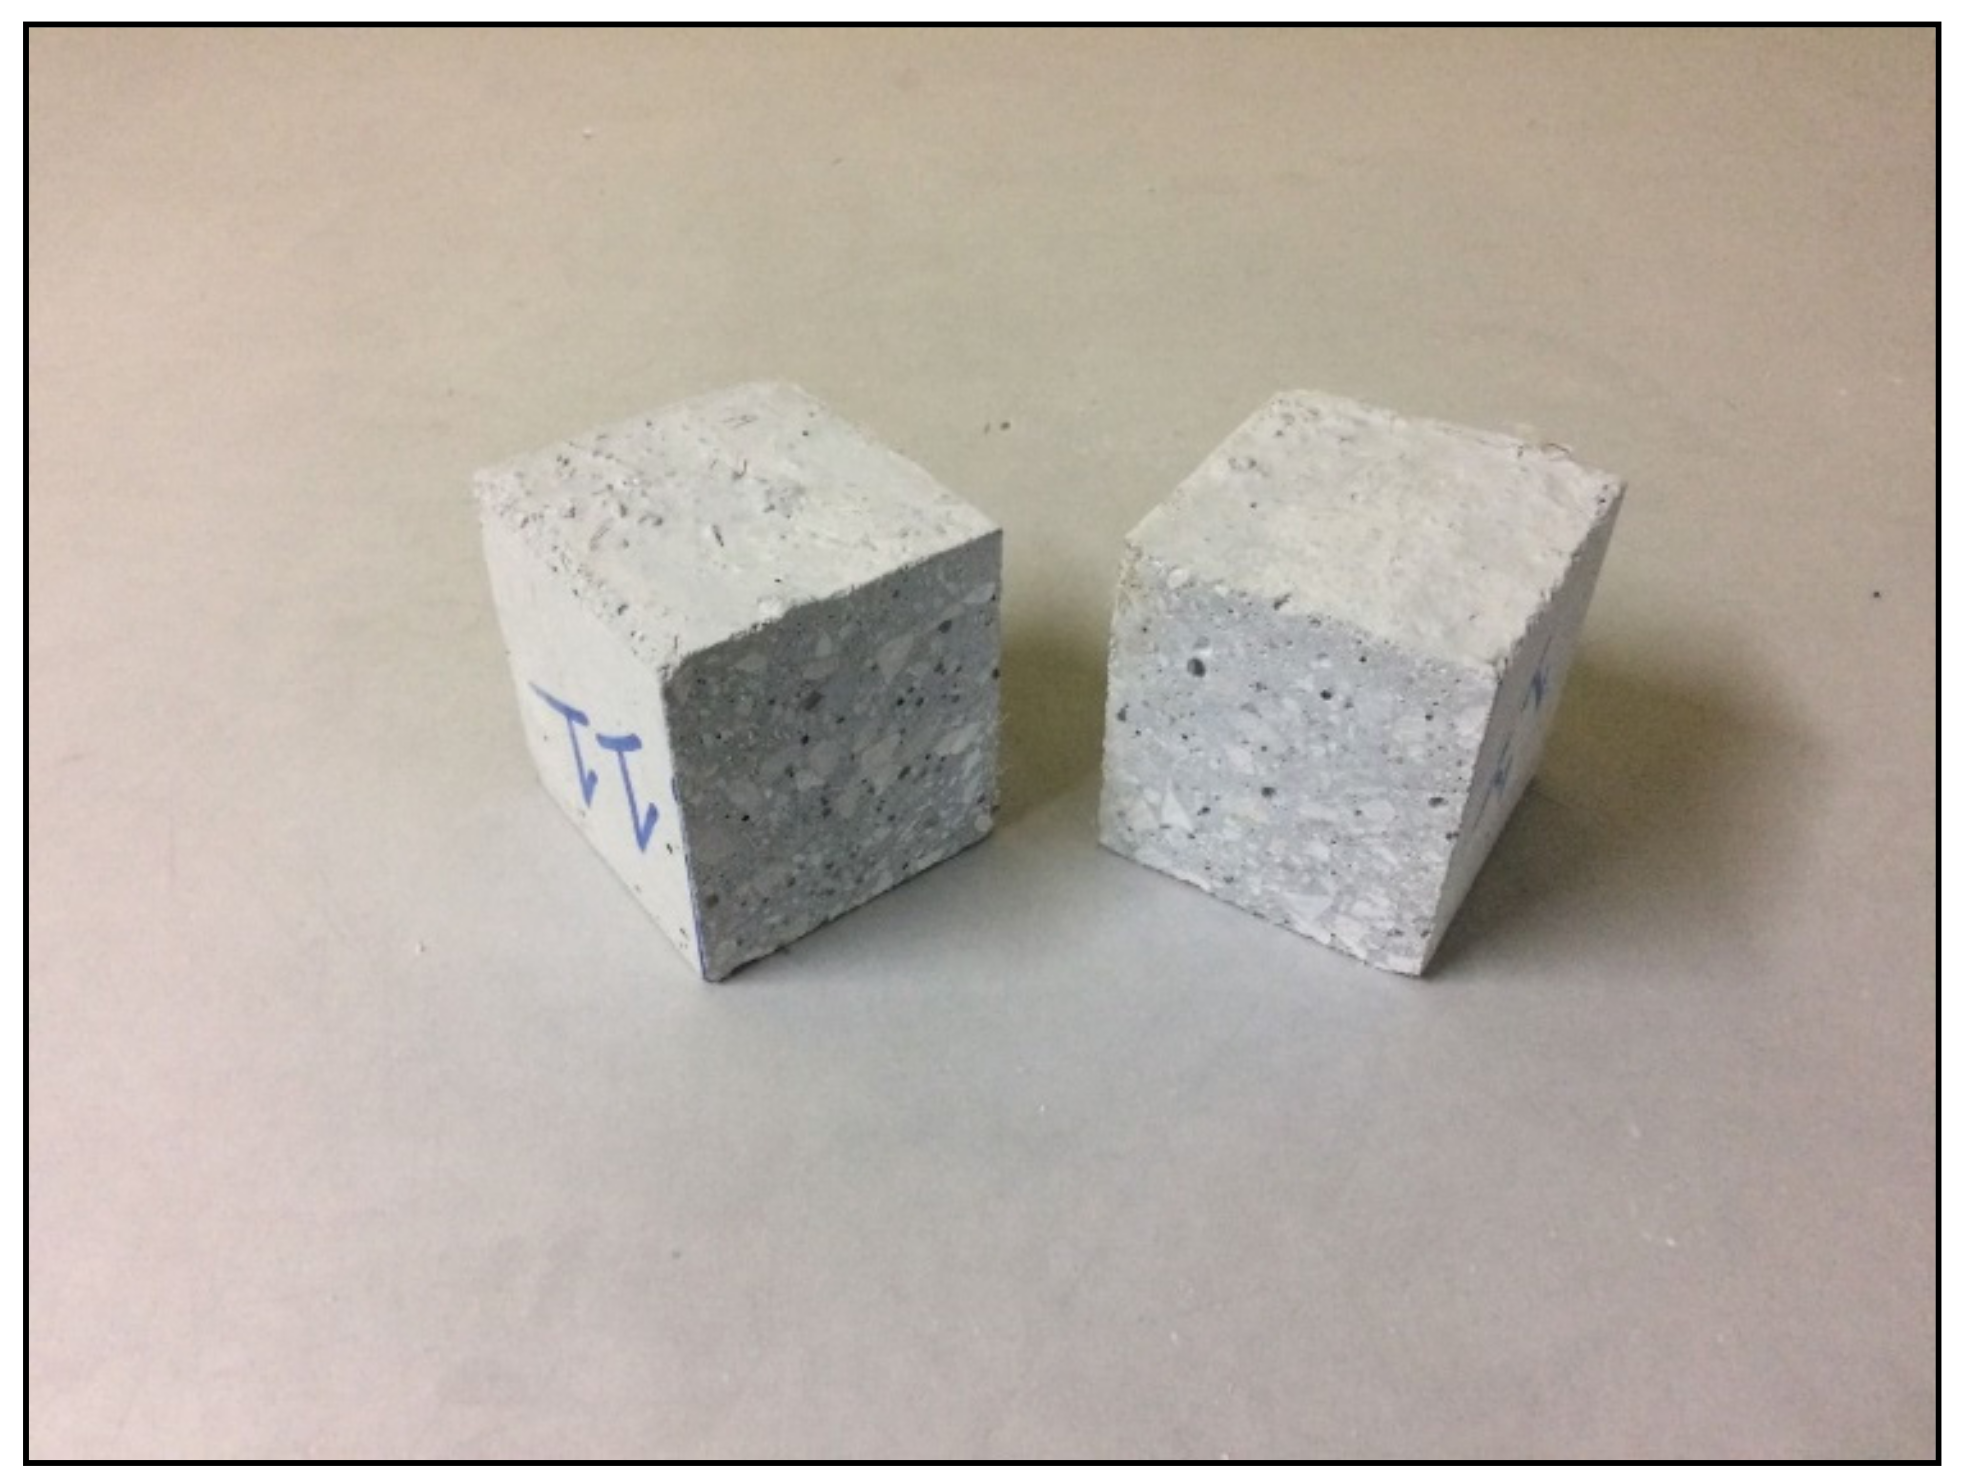
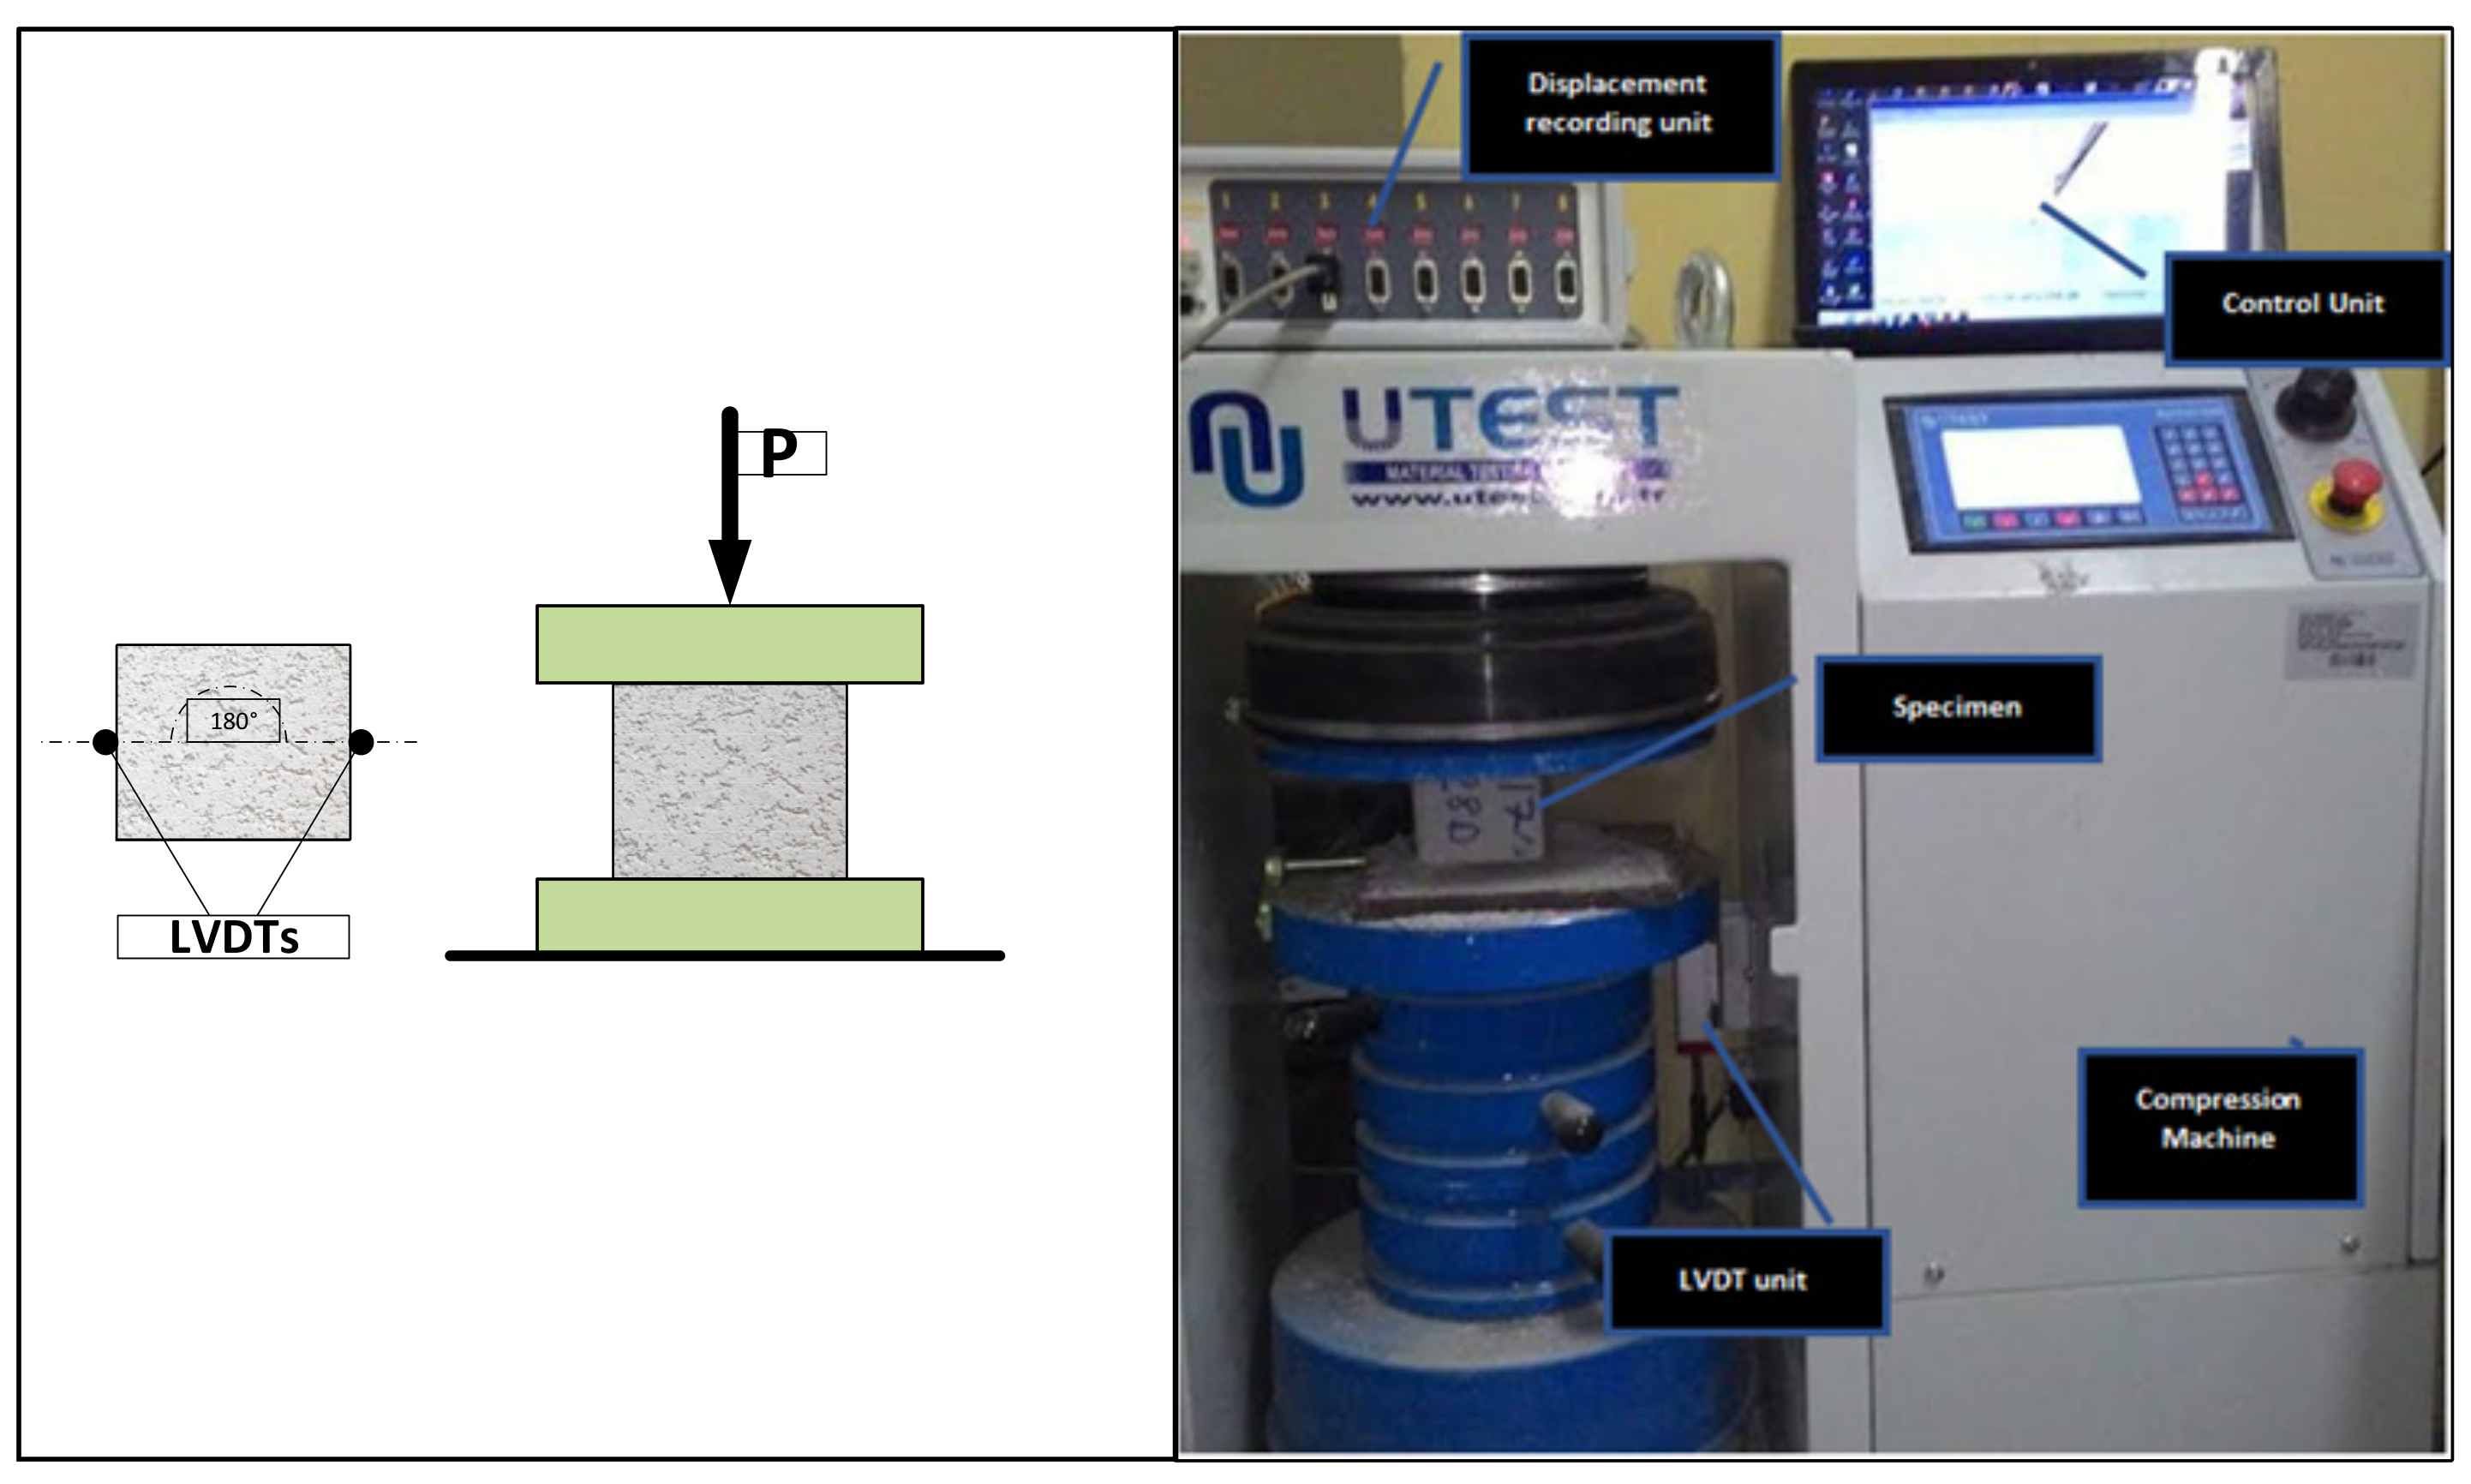
3.1.2. Sample Preparation and Testing

Ordinary composite Portland cement type II conforming to ASTM C150/C150M-19a [32] was used as a binding material in the mixture of the concrete. This study prepared and tested a total of 30 concrete mixtures, the proportions of which are listed in Table 3. The batches were prepared using a 40-L concrete mixer pan. First, the sand and gravel are combined for 3 min in a dry environment to ensure a uniform distribution. Then, for 5 min, the dry blend was supplemented with cement and fly ash. Afterwards, silica fume and superplasticizer are dissolved in water and slowed added to the mixture for at least five minutes until the desired consistency is reached. After fibers are added, the entire mixture is re-mixed for 5 min. Figure 3 shows the compression test specimens, which are cuboidal specimens with dimensions of (150 mm).
In order to conduct the uniaxial compression tests, a 2000 kN capacity compression machine was used. The loading rate was approximately 4 kN/min, and each specimen took about 20 min until it completely failed. The dimensions of the cube and cylinder samples used were 200 mm × 200 mm × 200 mm. The specimens were de-moulded after 24 h and cured in water according to ASTM C192 [33]. After 28 days of curing, the compressive strength was tested, as depicted in Figure 4. To ensure that the results were valid, the experiments were performed three times for each test model (cube). The linear variable differential transformer (LVDT) coupled to the loading cell of the machine was used to measure the deformation of the cubic specimens during the test. A data acquisition system recorded and presented deformation data on the computer. As a result of the compressive test, all the specimens were crushed. Compressive stresses and strains were derived from this data.

3.2. Optimization Model of Stress-Strain Relationship for HFRC

In order to generate an ideal HFRC stress-strain curve in two dimensions, optimization is required. The objective function was formulated, an optimization method was chosen, and a convergence criterion was established, all three of which were taken into account. The following sections go into detail about each of these points.

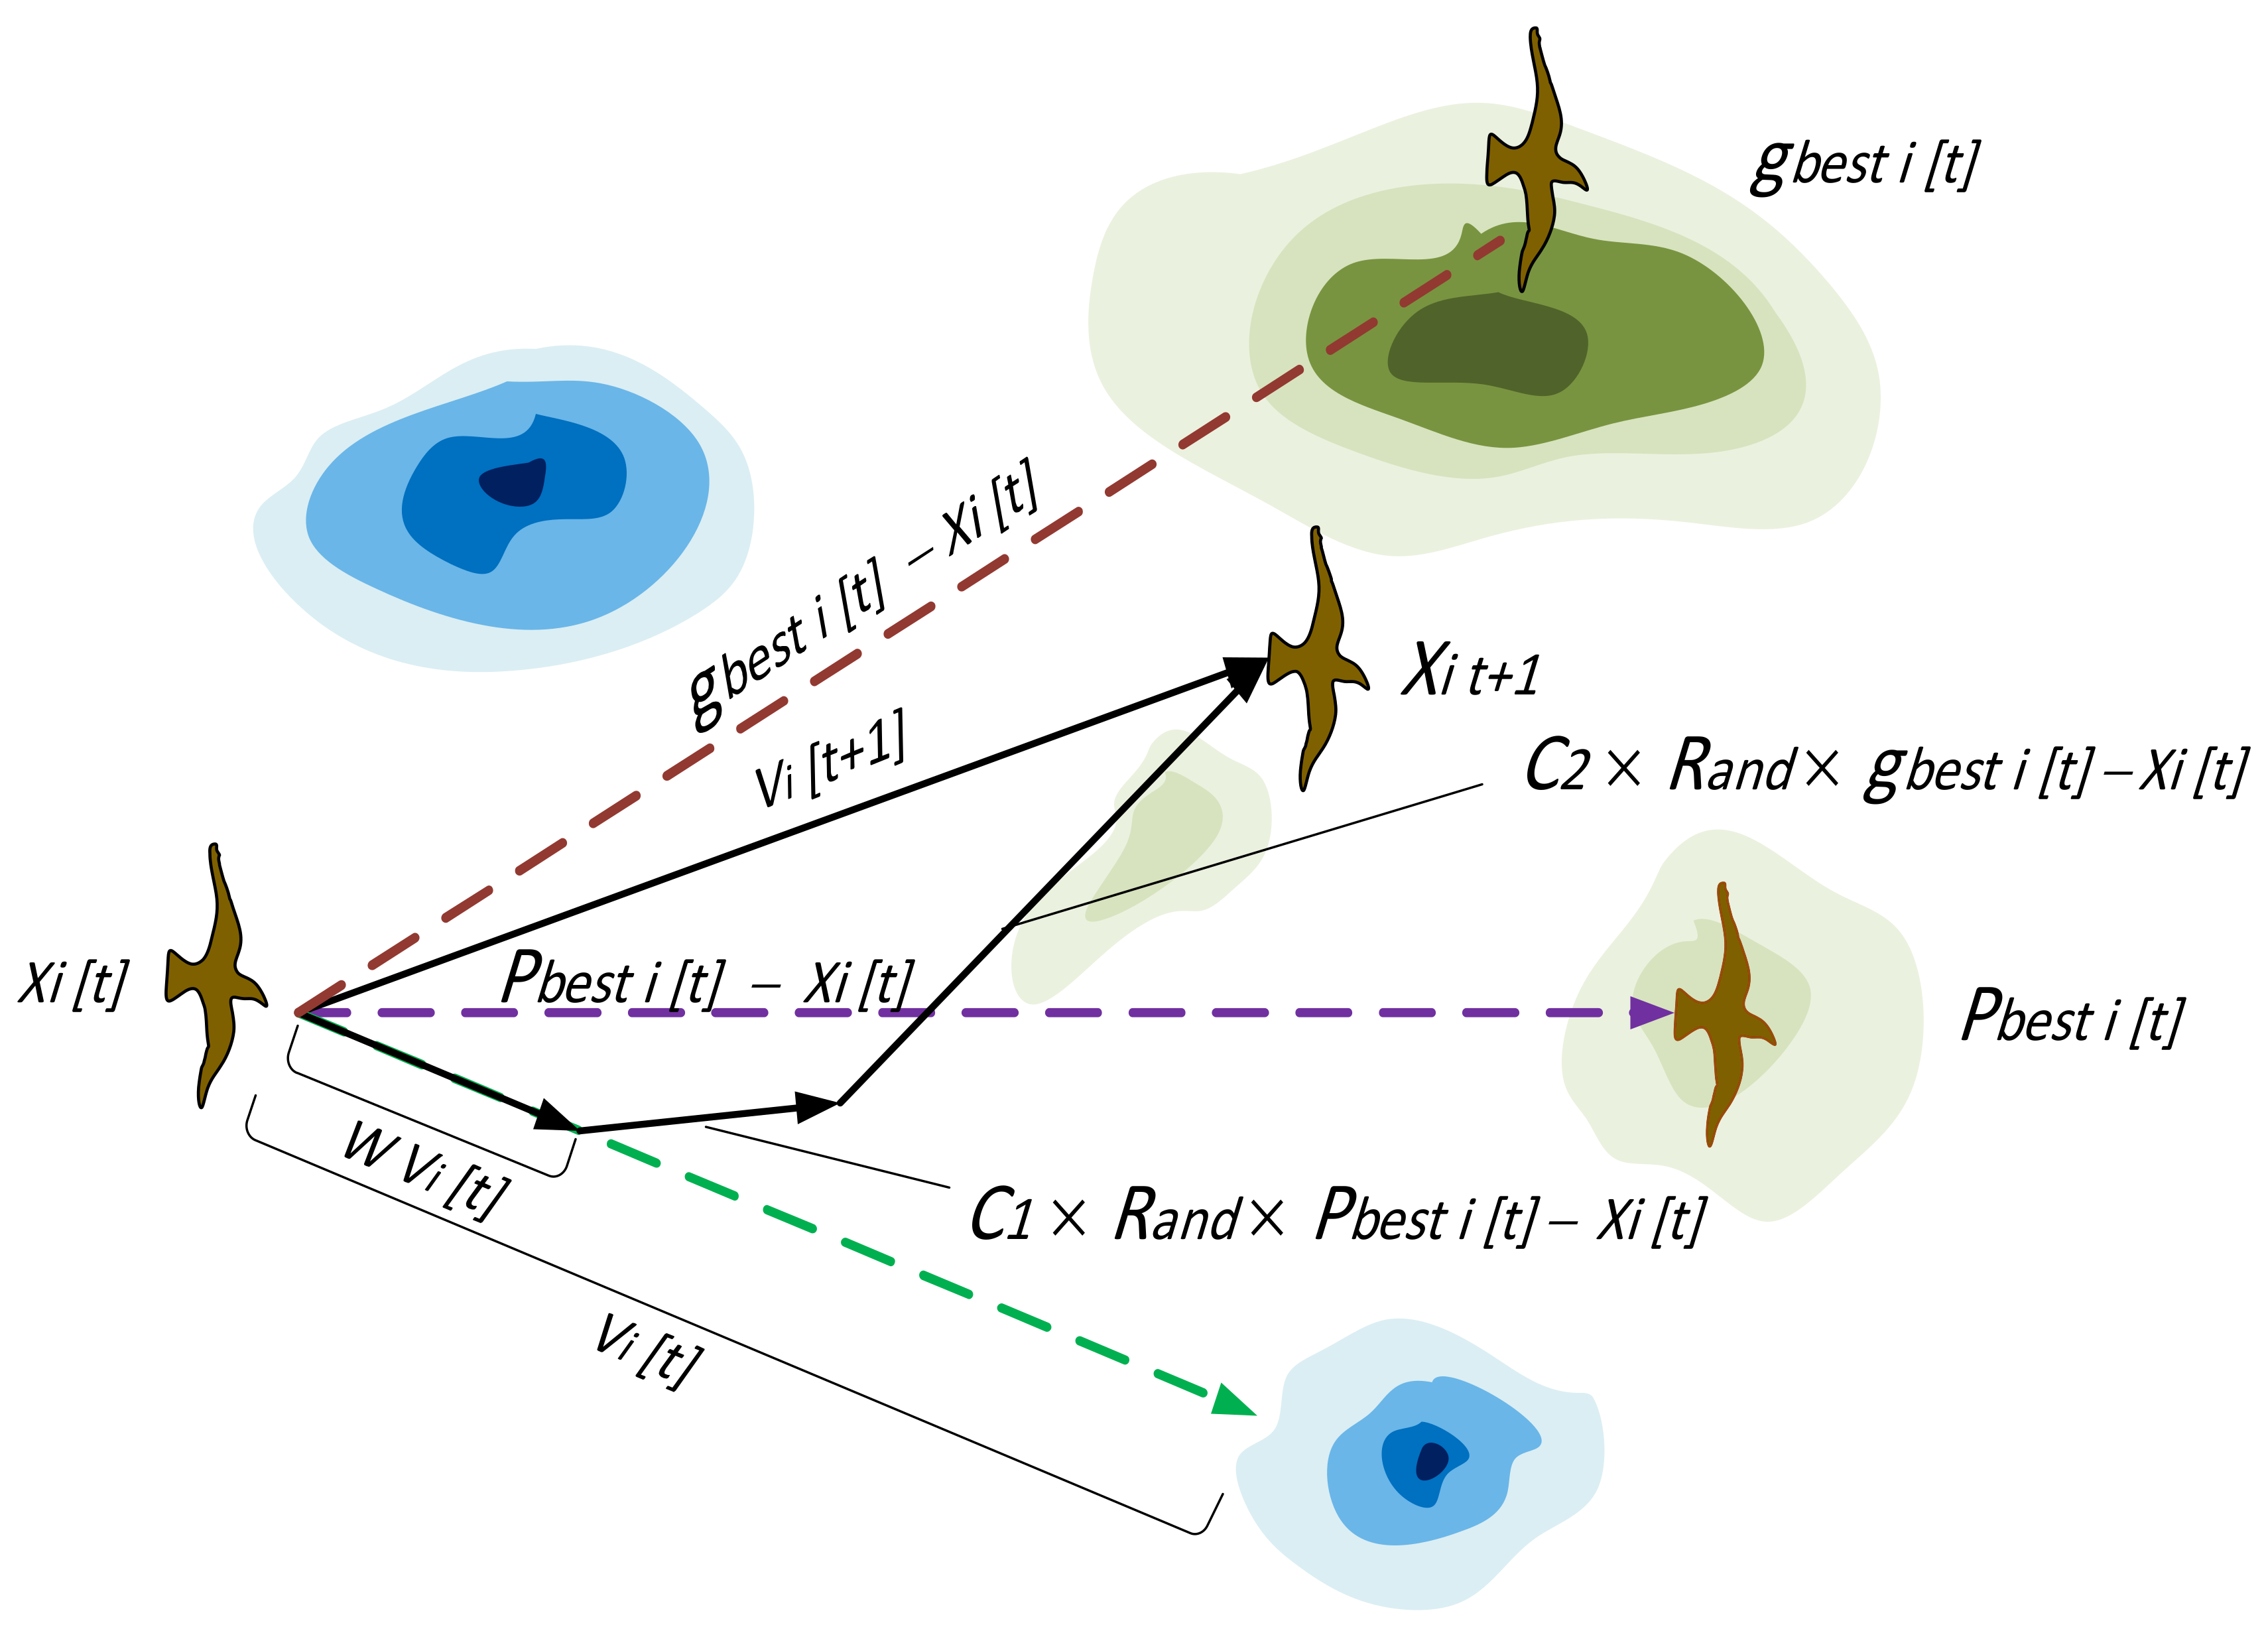
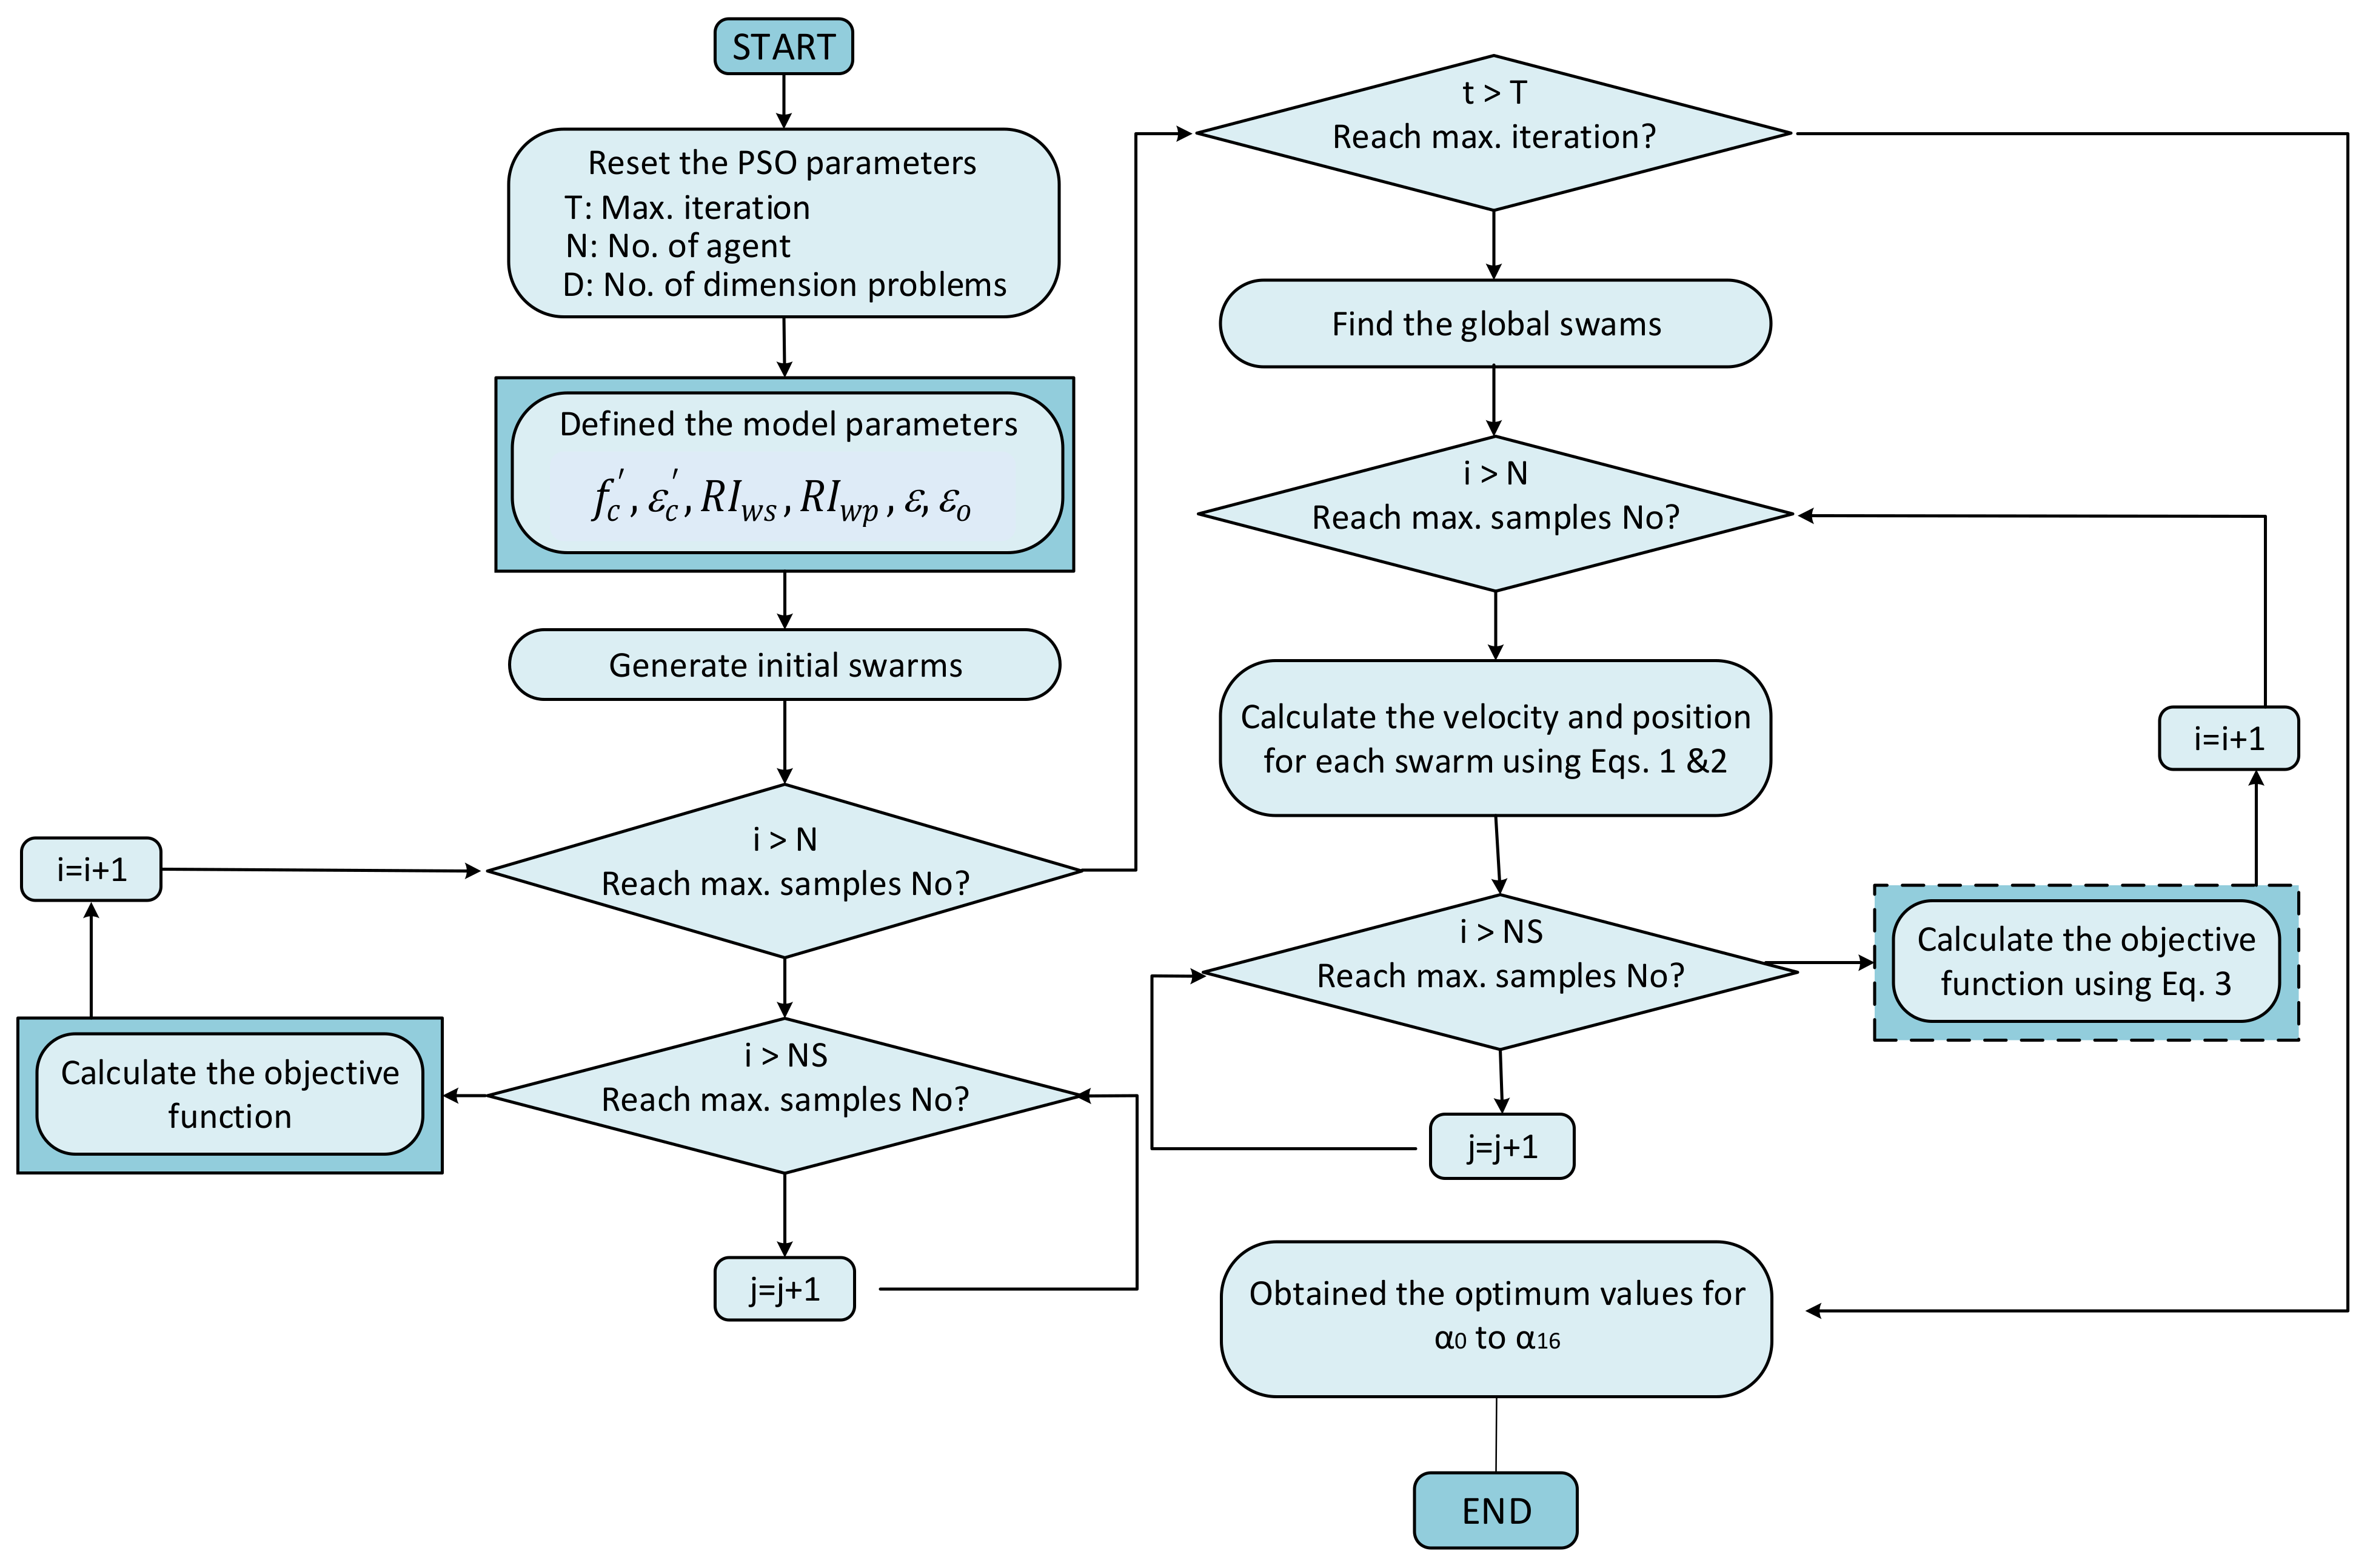
3.2.1. PSO Algorithm

It has been found that machine learning techniques outperform traditional methods in terms of their performance. Conventional regression methods have a key drawback in that they require a suitable initial model parameter set [31]. In addition, conventional methods may end up in multiple local minima, which is a problem. An extensive search space can be found in the new metaheuristic high-level procedure called “particle swarm optimization” (PSO). The ultimate results would be global minima, free of the local trap. PSO is memory and performance efficient when it comes to computing. It is simpler to build than other optimization methods since it makes use of probabilistic transition rules and does not start with a seed solution. the number of [1,34]. When combined with other optimization tools, it can build hybrid tools that have several advantages over other optimization methods.
It was motivated by observing the behavior of birds and fish in groups that inspired the PSO technique. Kennedy and Eberhart first proposed it [35,36]. A “swarm” of particles is formed in this method, which moves to find the best possible position for an optimization solution. When it comes to evolutionary algorithms, such as PSO, there is a population of people (also known as particles) whose positions are constantly being changed. Individual particles and swarms are repositioned as follows using the pbest and gbest positions of the best-performing particles in each iteration:
V i k + 1 = w × V i k + C 1 r 1 p b e s t   i k X i k + C 2 r 2 g b e s t   i k X i k
X i k + 1 = X i k + V i k + 1
In which ( X i and V i ) express the current position and velocity of the (ith) particle; C 1 and C 2 denote two positive acceleration constants; ( r 1 and r 2 ) two random values between (0 and 1); ( p b e s t   i k ) the ideal position visited by each particle; and g b e s t   i k represents the flying particle’s global optimal location in the swarm up to iteration k, when the flying particle’s global exploration and local exploitation abilities are balanced by w which is a weighting factor. A large inertia weight aids global exploration, but a low inertia weight aids local exploitation. Decrement function [ w k = a   w   x 1 ] is used in this study to reduce the inertia mass, where (a) is an increment constant less than but close to one.
The terms X i and V i denote the i-th particle’s current position and velocity; C 1 and C 2 denote two positive acceleration constants; ( r 1 and r 2 ) denote random values between (0 and 1); ( p b e s t   i k ) represents the optimal position visited by each particle; g b e s t   i k represents the flying particle’s global optimal location in the swarm up to iteration k; w is a weighting factor (inertia weight) that governs the trade-off between the flying particle’s global exploration and local exploitation abilities. Global exploration is facilitated by a high inertia weight, but local exploitation is facilitated by a low inertia weight. The inertia weight is decreased in this study using a decrement function defined by [ w k = a   w   x 1 ], where (a) is a constant that is less than but near to one.
Using PSO to maximize the objective function is represented in Figure 5, as shown. With each iteration, information from previous iterations, as well as information provided by other particles, is combined to create a new travel direction (solid line) for particle A. Particle B’s proximity to the ultimate solution in this iteration means it will pass along the global optimal coordinates to the other particles in turn. All particles can change their coordinates based on the best position of other particles thanks to this information sharing system.

3.2.2. Objective Function

Objective function is defined as the difference between predicted and observed values. Measurement of agreement between model output predictions and experimental outcomes is a primary goal of this objective function. The root-mean-square error is chosen as the objective function (RMSE). This objective function [37,38,39] can be calculated using the following expression:
RMSE = 1 n i = 1 n S A S E 2
where S A and S E represent the actual and predicted levels of stress, with n denoting the sample size.

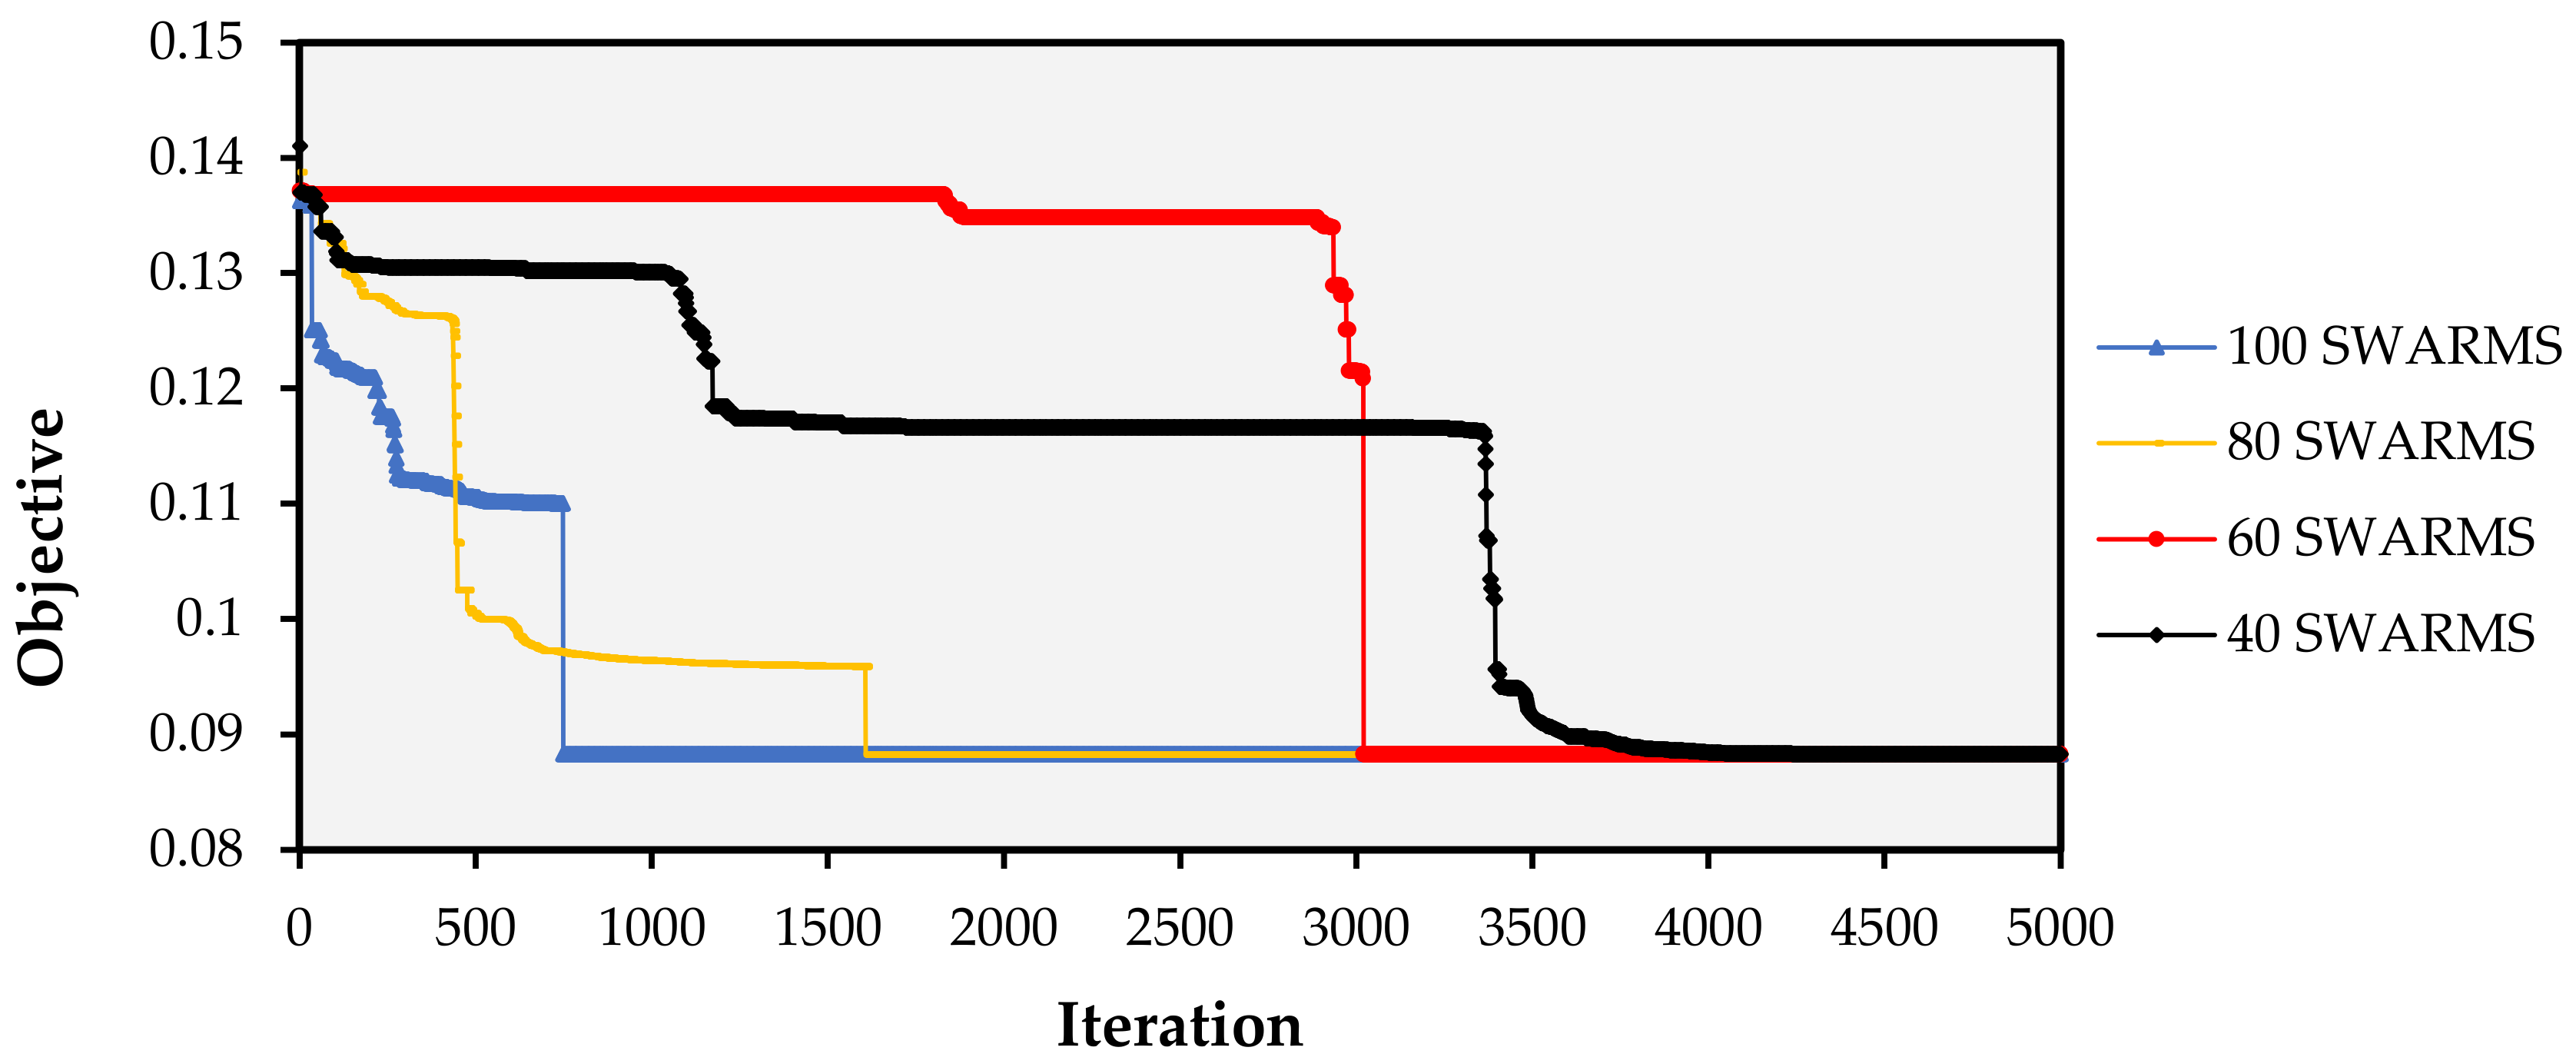
3.2.3. Convergence Criteria

There must be a set point at which the PSO search can be stopped because of its iterative nature. The two most prevalent criteria for convergence are the number of iterations and the smallest error in the objective function. If the optimum value is known in advance, the algorithm can be tested or fine-tuned. Although this is true in theory, it does not hold true in real-world structural optimization issues. PSO parameters are summarized in Table 4, while the PSO convergence parameters used in this study are listed and explained in Table 5.

3.2.4. Proposed Analytical Model and Data Processing

Four analytical models were used and modified to attain a good agreement between predicted and measured stress-strain relationships. In the proposed model, the stress-strain relationship of the HFRC was simulated using MATLAB code. PSO is used to find a previously unknown set of coefficients in the solution space. In the proposed model, the stress-strain relationship of the HFRC was simulated using MATLAB code.
Due to its consistency and simplicity, the formula suggested by Carreira and Chu [41] was used. For optimization analysis conducted using their experimental results, the following equations were obtained:
f H F R C = α 0 f c + α 1 R I w s α 2 + α 3 R I w p α 4
ε H F R C = α 5 ε c + α 6 R I w s + α 7 R I w p
β = α 8 + α 9 R I w s α 10 + α 11 R I w p α 12
where f c is the compressive strength of plain concrete (MPa),  ε c is the strain to correspond to f c ( ε c = 0.002 ). R I w s and R I w p are reinforcing index, which is is determined based on the fiber fraction:
R I w = w f · L f d f
where w f = fiber weight fraction ( w f 3 V f , V f = fiber volume fraction), L f = length of fiber (mm) and d f = diameter of the fiber (mm):
f H F R C f H F R C = α 13 β ε ε o α 14 β α 15 + ε ε o α 16 β
Here, f H F R C is the stress acting on the concrete (MPa); f H F R C , the compressive stress of concrete (MPa); ε , the compressive strain; ε o is the strain at peak stress; and β , a coefficient that determines the slope and shape of the curve.
The values of unknown coefficients, α 13   to   α 14 are obtained from the PSO algorithm, as presented in the following section. These values are then inserted in Equation (8) to generate the stress-strain curve. Figure 6 displays a flowchart of the proposed model.
It is possible to use soft-computing technologies to infer models that can predict within the data range given. Because the accuracy of the final models depends on the amount of data adopted during the modeling process, the magnitude of this data is important. The size of a dataset and the distribution of its variables have an impact on the performance of any model that is developed utilizing this data. There were two independent datasets: one to build the model, and the other to test it once it had been built. Twenty-four (80%) of the 30 curves were utilized to build the model; the remaining six (20%) were used to test the model. Using a fraction of three samples for each variable, were able to attain model adequacy [42]. The construction set ratio was 4 in this investigation, which fulfills and exceeds the requirement specified in the study design (i.e., 3).

4. Results and Discussion

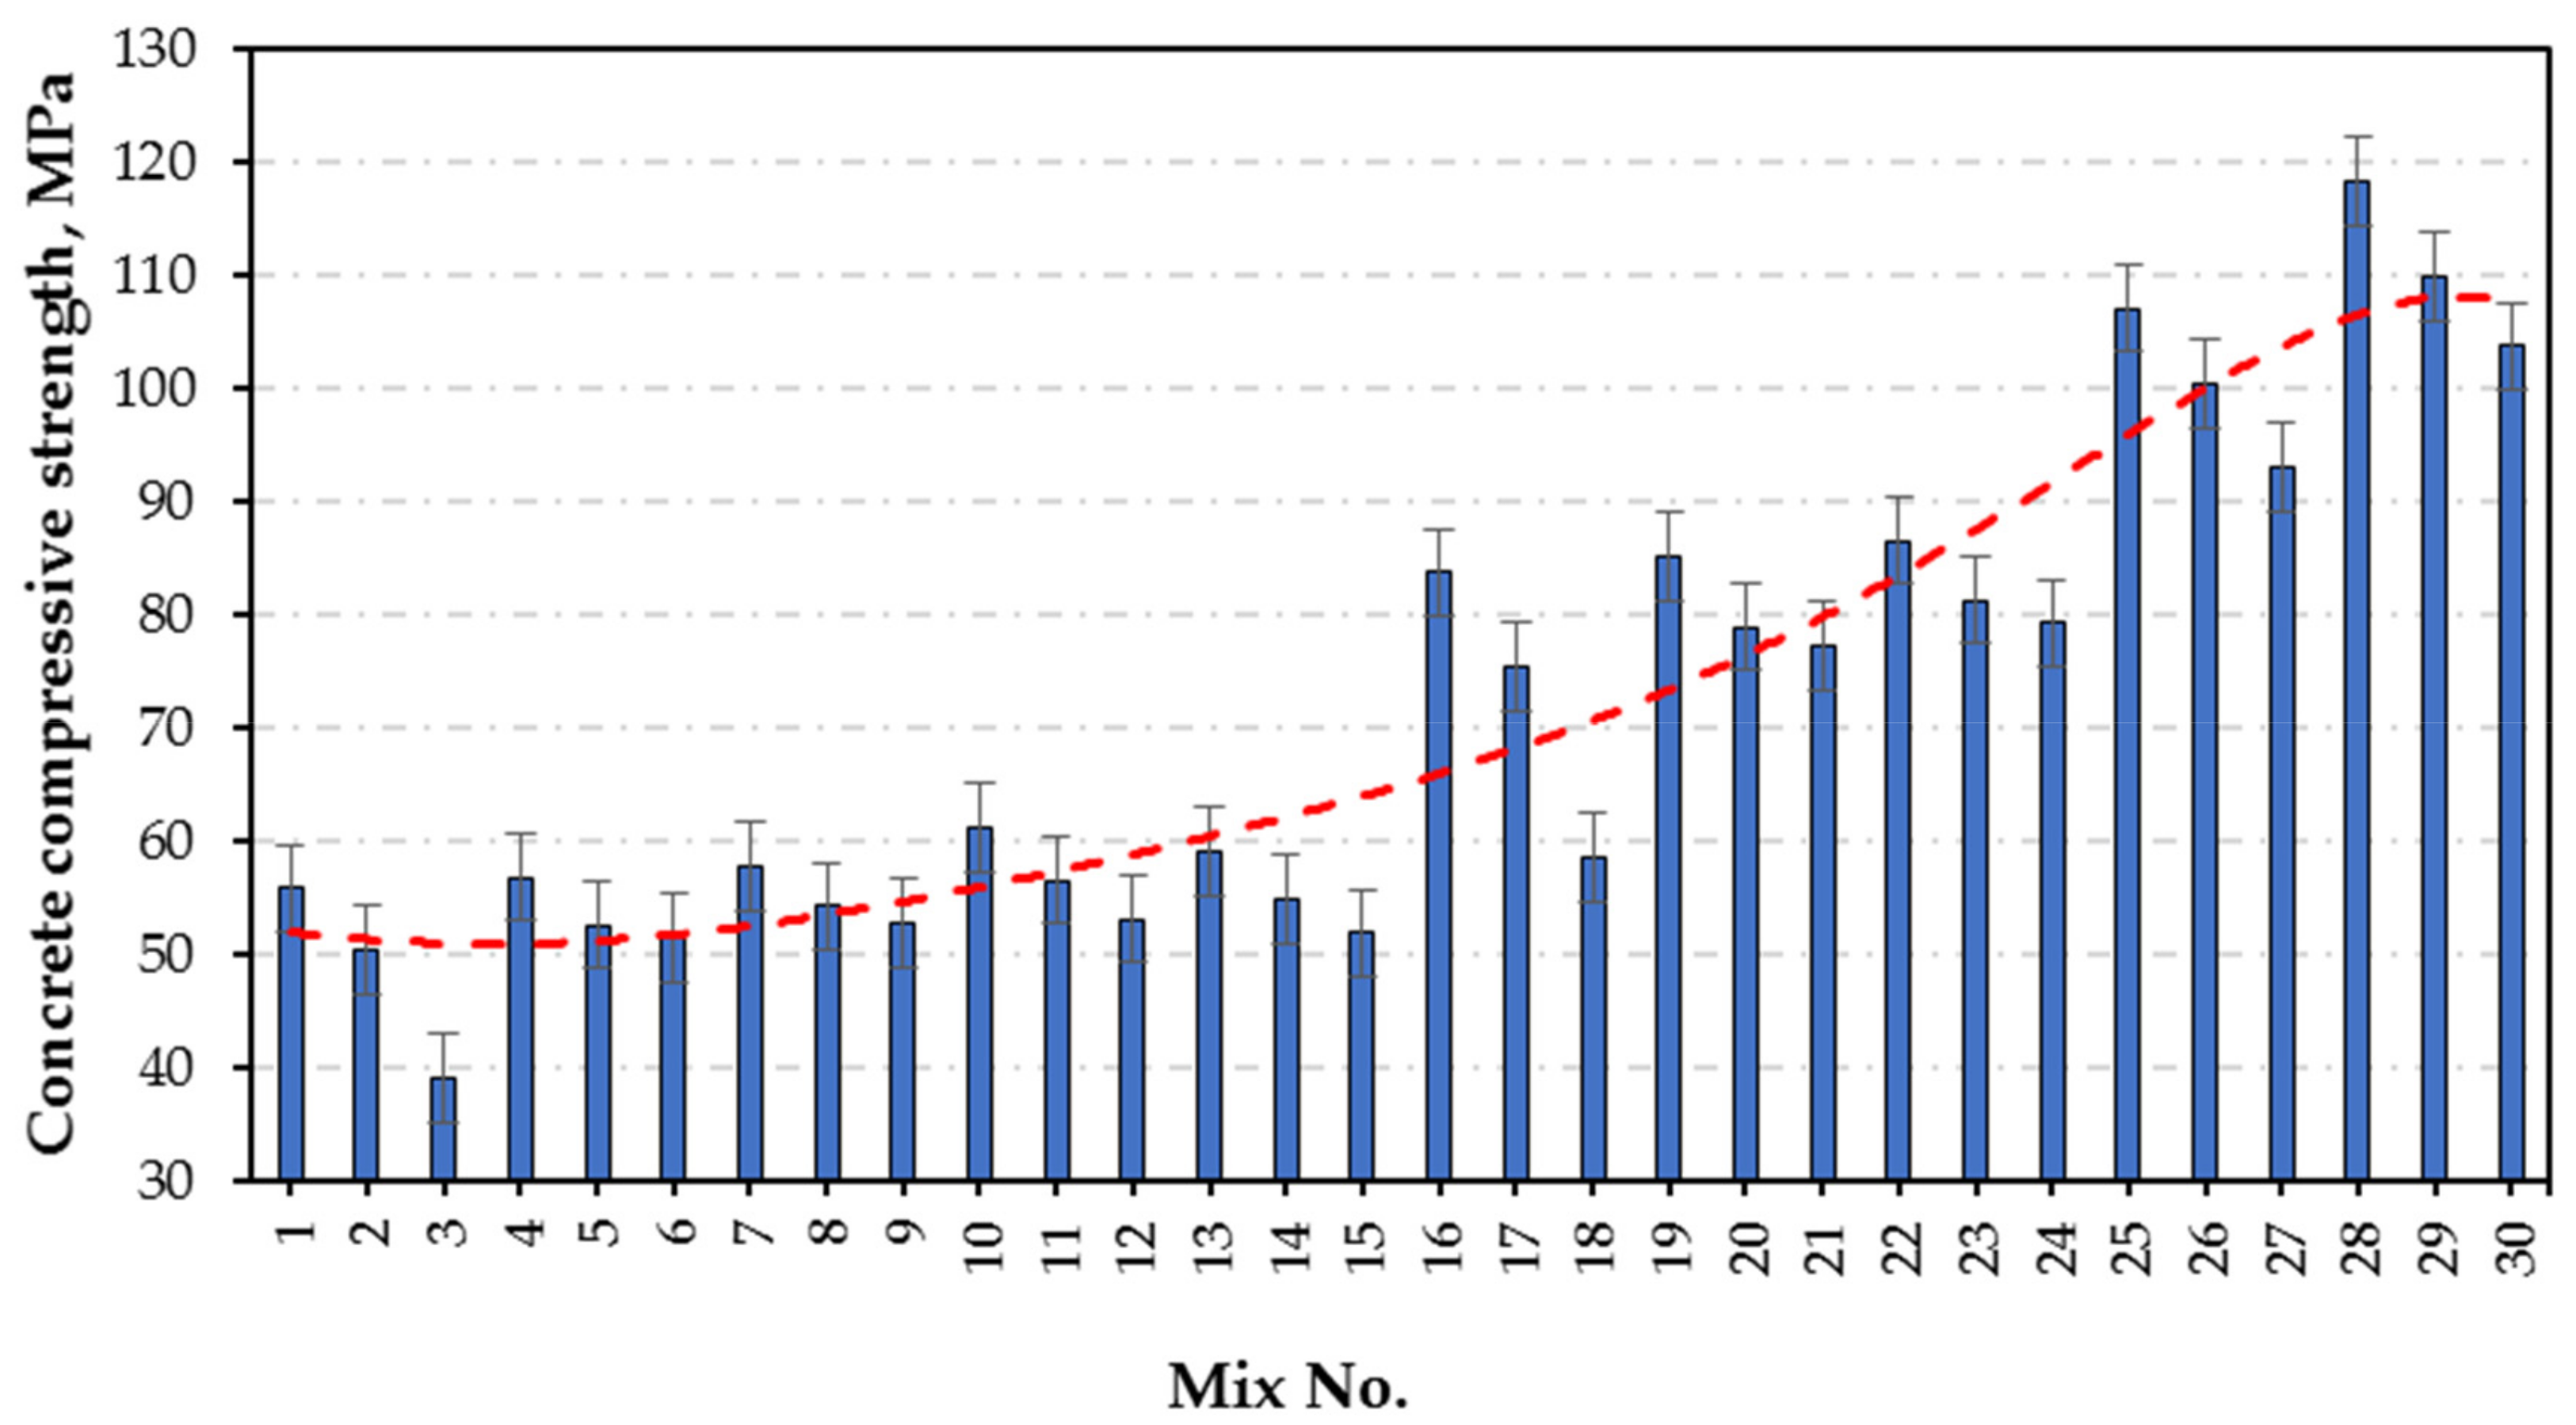
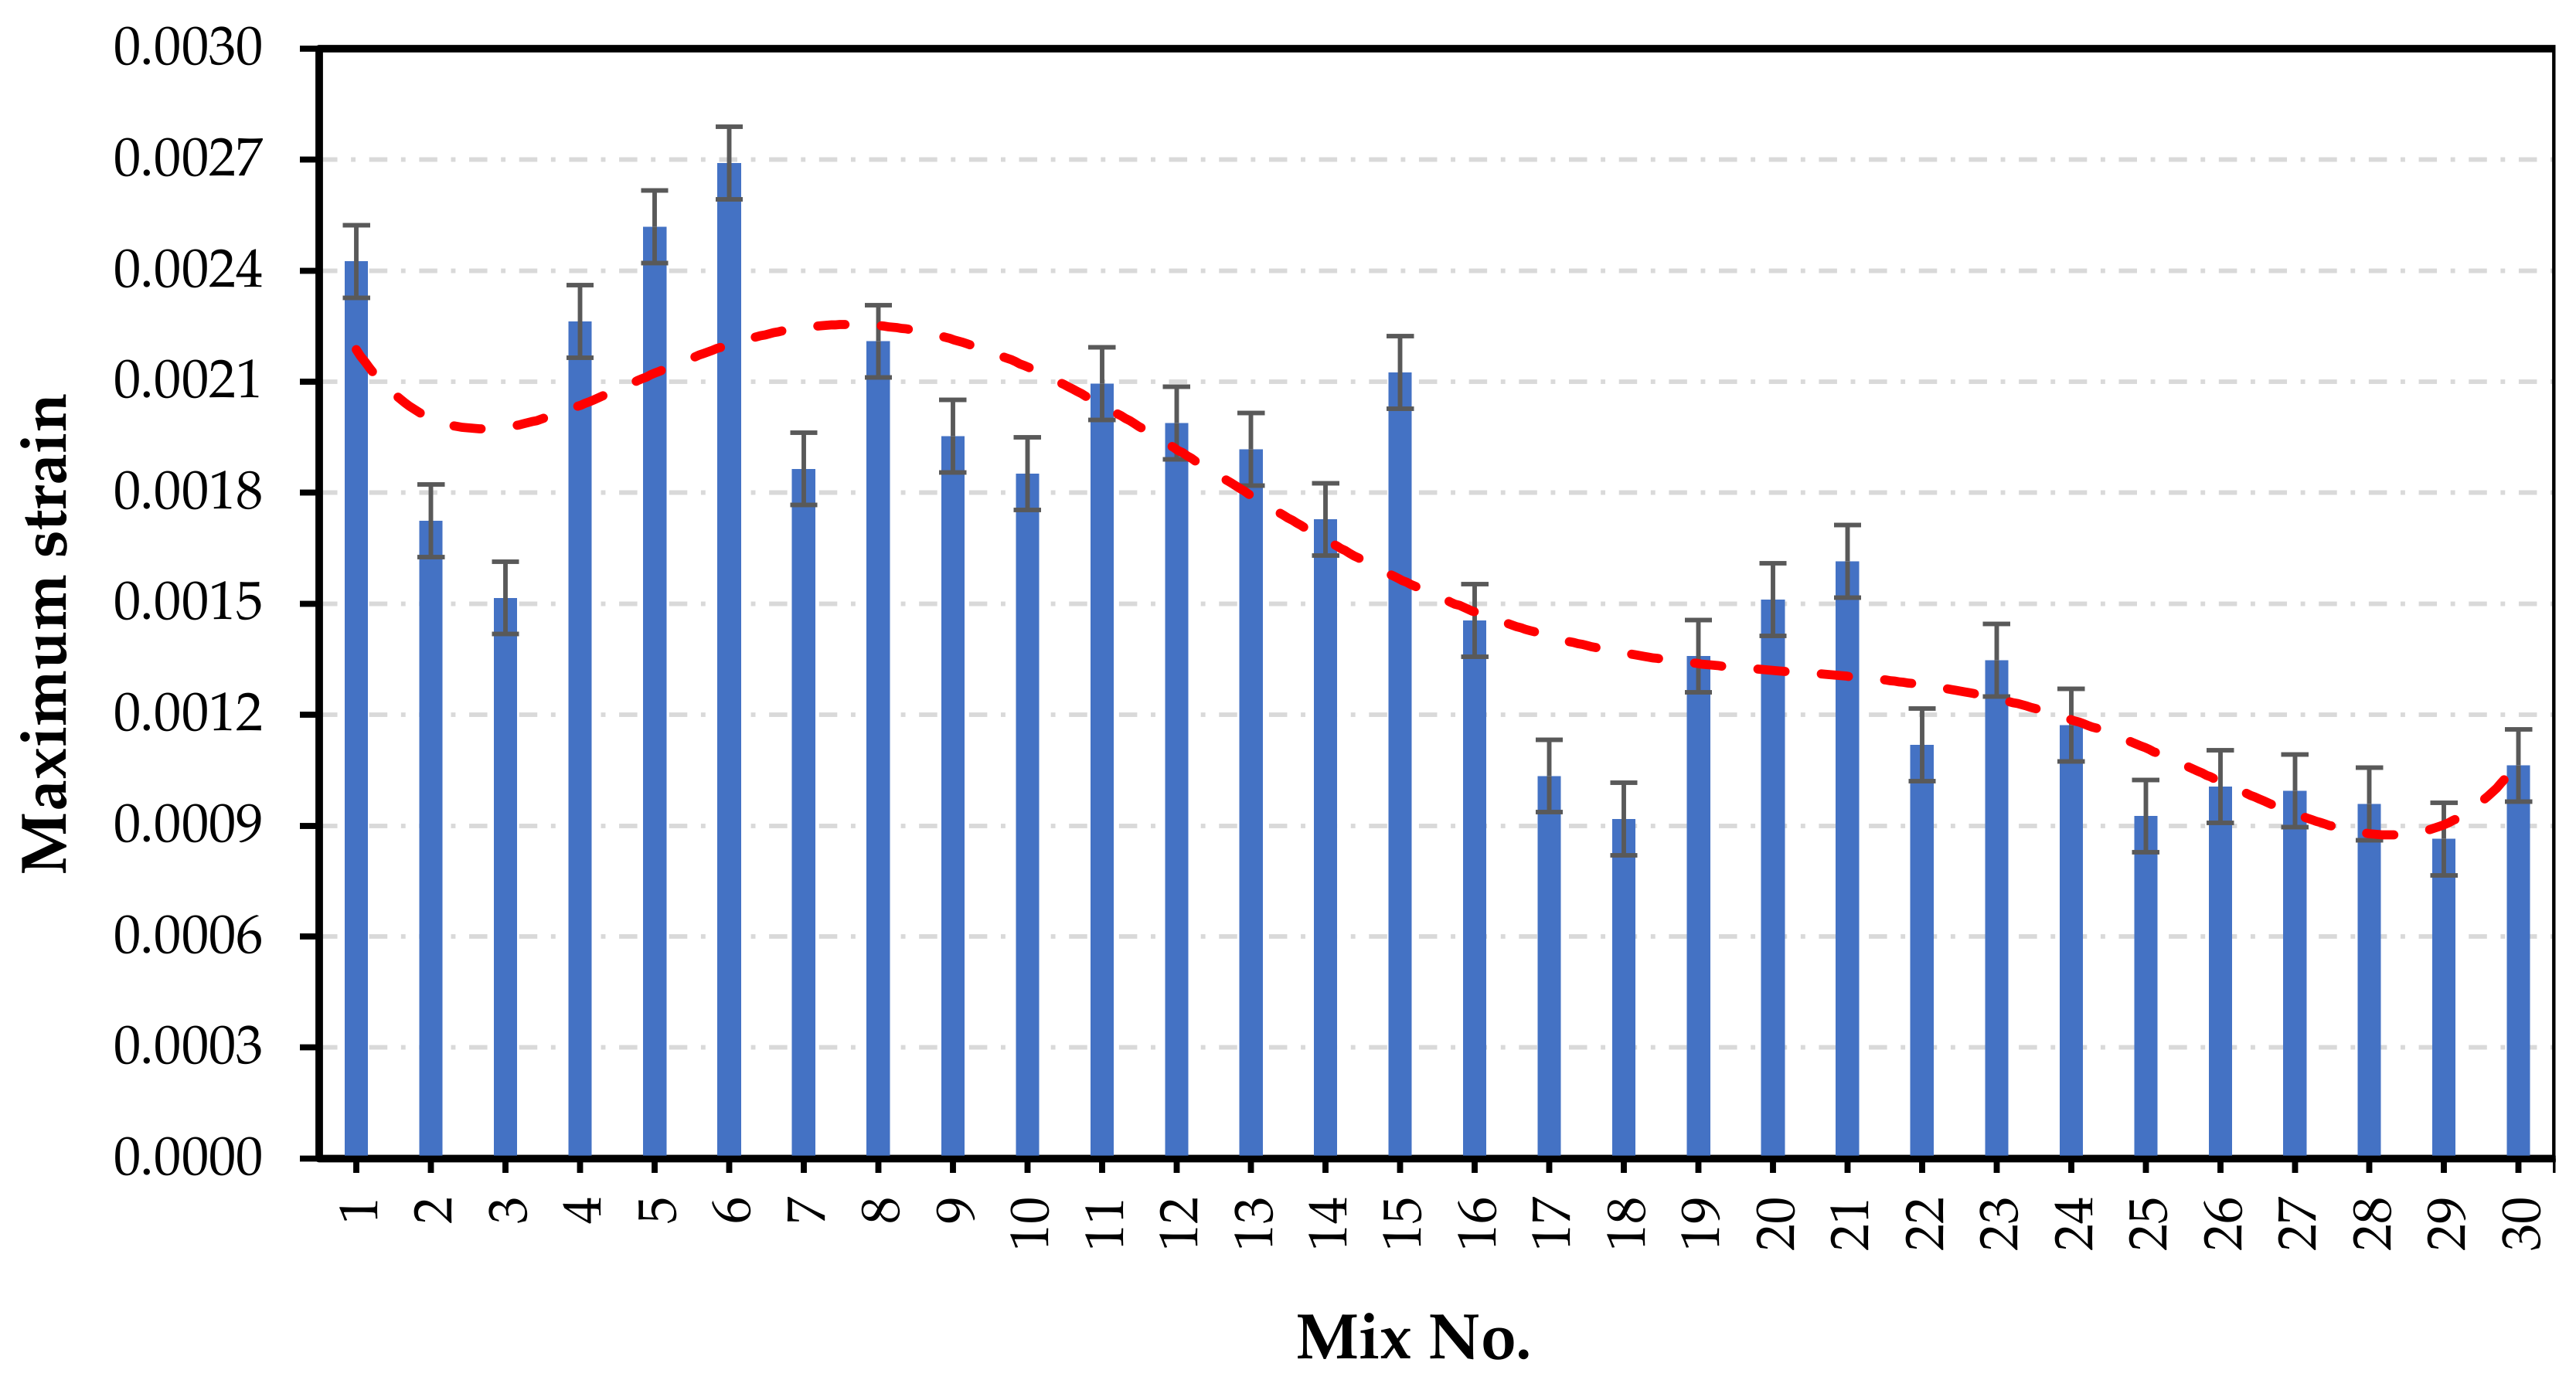
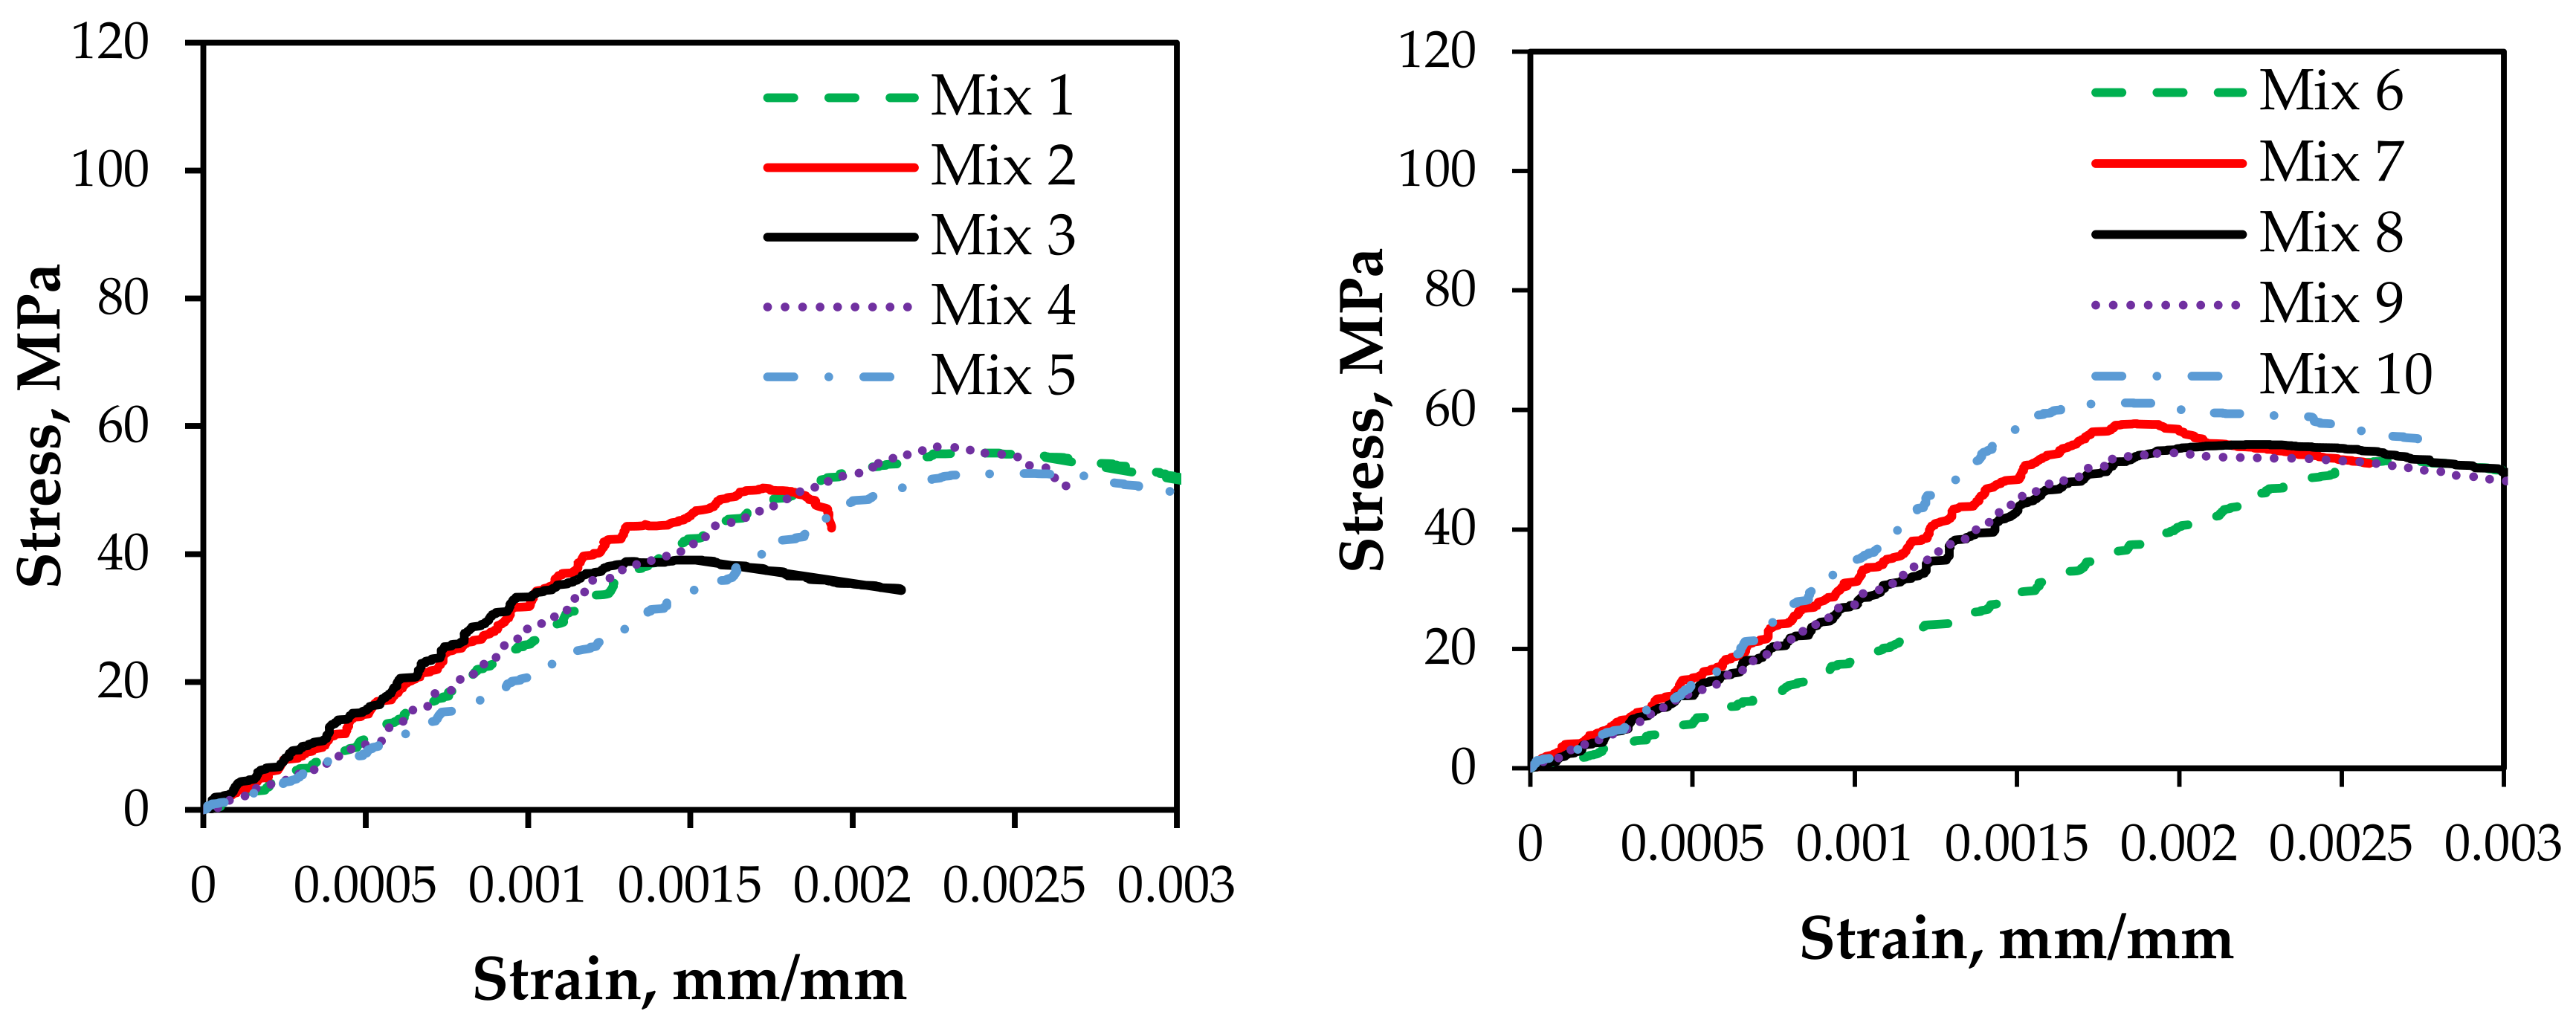
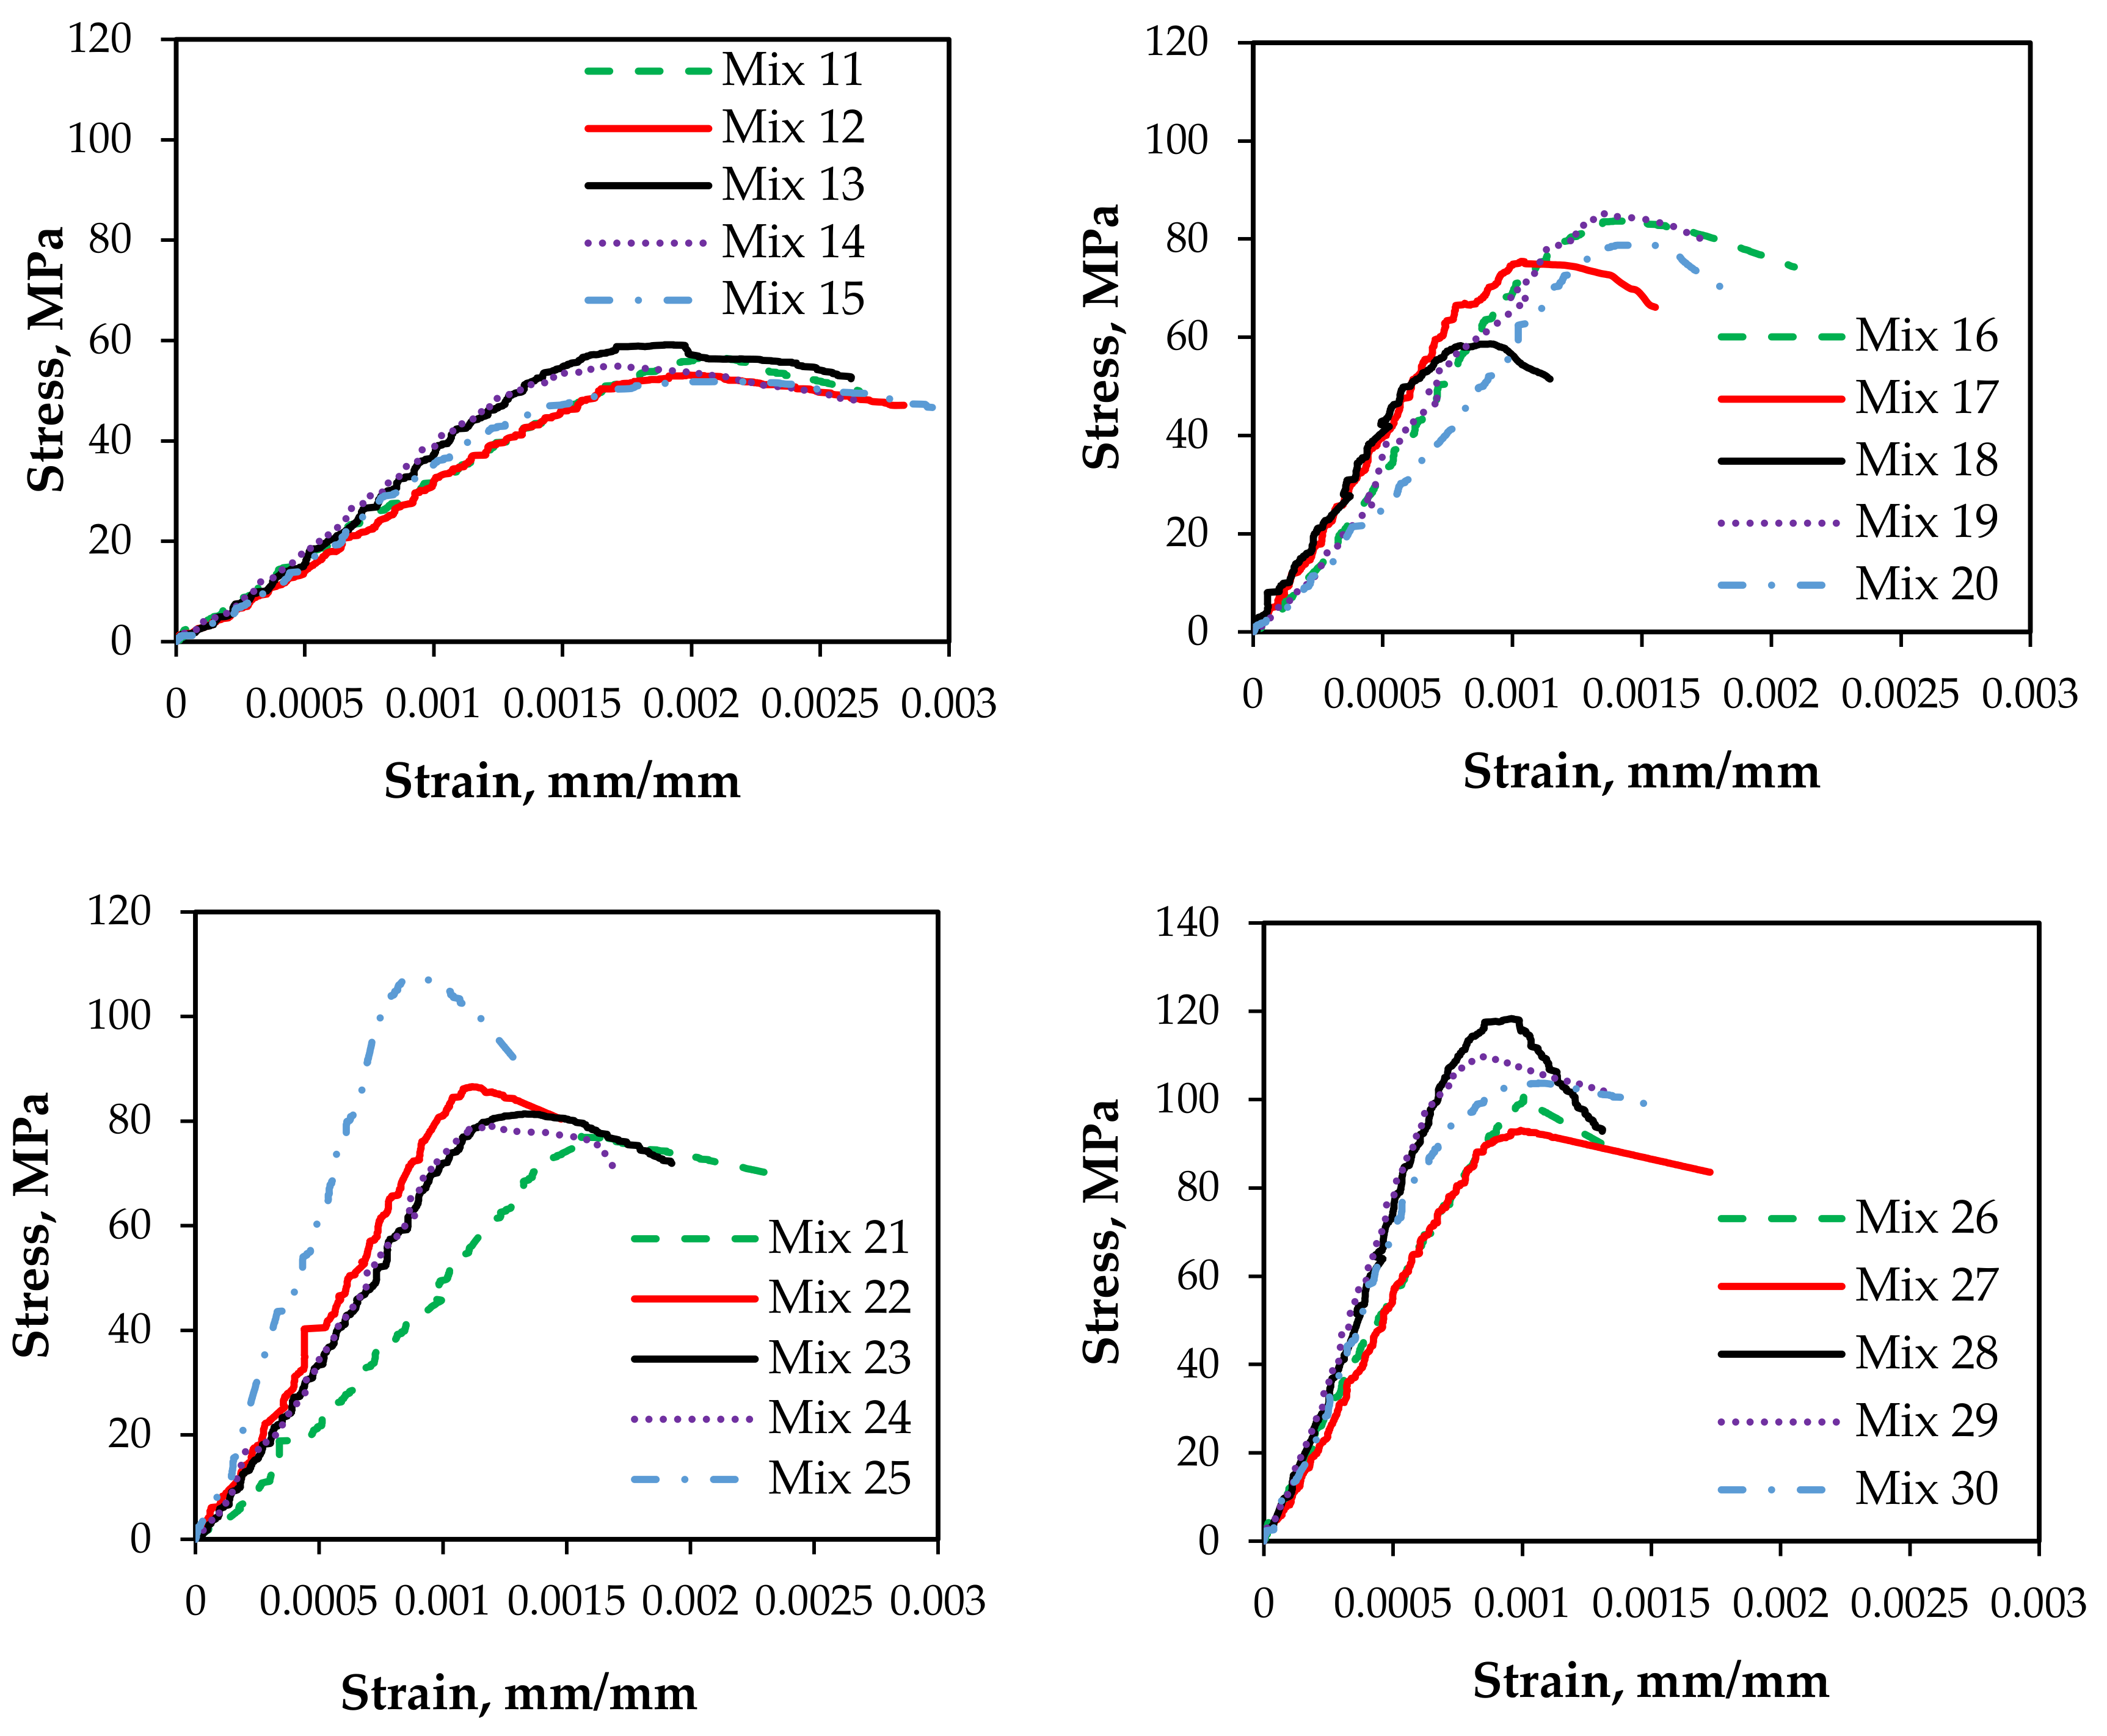
4.1. Experimental Results

During the experimental program, a dataset containing 30 various mixing proportions was achieved, which was utilized to build and verify the proposed stress-strain model of hybrid fiber concrete. Figure 7 graphically depicts the results of the compressive strength of 30 mixtures at 28 days of curing, the red dashed line representing the best fit changing in the maximum compressive strength of the tested concrete samples. At the same ratio of fiber content and aggregate (A) to binder (B) ratio (A/B), the results show that increasing the replacement ratio of FA induces a loss in compressive strength. Due to the higher particle size of FA compared to conventional Portland cement (NPC), this may be the cause. Cement particles dissolving in an alkaline liquid provide a smaller surface area than FA, which contributes to a delayed hydration process [43].
Each concrete specimen’s maximum strain can be determined from its stress-strain curves, based on the results of the experiments. The maximum strain of all samples can be shown to vary depending on the variance of the FA, fiber, and A/B ratios of the samples. The results show that using cement type I I causing a reduction in the maximum strain values. Moreover, increasing the FA and A / B ratios has opposite effects where FA has a positive trend in increasing the strain value while the A / B leads to a decrease in the strain, as shown in Figure 8, the red dashed line representing the best fit changing in the maximum strain values of the tested concrete samples. The stress-strain compressive behavior with increasing strain of the tested hybrid concrete specimens has been investigated through displacement-controlled tests, as illustrated in Figure 9.

4.2. Building of Stress-Strain Relationship Model

4.2.1. Development of the Proposed Models

The primary target is to develop stress-strain models that are based on the PSO approach’s ability to predict the best matching parameters. It is well established that models developed utilizing soft-computing exhibit predictive capability within the data range used in their creation. The amount of data that may be gathered is of paramount importance, since it has a substantial impact on the trustworthiness of the resulting models. The entire database was partitioned into a building dataset and a validation dataset for post-construction validation. A 24 (80%) of the 30 tested concrete combinations were used to develop the model, while the remaining six testing samples (20%) were used to verify the suggested model. The minimum ratio of objects to specified variables is three for model acceptability. Scholars claim that a value of five is more secure [42]. In this study, the adopted ratio is 30/3, or about ten, which is significantly greater than the stated threshold.
The PSO method was run by obtaining the aimd function for 40, 60, 80, and 100 swarms using the PSO parameter settings stated in Section 3.2.1 as displayed in Figure 10. The PSO method is able to pick the swarms with the smallest error and the shortest time by implementing several swarms. With the RMSE as an objective function, a suitable goal was chosen. As a result, four different swarms of varying sizes were evaluated. When the given convergence condition is met, the PSO search strategy continues. According to the results in Figure 10, the search became stable after 4100 iterations since the goal functions could only handle a maximum of 5000 iterations. To find the swarms with the lowest error and fastest convergence, a variety of swarms were tested. As shown in Figure 10, the optimal solution for the PSO method is achieved by using 100 swarms.
According to the proposed model, variables that have optimum coefficients are shown in Table 6. Per the data in the table, the stress-strain relationship predicted by the suggested model is accurate. To demonstrate its accuracy and consistency, as depicted in Figure 11, the acceptable model predicts output with an average value of 0.93, standard deviation of 0.122, and covariance of 12.67%. In addition, the following final description of the proposed model is obtained after rounding the coefficients for simplicity and replacing them into Equations (4)–(8):
f H F R C = 1.54   f c 0.0024   R I w s 1.09 + 6   R I w p 9.17
ε H F R C = 0.031   ε c + 0.82   R I w s 38.45   R I w p
β = 0.29 + 80.39 R I w s 31.42 23.51 R I w p 61.91
f H F R C f H F R C = 6.40 β ε ε o 4.31 β 0.09 + ε ε o 17.86 β
Based on these factors, a model’s performance can be evaluated using the following criteria [44,45]:
  • Predicted and actual values have a very strong correlation if the model’s, R > 0.8 .
  • Good correlation can be found between actual and predicted values when an R-squared model provides 0.2 < R < 0.8 .
  • When a model provides, R < 0.2 , the correlation between the expected and the actual values is weak.
As depicted in Figure 12, this work used a variety of statistical methods to verify the geographic variation of the expected stress capacity by the proposed model over that which was observed in a single topology. These results, as illustrated in this figure, show the superior performance of the proposed model for stress capacity forecast because they are so similar to what has been measured. Additionally, Figure 12 shows that the PSO model accurately predicts target values with a high R-value. This suggests that the model presented is capable of prediction based on low values and the applicability performance based on comparable values.

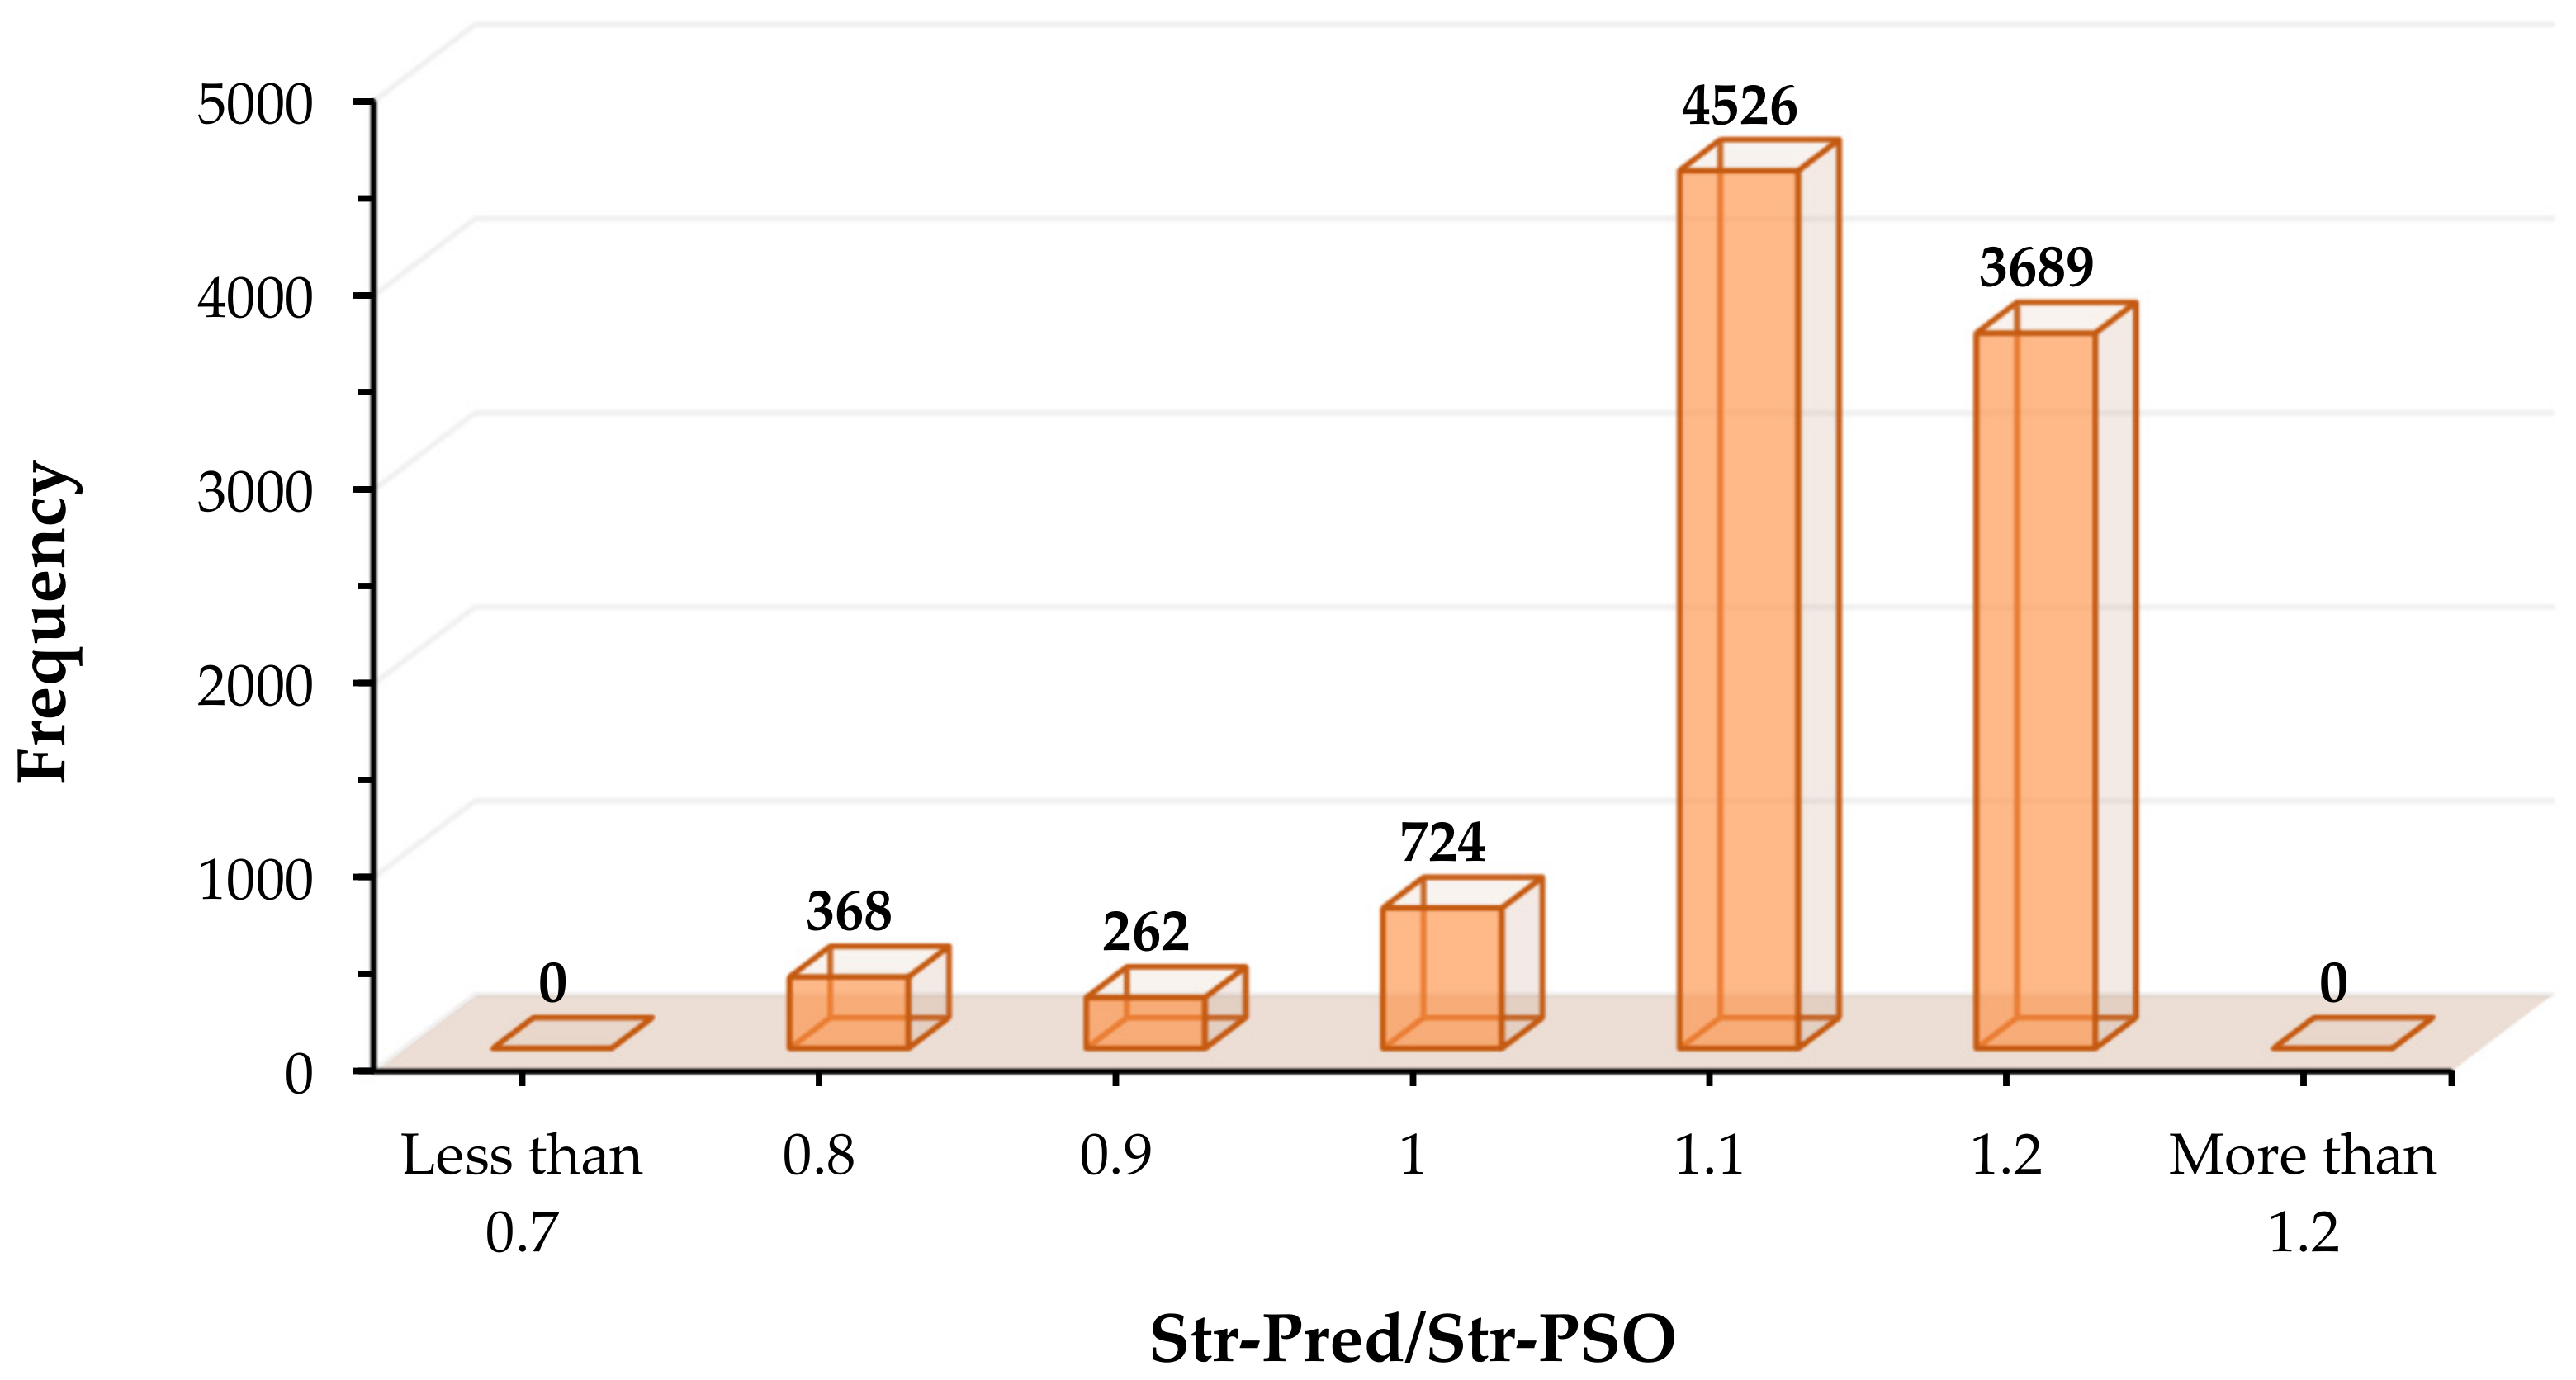
4.2.2. Error Evaluation of the Proposed Model

For additional validation, it has been suggested that the model’s estimate ability should be calculated using the relative error distribution [46]. Therefore, the absolute relative error (ARE) percentage is calculated as follows:
ARE = S A i S E i S A i × 100
With a high R-value, the PSO model accurately predicts the required values with high accuracy, as shown in Figure 13. As a result, the proposed model has a good ability to predict (i.e., low values) and to generalize (i.e., similar values).
In an ideal scenario, the frequency of ARE should decrease as the amount of ARE increases. This model has highest frequencies at low absolute relative error (ARE 10%) and lowest frequencies at high absolute relative error (ARE > 15%). Accordingly, the proposed model has an acceptable error distribution. As a result of errors, it is possible to conclude that the proposed model can serve as an excellent design guide for future research projects.

4.3. Building of Stress-Strain Relationship Model

The suggested model was evaluated using a dataset including six testing samples (20% of the entire dataset), which was obtained from a secondary source. These facts were not taken into consideration during the optimization procedure. Comparing stress strength capacity from observed data with that predicted by the suggested model in Figure 14 demonstrates this model’s accuracy can be relied upon. The proposed model yielded a value that was quite near to one standard deviation above the mean (1.03). Figure 14 shows that the R-value is 0.9997, which implies that the actual and anticipated strength capacities are in good agreement with one another. This data shows that the proposed model accurately predicts concrete’s strength capacity when varying fiber proportions are taken into consideration.
Moreover, Golbraikh and Tropsha [47] proposed a new criterion for determining the external validity of the PSO model, which they believe is more reliable. It is suggested that at least one slope of regression lines According to this criterion, it is recommended that at least one regression line’s slope ( k or k ´ ) across the origin be close to one in accordance with this criterion. Since Roy and Roy [48] made their proposal, a new indicator of model predictability has emerged ( R m ). The requirement is satisfied in the case of R m = 40.5. The squared correlation coefficient (through the origin) between the predicted and experimental values, or the correlation coefficient between experimental and predicted values, R o 2 . Table 7 lists the validation criteria that were taken into consideration, as well as the relevant results acquired by the model. According to these findings, the generated model is sufficiently and precisely satisfying the conditions that have been established.

5. Modeling of Hybrid Fiber-Reinforced Concrete Elements

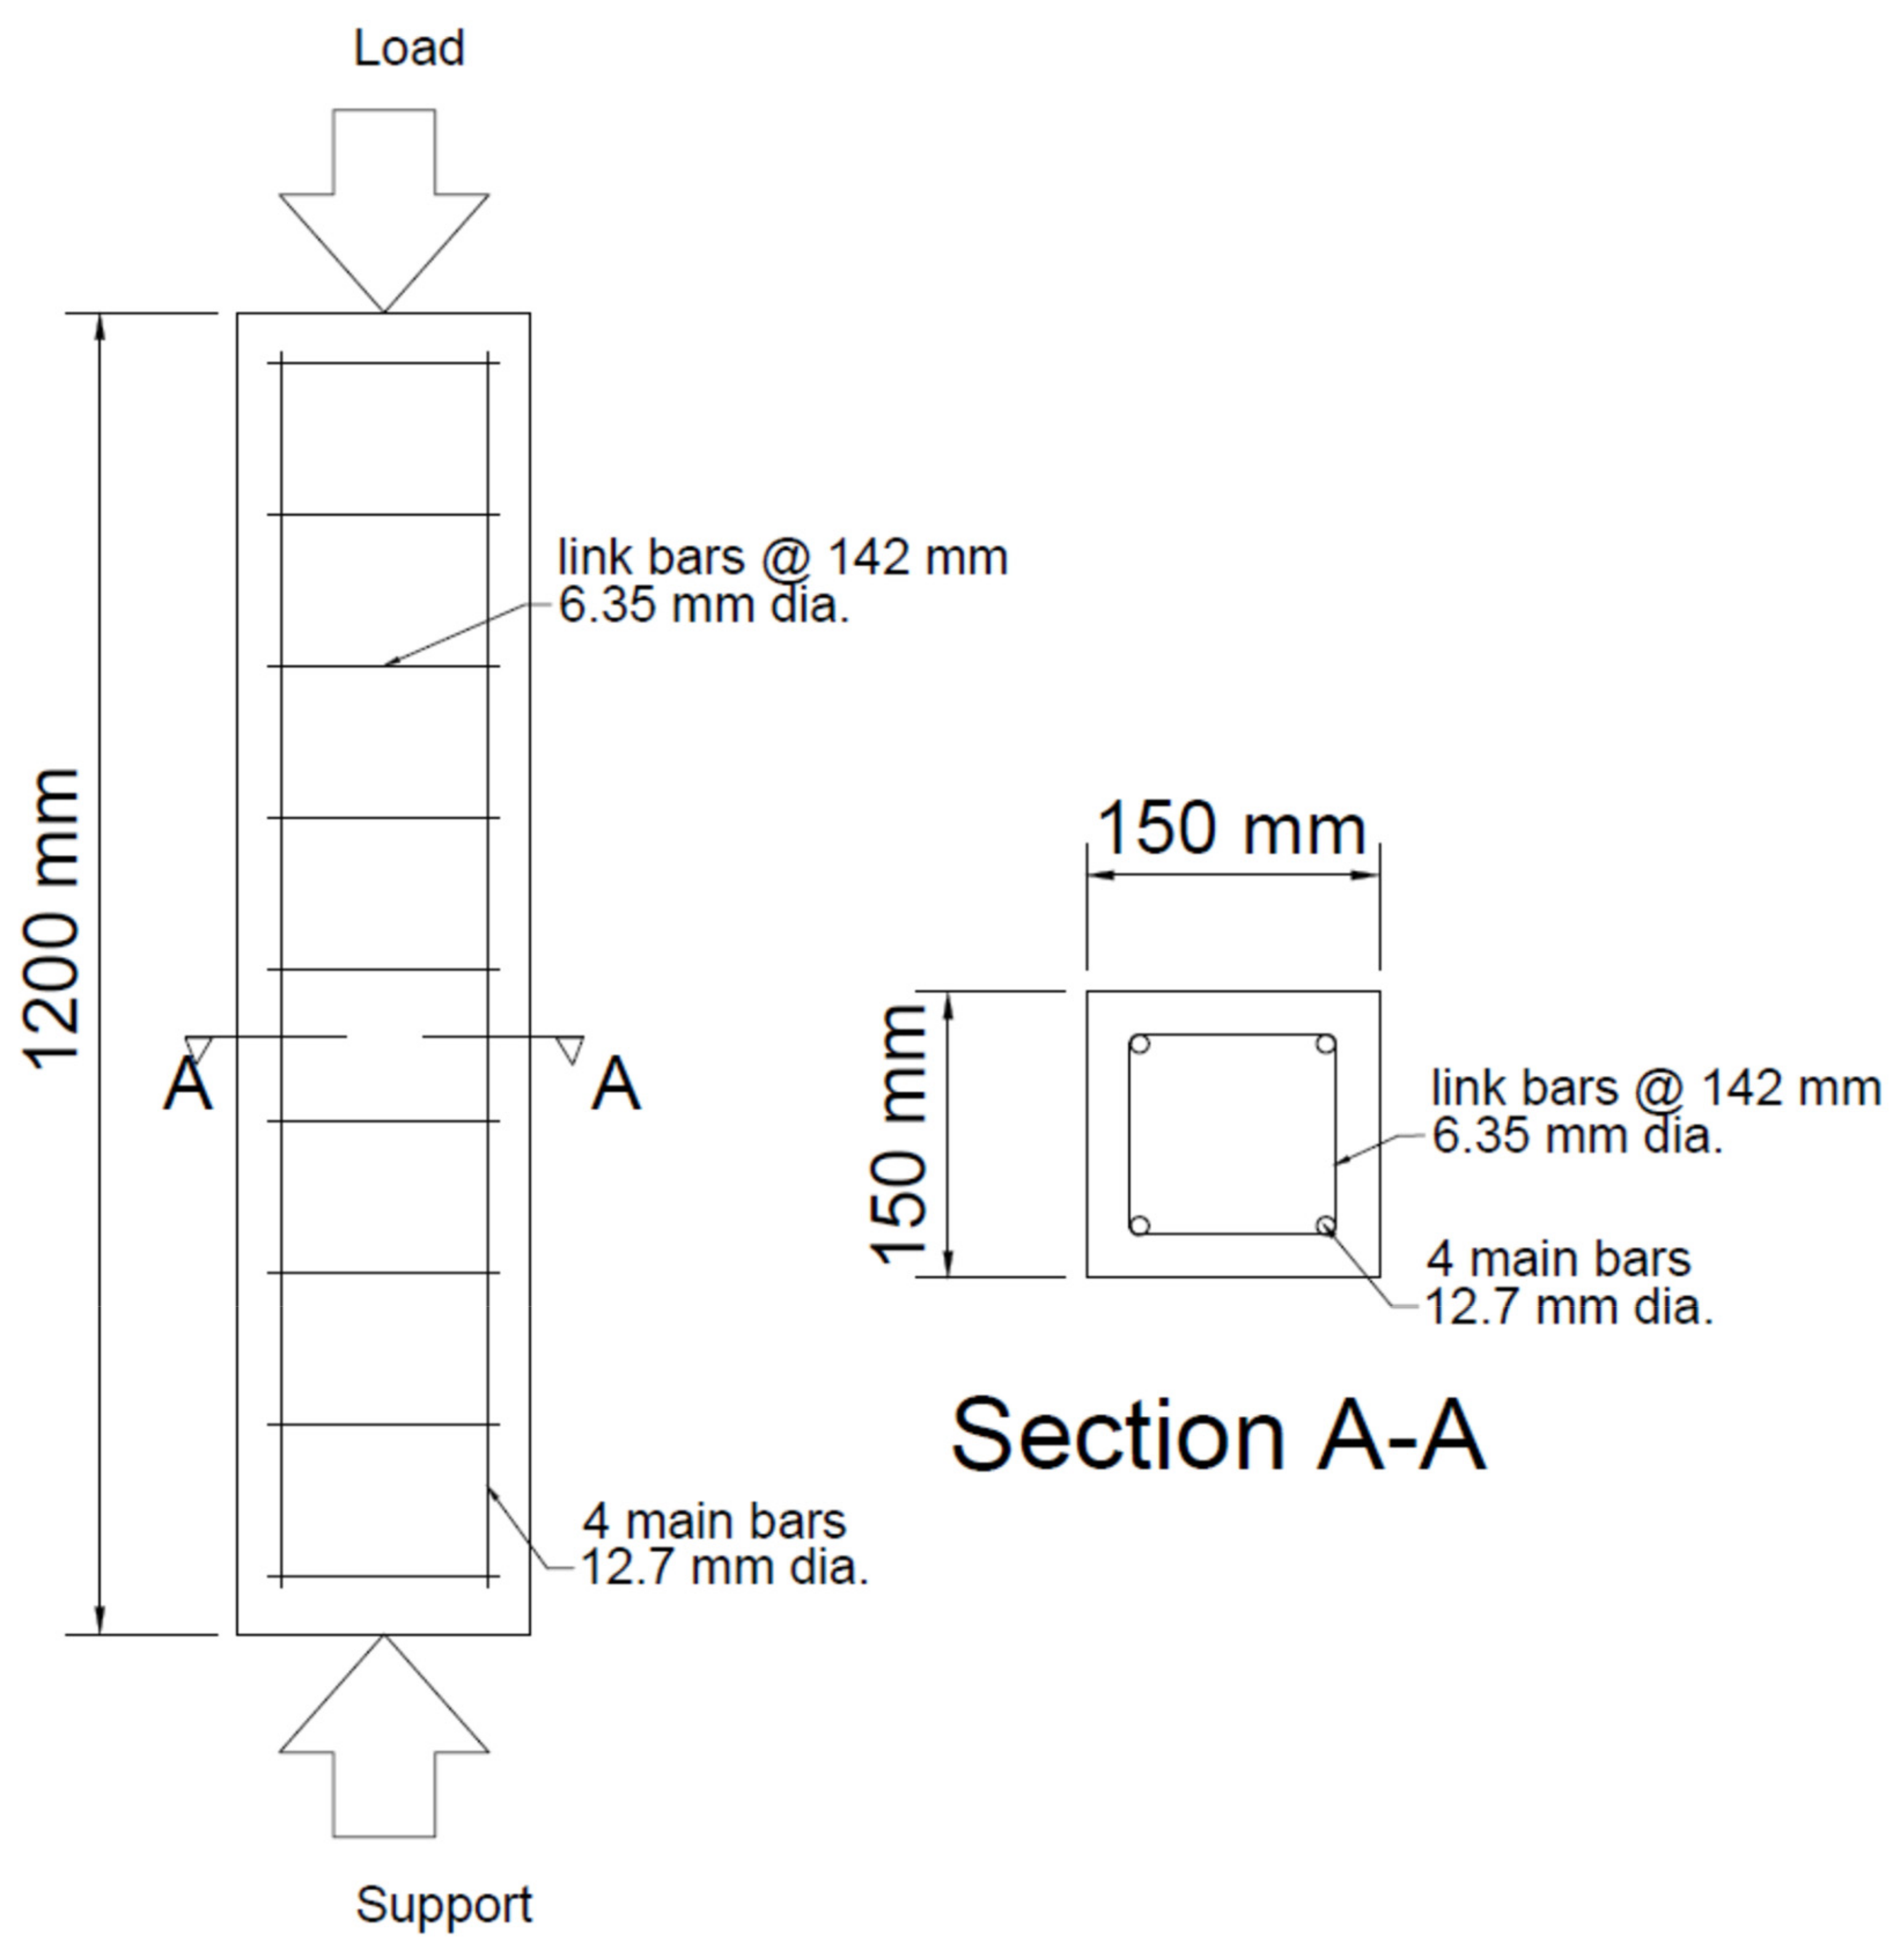
5.1. Modeling of the Structural Elements

The main purpose of this section is to further validate the newly suggested stress-strain expression (Equation (12)) that developed earlier in Section 4.2, where we demonstrate that the nonlinear finite element (FE) technique could be used to simulate the structural behavior of fiber-reinforced concrete elements using the ABAQUS software. Therefore, a total of 10 structural elements have been selected to exam the model (Equation (12)) of the stress-strain relationship of the HFRC, included five plain cubes tested in the current research and five specimens of R C columns that were tested in [49]. The typical structural geometry and boundary conditions of the selected structural elements are presented in Figure 15 for both models of cubes (150 mm) and R C columns (150 mm × 150 mm × 1200 mm).

5.2. Model Description

There are a variety of elements in the ABAQUS software library that can be used to represent the concrete and steel bars that have been used in several investigations [50,51,52,53,54], as example. In this study, the solid element type C 3 D 8 R has been adopted for the concrete part in both of the cubes and R C columns models, since this element has 8-node linear brick, reduced integration with six degrees of freedom at each node. A truss element type T 3 D 2 was selected for the steel bars of the RC columns models. The typical bonding behavior between the concrete and the steel bars of the RC columns was implemented using the “embedded region” option that is available in the ABAQUS software. Downward displacement option was applied at the top face of the models which increased gradually during the analyses representing the actual loading test scenario that applied on the corresponding specimens (see Figure 15). Dynamic-explicit step was used for the analyzed FE models to achieve the best concrete performance.

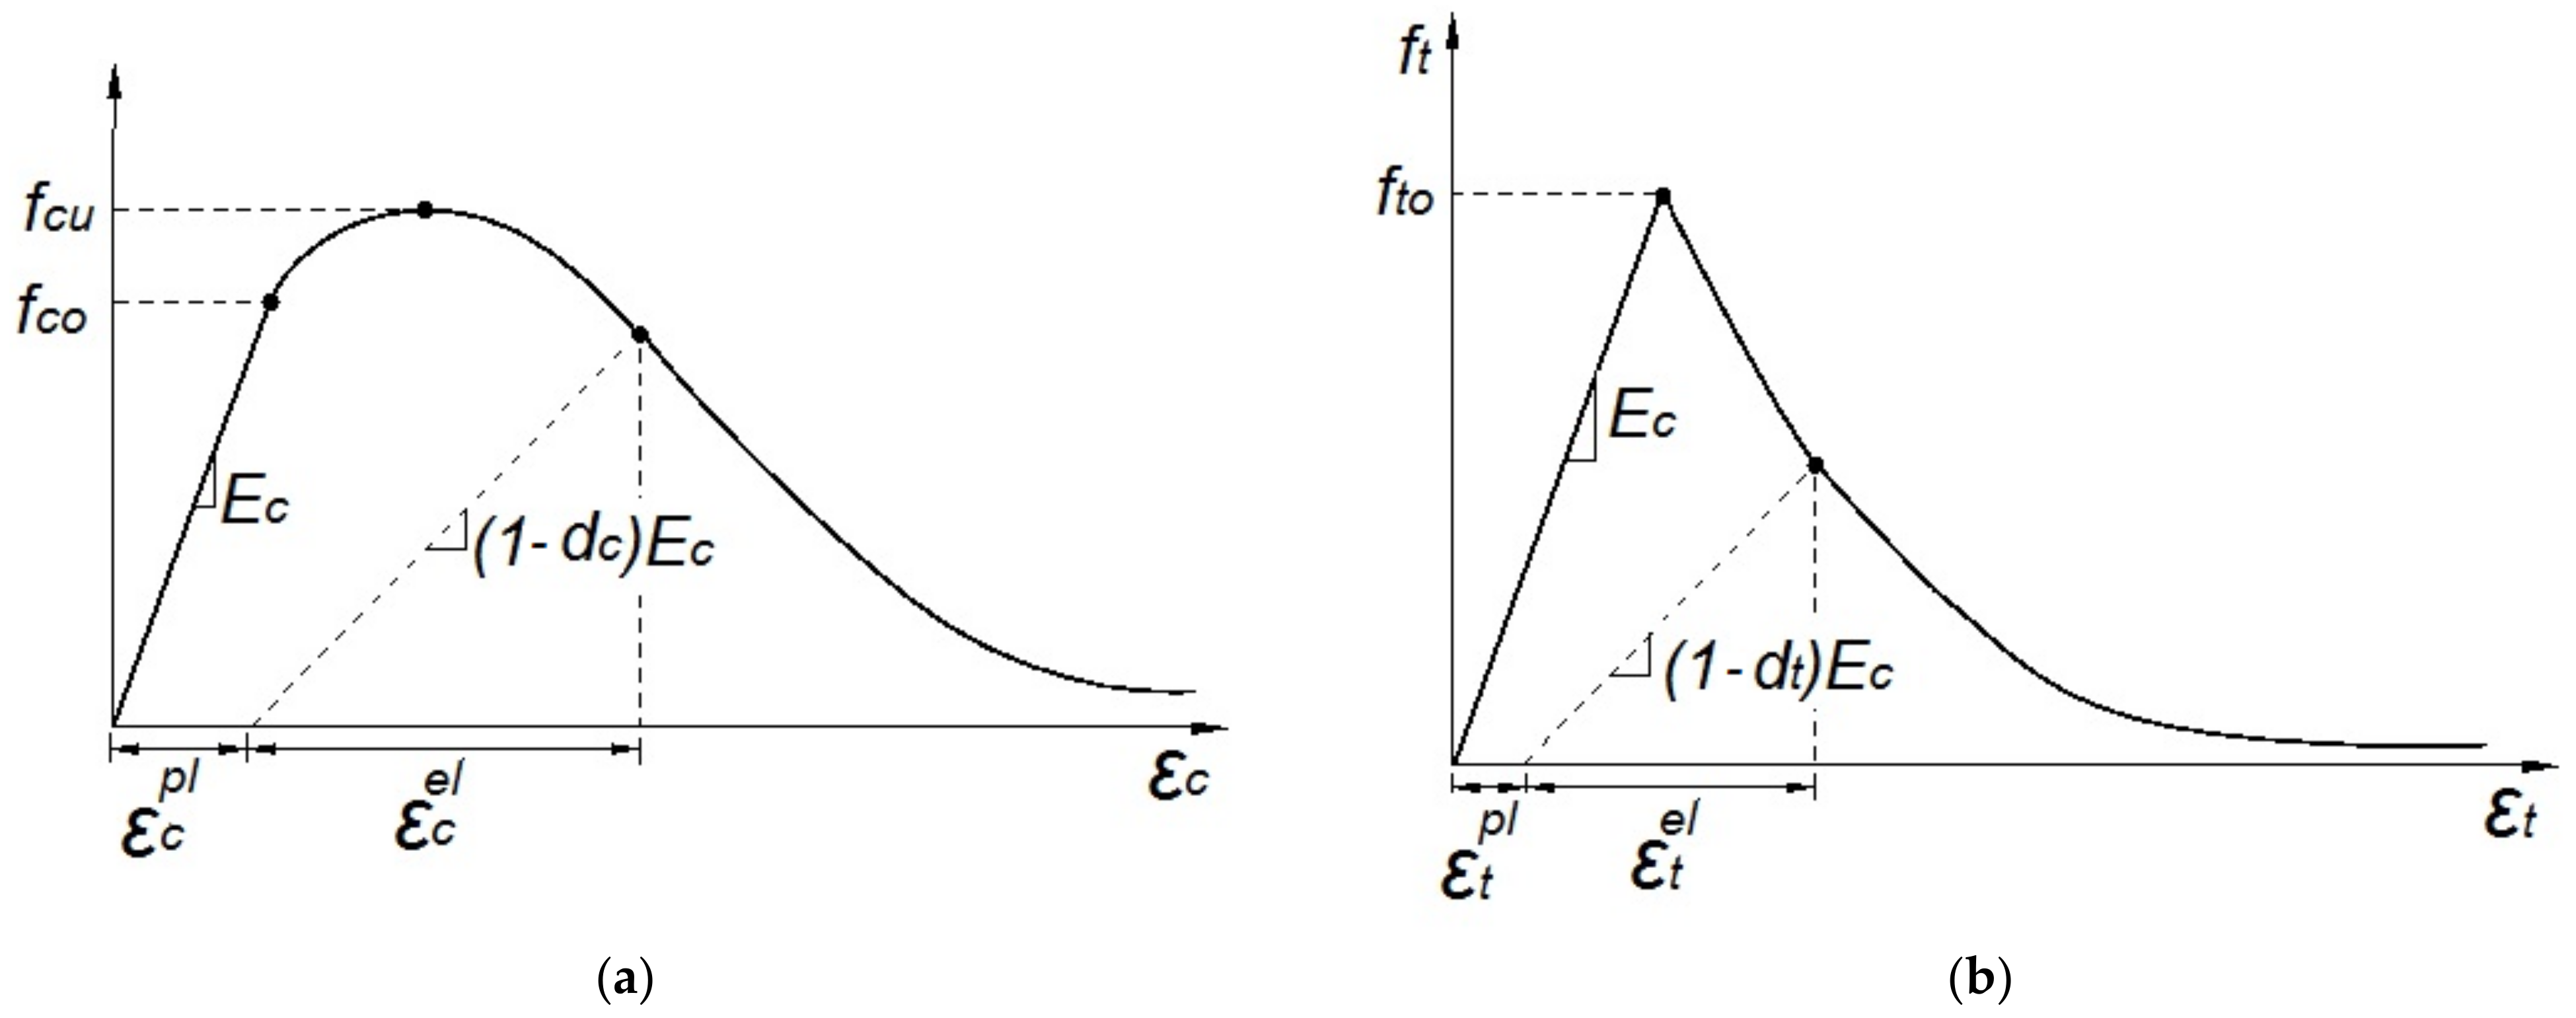
5.3. Materials Constitutive Models

As a brittle material, concrete is susceptible to two types of failure mechanisms: crushing under compression stress and cracking under tension stress, which often occurs in the plastic range. To a certain extent, however, concrete is considered an isotropic material in the elastic range. The elastic-isotropic function in the ABAQUS software was used to identify the concrete model’s modulus of elasticity ( E c ) and Poisson’s ratio (0.2). Meanwhile, to implementing the actual concrete performance at the plastic range for these FE models, two different stress-strain constitutive models were adopted for the concrete under compression and tension stresses using the concrete damage plasticity ( C D P ) option [50,51,52,53,54].
In general, for implementing the concrete model at the plastic range, the values of dilation angle, eccentricity, stress ratio, shape factor ( K ), and viscosity parameters have been taken equal to 40, 0.1, 1.16, 0.667, and 0.0, respectively. The newly developed analytical expression (Equation (12)) was used for the concrete compressive behaviour to estimate the stress-strain relationships for the hybrid fiber-reinforced concrete. While, for the concrete tension behavior, the same constitutive model adopted earlier by Al Zand et al. [50] for estimating the concrete stress-strain relationships were used, which are expressed as follows:
ε c r = f t o / E c
f t = E c · ε t   for   ε t ε c r
f t = f t o · ( ε c r / ε t ) 0.8   for   ε t < ε c r
where E c is the elastic modulus of concrete; f t and f t o are the concrete tensile strength, and the cracking failure ( 0.31 0.8   f c u 1 / 2 ), respectively. The f c and f c u are the cubic compressive strength and the ultimate cubic compressive strength of concrete, respectively. The ε t and ε c r are the strains of concrete at relevant tensile stress ( f t ) and cracking strain at f t o , respectively. The C D P of the concrete model under compression and tension stresses are illustrated in Figure 16, where their damage parameters ( d c and d t ) and the related inelastic and cracking stains ( ε i n and ε c k ) are estimated as follows:
d c = 1 f c / f c u
d t = 1 f t / f t o
ε i n = ε c f c / E c
ε c k = ε t f t / E c
Both the steel bars’ elastic modulus and Poisson’s ratio as well as their yield strengths were determined in the elastic-isotropic option, whereas their plastic-isotropic (related plastic strain) were identified. Stress-strain models similar to those used in [49] were employed in this work.

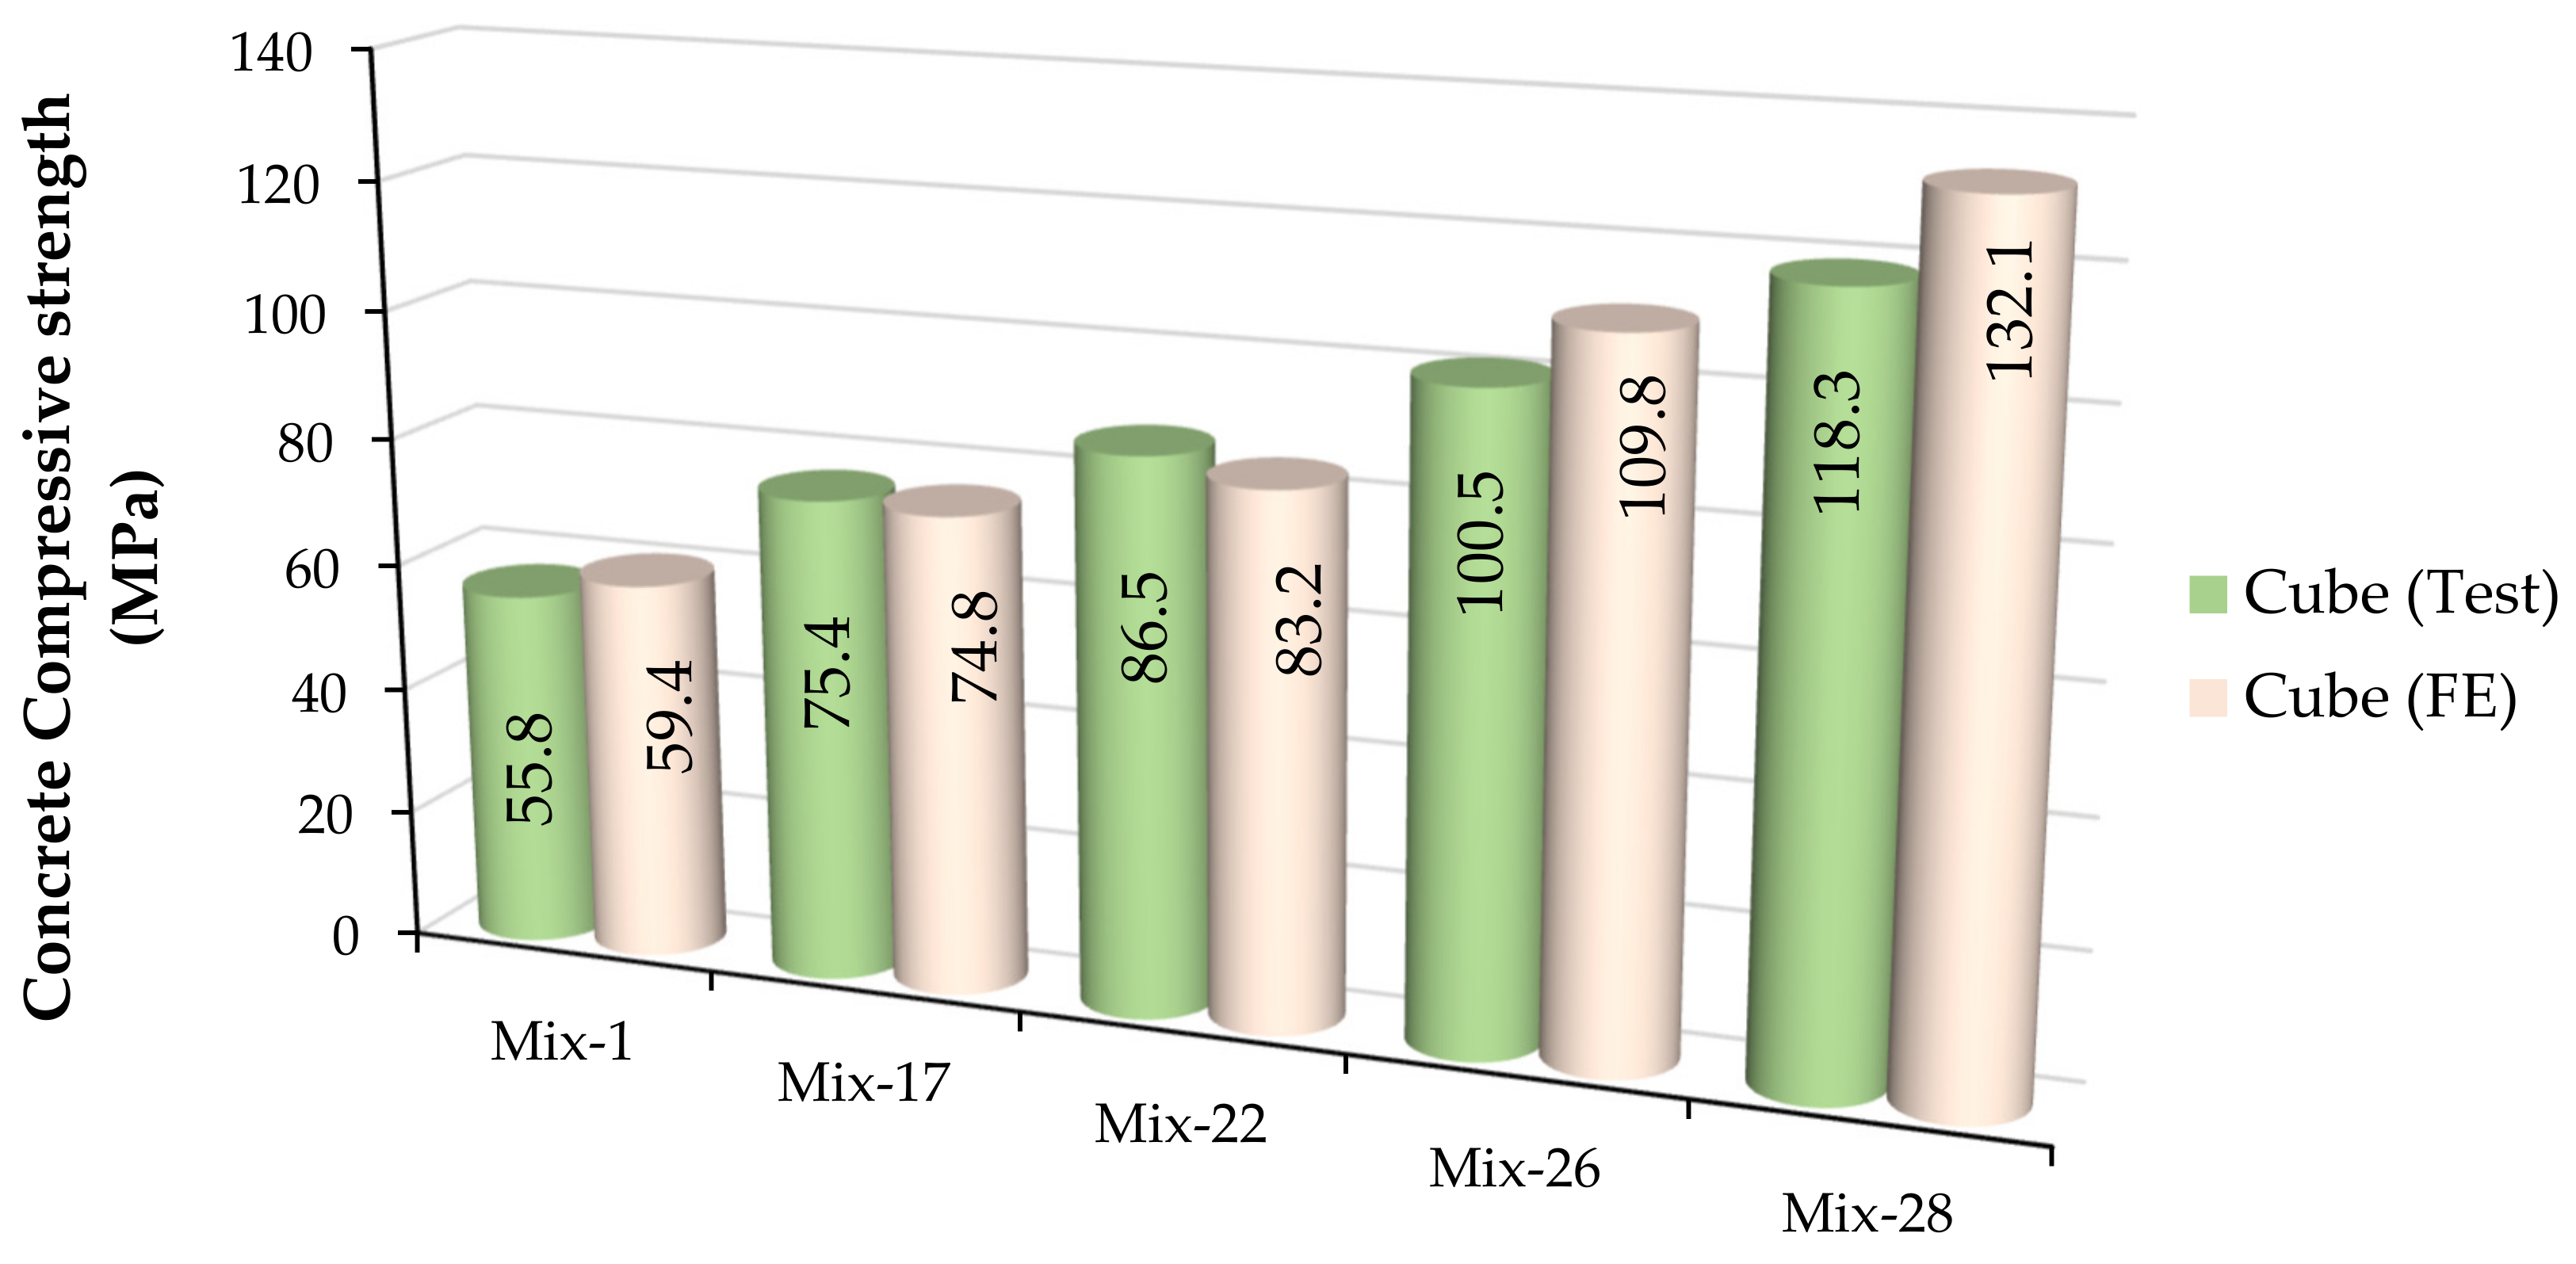
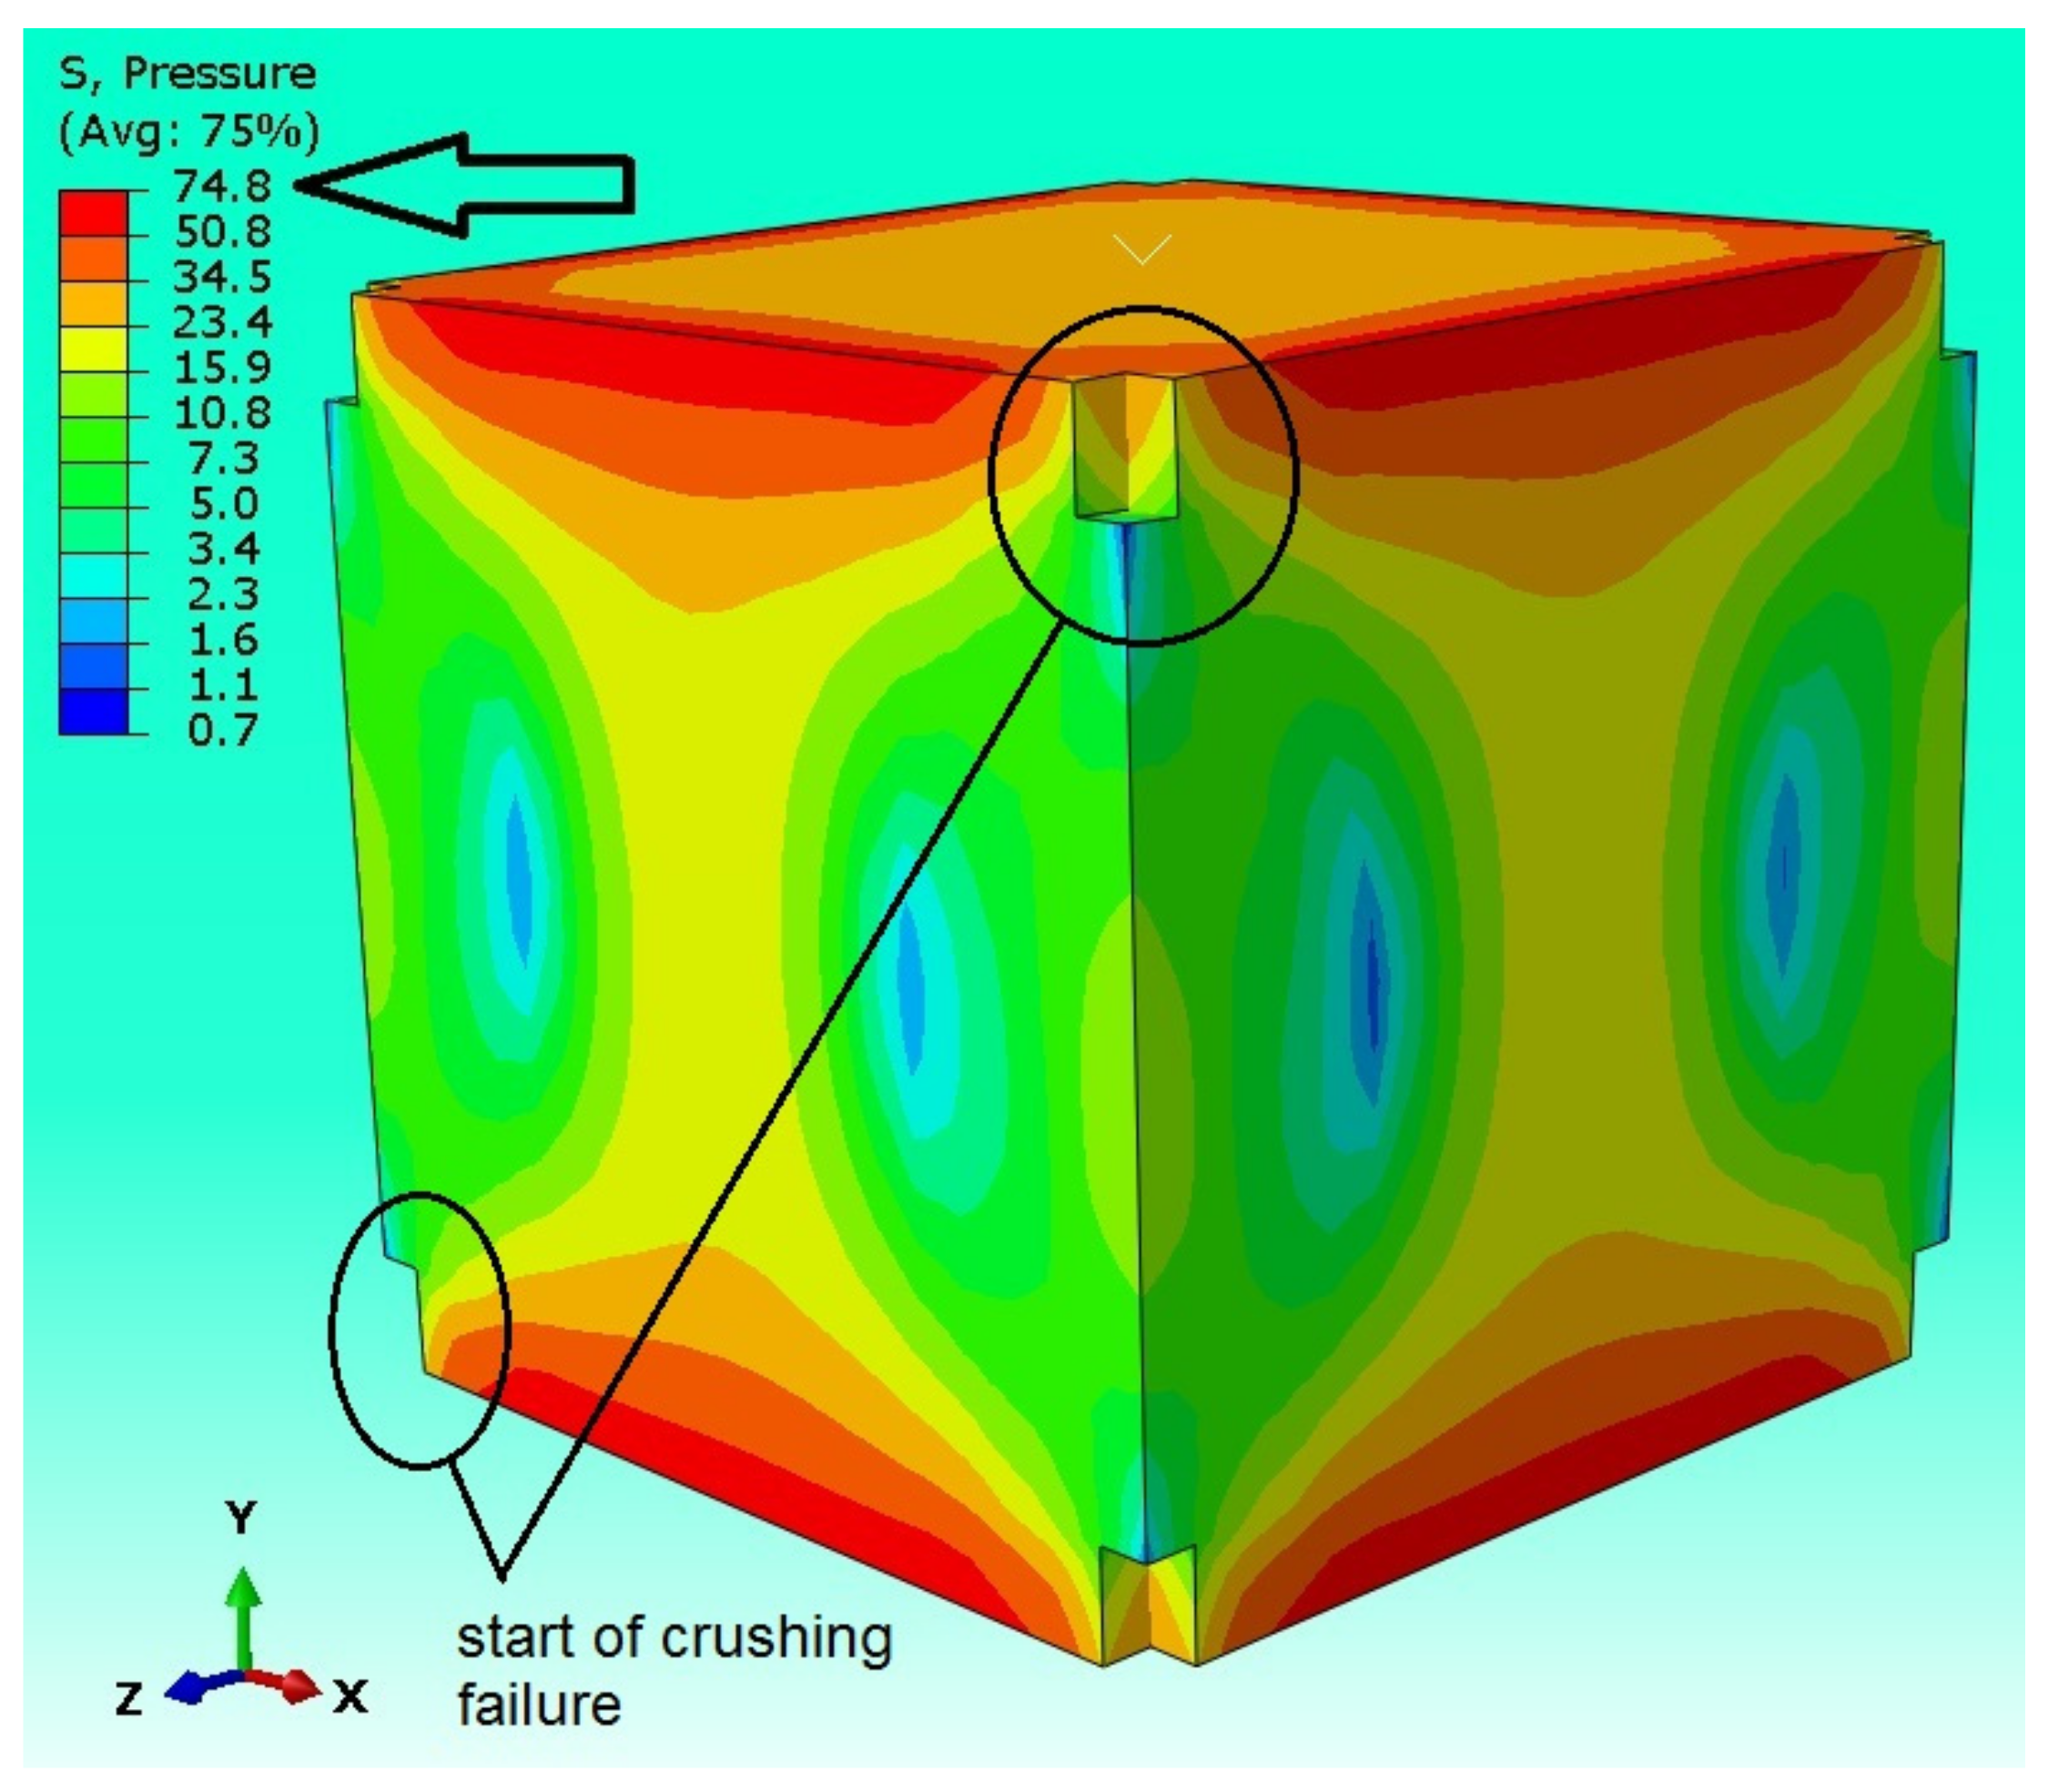
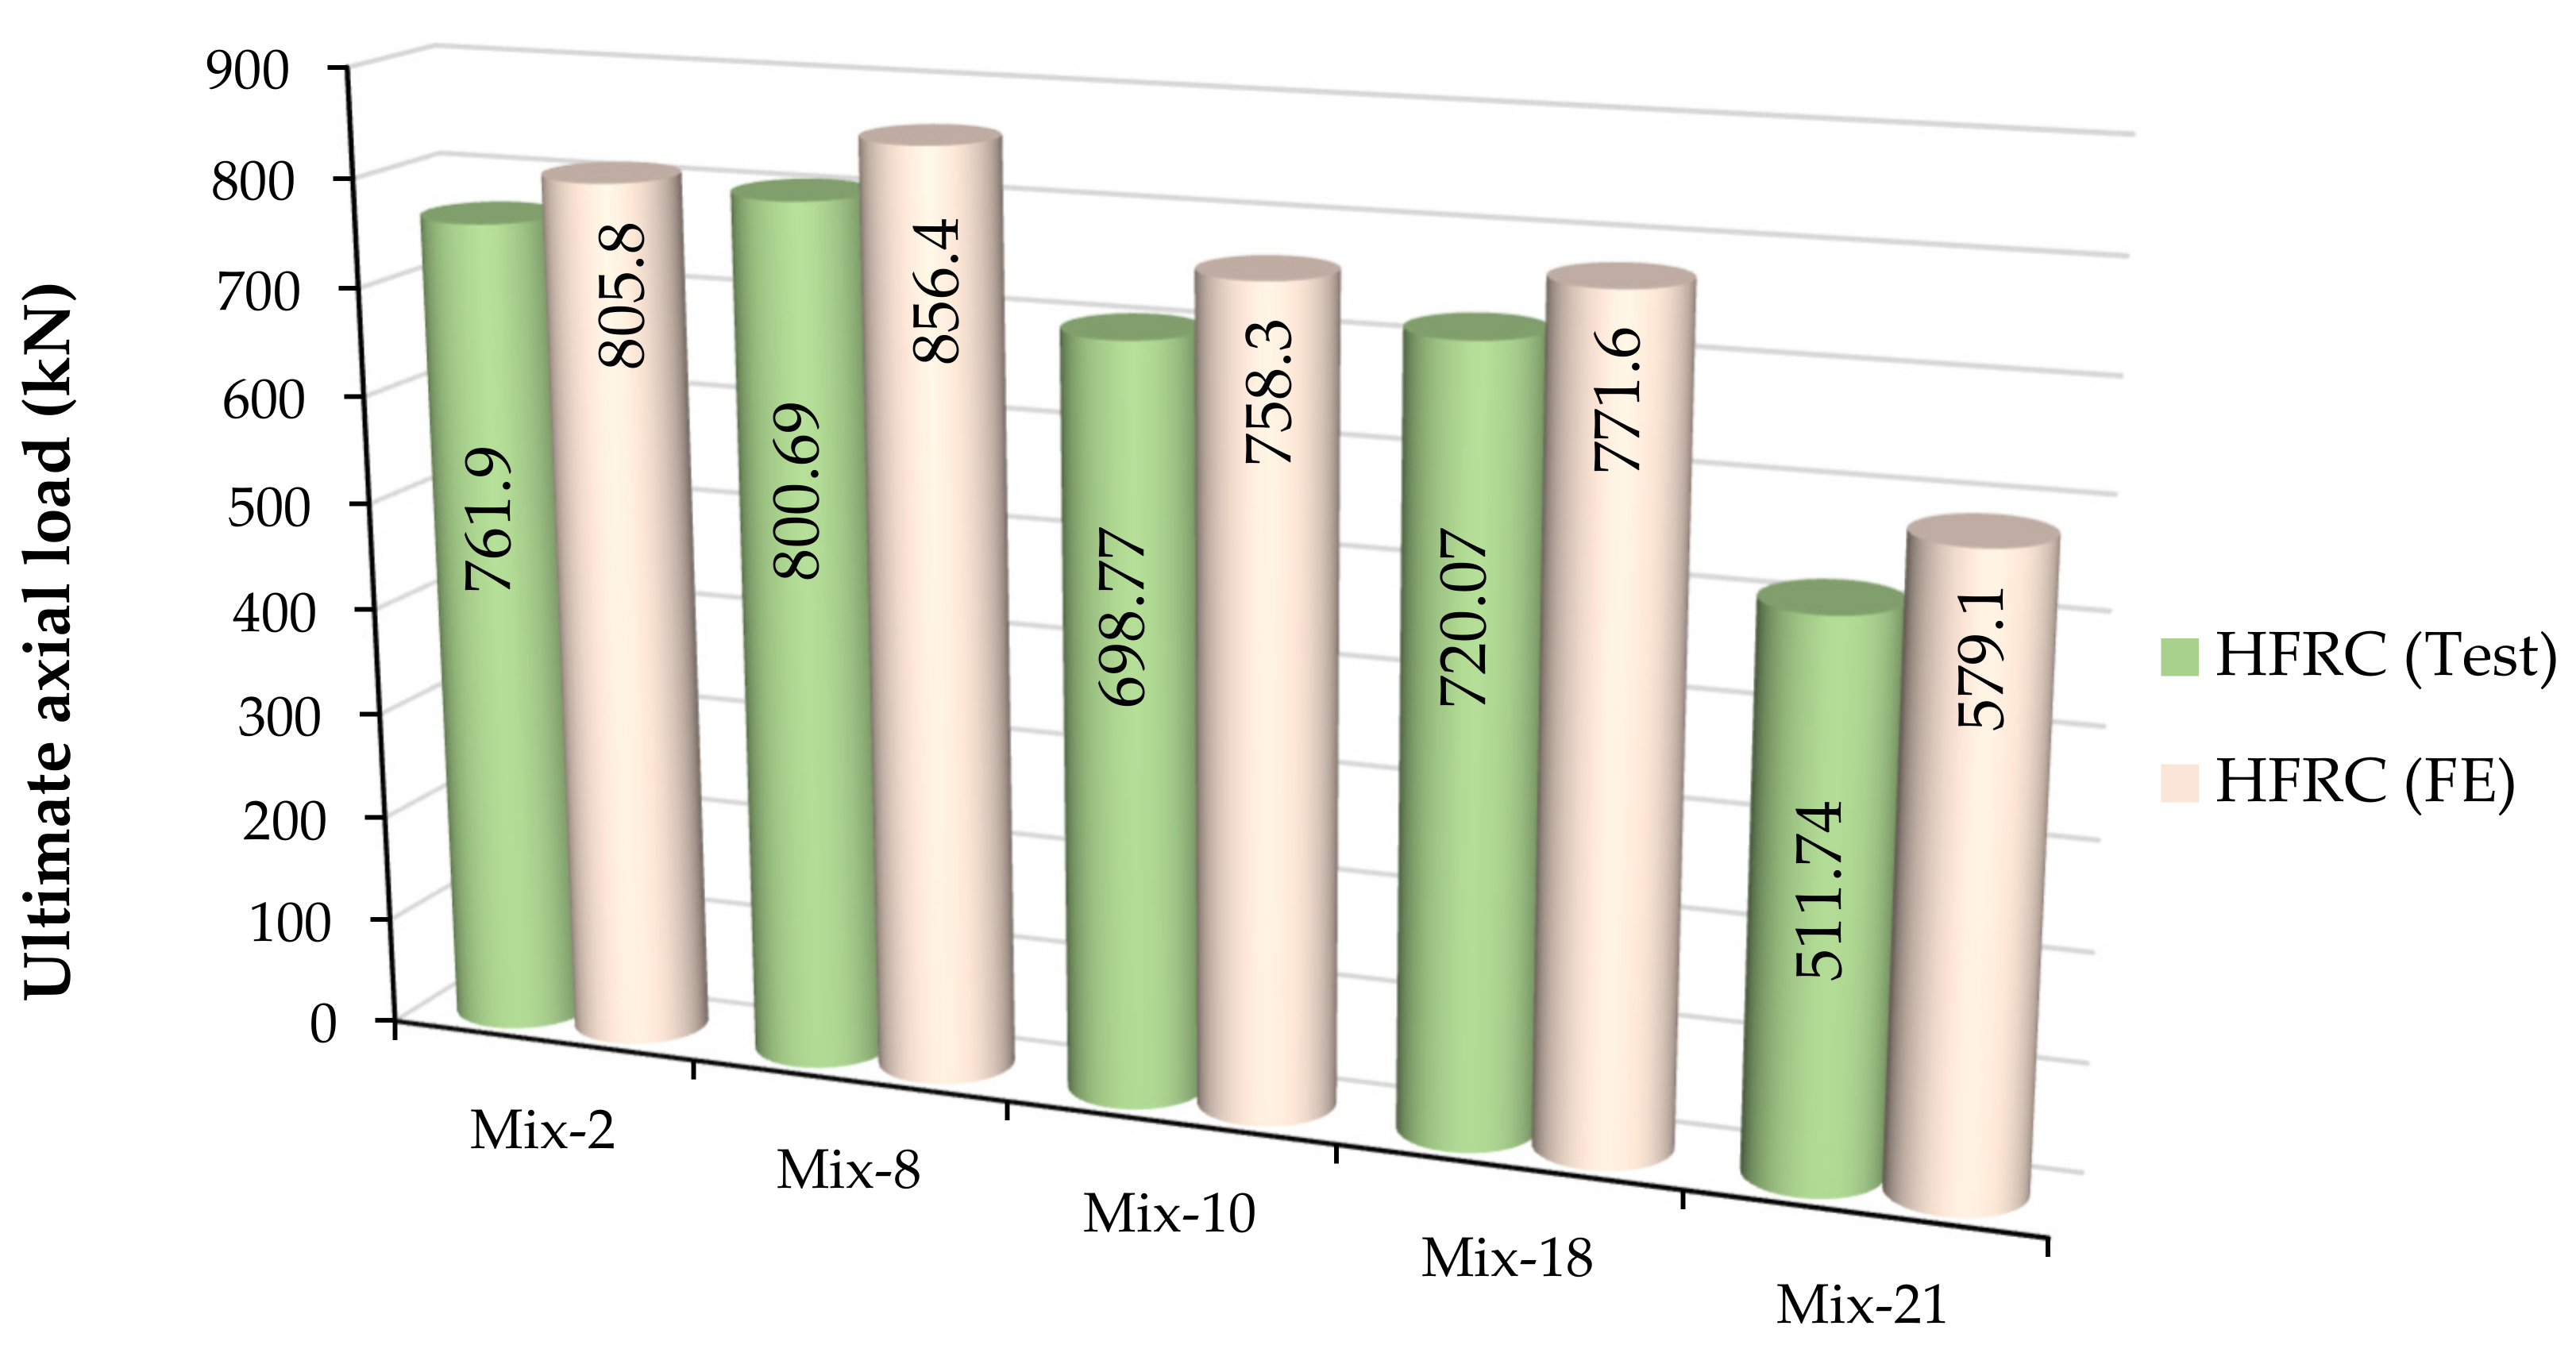
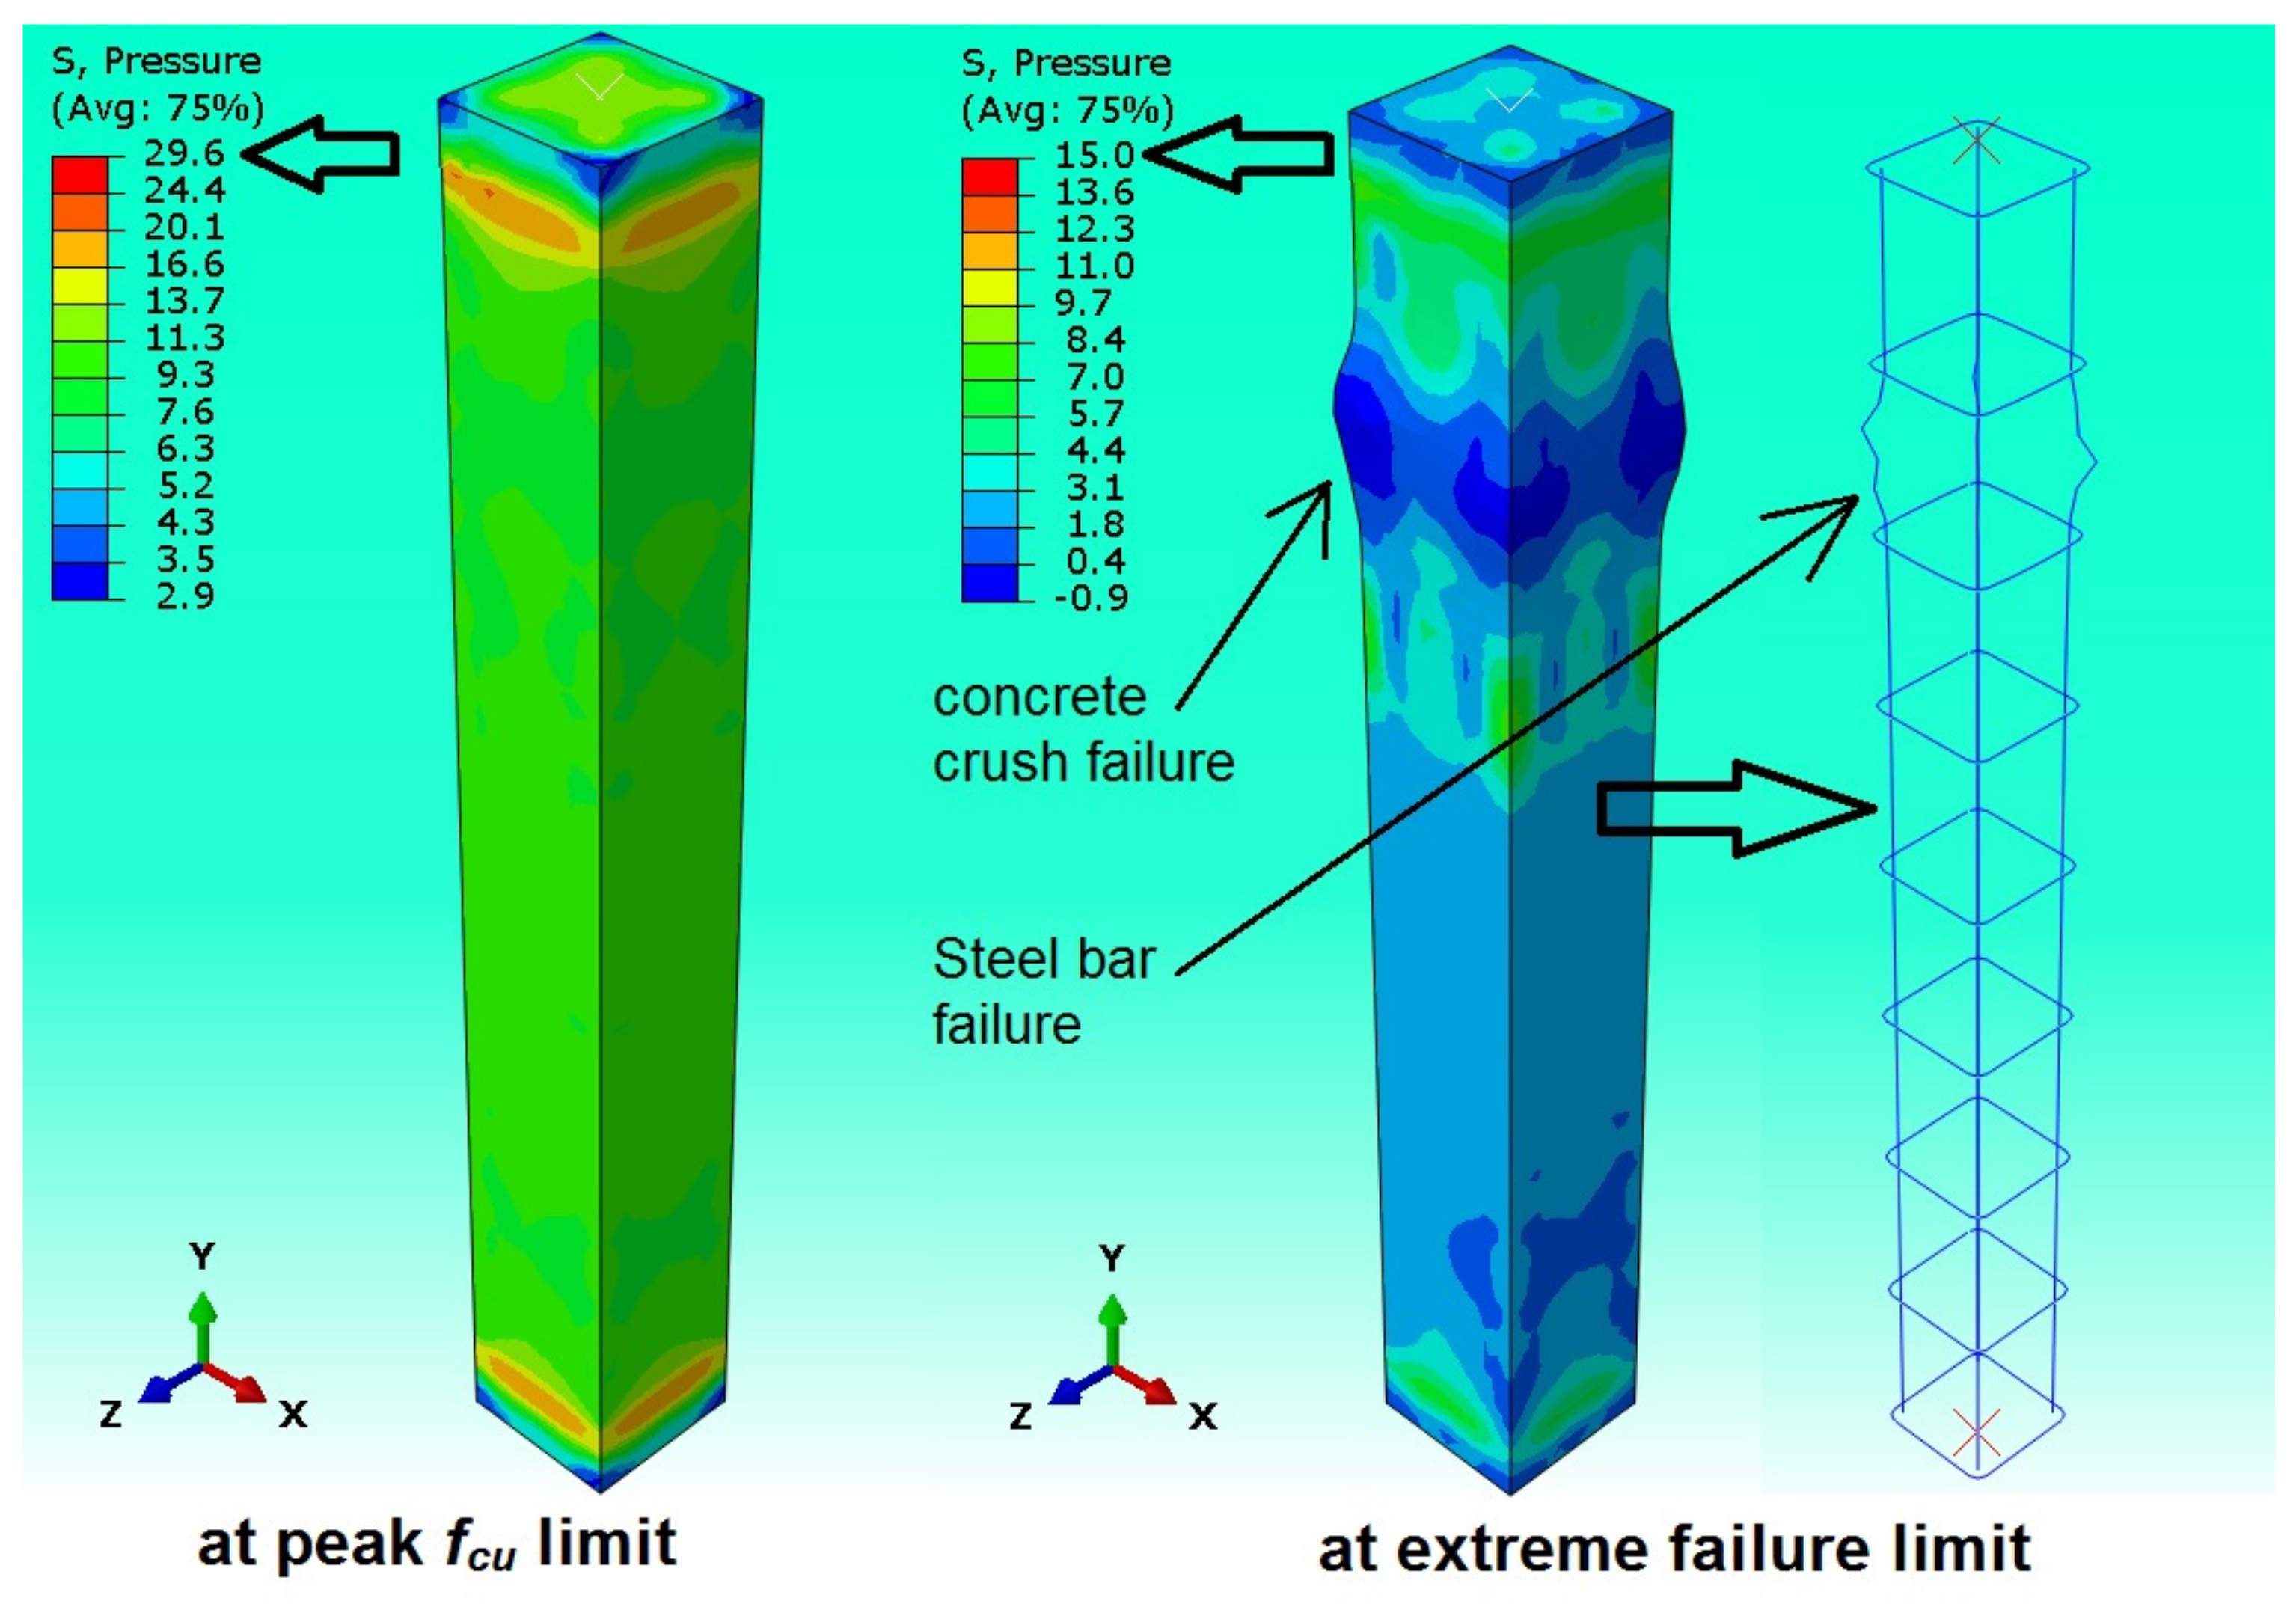
5.4. Validate the FE Models

The selected mixtures from the current study to modeling the FE cubes are Mix-1, Mix-17, Mix-22, Mix 26, and Mix-28, which achieved f c u values equal to 55.8, 75.4, 86.5, 100.5 and 118.3 MPa, respectively (see the above Table 3 and Figure 7). Due to the FE analyses study, the related cubes models achieved very close f c u values as compared in Figure 17, where the FE analyses showed slightly overestimated the actual tested values with acceptable deviations of about 6% (estimated from the average results of all five cube models). The actual crushed concrete behavior under the compression test once reached the ultimate mixture strength has been simulated accurately in the currently analyzed FE cubes model, as presented in Figure 18 for the model with mix-17 as an example.
Furthermore, five hybrid-fiber reinforced concrete columns tested in [49] were selected to verify the newly developed analytical concrete stress-strain model. The cross-sectional details of HFRCs are depicted in Figure 19, which is representing the same details given in [49]. Particularly, current FE columns models are prepared to simulating the tested columns with sample labels HC 0.7 0.1 , HC 0.8 0.3 , HC 0.8 0.7 , HC 1.0 0.3 , and HC 1.0 0.9 which achieved f c u values equal to 34.38 MPa , 37.81 MPa , 32.05 MPa , 35.17 MPa , and 29.74 MPa respectively, as given in [49]. The FE analyses showed that the HFRC columns models achieved slightly higher ultimate loading capacity values compared to the related tested specimens in [50], as presented in Figure 20. This deviation could be occurred due to the idealistic behavior that usually behaved by the numerical elements of the FE model compared to the actual elements of the experimental specimen’s components [49]. Generally, the overall standard deviations obtained from the comparisons between the FE column results and the corresponding tested columns are equal to 2.7%, which was estimated from the average values of ultimate loading capacities of the FE models to the tested specimens. In addition, the failure modes that achieved numerically for the analyzed columns are fairly matched to the actual crushed failures of the corresponding tested columns ( HC 1.0 0.9 ), as shown in Figure 21.

6. Conclusions

This work developed a stress-strain curves for hybrid fiber reinforced concrete (HFRC) in compression with varying fiber content. This study is limited to two fibre types: polyvinyl alcohol and hocked-end steel fibers. The suggested stress-strain relationship model was developed and validated using a dataset containing 30 HFRC mixtures. The CoV, the mean, and the correlation coefficient (R) values of 12.67%, 0.963, and 0.9997, respectively, were found in the statistical analysis, confirming the model’s excellent predictive accuracy and consistency, so it is possible to precisely predict concretes’ stress and strain capacity by using a proposed model that incorporates polyvinyl alcohol and hocked-end steel fibers.
The PSO technique was discovered to be a highly useful instrument for predicting stress-strain problems and providing an optimum solution for estimating stress capacity values utilizing a variety of parameters with a tolerable degree of precision. The development approach entails the collection of 30 HFRC curves. High-strength concrete with a compressive strength between 40 and 120 MPa can be estimated using the proposed stress-strain model. The proposed model has the highest ARE frequency (ARE 10%) and the lowest ARE frequency (ARE > 15%). Carreira and Chu’s model has been modified to incorporate two distinct fibers. The updated equation’s critical parameters have been empirically determined as a function of concrete strength.
The results display that, increases in the hocked steel fiber content up to a particular level, with a constant polyvinyl alcohol fiber amount, lead to increases in the stress capacity values. The established model can be utilized for practical predesign purposes because it is produced from testing on mixes with a wide variety of material components and attributes. The adequacy of modeling the structural elements that have varied contains fibers (one or more) have been achieved through a valid compression with the results of their corresponding tested specimens, confirming that the hybrid-reinforced concrete mixtures can be simulated adequately using the proper F E analysis software, opening the gate to further investigations of numerical analyses in this field.

Author Contributions

Conceptualization, A.A.A., A.H.A.-Z. and S.R.A.Z.; Data curation, A.A.A., A.H.A.-Z. and A.N.H.; Formal analysis, A.W.A.Z., M.M.H. and A.N.H.; Funding acquisition, A.A.A., A.H.A.-Z. and H.A.A.; Investigation, A.H.A.-Z. and S.R.A.Z.; Methodology, A.A.A., S.R.A.Z. and A.N.H.; Project administration, A.A.A., A.H.A.-Z., S.R.A.Z. and A.N.H.; Resources, S.R.A.Z., A.W.A.Z., M.M.H. and H.A.A.; Software, A.N.H., A.W.A.Z. and M.M.H.; Supervision, S.R.A.Z. and H.A.A.; Validation, A.N.H., A.W.A.Z., and A.A.A.; Visualization, A.H.A.-Z., M.M.H. and H.A.A.; Writing—original draft, A.A.A., A.H.A.-Z., A.N.H. and A.W.A.Z.; Writing—review and editing, S.R.A.Z., M.M.H., A.A.A., A.W.A.Z. and H.A.A. All authors have read and agreed to the published version of the manuscript.

Funding

This research received no external funding.

Institutional Review Board Statement

Not applicable.

Informed Consent Statement

Not applicable.

Data Availability Statement

Data are presented in the article.

Acknowledgments

The authors would like to express their gratitude for the support provided by the University of Baghdad-Iraq, Universiti Kebangsaan Malaysia, Ministry of Science and Technology, and University of Technology-Iraq.

Conflicts of Interest

The authors declare no conflict of interest.

References

  1. Hanoon, A.N.; Al Zand, A.W.; Yaseen, Z.M. Designing new hybrid artificial intelligence model for CFST beam flexural performance prediction. Eng. Comput. 2021, 1–27. [Google Scholar] [CrossRef]
  2. Mahmod, M.; Hanoon, A.N.; Abed, H.J. Flexural behavior of self-compacting concrete beams strengthened with steel fiber reinforcement. J. Build. Eng. 2018, 16, 228–237. [Google Scholar] [CrossRef]
  3. Odaa, S.A.; Hason, M.M.; Sharba, A.A.K. Self-compacting concrete beams reinforced with steel fiber under flexural loads: A ductility index evaluation. Mater. Today Proc. 2021, 42, 2259–2267. [Google Scholar] [CrossRef]
  4. Thomas, J.; Ramaswamy, A. Mechanical Properties of Steel Fiber-Reinforced Concrete. J. Mater. Civ. Eng. 2007, 19, 385–392. [Google Scholar] [CrossRef]
  5. Akcay, B.; Tasdemir, M.A. Mechanical behaviour and fibre dispersion of hybrid steel fibre reinforced self-compacting concrete. Constr. Build. Mater. 2012, 28, 287–293. [Google Scholar] [CrossRef]
  6. AbdulHameed, A.A.; Said, A.I. CFRP Laminates Reinforcing Performance of Short-Span Wedge-Blocks Segmental Beams. Fibers 2020, 8, 6. [Google Scholar] [CrossRef] [Green Version]
  7. Al-Zuhairi, A.H.; Al-Ahmed, A.H.A.; Hanoon, A.N.; Abdulhameed, A.A. Structural Behavior of Reinforced Hybrid Concrete Columns under Biaxial Loading. Lat. Am. J. Solids Struct. 2021, 18. [Google Scholar] [CrossRef]
  8. Almusallam, T.; Siddiqui, N.; Iqbal, R.A.; Abbas, H. Response of hybrid-fiber reinforced concrete slabs to hard projectile impact. Int. J. Impact Eng. 2013, 58, 17–30. [Google Scholar] [CrossRef]
  9. Abbas, H.; Almusallam, T.; Al-Salloum, Y. Improving the Impact Resistance of Reinforced Concrete. Adv. Mater. Res. 2014, 919–921, 1924–1929. [Google Scholar] [CrossRef]
  10. Bajaj, V.; Singh, S.P.; Singh, A.P.; Kaushik, S.K. Flexural fatigue analysis of hybrid fibre-reinforced concrete. Mag. Concr. Res. 2012, 64, 361–373. [Google Scholar] [CrossRef]
  11. ACI-Committee. Design Considerations for Steel Fiber Reinforced Concrete. ACI Struct. J. 1988, 85. [Google Scholar] [CrossRef]
  12. Chin, M.S.; Mansur, M.A.; Wee, T.H. Effects of Shape, Size, and Casting Direction of Specimens on Stress-Strain Curves of High-Strength Concrete. ACI Mater. J. 1997, 94, 209–219. [Google Scholar] [CrossRef]
  13. ACI-Committee. State of the Art Report on High-Strength Concrete. ACI J. Proc. 1984, 81. [Google Scholar] [CrossRef]
  14. Al-Quraishi, H.; Lafta, M.J.; Abdulridha, A.A. Direct Shear Behavior of Fiber Reinforced Concrete Elements. J. Eng. 2018, 24, 231–248. [Google Scholar]
  15. Mehrabi, P.; Shariati, M.; Kabirifar, K.; Jarrah, M.; Rasekh, H.; Trung, N.T.; Shariati, A.; Jahandari, S. Effect of pumice powder and nano-clay on the strength and permeability of fiber-reinforced pervious concrete incorporating recycled concrete aggregate. Constr. Build. Mater. 2021, 287, 122652. [Google Scholar] [CrossRef]
  16. Toghroli, A.; Mehrabi, P.; Shariati, M.; Trung, N.T.; Jahandari, S.; Rasekh, H. Evaluating the use of recycled concrete aggregate and pozzolanic additives in fiber-reinforced pervious concrete with industrial and recycled fibers. Constr. Build. Mater. 2020, 252, 118997. [Google Scholar] [CrossRef]
  17. Sinaei, H. Numerical investigation on exterior reinforced concrete Beam-Column joint strengthened by composite fiber reinforced polymer (CFRP). Int. J. Phys. Sci. 2011, 6, 6572–6579. [Google Scholar] [CrossRef]
  18. Shariati, M.; Armaghani, D.J.; Khandelwal, M.; Zhou, J.; Khorami, M. Assessment of Longstanding Effects of Fly Ash and Silica Fume on the Compressive Strength of Concrete Using Extreme Learning Machine and Artificial Neural Network. J. Adv. Eng. Comput. 2021, 5, 50–75. [Google Scholar] [CrossRef]
  19. Davoodnabi, S.M.; Mirhosseini, S.M.; Shariati, M. Analyzing shear strength of steel-concrete composite beam with angle connectors at elevated temperature using finite element method. Steel Compos. Struct. 2021, 40, 853–868. [Google Scholar] [CrossRef]
  20. Shariati, M.; Mafipour, M.S.; Mehrabi, P.; Ahmadi, M.; Wakil, K.; Trung, N.T.; Toghroli, A. Prediction of concrete strength in presence of furnace slag and fly ash using Hybrid ANN-GA (Artificial Neural Network-Genetic Algorithm). Smart Struct. Syst. 2020, 25, 183–195. [Google Scholar] [CrossRef]
  21. Armaghani, D.J.; Mirzaei, F.; Shariati, M.; Trung, N.T.; Shariati, M.; Trnavac, D. Hybrid ANN-based techniques in predicting cohesion of sandy-soil combined with fiber. Geomech. Eng. 2020, 20, 191–205. [Google Scholar] [CrossRef]
  22. Lee, S.-C.; Oh, J.-H.; Cho, J.-Y. Compressive Behavior of Fiber-Reinforced Concrete with End-Hooked Steel Fibers. Materials 2015, 8, 1442–1458. [Google Scholar] [CrossRef] [PubMed] [Green Version]
  23. Chalioris, C.E.; Panagiotopoulos, T.A. Flexural analysis of steel fibre-reinforced concrete members. Comput. Concr. 2018, 22, 11–25. [Google Scholar] [CrossRef]
  24. Choi, W.-C.; Jung, K.-Y.; Jang, S.-J.; Yun, H.-D. The Influence of Steel Fiber Tensile Strengths and Aspect Ratios on the Fracture Properties of High-Strength Concrete. Materials 2019, 12, 2105. [Google Scholar] [CrossRef] [Green Version]
  25. Voutetaki, M.E.; Naoum, M.C.; Papadopoulos, N.A.; Chalioris, C.E. Cracking Diagnosis in Fiber-Reinforced Concrete with Synthetic Fibers Using Piezoelectric Transducers. Fibers 2022, 10, 5. [Google Scholar] [CrossRef]
  26. Chalioris, C.E. Steel fibrous RC beams subjected to cyclic deformations under predominant shear. Eng. Struct. 2013, 49, 104–118. [Google Scholar] [CrossRef]
  27. Shariati, M.; Mafipour, M.S.; Haido, J.H.; Yousif, S.T.; Toghroli, A.; Trung, N.T.; Shariati, A. Identification of the most influencing parameters on the properties of corroded concrete beams using an Adaptive Neuro-Fuzzy Inference System (ANFIS). Steel Compos. Struct. 2020, 34, 155. [Google Scholar] [CrossRef]
  28. Shariati, M.; Mafipour, M.S.; Ghahremani, B.; Azarhomayun, F.; Ahmadi, M.; Trung, N.T.; Shariati, A. A novel hybrid extreme learning machine–grey wolf optimizer (ELM-GWO) model to predict compressive strength of concrete with partial replacements for cement. Eng. Comput. 2020, 1–23. [Google Scholar] [CrossRef]
  29. AbdulHameed, A.A.; Said, A.I. Experimental Investigation of the Behavior of Self-Form Segmental Concrete Masonry Arches. Fibers 2019, 7, 58. [Google Scholar] [CrossRef] [Green Version]
  30. Abbas, E.; AlZuhairi, A.H. Effect of Maximum Size of Aggregate on the Behavior of Reinforced Concrete Beams Analyzed using Meso Scale Modeling. J. Eng. 2020, 26, 143–155. [Google Scholar] [CrossRef]
  31. Hason, M.M.; Hanoon, A.N.; Al Zand, A.W.; AbdulHameed, A.A.; Al-Sulttani, A.O. Torsional Strengthening of Reinforced Concrete Beams with Externally-Bonded Fibre Reinforced Polymer: An Energy Absorption Evaluation. Civ. Eng. J. 2020, 6, 69–85. [Google Scholar] [CrossRef]
  32. ASTM C150/C150M-19a; Standard Specification for Portland Cement. ASTM International: West Conshohocken, PA, USA, 2019.
  33. ASTM-C192; Standard Practice for Making and Curing Concrete Test Specimens in the Laboratory Annual Book of ASTM Standards 4.02. ASTM International: West Conshohocken, PA, USA, 2003.
  34. Hason, M.M.; Hanoon, A.N.; Abdulhameed, A.A. Particle Swarm Optimization Technique Based Prediction of Peak Ground Acceleration of Iraq’s Tectonic Regions. J. King Saud Univ. Eng. Sci. 2021. [Google Scholar] [CrossRef]
  35. Kennedy, J.; Eberhart, R.C.; Shi, Y. Chapter seven—The Particle Swarm. In Swarm Intelligence; Kennedy, J., Eberhart, R.C., Shi, Y., Eds.; Morgan Kaufmann: San Francisco, CA, USA, 2001; pp. 287–325. [Google Scholar]
  36. Bratton, D.; Kennedy, J. Defining a Standard for Particle Swarm Optimization. In Proceedings of the 2007 IEEE Swarm Intelligence Symposium, Honolulu, HI, USA, 1–5 April 2007; pp. 120–127. [Google Scholar] [CrossRef]
  37. Hanoon, A.N.; Jaafar, M.S.; Hejazi, F.; Aziz, F.N.A.A. Energy absorption evaluation of reinforced concrete beams under various loading rates based on particle swarm optimization technique. Eng. Optim. 2016, 49, 1483–1501. [Google Scholar] [CrossRef]
  38. Hanoon, A.N.; Jaafar, M.; Hejazi, F.; Aziz, F.N.A. Strut-and-tie model for externally bonded CFRP-strengthened reinforced concrete deep beams based on particle swarm optimization algorithm: CFRP debonding and rupture. Constr. Build. Mater. 2017, 147, 428–447. [Google Scholar] [CrossRef]
  39. Al-Sulttani, A.O.; Ahsan, A.; Hanoon, A.N.; Rahman, A.; Daud, N.; Idrus, S. Hourly yield prediction of a double-slope solar still hybrid with rubber scrapers in low-latitude areas based on the particle swarm optimization technique. Appl. Energy 2017, 203, 280–303. [Google Scholar] [CrossRef]
  40. Lavanya, D.; Udgata, S.K. Swarm intelligence based localization in wireless sensor networks. In International Workshop on Multi-disciplinary Trends in Artificial Intelligence; Springer: Berlin/Heidelberg, Germany, 2011. [Google Scholar]
  41. Carreira, D.J.; Chu, K.-H. Stress-strain relationship for plain concrete in compression. J. Proc. 1985, 82, 797–804. [Google Scholar] [CrossRef]
  42. Frank, I.E.; Todeschini, R. The Data Analysis Handbook. In Data Handling in Science and Technology; Frank, I.E., Todeschini, R., Eds.; Elsevier: Amsterdam, The Netherlands, 1994; pp. 1–352. [Google Scholar]
  43. Berry, E.; Hemmings, R.; Zhang, M.; Malhotra, V. Fourth International Conference on Fly Ash, Silica Fume, Slag, and Natural Pozzolans in Concrete: Supplemental Proceedings; Electric Power Research Inst.: Istanbul, Turkey, 1992. [Google Scholar]
  44. Smith, G.N. Probability and Statistics in Civil Engineering; Collins Professional and Technical Books; Nichols Publishing Company: New York, NY, USA, 1986; 244p. [Google Scholar]
  45. Taylor, K.E. Summarizing multiple aspects of model performance in a single diagram. J. Geophys. Res. Atmos. 2001, 106, 7183–7192. [Google Scholar] [CrossRef]
  46. Bagheri, M.; Bagheri, M.; Gandomi, A.H.; Golbraikh, A. Simple yet accurate prediction method for sublimation enthalpies of organic contaminants using their molecular structure. Thermochim. Acta 2012, 543, 96–106. [Google Scholar] [CrossRef]
  47. Golbraikh, A.; Tropsha, A. Beware of q2! J. Mol. Graph. Model. 2002, 20, 269–276. [Google Scholar] [CrossRef]
  48. Roy, P.P.; Roy, K. On Some Aspects of Variable Selection for Partial Least Squares Regression Models. QSAR Comb. Sci. 2008, 27, 302–313. [Google Scholar] [CrossRef]
  49. Raza, A.; Khan, Q.U.Z. Experimental and numerical behavior of hybrid-fiber-reinforced concrete compression members under concentric loading. SN Appl. Sci. 2020, 2, 701. [Google Scholar] [CrossRef] [Green Version]
  50. Al Zand, A.W.; Badaruzzaman, W.H.W.; Tawfeeq, W.M. New empirical methods for predicting flexural capacity and stiffness of CFST beam. J. Constr. Steel Res. 2020, 164, 105778. [Google Scholar] [CrossRef]
  51. Al Zand, A.W.; Ali, M.M.; Al-Ameri, R.; Badaruzzaman, W.H.W.; Tawfeeq, W.M.; Hosseinpour, E.; Yaseen, Z.M. Flexural Strength of Internally Stiffened Tubular Steel Beam Filled with Recycled Concrete Materials. Materials 2021, 14, 6334. [Google Scholar] [CrossRef] [PubMed]
  52. Hernoune, H.; Benabed, B.; Kanellopoulos, A.; Al-Zuhairi, A.H.; Guettala, A. Experimental and Numerical Study of Behaviour of Reinforced Masonry Walls with NSM CFRP Strips Subjected to Combined Loads. Buildings 2020, 10, 103. [Google Scholar] [CrossRef]
  53. Al-Zuhairi, A.H.; Taj, A.I. Finite Element Analysis of Concrete Beam under Flexural Stresses Using Meso-Scale Model. Civ. Eng. J. 2018, 4, 1288. [Google Scholar] [CrossRef] [Green Version]
  54. Hosseinpour, E.; Baharom, S.; Badaruzzaman, W.H.W.; Shariati, M.; Jalali, A. Direct shear behavior of concrete filled hollow steel tube shear connector for slim-floor steel beams. Steel Compos. Struct. 2018, 26, 485–499. [Google Scholar] [CrossRef]
Figure 1. A diagrammatic illustration of the research approach.
Applsci 12 02245 g001
Figure 2. Respective features of (a) Steel fiber and (b) polyvinyl alcohol fiber.
Applsci 12 02245 g002
Figure 3. Concrete cubes samples.
Applsci 12 02245 g003
Figure 4. Uniaxial compression tests setup.
Applsci 12 02245 g004
Figure 5. The main concept of using PSO.
Applsci 12 02245 g005
Figure 6. Flowchart of the proposed algorithm.
Applsci 12 02245 g006
Figure 7. Compressive strength.
Applsci 12 02245 g007
Figure 8. Maximum strain.
Applsci 12 02245 g008
Figure 9. Stress-strain curves of cubic specimens with various fiber content percentages.
Applsci 12 02245 g009aApplsci 12 02245 g009b
Figure 10. Convergence of swarms of various sizes.
Applsci 12 02245 g010
Figure 11. Using the proposed model, a comparison of predicted and experimental stress capacity.
Applsci 12 02245 g011
Figure 12. Taylor diagrams of predicted versus observed standardized stress capacity using the PSO model (for 80% of the data).
Applsci 12 02245 g012
Figure 13. The proposed model’s (ARE) distribution.
Applsci 12 02245 g013
Figure 14. Taylor diagrams of predicted versus observed standardized stress capacity using the PSO model (for 20% of the data).
Applsci 12 02245 g014
Figure 15. Typical boundary conditions of the suggested 3D FE models. (a) Cube model. (b) RC column model.
Applsci 12 02245 g015
Figure 16. The CDP of concrete FE model. (a) Under compression stresses. (b) under tension stresses.
Applsci 12 02245 g016
Figure 17. Compression of the cubes ultimate compression strengths.
Applsci 12 02245 g017
Figure 18. The failure mode of the FE cube model (Mix-17).
Applsci 12 02245 g018
Figure 19. Cross-sectional details of RC columns specimens.
Applsci 12 02245 g019
Figure 20. Compression of the ultimate axial load capacity of HFRC columns.
Applsci 12 02245 g020
Figure 21. The failure mode of the FE HFRC model HC1.0–0.9.
Applsci 12 02245 g021
Table 1. Portland cement, Class-F fly ash, and silica fume composition and properties.
Chemical Composition, %Portland Cement (PC)FASF
CEM I 42.5RCEM I 52.5R
SiO220.7721.657.0191.96
Al2O35.554.1020.971.20
Fe2O33.350.264.150.84
MgO2.491.301.761.02
CaO61.465.79.780.62
Na2O0.190.192.230.67
K2O0.770.771.531.16
Loss on Ignition (LOI)2.23.201.251.86
Physical properties
Specific gravity3.153.152.22.3
Blaine fineness (m2/kg)325460290-
Table 2. Properties of the fibers used.
MaterialLength
(mm)
Diameter
(mm)
Tensile Strength
(MPa)
Stiffness
(Gpa)
Specific Gravity
P180.41000291.3
S300.7511002007.8
Table 3. Mixture proportions.
Mixture No.Cement I
kg/m3
Cement II
kg/m3
Fly AshSilica Fume
kg/m3
Water
kg/m3
PVA
kg/m3
Steel Fiber
kg/m3
Fine Agg.
kg/m3
Coarse Agg.
kg/m3
A/B Ratio
1739014477288003516091
2533032775281003425941
3243058572270003295721
4739014477288058.53516091
5533032775281058.53425941
6243058572270058.53295721
77390144772889.7558.53516091
85330327752819.7558.53425941
92430585722709.7558.53295721
105310104552079.7558.55068792
113860237542039.7558.54978622
121780428531989.7558.54828372
13419082441639.7558.559810383
143020186421599.7558.559310293
151410341421579.7558.557610003
16073914477288003516091
17053332775281003425941
18024358572270003295721
19073914477288058.53516091
20053332775281058.53425941
21024358572270058.53295721
220739144772889.7558.53516091
230533327752819.7558.53425941
240243585722709.7558.53295721
250531104552079.7558.55068792
260386237542039.7558.54978622
270178428531989.7558.54828372
28041982441639.7558.559810383
290302186421599.7558.559310293
300141341421579.7558.557610003
Table 4. The primary PSO variables.
DescriptionDetails
Particle count, NBetween 10 and 40 is a common range. The number can be extended to 50–100 for some challenging or specific problems.
The dimension of particles, DOptimum solution is decided by the problem at hand
Inertia weight, wAs a rule of thumb, w = 0.7 is considered to be a good starting point [38]. It is also possible to make changes to it throughout subsequent rounds.
Lower and upper bounds for each of the n design variables, x , L x U U Optimum solutions are based on the problem to be optimized. In general, a variety of ranges can be used for different particle diameters.
Cognitive and social characteristicsUsually ( c 1 = c 2 = 1.494 ) and other numbers are acceptable as long as [ 0 < c 1 + c 2 < 4 ] [40].
Table 5. Parameters governing PSO convergence.
DescriptionDetails
T-max is the maximum number of iterations that can be completed in a particular time period.In combination with other PSO parameters, the complexity of the issue to be optimized (D, N)
k f is the number of times the improvement of the objective function meets the convergence condition.A convergence has occurred if the objective function’s improvement over the last k f iterations (including this one) is less than or equal to f m .
The minimum improvement f m in the objective function’s value
Table 6. The PSO algorithm and the best possible values for the unknown coefficients.
ParametersSwarms Size
40 Swarms60 Swarms80 Swarms100 Swarms
α 0 1.54071.07830.75330.7560
α 1 −0.0024−0.00010.00080.0008
α 2 0.00003−0.0008−0.0007−0.0007
α 3 1.08731.08731.08731.0873
α 4 5.99406.87336.61335.9445
α 5 9.16996.78638.41573.8006
α 6 0.03100.29890.22340.0147
α 7 0.81890.05310.60060.9368
α 8 −38.4471−11.001621.0096−0.2854
α 9 63.605111.0420−36.641080.3926
α 10 37.400762.51021.088831.4167
α 11 −47.493245.025548.2601−23.5096
α 12 0.27543.579144.169961.9069
α 13 7.1427−71.484039.3211−6.4045
α 14 7.0842−43.566726.5333−4.3061
α 15 −89.66521.54691.00000.0886
α 16 −22.8279−12.74884.4237−17.8640
M V 1.0650.9521.0040.963
S D 0.2240.1610.1860.122
C o V %21.0316.9518.5612.67
Table 7. The PSO model’s statistical parameters for verification.
No.ExpressionLimitationModel Suggestion
1 R = i = 1 n P D A i P D A i ¯ P D E i P D E i ¯ i = 1 n P D A i P D A i ¯ 2 i = 1 n P D E i P D E i ¯ 2 R > 0.8 0.9997
2 k = i = 1 n P D A i × P D E i P D A i 2 0.85 < k < 1.15 1.0010
3 k ´ = i = 1 n P D A i × P D E i P D E i 2 0.85 < k < 1.15 0.9989
4 R m = R 2 × 1 R 2 R o 2 R m > 0.5 0.7584
where, R o 2 = 1 i = 1 n P D E i P D A i o 2 P D E i P D E i ¯ 2 , P D A i o = k × P D E i
Publisher’s Note: MDPI stays neutral with regard to jurisdictional claims in published maps and institutional affiliations.

