Article

Long-Term Occurrence and Fate of Microplastics in WWTPs: A Case Study in Southwest Europe

1
Department of Chemical and Environmental Engineering, University of Oviedo, C/Julián Clavería s/n, 33006 Oviedo, Spain
2
ACCIONA Agua S.A., 28108 Alcobendas, Spain
*
Author to whom correspondence should be addressed.
Appl. Sci. 2022, 12(4), 2133; https://doi.org/10.3390/app12042133
Submission received: 27 December 2021 / Revised: 11 February 2022 / Accepted: 12 February 2022 / Published: 18 February 2022

Abstract

:
Microplastic (MP) water pollution is a major problem that the world is currently facing, and wastewater treatment plants (WWTPs) represent one of the main alternatives to reduce the MP release to the environment. Several studies have analysed punctual samples taken throughout the wastewater treatment line. However, there are few long-term studies on the evolution of MPs over time in WWTPs. This work analyses the performance of a WWTP sited in Southwest Europe in relation with annual occurrence and fate of MPs. Samples were monthly taken at different points of the facility (influent, secondary effluent, final effluent, and sludge) and MPs were quantified and characterised by means of stereomicroscopy and FTIR spectrophotometry. The majority of MPs found in wastewater and sludge samples were fragments and fibres. Regarding to the chemical composition, in the water samples, polyethylene (PE), polyethylene terephthalate (PET) and polypropylene (PP) stood out, whereas, in the sludge samples, the main polymers were PET, polyamide (PA) and polystyrene (PS). The MPs more easily removed during the wastewater treatment processes were those with sizes greater than 500 µm. Results showed that the MPs removal was very high during all the period analysed with removal efficiencies between 89% and 95%, so no great variations were found between months. MP concentrations in dry sludge samples ranged between 12 and 39 MPs/g, which represented around 79% of the total MPs removed during the wastewater treatment processes. It is noticeable that a trend between temperature and MPs entrapped in sewage sludge was observed, i.e., higher temperatures entailed higher percentage of retention.

1. Introduction

WWTPs are a major indirect source of MP emissions into the environment, due to the daily discharge of large quantities of MPs, from agricultural, industrial or urban activities, to the sewage system [1,2,3]. At the household level, this pollution mainly comes from the use of products that containing MPs, namely cosmetic and personal care products, and also fibres generated during laundry [4,5,6]. In addition, MPs can be originated from the weathering and fragmentation of plastics due to disposal mismanagement or by the wear and tear of plastic items [7,8,9]. These microplastics can enter to the sewage system by surface runoff or stormwater, either because they are on the ground surface or deposited from the atmosphere [10,11,12]; therefore, wastewater could contain a high number of MPs, specifically, the MP concentration reported in WWTPs ranged between 0.28 and 3.14·104 particles/L [13]. Although WWTPs can frequently achieve removal efficiencies of MPs up to 90%, this is insufficient because large quantities of microplastics are still being released into rivers and oceans [13,14,15].
It has been reported that most MPs removed during the wastewater treatment are accumulated in sludge [16]. So far, the reported ranges of MP concentration in wet and dry mixed sludge were 400–7000 and 1500–170,000 particles/kg, respectively [17,18,19,20]. Furthermore, the repeated application of sludge in agriculture as soil amendment is a potential problem, as it favours the excessive and unavoidable accumulation of MPs in the farmlands. It is estimated that the use of sludge as fertilizer releases in European agricultural lands between 63,000 and 430,000 tons of MPs per year [21,22]. MPs not removed from the wastewater during the treatment processes are finally released into the aquatic environment; in particular, the abundance of MPs in the effluent of urban WWTPs ranges between 0.01 and 297 particles/L [13]. MPs emitted to the environment become a potential risk, not only to the ecosystems, but also to human health, since they can be bioaccumulated through the trophic chain [23,24,25,26].
Several chemical, physical and biological processes take place in WWTPs to achieve high-quality effluent water. Each treatment plant uses its own technologies depending on different factors (the subsequent reuse of water, the characteristics of wastewater, the place where the effluent is discharged, etc.) [3]. When the wastewater treatment includes dynamic membranes (DMs) or membrane bioreactor (MBR), MP removals of 99% or even higher have been reported [18,27,28,29,30]. The major drawback is the high cost of implementing and maintaining these technologies. Surprisingly, there are some works that reported similar removal efficiencies employing lower cost technologies, such as conventional activated sludge (CAS) and sequencing batch reactor (SBR) [18,31]. In fact, removal efficiencies in the range between 96–98% have been reported from WWTPs that used that kind of technologies. It is necessary to point out that most works have calculated the removal efficiencies just by analysing a few samples, which can contribute to the dispersion of efficiencies. Analysing the WWTPs performance for extended periods would be necessary to stablish accurate conclusions. Therefore, in this work, the performance of wastewater treatment processes was evaluated in a WWTP sited in Southwest Europe over a 12-month period. The aim of the study is increasing the knowledge on the behaviour, fate and elimination of microplastics in the different stages of treatment throughout the year. Furthermore, as far as we know, it is the first study to analyse the effect of a double consecutive decantation (secondary treatment), as well as the use of a lamellar settler in the tertiary treatment.

2. Materials and Methods

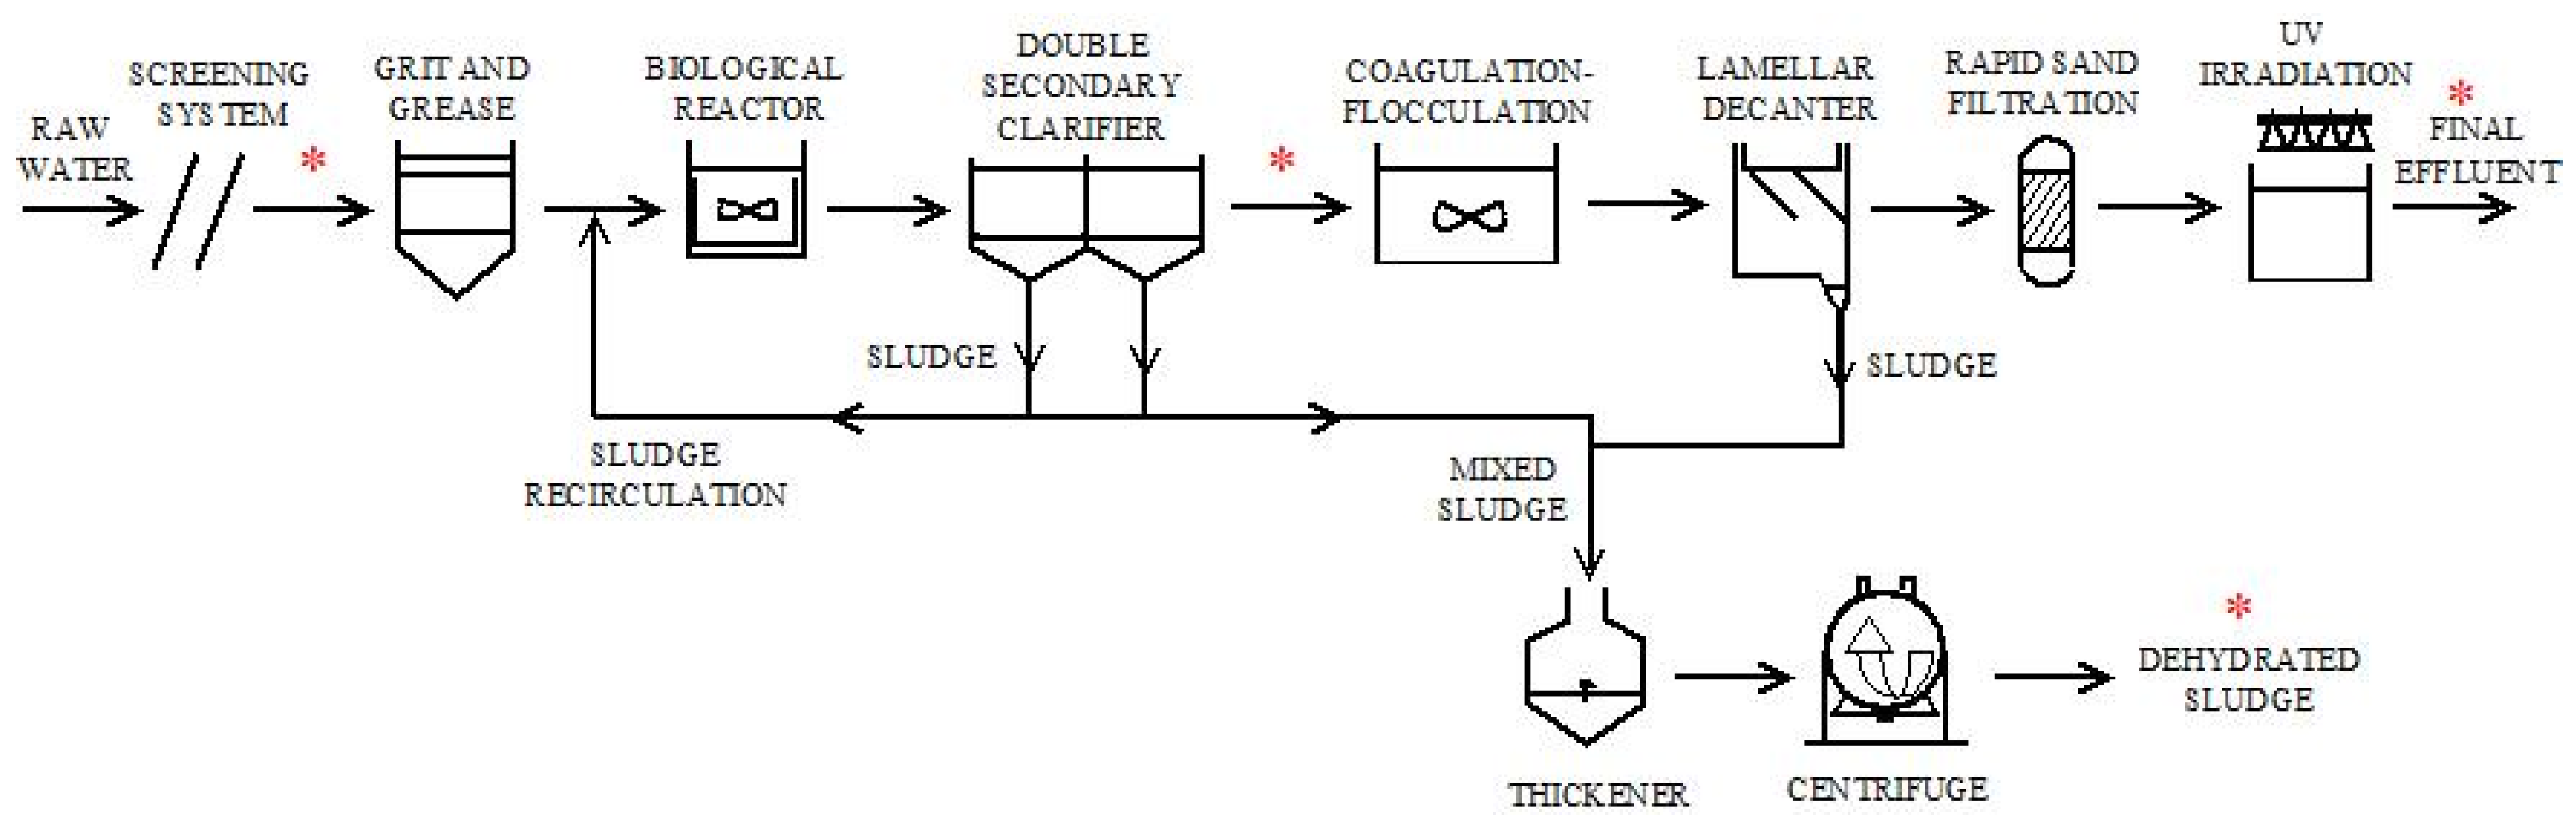
2.1. WWTP Characteristics

The WWTP is located in the Southwest of Spain, specifically in Caravaca de la Cruz (Murcia). It was designed to treat an average daily flow of 8000 m3, serving 85,000 population equivalent (p.e.). Firstly, as can be seen in Figure 1, the raw water is pre-treated by means of a screening system (pore size of 10 mm and 3 mm) and an aerated grit and grease removal system. The secondary treatment consists of an anoxic tank with a capacity of 950 m3 with two agitators, two carousel-type aeration tanks with a total volume of 19,000 m3 and two secondary decanters placed in series. Finally, the tertiary treatment consists of coagulation-flocculation tank, lamellar decanter, rapid sand filter (RSF) and UV disinfection system.
The sludge recovered from the secondary and tertiary treatment is mixed, thickened by settling, and finally, dewatered by means of centrifugation, up to 78–86% moisture content (w/w).

2.2. Sampling Points

To obtain representative and homogeneous samples, the water was collected in turbulent areas to prevent the heavier MPs to sediment. Sampling points are indicated by an asterisk in Figure 1, i.e., after the screening systems (influent), effluent from secondary treatment, effluent from tertiary treatment and dehydrated sludge. To collect the water, it was pumped through a sieve module assembled in a specific sampling device (Figure S1). This device is made up of four mesh stainless steel filters (CISA Sieving Technologies) of 150 mm of diameter and the following slot sizes: 500, 250, 100 and 20 µm (placed from the largest to the smallest one). Thus, MPs contained in the sampled water were classified by size and retained in the corresponding sieve. The flow rate chosen for sampling was 10 L/min which was maintained during approximately 30 min (or until the solids clog the sieves) at each collection point. MPs collected were dragged with distilled water and stored under refrigeration until further processing. The volumes of wastewater sampled at each sampling point each month are detailed in Table S1.
Dewatered sludge samples were also stored under refrigeration. In order to express MP concentration on dry weight basis (w/w), a gravimetric method was used to determine the moisture content of each sample of sludge by triplicate.

2.3. Pre-Treatment of Samples

Water samples were stored in an oven at 90 °C to dryness. After that, the organic matter was degraded by treating the samples with Fenton’s reagent (20 mL of solution of Fe(II) at pH 3 with 20 mL of H2O2 50%) at room temperature, during 30 min. Once digested, samples were left at room temperature for 24 h to allow the residual hydrogen peroxide to evaporate and, then, they were stored in an oven at 90 °C to dryness (10 h). MPs were isolated from the remaining inorganic impurities by density using a solution of ZnCl2 (d = 1.6 g/mL) (97% purity, VWR), so that supernatant was filtered under vacuum using a glass microfiber filter (Whatman, diameter 47 mm, pore size of 0.7 µm).
Sludge samples (5 g) were oxidised during 24 h with 30 mL of hydrogen peroxide (H2O2, 50%). This process was carried out twice. The rest of the procedure was the same as that employed for water samples.
Distilled water and zinc chloride solution employed in the pre-treatment samples were previously filtered using a glass microfiber filter (Whatman, diameter 47 mm, pore size of 0.7 µm) to avoid MP contamination.

2.4. Microplastic Analysis

Filters with MPs were examined under a semiautomatic stereomicroscope (Leica M205FA) with a high-resolution colour digital camera attached (Leica DFC310FX) to process images with a maximum resolution of 1392 × 1040 pixels (1.4 Mpixels CCD). It is used for the quantification of MPs and the analysis of colour and shape of microparticles [28,32,33,34].
To determine the chemical composition of microplastics, an FTIR spectrophotometer coupled to a microscope with an imaging system (Varian 620-IR and Varian 670-IR) with three detection systems is used [35]. Samples were analysed in the mid-infrared of 4000–400 cm−1, a range in which the most typical bands of plastic materials are identified. The identification of functional groups and molecular composition of polymeric surfaces was carried out using the list of absorption bands of sixteen polymers described by Jung et al. (2018) [36].

3. Results and Discussion

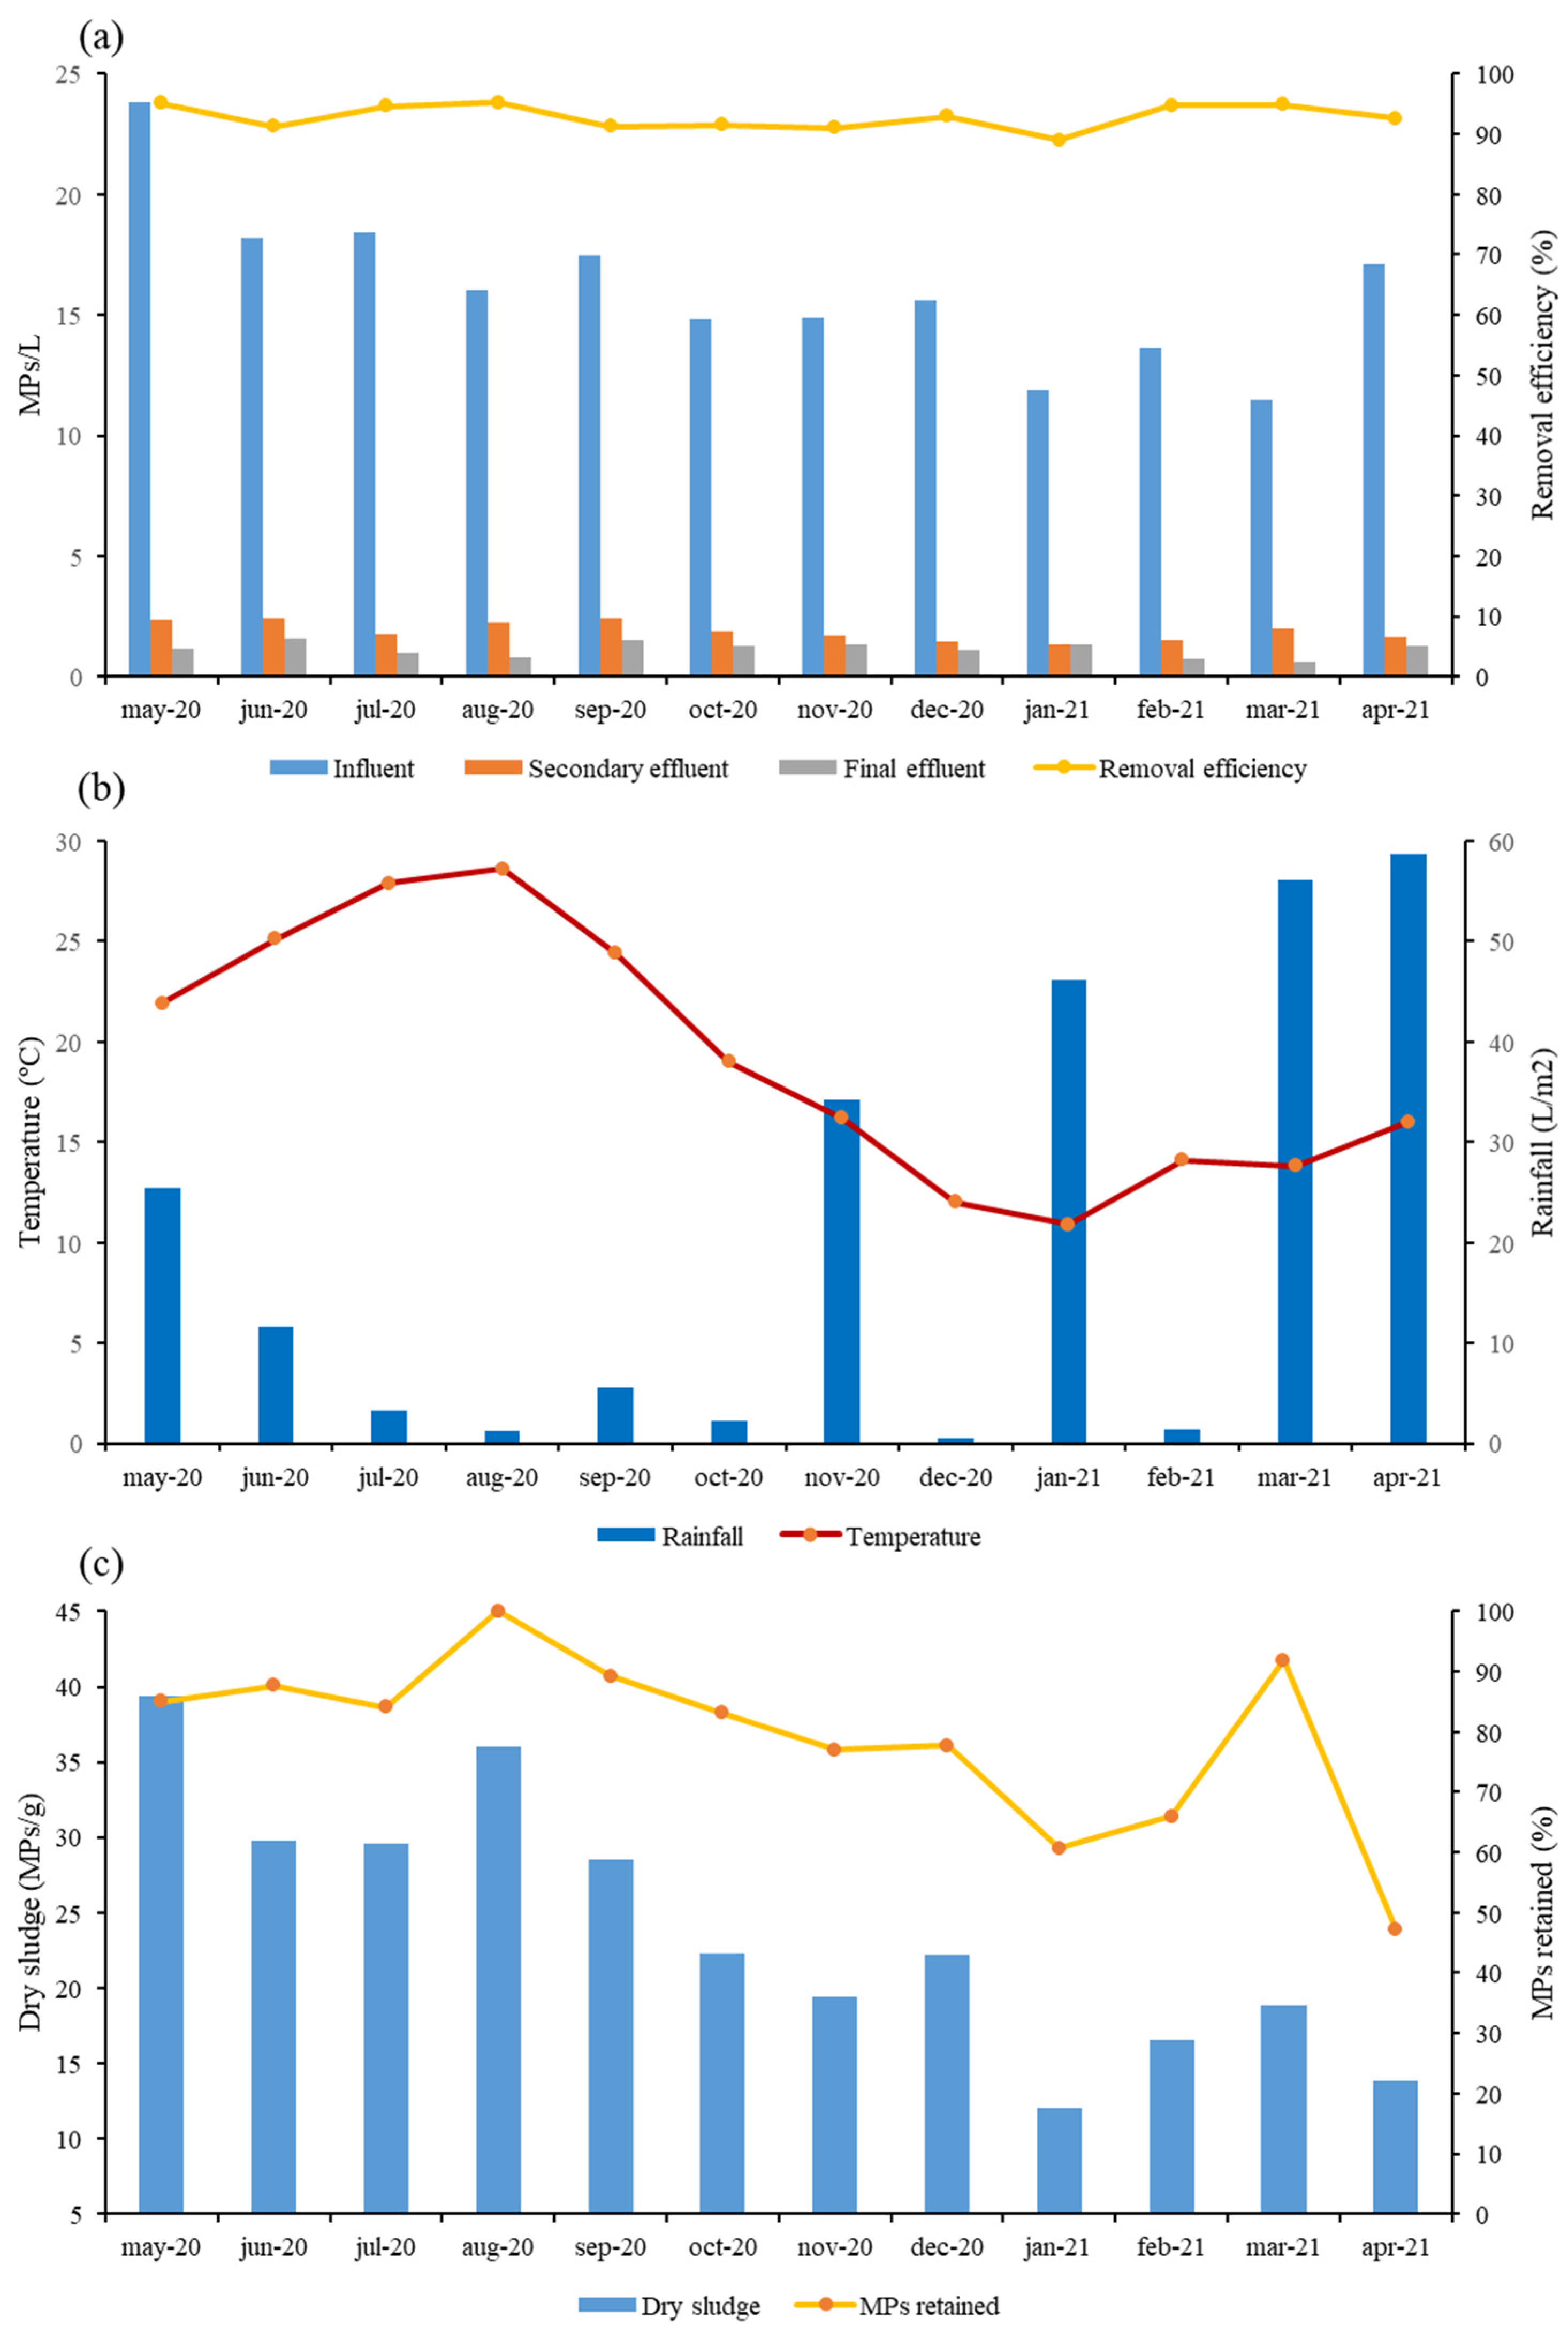
3.1. Occurrence and Evolution of MPs

Nowadays, most of the studies dealing with the occurrence of MPs in WWTPs have been focused on wastewater and sludge samples collected over short periods, i.e., days or weeks [16,32,37]. In this work, the occurrence and evolution of microplastics in a WWTP have been examined, over a 12-month period (Figure 2). Figure 2a summarised the MP concentration in the different sampling points in the WWTP analysed during the study.
Figure 2. (a) Microplastic concentration (MPs/L) in the WWTP at the four sampling points and overall removal efficiency for one year (May 2020–April 2021), (b) rainfall (L/m2) and temperature (°C) recorded in Caravaca de la Cruz over the sampling period (Source: State Meteorological Agency [38]), (c) Microplastic concentration in sludge expressed per dry weight (MPs/g) and percentages of MPs retained in the sludge with respect to the MPs removed during the treatment in the WWTP during the period studied.
Applsci 12 02133 g002
The WWTP receives in the influent, after screening systems, a mean concentration of 16.1 ± 3.3 MPs/L. This value is in accordance with other studies reporting similar MP concentrations in the influent of urban WWTP, for example, between 12–16 MPs/L in China [39,40,41], 12.2 MPs/L in Thailand [42], 15.1 MPs/L in Sweden [43] and 15.7 MPs/L in Scotland [44]. Nevertheless, it should be noted that other works reported MP concentration in influent samples much higher [45] or slightly lower [46] than those found in this work. This can be since the number of MPs in wastewater can be affected by different factors such as population served, lifestyle, climate and seasonal conditions [47].
Considering Figure 2, it can be observed that during the warmest months, from April to September, the MP concentration in influents is, in general, slightly higher compared to the coldest, i.e., January to March. This is probably due to the higher evaporation of water that concentrates microplastics in the aqueous stream. This is in agreement with previous studies, carried out in Spain [10]. It may be due to the fragmentation of (micro)plastics by greater solar irradiation and, to the increase of MP concentration by evaporation of water. On the contrary, Ben-David et al. [48] studied a WWTP in a city located in the north of Israel that reported higher values of MP concentration in the rainy winter season, which was associated with a greater use of washing machines or a greater contribution from land runoff. In this case, there is not any clear correlation between rainfall and the MP concentrations found in influent.
After pre-treatment, the secondary treatment consists of a biological reactor together with a double settling tank. So far, there is no literature data reported on the effect of a double decanter for MP elimination. In general, secondary effluent shows a notable decrease in MP concentration in comparison with those in influent (an average value of 1.90 ± 0.38 MPs/L), which means a removal efficiency (grit and grease removal + biological treatment) higher than of 88%. Hidayaturrahman and Lee [49] analysed the influence of grit and grease and secondary treatment in three WWTPs with MP removals between 75–93%. Similar results were obtained by Ruan et al. [50], who found elimination efficiencies of 87%, whereas Yang et al. [41], after secondary treatment, obtained a removal efficiency of 72%.
It is clear that WWTPs with tertiary treatments have been reported to be more efficient in eliminating MPs than systems that present only a secondary treatment [51]. For example, Magni et al. [19] found a removal efficiency of 64% after the secondary treatment and 84% after the tertiary. In addition, Ziajahromi et al. [52] indicated that, after the secondary treatment, the removal efficiency of MPs was 66%, whereas, after a tertiary treatment, was 87%. Regarding the tertiary treatment applied in this WWTP, that consists of a coagulation-flocculation, a lamellar settler, a RSF and an UV disinfection, the removal efficiency of MPs of around 41% was achieved, which increased the overall removal efficiency until values of around 93% and entails an emission of 1.13 MPs/L in the effluent. In those effluent samples, during the warmest months (April to September) the MP concentration was higher compared to the coldest ones (January to March) with ranges of 0.77–1.58 MPs/L (1.21 ± 0.31) and 0.59–1.31 MPs/L (0.87 ± 0.38), respectively. These results are in accordance with those reported by Jiang et al. [53].
Although coagulation-flocculation is a typical process found in drinking water treatment plants (DWTPs) [54,55], it is also commonly employed in WWTPs. For example, Hidayaturrahman and Lee [49] reported removal efficiencies of MPs between 50–82% by means of a coagulation-flocculation process.
The effect of RSF in the MP elimination has been analysed in previous works with a wide variety of results. For example, in a WWTP located in Finland, MPs were reduced from 0.7 to 0.02 MPs/L, which means an efficiency of 97% [30]. In another study carried out in two German WWTPs, the use of a sand filter achieved a noteworthy MP removal (above 99%) [56], whereas Magni et al. [19] described a MP elimination by a RSF of only 50%.
The overall MP removal efficiency of the WWTP analysed in this work was between 89% and 95%, with an average value of 92.9 ± 2.1% and it is remarkable that no noticeable variation between months was detected, so rainfall and temperature does not seem to affect MP elimination. The removal efficiencies found in the facility analysed in the present work were within the range reported in different European WWTPs (72–98%) [3,57,58,59,60]. A wide variation can be found depending on the treatment technology used and the operating conditions in the WWTP [61], the origin and type of wastewater [20], as well as the sampling and identification methods used in the process, population density and regional development [40].

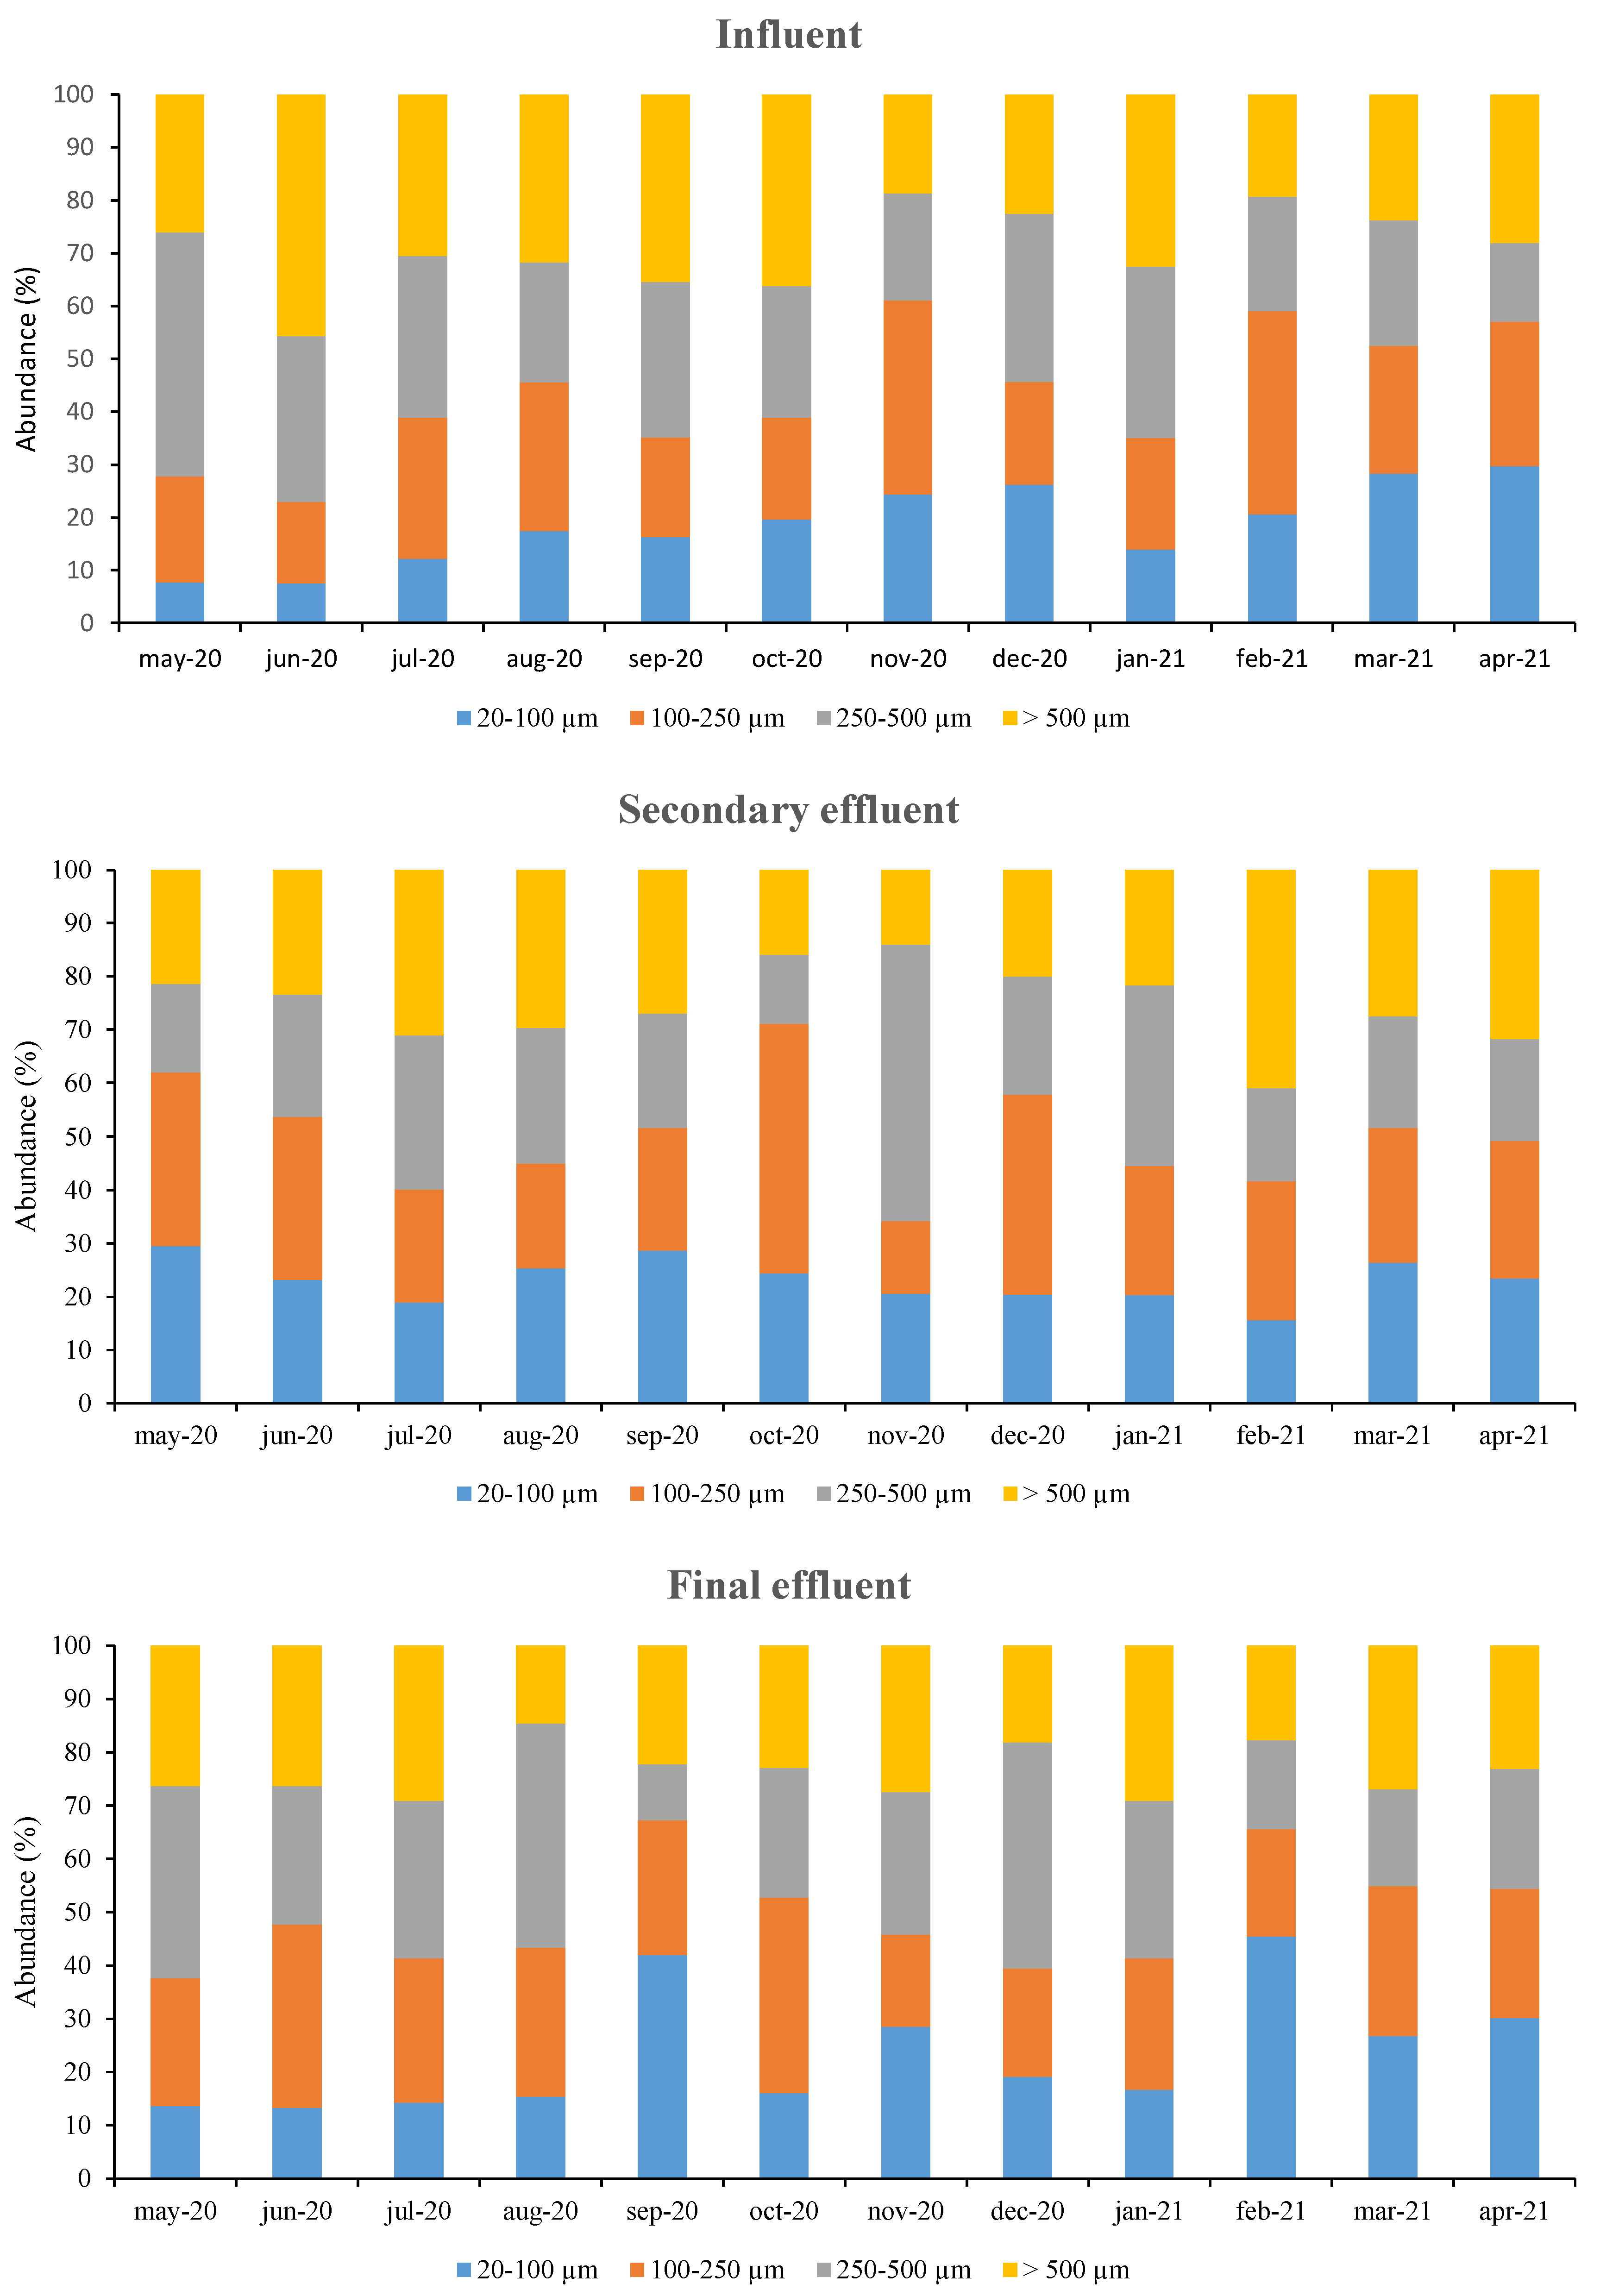
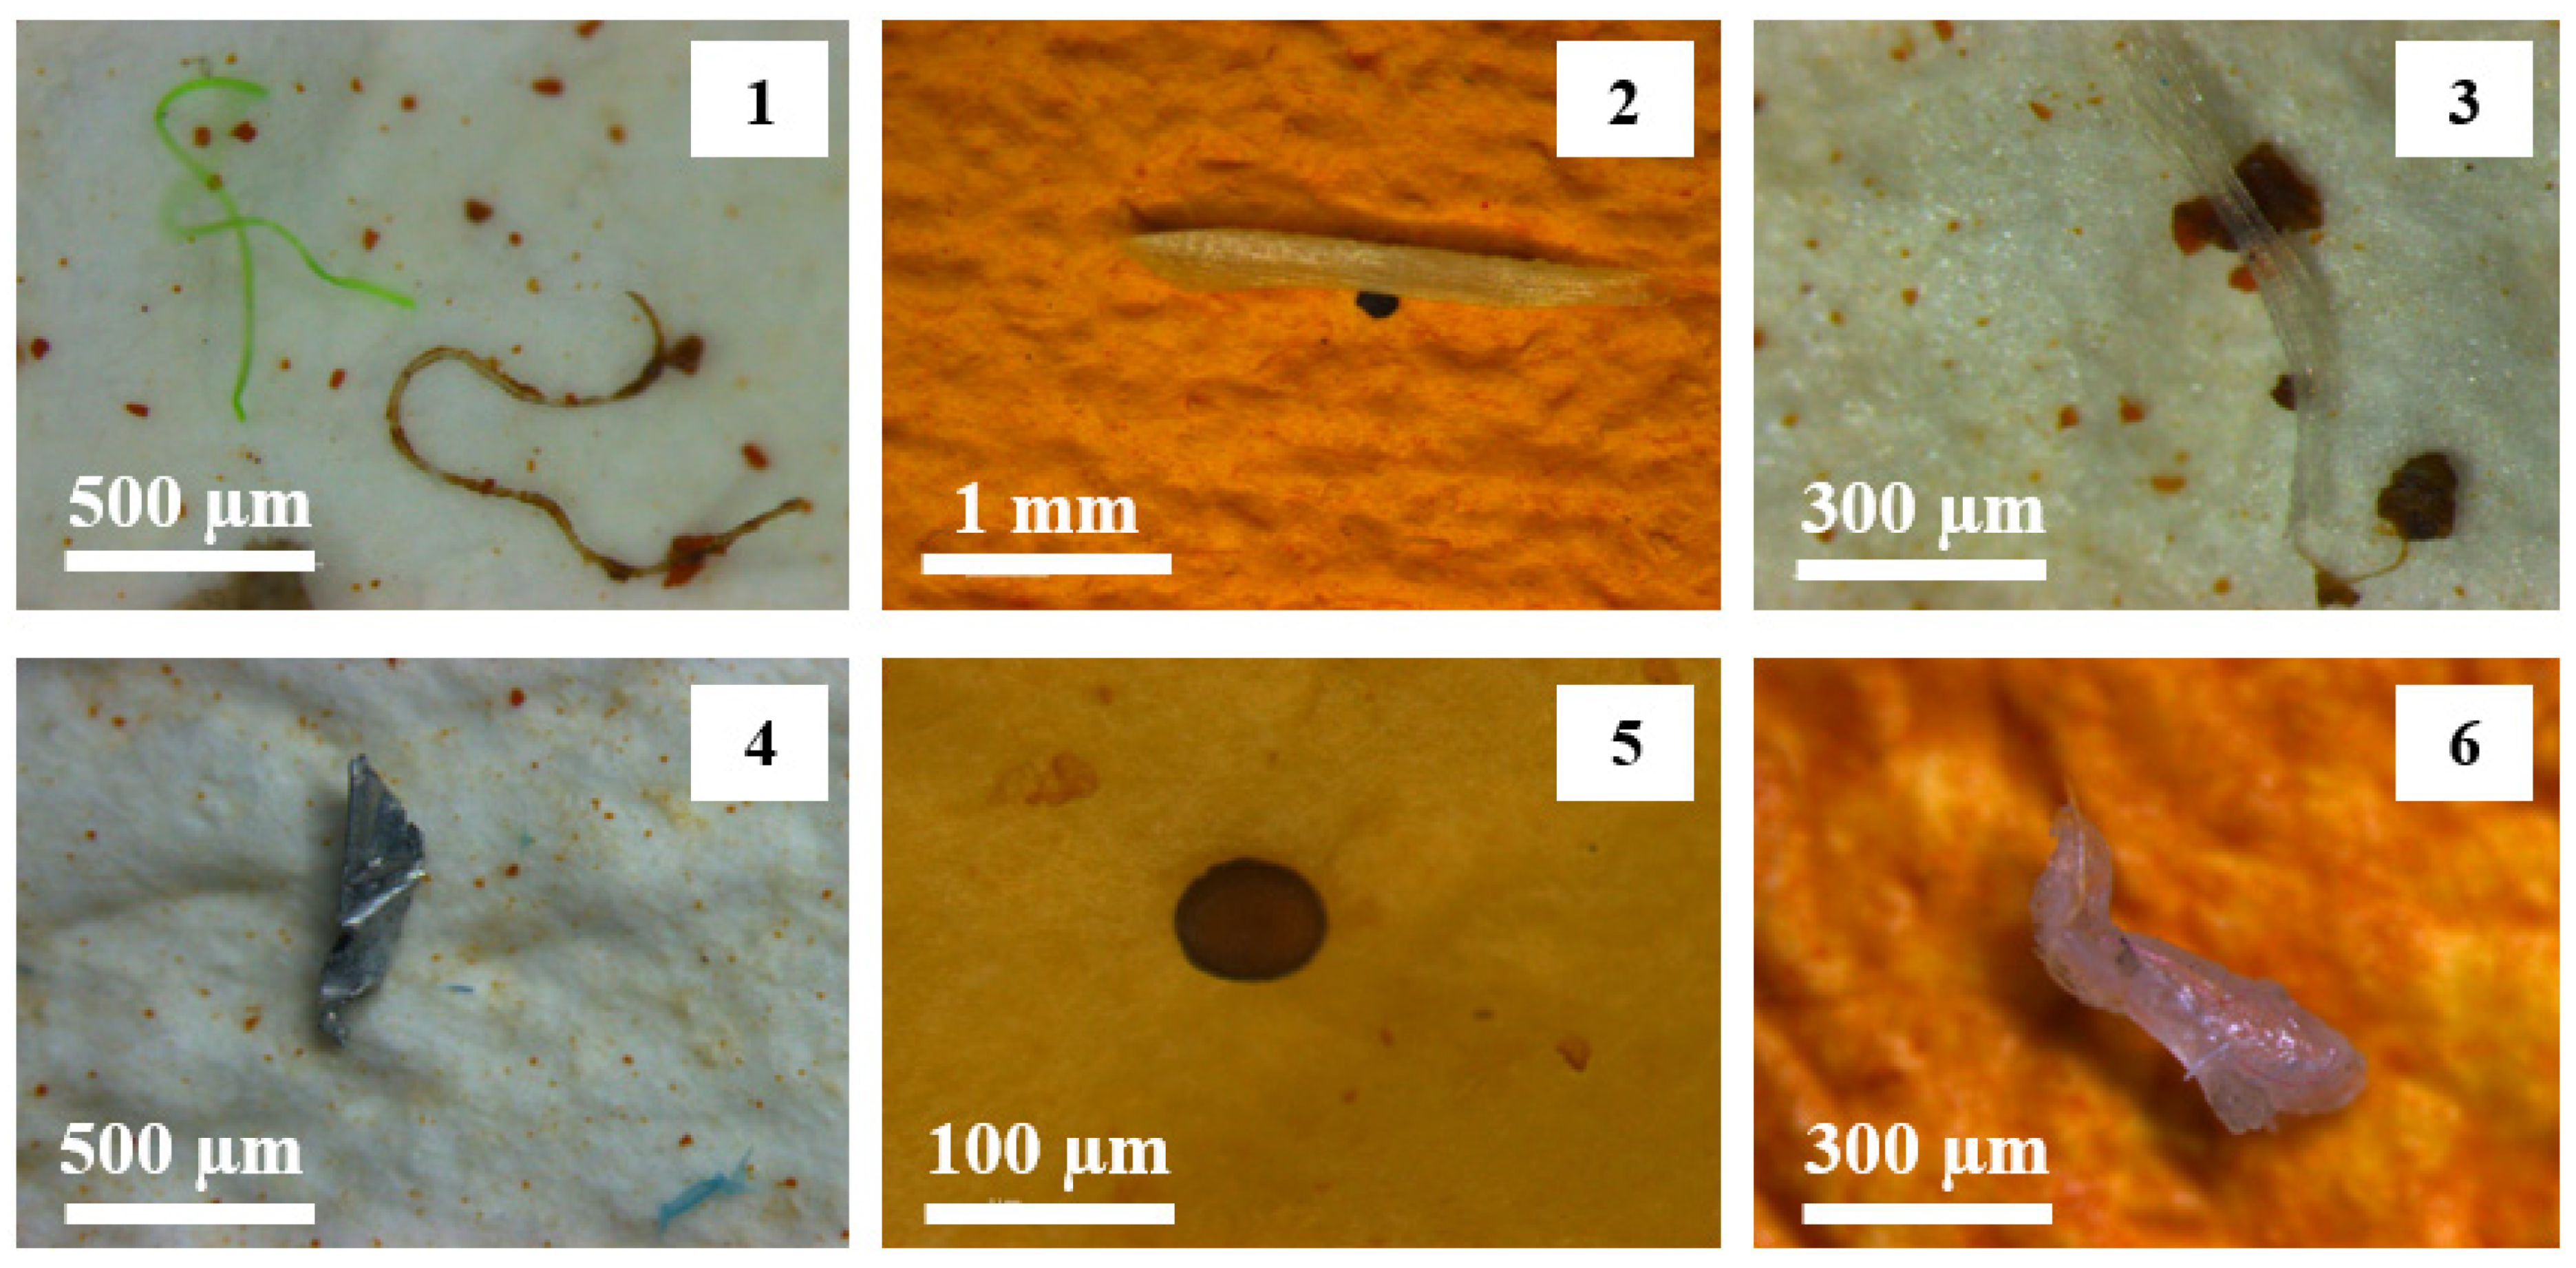
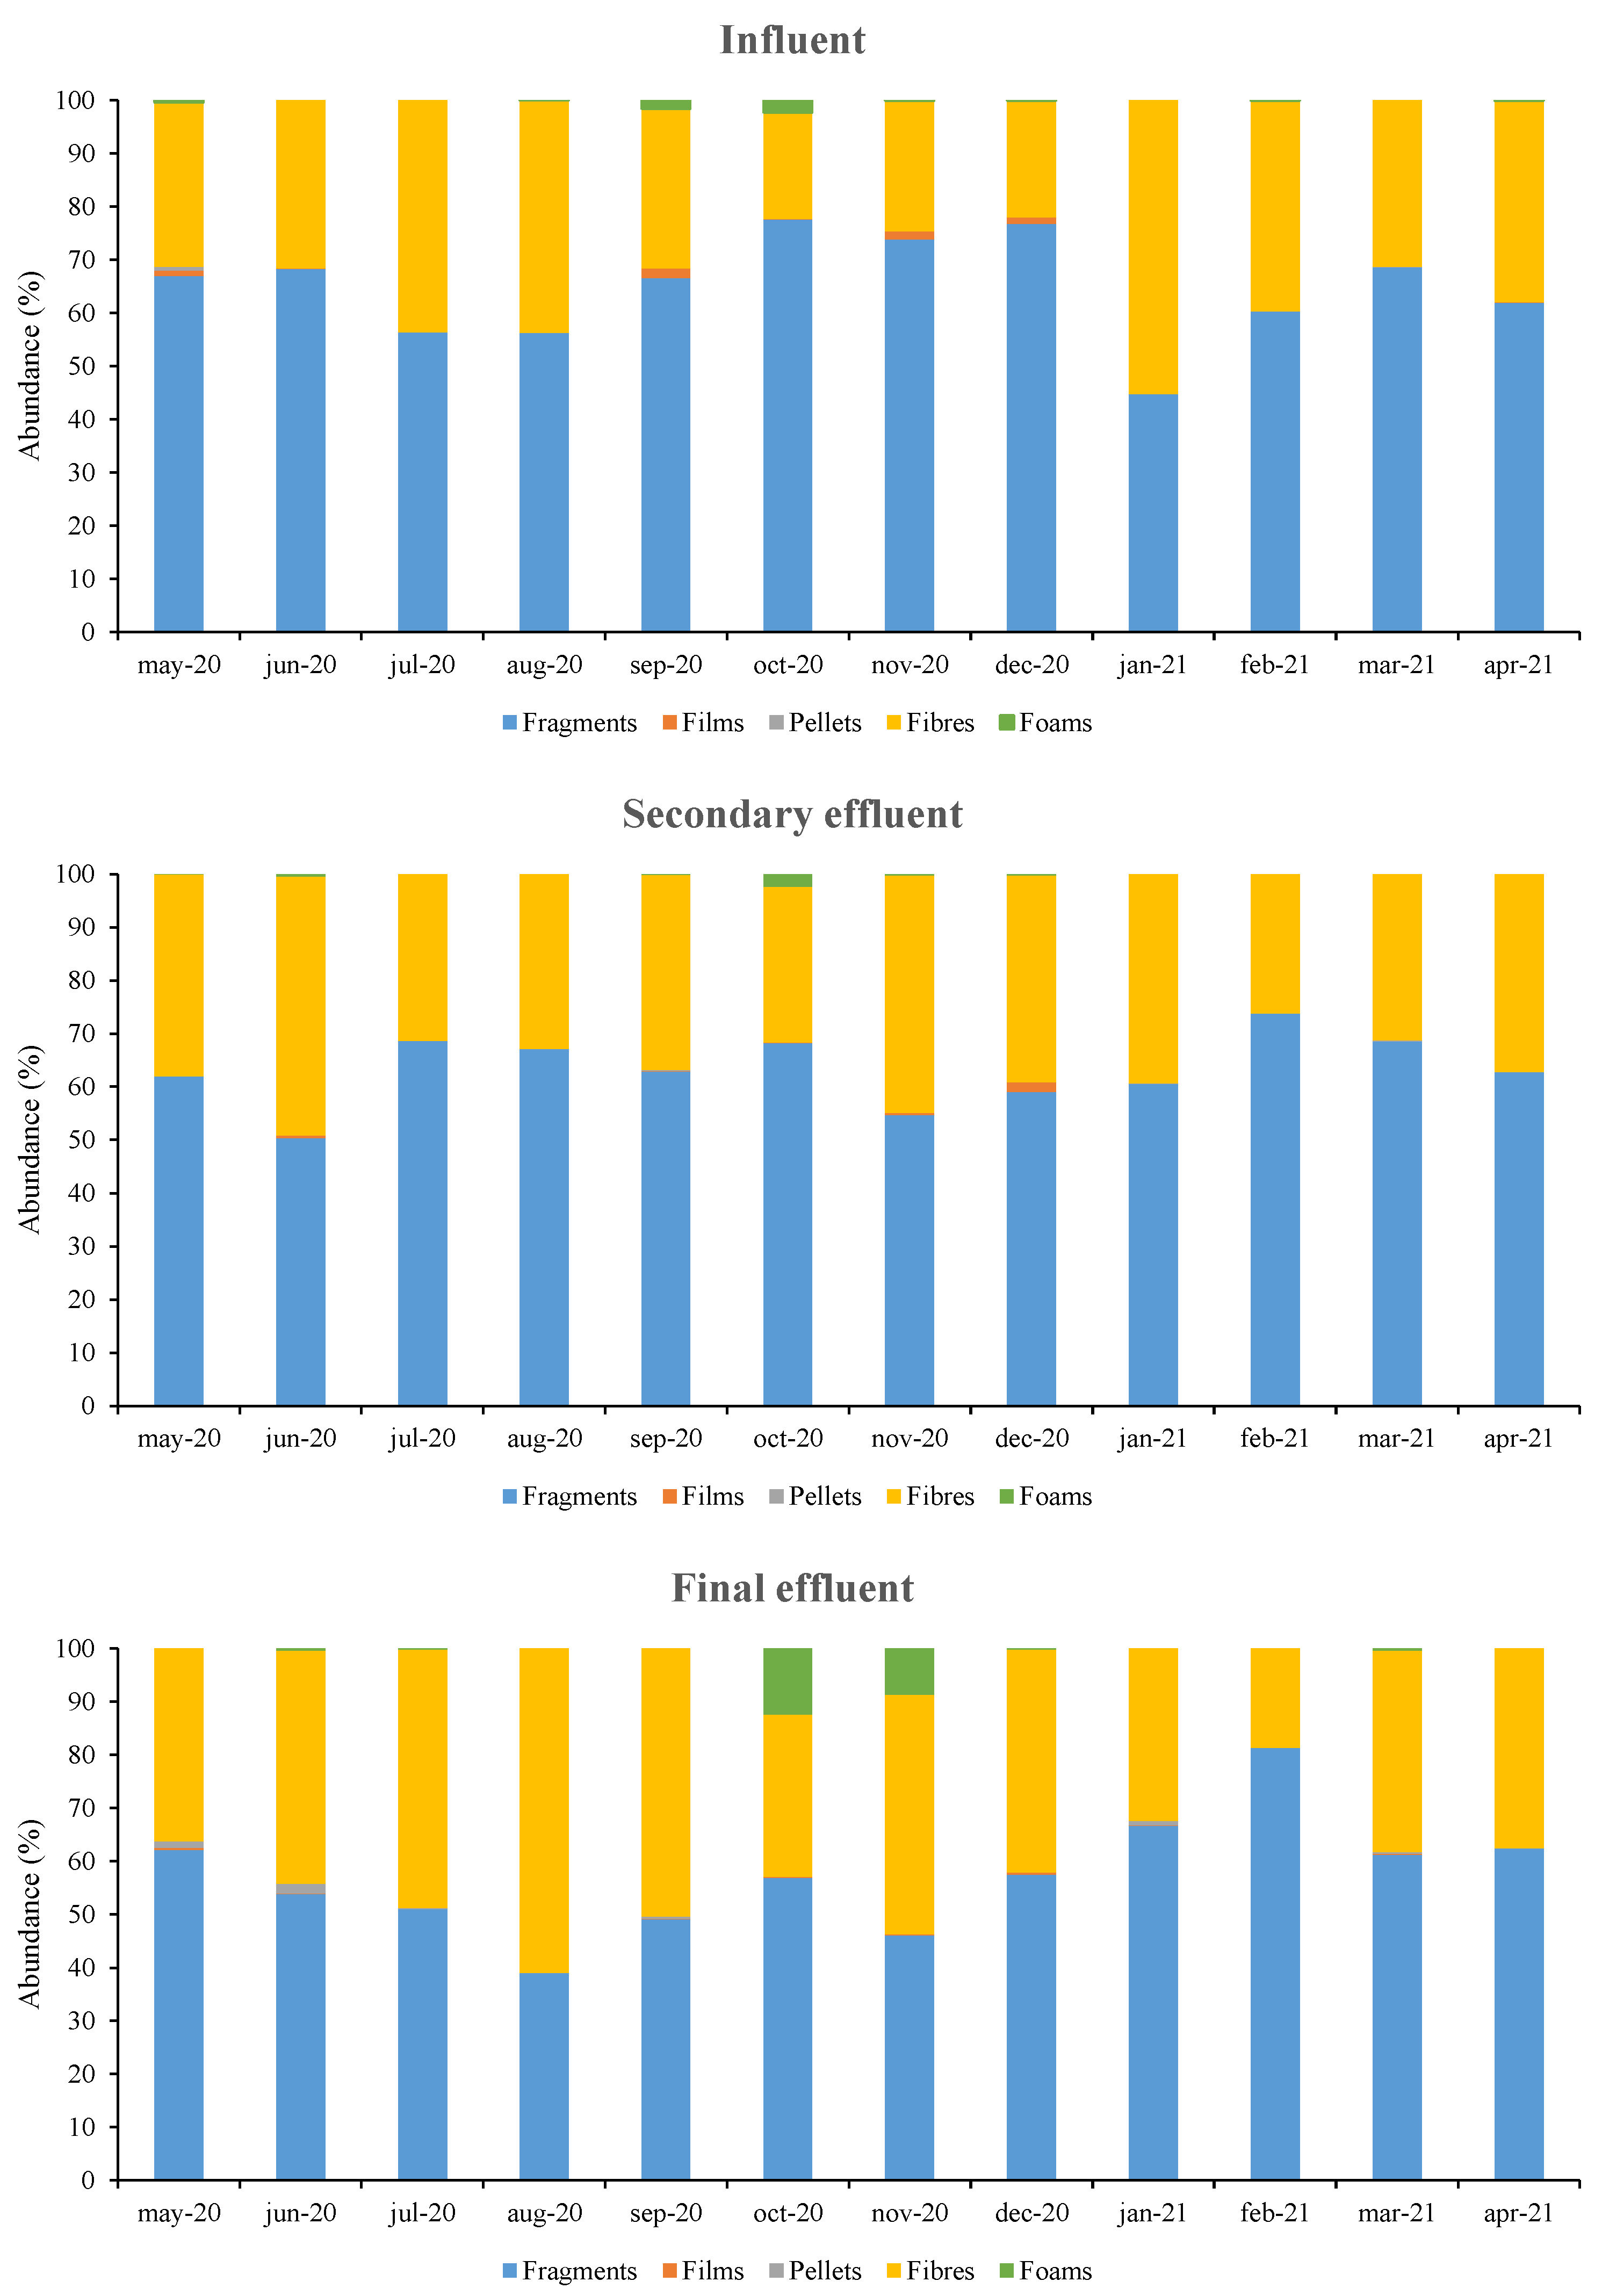
3.2. Characterization of MPs by Size, Shape and Colour

As explained before, the sampling procedure allowed the MP classification by size. According to Figure 3, on average, in influent samples MP ≥ 500 µm only accounted around 30% of total MPs, whereas 56% and 80% represented MPs higher than 250 μm and 100 µm, respectively. This indicates a major percentage of small MPs than usual in the influent since most WWTPs it has been reported MPs abundance with a size greater than 500 µm above 70% [18,45,46,61,62,63]. The variations in the percentages of MPs found in each range of size are noticeable thorough the treatment processes, i.e., the percentage of those MPs with a size greater than 500 µm decreased from 30% in the influent to 24% in the secondary effluent. At the same time, the percentage of the smallest particles (20–100 µm) increased from 20% in the influent to 23% in the secondary effluent. It should be noted that, after pre-treatment and secondary treatment, the MPs most easily eliminated were those larger than 500 μm (57%) and those with a size between 250–500 μm (52%), as can be seen in Table S2. This means that the grit and grease system and the secondary treatment removed the bigger MPs with higher efficiency than the smaller ones. Important variations in the percentages of the middle sizes were not detected and the sizes distribution in the final effluent is similar to the secondary one. In the final effluent samples, the vast majority of MPs were smaller than 500 µm, around 76%, whereas a quarter of the microplastics were smaller than 100 µm (Table S2). These results agree with other previous studies, which reported that most of the MPs in the final effluent were smaller than 500 µm. However, the percentage of MPs smaller than 100 µm in the effluents is usually over 60%, percentage higher than those found in this work [19,31,33,34,52,64,65,66,67]. Table S2 shows that, after tertiary treatment, the most easily eliminated MPs were, both, those larger than 500 μm and those with a size between 100–250 μm (approximately 30%). In addition, considering the temperature, it can be observed that in the warmest months (May–September) the MPs with a size higher of 250 µm presented abundances of 60–70%, while during those months with lower temperature (November, February–April), it is observed that the MPs with sizes less than 250 µm presented abundances of 60%. It has been reported that MP degradation are determined by the combined effect of different parameters, including temperature. Specifically, Ariza-Tarazona et al. [68] concluded that photolysis combined to low temperatures leads to plastic brittleness, which is in accordance with results commented above, since the coldest months showed a greater proportion of MPs smaller than 250 µm. Finally, it can be observed that the overall microplastic removal efficiency was higher in MPs larger than 500 μm (70%) compared to the rest of the sizes.
The morphological characteristics of MPs found in wastewater samples can be classified into five different types: fragments, fibres, microspheres or pellets, films and foams, as can be observed in Figure 4. Fragments exhibit irregular and opaque shapes, whereas fibres show a high length-width ratio. Pellets have spherical form, foams are fluffy particles and, finally, films have a relatively flat surface.
Figure 5 shows the percentages of MP classified by shape found in the different points of sampling: influent, secondary effluent and final effluent. It can be observed that, in all samples, fibres and fragments constitute practically the totality of MPs (above 98%). According to the literature, fibres and fragments are the most predominant particle found in wastewater with a mean percentage of 56% and 34%, respectively [18,41,52,57,69,70,71]. Previous studies reported that fragments are the vast majority MPs [17,34,72,73], in concordance with the results obtained in this case study. Following the evolution of MPs through the wastewater treatment process (Figure 5), in influent samples the concentration of fragments and fibres ranged between 44.8–77.6% (with an average value of 64.9 ± 9.5%) and 20.0–55.2% (with an average value of 34.2 ± 10.2%), respectively. These percentages remained constant after the secondary treatment. However, in the final effluent samples, the concentration of fragments and fibres ranged between 46.1–81.4% and 18.6–61.0%, respectively, which shows a certain decrease in the abundance of fragments (with an average value of 57.3 ± 10.9%) and an increase in the percentage of fibres (with an average value of 40.3 ± 10.8%). This means that the tertiary treatment allowed a better removal of fragments (38%) than fibres (24%), as can be seen in Table S2. It has been reported that the high length-width ratio allows fibres to remain in water masses for more time than particles with other morphologies [2]. In addition, the overall removal efficiency shows a better elimination of fragments in comparison with fibres (67% vs. 56%). Finally, it is noteworthy that films, pellets and foams only account for 1–2%.
Respect to the MPs colour, white and black microparticles were the most common MPs at every sampling point, which means 81% of total MPs. The remaining percentage corresponds to red, blue, green, yellow and purple. This is agreement with previous studies that analyse MPs in WWTPs where higher abundances of white and black MPs were also detected [40,48,74].

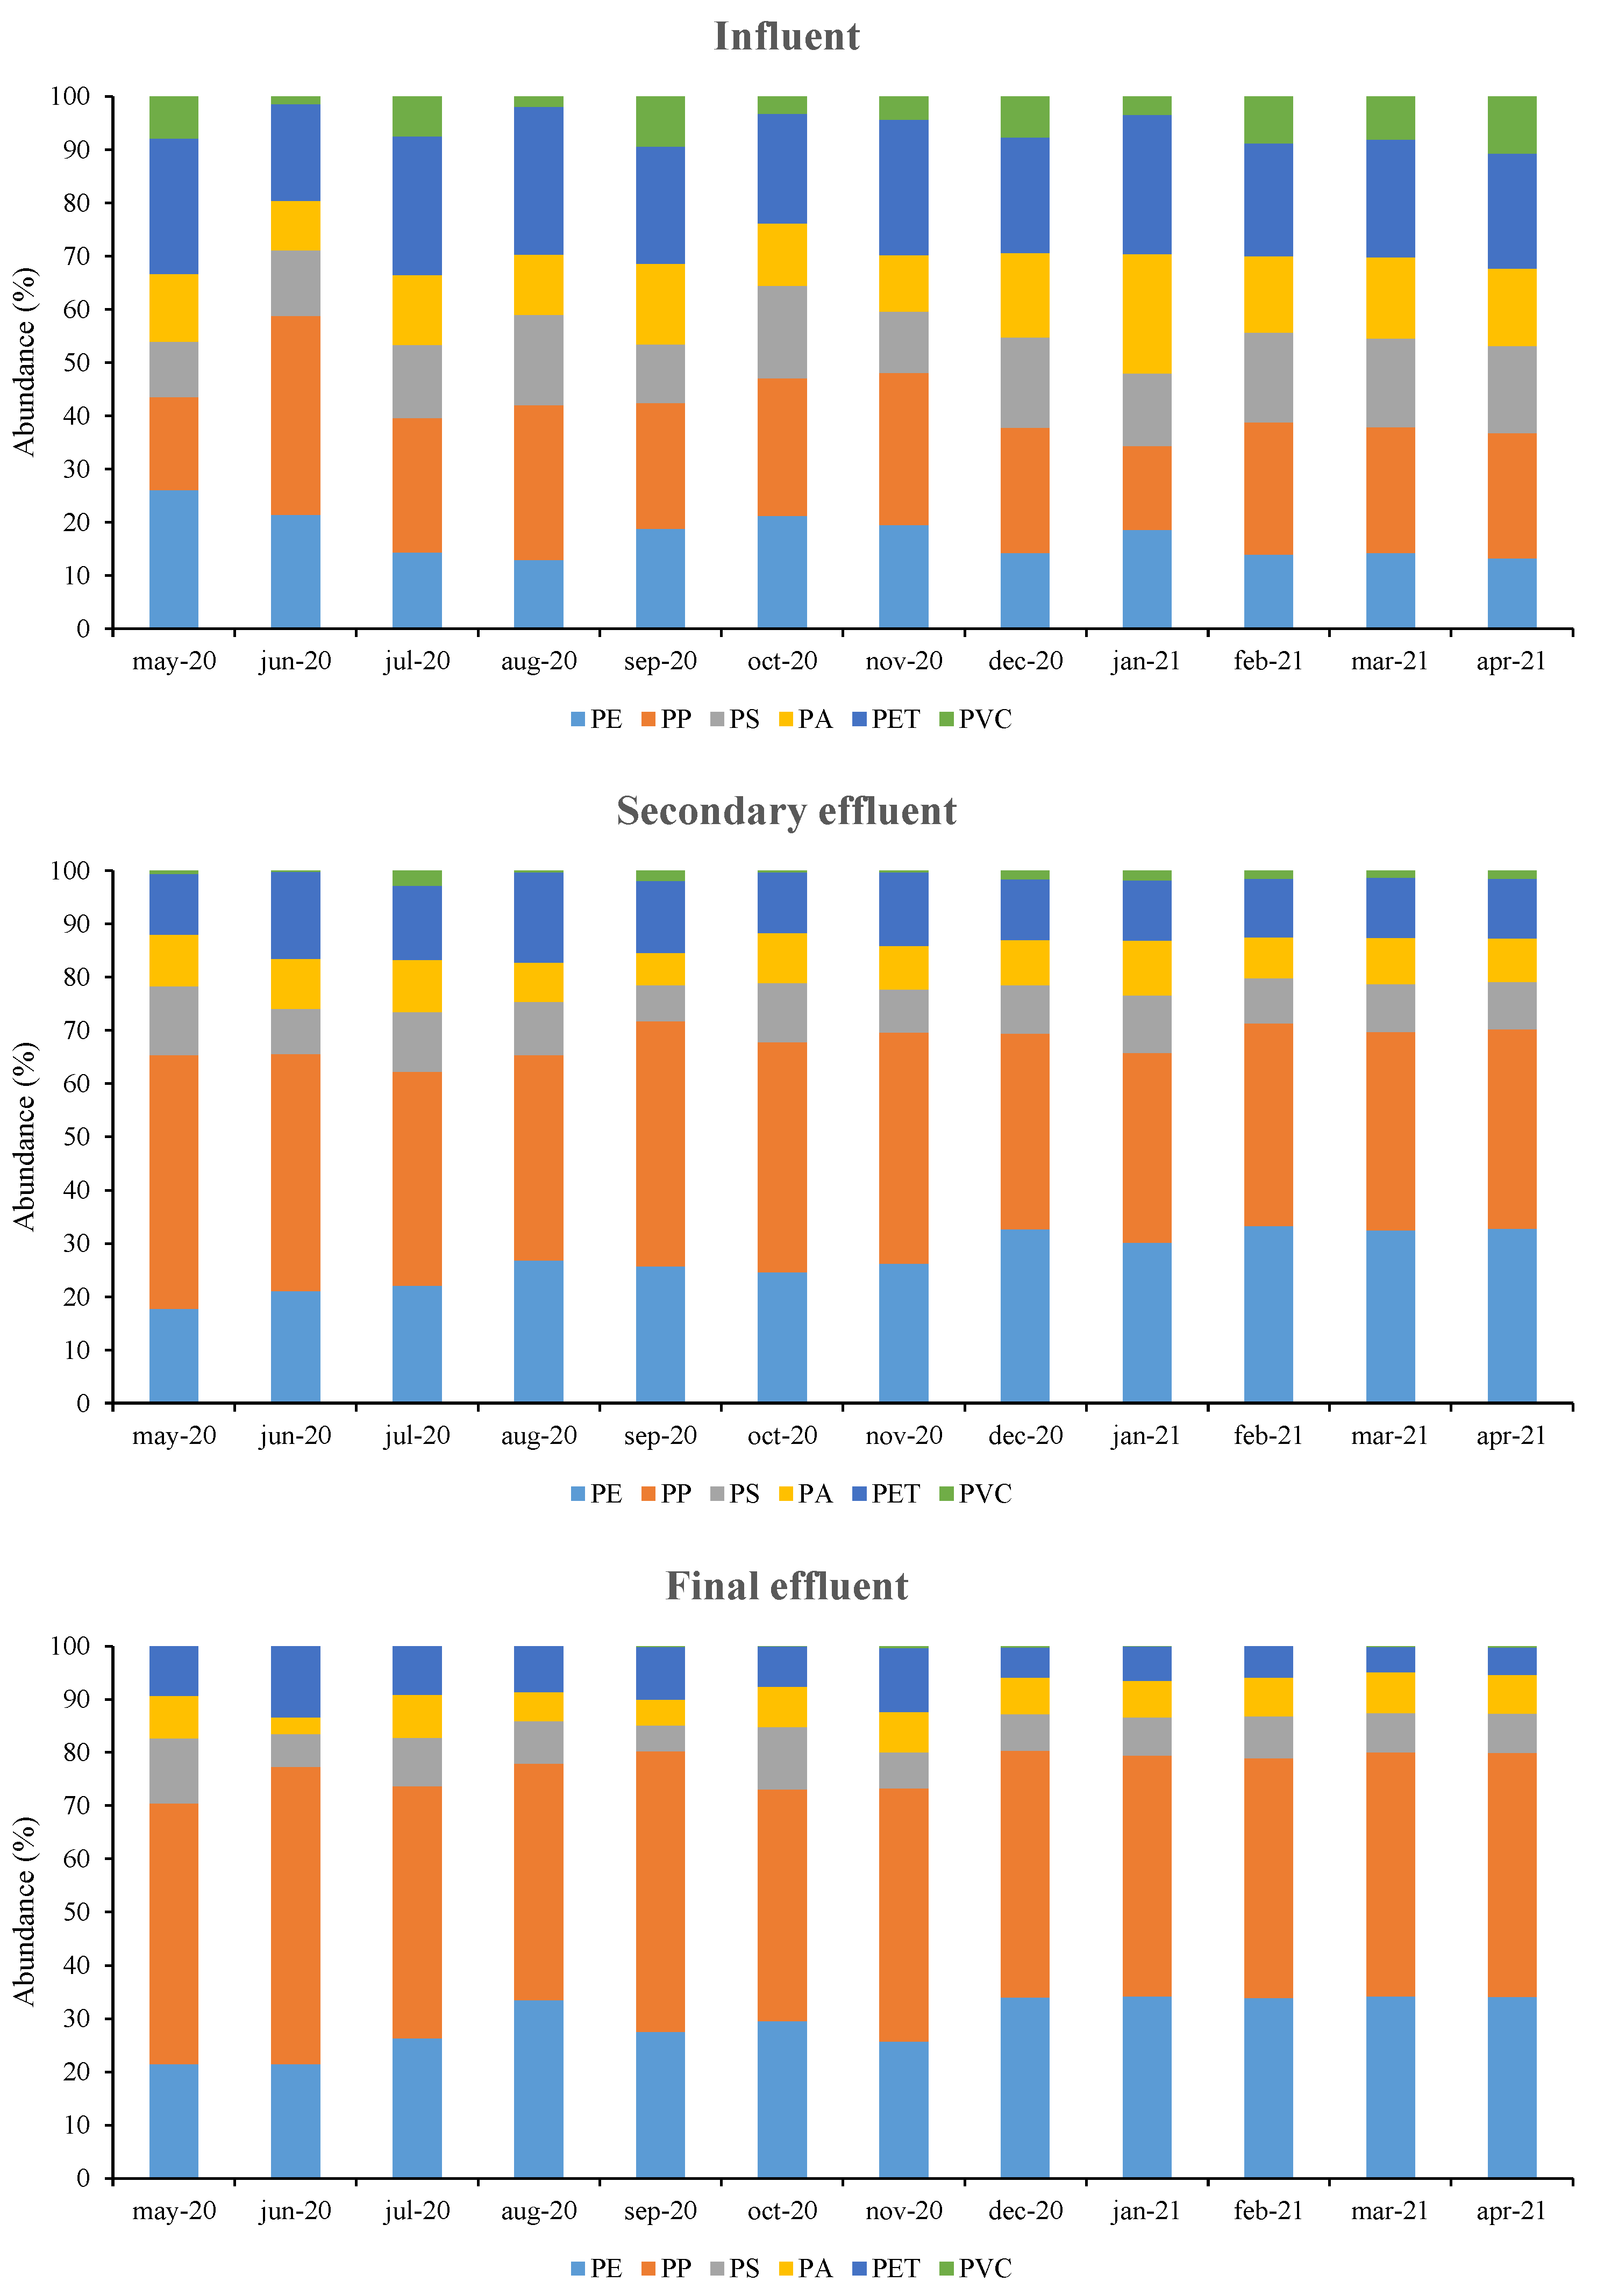
3.3. Chemical Composition of MPs

The chemical composition is a relevant characteristic that determines the MP density and therefore, directly influences over the removal efficiency. Over 30 kinds of polymers have been described in wastewater samples of different WWTPs [51]. In this study PE, PP, PS, PA, PET and polyvinyl chloride (PVC) were detected in the wastewater samples (Figure 6). In the influent, on average, PP is the polymer most frequently detected with an abundance of 24.9 ± 5.5% (ranges between 15.8–37.4%), followed by PET with 23.2 ± 2.9% (27.8–18.1%), PE with 17.3 ± 4.2% (13.0–26.0%), PS with 14.5 ± 2.7% (10.4–17.3%), PA with 3.9 ± 3.4% (9.3–22.4%) and PVC with 6.2 ± 3.1% (1.5–10.7%). Different studies reported that most frequent polymers in urban wastewaters are PS (20–90%), PE (5–60%), PP (2–40%), PET (3–38%), PA (2–35%) [2,3,75] and PVC in low abundances [61]. These data are in agreement with those found here, excepting for PS that was detected in percentages lower than values described in previous works. These variations in the abundance of different type of polymers in the influent are determined by the origin of wastewater that arrives to the WWTP (urban, industrial, agricultural) [74]. As the wastewater stream progresses through the different stages of WWTP, polymers less dense than wastewater, such as PP and PE, increased their proportion, being in the final effluent in percentages around 47.4 ± 3.6% and 29.6 ± 5.0%, respectively. On the contrary, polymers denser than wastewater, such as PS, PA, PET and PVC, decreased in abundance during the treatment processes due to their facility of settling, so they represented in the final effluent around 21%, whereas in the influent their proportion was notably higher (58%). An example of the FTIR spectra for each polymer are shown in Figure S2.
In addition, it has been analysed the relation between the chemical composition and the shape and colour of MPs during the different treatments in WWTP. Linking chemical composition with colour (Table S3), it is noticeable that, more than 90% of PVC microparticles were purple and yellow. Linking chemical composition with shape (Table S4), in the influent samples it has been found that PVC, PP, PET and PE have percentages of fragments of 98%, 77%, 74% and 67%, respectively. Moreover, 90% of the particles that corresponded to PA were fibres. Foams, pellets and films did not represent an abundance higher than 10% for any polymer.

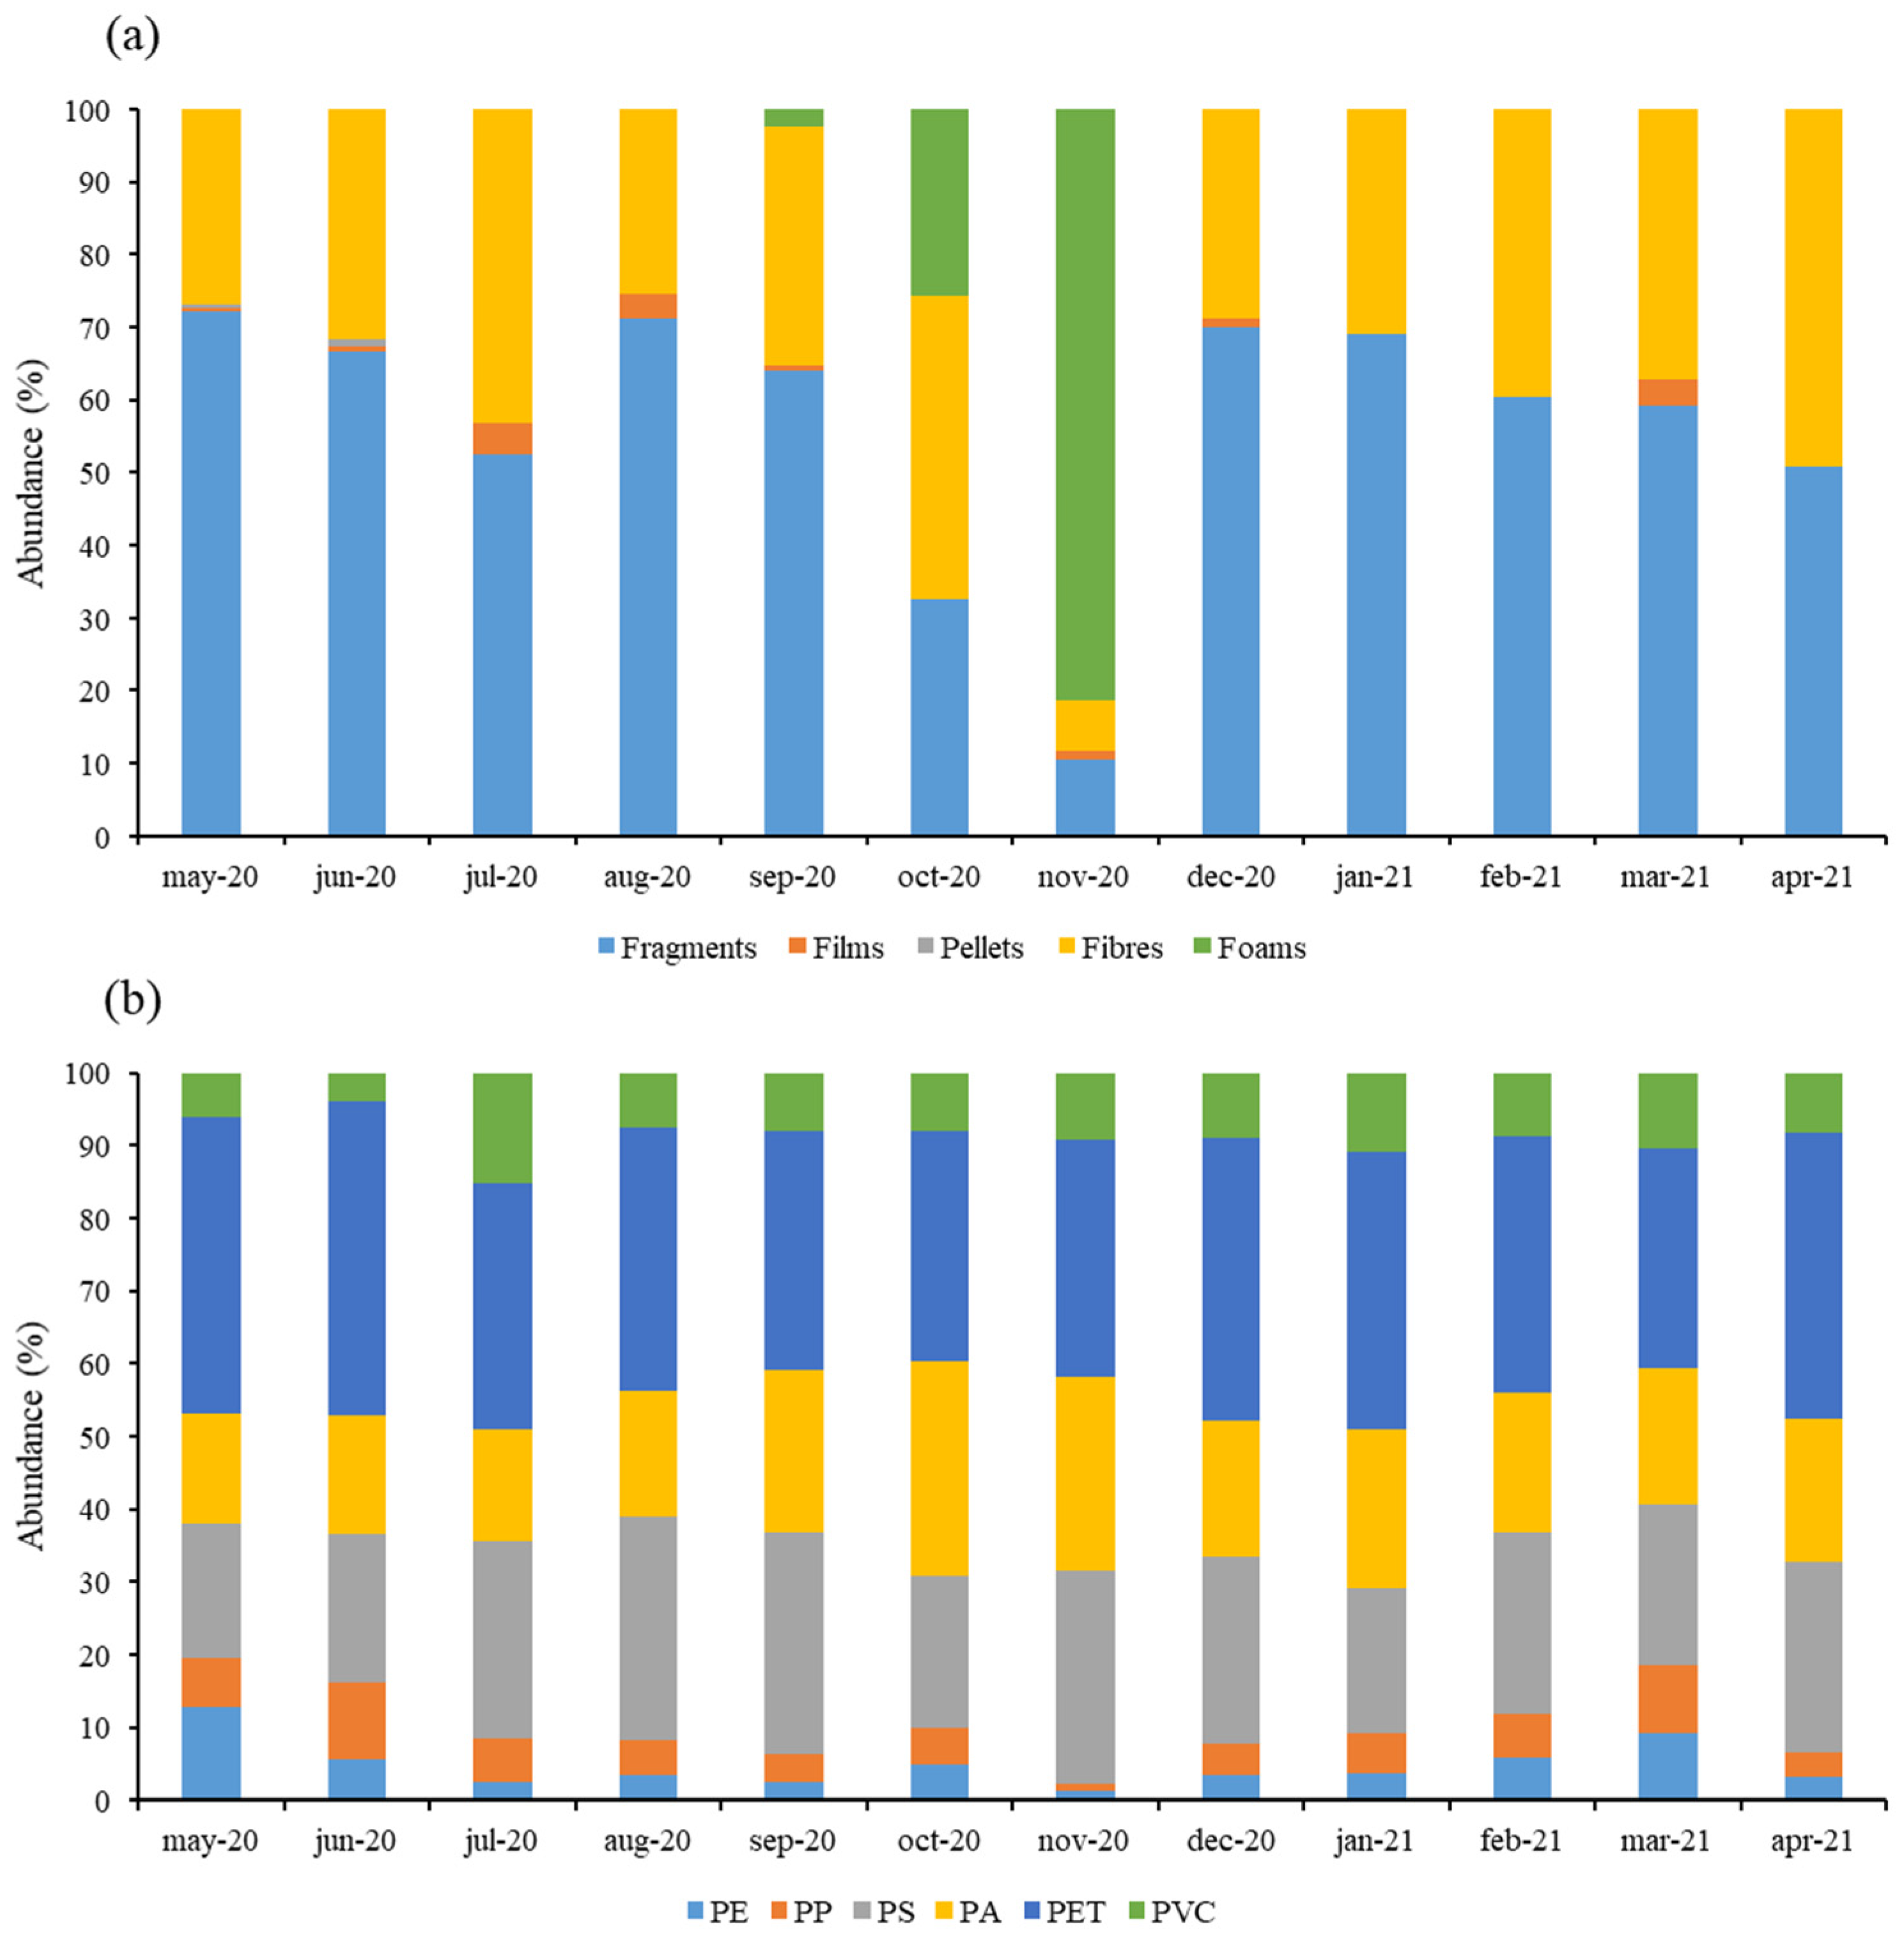
3.4. Microplastics Entrapped in Sewage Sludge

It has been found that during the warmest months (May-September) the MP concentrations in dry sludge (28–39 MPs/g) were higher than those detected the rest of the months (12–22 MPs/g) (Figure 2c). These values are expressed by dry weight considering the sludge moisture of the different samples analysed (78–86% w/w). In the sludge samples there was a mean concentration of 24.0 ± 8.6 MPs/g dry sludge, value similar to those reported in literature for urban WWTPs [31,64,67,70,72]. According to Figure 2c, it can be observed that MP percentage retained in sludge varies between 47% and 100% with a mean value of 79%. These percentages are in agreement with those reported by different authors (8–92%) [16,28,32,76]. The removal of MPs in previous stages, i.e., during pre-treatment processes, can achieve notable values of elimination, for example, Murphy et al. [44] found that 45% of MPs that arrive at WWTP can be removed in grit and grease system. These percentages have been calculated based on the number of microplastics detected in the influent and the final effluent of the WWTP taking into account the daily flow (Table S5) in each sampling point. In addition, a trend between temperature and MPs retained in sewage sludge was observed, i.e., temperatures seem to favour the entrapping of MPs.
Physical and chemical properties of MPs retained in sludge samples were also analysed and results are summarised in Figure 7. Most MPs found in sludge are fragments and fibres (57 ± 18% and 33 ± 11%, respectively). Foams represent the 9%, but it should be noted that this specific shape was only detected in three samples (September, October and November) with percentages of 2%, 26% and 81%, respectively. The majority of the published works reported a higher abundance of fibres than fragments, with higher percentages than those found here (50–84%) [16,17,28,33,40,44,70,72,76]. However, it is remarkable that other works are in accordance with the results obtained in this case study, i.e., reported a higher proportion of fragments with respect to fibres [19,34,77].
As can be seen in Figure 7, no notable differences in abundance of MPs regarding chemical composition were found. The most predominant polymers in sludge samples were PET (36 ± 4%), followed by PS (25 ± 4%), PA (20 ± 4%) and PVC (9 ± 3%), in accordance with other studies, i.e., Kazour et al. [72] reported relative abundances of PS (25%), PET (20%), PA (10%) and PVC (5%) of the same order of magnitude than those found here. This agrees with the fact that the abundances of these polymers decreased throughout the wastewater treatment processes, as above commented. The high density of these polymers favours their sedimentation, being more easily entrapped in sludge. Regarding colour, around 82% of MPs found in sludge were white and black, as occurred in the wastewater samples.

3.5. Release of MPs to the Environment

Several studies reported the environmental incidence of MPs emitted to the environment by WWTPs. As far as we know, until now, there have been seven works published that analysed the incidence of MPs in Spanish WWTPs [10,17,45,66,78,79,80]. The values found in the present work (average values of 16.1 ± 3.3 MPs/L and 1.1 ± 0.3 MPs/L in influent and effluent, respectively) were within the ranges reported by the previous works (between 2.7 MPs/L and 645 MPs/L in influent and 0.31 MPs/L and 16 MPs/L in effluent).
Considering the MP concentration detected in the influents (between 11.4 and 23.8 MPs/L) and the volume of wastewater that arrives at the WWTP (an average value between 4089 m3/day and 5570 m3/day) (Table S5), it can be estimated that between 5.57·107 and 1.27·108 microplastics enter into the facility each day. Since the removal efficiency of the studied facility is 92.9 ± 2.1%, approximately between 2.50·106 and 6.98·106 microplastics per day are emitted to the environment. For example, Edo et al. (2020) [17], who analysed a WWTP five times larger than that studied here, estimated that around 3·108 microplastics per day are release into the Henares River (Madrid), even though the WWTP reduce the MP concentration by 93%. This highlights the importance of WWTPs as source of MPs released into the environment.
In dry sludge samples, an average value of 24.0 ± 8.6 MPs/g is found, value lower than those values reported by other authors that analysed sewage sludge samples in the same country (Spain) (between 50 and 165 MPs/g) [17,22,78]. Considering that the MP concentration detected in the sludge (between 12.0 and 39.4 MPs per gram of dry sludge) and the kg of sludge generated in the WWTP (values between 1764 kg and 3976 kg) (Table S6), it can be estimated that around between and 4.23·107 and 9.54·107 microplastics are entrapped in sludge. Thus, the subsequent management of the sludge is a determinant step to avoid the release of these MPs to the environment.

4. Conclusions

In this work the annual occurrence and fate of microplastics have been evaluated in a WWTP site in Southwest Europe employed as a case study. Results showed that this WWTP has a high removal efficiency (89–95%) all along the period studied, reducing considerably the number of MPs in treated water in comparison to influent values. Specifically, most microplastics (88%) were eliminated in the secondary treatment stage, being entrapped into the sludge. It was also found that the concentration of MPs in the influent was slightly higher during the warmer months (April–September) (17.1–23.8 MPs/L) compared to the colder ones (October–March) (11.4–15.6 MPs/L). MPs more easily eliminated from the wastewater samples were those with sizes greater than 500 µm and fragments and fibres were the shapes most frequently detected in wastewater and sludge samples. In addition, it was found that PP and PE were the commonest polymers in wastewater samples, whereas in sludge samples the majority were PET, PS and PA, which is due to the fact that denser polymers tend to settle more easily during the treatment processes. Furthermore, the temperature seems to favour the retention of MP in sludge. Future works should be focus on improving the removal of MPs from wastewater and, especially, from sewage sludge in order to reduce the release of these MPs to the environment.

Supplementary Materials

The following supporting information can be downloaded at: https://www.mdpi.com/article/10.3390/app12042133/s1, Figure S1: Device employed for wastewater sampling. The photograph shows the filtration module, pressure indicator and flow meter as part of the device, Figure S2: (a) Example of FTIR spectra registered for polyethylene (PE) obtained from the analysis of a black fibre recovered from the secondary effluent sample of July; (b): Example of FTIR spectra registered for polypropylene (PP) obtained from the analysis of a white fragment recovered from influent sample of August; (c): Example of FTIR spectra registered for polystyrene (PS) obtained from the analysis of a red fibre recovered from the influent sample of September; (d): Example of FTIR spectra registered for polyamide (PA) obtained from the analysis of a white foam recovered from the secondary effluent sample of October; (e): Example of FTIR spectra registered for polyethylene terephthalate (PET) obtained from the analysis of a white fragment recovered from the final effluent sample of March; (f): Example of FTIR spectra registered for polyvinyl chloride (PVC) obtained from the analysis of a black fragment recovered from the sludge sample of October, Table S1: Volumes of wastewater (L) and amount of sludge (g) sampled during the period of the study, Table S2: Size and shape evolution of microplastics after each treatment (influent, secondary effluent and final effluent) and the overall removal efficiency of each type of microplastic, Table S3: Relationship between the colours and chemical composition found for each sampling point expressed in percentage, Table S4: Relationship between the shapes and chemical composition found for each sampling point expressed in percentage, Table S5: Summary of the concentrations of microplastics (MPs/L) in the influent, secondary treatment and final effluent during the period of study. Influent and effluent average flow values are also indicated, Table S6: Summary of the concentrations of microplastics (MPs/g) in dehydrated sludge during the period of study. Average mass flow values are also indicated.

Author Contributions

Conceptualization, A.M.-M. and D.S.; methodology, A.M.-M., R.M.-D. and D.S.; validation, A.L. (Amanda Laca), A.L. (Adriana Laca) and M.D.; formal analysis, A.M.-M., D.S. and A.L. (Amanda Laca); investigation, A.M.-M., R.M.-D. and D.S.; resources, A.M.-M., D.S., A.M.-M. and M.D.; data curation, D.S., A.L. (Amanda Laca) and A.L. (Adriana Laca); writing—original draft preparation, A.M.-M. and D.S.; writing—review and editing, A.M.-M. and D.S.; visualization, A.L. (Amanda Laca) and A.L. (Adriana Laca); supervision, A.L. (Amanda Laca), A.L. (Adriana Laca) and M.D.; project administration, M.D. and A.R.; funding acquisition, A.R. All authors have read and agreed to the published version of the manuscript.

Funding

Foundation University of Oviedo, with Project FUO-395-19, has financed this work.

Institutional Review Board Statement

Not applicable.

Informed Consent Statement

Not applicable.

Data Availability Statement

Not applicable.

Acknowledgments

Authors gratefully acknowledge the cooperation of ACCIONA Agua and ESAMUR (Regional Entity for Sanitation and Wastewater Treatment of the Region of Murcia) with wastewater samples collection, especially to the workers of the WWTP of Caravaca de la Cruz.

Conflicts of Interest

The authors declare no conflict of interest.

Abbreviations

CASConventional activated sludge
DMDynamic membranes
MBRMembrane bioreactor
MPMicroplastic
PAPolyamide
PEPolyethylene
PETPolyethylene terephthalate
PPPolypropylene
PSPolystyrene
PVCPolyvinyl chloride
RSFRapid sand filtration
SBRSequencing batch reactor
WWTPWastewater treatment plant

References and Note

  1. Masiá, P.; Sol, D.; Ardura, A.; Laca, A.; Borrell, Y.J.; Dopico, E.; Laca, A.; Machado-Schiaffino, G.; Díaz, M.; Garcia-Vazquez, E. Bioremediation as a promising strategy to microplastics removal in wastewater treatment plants. Mar. Pollut. Bull. 2020, 156, 111252. [Google Scholar] [CrossRef] [PubMed]
  2. Ngo, P.L.; Pramanik, B.K.; Shah, K.; Roychand, R. Pathway, classification and removal efficiency of microplastics in wastewater treatment plants. Environ. Pollut. 2019, 255, 113326. [Google Scholar] [CrossRef]
  3. Sol, D.; Laca, A.; Laca, A.; Díaz, M. Approaching the environmental problem of microplastics: Importance of WWTP treatments. Sci. Total Environ. 2020, 740, 140016. [Google Scholar] [CrossRef] [PubMed]
  4. Boucher, J.; Friot, D. Primary Microplastic in the Oceans: A Global Evaluation of Sources; IUCN: Gland, Switzerland, 2017; 43p. [Google Scholar] [CrossRef]
  5. De Falco, F.; Di Pace, E.; Cocca, M.; Avella, M. The contribution of washing processes of synthetic clothes to microplastic pollution. Sci. Rep. 2019, 9, 6633. [Google Scholar] [CrossRef] [PubMed]
  6. De Falco, F.; Cocca, M.; Avella, M.; Thompson, R.C. Microfiber Release to Water, via Laundering, and to Air, via Everyday Use: A Comparison between Polyester Clothing with Differing Textile Parameters. Environ. Sci. Technol. 2020, 54, 3288–3296. [Google Scholar] [CrossRef]
  7. Liu, X.; Yuan, W.; Di, M.; Li, Z.; Wang, J. Transfer and fate of microplastics during the conventional activated sludge process in one wastewater treatment plant of China. Chem. Eng. J. 2019, 362, 176–182. [Google Scholar] [CrossRef]
  8. Rochman, C.M. Microplastics research—From sink to source. Science 2018, 360, 28–29. [Google Scholar] [CrossRef]
  9. Ziajahromi, S.; Neale, P.A.; Leusch, F.D.L. Wastewater treatment plant effluent as a source of microplastics: Review of the fate, chemical interactions and potential risks to aquatic organisms. Water Sci. Technol. 2016, 74, 2253–2269. [Google Scholar] [CrossRef]
  10. Bayo, J.; Olmos, S.; López-Castellanos, J. Microplastics in an urban wastewater treatment plant: The influence of physicochemical parameters and environmental factors. Chemosphere 2020, 238, 124593. [Google Scholar] [CrossRef]
  11. Chen, G.; Feng, Q.; Wang, J. Mini-review of microplastics in the atmosphere and their risks to humans. Sci. Total Environ. 2020, 703, 135504. [Google Scholar] [CrossRef]
  12. Prata, J.C. Airborne microplastics: Consequences to human health? Environ. Pollut. 2018, 234, 115–126. [Google Scholar] [CrossRef] [PubMed]
  13. Liu, W.; Zhang, J.; Liu, H.; Guo, X.; Zhang, X.; Yao, X.; Cao, Z.; Zhang, T. A review of the removal of microplastics in global wastewater treatment plants: Characteristics and mechanisms. Environ. Int. 2021, 146, 106277. [Google Scholar] [CrossRef] [PubMed]
  14. Habib, R.Z.; Thiemann, T.; Al Kendi, R. Microplastics and Wastewater Treatment Plants—A Review. J. Water Resour. Prot. 2020, 12, 1–35. [Google Scholar] [CrossRef] [Green Version]
  15. Sol, D.; Laca, A.; Laca, A.; Díaz, M. Microplastics in Wastewater and Drinking Water Treatment Plants: Occurrence and Removal of Microfibres. Appl. Sci. 2021, 11, 10109. [Google Scholar] [CrossRef]
  16. Gies, E.A.; LeNoble, J.L.; Noel, M.; Etemadifar, A.; Bishay, F.; Hall, E.R.; Ross, P.S. Retention of microplastic in a major secondary wastewater treatment plant in Vancouver, Canada. Mar. Pollut. Bull. 2018, 133, 553–561. [Google Scholar] [CrossRef]
  17. Edo, C.; González-Pleiter, M.; Leganés, F.; Fernández-Piñas, F.; Rosal, R. Fate of microplastics in wastewater treatment plants and their environmental dispersion with effluent and sludge. Environ. Pollut. 2020, 259, 113837. [Google Scholar] [CrossRef]
  18. Lares, M.; Ncibi, M.C.; Sillanpää, M. Occurrence, identification and removal of microplastic particles and fibers in conventional activated sludge process and advanced MBR technology. Water Res. 2018, 133, 236–246. [Google Scholar] [CrossRef]
  19. Magni, S.; Binelli, A.; Pittura, L.; Avio, C.G.; Della Torre, C.; Parenti, C.C.; Gorbi, S.; Regoli, F. The fate of microplastics in an Italian Wastewater Treatment Plant. Sci. Total Environ. 2019, 652, 602–610. [Google Scholar] [CrossRef]
  20. Mahon, A.M.; O’Connell, B.; Healy, M.G.; O’Connor, I.; Officer, R.; Nash, R.; Morrison, L. Microplastics in Sewage Sludge: Effects of Treatment. Environ. Sci. Technol. 2017, 51, 810–818. [Google Scholar] [CrossRef]
  21. Rolsky, C.; Kelkar, V.; Driver, E.; Halden, R.U. Municipal sewage sludge as a source of microplastics in the environment. Curr. Opin. Environ. Sci. Health 2020, 14, 16–22. [Google Scholar] [CrossRef]
  22. van den Berg, P.; Huerta-Lwanga, E.; Corradini, F.; Geissen, V. Sewage sludge application as a vehicle for microplastics in eastern Spanish agricultural soils. Environ. Pollut. 2020, 261, 114198. [Google Scholar] [CrossRef] [PubMed]
  23. Auta, H.S.; Emenike, C.U.; Fauziah, S.H. Distribution and importance of microplastics in the marine environment: A review of the sources, fate, effects, and potential solutions. Environ. Int. 2017, 102, 165–176. [Google Scholar] [CrossRef]
  24. Lu, L.; Luo, T.; Zhao, Y.; Cai, C.; Fu, Z.; Jin, Y. Interaction between microplastics and microorganism as well as gut microbiota: A consideration on environmental animal and human health. Sci. Total Environ. 2019, 667, 94–100. [Google Scholar] [CrossRef]
  25. Wang, W.; Ge, J.; Yu, X. Bioavailability and toxicity of microplastics to fish species: A review. Ecotoxicol. Environ. Saf. 2019, 189, 109913. [Google Scholar] [CrossRef] [PubMed]
  26. Xu, S.; Ma, J.; Ji, R.; Pan, K.; Miao, A.J. Microplastics in aquatic environments: Occurrence, accumulation, and biological effects. Sci. Total Environ. 2020, 703, 134699. [Google Scholar] [CrossRef] [PubMed]
  27. Li, L.; Xu, G.; Yu, H.; Xing, J. Dynamic membrane for micro-particle removal in wastewater treatment: Performance and influencing factors. Sci. Total Environ. 2018, 627, 332–340. [Google Scholar] [CrossRef]
  28. Lv, X.; Dong, Q.; Zuo, Z.; Liu, Y.; Huang, X.; Wu, W.M. Microplastics in a municipal wastewater treatment plant: Fate, dynamic distribution, removal efficiencies, and control strategies. J. Clean. Prod. 2019, 225, 579–586. [Google Scholar] [CrossRef]
  29. Michielssen, M.R.; Michielssen, E.R.; Ni, J.; Duhaime, M.B. Fate of microplastics and other small anthropogenic litter (SAL) in wastewater treatment plants depends on unit processes employed. Environ. Sci. Water Res. Technol. 2016, 2, 1064–1073. [Google Scholar] [CrossRef] [Green Version]
  30. Talvitie, J.; Mikola, A.; Koistinen, A.; Setälä, O. Solutions to microplastic pollution–removal of microplastics from wastewater effluent with advanced wastewater treatment technologies. Water Res. 2017, 123, 401–407. [Google Scholar] [CrossRef] [Green Version]
  31. Lee, H.; Kim, Y. Treatment characteristics of microplastics at biological sewage treatment facilities in Korea. Mar. Pollut. Bull. 2018, 137, 1–8. [Google Scholar] [CrossRef]
  32. Jiang, J.; Wang, X.; Ren, H.; Cao, G.; Xie, G.; Xing, D.; Liu, B. Investigation and fate of microplastics in wastewater and sludge filter cake from a wastewater treatment plant in China. Sci. Total Environ. 2020, 746, 141378. [Google Scholar] [CrossRef] [PubMed]
  33. Naji, A.; Azadkhah, S.; Farahani, H.; Uddin, S.; Khan, F.R. Microplastics in wastewater outlets of Bandar Abbas city (Iran): A potential point source of microplastics into the Persian Gulf. Chemosphere 2021, 262, 128039. [Google Scholar] [CrossRef] [PubMed]
  34. Pittura, L.; Foglia, A.; Akyol, Ç.; Cipolletta, G.; Benedetti, M.; Regoli, F.; Fatone, F. Microplastics in real wastewater treatment schemes: Comparative assessment and relevant inhibition effects on anaerobic processes. Chemosphere 2021, 262, 128415. [Google Scholar] [CrossRef]
  35. Elkhatib, D.; Oyanedel-Craver, V. A critical review of extraction and identification methods of microplastics in wastewater and drinking water. Environ. Sci. Technol. 2020, 54, 7037–7049. [Google Scholar] [CrossRef]
  36. Jung, M.R.; Horgen, F.D.; Orski, S.V.; Rodriguez, C.V.; Beers, K.L.; Balazs, G.H.; Jones, T.; Work, T.M.; Brignac, K.C.; Royer, S.J.; et al. Validation of ATR FT-IR to identify polymers of plastic marine debris, including those ingested by marine organisms. Mar. Pollut. Bull. 2018, 127, 704–716. [Google Scholar] [CrossRef]
  37. Lin, L.; Zuo, L.Z.; Peng, J.P.; Cai, L.Q.; Fok, L.; Yan, Y.; Li, H.X.; Xu, X.R. Occurrence and distribution of microplastics in an urban river: A case study in the Pearl River along Guangzhou City, China. Sci. Total Environ. 2018, 644, 375–381. [Google Scholar] [CrossRef] [PubMed]
  38. State Meteorological Agency. Territorial Meteorological Centre of Murcia.
  39. Long, Z.; Pan, Z.; Wang, W.; Ren, J.; Yu, X.; Lin, L.; Lin, H.; Chen, H.; Jin, X. Microplastic abundance, characteristics, and removal in wastewater treatment plants in a coastal city of China. Water Res. 2019, 155, 255–265. [Google Scholar] [CrossRef]
  40. Ren, P.; Dou, M.; Wang, C.; Li, G.; Jia, R. Abundance and removal characteristics of microplastics at a wastewater treatment plant in Zhengzhou. Environ. Sci. Pollut. Res. 2020, 27, 36295–36305. [Google Scholar] [CrossRef]
  41. Yang, L.; Li, K.; Cui, S.; Kang, Y.; An, L.; Lei, K. Removal of microplastics in municipal sewage from China’s largest water reclamation plant. Water Res. 2019, 155, 175–181. [Google Scholar] [CrossRef]
  42. Hongprasith, N.; Kittimethawong, C.; Lertluksanaporn, R.; Eamchotchawalit, T.; Kittipongvises, S.; Lohwacharin, J. IR microspectroscopic identification of microplastics in municipal wastewater treatment plants. Environ. Sci. Pollut. Res. 2020, 27, 18557–18564. [Google Scholar] [CrossRef]
  43. Magnusson, K.; Norén, F. Screening of Microplastic Particles in and Down-Stream a Wastewater Treatment Plant; C 55; IVL Swedish Environmental Research Institute: Stockholm, Sweden, 2014. [Google Scholar]
  44. Murphy, F.; Ewins, C.; Carbonnier, F.; Quinn, B. Wastewater treatment works (WwTW) as a source of microplastics in the aquatic environment. Environ. Sci. Technol. 2016, 50, 5800–5808. [Google Scholar] [CrossRef] [PubMed] [Green Version]
  45. Franco, A.A.; Arellano, J.M.; Albendín, G.; Rodríguez-Barroso, R.; Zahedi, S.; Quiroga, J.M.; Coello, M.D. Mapping microplastics in Cadiz (Spain): Occurrence of microplastics in municipal and industrial wastewaters. J. Water Process. Eng. 2020, 38, 101596. [Google Scholar] [CrossRef]
  46. Cao, Y.; Wang, Q.; Ruan, Y.; Wu, R.; Chen, L.; Zhang, K.; Lam, P.K.S. Intra-day microplastic variations in wastewater: A case study of a sewage treatment plant in Hong Kong. Mar. Pollut. Bull. 2020, 160, 111535. [Google Scholar] [CrossRef]
  47. Alavian Petroody, S.S.; Hashemi, S.H.; van Gestel, C.A.M. Factors affecting microplastic retention and emission by a wastewater treatment plant on the southern coast of Caspian Sea. Chemosphere 2020, 261, 128179. [Google Scholar] [CrossRef]
  48. Ben-David, E.A.; Habibi, M.; Haddad, E.; Hasanin, M.; Angel, D.L.; Broth, A.M.; Sabbah, I. Microplastic distributions in a domestic wastewater treatment plant: Removal efficiency, seasonal variation and influence of sampling technique. Sci. Total Environ. 2021, 752, 141880. [Google Scholar] [CrossRef]
  49. Hidayaturrahman, H.; Lee, T.G. A study on characteristics of microplastic in wastewater of South Korea: Identification, quantification, and fate of microplastics during treatment process. Mar. Pollut. Bull. 2019, 146, 696–702. [Google Scholar] [CrossRef] [PubMed]
  50. Ruan, Y.; Zhang, K.; Wu, C.; Wu, R.; Lam, P.K. A preliminary screening of HBCD enantiomers transported by microplastics in wastewater treatment plants. Sci. Total Environ. 2019, 674, 171–178. [Google Scholar] [CrossRef]
  51. Sun, J.; Dai, X.; Wang, Q.; van Loosdrecht, M.C.; Ni, B.J. Microplastics in wastewater treatment plants: Detection, occurrence and removal. Water Res. 2019, 152, 21–37. [Google Scholar] [CrossRef] [PubMed]
  52. Ziajahromi, S.; Neale, P.A.; Rintoul, L.; Leusch, F.D. Wastewater treatment plants as a pathway for microplastics: Development of a new approach to sample wastewater-based microplastics. Water Res. 2017, 112, 93–99. [Google Scholar] [CrossRef]
  53. Jiang, F.; Wang, M.; Ding, J.; Cao, W.; Sun, C. Occurrence and Seasonal Variation of Microplastics in the Effluent from Wastewater Treatment Plants in Qingdao, China. J. Mar. Sci. Eng. 2022, 10, 58. [Google Scholar] [CrossRef]
  54. Shen, M.; Song, B.; Zhu, Y.; Zeng, G.; Zhang, Y.; Yang, Y.; Yi, H. Removal of microplastics via drinking water treatment: Current knowledge and future directions. Chemosphere 2020, 251, 126612. [Google Scholar] [CrossRef]
  55. Novotna, K.; Cermakova, L.; Pivokonska, L.; Cajthaml, T.; Pivokonsky, M. Microplastics in drinking water treatment—Current knowledge and research needs. Sci. Total Environ. 2019, 667, 730–740. [Google Scholar] [CrossRef] [PubMed]
  56. Wolff, S.; Weber, F.; Kerpen, J.; Winklhofer, M.; Engelhart, M.; Barkmann, L. Elimination of Microplastics by Downstream Sand Filters in Wastewater Treatment. Water 2021, 13, 33. [Google Scholar] [CrossRef]
  57. Mason, S.A.; Garneau, D.; Sutton, R.; Chu, Y.; Ehmann, K.; Barnes, J.; Rogers, D.L. Microplastic pollution is widely detected in US municipal wastewater treatment plant effluent. Environ. Pollut. 2016, 218, 1045–1054. [Google Scholar] [CrossRef]
  58. Takdastan, A.; Niari, M.H.; Babei, A.; Dobaradaran, S.; Jorfi, S.; Ahmadi, M. Occurrence and distribution of microplastic particles and the concentration of Di 2-ethyl hexyl phthalate (DEHP) in microplastics and wastewater in the wastewater treatment plant. J. Environ. Manag. 2021, 280, 111851. [Google Scholar] [CrossRef] [PubMed]
  59. Yang, Z.; Li, S.; Ma, S.; Liu, P.; Peng, D.; Ouyang, Z.; Guo, X. Characteristics and removal efficiency of microplastics in sewage treatment plant of Xi’an City, northwest China. Sci. Total Environ. 2021, 771, 145377. [Google Scholar] [CrossRef]
  60. Yuan, F.; Zhao, H.; Sun, H.; Zhao, J.; Sun, Y. Abundance, morphology, and removal efficiency of microplastics in two wastewater treatment plants in Nanjing, China. Environ. Sci. Pollut. Res. 2021, 28, 9327–9337. [Google Scholar] [CrossRef]
  61. Wang, F.; Wang, B.; Duan, L.; Zhang, Y.; Zhou, Y.; Sui, Q.; Yu, G. Occurrence and distribution of microplastics in domestic, industrial, agricultural and aquacultural wastewater sources: A case study in Changzhou, China. Water Res. 2020, 182, 115956. [Google Scholar] [CrossRef]
  62. Dris, R.; Gasperi, J.; Rocher, V.; Saad, M.; Renault, N.; Tassin, B. Microplastic contamination in an urban area: A case study in Greater Paris. Environ. Chem. 2015, 12, 592–599. [Google Scholar] [CrossRef]
  63. Gündoğdu, S.; Çevik, C.; Güzel, E.; Kilercioğlu, S. Microplastics in municipal wastewater treatment plants in Turkey: A comparison of the influent and secondary effluent concentrations. Environ. Monit. Assess. 2018, 190, 626. [Google Scholar] [CrossRef]
  64. Mintenig, S.M.; Int-Veen, I.; Löder, M.G.; Primpke, S.; Gerdts, G. Identification of microplastic in effluents of waste water treatment plants using focal plane array-based micro-Fourier-transform infrared imaging. Water Res. 2017, 108, 365–372. [Google Scholar] [CrossRef] [PubMed]
  65. Simon, M.; van Alst, N.; Vollertsen, J. Quantification of microplastic mass and removal rates at wastewater treatment plants applying Focal Plane Array (FPA)-based Fourier Transform Infrared (FT-IR) imaging. Water Res. 2018, 142, 1–9. [Google Scholar] [CrossRef] [PubMed]
  66. Franco, A.A.; Arellano, J.M.; Albendín, G.; Rodríguez-Barroso, R.; Coello, M.D. Microplastic pollution in wastewater treatment plants in the city of Cadiz: Abundance, removal efficiency and presence in receiving water body. Sci. Total Environ. 2021, 776, 145795. [Google Scholar] [CrossRef]
  67. Xu, X.; Zhang, L.; Jian, Y.; Xue, Y.; Gao, Y.; Peng, M.; Jiang, S.; Zhang, Q. Influence of wastewater treatment process on pollution characteristics and fate of microplastics. Mar. Pollut. Bull. 2021, 169, 112448. [Google Scholar] [CrossRef]
  68. Ariza-Tarazona, M.C.; Villarreal-Chiu, J.F.; Hernández-López, J.M.; De la Rosa, J.R.; Barbieri, V.; Siligardi, C.; Cedillo-González, E.I. Microplastic pollution reduction by a carbon and nitrogen-doped TiO2: Effect of pH and temperature in the photocatalytic degradation process. J. Hazard. Mater. 2020, 395, 122632. [Google Scholar] [CrossRef]
  69. Talvitie, J.; Heinonen, M.; Pääkkönen, J.P.; Vahtera, E.; Mikola, A.; Setälä, O.; Vahala, R. Do wastewater treatment plants act as a potential point source of microplastics? Preliminary study in the coastal Gulf of Finland, Baltic Sea. Water Sci. Technol. 2015, 72, 1495–1504. [Google Scholar] [CrossRef]
  70. Tang, N.; Liu, X.; Xing, W. Microplastics in wastewater treatment plants of Wuhan, Central China: Abundance, removal, and potential source in household wastewater. Sci. Total Environ. 2020, 745, 141026. [Google Scholar] [CrossRef]
  71. Xu, X.; Jian, Y.; Xue, Y.; Hou, Q.; Wang, L. Microplastics in the wastewater treatment plants (WWTPs): Occurrence and removal. Chemosphere 2019, 235, 1089–1096. [Google Scholar] [CrossRef]
  72. Kazour, M.; Terki, S.; Rabhi, K.; Jemaa, S.; Khalaf, G.; Amara, R. Sources of microplastics pollution in the marine environment: Importance of wastewater treatment plant and coastal landfill. Mar. Pollut. Bull. 2019, 146, 608–618. [Google Scholar] [CrossRef]
  73. Park, H.J.; Oh, M.J.; Kim, P.G.; Kim, G.; Jeong, D.H.; Ju, B.K.; Lee, W.S.; Chung, H.M.; Kang, H.J.; Kwon, J.H. National Reconnaissance Survey of Microplastics in Municipal Wastewater Treatments Plants in Korea. Environ. Sci. Technol. 2020, 54, 1503–1512. [Google Scholar] [CrossRef]
  74. Conley, K.; Clum, A.; Deepe, J.; Lane, H.; Beckingham, B. Wastewater treatment plants as a source of microplastics to an urban estuary: Removal efficiencies and loading per capita over one year. Water Res. 2019, 3, 100030. [Google Scholar] [CrossRef] [PubMed]
  75. Ali, I.; Ding, T.; Peng, C.; Naz, I.; Sun, H.; Li, J.; Liu, J. Micro- and nanoplastics in wastewater treatment plants: Occurrence, removal, fate impacts and remediation technologies—A critical review. Chem. Eng. J. 2021, 423, 130205. [Google Scholar] [CrossRef]
  76. Ziajahromi, S.; Neale, P.A.; Silveira, I.T.; Chua, A.; Leusch, F.D.L. An audit of microplastic abundance throughout three Australian wastewater treatment plants. Chemosphere 2021, 263, 128294. [Google Scholar] [CrossRef] [PubMed]
  77. Zhang, L.; Liu, J.; Xie, Y.; Zhong, S.; Gao, P. Occurrence and removal of microplastics from wastewater treatment plants in a typical tourist city in China. J. Clean. Prod. 2021, 291, 125968. [Google Scholar] [CrossRef]
  78. Alvim, C.B.; Bes-Piá, M.A.; Mendoza-Roca, J.A. Separation and identification of microplastics from primary and secondary effluents and activated sludge from wastewater treatment plants. Chem. Eng. J. 2020, 402, 126293. [Google Scholar] [CrossRef]
  79. Bayo, J.; López-Castellanos, J.; Olmos, S. Membrane bioreactor and rapid sand filtration for the removal of microplastics in an urban wastewater treatment plant. Mar. Pollut. Bull. 2020, 156, 111211. [Google Scholar] [CrossRef]
  80. Bayo, J.; Olmos, S.; López-Castellanos, J. Assessment of Microplastics in a Municipal Wastewater Treatment Plant with Tertiary Treatment: Removal Efficiencies and Loading per Day into the Environment. Water 2021, 13, 1339. [Google Scholar] [CrossRef]
Figure 1. Scheme of WWTP analysed in this work (asterisks indicate sampling points).
Applsci 12 02133 g001
Figure 3. Size variation of microplastics in influent, secondary effluent, and final effluent samples during the period studied.
Applsci 12 02133 g003
Figure 4. Examples of some microplastic particles found in this work and classified by shape and colour. (1): Green and yellow fibres, (2,3): Yellow and transparent fragments, (4): Grey film, (5): Black pellet, (6): Transparent foam.
Applsci 12 02133 g004
Figure 5. Shape variation of microplastics in influent, secondary effluent and final effluent samples during the period studied.
Applsci 12 02133 g005
Figure 6. Composition variation of microplastics in influent, secondary effluent and final effluent samples during the period studied.
Applsci 12 02133 g006
Figure 7. Abundance of microplastics in sludge samples according to (a) the shape and (b) chemical composition.
Applsci 12 02133 g007
Publisher’s Note: MDPI stays neutral with regard to jurisdictional claims in published maps and institutional affiliations.

