Article

Driver Drowsiness Detection by Applying Deep Learning Techniques to Sequences of Images

Computer Science and Engineering Department, Universidad Carlos III de Madrid, 28911 Leganés, Spain
*
Author to whom correspondence should be addressed.
Appl. Sci. 2022, 12(3), 1145; https://doi.org/10.3390/app12031145
Submission received: 2 December 2021 / Revised: 7 January 2022 / Accepted: 19 January 2022 / Published: 22 January 2022
(This article belongs to the Special Issue Application of Artificial Intelligence, Deep Neural Networks)

Abstract

:
This work presents the development of an ADAS (advanced driving assistance system) focused on driver drowsiness detection, whose objective is to alert drivers of their drowsy state to avoid road traffic accidents. In a driving environment, it is necessary that fatigue detection is performed in a non-intrusive way, and that the driver is not bothered with alarms when he or she is not drowsy. Our approach to this open problem uses sequences of images that are 60 s long and are recorded in such a way that the subject’s face is visible. To detect whether the driver shows symptoms of drowsiness or not, two alternative solutions are developed, focusing on the minimization of false positives. The first alternative uses a recurrent and convolutional neural network, while the second one uses deep learning techniques to extract numeric features from images, which are introduced into a fuzzy logic-based system afterwards. The accuracy obtained by both systems is similar: around 65% accuracy over training data, and 60% accuracy on test data. However, the fuzzy logic-based system stands out because it avoids raising false alarms and reaches a specificity (proportion of videos in which the driver is not drowsy that are correctly classified) of 93%. Although the obtained results do not achieve very satisfactory rates, the proposals presented in this work are promising and can be considered a solid baseline for future works.

1. Introduction

Drowsiness, defined as the state of sleepiness when one needs to rest, can cause symptoms that have great impact over the performance of tasks: slowed response time, intermittent lack of awareness, or microsleeps (blinks with a duration of over 500 ms), to name a few examples [1]. In fact, continuous fatigue can cause levels of performance impairment similar to those caused by alcohol [2,3]. While driving, these symptoms are extremely dangerous since they significantly increase the probabilities of drivers missing road signs or exits, drifting into other lanes or even crashing their vehicle, causing an accident [4].
For this work, our premise is the following: a camera mounted on a vehicle will record frontal images of the driver, which will be analyzed by using artificial intelligence (AI) techniques, such as deep learning, to detect whether the driver is drowsy or not. By using that information, the system will be able to alert the driver and prevent accidents. Given that the ADAS will have different functionalities integrated, one of the restrictions imposed to the module presented in this work will be to avoid the activation of false alarms that may distract the driver and cause him or her to turn off the ADAS.
Thus, the main novelty of this work is the use of a non-intrusive system that is capable of detecting fatigue from sequences of images, which at the moment is an open problem. In most of the available works, the experimental methodology consists of extracting and classifying individual frames from each video and verifying whether the classification is correct or not, but that approach does not consider the intrinsic relationship between consecutive images, and their measures of false positives are less reliable. Currently, there are few works that test the systems on complete videos and count the number of alarms emitted during each video (which is necessary when evaluating the number of false alarms raised during a period of time). Therefore, the proposals presented in this paper can be considered a starting point for the design of such systems.
Deep learning algorithms are characterized by the use of neural networks whose models are built of massive amounts of layers [5], and they have the ability to automatize the feature extraction process [6]. Among deep learning algorithms, there is a specific type of deep neural networks (DNNs) called convolutional neural networks (CNNs), which have great performance on computer vision because they are able to find patterns and recognize characteristics among images [7].
An important concept related to CNNs is transfer learning [8]. This technique consists of using a model that was previously trained to solve a different problem on a similar domain (e.g., detecting dogs in images), and use it to solve a new problem (e.g., detecting cats). The idea is to create a new CNN in which the first layers correspond to the lower layers of the pre-trained model and the upper layers are new layers adapted and trained to solve the new proposed problem. In this way, the knowledge acquired by the pre-trained model serves as a starting point for the new model. This technique is especially useful to generate accurate models with a small amount of data, where it would not be feasible to train a model from scratch, and, on the other hand, it is useful to reach high accuracy with few training epochs.
In this context, we propose two different solutions to approach the fatigue detection problem:
  • The first one is focused on using deep learning to analyze a sequence of images of the driver.
  • The second one uses a combination of AI and deep learning techniques to extract the important features from the image and, after that, the obtained data are introduced on a fuzzy inference system that evaluates whether the driver is drowsy or not.
The implementation of the first proposed solution consists of a combination of a CNN and a recurrent neural network (RNN), which is a type of neural network that is specialized in feature extraction from sequences of data (e.g., using the weather information of the last 7 days to predict tomorrow’s weather). This way, the CNN architecture will recognize patterns on the images and, by introducing it on a RNN structure, the model will be able to identify patterns among the sequence of images, thus predicting whether the driver is tired or not.
The second alternative, however, uses a combination of artificial intelligence techniques and deep learning to preprocess the images of the driver. A linear supporting vector machine (SVM), combined with the histogram of oriented gradients (HOG), will be used to identify the face, and an ensemble of regression trees will be used to detect the landmarks of the driver (keypoints that locate face elements, such as the eyes or the mouth). In this work, we opted to use the combination of a linear SVM with HOG to detect the driver’s face, but there are other interesting techniques, such as YOLO-v4 [9], that could be used for this purpose.
Once the face of the driver has been located, the preprocessing will continue, and a CNN that receives the cropped face as an input will be used to know whether the driver is yawning or not. The parameters obtained after the preprocessing phase are then introduced on a fuzzy inference system powered by fuzzy logic, where they will be analyzed to assess the drowsiness level of the driver (for example, by evaluating if the driver is yawning frequently or blinking too fast).
Fuzzy logic uses rules that follow the structure “if p then q”, but, whereas in classical logic p and q can only be t r u e or f a l s e , in fuzzy logic, a statement can be partially true [10]. This is very useful when handling imprecise or rough information, for example, when we are trying to assess if a certain number of blinks means that the driver is blinking slowly or quickly. Since the consequent can also be partially true, this allows the system to estimate the level of drowsiness of the driver instead of only decide whether he or she is fatigued or not, which can help to avoid false positives.
This way, when the system estimates that the driver is too tired to drive, it will be able to raise an alarm and suggest the stopping of the vehicle, thus protecting both the driver and their surroundings (such as pedestrians or other drivers). In the near future, an implementation of these systems could be integrated on a vehicle as an advanced driver assistance system (ADAS) to monitor drivers and calculate their drowsiness level, alerting them if necessary.
This paper is organized as follows: Section 2 provides an overview of recent works related to fatigue detection, as well as the application of deep learning and fuzzy logic techniques for driver safety. The proposed design for our fatigue detection system is described on Section 3, while Section 4 presents the results obtained. Finally, Section 5 analyzes the results and the detected problems and proposes possible improvements and future work lines, and Section 6 presents the conclusions of the work.

2. Background and Related Work

When measuring the drowsiness level of a driver, there are two different approaches according to the origin of the data used for this measuring. On the one hand, there are systems that monitor the vehicle state to assess the fatigue of the driver, while on the other hand, there are systems that use parameters obtained from the own driver.
(a) Systems focused on the vehicle
Among works that focus on the analysis of the vehicle state and its relation to fatigue, the most common measures that are studied are steering wheel behaviors or lane departures [11,12,13]. In [14], other parameters of the car are used, such as the vehicle position or the steering wheel angle, and they perform data fusion on multiple measures to achieve a more reliable system. However, even if the diminishing performance over skill-based tasks by the driver can actually be a consequence of drowsiness, it appears at a later stage and it cannot be used to detect the early symptoms of fatigue [15].
(b) Systems focused on the driver
One of the most reliable ways of estimating fatigue is by using electroencephalograms (EEG) in combination with electrooculograms (EOG) [16], but in real driving environments, these kinds of systems are usually rejected by drivers. Their main drawback is that they require that the driver has attached electrodes around the eyes and over the head, which makes them intrusive systems that produce discomfort and rejection by drivers.
Because of this limitation, the most used fatigue detection systems are those in which the driver’s state is detected through a camera placed on the vehicle that takes images of the driver. In this work, we will focus on the detection of the early symptoms of drowsiness by using the driver’s state.
There are many works that follow this approach, which use numerous and varied parameters and techniques for their detection. For example, in [17], the landmarks of the driver’s face (that is, a group of points that locate the most important elements of the face: eyes, eyebrows, nose, mouth, and facial shape) are obtained, and then, using these landmarks, some parameters, such as the percentage of eye closure (PERCLOS), are calculated. Afterwards, these features are introduced on a support vector machine (SVM) that classifies whether the driver is tired or not.
In [18], a combination of depth videos and deep learning is used for fatigue detection. In particular, it uses two CNNs: a spatial CNN, which detects object’s positions, and a temporal CNN, which looks for information between two neighboring frames. By using these two CNNs, the system is able to calculate motion vectors from one frame to another, which allows to detect yawns, even when the driver uses a hand to cover his or her mouth.
Fuzzy logic [10] becomes a powerful tool when developing systems that help protect drivers: on the one hand, because it is easy and intuitive to create rules that are accurate and whose results are easily understood, and, on the other hand, due to the fast computing of these kind of systems, which allows using them in real time. Examples of these systems are not limited to fatigue detection: in [19], for example, a fuzzy-based alarm system is proposed that alerts the driver of dangerous situations.
Among works that combine fuzzy logic and fatigue detection, in [20], a system is proposed that analyzes the mouth and eyes of the driver, measuring its openness to assess whether the driver is fatigued or not, and if the system detects drowsiness over several consecutive frames, it raises an alarm. In contrast, in [21], the authors use measures that represent the driver’s behavior over a window of time, as the average PERCLOS, the driver’s blinking rate or the head position, all of it measured over the last 60 s. After this, these parameters are introduced in a fuzzy inference system (FIS) formed by 32 different rules, and the drowsiness level of the driver is calculated.
Although both works report good results, it is important to note that the experiments were performed over people that simulated their drowsiness state. By faking these situations, subjects tend to exaggerate their expressions and show symptoms that are clearly visible, which causes the developed systems to be less reliable in real environments.
To avoid the problem of simulated data, in this work, we will use the UTA Real-Life Drowsiness Dataset (UTA-RLDD) [22]. This dataset contains the frontal videos of 60 different people performing a simple task (reading or watching something on a computer), with a duration of 10 min per recording. These videos are classified based on the state of drowsiness of the subjects when they were recorded (awake, low vigilant or drowsy), and each person has at least one video of each category. UTA-RLDD was created for the task of multi-stage drowsiness detection, targeting not only extreme and easily visible cases, but also less explicit cases, where subtle micro-expressions are the discriminative factors. Because of this, it is a suitable dataset to search for the evidence of real drowsiness, which is the purpose of this work.
The ultimate aim of our work is to activate an alarm when the system detects that the driver is drowsy, which means that the alarm activation module will follow a binary behavior (on/off, depending on the fatigue level of the driver). Because of this, only the “awake” and “drowsy” classes are used to train and test the system (60 awake videos, 62 drowsy videos). The database provides the videos divided in 5 folds (or subsets of data), so in this work, we use 5-fold cross-validation to test the data. These videos were recorded with different cameras (web, mobile phone, etc.), resulting in a pool of videos with different qualities and resolution. This is very interesting to emulate real situations in a car, where there are light changes, but the results obtained can be moderate, as would correspond to this situation.
To compare our work to a baseline, it is especially interesting to review the works proposed in [22,23] since they define and implement a fatigue detection system, mostly based on CNNs that are tested over UTA-RLDD. However, it is important to note that in most of these works, the methodology used to test the database is different from ours. These differences are explained in Section 5, where the results reported by our systems are analyzed and compared with those obtained by other reference systems.
Besides this, the YawDD dataset [24] is also used to help with the preprocessing of the recordings: YawDD videos are used to train and test a complementary CNN that detects whether the driver is yawning or not. Although yawns are not as common as other symptoms at the early stages of fatigue, they are a clear indicator of drowsiness, and it is important that our system is able to detect them.
Because of this, and because in UTA-RLDD the yawns are not tagged, we use a dedicated dataset that allows us to train a model for this task. Once the CNN is trained and the information about yawns can be gathered from any video, YawDD videos will not be used anymore (the UTA-RLDD dataset will be used to test the drowsiness detection system, as mentioned before).
YawDD provides videos from 30 different people performing three actions while driving: talking or singing, yawning, or driving normally. This dataset provides videos taken from two different angles: some of them were recorded with a camera mounted under the front mirror of the vehicle, while others were recorded from the dashboard. Because of their similarity to UTA-RLDD videos, in this work, we use the videos of the dashboard to detect if the driver is yawning.

3. Materials and Methods

The aim of this work is to develop a system that is able to estimate the fatigue of a driver by using sequences of images that are recorded in such way that the face of the subject is visible.
The drowsiness detection system developed in this work is part of a driver-based ADAS system [25,26], with two important restrictions: early detection and minimization of the number of false positives. The idea is that the system will warn the driver only in real cases of fatigue, to avoid false positives, which would cause boredom in the driver, causing them to turn off the ADAS, without executing the rest of the functionalities.
When it comes to the recording of the driver, it is important to determine the frame rate that the camera has to communicate to the system. A high frame rate will overload the system because of the high number of frames per second (FPS) that have to be evaluated, but a low amount of FPS can affect negatively the system performance. In this domain, it is necessary that there are enough FPS to appreciate details of the image sequence that have a very short duration, such as blinks.
Since the average blink duration ranges from 100 to 400 ms [27], in this work, a frame rate of 10 FPS is used, which is enough to detect blinks and avoid overloading the system. This way, 600 frames are evaluated every time a new frame is captured by the camera. To do this, the system stores the previous 599 frames, so that a full sequence of 60 s is analyzed at each instant.
As mentioned in Section 1, this work proposes two alternative solutions to estimate drivers’ drowsiness. The first alternative uses a recurrent and convolutional neural network, while the second one uses AI and deep learning techniques to extract numeric features from images, and then introduces them into a fuzzy logic-based system. However, both solutions follow the same process structure, which consists of three phases: preprocessing, analysis, and alarm activation. Figure 1 shows the three different phases.
As shown in Figure 1, the system receives 600 frontal images of the driver, corresponding to the last 60 s recorded by a camera placed on the vehicle (for example, on the driver’s dash) at 10 frames per second (FPS).
These images are received by the preprocessing module, whose objective is to transform the received image into data that can be used by the drowsiness detection model. The preprocessed data are then sent to the analysis module, which performs the fatigue detection tasks and assesses the level of drowsiness of the driver at that moment, based on the information from the last 60 s. Lastly, the calculated drowsiness level is transmitted to the alarm activation module, which uses the last levels of drowsiness to determine whether it is necessary to alert the driver or not.
As mentioned above, one of the main objectives of the alarm activation module is to minimize the number of false positives of the system (drowsiness alerts when the driver is actually awake), since a high number of false positives disturbs the driver and increases the possibility of turning off the system. This is one of the reasons that motivate the experimentation over videos instead of frames and make the tests more exacting, since the activation of a single alarm in a 10 min video means that, regardless of what is detected before or after that moment, the classification of the video will be considered “drowsy”.
Once the system has made its decision on whether to alert the driver or not (a yes/no possible outcome), it will communicate its decision to the human–computer interaction system responsible for warning the driver by using visual and/or sound stimuli.
The three modules (preprocessing, analysis and alarm activation) of each of the two alternative solutions are described below.

3.1. Alternative I: Recurrent and Convolutional Neural Network

The first alternative, although it is focused on using deep learning techniques, uses one artificial intelligence technique (linear SVM combined with HOG) to preprocess the driver’s image and extract the face. This new image is sent to the analysis module, that applies deep learning techniques to analyze the fatigue of the driver at that moment.
In this case, the analysis module is composed of a recurrent and convolutional neural network (which we will call “recurrent CNN”). This recurrent CNN is responsible for detecting the fatigue of the driver at the current moment by calculating a numerical output that represents the estimated drowsiness level of the driver. This value is sent to the alarm activation module, where it is decided whether or not to activate the corresponding alarm.
Figure 2 shows a diagram representing the process followed by the system, divided in 3 stages that are detailed in this section.

3.1.1. Preprocessing

As previously mentioned, before sending the image to the recurrent CNN, we crop and preprocess the original frame at the preprocessing module. To avoid that the model is affected by possible noise, the first step is to apply a Gaussian blur to the original image. Blurring images is a common technique used to smooth edges and remove noise from an image, while leaving most of the image intact.
From the blurred image, we extract the image region that contains the face, for which DLIB’s library [28] is used. In particular, we use its face detector, which calculates the coordinates of the face location by using histograms of oriented gradients (HOG) and a linear supporting vector machine (SVM) [29]. This way, this AI technique is used to crop the original image and leave only the face of the driver.
After this, we scale the face to 64 × 64 px, a size that allows us to preserve the details of the face and considerably reduces the computation time required to process each image. Next, we perform a histogram equalization to adjust the contrast of the image and avoid unnecessary details. We apply ImageNet mean subtraction [7], a technique that reduces the probability that the classification is affected by the illumination of the image, and that allows to use transfer learning with models that have been trained over the ImageNet domain. Figure 3 shows an example of the preprocessing that is performed.

3.1.2. Analysis

The analysis module uses a recurrent and convolutional neural network to estimate the drowsiness level of the driver. The CNN is based on the EfficientNetB0 architecture [30], which presents a lightweight model that is highly precise. Smaller models are processed faster, and EfficientNetB0 presents the smallest model of the EfficientNet series. Since the differences in accuracy are not significant in our domain when upgrading to a superior model, we consider EfficientNetB0 to be the most adequate model for this case, where the model needs to quickly obtain a prediction. This way, we perform transfer learning on this model by using previously trained weights that have great performance in recognizing objects on images from the ImageNet dataset [31].
The EfficientNetB0 architecture is divided into 9 blocks, each of them formed by multiple layers. Figure 4 shows an overview of this architecture, where the 9 main blocks are represented.
In this work, we focused on tuning the number of frozen layers of the transferred model to obtain the highest possible accuracy. For this, we trained our system using four different configurations, named after the amount of layers that are trained within the EfficientNetB0 model:
  • No training: All layers are frozen, no layer from EfficientNetB0 is trained.
  • Top training: All layers are frozen except for the layers of Block 9 (pooling, flatten, dense and dropout layers).
  • Partial training: In addition to layers of Block 9, layers from Block 8 (the last MBConv block) are also trained.
  • Full training: All layers remain unfrozen.
To test these configurations, a preliminary evaluation was performed, where each configuration was trained over 25 epochs. After analyzing the training accuracy obtained from this experimentation, we concluded that the best performing configuration was top training. So, the weights of the model are frozen at every layer, except for the last block of the layers (which consists of pooling, flatten, dense and dropout layers), preventing the information loss of the early layers while training the new model. In this case, the EfficientNetB0 architecture is used as the base of a GRU (gated recurrent unit) recurrent neural network, combining, in this way, a CNN with a RNN.
The GRU network receives 600 images with the face of the driver, and it has to identify the characteristics that reveal if the driver was drowsy during that last minute. The output of the GRU is received by the final classifier, where some dense and dropout layers are used to estimate the drowsiness level of the driver, which is a number between 0 and 1.
Figure 5 shows the final architecture of the network. As mentioned, transfer learning is applied in the module labeled GRU in Figure 5, where EfficientNetB0 is implemented. The rest of the additional layers are those that are trained to transform the knowledge provided by EfficientNetB0 into a drowsiness level estimation.

3.1.3. Alarm Activation

The following conditions must be met to alert the driver:
  • The driver is considered to be drowsy at a specific moment when the output of the analysis module is greater than a threshold, called d r o w s i n e s s _ t h r e s h o l d . This value ranges between 0 and 1.
  • The driver has to be considered drowsy for multiple instants of the last 60 s to raise an alarm. This is determined by the variable m i n _ t i m e , which represents how many seconds the driver has to be drowsy before alerting him or her. This value ranges between 0 and 60.
This way, when the driver is considered drowsy for at least the established minimum time, an alarm is raised. If the condition to raise an alarm continues after alerting the driver, a second alarm is not raised. Instead, another alarm is raised only if the conditions for alerting the driver are no longer met, and after that, drowsiness is detected again.
To calculate the optimal values of variables d r o w s i n e s s _ t h r e s h o l d and m i n _ t i m e , multiple tests were performed, which are described in Section 3.3.

3.2. Alternative II: Deep Learning Combined with Fuzzy Logic

In this case, the images are preprocessed by using artificial intelligence (linear SVM combined with HOG and ensemble of regression trees) and deep learning techniques (pre-trained CNN), which extract numerical characteristics that can be introduced on a fuzzy inference system (FIS). After this, the FIS returns a numerical output that represents the estimated drowsiness level of the driver, and this value allows the system to raise an alarm if needed.
Figure 6 shows a diagram representing the process followed by the system, divided into 3 stages, which are explained in this section.

3.2.1. Preprocessing

The parameters that we are interested in discovering from the driver’s image are the following:
  • Number of blinks ( b l i n k s ).
  • Average blinking duration ( a v g _ b l i n k ).
  • Number of microsleeps, i.e., blinks with a duration of over 500 ms ( m i c r o s l e e p s ).
  • Number of yawns ( y a w n s ).
  • Time spent yawning ( a v g _ y a w n ).
The first step to calculate these parameters is locating the driver’s face. To do this, DLIB’s face detector is used once again. However, in this case, we also use the landmark detector that DLIB provides, which is an implementation of [32], where the shape predictor uses an ensemble of regression trees. DLIB’s landmark detector represents the facial features with a group of 68 points, 12 of them representing the eyes (6 points per eye), which allows us to know the position of the driver’s eyes. Figure 7 shows an example of landmark detection.
To calculate the parameters related to eyes and blinks, it is necessary to calculate first how opened or closed the driver’s eyes are. To do this, we use the technique proposed in [33]: we calculate the eye aspect ratio (EAR) by measuring the distance between the top eyelid and the bottom eyelid, and we divide it by the eye width, thus obtaining openness values that usually range between 0.16 and 0.36. Experimentally, it is determined a threshold of 0.20, so that every time that the measured EAR is under 0.20, it is considered that the driver has closed his or her eyes. By calculating how many times and for how long the driver blinks, we gather the first three measures.
Next, we want to use the face to detect if the driver is yawning. To do this, the face of the driver is cropped and preprocessed following the same process as described in Section 3.1.1. This image is then given as an input to a CNN that we have trained specifically to detect whether a person is yawning or not. This network is based on the EfficientNetB0 model: we use its architecture and its trained weights over the ImageNet domain, and we add new layers to the model to train the network on the detection of the specific actions that we are interested in.
Figure 8 shows the architecture chosen for this network.
To train this neural network, the YawDD dataset [24] is used, which provides videos from 30 different people yawning and driving normally. In particular, we use the videos that were recorded by a camera placed on the dashboard, in front of the driver. Videos from 18 people are used at the training phase, while 6 are used for validation and the other 6 are used for testing. The accuracy when classifying the drivers’ yawns reached a notable 88% accuracy on the testing data used. To avoid possible errors, to classify a frame, the system calculates the average class of the last 20 frames (2 s), and it returns the class that appears more times.
Thanks to this deep learning model, we can calculate how many seconds the driver has spent yawning, thus obtaining the remaining parameters that we need for the fuzzy inference system.

3.2.2. Analysis

To perform the drowsiness detection, a Mamdani fuzzy inference system [34] is designed for which we have to specify inputs, outputs, and rules.

Inputs

Each input has to be represented by a variable, which must have one or more fuzzy sets that define the possible values that the variable can take (for example, variable “number of blinks”, which would receive an integer, could have fuzzy sets “low”, “normal” and “high”). Each fuzzy set is defined by a membership function μ A ( x ) , which, for an input x, assigns a degree of membership to fuzzy set A. This membership value is a number between 0 and 1, where 0 means that it is completely false and that value x belongs to fuzzy set A, and 1 means that is completely true.
In this work, two types of membership functions are used: triangular (tri) and trapezoidal (trap) membership functions. These membership functions are typically used in fuzzy logic because they are able to represent easily and accurately the evolution of the values on most fuzzy sets. In this case, the use of one type of membership function or another is tailored to each variable, and it is related to the range of values associated with each fuzzy set.
Both functions are defined by a group of points that are linearly connected, but, while triangular functions are defined by three points (with membership values 0, 1, and 0), at the trapezoidal function, there are four points (with membership values 0, 1, 1, and 0).
Figure 9 shows an example of a variable where three fuzzy sets are defined: two of them ( l o w and n o r m a l ) use triangular functions, and the other one ( h i g h ) uses a trapezoidal function.
Table 1 shows the variables used as inputs of the FIS along their respective fuzzy sets.

Output

As inputs, the outputs of a FIS are designed with variables defined by fuzzy sets. The result is calculated as the degree of membership to the different fuzzy sets, and after that, it is defuzzified to obtain a single numerical value that represents that variable (in our case, a number on the [0, 1] interval that indicates the drowsiness level of the driver). The output variable of this system is defined at Table 2.
The method employed for defuzzification is the center of gravity (COG). This technique, based on the activations of the output fuzzy sets, calculates the center of gravity of the area under the membership functions [35].
Figure 10 shows an example of this method, where the defuzzified output is 0.53.

Rules

Finally, rules connect input variables with output variables. Our aim is to define the conditions that show the drowsiness state of a driver. For this, 11 different rules are defined and collected in Table 3.

3.2.3. Alarm Activation

To calculate whether the ADAS has to alert the driver or not, the system based on fuzzy logic performs the same process as that of the system that uses a recurrent CNN, which is described in Section 3.1.3.

3.3. Experimentation Methodology

Experimentation is performed over the UTA-RLDD dataset, using videos of 60 different people on two different states: awake and drowsy. The training data used consist of 97 videos (48 awake, 49 drowsy), while the test data consist of 25 videos (12 awake, 13 drowsy). It is important to consider that UTA-RLDD is a realistic dataset, where the subjects are not simulating their drowsiness, so it is common that the recorded person does not show fatigue symptoms at every second of the video, but only at specific moments.
Because of this, to evaluate the system’s performance, each video is analyzed frame by frame, evaluating at each frame the drowsiness level of the driver. After this, the alarm activation module of the ADAS decides whether to alert the driver or not. The number of alarms raised during the video is counted, and this number is used to calculate the system’s accuracy. This way, each video can count either as a hit (if the subject is awake and there are no raised alarms, or if the subject is drowsy and there is at least one alert) or as a miss (if there are no alarms when the driver is drowsy, or if the system raises an alarm when the driver is awake). If the system alerts the driver at least once, we consider that the video is classified as “drowsy”, and if there are no alarms, it is classified as “awake”.
It is important to understand the following terms that are used while evaluating the system:
  • FP (false positive): Video misclassified as “drowsy”, where the subject was actually awake.
  • FN (false negative): Video misclassified as “awake”, where the subject was actually drowsy.
  • TN (true negative): Video correctly classified as “awake”, where the subject was awake.
  • TP (true positive): Video correctly classified as “drowsy”, where the subject was drowsy.
As explained in Section 3.1.3, the alarm activation module works with two variables: d r o w s i n e s s _ t h r e s h o l d , which represents the minimum drowsiness level to consider that a driver is drowsy, and m i n _ t i m e , which represents how many seconds the driver has to be considered drowsy before raising an alarm. These two variables affect the system’s performance: if the threshold is low and the minimum time is high, there are more possibilities of raising an alarm. This means that the driver is alerted at early phases of fatigue; however, it also increases the generation of false positives. Avoiding false positives is of the utmost importance, since a system that raises alarms when it is not necessary will bother the driver, who will likely turn off the whole system.
Because of this reason, we perform multiple tests with different combinations of thresholds and minimum times. We test the systems over the training data with a threshold ranging between 0.20 and 0.95 (using intervals of 0.05), and with a minimum time ranging between 10 and 60 (using intervals of 5). After this, the combination that obtains the higher accuracy over the training data is chosen. If there is more than one combination that reaches the best accuracy, the combination with the lowest number of false positives is selected. Then, the chosen combination is used to evaluate the system over the test data.
To verify the performance of both alternatives over different distributions of data, we apply a 5-fold cross validation. Because of this, the methodology described above is followed separately in each of the five experiments performed. As an illustrative example, we present the detailed results obtained on the first experiment, followed by a summary of the results of the five experiments and the final averaged results.

4. Results

This section presents the results derived from the experimental evaluation. These results were obtained by following the experimentation methodology described in Section 3.3 with each of the two solutions proposed in this work, so there is a subsection for the performance of each alternative.

4.1. Alternative I: Recurrent and Convolutional Neural Network

First, to illustrate the experimentation methodology followed, we present the results obtained on the first experiment, where we use folds 1–4 for training and fold 5 for testing. Figure 11 shows the accuracy rates of the first alternative for the classification of the training data on this experiment.
As it can be seen in Figure 11, the d r o w s i n e s s _ t h r e s h o l d s with the better performance are 0.60, 0.65 and 0.70, where the 0.65 stands out and reaches an accuracy of 71% when the minimum time ( m i n _ t i m e ) is 15. We use this combination to evaluate the system over the test data, and we obtain the results presented in Table 4.
Following the same methodology, we test the other combinations of folds, obtaining the results presented in Table 5 and Table 6.
As we can observe, the accuracy over the test data is reduced by around 55%. Besides this, there are a lot of false positives, since in 40% of the videos in which the subject was awake, the system raised an unnecessary alarm (on average, 4.8/12 of the videos). These results show that this approach is not useful to be used in the ADAS.

4.2. Alternative II: Deep Learning Combined with Fuzzy Logic

As in the previous case, we present first the results obtained on the first experiment, where we use folds 1–4 for training and fold 5 for testing, and, after this, we present the cross-validated results obtained over the test data.
Figure 12 shows the accuracy rates of the second alternative for the classification of the training data. In this case, the table only shows the results of d r o w s i n e s s _ t h r e s h o l d s that range from 0.20 to 0.65, because all systems tested with a threshold of 0.55 or higher obtained an accuracy of 0.49. This accuracy was obtained by never alerting the driver, which is accurate for 49% of the data (corresponding to the “awake” videos).
As it can be seen in Figure 12, there are multiple combinations of thresholds and times that reach the maximum accuracy obtained, which in this case is 69%. Because of this, we have to analyze the false positive rate of each combination, aiming to use the combination that produces the minimum number of false positives.
Table 7 shows the complete results of the combinations that achieved the best accuracy on the first experiment.
As we can see, both combinations with a 0.5 threshold achieve an impressive 0% false positive rate, so we will use these combinations to test the system over the test data, and we obtain the results presented in Table 8.
Since both combinations achieve the same accuracy, we could choose any of them to represent the results of the first experiment. Following the same methodology, we test the other combinations of folds, obtaining the results presented in Table 9 and Table 10.
The averaged accuracy, although it is sightly better, does not differ much from the one obtained by Alternative I. However, in this case, the system only alerts the driver incorrectly on 0.8/12 cases, which means that the false positive rate of this solution is reduced to 7%.

5. Discussion

This section presents a complete analysis of the results obtained by both alternatives, including the limitations of the results and a comparison with the state of the art, some problems detected at the preprocessing module, and possible future improvements to the system that are identified.

5.1. Analysis and Limitations of the Results

After analyzing the results obtained, we can conclude that, even though both systems have potential, they are not ready for installation on the ADAS of a real vehicle. The accuracy of both systems is insufficient, especially on the test data, so they must be revised and improved.
Both alternatives reached a similar accuracy: around 65% on training data and 55–65% on test data. This results are quite poor considering that we are only classifying two balanced classes (awake and drowsy), since a random classifier should obtain an accuracy of 50% and our system only sightly improves that number.
Even thought the results are similar, Alternative I falls behind Alternative II because it raises too many false positives to be tolerable to the driver. Until the false positive rate is minimized, this alternative cannot be considered for implementation in real driving environments. Since this solution uses a neural network that learns by itself the characteristics of data, to improve this results, it is necessary to tune the training parameters or even the architecture of the network used.
However, the results obtained by Alternative II, which uses deep learning combined with fuzzy logic, are promising, since it minimizes the number of false positives. From the 60 videos (around 10 h of video) where the driver was completely alert, the system only raised an alarm on 4 of them, so it stands as a reliable system that will not bother the driver with unnecessary alarms. Its precision while detecting actual fatigue is inferior to Alternative I, but we are working on improvements to the fuzzy inference system that will make the system capable of detecting more drowsy situations.
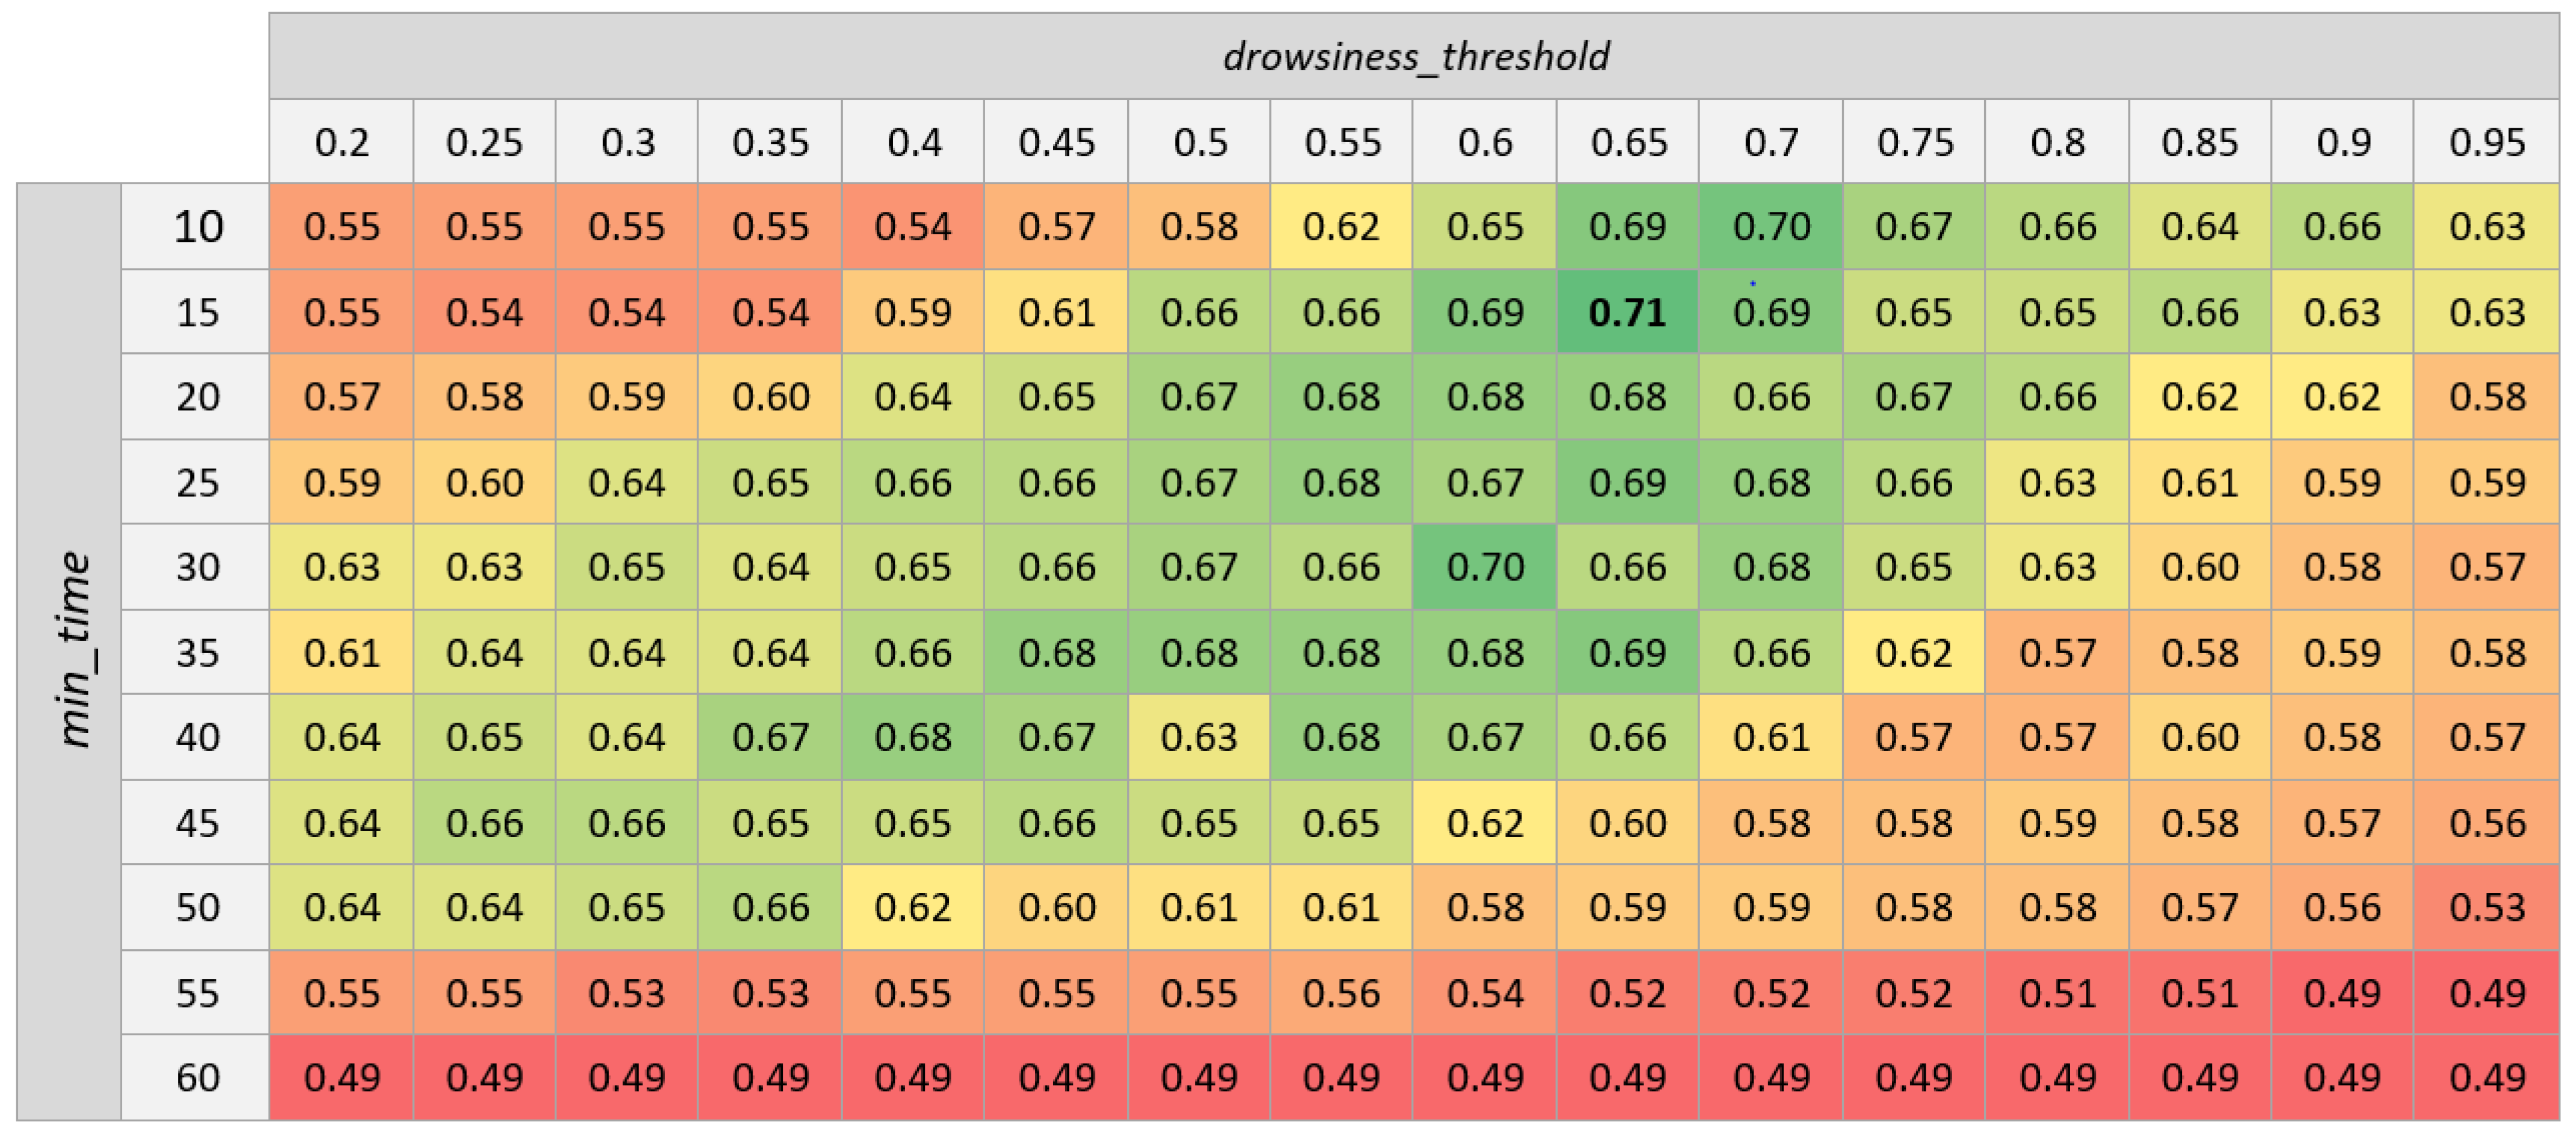
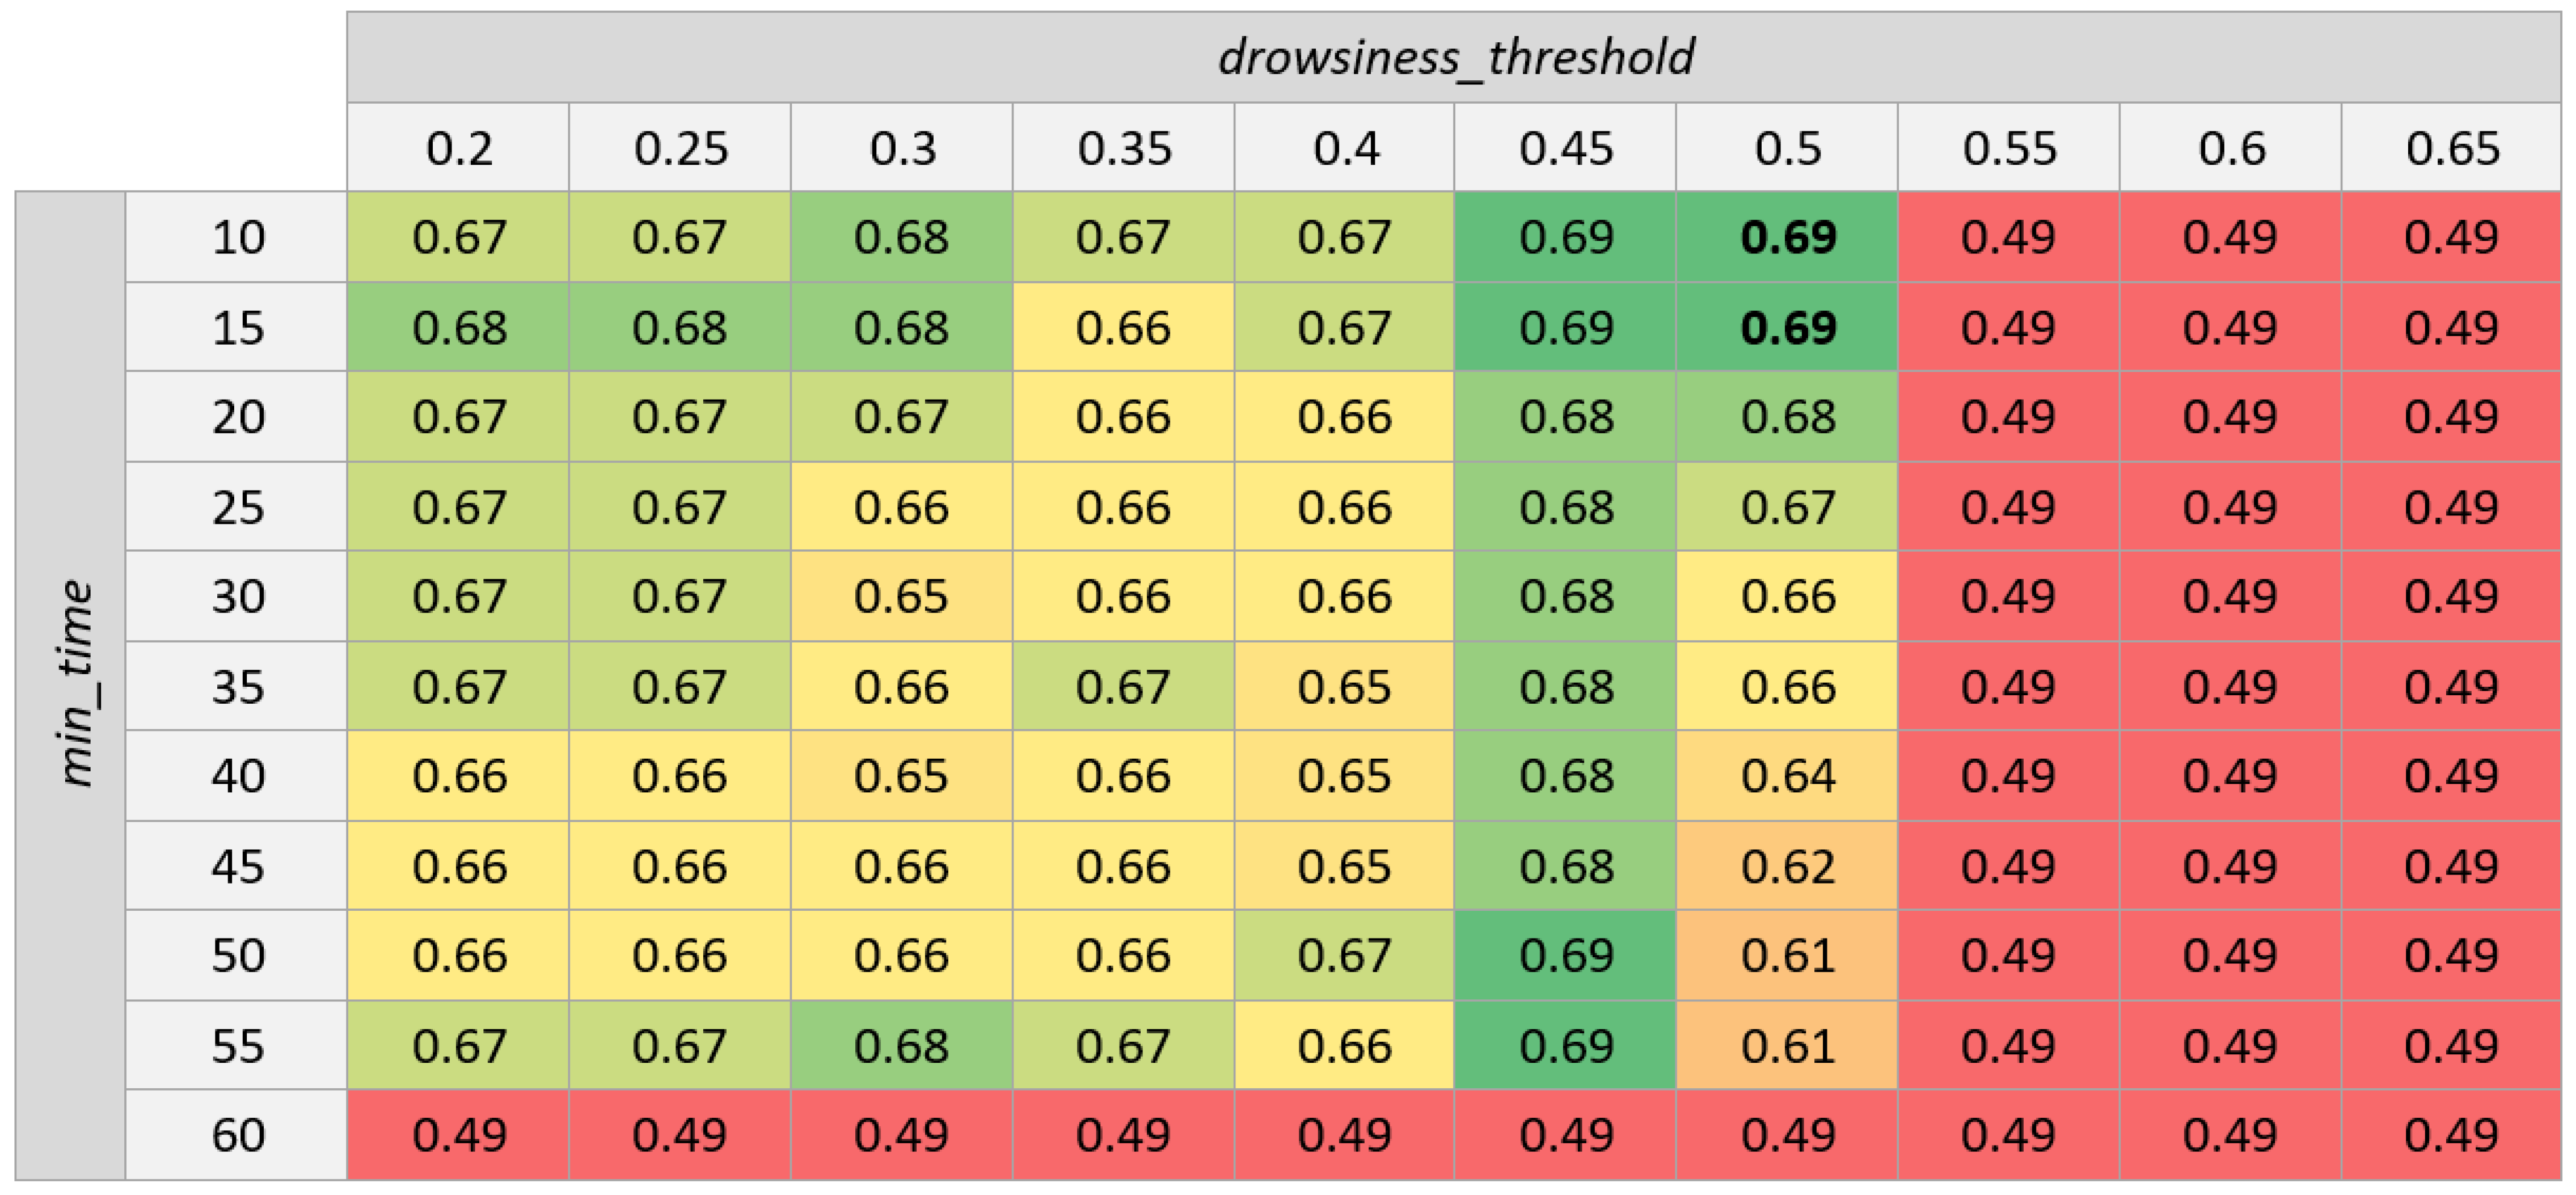
Apart from the accuracy, another aspect that requires analysis for future versions of the system is the value of parameters d r o w s i n e s s _ t h r e s h o l d and m i n _ t i m e . This value remains relatively stable among the tests performed ( d r o w s i n e s s _ t h r e s h o l d is in the range of [0.50, 0.65] or [0.45, 0.50] depending on the alternative, while m i n _ t i m e is usually in the range of [0.10, 0.15]), but there are some outliers among the results of the different folds, and the tests performed are insufficient for choosing the best value.
Because of this, more tests are necessary to obtain the best combination of parameters for which it could be beneficial to use other databases and a cross validation that considers more folds (e.g., using 10 folds instead of 5). By comparing the best performing combinations of each of those tests, we will be able to determine values that work almost universally.

5.2. Comparison with Systems of the State of the Art

Unfortunately, currently there are not a lot of works where the UTA-RLDD dataset is used, so we are limited when comparing our work to a baseline. The most relevant works at this moment are [22,23,36,37,38,39,40,41,42].
In the majority of the works available, the experimentation methodology differs from ours: they extract and classify individual frames from each video and verify whether the classification was correct or not, while we test our systems over the full videos and count the number of alarms raised during each video. Therefore, and although the evaluation of our system is described in terms of videos classified as awake or drowsy, technically the system does not classify the videos, but rather counts the number of alarms raised by the alarm activation module during each video and considers that the system detects the driver as “awake” when it does not raise any alarm and “drowsy” when it raises at least one. Because of this, some works are not exactly comparable, but it is interesting to check their results nevertheless.
It is also important to note that UTA-RLDD provides videos classified in three categories (awake, low vigilant, and drowsy). Some works use all categories, while others perform the classification using only two of the labels (awake and drowsy, as in this work), which is relevant when evaluating results and comparing systems.
A summary of the results collected in some of the works that use the UTA-RLDD database is shown in Table 11. As we have mentioned before, we consider that avoiding false positives is critical in this domain, so that drivers do not turn off the alert system. Because of this, besides the global accuracy, we also compare the false positives rate, when possible. It is worth noting that after thoroughly revising the related works, we verified that the false positive rate is only available in Refs. [22] (where three classes are used) and [36,41,42] (where two classes are used, but classification is performed using frames instead of videos).
In [22], the work where the UTA-RLDD was presented, four methods are used to classify videos as one of the three available categories. These methods obtain global accuracies between 57% and 65%, and the model that obtains the highest accuracy is the HM-LTSM network, with 65.20% accuracy. The accuracy on awake and drowsy videos is high, reaching a notable 80% in both categories. Although these results are very positive, false alarms would be raised in 19% of the cases, so the system could be improved to reduce this rate.
It is also interesting to analyze their comparison to a human judgment baseline, in which four volunteers classified the drowsiness level of each video. Human judgment reached a 57.8% accuracy, which is closer to the accuracy obtained by our systems. It makes sense that the fuzzy logic-based system approaches the accuracy obtained by human judgment, since the variables and the rules defined are based on the expert knowledge of humans. The false positive rate is higher, however, while using human judgment, and alerts the driver unnecessarily in 37% of the cases.
In [36], they use the categories “awake” and “drowsy”, like our system, leaving out the “low-vigilant” videos. In this case, the authors use around 100–120 images per recording. The model chosen for the fatigue detection task is a simple CNN created from scratch that combines five convolutional layers with a flatten layer and a dense layer. Although the global accuracy on the test images reaches 69%, this model cannot be considered for a real implementation on an ADAS because of the high rate of false positives (56% of the images tested).
It might be noted that, according to the author’s code, the random train/test split (80% train/20% test) of data was performed after extracting the images. Because of this, the accuracy might have been affected if frames extracted from the same video were used both in train and in test sets. Since every video is recorded under different conditions, the network could be learning to recognize the situation that is shown at a particular frame (person, angle, illumination), instead of recognizing the fatigue of the subject.
In [38], the authors present two CNNs trained to classify individual frames and predict whether the driver is drowsy or awake. One of the CNNs is created from scratch with three convolutional layers and one fully connected layer, and one is based on the AlexNet architecture [7], where they apply transfer learning. The CNN created from scratch obtains slightly better results, reaching a notable 96% accuracy.
To test the CNNs, they use videos from 28 out of the 60 subjects available at UTA-RLDD dataset, gathering around 55,000 frames. The authors mention that they use 70% of the data for training and 30% for testing, but there are no details on how the separation is done, so it is possible that it presents the same problem explained in the previous case.
In [23], they use the UTA-RLDD dataset to train and test a CNN inspired by LeNet architecture [39] to detect fatigue in drivers. They also use the “awake” and “drowsy” videos, and their methodology is to classify a randomly generated frame of each video. The accuracy of the model is assessed using stratified five-fold cross validation and, according to the authors, in each fold, there are about 152 sleepy samples and about 151 vigilant samples. However, since there is no indication about if the training and test sets share frames from the same video, it is possible that it presents the same problems as [36,38].
This way, it is reported an accuracy of 91.8% when classifying a single frame, much higher than the accuracy obtained by our systems when raising alarms on the full videos. In that same work, they also use an implementation of [43], which uses multiple CNNs to classify fatigue, over UTA-RLDD. In this case, the accuracy reaches 63%, which is more similar to the results reported by our systems.
In [37], the authors use the FaceNet CNN [44] to extract facial features from the drivers’ images, and then use either a multiclass SVM or a K-NN to classify those features into one of the three categories of the UTA-RLDD dataset. The accuracy obtained by both systems is high: the multiclass SVM reaches a 89% accuracy when classifying individual frames, while the K-NN outperforms it with a 94% accuracy. They use a total of 3000 images to train the models and another 300 images to validate them, but it is unknown to what videos these images belong or how they were selected.
In [40], the authors combine convolutional neural networks and long short-term memory for fatigue detection. The proposed hybrid architecture is trained and evaluated on a relabeled dataset that combines multiple datasets, including UTA-RLDD, and classifies their videos into three classes: “alert”, “low vigilant”, and “fatigue”. The relabeling process is performed at two levels: at the frame level (each frame is classified as one of the three categories) and at the minute level (each minute is classified).
The accuracy obtained by this architecture is 54.71% on frame segment cases, and 43.05% on minute segment cases. According to the authors, unlike other databases, UTA-RLDD contains subtle facial features that are difficult to capture through the training process. This could explain the low accuracy values obtained.
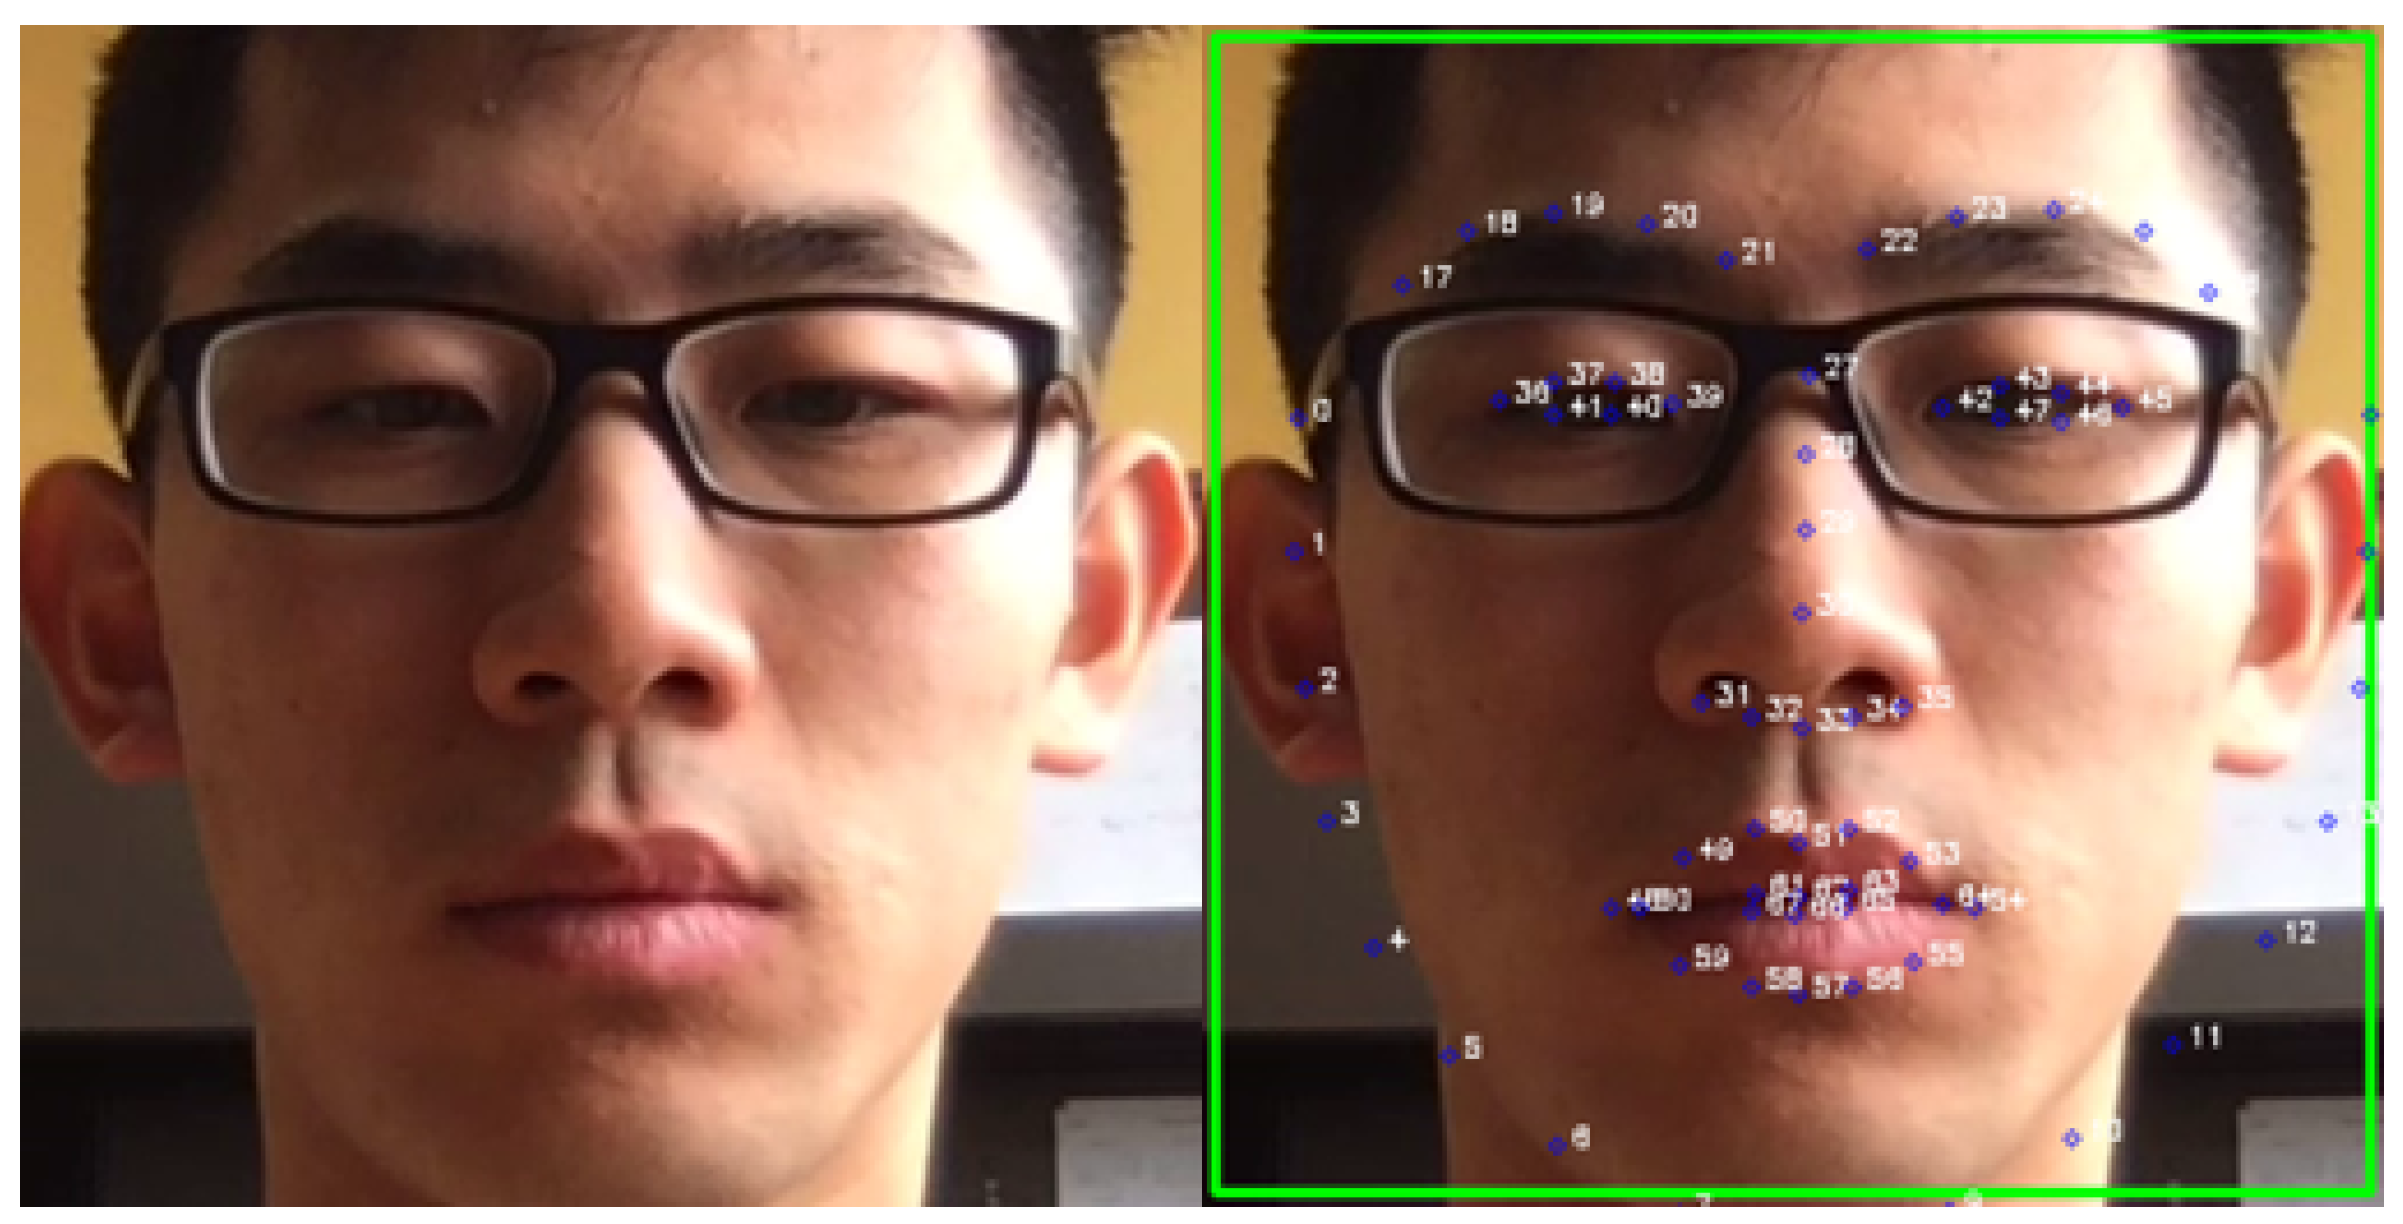
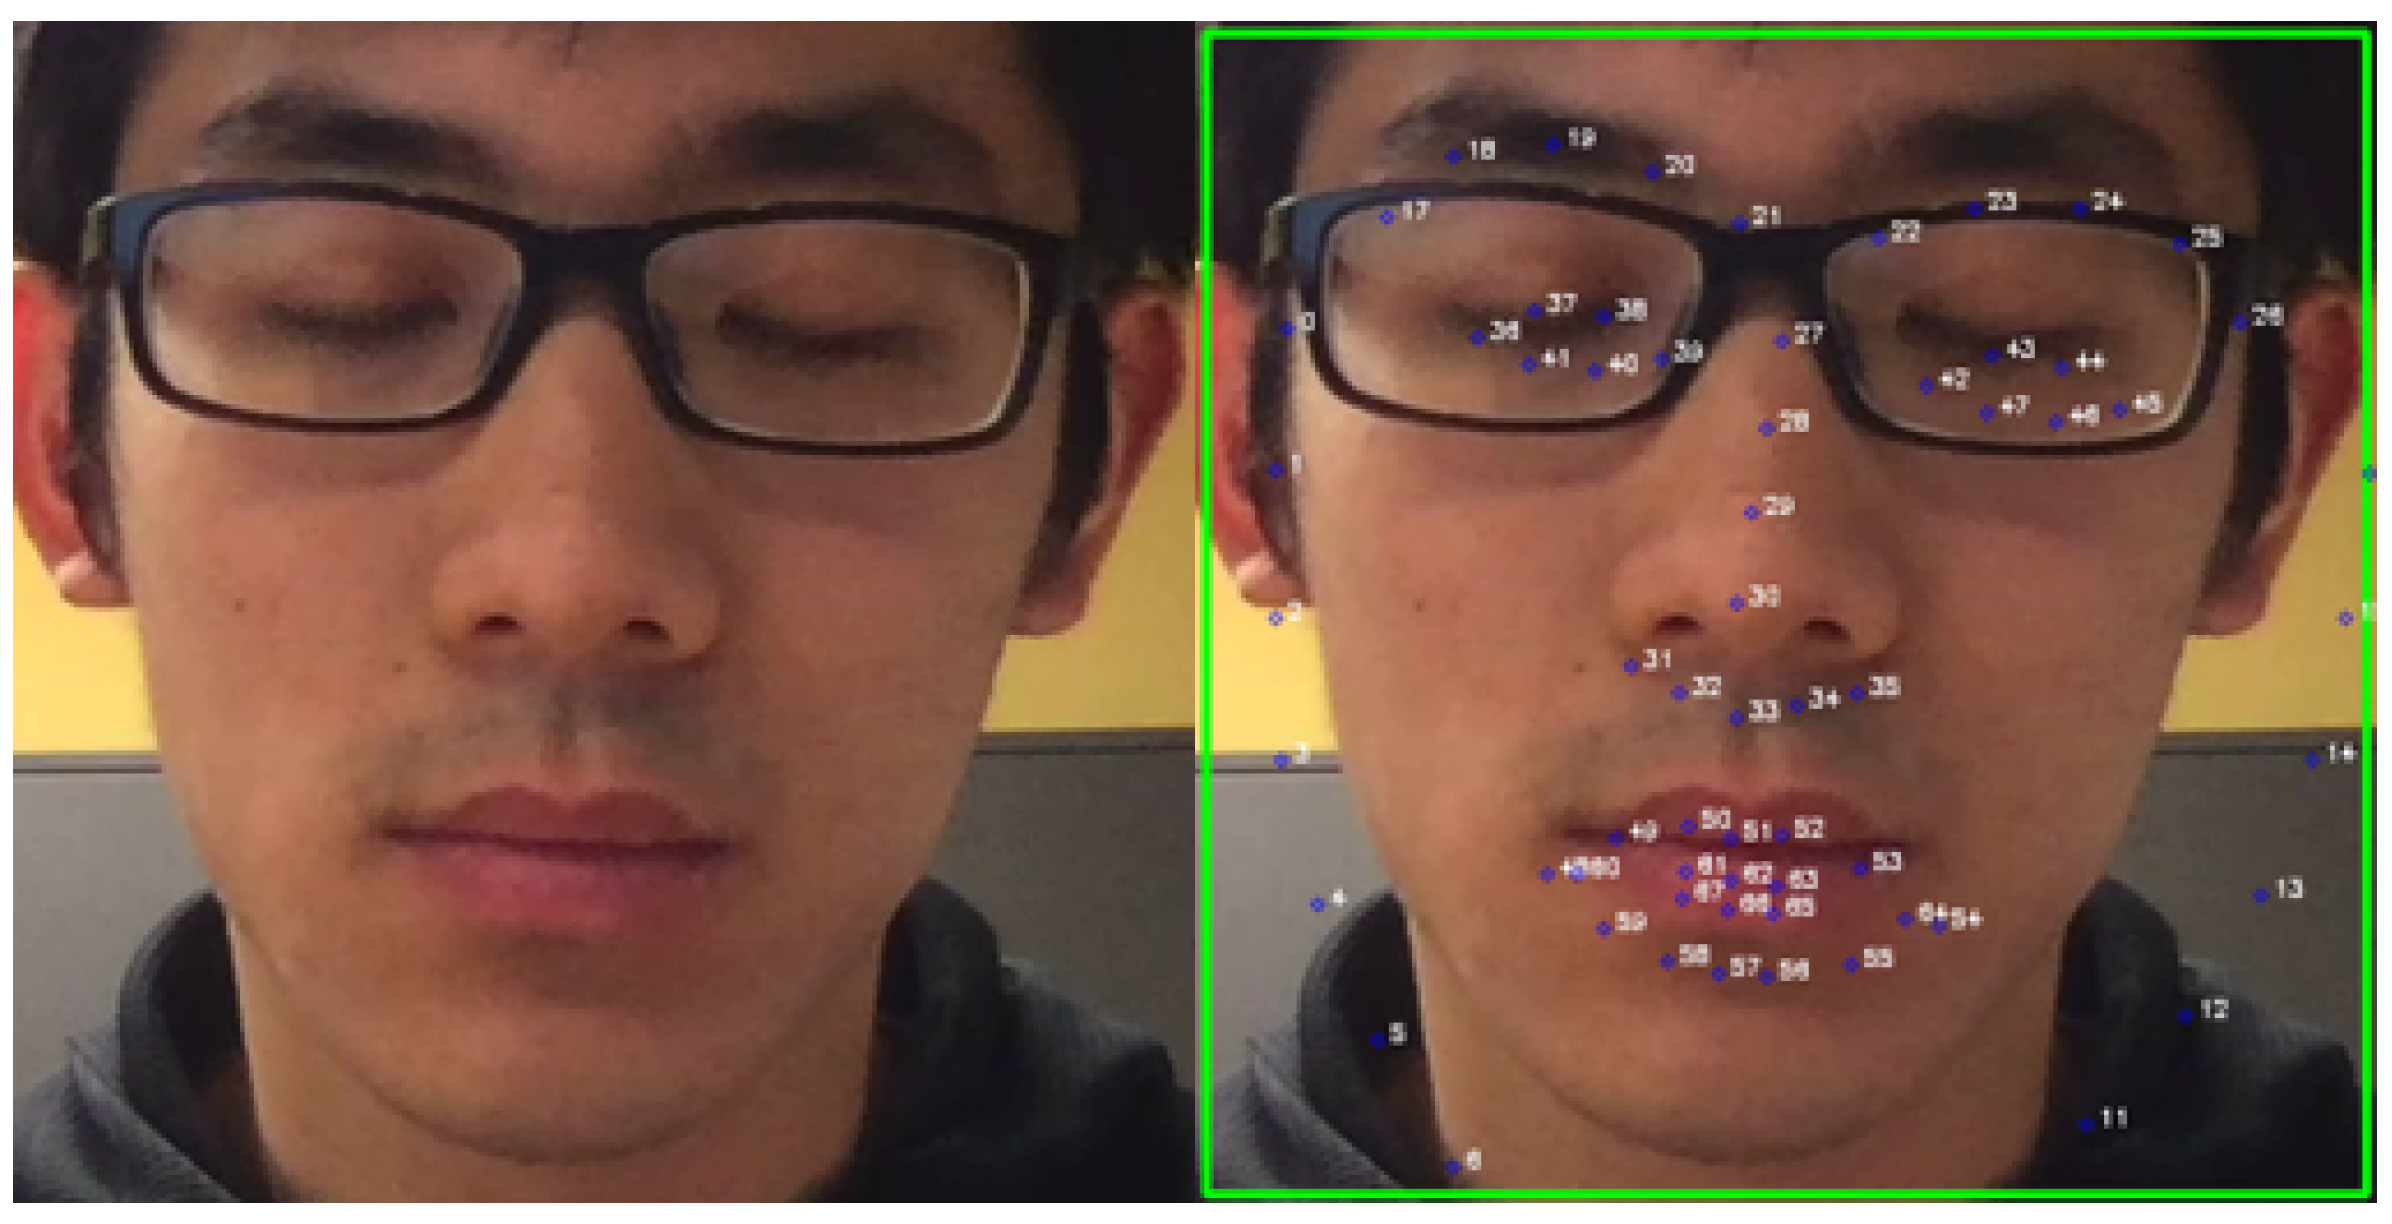
In [41], authors compare a CNN and a LSTM that evaluate drowsiness driver detection on UTA-RLDD dataset. Dlib’s pretrained face detector is used for detecting landmarks of eyes and mouth and extracting the eye aspect ratio (EAR), mouth aspect ratio (MAR), mouth over eye aspect ratio (MOEAR) and pupil circularity (PC). After extracting these four features, the data of all participants are merged and a new dataset is created. In total, 75% of the data are used to train the models, and the remaining 25% are used to test these models. The overall accuracy obtained by the LSTM network is 0.64, and that obtained by CNN is 0.72. As in [36], the system accuracy may be affected by the fact that images from the same video are used in both the training and test sets. In addition, the false positive rate of both systems is around 22%, which makes them unsuitable for implementation in an ADAS.
In [42], the authors use a LSTM that receives facial features (changes in eyes and mouth movements) as input data to predict fatigue. In this work, the dataset used to model the system include frames from alert and drowsy videos of only 16 participants. In this case, the training of the model is performed by applying a cross-validation process that uses 74% of the data. Once the cross validation is completed, the best performing model is chosen as the final model. According to the authors, the accuracy (63%) and true positive rate (70%) achieved by the system are not satisfactory. Their argument is that facial landmark data are not sufficient to make a reliable prediction and that other characteristics, such as body temperature and heart rate, should be used to make a reliable prediction. The false positive rate of this system (0.48) is also not tolerable in a real driving environment.
Overall, the models that reach the highest accuracy (around 90%) are those who use CNNs to classify individual frames extracted from the videos. Even though these results are positive and promising, we consider that it would be necessary to evaluate its performance over the full duration of the videos, as is done in [22] and in this work, to guarantee that false alarms are not raised. Since some of the works compared do not describe exhaustively the split process of training and testing samples, it would be necessary to revise that the systems recognize fatigue symptoms and not other characteristics of the subjects.
Finally, it should be noted that the low false positive rate (0.07) obtained by the system that combines AI and fuzzy logic techniques (alternative II), together with its accuracy value (0.63), indicate that this proposal meets the objectives set in this work: to design a system that can be integrated into an ADAS that is able to detect fatigue states in driving environments and minimizes the false alarms raised.

5.3. Problems Detected at Preprocessing

Apart from the accuracy reported, some problems were detected while testing the alternative based on the combination of deep learning and fuzzy logic, specifically on some tests of the videos from subject 60, which showed a young Asian man wearing glasses. This particular case stood out because at that time, the system made two errors: the awake video was classified as “drowsy”, and the drowsy video was classified as “awake”, so we checked manually what happened.
The two errors were related to the feature extraction process. Figure 13 shows the causes of the error on the awake video: even though landmarks are correctly detected, the points that represent the eyes of the subject are close to each other, which caused the error of the system. The EAR value, which was set at 0.22 at that moment, made the system believe that the eyes were constantly closed, raising an alarm almost immediately. This way, the differences in facial features across all races should be taken into account by the system.
However, on the drowsy video, the error was caused by a failure of landmark detection. As seen in Figure 14, the eye detection is not aligned with the face of the subject, and when he closes his eyes, the system is unable to detect it. This error could be caused by the changes in illumination, because of the glasses, or by a combination of both, but in any case, it highlights the importance of a good landmark detection system.

5.4. Future Works and Improvements

Since Alternative I uses a neural network that learns the features of the videos by itself, to improve it, we could modify the following:
  • Training settings. For example, changing the number of epochs or the learning rate.
  • Model used for transfer learning. We used EfficientNetB0, which is a model trained for object recognition over the ImageNet database. A domain that could be more similar to the drowsiness detection task could be facial recognition (since in this domain they analyze faces, too), so we could try to use models, such as VGGFace [45].
  • Network’s architecture, especially the section related to the recurrent neural network. GRU is known for being useful for its long-term memory, which helps working with long sequences of data, but the system could benefit from using an architecture specialized in working with massive sequences of data, such as WaveNet [46].
For both alternatives, it could also be useful to add a third class to the classes “awake” and “drowsy”. This new class, which could be named “questionable” as in [12], could be used to avoid false positives when the model is not 100% sure that the driver is drowsy. To do this, the UTA-RLDD database could be used, since it provides an extra class “low vigilant” where the subjects are not neither completely alert nor completely drowsy.
Another possible improvement to the system could be to review the fuzzy inference system, adding new inputs and rules. For example, the CNN in charge of yawning detection could be modified to also identify when the driver is talking, since the drowsiness level of a person that is part of a conversation is usually low.
Finally, to guarantee the effectiveness of the system in a real driving environment, it would be necessary to test it over data where the subjects are actually driving and the driver state is quantifiably binary (awake/drowsy). The UTA-RLDD dataset is extremely useful because it is realistic and shows videos recorded from a similar angle to that which could be used in vehicles, but the subjects are not driving and their symptoms could vary. In this dataset, the subjects were asked to perform one of these three actions: reading, watching something on their computer, or being idle. While reading, for example, the blinking rate is reduced [47], so the activity performed is relevant when testing the final system.

6. Conclusions

In this paper, two different implementations for a driver drowsiness detection system are proposed, where deep learning plays an important role. These systems use images of the driver to identify fatigue symptoms, but instead of predicting whether a driver is tired or not from a single image, in this work, a full sequence of 60 s is used to determine whether the driver is tired or not over the last minute.
The first solution proposed uses a model based on deep learning for the estimation of the drowsiness level of the driver, using a combination of a convolutional neural network with a recurrent neural network. The second solution uses fuzzy logic for calculating the fatigue but needs to apply artificial intelligence and deep learning techniques to preprocess the data before using the fuzzy inference system.
Testing was performed using a 5-fold cross-validation on 122 videos that have a duration of approximately 10 min per recording, which are provided by the UTA-RLDD database. The number of raised alarms was counted for each video, verifying in this way whether the system is reliable or not. Neither of the systems reported a satisfying performance, both of them obtaining an accuracy of around 65% over training data and over 60% on test data.
However, the second alternative, which combines deep learning with fuzzy logic, reported promising results. This system is able to work continuously without bothering the driver when he or she is not drowsy, since among the 60 videos of attentive drivers, there was only one video in which the system raised an alarm incorrectly (raising an unnecessary alarm only in 7% of the cases where the driver was actually alert). This way, the minimization of the false positive rate obtained is considered a success.
Its accuracy when correctly detecting the drowsiness of the driver, however, needs to be improved, because the system alerted the driver only in approximately 22 out of 61 videos where the subjects were drowsy (36% accuracy). This means that, although the conditions established for the fuzzy system are related to fatigue symptoms and can be used to detect fatigue, they do not represent all of the possible symptoms and thus cannot detect drowsiness on all videos.
Both systems have great potential, and multiple ways of improving them were identified and will be addressed in the future. Detecting drowsiness from images of the driver is a complex problem that even commercial automotive brands struggle with. Further investigation will be needed before completion, for which this work stands as a solid baseline to improve upon.

Author Contributions

Conceptualization, M.P.S.; methodology, J.M.A.-W. and A.S.; software, E.M.; validation, E.M. and A.S.; formal analysis, M.P.S.; investigation, M.P.S. and J.M.A.-W.; resources, A.S.; data curation, J.M.A.-W.; writing—original draft preparation, E.M. and J.M.A.-W.; writing—review and editing, M.P.S. and A.S.; visualization, E.M.; supervision, M.P.S. and A.S.; project administration, A.S.; funding acquisition, A.S. All authors have read and agreed to the published version of the manuscript.

Funding

This research received no external funding.

Institutional Review Board Statement

Not applicable.

Informed Consent Statement

Not applicable.

Data Availability Statement

The data supporting reported results can be found publicly available at (UTA-RLDD) https://sites.google.com/view/utarldd/home, accessed on 1 December 2021, (UTA-RLDD dataset [22], a dataset by Ghoddoosian et al.) and at (YawDD) https://ieee-dataport.org/open-access/yawdd-yawning-detection-dataset, accessed on 1 December 2021, (YawDD dataset [24], a dataset by Abtahi et al.).

Acknowledgments

This work was supported by the Spanish Government under projects PID2019-104793RB-C31, TRA2016-78886-C3-1-R, RTI2018-096036-B-C22, PEAVAUTO-CM-UC3M and by the Region of Madrid’s Excellence Program (EPUC3M17).

Conflicts of Interest

The authors declare no conflict of interest.

References

  1. Dinges, D.F. An overview of sleepiness and accidents. J. Sleep Res. 1995, 4, 4–14. [Google Scholar] [CrossRef]
  2. Dawson, D.; Reid, K. Fatigue, alcohol and performance impairment. Nature 1997, 388, 235. [Google Scholar] [CrossRef]
  3. Williamson, A.M.; Feyer, A.M.; Mattick, R.P.; Friswell, R.; Finlay-Brown, S. Developing measures of fatigue using an alcohol comparison to validate the effects of fatigue on performance. Accid. Anal. Prev. 2001, 33, 313–326. [Google Scholar] [CrossRef]
  4. Soares, S.; Monteiro, T.; Lobo, A.; Couto, A.; Cunha, L.; Ferreira, S. Analyzing Driver Drowsiness: From Causes to Effects. Sustainability 2020, 12, 1971. [Google Scholar] [CrossRef] [Green Version]
  5. Pouyanfar, S.; Sadiq, S.; Yan, Y.; Tian, H.; Tao, Y.; Reyes, M.P.; Shyu, M.L.; Chen, S.C.; Iyengar, S.S. A Survey on Deep Learning: Algorithms, Techniques, and Applications. ACM Comput. Surv. 2018, 51, 1–36. [Google Scholar] [CrossRef]
  6. Najafabadi, M.; Villanustre, F.; Khoshgoftaar, T.; Seliya, N.; Wald, R.; Muharemagic, E. Deep learning applications and challenges in big data analytics. J. Big Data 2015, 2, 1–21. [Google Scholar] [CrossRef] [Green Version]
  7. Krizhevsky, A.; Sutskever, I.; Hinton, G.E. ImageNet Classification with Deep Convolutional Neural Networks. Commun. ACM 2017, 60, 84–90. [Google Scholar] [CrossRef]
  8. Transfer Learning & Fine-Tuning. Available online: https://keras.io/guides/transfer_learning/ (accessed on 20 August 2021).
  9. Roy, A.M.; Bhaduri, J. A Deep Learning Enabled Multi-Class Plant Disease Detection Model Based on Computer Vision. AI 2021, 2, 413–428. [Google Scholar] [CrossRef]
  10. Zadeh, L. Fuzzy logic. Computer 1988, 21, 83–93. [Google Scholar] [CrossRef]
  11. Krajewski, J.; Sommer, D.; Trutschel, U.; Edwards, D.; Golz, M. Steering Wheel Behavior Based Estimation of Fatigue. In Proceedings of the Fifth International Driving Symposium on Human Factors in Driver Assessment, Training and Vehicle Design, Big Sky Resort, Big Sky, MT, USA, 22–25 June 2009; pp. 118–124. [Google Scholar] [CrossRef]
  12. Friedrichs, F.; Yang, B. Drowsiness monitoring by steering and lane data based features under real driving conditions. In Proceedings of the 2010 18th European Signal Processing Conference, Aalborg, Denmark, 23–27 August 2010; pp. 209–213. [Google Scholar]
  13. McDonald, A.D.; Schwarz, C.; Lee, J.D.; Brown, T.L. Real-Time Detection of Drowsiness Related Lane Departures Using Steering Wheel Angle. Proc. Hum. Factors Ergon. Soc. Annu. Meet. 2012, 56, 2201–2205. [Google Scholar] [CrossRef] [Green Version]
  14. Samiee, S.; Azadi, S.; Kazemi, R.; Nahvi, A.; Eichberger, A. Data Fusion to Develop a Driver Drowsiness Detection System with Robustness to Signal Loss. Sensors 2014, 14, 17832–17847. [Google Scholar] [CrossRef] [PubMed] [Green Version]
  15. Yang, J.H.; Mao, Z.H.; Tijerina, L.; Pilutti, T.; Coughlin, J.F.; Feron, E. Detection of Driver Fatigue Caused by Sleep Deprivation. IEEE Trans. Syst. Man Cybern.—Part A Syst. Hum. 2009, 39, 694–705. [Google Scholar] [CrossRef] [Green Version]
  16. Sommer, D.; Golz, M. Evaluation of PERCLOS based current fatigue monitoring technologies. In Proceedings of the 2010 Annual International Conference of the IEEE Engineering in Medicine and Biology, Buenos Aires, Argentina, 31 August–4 September 2010; pp. 4456–4459. [Google Scholar] [CrossRef]
  17. Gao, Y.; Wang, C. Fatigue state detection from multi-feature of eyes. In Proceedings of the 2017 4th International Conference on Systems and Informatics (ICSAI), Hangzhou, China, 11–13 November 2017; pp. 177–181. [Google Scholar] [CrossRef]
  18. Ma, X.; Chau, L.P.; Yap, K.H. Depth video-based two-stream convolutional neural networks for driver fatigue detection. In Proceedings of the 2017 International Conference on Orange Technologies (ICOT), Singapore, 8–10 December 2017; pp. 155–158. [Google Scholar] [CrossRef]
  19. Magán, E.; Ledezma, A.; Sesmero, P.; Sanchis, A. Fuzzy Alarm System based on Human-centered Approach. In Proceedings of the 6th International Conference on Vehicle Technology and Intelligent Transport Systems (VEHITS 2020), Prague, Czech Republic, 2–4 May 2020; pp. 448–455. [Google Scholar] [CrossRef]
  20. Azim, T.; Jaffar, M.A.; Mirza, A.M. Fully automated real time fatigue detection of drivers through Fuzzy Expert Systems. Appl. Soft Comput. 2014, 18, 25–38. [Google Scholar] [CrossRef]
  21. Bergasa, L.; Nuevo, J.; Sotelo, M.A.; Barea, R.; Guillén, M. Real-time system for monitoring driver vigilance. IEEE Trans. Intell. Transp. Syst. 2006, 7, 63–77. [Google Scholar] [CrossRef] [Green Version]
  22. Ghoddoosian, R.; Galib, M.; Athitsos, V. A Realistic Dataset and Baseline Temporal Model for Early Drowsiness Detection. In Proceedings of the IEEE Conference on Computer Vision and Pattern Recognition Workshops, Singapore, 8–10 December 2019. [Google Scholar]
  23. Tamanani, R.; Muresan, R.; Al-Dweik, A. Estimation of Driver Vigilance Status Using Real-Time Facial Expression and Deep Learning. IEEE Sens. Lett. 2021, 5, 1–4. [Google Scholar] [CrossRef]
  24. Abtahi, S.; Omidyeganeh, M.; Shirmohammadi, S.; Hariri, B. YawDD: Yawning Detection Dataset. IEEE DataPort 2020. [Google Scholar] [CrossRef]
  25. Lorente, M.P.S.; Lopez, E.M.; Florez, L.A.; Espino, A.L.; Martínez, J.A.I.; de Mi-guel, A.S. Explaining Deep Learning-Based Driver Models. Appl. Sci. 2021, 11, 3321. [Google Scholar] [CrossRef]
  26. Sipele, O.; Zamora, V.; Ledezma, A.; Sanchis, A.c. Advanced Driver’s Alarms System through Multi-agent Paradigm. In Proceedings of the 2018 3rd IEEE International Conference on Intelligent Transportation Engineering (ICITE), Singapore, 3–5 September 2018; pp. 269–275. [Google Scholar] [CrossRef]
  27. Schiffman, H.R. Sensation and Perception: An Integrated Approach, 3rd ed.; John Wiley & Sons: Oxford, UK, 1990. [Google Scholar]
  28. King, D.E. Dlib-ml: A Machine Learning Toolkit. J. Mach. Learn. Res. 2009, 10, 1755–1758. [Google Scholar]
  29. Dalal, N.; Triggs, B. Histograms of oriented gradients for human detection. In Proceedings of the 2005 IEEE Computer Society Conference on Computer Vision and Pattern Recognition (CVPR’05), San Diego, CA, USA, 20–26 June 2005; Volume 1, pp. 886–893. [Google Scholar] [CrossRef] [Green Version]
  30. Tan, M.; Le, Q.V. EfficientNet: Rethinking Model Scaling for Convolutional Neural Networks. arXiv 2019, arXiv:1905.11946. [Google Scholar]
  31. Deng, J.; Dong, W.; Socher, R.; Li, L.J.; Li, K.; Fei-Fei, L. ImageNet: A large-scale hierarchical image database. In Proceedings of the 2009 IEEE Conference on Computer Vision and Pattern Recognition, Miami, FL, USA, 20–25 June 2009; pp. 248–255. [Google Scholar] [CrossRef] [Green Version]
  32. Kazemi, V.; Sullivan, J. One millisecond face alignment with an ensemble of regression trees. In Proceedings of the 2014 IEEE Conference on Computer Vision and Pattern Recognition, Columbus, OH, USA, 23–28 June 2014; pp. 1867–1874. [Google Scholar] [CrossRef] [Green Version]
  33. Soukupová, T.; Cech, J. Eye-Blink Detection Using Facial Landmarks. In Proceedings of the 21st Computer Vision Winter Workshop, Rimske Toplice, Slovenia, 3–5 February 2016; pp. 22–29. [Google Scholar]
  34. Mamdani, E.; Assilian, S. An experiment in linguistic synthesis with a fuzzy logic controller. Int. J. Man-Mach. Stud. 1975, 7, 1–13. [Google Scholar] [CrossRef]
  35. Leekwijck, W.V.; Kerre, E.E. Defuzzification: Criteria and classification. Fuzzy Sets Syst. 1999, 108, 159–178. [Google Scholar] [CrossRef]
  36. Yassine, N. Artificial Intelligence Techniques for Driver Fatigue Detection. Ph.D. Thesis, Oxford Brookes University, Oxford, UK, 2020. [Google Scholar]
  37. Adhinata, F.D.; Rakhmadani, D.P.; Wijayanto, D. Fatigue Detection on Face Image Using FaceNet Algorithm and K-Nearest Neighbor Classifier. J. Inf. Syst. Eng. Bus. Intell. 2021, 7, 22–30. [Google Scholar] [CrossRef]
  38. Nasri, I.; Karrouchi, M.; Snoussi, H.; Kassmi, K.; Messaoudi, A. Detection and Prediction of Driver Drowsiness for the Prevention of Road Accidents Using Deep Neural Networks Techniques. In Proceedings of the 6th International Conference onWireless Technologies, Embedded, and Intelligent Systems (WITS 2020), Fez, Morocco, 14–16 October 2020; pp. 57–64. [Google Scholar]
  39. Lecun, Y.; Bottou, L.; Bengio, Y.; Haffner, P. Gradient-Based Learning Applied to Document Recognition. Proc. IEEE 1998, 86, 2278–2324. [Google Scholar] [CrossRef] [Green Version]
  40. Liu, P.; Chi, H.L.; Li, X.; Guo, J. Effects of dataset characteristics on the performance of fatigue detection for crane operators using hybrid deep neural networks. Autom. Constr. 2021, 132, 103901. [Google Scholar] [CrossRef]
  41. Khan, F.; Islam, R. Drowsiness Driver Detection Using Neural Network on UTA-RLDD Dataset. Available online: https://github.com/kokfahad/Drowsiness-Driver-Detection---Fahad (accessed on 1 December 2021).
  42. Singh, H.K.; Kuusik, A.B.R. Evaluation of Driver Status Assessment System Based on Deep Learning. Ph.D. Thesis, Tallinn University of Technology, Tallinn, Estonia, 2020. [Google Scholar]
  43. Reddy, B.; Kim, Y.H.; Yun, S.; Seo, C.; Jang, J. Real-Time Driver Drowsiness Detection for Embedded System Using Model Compression of Deep Neural Networks. In Proceedings of the 2017 IEEE Conference on Computer Vision and Pattern Recognition Workshops (CVPRW), Honolulu, HI, USA, 21–26 July 2017; pp. 438–445. [Google Scholar] [CrossRef]
  44. Schroff, F.; Kalenichenko, D.; Philbin, J. FaceNet: A Unified Embedding for Face Recognition and Clustering. In Proceedings of the IEEE Computer Society Conference on Computer Vision and Pattern Recognition, Boston, MA, USA, 7–12 June 2015; pp. 815–823. [Google Scholar] [CrossRef] [Green Version]
  45. Parkhi, O.M.; Vedaldi, A.; Zisserman, A. Deep Face Recognition. In Proceedings of the British Machine Vision Conference, Swansea, UK, 7–10 September 2015. [Google Scholar]
  46. van den Oord, A.; Dieleman, S.; Zen, H.; Simonyan, K.; Vinyals, O.; Graves, A.; Kalchbrenner, N.; Senior, A.; Kavukcuoglu, K. WaveNet: A Generative Model for Raw Audio. arXiv 2016, arXiv:1609.03499. [Google Scholar]
  47. Abusharha, A.A. Changes in blink rate and ocular symptoms during different reading tasks. Clin. Optom. 2017, 9, 133–138. [Google Scholar] [CrossRef] [Green Version]
Figure 1. System overview.
Applsci 12 01145 g001
Figure 2. Alternative I overview.
Applsci 12 01145 g002
Figure 3. Preprocessing of the driver’s face.
Applsci 12 01145 g003
Figure 4. EfficientNetB0’s architecture overview.
Applsci 12 01145 g004
Figure 5. Architecture of the model used for drowsiness estimation.
Applsci 12 01145 g005
Figure 6. Alternative II overview.
Applsci 12 01145 g006
Figure 7. (left) Face detected by DLIB’s face detection algorithm. (right) Landmarks detected by DLIB’s landmark detection algorithm.
Applsci 12 01145 g007
Figure 8. Architecture of the model used for yawning detection.
Applsci 12 01145 g008
Figure 9. Fuzzy sets and membership functions of variable “blinks”.
Applsci 12 01145 g009
Figure 10. Defuzzification example.
Applsci 12 01145 g010
Figure 11. Accuracy obtained by Alternative I over training data. Minimun value is colored red. Median value is colored yellow. Maximum value is colored green. All other cells are colored proportionally. The best value is shown in bold.
Applsci 12 01145 g011
Figure 12. Accuracy obtained by Alternative II over training data. Minimun value is colored red. Median value is colored yellow. Maximum value is colored green. All other cells are colored proportionally. The best (max. accuracy with min. false positives) values are shown in bold.
Applsci 12 01145 g012
Figure 13. (left) Frame of subject 60’s awake video. (right) Landmark detection of the frame.
Applsci 12 01145 g013
Figure 14. (left) Frame of subject 60’s drowsy video. (right) Landmark detection of the frame.
Applsci 12 01145 g014
Table 1. Inputs FIS.
Variable NameFuzzy Sets
NameMembership Function
No. of blinks ( b l i n k s )low t r i ( 0 , 0 , 10 )
normal t r i ( 0 , 10 , 20 )
high t r a p ( 10 , 20 , 50 , 50 )
Average duration of blinks, in seconds ( a v g _ b l i n k )low t r a p ( 0 , 0 , 0.10 , 0.30 )
normal t r a p ( 0.10 , 0.30 , 0.40 , 0.60 )
high t r a p ( 0.40 , 0.60 , 30 , 30 )
Number of microsleeps ( m i c r o s l e e p s )low t r i ( 0 , 0 , 2 )
high t r a p ( 1 , 3 , 10 , 10 )
Number of yawns ( y a w n s )low t r i ( 0 , 0 , 2 )
high t r a p ( 0 , 2 , 10 , 10 )
Seconds spent yawning ( a v g _ y a w n )low t r i ( 0 , 0 , 10 )
high t r i ( 0 , 10 , 30 , 30 )
Table 2. Output FIS.
Variable NameFuzzy Sets
NameMembership Function
Drowsiness ( d r o w s i n e s s )low t r i ( 0 , 0 , 0.5 )
medium t r i ( 0 , 0.5 , 1 )
high t r i ( 0.5 , 1 , 1 )
Table 3. Rules FIS.
Table 3. Rules FIS.
Rule NumberRule Description
IFTHEN
1( a v g _ b l i n k is high) and ( y a w n s is low) d r o w s i n e s s is medium
2( a v g _ b l i n k is high) and ( y a w n s is high) d r o w s i n e s s is high
3( b l i n k s is high) and ( a v g _ b l i n k is low) d r o w s i n e s s is medium
4( b l i n k s is high) and ( a v g _ b l i n k is normal or a v g _ b l i n k is high) d r o w s i n e s s is high
5( m i c r o s l e e p s is high) d r o w s i n e s s is high
6( y a w n s is low) and ( a v g _ y a w n is low) d r o w s i n e s s is low
7( y a w n s is low) and ( a v g _ y a w n is high) d r o w s i n e s s is medium
8( y a w n s is high) and ( a v g _ y a w n is low) d r o w s i n e s s is medium
9( y a w n s is high) and ( a v g _ y a w n is high) d r o w s i n e s s is high
10( b l i n k s is normal) and ( a v g _ b l i n k is normal) and ( m i c r o s l e e p s is low) d r o w s i n e s s is low
11( b l i n k s is low) and ( a v g _ b l i n k is low) and ( m i c r o s l e e p s is low) d r o w s i n e s s is low
Table 4. Results obtained by Alternative I when using the system over the test data with the best combination of d r o w s i n e s s _ t h r e s h o l d and m i n _ t i m e .
Drowsiness ThresholdMinimum TimeFPFNTNTPTotal Accuracy
0.651565680.56
Table 5. Cross-validation of the results obtained by Alternative I over train data.
Cross-Validation ExperimentDrowsiness ThresholdMinimum TimeFPFNTNTPTotal Accuracy
10.6515171131380.71
20.6010192029300.60
30.5055222226270.55
40.5010261222380.61
50.501023246180.65
Average--17.219.430.830.20.62
Table 6. Cross-validation of the results obtained by Alternative I over test data.
Cross-Validation ExperimentDrowsiness ThresholdMinimum TimeFPFNTNTPTotal Accuracy
10.651565680.56
20.6010310920.46
30.505595380.62
40.501044880.67
50.50102111010.46
Average--4.877.25.40.554
Table 7. Best results obtained by Alternative II when using the system over the training data.
Drowsiness ThresholdMinimum TimeFPFNTNTPTotal Accuracy
0.451032745220.69
0.451532745220.69
0.455012947200.69
0.455512947200.69
0.501003048190.69
0.501503048190.69
Table 8. Results obtained by Alternative II when using the system over the test data with the best combination of d r o w s i n e s s _ t h r e s h o l d and m i n _ t i m e .
Drowsiness ThresholdMinimum TimeFPFNTNTPTotal Accuracy
0.50101111120.52
0.50151111120.52
Table 9. Cross validation of the results obtained by Alternative II over train data.
Cross-Validation ExperimentDrowsiness ThresholdMinimum TimeFPFNTNTPTotal Accuracy
10.5010–1503048190.69
20.5010–1513447160.64
30.4510–1523146180.66
40.5010–1513347170.65
50.4550–5513247180.66
Average--1324717.60.66
Table 10. Cross validation of the results obtained by Alternative II over test data.
Cross-Validation ExperimentDrowsiness ThresholdMinimum TimeFPFNTNTPTotal Accuracy
10.5010–151111120.52
20.5010–15071250.71
30.4510–15271060.64
40.5010–15081240.67
50.4550–55181140.63
Average--0.88.211.24.20.63
Table 11. Comparison of results obtained by systems that predict fatigue over UTA-RLDD dataset.
ModelOverall Accuracy (Test)Awake Videos AccuracyLow-Vigilant AccuracyDrowsy Videos AccuracyMethodologyReferenceExperimentation Notes
Our approach: Alternative I0.550.60N/A0.45Videos-5-fold cross-validation
Our approach: Alternative II0.630.93N/A0.35
HM-LSTM network0.650.810.320.82Videos[22]5-fold cross-validation
LSTM network0.61---
Fully connected layers0.57---
Human judgment0.580.630.450.65
2-stream DNN0.63-N/A-Frames[23]5-fold cross-validation (152 sleepy samples, 151 vigilant samples per fold)
CNN (LeNet)0.92-N/A-
CNN (5 conv. layers)0.690.44N/A0.90Frames[36]5-fold cross-validation
FaceNet + SVM0.90---Frames[37]Train: 1000 samples for each class Validation: 100 samples
FaceNet + KNN0.95---
CNN (LeNet)0.96-N/A-Frames[38]28/60 participants Dataset: 101,793 samples
CNN and LSTM (frame segment level)0.43---Frames[40]70% train, 30% test Dataset is relabelled with every frame and minute as segment units using Karolinska Sleepiness Scale (KSS)
CNN and LSTM (minute segment level)0.55---Video
LSTM0.640.40N/A0.88Frames[41]A new dataset is created by merging data of all participants 75% train, 25% test
CNN0.720.63N/A0.80
Deep Learning (LSTM)0.630.52N/A0.70Frames[42]16/60 participants 74% train, 26% test 10 cv to find the best-performed model, which is used for testing. Test: 1591 frames
Publisher’s Note: MDPI stays neutral with regard to jurisdictional claims in published maps and institutional affiliations.

