Article

Assessment of the Ecotoxicity of Ag, Bi, Te and Tl According to the Biological Indicators of Haplic Chernozem

Department of Ecology and Nature Management, Southern Federal University, Rostov-on-Don 344090, Russia
*
Author to whom correspondence should be addressed.
Appl. Sci. 2022, 12(24), 12854; https://doi.org/10.3390/app122412854
Submission received: 8 November 2022 / Revised: 3 December 2022 / Accepted: 12 December 2022 / Published: 14 December 2022
(This article belongs to the Special Issue Advances in Heavy Metal Pollution in the Environment)

Abstract

:
Soil contamination with such rare heavy metals as silver (Ag), bismuth (Bi), tellurium (Te), and thallium (Tl) leads to disruption of its agricultural and ecological functions. Each of these rare heavy metals has a different level of soil toxicity, which affects the ecological state of the soil and its recovery degree estimated by biological indicators. The work objective is to assess the ecotoxicity of oxides and nitrates of silver, bismuth, tellurium, and thallium by biological indicators of Haplic Chernozem. Under the conditions of a laboratory simulation experiment, silver, bismuth, tellurium, and thallium were introduced into the samples of soil. The ecological state of the soil for each incubation period was assessed by the activity of soil enzymes (catalase and dehydrogenases), the intensity of seed development in polluted soil (the length of shoots and roots of winter wheat), and microbiological indicators (the total number of bacteria and Azotobacter sp. abundance). For 90 days, when contaminated with oxides of silver, bismuth, tellurium, and thallium, the most sensitive biological indicator was the length of wheat roots; when contaminated with nitrates, the total number of bacteria was the most sensitive biological indicator. The most informative biological indicator for contamination with both chemical forms of rare elements (silver, bismuth, tellurium, and thallium) was the Azotobacter sp. abundance. The most ecotoxic elements among those studied were thallium and tellurium, both in the form of oxides and nitrates. The results of the study may be useful for biomonitoring and diagnostics of the state of soils contaminated with silver, bismuth, tellurium, and thallium.

1. Introduction

Sustainable functioning of natural and anthropogenic ecosystems includes an assessment of the soil ecological state that meets the requirements of FAO [1,2,3]. This balance affects the performance of ecological and agricultural functions by the soil. Such soil functions are particularly sensitive when polluted with heavy metals [4,5]. Sources of soil pollution with heavy metals because of anthropogenic activities are the burning of fossil fuels for electricity production, operation of metallurgical, oil refining, and cement plants, mining and ore processing, the use of bottom sediments as fertilizers, and the use of pesticides. It is because of such activities that such elements as silver (Ag), bismuth (Bi), tellurium (Te), and thallium (Tl) enter the environment [6,7,8]. The result of silver, bismuth, tellurium, and thallium entry into the environment is the accumulation of increased concentrations of elements in soils. At the same time, silver content varies from 8 to 35.9 mg/kg [9,10], and in ore mining sites up to 7000 mg/kg [11]. The range of bismuth concentrations in soil is from 0.15 to 1891 mg/kg [12,13], thallium–7 mg/kg [14,15], 19 mg/kg [16], and near coal mines up to 20,000 mg/kg [17]. The recorded tellurium content is from 0.166 to 11 mg/kg [7,18], and near ore deposits it is up to 290 mg [19].
The presence of high concentrations of silver, bismuth, tellurium, and thallium in the soil has a direct effect on the activity of soil enzymes, the abundance and diversity of soil bacteria, and plant growth and development. The effect of silver soil pollution has been studied on a wide range of biological indicators [20,21]: decrease of soil enzyme activity [22,23], reduction of plant root length [24], reduction of species diversity, and abundance of soil bacteria [25,26]. Under the influence of bismuth soil pollution, the activity of dehydrogenases in soil ecosystems is inhibited [27]. Some studies have noted the accumulation of silver [10], bismuth [28,29], tellurium [30,31], and thallium [32,33] in plants. Higher ecotoxicity of silver and thallium for plants was revealed compared to bismuth [29]. Ecotoxicity of tellurium for microorganisms begins at low concentrations in the order of 1 mg/kg [34], nevertheless, it is tellurium that has been least studied and almost all studies have been conducted in vitro. According to the authors, with sufficiently high antibacterial activity [35], tellurium is less toxic than silver [36]. Separate studies have been conducted to assess silver ecotoxicity [37,38,39], bismuth [40,41], tellurium [42], and thallium [43] on the quantitative content of soil bacteria, changes in the activity of soil enzymes and indicators of the intensity of initial growth and development of seeds. Previously, the activity of seven enzymes was studied in silver, bismuth, tellurium, and thallium contamination [44]. However, a comprehensive study on the comparative assessment of the ecotoxicity of silver, bismuth, tellurium, and thallium based on the spectrum of informative and sensitive biological indicators of soils was conducted for the first time.
Haplic Chernozem is a common type of soil in Europe [45,46,47]. Thermal power plants operating on coal and to some extent on fuel oil. For example, in the south of Russia, Novocherkassk Power Station is a source of pollution of chernozems [48,49]. Emissions from power plants include products from the incomplete combustion of coal including heavy metals like silver, bismuth, tellurium, and thallium. Trace elements bound in coal are released and redistributed into bottom ash, fly ash, and gas phase during combustion [50,51]. Heavy metals (HM) are 0.1–1.0 µm in size; they are adsorbed on large soot particles and transported by air over long distances from the emission source, forming technogenic anomalies. As well as sources of pollution of Haplic Chernozem are storage, processing and disposal of industrial and municipal waste, pesticides, fertilizers, wastewater, operation of road and rail transport, metal, and oil refineries [7,18].
During the scientific research, the following scientific hypothesis was proposed: the ecotoxicity of silver, bismuth, tellurium, and thallium estimated by biological indicators of Haplic Chernozem depends on the form of metal chemical compound (oxide and nitrate), on metal concentration (0.5–30 PPC), and on the duration of contamination (10, 30, 90 days). The lower the concentration of metal in the soil, the faster the restoration of informative and sensitive biological indicators of Haplic Chernozem occurs after 90 days.
The work objective is to assess the ecotoxicity of both chemical forms of silver, bismuth, tellurium, and thallium by biological indicators of Haplic Chernozem. Research objectives for the implementation of the goal are: (1) to assess the effect of pollution with both chemical forms of silver, bismuth, tellurium, and thallium on biological indicators; (2) to study the change in biological indicators of chernozem after contamination after 10, 30, and 90 days; (3) to establish the most sensitive and informative biological indicators for contamination with both chemical forms of silver, bismuth, tellurium, thallium; (4) to rank heavy metals by their ecotoxicity.

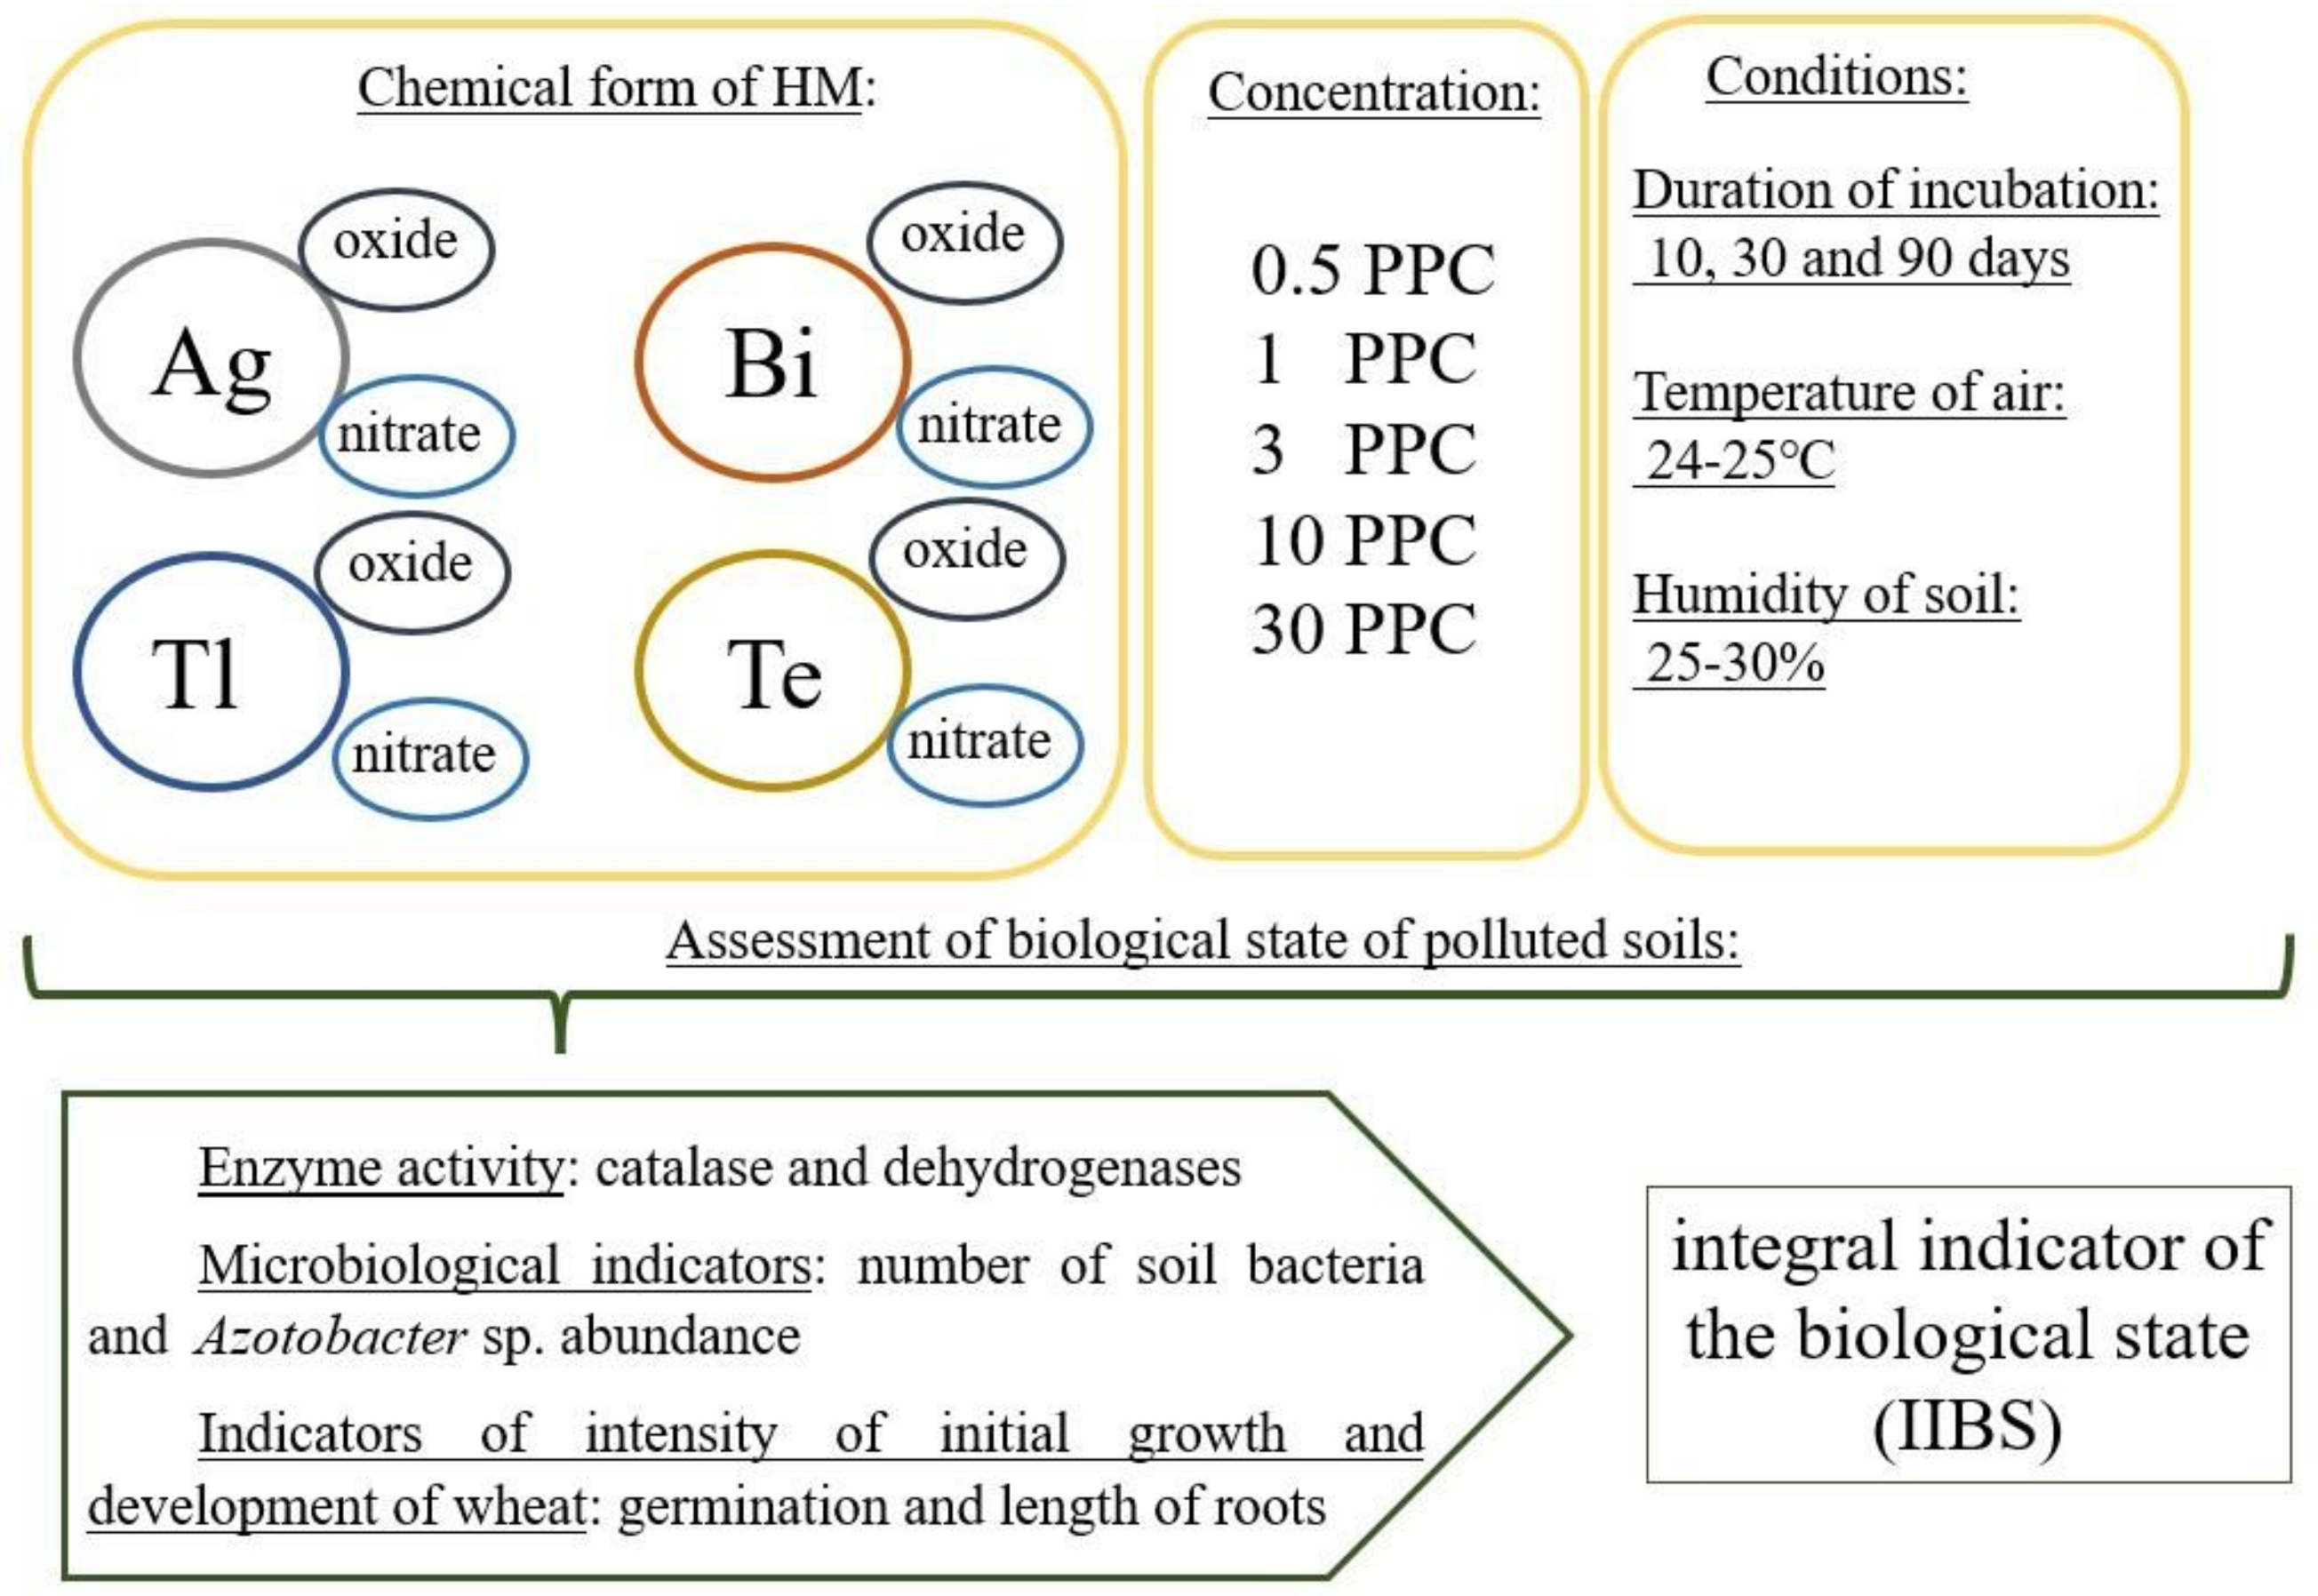
2. Materials and Methods

2.1. Study Object

The soil of the research area is Haplic Chernozem [52]. Haplic Chernozem is characterized by a heavy granulometric composition, high humus content (3.7%), and a neutral reaction of the medium (pH 7.8). Chernozems occupy significant areas in Eurasia: Hungary, Bulgaria, Austria, Czech Republic, Slovakia, the Balkan Peninsula, Moldova, Ukraine, Russia, Mongolia, and China [45,46]. In North America, the chernozem zone includes the western part of the United States and southern Canada. In South America, chernozems are observed in the south of Argentina and in the southern foothill regions of Chile. The areas of Russian chernozems make up 52% of the world’s chernozems. The main regions of the distribution of chernozems in Russia are the Central Black Earth region, the Volga region, the North Caucasus, the Southern Urals, and Western Siberia [53,54].

2.2. Heavy Metals

Both chemical forms of silver, bismuth, tellurium, and thallium were used for soil contamination. Silver was introduced into the soil in the form of oxide (Ag2O) and a silver nitrate solution (AgNO3). Bismuth was introduced into the soil in the form of oxide (Bi2O3) and a solution of bismuth nitrate (Bi(NO3)3). Tellurium was introduced into the soil in the form of oxide (TeO2) and a solution of tellurium nitrate (Te2O3(OH)NO3). Thallium was introduced into the soil in the form of oxide (Tl2O3) and a solution of thallium nitrate (Tl(NO3)3). In terms of the derived concentration of the element possible permissible concentrations (PPC) 0.5, 1, 3, 10, and 30 PPC of each element in the form of oxide and nitrate were introduced into the soil.

2.3. Simulation Experiment

Both chemical forms of silver, bismuth, tellurium, and thallium were added to the prepared soil samples in concentrations of 0.5, 1, 3, 10, and 30 PPC and thoroughly mixed. Incubation was carried out under pure soil-led conditions at a constant temperature (24–25 °C) and humidity (30%) for 10, 30, and 90 days. The scheme of the experiment is shown in Figure 1.

2.4. Physical and Chemical Properties

In clean soil (pure soil), before the introduction of silver, bismuth, tellurium, and thallium, the content of organic matter (in %) and the reaction of the soil medium (pH) were determined. The content of total organic matter was determined by the acid oxidation of potassium dichromate with a spectrophotometric finish [55]. Soil pH was measured using an electrode potentiometer in distillate water, in the ratio of 1 part soil to 2.5 parts of water (w/v).

2.5. Methods for Assessing Biological Activity

The biological activity of soils was assessed according to the methods described in Table 1. The use of these biological indicators makes it possible to assess the state of the soil under chemical pollution and determine the most informative and sensitive biological indicators [56,57,58,59].
In addition, given the high level of soil fertility, it is very important to evaluate the phytotoxic properties of the soil for plants growing in the same zone—winter wheat (Triticum aestivum L.) [61,62,63,64]. As a result of the determination of biological indicators, the integral indicator of the biological state (IIBS) was evaluated as an average to show the reflective response of all biological indicators to the state of the soil [4].

2.6. Statistical Processing

Statistical data processing was carried out using ANOVA analysis. Data were analyzed using analysis of variance followed by the determination of the least significant difference (LSD). Variation statistics (mean values, dispersion) were determined, and the reliability of different samples was established using dispersion analysis (Student’s t test). LSD was determined using Equation (1):
LSD = S d   ×   t S
where:
  • Sd = significant difference
  • ts = Student’s coefficient
The nonparametric Spearman’s correlation coefficient (for informativeness value) was calculated between the concentration of Ag, Bi, Te and Tl as an average of the biological indicators.

3. Results

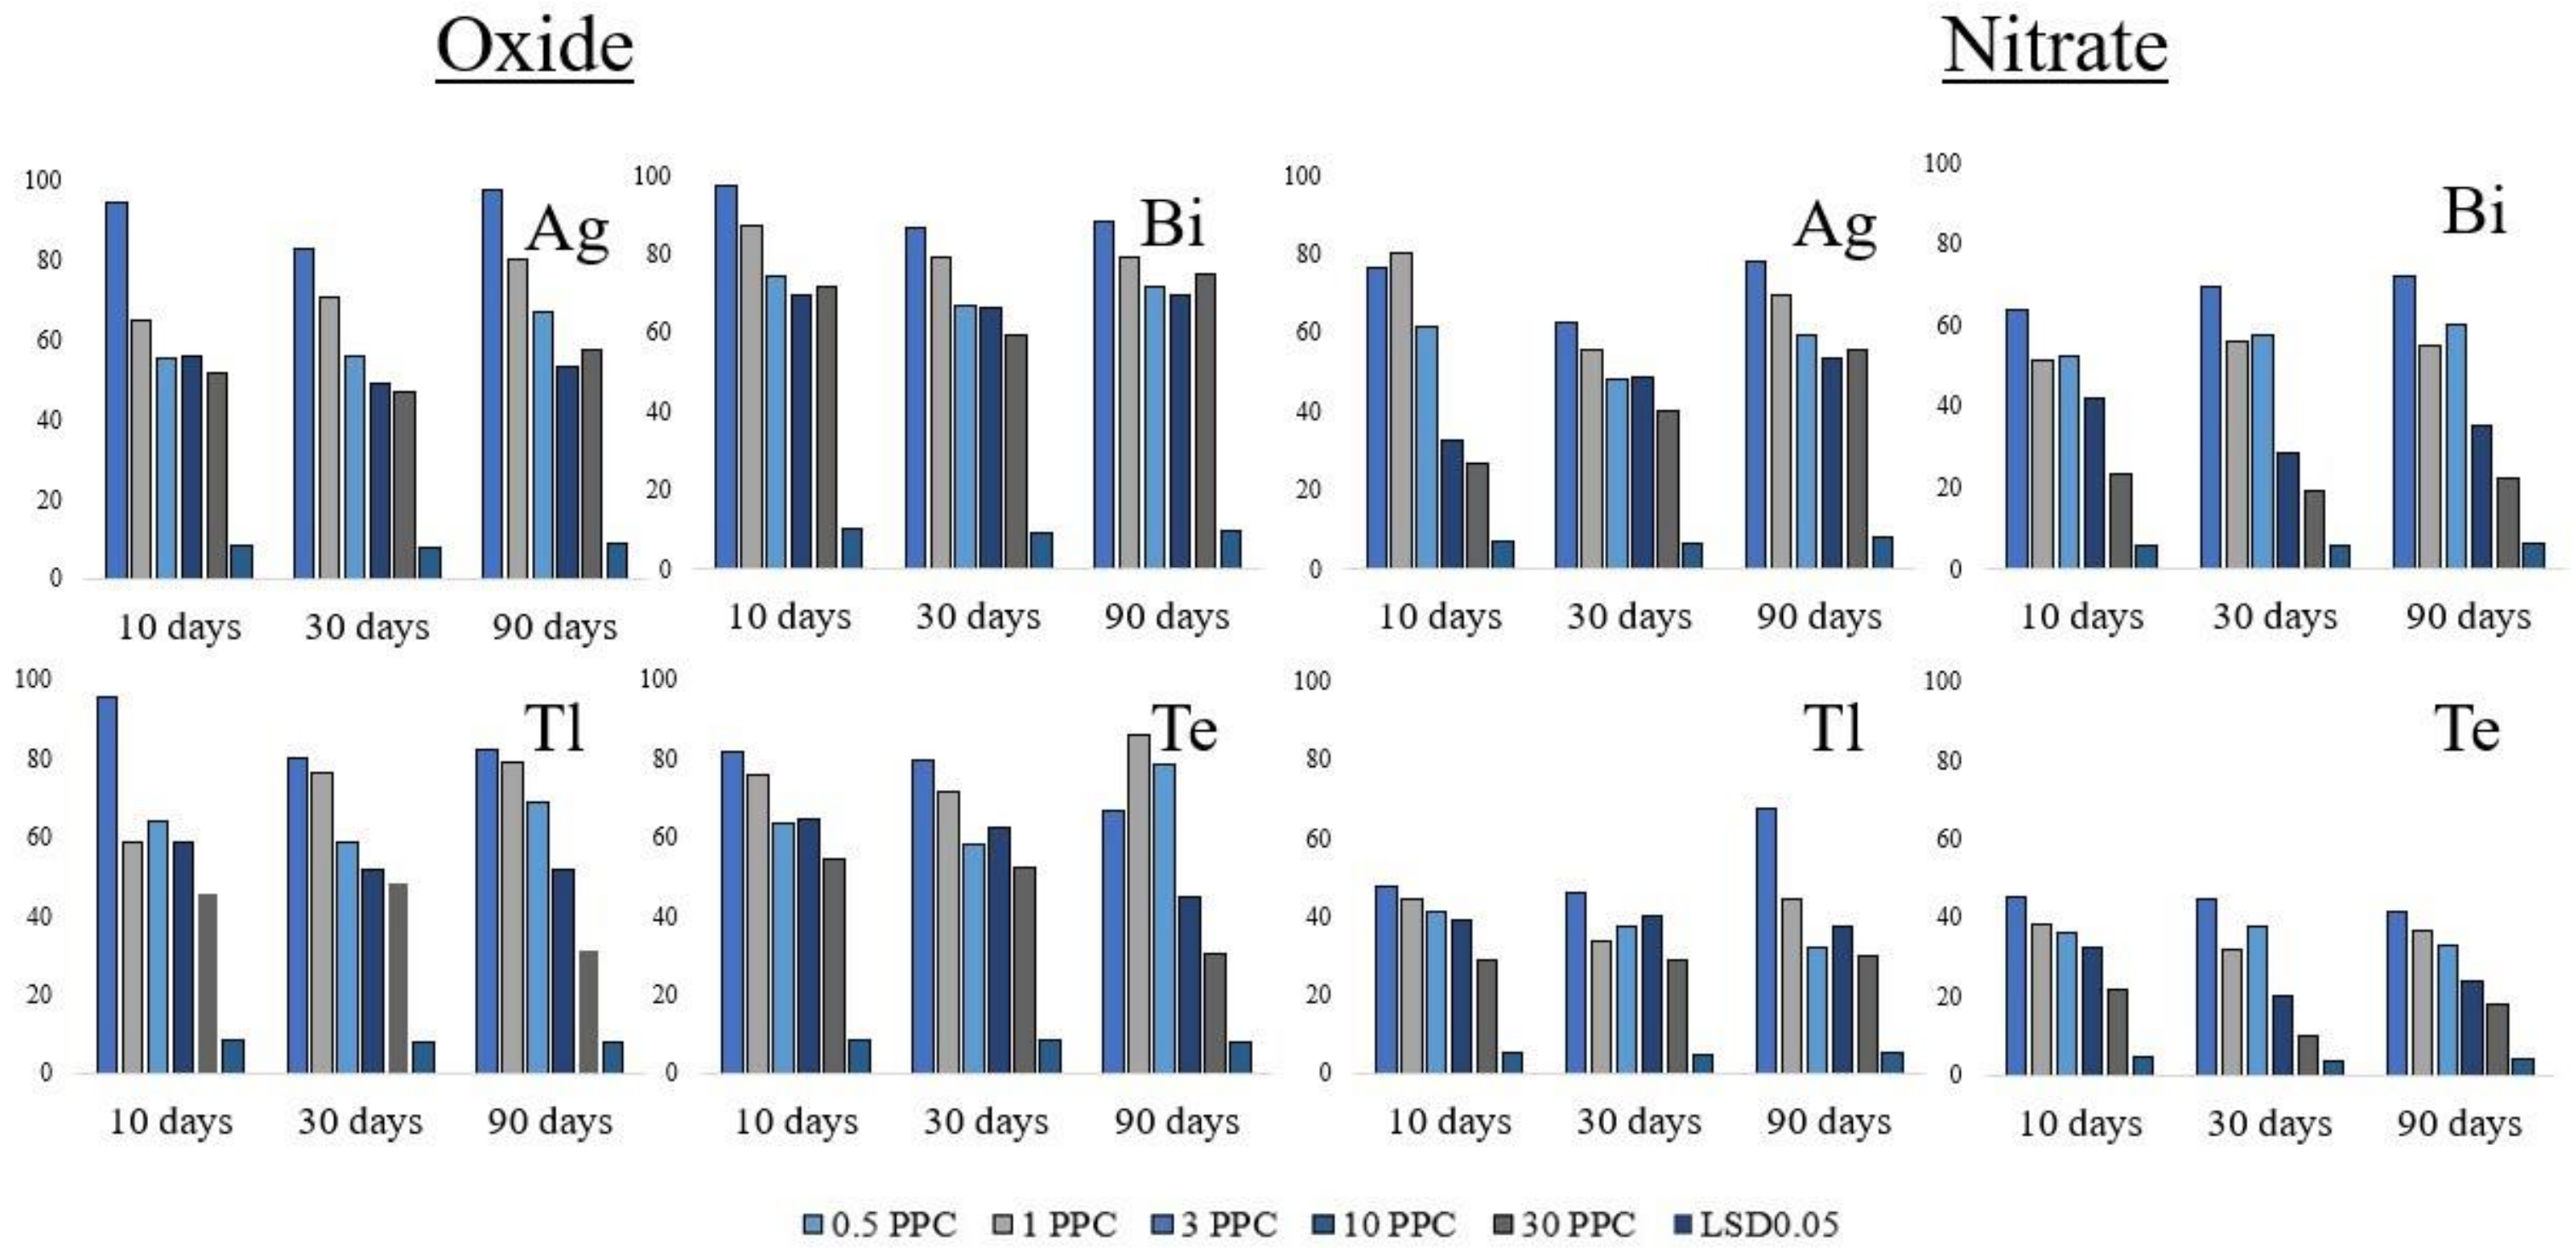
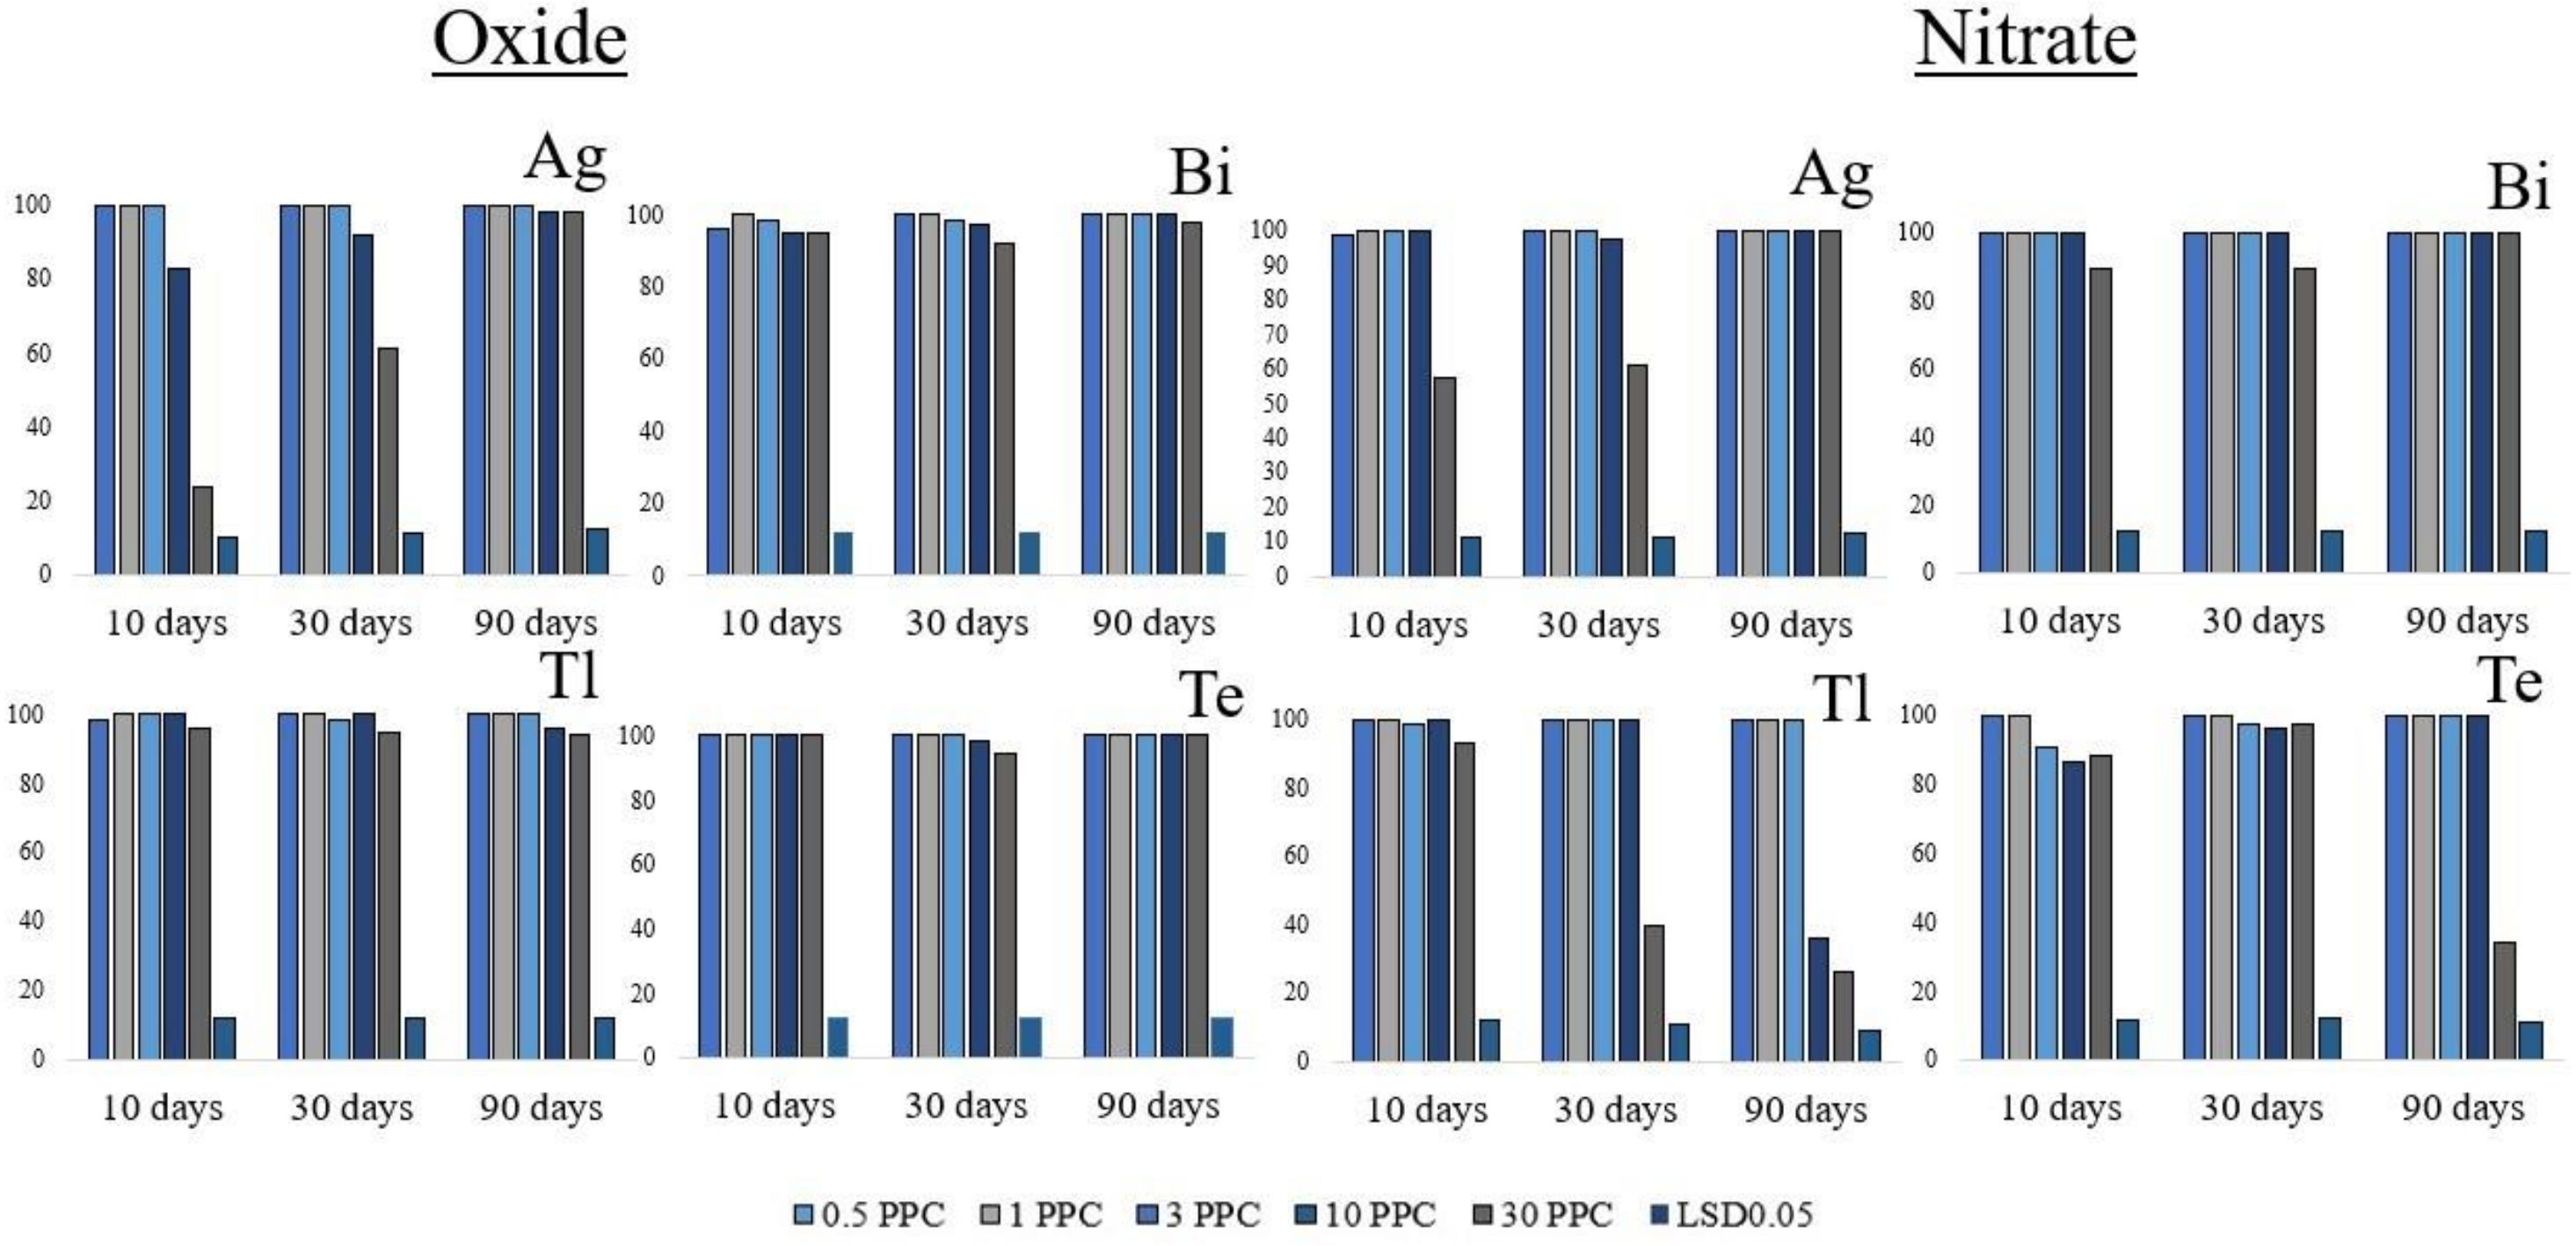
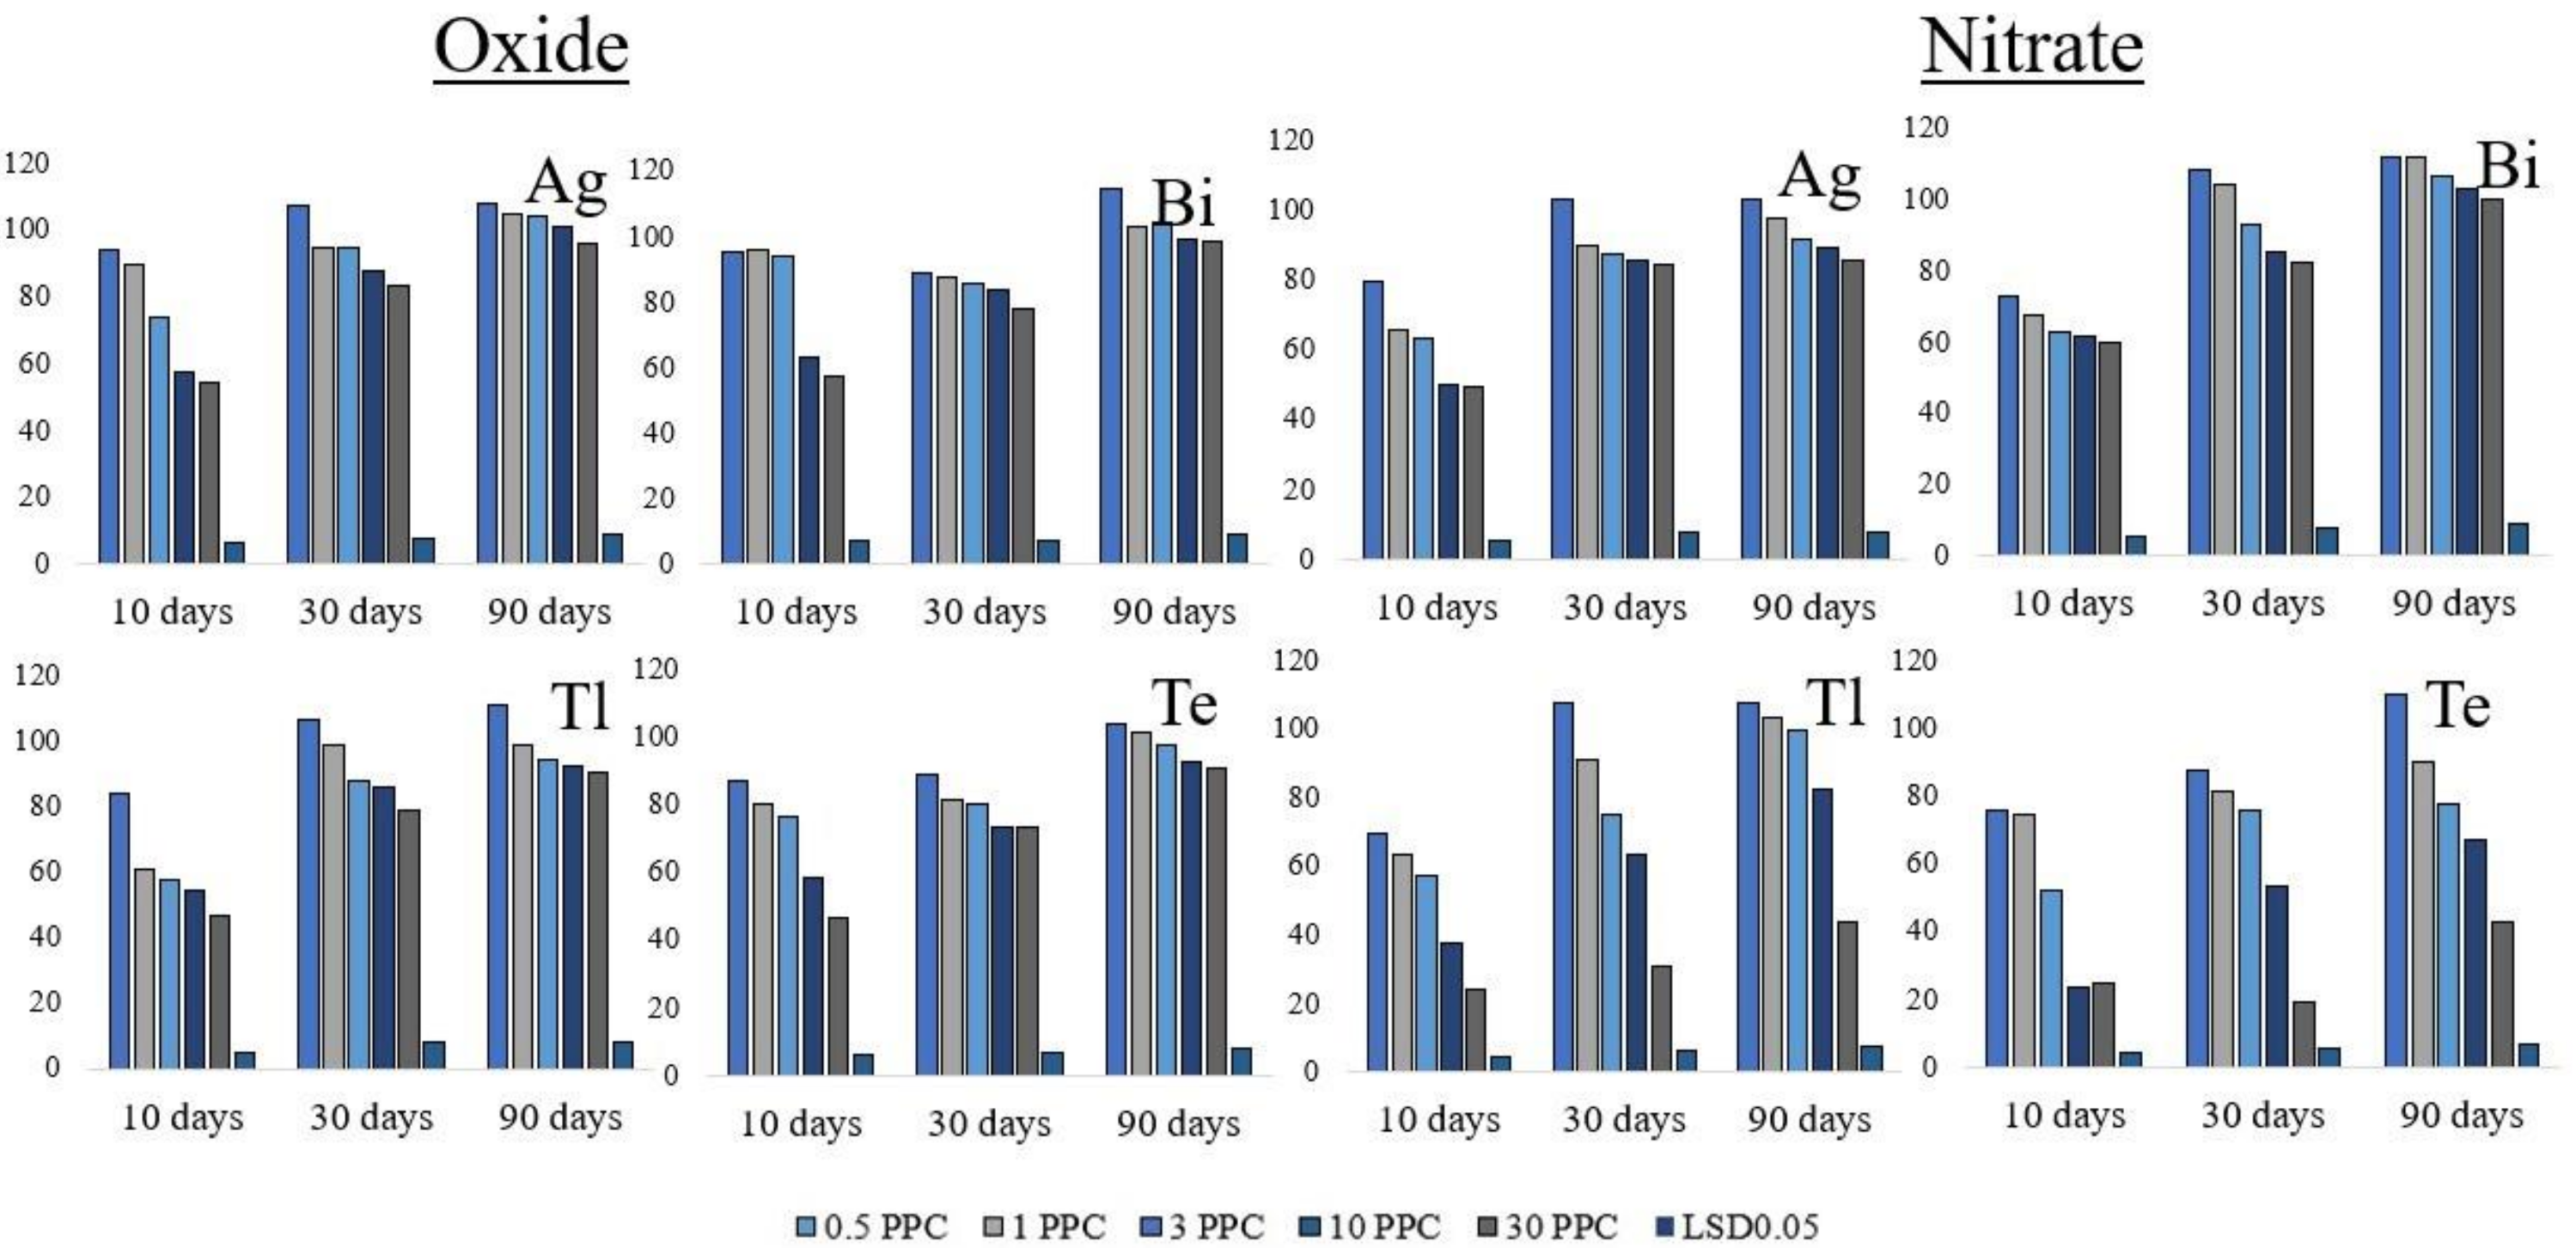
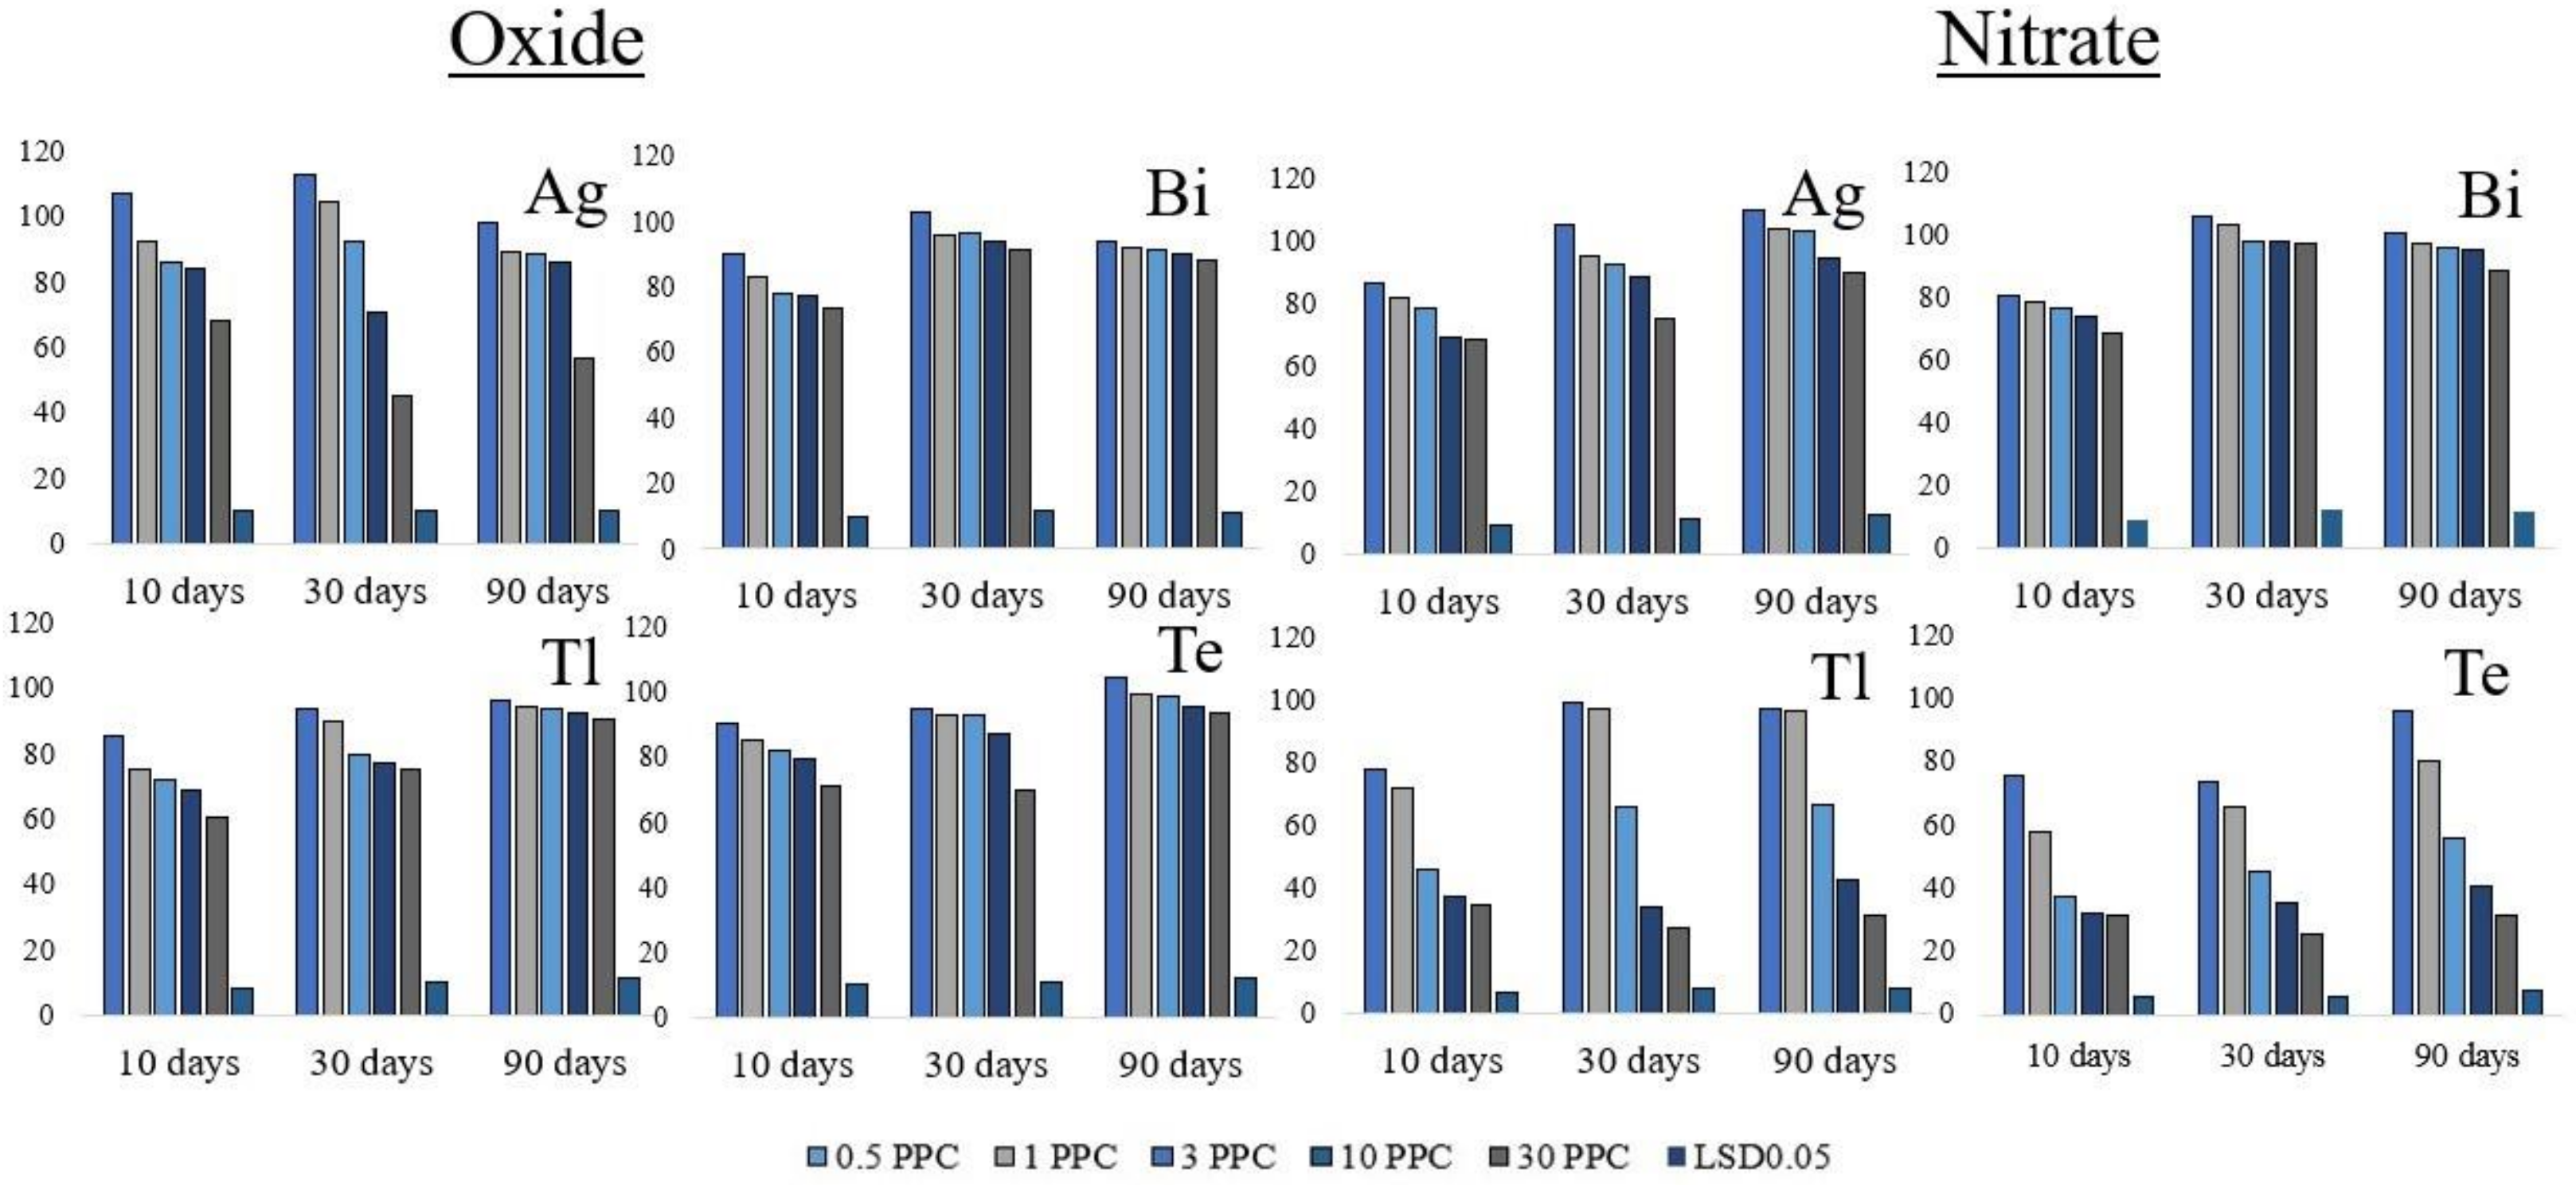
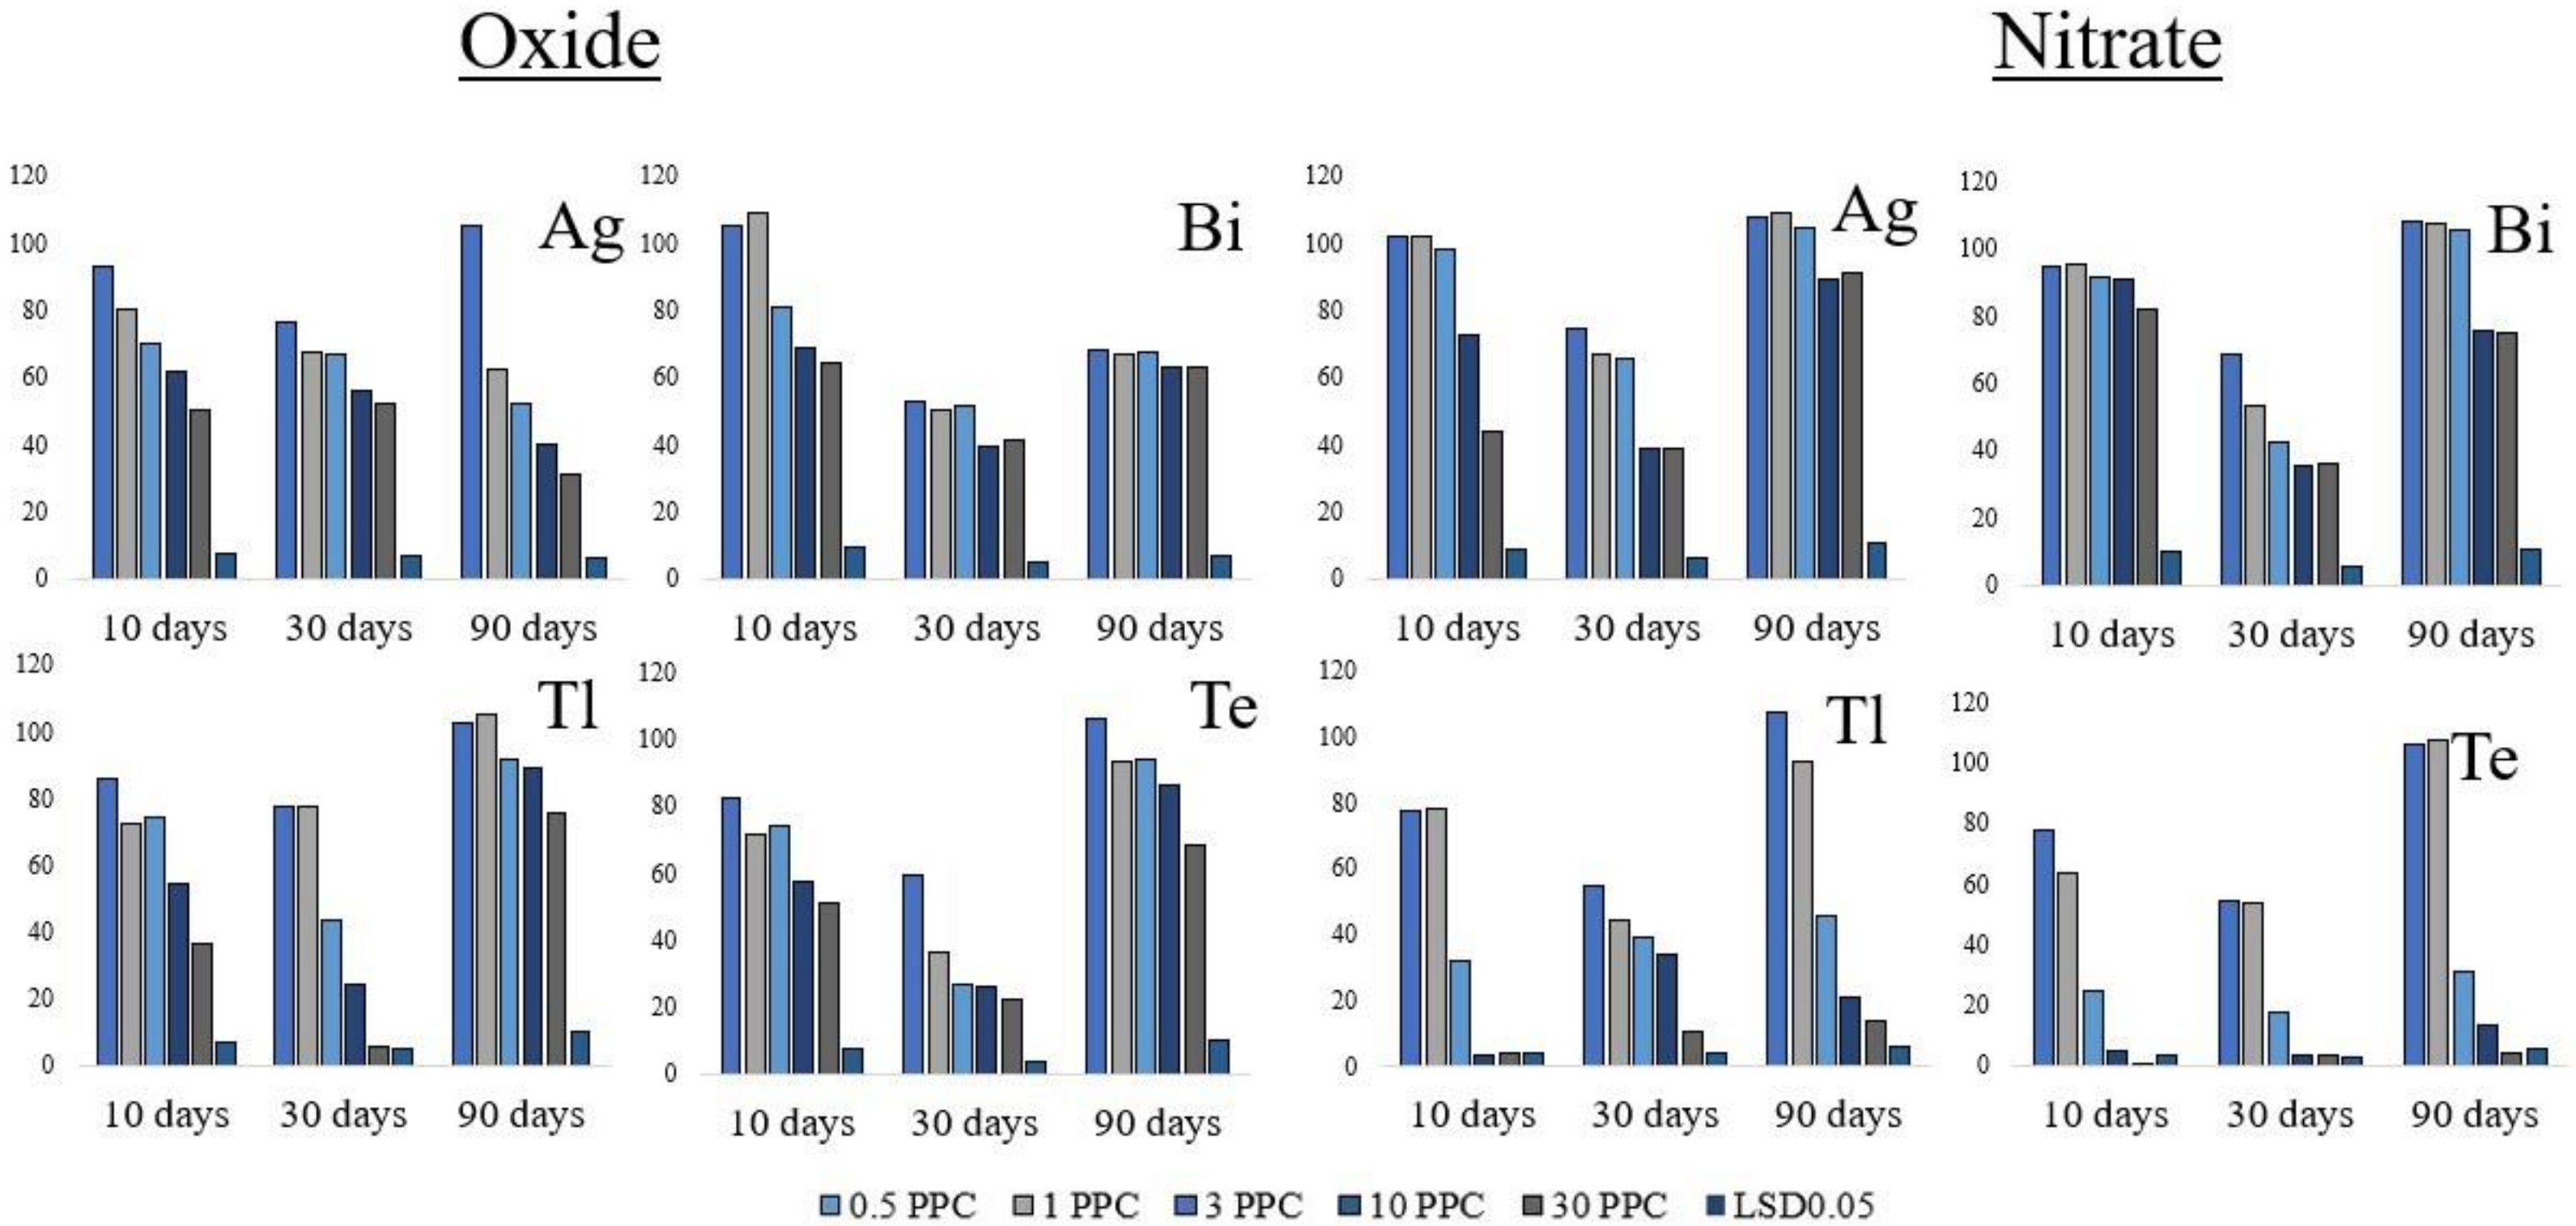
3.1. Microbiological Indicators

The total number of bacteria in the soil contaminated with silver oxide varied during the exposure period (Figure 2). At low concentrations (0.5–1 PPC), the number of bacteria decreased by 35, 29, and 20%. With an increase 3–30 PPC, the number of bacteria was inhibited by 44–53%. On the 30th day, an increase in soil toxicity in the number of bacteria was found, with a recovery on the 90th day by 5–11% compared to the 30th day.
Nitrate of silver, compared with oxide, had a more expressed toxic effect on the number of bacteria already at 0.5 PPC–24, 37, and 22% on the 10, 30, and 90th days. With an increase in the concentration of nitrate of silver 1–30 PPC, the decrease of the number of bacteria was 19–73% of the pure soil.
Bismuth oxide at 0.5 PPC on the 10th day had no effect on the number of bacteria. At the same time, on the 30 and 90th days, decrease at 0.5 PPC was 13 and 11%. Within 90 days, bismuth oxide 1–30 PPC inhibited the number of bacteria by 13–40%. Nitrate of bismuth at a concentration of 0.5 PPC was toxic by 30–36% of the pure soil. When the concentration was increased to 30 PPC, the toxicity increased by 44–71% of the pure soil. The toxicity of nitrates compared to oxides was 30–35%.
Thallium oxide at 0.5 PPC on the 30 and 90th days was toxic by 20 and 17%. Increasing the concentration 1–30 PPC increases the toxicity of thallium oxide by 24–69% relative to the pure soil. Nitrate of thallium at 0.5 PPC was very toxic on the 10th and 30th days by 52 and 54% relative to the pure soil. On the 90th day, the number of bacteria was restored by 22% compared to the 30th day.
Tellurium oxide at 0.5 PPC was toxic on the 10th day of the experiment already—18% lower than the pure soil. At the same time, on the 30th and 90th days, the number of bacteria decreased by 20 and 33%. Increasing the concentration of tellurium oxide by 1–30 PPC inhibited the number of bacteria by 14–69% relative to the pure soil. Nitrate of tellurium, as well as thallium nitrate, inhibited the number of bacteria by 54–58% already at 0.5 PPC. With an increase in the concentration of tellurium up to 30 PPC, the decrease of the number reached up to 90%.
The Azotobacter sp. abundance at low concentrations (0.5–3 PPC) of both chemical forms of silver, bismuth, tellurium, and thallium did not differ from the pure soil (Figure 3). Differences in decrease were found at concentrations 10 and 30 PPC. Silver oxide at 10 PPC on the 10 and 30th days inhibited the Azotobacter sp. abundance by 17 and 8%. On the 90th day, the Azotobacter sp. abundance was restored to the level of pure soil. The concentration of 30 PPC also inhibited the value of the indicator only on the 10 and 30th days, by 76 and 39% relative to the pure soil.
Nitrate of silver had a toxic effect on the Azotobacter sp. abundance only by 30 PPC on the 10 and 30th days of the experiment by reducing the indicator by 43 and 39% relative to the pure soil. On the 90th day, the indicator recovered to the level of pure soil.
Bismuth oxide did not have a significant effect on the Azotobacter sp. abundance at any concentration and for any duration of contamination. Nitrate of bismuth at 30 PPC 10–30 days inhibited the Azotobacter sp. abundance by 11 and 10%, relative to the pure soils. On the 90th day, the indicator recovered to the level of pure soil.
The oxides of thallium and tellurium had no effect on the Azotobacter sp. abundance in Haplic Chernozem. Thallium nitrate at 30 PPC on the 30th day inhibited the Azotobacter sp. abundance by 60%, and on the 90th day, 10 and 30 PPC of nitrate of tellurium decreased the Azotobacter sp. abundance by 64 and 74%. Thallium nitrate at 10 and 30 PPC decreased the Azotobacter sp. abundance on the 10th day by 13 and 12%, and at 30 PPC on the 90th day by 66% relative to the pure soil.

3.2. Enzymatic Activity

Silver oxide in small concentrations did not significantly differ from the pure soil (day 10) and caused weak stimulation of catalase activity (days 30 and 90) (Figure 4). With an increase in the concentration of silver oxide to 30 PPC, decrease was established only on the 10th day by 26–45%. On the 30th day, only at a concentration of 10 and 30 PPC, decrease of catalase activity was established by 12 and 16%. On the 90th day, regardless of the concentration of silver, catalase in soil did not differ from the pure soil and was stimulated.
Nitrate of silver on the 10th day caused decrease of enzymatic activity by 21%, and on the 30th and 90th days, it did not differ from the pure soil. On the 10th day, with an increase in the concentration 1–30 PPC of nitrate of silver, activity decrease was 34–51%. After 30 days of the experiment, 1–30 PPC inhibited catalase activity by only 10–16% relative to the pure soil. After another 60 days, catalase activity decreased 3–30 PPC of nitrate of silver by 8–14%.
Bismuth oxide at 0.5 PPC only on the 30th day caused decrease of enzymatic activity by 11%, and on the 90th had a stimulating effect (15% relative to the pure soil). On the 10th day, only in soil with 10 and 30 PPC of bismuth oxide, decrease of activity was found by 37 and 43%. On the 30th day, enzymatic activity at concentrations of 1–30 PPC varied in the range of 13–22% relative to the pure soil. On the 90th day, there were no significant differences from the pure soil.
Starting on the 10th day, nitrate of bismuth had an inhibitory effect on catalase activity 0.5–30 PPC by 27–40%. On the 30th day, activity was restored, and the process of its decrease was established with concentrations of 10 and 30 PPC by 14 and 18%. On the 90th day, activity stimulation at 0.5 and 1 PPC of nitrate of bismuth was established, and at 3–30 PPC, no significant differences from the pure soil were revealed.
Thallium oxide at 0.5 PPC on the 10th day inhibited catalase activity by 16% relative to the pure soil, and on the 30th and 90th days, activity stimulation of soil enzyme was established by 7 and 11%. At concentrations 1–30 PPC of thallium oxide on the 10th day, activity decrease was 39–54% relative to the pure soil. At the same time, on the 30th day, decrease was established in the concentration range 3–30 PPC–12–21%, and on the 90th day only at a concentration of 30 PPC by 10% relative to the pure soil. Nitrate of thallium at 0.5 PPC was highly toxic on the 10th day—30% below the pure soil, as well as with an increase in the nitrate concentration 1–30 PPC by 36–76% relative to the pure soil. On the 30th day, at a concentration of 3–30 PPC of nitrate of thallium, catalase activity was inhibited by 25–69% relative to the pure soil. On the 90th day, activity decrease was established at a concentration of 10 and 30 PPC of nitrate of thallium by 17 and 56%.
Tellurium oxide at 0.5 PPC inhibited catalase activity on the 10th and 30th days by 13 and 11% relative to the pure soil. On the 10th day, with an increase in the concentration 1–30 PPC of tellurium oxide, catalase activity decrease was 20–53%, and on the 30th day at the same concentrations, it was 19–27%. On the 90th day, catalase activity decrease was found only at 30 PPC 9% lower than the pure soil. Nitrate of tellurium at 0.5 PPC on the 10th and 30th days inhibited enzyme activity by 24 and 12%. With an increase in the concentration of nitrate of tellurium on the 10th day 1–30 PPC, catalase activity was inhibited by 25–75% relative to the pure soil, and on the 30th day at concentrations 1–30 PPC, it was inhibited by 19–80% lower than the pure soil. On the 90th day, nitrate of tellurium at 1–30 PPC caused decrease of enzyme activity by 10–57% relative to the pure soil.
The activity of dehydrogenases of soil when contaminated with silver oxide is shown in Figure 5. At low concentrations of silver oxide (0.5 and 1 PPC), dehydrogenases activity was stimulated on the 10th and 30th days by 7 and 13%. With an increase in silver oxide concentration 1–30 PPC, activity decrease was 7–42% relative to the pure soil.
On the 30th day, at a concentration of 3–30 PPC of silver oxide, decrease was 7–64% relative to the pure soil. On the 90th day, activity decrease was established with a concentration of 1–30 PPC by 11–43% relative to the pure soil. Nitrate of silver at 0.5 PPC inhibited dehydrogenases activity by 13% after 10 days. After 30 and 90 days at the same concentration, enzyme activity stimulation was established by 5 and 10%. When the concentration was increased 1–30 PPC after 10 days of the experiment, activity decrease was 18–32% relative to the pure soil. After 30 days, dehydrogenases activity decrease was established at 10 and 30 PPC of nitrate of silver by 11 and 25%. After 90 days, dehydrogenases activity decrease was established only at a maximum concentration of 30 PPC—10% lower than the pure soil.
Bismuth oxide at 0.5 PPC inhibited enzyme activity by 10% after 10 days. After 30 and 90 days, there was no significant difference in enzyme activity from the pure soil. With an increase in the concentration of bismuth oxide 1–30 PPC, activity decrease by 17–26% was established. After 30 days from the moment of contamination, decrease was established at a maximum concentration of bismuth oxide (30 PPC) 10% below the pure soil. After 90 days, decrease of dehydrogenase activity was established at concentrations of 10 and 30 PPC of bismuth oxide by 10 and 12%. Nitrate of bismuth at 0.5 PPC inhibited dehydrogenase activity by 19% after 10 days. After 30 and 90 days, at 0.5 PPC of nitrate of bismuth, dehydrogenase activity did not significantly differ from the pure soil. After 10 days, with an increase in the concentration of nitrate of bismuth 1–30 PPC, enzyme activity decreases by 21–31% were established. After 30 days at any concentration of nitrate of bismuth, there were no significant differences from the pure soil. After 90 days, activity decrease was detected only at 30 PPC of nitrate of bismuth, 11% lower than the pure soil.
Thallium oxide at 0.5 PPC inhibited dehydrogenase activity by 15% after 10 days of contamination. After 30 and 90 days, there was no significant difference in enzyme activity from the pure soil. After 10 days with an increase in the concentration of thallium oxide 1–30 PPC, the activity of dehydrogenases was inhibited by 23–39% relative to the pure soil. After 30 days from the moment of contamination with thallium oxide with concentrations of 1–30 PPC, dehydrogenases activity decrease after 90 days was established only at a concentration of 90 PPC by 9%. Nitrate of thallium at 0.5 PPC after 10 days of the experiment inhibited the activity of dehydrogenases by 22% relative to the pure soil value. After 30 and 90 days at 0.5 PPC of nitrate of thallium, there was no significant difference from the pure soil. With an increase in nitrate of thallium concentration 1–30 PPC, activity decrease was found by 28–65% relative to the pure soil. On the 30th day, decrease was established in the range 3–30 PPC by 34–72% relative to the pure soil. On the 90th day, decrease was established in the range 3–30 PPC by 33–69%, relative to the pure soil.
Tellurium oxide at 0.5 PPC inhibited dehydrogenases activity only on the 10th day: 9% lower than the pure soil; on the 30th and 90th days, there was no significant difference in dehydrogenase activity from the pure soil. After 10 days, activity decrease was established with an increase in tellurium oxide concentration 1–30 PPC by 15–29% relative to the pure soil. On the 30th day, activity decrease was established only at concentrations of 10 and 30 PPC by 13 and 30%. On the 90th day, there were no significant differences in the activity of dehydrogenases from the pure soil. Nitrate of tellurium at 0.5 PPC after 10 and 30 days of the experiment caused activity decrease by 14 and 16%. With an increase in the concentration 1–30 PPC on the 10th day, enzyme activity decrease was 42–68% relative to the pure soil. After 30 days, with an increase in the concentration 1–30 PPC, activity decrease was 34–74%, relative to the pure soil. A similar trend was established after 90 days; with an increase in the concentration 1–30 PPC, dehydrogenases activity decrease was 19–69%, relative to the pure soil.

3.3. Phytotoxic Indicators

Winter wheat (Triticum aestivum L.) germination after contamination with both chemical forms of silver, bismuth, tellurium, and thallium is shown in Figure 6. Silver oxide at 0.5 PPC after 10 and 90 days reduced wheat germination by 12 and 23%. On the 30th day, no significant differences from the pure soil were found.
With an increase in the concentration of silver oxide after 10 days by 1–30 PPC, a decrease in germination by 22–30% relative to the pure soil was observed. On the 30th day, no significant differences from the pure soil were found. On the 90th day, as well as on the 10th day, there was a decrease in germination by 50–65% below pure soil. With nitrate of silver at 0.5 PPC on the 10th, 30th, and 90th days, no significant difference from the pure soil was revealed. With an increase in nitrate of silver concentration for 10 days 1–30 PPC, the decrease in germination was 12–32% relative to the pure soil. After 30 days, a decrease in germination was established with an increase in the concentration 1–30 PPC of nitrate of silver by 20–50% relative to the pure soil. After 90 days, a decrease in germination was observed with the introduction 3–30 PPC of nitrate of silver by 19–35% relative to the pure soil.
Bismuth oxide at a concentration of 0.5 PPC reduced wheat germination by 12%. After 30 and 90 days, there were no significant differences in wheat germination on soil with bismuth oxide from the pure soil. With an increase in the bismuth oxide concentration after 10 days of the experiment, the decrease in germination was 10–35% relative to the pure soil. After 30 days of the experiment, with an increase in concentrations 1–30 PPC, the decrease in germination was 33–57%. After 90 days, germination recovery was again observed compared to previous periods: a decrease in germination of 1–30 PPC was 12–27% relative to the pure soil. Nitrate of bismuth at 0.5 PPC reduced germination on the 10th, 30th, and 90th days by 10, 13, and 12% of the pure soil. With an increase in the concentration of nitrate of bismuth on the 10th day 1–30 PPC, the germination decreased by 5–22%. After 30 days, with an increase in the 1–30 PPC, the decrease in germination was 30–43%. After 90 days with an increase in the concentration 1–30 PPC, the decrease in germination was 8–46% relative to the pure soil.
Thallium oxide at 0.5 PPC reduced wheat germination already on the 10th day by 17%, on the 30th day by 7%, and on the 90th day by 12% relative to the pure soil. With an increase in the 1–30 PPC, 10 days after contamination with thallium oxide, a decrease in germination by 17–55% was found, after 30 days by 13–87%, and after 90 days by 19–35% relative to the pure soil. Nitrate of thallium at 0.5 PPC caused a decrease in wheat germination after 10, 30, 90 days by 12, 17, 12% relative to the pure soil. With an increase in the 1–30 PPC of nitrate of thallium after 10 days, a decrease in germination by 22–77% was found; after 30 days, 20–53% decrease was found; and after 90 days, 27–73% decrease was found relative to the pure soil.
Tellurium oxide at 0.5 PPC caused decrease of wheat germination after 10 and 30 days from contamination by 20 and 13%. After 90 days of the experiment, there was no significant difference from the pure soil. With an increase in the 1–30 PPC of tellurium oxide on the 10th day, the decrease in germination was 27–37%, on the 30th day it was 47–67%, and on the 90th day it was 12–38% relative to the pure soil. Nitrate of tellurium at 0.5 PPC after 10 and 30 days of the experiment reduced wheat germination by 17 and 13% relative to the pure soil. Ninety days after the application of nitrate of tellurium, no significant differences from the pure soil were found. With an increase in the concentration of nitrate of tellurium 1–30 PPC, a decrease in germination on the 10th day by 32–80% and on the 30th by 13–63%, and on the 90th day, at concentrations of 3–30 PPC, a decrease in germination by 58–73% relative to the pure soil was established.
The length of wheat roots after contamination with both chemical forms of silver, bismuth, tellurium, and thallium after 10, 30, and 90 days depended on the duration of contamination and the chemical form of heavy metal (Figure 7). Silver oxide at a concentration of 0.5 PPC only on the 30th day caused a decrease in root length by 23% relative to the pure soil. On the 10th and 90th days at 0.5 PPC of silver oxide, there were no significant differences from the pure soil in the length of wheat roots.
With an increase in the concentration of silver oxide 1–30 PPC after 10 days of the experiment, a decrease in germination by 20–50% was found, after 30 days by 32–48%, and after 90 days by 37–68% relative to the pure soil. Nitrate of silver reduced root length only on the 30th day at concentrations of 0.5 and 1 PPC by 26 and 33%. At the same concentrations after 10 and 90 days, there was no significant difference from the pure soil.
Bismuth oxide at 0.5 PPC reduced root length on the 30 and 90th days by 47 and 32% relative to the pure soil. With an increase in the concentration of bismuth oxide 3–30 PPC on the 10th day, a decrease in root length by 19–35% was found. After 30 days, with an increase in the content of bismuth oxide 1–30 PPC, the reduction in root length was 48–59%, on the 90th day–33–37%. Nitrate of bismuth after 10 days had a toxic effect on the root length only at 10 and 30 PPC–9 and 18% relative to the pure soil. After 30 days, nitrate of bismuth at 1–30 PPC reduced the length of wheat roots by 47–64% of the pure soil. On the 90th day, a decrease in root length was found only at 10 and 30 PPC by 24 and 25% relative to the pure soil.
Thallium oxide at 0.5 PPC reduced root length only on the 10 and 30th days by 14 and 22%. On the 90th day, there was no significant difference in root length when contaminated with thallium oxide from the pure soil. With an increase in thallium oxide 1–30 PPC on the 10th day, a decrease in root length by 27–63% relative to the pure soil was found. On the 30th day, with thallium oxide 1–30 PPC, a decrease in the length of wheat roots by 22–94% relative to the pure soil was found. On the 90th day, the soil recovered from thallium oxide contamination, and a decrease in root length was found for 10 and 30 PPC by 11 and 24% relative to the pure soil. Nitrate of thallium at 0.5 PPC on the 10th and 30th days inhibited root length by 22 and 45% relative to the pure soil. On the 90th day, there was no significant difference in root length when contaminated with nitrate of thallium. With an increase in the concentration 1–30 PPC on the 10th day, a decrease in root length by 22–96% relative to the pure soil was found. On the 30th day, the reduction in root length at a concentration of 1–30 PPC was 56–89%, and on the 90th day it was 7–86% relative to the pure soil.
Tellurium oxide at 0.5 PPC reduced root length only on the 10th and 30th days by 17 and 41% relative to the pure soil. On the 90th day, there was no significant difference in root length when contaminated with tellurium oxide from the pure soil. With an increase in tellurium oxide 1–30 PPC on the 10th day, the reduction in root length was 28–49%, and on the 30th day it was 64–78% relative to the pure soil. On the 90th day, a decrease in root length was found only at a concentration of 10 and 30 PPC by 14 and 32% relative to the pure soil. Nitrate of tellurium at 0.5 PPC on the 10th and 30th days inhibited root length by 22 and 45% relative to the pure soil. On the 90th day, there was no significant difference in root length when contaminated with nitrate of tellurium. With an increase in the 1–30 PPC on the 10th day, a decrease in root length by 37–100% relative to the pure soil was found. On the 30th day, the reduction in root length at a concentration of 1–30 PPC was 45–96%, and on the 90th day at concentrations of 3–30 PPC of nitrate of tellurium, it was 68–96% relative to the pure soil.

3.4. The Change in the Integral Indicator of the Biological State of Haplic Chernozem

The integral indicator of the biological state of chernozem (IIBS) in case of contamination with both chemical forms of silver, bismuth, tellurium, and thallium is shown in Figure 8. Silver during the entire incubation period (10, 30, 90 days) in the form of oxide was more toxic than its nitrate. At low concentrations (0.5–1 PPC), greater toxicity of silver oxide than nitrate was detected. Only on the 90th day, when nitrate of silver was applied, a tendency to restore biological indicators to the level of pure soil was established: 10% lower than in the pure soil.
Bismuth oxide in its toxic effect on biological parameters practically did not differ from nitrate. Only on the 10th day, a smaller decrease was found under the influence of bismuth oxide IIBS–16% compared to the same period of incubation of nitrate of bismuth.
Thallium oxide compared with nitrate of thallium was more toxic for all biological parameters on the 10th, 30th, and 90th days by 28, 20, and 36% relative to the pure soil. Tellurium oxide compared to nitrate of tellurium, as well as thallium, was more toxic for all biological parameters on the 10th, 30th, and 90th days by 46, 28, and 44% relative to the pure soil. Nitrate of tellurium had the most toxic effect on IIBS among all studied compounds of rare metals.
IIBS of soil for 90 days tended to restore biological parameters when contaminated with silver and bismuth oxides and nitrates, and when contaminated with tellurium and thallium oxide and nitrate, it was inhibited or did not differ from 30 days.

4. Discussion

The use of biological indicators to assess the state of contaminated soils before assessing the quantitative content of a pollutant allows an indirect assessment of the resistance of soil microbiota to pollution. At the same time, it is very important to choose among the variety of indicators those that are the most informative (according to the tightness of the relationship with the concentration of the pollutant) and sensitive (according to the largest percentage of the indicator decrease relative to the pure soil) [4]. Sensitivity assessment was carried out based on the response of biological indicators to contamination with both chemical forms of silver, bismuth, tellurium, and thallium (Table 2).
It was found that when contaminated with silver, the sensitivity of biological indicators ranged as follows:
  • oxide of silver: LR = B > G > Adeh> A cat = Az
  • nitrate of silver: B > G = LR > Acat > Adeh > Az
The most sensitive biological indicator for contamination with silver oxide was root length, and for nitrate of silver it was the total number of soil bacteria. The least sensitive indicator for contamination with silver oxide and nitrate was the Azotobacter sp. abundance.
It was found that when contaminated with bismuth, the sensitivity of biological indicators ranged as follows:
  • oxide of bismuth: LR > B = G > Adeh > Acat > Az
  • nitrate of bismuth: B > G = LR > Acat > Adeh > Az
The most sensitive biological indicator for contamination with bismuth oxide was root length, and for nitrate of bismuth it was the total number of soil bacteria. The least sensitive indicator for contamination with bismuth oxide and nitrate was the Azotobacter sp. abundance.
It was found that when contaminated with thallium, the sensitivity of biological indicators ranged as follows:
  • oxide of thallium: B > G > LR > Adeh = Acat > Az
  • nitrate of thallium: B > LR >G > Adeh > Acat > Az
The most sensitive biological indicator for contamination with thallium oxide and nitrate was wheat germination. The least sensitive indicator for contamination with thallium oxide and nitrate was the Azotobacter sp. abundance.
It was found that when contaminated with tellurium, the sensitivity of biological indicators ranged as follows:
  • oxide of tellurium: LR = B > G > Acat >Adeh > Az
  • nitrate of tellurium: B > LR > Adeh > G > Acat > Az
The most sensitive biological indicator for contamination with tellurium oxide was root length, and for nitrate of tellurium it was the total number of soil bacteria. The least sensitive indicator for contamination with tellurium oxide and nitrate was the Azotobacter sp. abundance.
When contaminated with oxides of silver, bismuth, tellurium, and thallium, the most sensitive biological indicator was the length of wheat roots; when contaminated with nitrates, the most sensitive biological indicator was the total number of bacteria. The least sensitive biological indicator for contamination with both chemical forms of silver, bismuth, tellurium, and thallium was the Azotobacter sp. abundance.
The information content was evaluated by Spearman correlation coefficients (R) between the content of heavy metals and the response of biological indicators for 10, 30, and 90 days (Table 3).
It was established that for contamination with silver, the series of informative biological indicators looked as follows:
  • oxide of silver: Az > Adeh > Acat >LR > B > G
  • nitrate of silver: Az > Adeh = LR > G >Acat >B
The most informative biological indicator for contamination with silver oxide and nitrate was the Azotobacter sp. abundance. The least informative indicator for contamination with silver oxide was germination; for nitrate, it was the total number of bacteria.
It was established that for contamination with bismuth, the series of informative biological indicators looked as follows:
  • oxide of bismuth: Az > Acat > G >Adeh > LR > B
  • nitrate of bismuth: Az > G > Adeh >Acat = LR > B
The most informative biological indicator for contamination with bismuth oxide and nitrate was the Azotobacter sp. abundance. The least informative indicator for contamination with bismuth oxide, and for nitrate it was the total number of bacteria.
It was found that when contaminated with thallium, the sensitivity of biological indicators ranged as follows:
  • oxide of thallium: Az > LR> G > B > Acat =Adeh
  • nitrate of thallium: Az > Acat >Adeh > G = LR > B
The most informative biological indicator for contamination with thallium oxide and nitrate was the Azotobacter sp. abundance. The least informative indicator for thallium oxide contamination was the activity of catalase and dehydrogenase; for nitrate of thallium, the least informative indicator was the total number of bacteria.
It was found that when contaminated with tellurium, the sensitivity of biological indicators ranged as follows:
  • oxide of tellurium: Az >Adeh > Acat > B > G = LR
  • nitrate of tellurium: Az > Acat > G >Adeh = LR > B
The most informative biological indicator for contamination with tellurium oxide and nitrate was the Azotobacter sp. abundance. The least informative indicator for contamination with tellurium oxide was root length and germination, and for nitrate of tellurium it was the total number of bacteria.
The most informative biological indicator for contamination with both chemical forms of silver, bismuth, tellurium, and thallium was the Azotobacter sp. abundance. Germination was the least informative for silver oxide; for bismuth, the total number of bacteria was the least informative; for thallium oxide, it was the activity of catalase and dehydrogenases; and for tellurium oxide, it was the root length and germination. The least informative biological indicator for contamination with silver, bismuth, tellurium, and thallium nitrates was the total number of bacteria.
Evaluation of a wide range of enzymes of soil when contaminated with both chemical forms of silver, bismuth, tellurium, and thallium allowed establishing that catalase and phosphatase had the greatest sensitivity, and the most informative enzymes were phosphatase and invertase [44].
According to the ecotoxic effect of heavy metals on the state of the soil after 90 days of the experiment after contamination, a series is presented, % of the pure soil:
  • oxides: bismuth (82) < silver (78) = tellurium (78) < thallium (77)
  • nitrates: silver (80) = bismuth (80) < thallium (60) < tellurium (56)
The most toxic elements among those studied, both in the form of oxides and in the form of nitrates, were thallium and tellurium. According to the integral indicator of soil enzymatic activity (IIEA), thallium contamination was detected at a critical maximum permissible concentration of 0.601 mg/kg, which was two times higher than silver (0.396 mg/kg), but three times less than tellurium (1.475 mg/kg) [44]. Previously, it was found that tellurium (Te), selenium (Se), silver (Ag), and chromium (Cr) had the greatest toxic effect on the biological functions of the soil [5]. Thus, when tellurium and thallium nitrates were introduced into the soil, the maximum decrease of the biological parameters of chernozem was established.
Enzymatic activity, number of bacteria, phytotoxicity of such rare elements as silver, bismuth, tellurium, and thallium have been studied to a different extent. If the change in activity during pollution with silver and bismuth compounds has been studied to some extent [10,22,23,37,39,41,65], then with pollution with thallium and tellurium, these are isolated works [38,42]. This contamination by AgNPs in the total number of bacteria and enzymatic activity was more than that in the Azotobacter sp. abundance [38]. The highest sensitivity for contamination with bismuth was found in terms of the number of bacteria (61%) and the activity of dehydrogenases (77%), and the highest information content in terms of Azotobacter sp. abundance (R = −0.55) and the germination rate (R = −0.68) [41]. In our study, pollution with silver and bismuth has the greatest effect on the sensitivity of the length of the roots and the number of bacteria, and Azotobacter sp. abundance is the most informative. When Haplic Chernozem is contaminated with thallium, the most sensitive indicators are the length of the roots and the number of bacteria, and for tellurium, the most sensitive indicator is germination.

5. Conclusions

After 90 days of the experiment, the ecological state of Haplic Chernozem after contamination with both chemical forms of silver, bismuth, tellurium, and thallium changed in the direction of both the recovery and decrease of biological indicators. When contaminated with oxides of rare elements (silver, bismuth, tellurium, thallium), the most sensitive biological indicator was the length of wheat roots, and when contaminated with nitrates, it was the total number of bacteria. The most informative biological indicator for contamination with both chemical forms of rare elements was the Azotobacter sp. abundance. The most ecotoxic elements among those studied were thallium and tellurium, both in the form of oxides and nitrates. Research results may be used for the biomonitoring and diagnostics of the state of soils contaminated with various chemical compounds of silver, bismuth, tellurium, and thallium.

Author Contributions

Conceptualization, S.K. and T.M.; methodology, S.K.; software, T.M.; validation, T.M., S.K., and N.E.; formal analysis, S.K.; investigation, S.K.; resources, T.M.; data curation, A.T. and N.T.; writing—original draft preparation, T.M.; writing—review and editing, S.K.; visualization, T.M.; supervision, T.M.; project administration, S.K.; funding acquisition, S.K. All authors have read and agreed to the published version of the manuscript.

Funding

This research was funded by a grant from the Russian Science Foundation No. 22-24-01041 at the Southern Federal University.

Institutional Review Board Statement

Not applicable.

Informed Consent Statement

Not applicable.

Data Availability Statement

Not applicable.

Acknowledgments

This research was funded by a grant from the Russian Science Foundation No. 22-24-01041 at the Southern Federal University.

Conflicts of Interest

The authors declare no conflict of interest.

References

  1. Sustainable Land Management. Available online: https://www.fao.org/land-water/land/sustainable-land-management/ru (accessed on 28 October 2022).
  2. O’Riordan, R.; Davies, J.; Stevens, C.J.; Quinton, J.N.; Boyko, C.T. The ecosystem services of urban soils: A review. Geoderma 2021, 395, 115076. [Google Scholar] [CrossRef]
  3. Vasenev, V.I.; van Oudenhoven, A.P.; Romzaykina, O.N.; Hajiaghaeva, R. The Ecological Functions and Ecosystem Services of Urban and Technogenic Soils: From Theory to Practice (A Review). Eurasian Soil Sci. 2018, 51, 1119–1132. [Google Scholar] [CrossRef] [Green Version]
  4. Kolesnikov, S.I.; Kazeev, K.S.; Akimenko, Y.V. Development of regional standards for pollutants in the soil using biological parameters. Environ. Monit. Assess. 2019, 191, 544. [Google Scholar] [CrossRef] [PubMed]
  5. Kolesnikov, S.; Minnikova, T.; Kazeev, K.; Akimenko, Y.; Evstegneeva, N. Assessment of the Ecotoxicity of Pollution by Potentially Toxic Elements by Biological Indicators of Haplic Chernozem of Southern Russia (Rostov region). Water Air Soil Pollut. 2022, 233, 18. [Google Scholar] [CrossRef]
  6. Xing, G.; Zhu, J.; Xiong, Z. Ag, Ta, Ru, and Ir enrichment in surface soil: Evidence for land pollution of heavy metal from atmospheric deposition. Glob. Biogeochem Cycles 2004, 18, 1–5. [Google Scholar] [CrossRef]
  7. Perkins, W.T. Extreme selenium and tellurium contamination in soils—an eighty year-old industrial legacy surrounding a Ni refinery in the Swansea Valley. Sci. Total Environ. 2011, 412-413, 162–169. [Google Scholar] [CrossRef]
  8. Wiklund, J.A.; Kirk, J.L.; Muir, D.C.G.; Carrier, J.; Gleason, A.; Yang, F.; Evans, M.; Keating, J. Widespread Atmospheric Tellurium Contamination in Industrial and Remote Regions of Canada. Environ. Sci. Technol. 2018, 52, 6137–6145. [Google Scholar] [CrossRef]
  9. Kabata-Pendias, A. Trace Elements in Soils and Plants, 4th ed.; Crc Press: Boca Raton, FL, USA, 2010; p. 548. [Google Scholar]
  10. Yildirim, D.; Sasmaz, A. Phytoremediation of As, Ag, and Pb in contaminated soils using terrestrial plants grown on Gumuskoy mining area (Kutahya Turkey). J. Geochem. Explor. 2017, 182, 228–234. [Google Scholar] [CrossRef]
  11. Druzhinin, A.V.; Karelina, E.V. The main types of industrial silver deposits. Bull. Peoples’ Friendsh. Univ. Russ. A Ser. Eng. Stud. 2008, 1, 35–41. [Google Scholar]
  12. Lyapunov, M.Y. Patterns of the distribution of chemical elements in the soils of the Pioneer gold deposit in the Amur Region. Geochemistry. Bull. Tomsk Polytech. Univ. 2014, 325, 57–68. [Google Scholar]
  13. Elekes, C.C.; Busuioc, G. The mycoremediation of metals polluted soils using wild growing species of mushrooms. In Proceedings of the 7th WSEAS International Conference on Engineering Education (EDUCATION '10), Varna, Bulgaria, 22–24 July 2010; pp. 36–39. [Google Scholar]
  14. Karbowska, B. Presence of thallium in the environment: Sources of contaminations, distribution and monitoring methods. Environ. Monit. Assess. 2016, 188, 640–659. [Google Scholar] [CrossRef] [Green Version]
  15. Grösslová, Z.; Vaněk, A.; Oborná, V.; Mihaljevič, M.; Ettler, V.; Trubač, J.; Drahota, P.; Penížek, V.; Pavlů, L.; Sracek, O.; et al. Thallium contamination of desert soil in Namibia: Chemical, mineralogical and isotopic insights. Environ. Pollut. 2018, 239, 272–280. [Google Scholar] [CrossRef] [PubMed]
  16. Liu, J.; Wang, J.; Chen, Y.H.; Shen, C.C.; Jiang, X.Y.; Xie, X.F.; Chen, D.Y.; Lippold, H.; Wang, C.L. Thallium dispersal and contamination in surface sediments from South China and its source identification. Environ. Pollut. 2016, 213, 878–887. [Google Scholar] [CrossRef] [PubMed]
  17. Baceva, K.; Stafilov, T.; Sajn, R.; Tanaselia, C.; Makerski, P. Distribution of chemical elements in soils and stream sediments in the area of abandoned Sb-As-Tl Allchar mine, Republic of Macedonia. Environ. Res. 2014, 133, 77–89. [Google Scholar] [CrossRef]
  18. Grygoyć, K.; Jabłońska-Czapla, M. Development of a Tellurium Speciation Study Using IC-ICP-MS on Soil Samples Taken from an Area Associated with the Storage. Processing, and Recovery of Electrowaste. Molecules 2021, 26, 2651. [Google Scholar] [CrossRef] [PubMed]
  19. Hayes, S.M.; Ramos, N.A. Surficial geochemistry and bioaccessibility of tellurium in semiarid mine tailings. Environ. Chem. 2019, 16, 251–265. [Google Scholar] [CrossRef]
  20. Kwak, J.I.; Nam, S.H.; An, Y.J. Applicability Evaluation of Soil Algae Pipe Assay in Silver Nanoparticle-Contaminated Soils. Appl. Sci. 2022, 12, 1890. [Google Scholar] [CrossRef]
  21. Nam, S.H.; Kwak, J.I.; An, Y.J. Rapid in Situ Biomonitoring of Subsoil Contamination by Applying an Algae-Soaked Disc Seeding Assay. Appl. Sci. 2021, 11, 2463. [Google Scholar] [CrossRef]
  22. Yan, C.; Huang, J.; Cao, C.; Li, R.; Ma, Y.; Wang, Y. Effects of PVP-coated silver nanoparticles on enzyme activity, bacterial and archaeal community structure and function in a yellow-brown loam soil. Environ. Sci. Pollut. Res. 2020, 27, 8058–8070. [Google Scholar] [CrossRef]
  23. Eivazi, F.; Afrasiabi, Z.; Jose, E. Pedosphere Effects of Silver Nanoparticles on the Activities of Soil Enzymes Involved in Carbon and Nutrient Cycling. Pedosphere 2018, 28, 209–214. [Google Scholar] [CrossRef]
  24. Cvjetko, P.; Milošić, A.; Domijan, A.-M.; Vinković Vrček, I.; Tolić, S.; Peharec Štefanić, P.; Letofsky-Papst, I.; Tkalec, M.; Balen, B. Toxicity of silver ions and differently coated silver nanoparticles in Allium cepa roots. Ecotoxicol. Environ. Saf. 2017, 137, 8–28. [Google Scholar] [CrossRef] [PubMed]
  25. Grün, A.; Straskraba, S.; Schulz, S.; Schloter, M.; Emmerling, C. Long-term effects of environmentally relevant concentrations of silver nanoparticles on microbial biomass, enzyme activity, and functional genes involved in the nitrogen cycle of loamy soil. J. Environ. Sci. 2018, 69, 12–22. [Google Scholar] [CrossRef] [PubMed]
  26. Montes de Oca-Vásquez, G.; Solano-Campos, F.; Vega-Baudrit, J.R.; López-Mondéjar, R.; Vera, A.; Morenof, J.L.; Bastidaf, F. Organic amendments exacerbate the effects of silver nanoparticles on microbial biomass and community composition of a semiarid soil. Sci. Total Environ. 2020, 744, 140919. [Google Scholar] [CrossRef] [PubMed]
  27. Murata, T. Effects of bismuth contamination on the growth and activity of soil microorganisms using thiols as model compounds. J. Env. Sci Health A. Tox Hazard Subst Envion. Eng. 2006, 41, 161–172. [Google Scholar] [CrossRef]
  28. Wei, C.; Deng, Q.; Wu, F.; Fu, Z.; Xu, L. Arsenic, antimony, and bismuth uptake and accumulation by plants in an old antimony mine, China. Biol. Trace Elem. Res. 2011, 144, 1150–115810. [Google Scholar] [CrossRef]
  29. Kearns, J.; Turner, A. An evaluation of the toxicity and bioaccumulation of bismuth in the coastal environment using three species of macroalga. Environ. Pollut. 2016, 208, 435–441. [Google Scholar] [CrossRef] [Green Version]
  30. Yang, G.; Zheng, J.; Tagami, K.; Uchida, S. Rapid and sensitive determination of tellurium in soil and plant samples by sector-field inductively coupled plasma mass spectrometry. Talanta 2013, 116, 181–187. [Google Scholar] [CrossRef]
  31. Nelson, B.; Chen, Y.-W. Tellurium in the environment: A critical review focused on natural waters, soils, sediments and airborne particles. Appl. Geochem. 2015, 63, 83–92. [Google Scholar]
  32. Pavoni, E.; Petranich, E.; Adami, G.; Baracchini, E.; Crosera, M.; Emili, A.; Lenaz, D.; Higueras, P.; Covelli, S. Bioaccumulation of thallium and other trace metals in Biscutella laevigata nearby a UDCommisioned zinc-lead mine (Northeastern Italian Alps). J. Environ. Manag. 2017, 186, 214–224. [Google Scholar] [CrossRef]
  33. Liu, J.; Wang, J.; Xiao, T.F.; Bao, Z.A.; Lippold, H.; Luo, X.W.; Yin, M.L.; Ren, J.M.; Chen, Y.H.; Linghu, W.S. Geochemical dispersal of thallium and other metals in sediment profiles from a smelter-impacted area in South China. Appl. Geochem. 2018, 88, 239–246. [Google Scholar] [CrossRef]
  34. Presentato, A.; Turner, R.J.; Vásquez, C.C.; Yurkov, V.; Zannoni, D. Tellurite-dependent blackening of bacteria emerges from the dark ages. Environ. Chem. 2019, 16, 266–288. [Google Scholar] [CrossRef]
  35. Zare, B.; Faramarzi, M.A.; Sepehrizadeh, Z.; Shakibaie, M.; Rezaie, S.; Shahverdi, A.R. Biosynthesis and recovery of rod-shaped tellurium nanoparticles and their bactericidal activities. Mater. Res. Bull. 2012, 47, 3719–3725. [Google Scholar] [CrossRef]
  36. Lin, Z.H.; Lee, C.H.; Chang, H.Y.; Chang, H.T. Antibacterial activities of tellurium nanomaterials. Chem. Asian J. 2012, 5, 930–934. [Google Scholar] [CrossRef] [PubMed]
  37. Kolesnikov, S.I.; Tsepina, N.I.; Sudina, L.V.; Minnikova, T.V.; Kazeev, K.S.; Akimenko, Y.V. Silver ecotoxicity estimation by the soils state biological indicators. Appl. Environ. Soil Sci. 2020, 2022, 1–9. [Google Scholar] [CrossRef]
  38. Kolesnikov, S.; Tsepina, N.; Minnikova, T.; Kazeev, K.; Mandzhieva, S.; Sushkova, S.; Minkina, T.; Mazarji, M.; Singh, R.K.; Rajput, V.D. Influence of Silver Nanoparticles on the Biological Indicators of Haplic Chernozem. Plants 2021, 10, 1022. [Google Scholar] [CrossRef]
  39. Tsepina, N.; Kolesnikov, S.; Minnikova, T.; Timoshenko, A.; Kazeev, K. Soil contamination by silver and assessment of its ecotoxicity. Rev. Agric. Sci. 2022, 10, 186–205. [Google Scholar] [CrossRef]
  40. Sudina, L.; Kolesnikov, S.; Minnikova, T.; Kazeev, K.; Sushkova, S.; Minkina, T. Assessment of ecotoxicity of the bismuth by biological indicators of soil condition. Eurasian J. Soil Sci. 2021, 10, 236–242. [Google Scholar] [CrossRef]
  41. Kolesnikov, S.I.; Sudina, L.V.; Kuzina, A.A.; Minnikova, T.V.; Tsepina, N.I.; Kazeev, K.S.; Akimenko, Y.V. The effect of bismuth contamination on the soil biological properties. Agric. Nat. Resour. 2022, 56, 417–428. [Google Scholar] [CrossRef]
  42. Kolesnikov, S.I. Impact of Contamination with Tellurium on Biological Properties of Ordinary Chernozem. Soil Sediment Contam. Int. J. 2019, 28, 792–800. [Google Scholar] [CrossRef]
  43. Kolesnikov, S.; Minnikova, T.; Minkina, T.; Rajput, V.D.; Tsepina, N.; Kazeev, K.; Zhadobin, A.; Nevedomaya, E.; Ter-Misakyants, T.; Akimenko, Y.; et al. Toxic Effects of Thallium on Biological Indicators of Haplic Chernozem Health: A Case Study. Environments 2021, 8, 119. [Google Scholar] [CrossRef]
  44. Minnikova, T.; Kolesnikov, S.; Evstegneeva, N.; Timoshenko, A.; Tsepina, N. Estimation of the Enzymatic Activity of Haplic Chernozem under Contamination with Oxides and Nitrates of Ag, Bi, Te and Tl. Agronomy 2022, 12, 2183. [Google Scholar] [CrossRef]
  45. Panagos, P.; Jones, A.; Stolbovoy, V.; Máté, F.; Bódis, K.; Jones, A.; Panagos, P.; Van Liedekerke, M.H.; Joint Research Centre, Institute for Environment and Sustainability. Soils of the European Union. Publications Office, 2014. Available online: https://data.europa.eu/doi/10.2788/87029 (accessed on 10 November 2022).
  46. Tóth, G.; Montanarella, L.; Stolbovoy, V.; Máté, F.; Bódis, K.; Jones, A.; Panagos, P.; Van Liedekerke, M. Soils of the European Union; JRC Scientific and Technical Reports; Office for Official Publications of the European Communities: Luxembourg, 2008. [Google Scholar]
  47. Panagos, P.; Liedekerke, M.H.; Montanarella, L. Multi-scale European Soil Information System (MEUSIS): A multi-scale method to derive soil indicators. Comput. Geosci. 2011, 15, 463–475. [Google Scholar] [CrossRef]
  48. Minnikova, T.V.; Denisova, T.V.; Mandzhieva, S.S.; Kolesnikov, S.I.; Minkina, T.M.; Chaplygin, V.A.; Burachevskaya, M.V.; Sushkova, S.N.; Bauer, T.V. Assessing the effect of heavy metals from the Novocherkassk power station emissions on the biological activity of soils in the adjacent areas. J. Geochem. Explor. 2017, 174, 70–78. [Google Scholar] [CrossRef]
  49. Minkina, T.M.; Mandzhieva, S.S.; Chaplygin, V.A.; Burachevskaya, M.V.; Bauer, T.V.; Sushkova, S.N.; Nevidomskaya, D.G.; Motuzova, G.V. Effect of aerotechnogenic emissions on the content of heavy metals in herbaceous plants of the lower Don region. Eurasian Soil Sci. 2017, 50, 746–755. [Google Scholar] [CrossRef]
  50. Clarke, L.B.; Sloss, L.L. Trace Elements Emission from Coal Combustion and Gasification. IEA Coal Res. 1992, 115–126. [Google Scholar]
  51. Dang, J.; Xie, Q.; Liang, D.; Wang, X.; Dong, H.; Cao, J. The Fate of Trace Elements in Yanshan Coal during Fast Pyrolysis. Minerals 2016, 6, 35. [Google Scholar] [CrossRef] [Green Version]
  52. World Reference Base for Soil Resources. International Soil Classification System for Naming Soils and Creating Legends for Soil Maps, 4th ed.; International Union of Soil Sciences (IUSS): Vienna, Austria, 2022; p. 234. [Google Scholar]
  53. Anishchenko, A.N.; Shutkov, A.A. Problems of implementation of the Doctrine of food security in Russia. Food Policy Secur. 2021, 8, 9–22. [Google Scholar] [CrossRef]
  54. Soil Cover and Land Resources of the Russian Federation. Soil Science Institute named by Vasily Vasilyevich Dokuchaev’s Russian Academy of Agricultural Sciences; Soil Cover and Land Resources of the Russian Federation: Moscow, Russia, 2001; p. 399. [Google Scholar]
  55. Wylie, E.M.; Colletti, L.M.; Walker, L.F.; Lujan, E.J.; Garduno, K.; Mathew, K.J. Comparison of the Davies and Gray titrimetric method with potassium dichromate and ceric titrants. J. Radioanal. Nucl. Chem. 2018, 318, 227–233. [Google Scholar] [CrossRef]
  56. Galstyan, A.S. Unification of methods for studying the activity of soil enzymes. Eurasian Soil Sci. 1978, 2, 107–114. [Google Scholar]
  57. Khaziev, F.K. Methods of Soil Enzymology; Institute of Biology of the UFA Scientific Center Nauka: Moscow, Russia, 2005; p. 252. [Google Scholar]
  58. McFeters, G.A.; Yu, F.P.; Pyle, B.H.; Stewart, P.S. Physiological assessment of bacteria using fluorochromes. J. Microbiol. Methods 1995, 21, 1–13. [Google Scholar] [CrossRef]
  59. Zvyagintsev, D.G. Methods of Soil Microbiology and Biochemistry; Moscow State University: Moscow, Russia, 1991; p. 304. [Google Scholar]
  60. Zvyagintsev, D.G.; Babieva, I.P.; Zenova, G.M. Biology of Soils, 3rd ed.; Moscow University Publishing House: Moscow, Russian, 2005; 448p. [Google Scholar]
  61. Sheudzhen, A.K.; Gromova, L.I.; Pasternak, Y.E. Influence of mineral fertilizers on the yield and grain quality of winter wheat cultivated after sunflower. Fertility 2015, 1, 4–7. [Google Scholar] [CrossRef]
  62. Grote, U.; Fasse, A.; Nguyen, T.T.; Erenstein, O. Food Security and the Dynamics of Wheat and Maize Value Chains in Africa and Asia. Front. Sustain. Food Syst. 2021, 4, 617009. [Google Scholar] [CrossRef]
  63. Goleva, G.G.; Vashchenko, T.G.; Oleynikova, E.M.; Golev, A.D.; Ivannikov, A.; Fedulova, T.P. Morpho-biological diversity of winter wheat varieties assessment. International Transaction Journal of Engineering, Manag. Appl. Sci. Technol. 2020, 11, 1110. [Google Scholar] [CrossRef]
  64. Turebayeva, S.; Zhapparova, A.; Yerkin, A.; Aisakulova, K.; Yesseyeva, G.; Bissembayev, A.; Saljnikov, E. Productivity of Rainfed Winter Wheat with Direct Sowing and Economic Efficiency of Diversified Fertilization in Arid Region of South Kazakhstan. Agronomy 2022, 12, 111. [Google Scholar] [CrossRef]
  65. Kaczynski, P.; Lozowicka, B.; Hrynko, I.; Wolejko, E. Behaviour of mesotrione inmaize and soil system and its influence on soil dehydrogenase activity. Sci. Total Environ. 2016, 571, 1079–1088. [Google Scholar] [CrossRef] [PubMed]
Figure 1. Scheme of the model experiment.
Applsci 12 12854 g001
Figure 2. The total number of bacteria in soil after contamination of silver, bismuth, tellurium, and thallium, % of the pure soil.
Applsci 12 12854 g002
Figure 3. Azotobacter sp. abundance of soil after contamination of silver, bismuth, tellurium, and thallium, % of the pure soil.
Applsci 12 12854 g003
Figure 4. Catalase activity in soil after contamination of silver, bismuth, tellurium, and thallium, % of the pure soil.
Applsci 12 12854 g004
Figure 5. Activity of dehydrogenases in soil after contamination of silver, bismuth, tellurium, and thallium, % of the pure soil.
Applsci 12 12854 g005
Figure 6. Germination of winter wheat (Triticum aestivum L.) on soil after contamination of silver, bismuth, tellurium, and thallium, % of the pure soil.
Applsci 12 12854 g006
Figure 7. Root length of winter wheat (Triticum aestivum L.) on soil after contamination of silver, bismuth, tellurium, and thallium, % of the pure soil.
Applsci 12 12854 g007
Figure 8. Changes in the integral indicator of the biological state of soil after contamination of silver, bismuth, tellurium, and thallium, % of the pure soil.
Applsci 12 12854 g008
Table 1. Methods for assessing the ecological state of soils.
Biological IndicatorsMaterials and ConditionsReference
Activity of catalasegasometrical method[56]
Activity of dehydrogenasesPE 5800VI spectrophotometer[57]
The total number of bacteriaCarl Zeiss Axio Lab A1 microscope[59]
Azotobacter sp. abundanceabacterial air-box (BAVnp-01—“Laminar-S”).[59]
germination of winter wheat (Triticum aestivum L.)Binder KBW-240 climate chamber[60]
root length of winter wheat (Triticum aestivum L.)Binder KBW-240 climate chamber[60]
Table 2. Sensitivity of biological indicators of soil after contamination by silver, bismuth, tellurium, and thallium, % of pure soil (averaged PPC), % of pure soil.
Heavy MetalsChemical FormBiological Indicators
AcatAdehAzBGLR
Silveroxide908690667465
nitrate829094577980
Bismuthoxide908998767566
nitrate899199477878
Thalliumoxide838399646768
nitrate716286405844
Telluriumoxide8289100656864
nitrate645293325638
Note: Acat—activity of catalase; Adeh—activity of dehydrogenases; Az—Azotobacter sp. abundance; B—number of soil bacteria; G—germination; LR—length of roots.
Table 3. Informativeness (Spearman’s correlation) of biological indicators after contamination by silver, bismuth, tellurium, and thallium.
RChemical FormBiological Indicators
AcatAdehAzBGLR
Silveroxide−0.86−0.96−0.99−0.66−0.61−0.76
nitrate−0.72−0.90−0.96−0.71−0.88−0.91
Bismuthoxide−0.90−0.72−0.96−0.63−0.79−0.66
nitrate−0.81−0.83−0.95−0.78−0.86−0.81
Thalliumoxide−0.75−0.74−0.99−0.81−0.86−0.89
nitrate−0.96−0.82−0.99−0.52−0.79−0.79
Telluriumoxide−0.84−0.93−0.99−0.80−0.73−0.74
nitrate−0.90−0.74−0.99−0.58−0.77−0.74
Note: Acat—activity of catalase; Adeh—activity of dehydrogenases; Az—Azotobacter sp. abundance; B—number of soil bacteria; G—germination; LR—length of roots.
Publisher’s Note: MDPI stays neutral with regard to jurisdictional claims in published maps and institutional affiliations.

