Article

Characteristic Analysis on Temporal Evolution of Granulation in a Modified Anaerobic Digestion System

1
School of Water Conservancy and Civil Engineering, Northeast Agricultural University, Harbin 150030, China
2
Key Laboratory of Effective Utilization of Agricultural Water Resources of Ministry of Agriculture, Northeast Agricultural University, Harbin 150030, China
3
Heilongjiang Provincial Key Laboratory of Water Resources and Water Conservancy Engineering in Cold Region, Northeast Agricultural University, Harbin 150030, China
4
Heilongjiang Institute of Water Conservancy and Hydroelectric Power Investigation Design and Research, Harbin 150080, China
5
Skate Key Laboratory of Urban Water Resource and Environment, School of Municipal and Environmental Engineering, Harbin Institute of Technology, Harbin 150090, China
*
Author to whom correspondence should be addressed.
Appl. Sci. 2022, 12(23), 12127; https://doi.org/10.3390/app122312127
Submission received: 8 November 2022 / Revised: 21 November 2022 / Accepted: 24 November 2022 / Published: 27 November 2022
(This article belongs to the Special Issue Advances in Pollution Control and Fuel Production from Water)

Abstract

:
In the present study, the surface morphology, particle size distribution, sedimentation performance, and fractal characteristics of sludge flocs in a modified anaerobic baffled reactor (mABR) during start-up were analyzed by digital image analysis technology. The results showed that the special structure of mABR enabled successful start-up and granular sludge formation in a relatively short time. After the granular sludge was mature, the COD removal rate could quickly recover to the level before the change in organic loading rates (OLRs) within just six days, increasing from the lowest value of 76.8% to 80.2%, which indicated that the granular sludge could maintain a relatively stable micro-environment and make the metabolic process continue when the influent conditions changed suddenly. It was expected that this paper would be helpful for researchers to further develop a unified theory for anaerobic granulation and technology for expediting the formation of mABR granules.

1. Introduction

Anaerobic granular sludge is the major success factor of high-rate anaerobic processes [1]. The formation of granular sludge causes efficient decoupling of solids retention time (SRT) and hydraulic retention time (HRT), thereby creating the conditions for the anaerobic reactor of biomass interception and stable operation. The size and structure of granular sludge are considered fundamental to the efficient operation of water treatment.
Granulation, defined as the formation of well settleable microbial aggregates with various functionalities, depends on several aspects, such as hydraulic conditions, wastewater characteristics, physico-chemical parameters, and so on [2]. The formation of mechanisms for anaerobic granulation reveals that there are several phases of sludge flocs growth [3]. At the beginning, anaerobic bacteria could attach to the inert nuclei particle surfaces to form the initial biofilms, namely embryonic granule for anaerobic granulation [4]. During this period, embryonic granules are aggregated into large sludge flocs due to winding by a large number of filamentous bacteria, then the internal parts of the sludge flocs form a stable environment for anaerobic microbial growth and the structure is tighter as the flocs grow and become larger. After a certain time, granular sludges step into a maturity stage resulting in a steady-state micro ecosystem.
Image analysis has become a common methodology in many research areas [5], such as chemical coagulation–flocculation [6,7,8] and electrocoagulation [9,10,11]. Moreover, the structure of the sludge aggregation flocs can be seen in the image as well. The observed structures, regardless of the applied scale of magnification (or reduction), are generally indicative of their fractal character [12]. Statistics have documented that a given group of sludge flocs usually supports determinations of their fractal dimension Df [13,14,15]. The value of Df can define the compactness and the spatial structure of sludge flocs, which increased as the sludge flocs’ density increased.
Whether the start-up process is successful or not is a prerequisite for the operation of the anaerobic reactor. Over the years, various works representing the start-up performance of anaerobic reactors have been developed, however, there is no previous work focusing on sludge flocs’ size and structure characteristics during the start-up process. In the present study, a start-up experiment was carried out to investigate the sludge flocs in terms of perimeter P and area A contrast-enhanced images derived from a non-intrusive optical sampling and digital image analysis technique, and then the Df analyzed the sludge aggregates–flocs with fractal characteristics. The aim of this study is to identify the diversification of sludge flocs’ characteristics during the start-up process in an efficient anaerobic baffled reactor. This demonstrates the mechanism of anaerobic granulation in wastewater treatment. The results obtained in this study are expected to provide a better understanding of the size, sedimentation, and structure of granular sludge in high-efficiency reactors and further contribute to establishing a unified theory of anaerobic granulation and the accelerated formation technology of granular sludge.

2. Materials and Methods

2.1. Apparatus

A modified version of ABR was used in this work. On the one hand, four compartments in the mABR were designed with the volume ratios of 2:1:3:4, so that different bacterial species could participate in the metabolism under their own optimal environmental conditions. On the other hand, in order to accelerate the mass transfer, the baffles were transformed into a series of 120-degree angles and the wave height was 20 mm. Temperature control was accomplished by a water jacket to maintain the operation at a constant mesophilic temperature of 35 ± 0.5 °C, and the produced gas was discharged via portholes at the top of each compartment. A peristaltic pump (Longer WT600-2, Longer pump Co., Baoding, China) was used to feed wastewater into the reactor at different flow rates that ranged between 114.2 and 38.1 mL/min.

2.2. Inoculated Sludge and Synthetic Wastewater

The anaerobic sludge used as the inoculum in the reactor originated from the sludge of the anaerobic treatment tower and treated beer wastewater of the Huarun Snow Brewery Company, which is located in Harbin in Heilongjiang province, China. The sludge was gray black anaerobic flocculent sludge with a slight odor, and the pH value was 6.9 ± 0.2. A total volume of 28 L of this sludge was added to each compartment at 50% by volume after 4 h of precipitation and supernatant filtration. The biomass concentration was approximately 15 g (VSS)/L.
The synthetic wastewater was produced to a chemical oxygen demand (COD) concentration of approximately 1000 mg/L, using glucose, (NH4)2SO4, and KH2PO4, as a carbon, nitrogen, and phosphorus source, respectively. The ratio of the COD:TN:TP remained at approximately 250:5:1 and NaHCO3 was added to the influent to keep the alkalinity and control the value of the pH at around 7.0 to 7.5. In addition, because the anaerobic bacteria could not synthesize some essential vitamins and amino acids, it was necessary to add a certain amount of Mg, Fe, Ca, Co, Ni, Mn, and other trace elements into the water to maintain the growth of the anaerobic bacteria.

2.3. Carrier

At the beginning of the start-up, 500 mg/L fly ash was added to the anaerobic sludge in the 1st compartment of the reactor at one time in order to promote the acclimation and the granulation. Based on the characteristics of a large specific surface area and high porosity, the high physical adsorption capacity of the fly ash could accelerate the formation of bacterial micelles, make itself form the core carrier of sludge granulation, shorten the formation time of granular sludge, and improve the stability of the system and the settling property of microorganisms as soon as possible [3].
The organic polymer polyacrylamide (PAM) was added to the anaerobic sludge in the 3rd compartment of the reactor once every 8 d a total of four times, adding the amount of 10 mg/L to create 200 mL of solution in order to overcome the disadvantage of adding one type of carrier alone. The PAM could reduce the REDOX capacity of the system, and also improve the contact and attachment, electrostatic adsorption, and adsorption bridging between the sludge particles and the microorganisms so that the microorganisms were able to gather together quickly under the traction of external forces. However, this phenomenon would gradually disappear with the shear action of the water flow during the operation, and the added PAM would be degraded at last.

2.4. Starting Mode

Barber and Stuckey studied the start-up characteristics of the ABR process in two ways [16]. The results showed that the starting mode with a constant influent concentration and gradually reduced HRT after the removal rate reached stability was superior to that with a constant HRT and gradually increased influent concentration in terms of operation stability and treatment effect. This was because when starting-up with a longer HRT, the liquid upward flow rate and the gas production were both lower, which was conducive to the growth of flocculent sludge and the trapping of microbial solids, so the methanogens could quickly recover from the impact load.
The whole start-up process was divided into four phases which adopted the mode of a constant influent COD concentration of 1000 mg/L, and a gradually reduced HRT of 24, 18, 12, and 8 h corresponding to the OLRs of 1.0, 1.3, 2.0, and 3.0 kg·COD/(m3d), respectively. The next phase was performed when the COD removal rate was sustained at around 80% at one phase for 2 d, and the whole start-up process lasted for 45 d.

2.5. Material Preparation

Sludge samples were taken from the upper, middle, and lower parts of the sludge bed in four compartments, and the samples from each compartment were mixed separately. The mixed sample was diluted by a factor of 50 with deionized water, and the diluted sample of 0.2 mL was placed in a petri dish using a pipette with a diameter of 4mm. The petri dish was gently shaken to evenly disperse the sludge flocs And to avoid overlapping. If the sludge flocs broke up during removal, they needed to be discarded.

2.6. Image Capture

The in situ recognition system consisted of a high-speed digital charged coupled device (CCD) video camera (SVS-VISTEK GmbH, Germany) to capture clear sludge flocs images by adjusting the focal length, and an image processing software package (Fmans 10, China) was used to determine the sludge floc geometrical parameters. Here, the CCD camera had a sensor matrix consisting of 992 (horizontal) × 510 (vertical) pixels, giving an interrogation window of about 5665 mm × 2920 mm. This meant the monitoring system had a resolution of around 5.7 mm for particle imaging in the present flocculation study. A personal computer served to control the camera and provided storage for floc images. The schematic of the experimental apparatus is presented in Figure 1.

2.7. Image Analysis and Sludge Volume Index

The size, dP, of a floc of irregular shape was calculated in terms of the equivalent diameter by [17]
d P = 4 A / π 1 / 2
where A was the projected area of the floc. Then the average size and the size distribution of the flocs in three images within each compartment were used to reflect the floc size at the corresponding moment.
The two-dimensional fractal dimension was used to characterize the fractal characteristics of the flocs. The fractal dimension Df, defined how the projected area (A) of the particles scales up with the length of the perimeter (P) according to [18,19]
A P D f
Df depicted the surface morphology of the sludge floc in a two-dimensional projection; its values ranged from Df = 1 for the projected area of a sphere (a circle) to Df = 2 for a line (e.g., a chain of particles) [20]. According to the conceptual model of flocs, the fractal dimension was not determined by the size of the flocs. Therefore, here the fractal dimension of flocs was measured by big flocs, instead of the whole fractal dimension of flocs, including small flocs. According to the result by Chakraborti et al., the statistical fractal dimension was the same for the big flocs and smaller flocs in a jar test experiment [21].
The sludge volume index (SVI, mL/g) referred to the slurry mixed liquid corresponding to the volume occupied by dry sludge for 1 g after 30 min of static precipitation and the calculation formula was as follows:
S V I = S V × 1000 / M L S S × 100
where SV was the precipitation rate which refers to the volume occupied of sludge blanket for 100 mL mixed liquid after 30 min of precipitation, and MLSS was the mixed liquid suspended solids.
SVI could better reflect the loose degree and the sedimentation performance of the activated sludge. The smaller the value of SVI was, the better the sedimentation performance of the sludge was, but if the value of SVI was too low, it might be caused by the high content of inorganic impurities in the sludge and in this case, the activity of the sludge was low. If the value of SVI was too high, it usually caused poor performance of the sedimentation process and it might be in danger of sludge expansion.

3. Results and Discussion

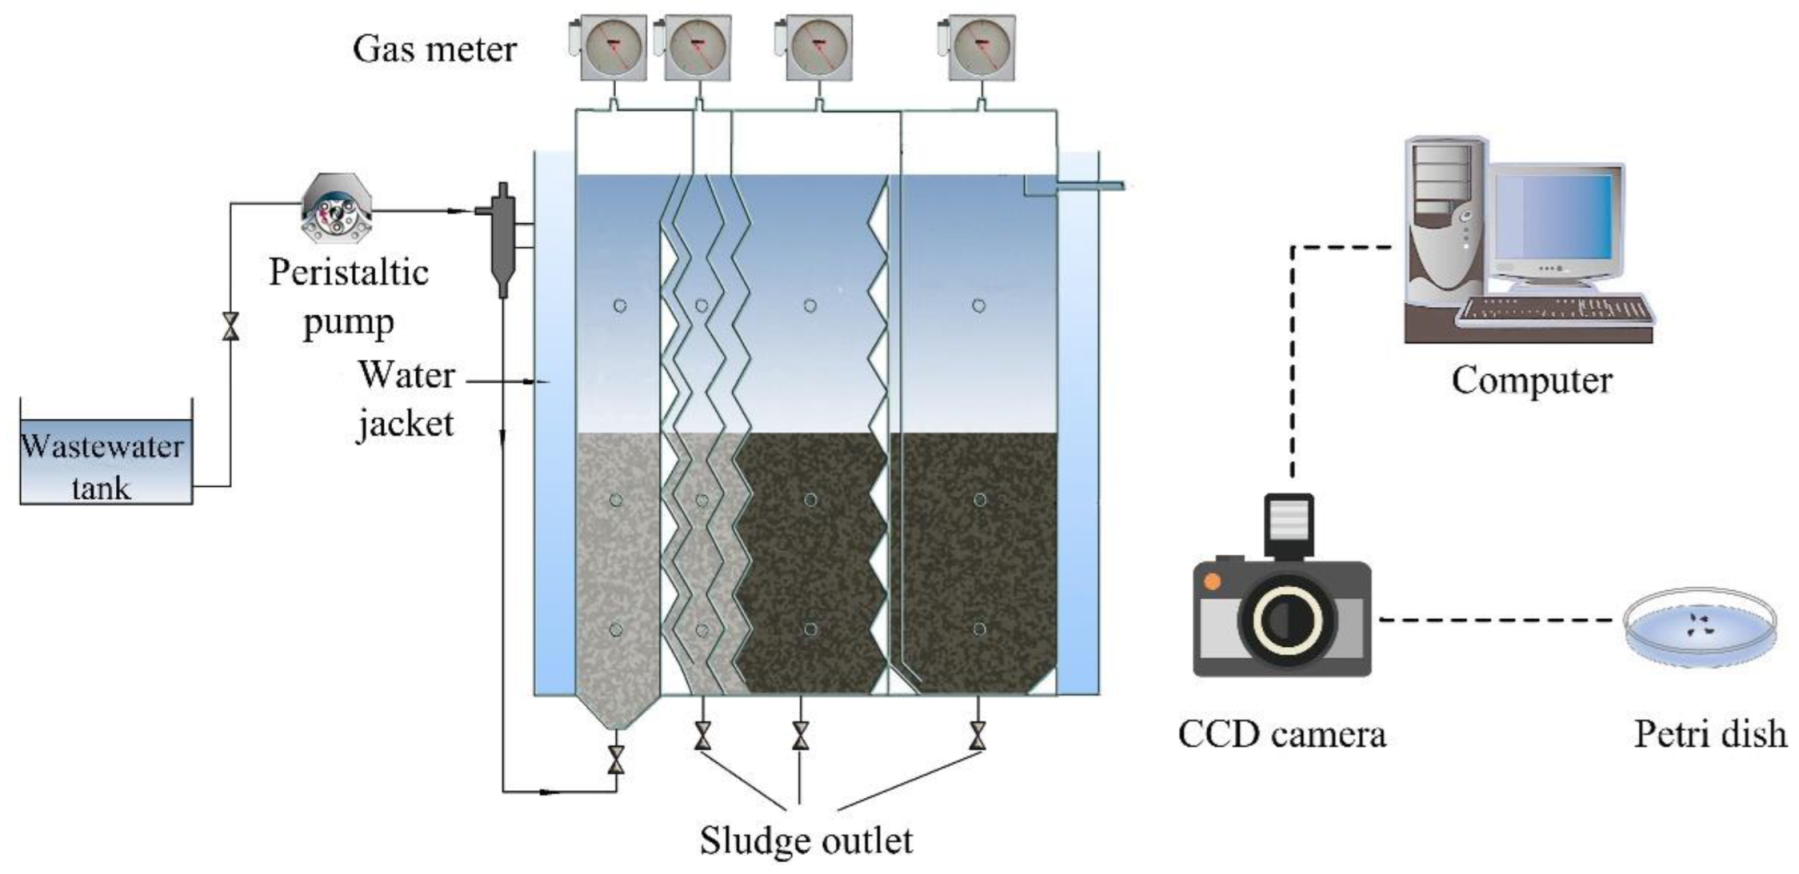
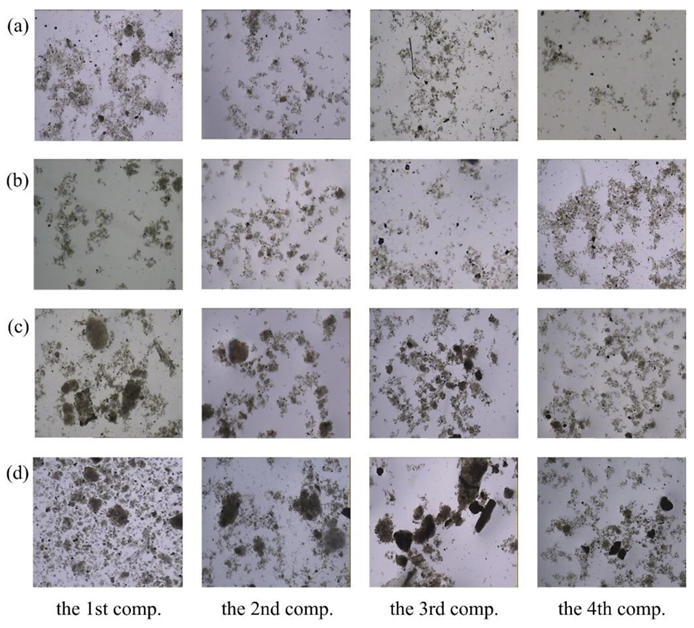
3.1. Surface Morphology

At the initial stage of start-up, images of activated sludge growing in mABR were collected on the 12th day of operation at an OLR of 1 kg·COD/m3 d (Figure 2a). It was found that most of the sludge in the four compartments was flocculent and scattered, and a small amount of smooth and fine granular sludge was brought in from the anaerobic treatment tower during inoculum. As the reactor start-up, the dispersed sludge flocs gradually formed flocculating constituents. The analysis was that the number of microorganisms in the activated sludge gradually increased, making the bacteria collide with each other and adsorb to the solid surface. In this period, the growth rate of activated sludge was very slow because the inoculated sludge was initially dispersed, and the flocculent sludge accounted for a large proportion. Therefore, in the process of operation, the water flow should be ensured to have a slow upward flow rate to avoid sludge loss caused by a too fast flow rate.
The images captured of the activated sludge on the 25th day (OLR = 1.3 kg·COD/m3 d) of start-up showed that the sludge flocs in the first two compartments started to turn white, while in the latter two compartments, they gradually deepened, with black flocculent sludge dominating (Figure 2b). This was mainly due to the environmental conditions of the anterior compartments being suitable for the growth of acidogenic bacteria, while the rear compartments were suitable for the growth of methanogens [22]. Later in this phase it was found that the four compartments had preliminary formed large specific gravity particles as the core of sludge granulation, which reflected that the new granular sludge with a rough surface and an irregular shape appeared in the flocculent sludge of the 1st compartment, and the core bodies were formed in the sludge flocs of the last three compartments.
The Images captured of the activated sludge on the 35th day (OLR = 2.0 kg·COD/m3 d) of start-up showed that the proportion of granular sludge in the 1st compartment was the largest among the four compartments because it was in the most anterior part of the reactor with adequate microbial nutrition and bearing a much higher organic load than the other three compartments (Figure 2c). In addition, the fly ash added in the 1st compartment at the beginning of the start-up could serve as the core carrier of sludge granulation and play a skeleton role in the formation of granular sludge. At the same time, the adsorption of fly ash also created the most primitive conditions for the enrichment of sludge flocs and the formation of zoogloeas [3]. In general, the proportion of granular sludge in the 2nd compartment was slightly smaller than that in the 1st compartment, and a small amount of fly ash was discovered in the 2nd compartment because the speed of the water flow increased and the disturbance of gas production was enhanced. Part of the fly ash in the 1st compartment was carried into the next compartment. The proportion of granular sludge in the 3nd compartment was smaller than that in the first two compartments, and the organic polymer PAM added to this compartment could strengthen the adhesion between the bacteria and promote the rapid aggregation of microorganisms under the traction of external force, which was reflected in part of the granular sludge surface, which appeared distinctly viscous, and many fine particles adhered to each other and formed clumps. To a certain extent, these conditions could reduce the contact area between the sludge and wastewater, but this phenomenon gradually disappeared with the shear action of water flow. The location and environmental conditions of the 4th compartment resulted in a large proportion of loose flocculent sludge and the small particle size of the granular sludge. The plug flow pattern of mABR made the front compartment have a high organic load and sufficient microbial nutrition, and with the degradation of organic matter along the way, only limited nutrients were able to be obtained by the microorganisms in the 4th compartment, which greatly affected the metabolism thus slowing down the process of sludge granulation [23].
The images of activated sludge in each compartment were captured after 45d of start-up (OLR = 3.0 kg·COD/m3 d). It was found that the particle size of granular sludge increased significantly, and the degree of granulation also increased. As shown in Figure 2d, the sludge granulation degree of the 1st compartment was the highest due to the location where the indoor microorganisms could obtain adequate nutrition and grow fast. However, the 1st compartment was at the front end of the acid production stage and the effect of gas production was strong, so that the surface of the granular sludge was relatively rough, irregularly shaped, and had a milky white color. The granular sludge in the 2nd compartment had a good structure and uniform particle size, its shape was mainly spherical and ellipsoid, and the color was milky white. The growth rate of granular sludge in the 3rd compartment was relatively fast, both the average particle size and the granulation degree were higher than those in the 2nd compartment, and the surface of the granular sludge was smooth, clear, and black. The average particle size of the granular sludge in the 4th compartment was still the smallest in the reactor, showing the lowest degree of granulation and a black color. By observing the images, it could be found that the interior of the granular sludge had spaces inside, which indicated that the large particles were composed of small particles gradually in polymerization. These spaces inside the granular sludge were also the important channels for microorganism energy metabolism, including internal gas release, metabolite exclusion, and nutrient entry. With the progress of sludge granulation, the sludge concentration in the reactor increases stably and the impact load resistance increases. The reactor enters the stable operational stage after successful start-up.

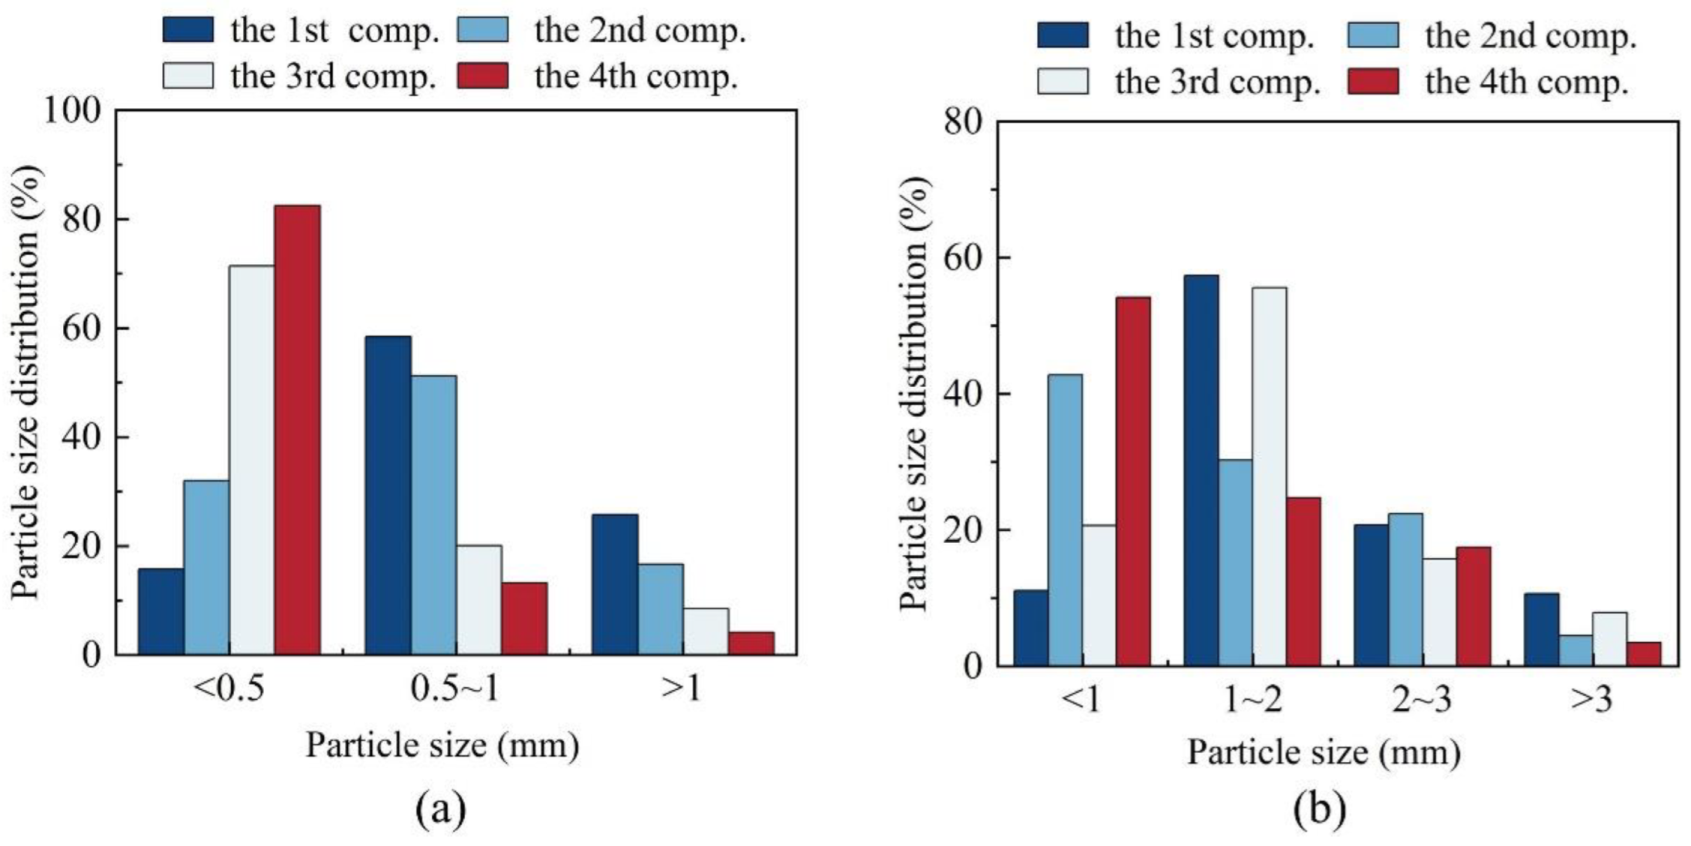
3.2. Particle Size Distribution

Since the granular sludge began to appear to different degrees in four compartments at the 3rd phase of the start-up, the particle size distribution of granular sludge on the 35th and 45th day was analyzed.
As shown in Figure 3a, the highest degree of granulation was found in the 1st compartment of the reactor after 35 d of acclimation. The particle size of granular sludge mainly was concentrated in 0.5–1.0 mm with an average value of 1.2 mm, among which the particle size greater than 1.0 mm accounted for 25.8% of the total granular sludge in the 1st compartment. The granular sludge with a particle size of 0.5–1.0 mm accounted for the highest proportion, and the particle size greater than 1.0 mm accounted for 16.7% of the total granular sludge in the 2nd compartment, which was much less than that in the 1st compartment, therefore, the average particle size was only 0.9 mm. The particle size of granular sludge decreased significantly from the 3rd compartment. The proportion of granular sludge with a particle size less than 0.5mm in the 3rd compartment and the 4th compartment reached 71.4% and 82.5%, respectively, and the average particle size was 0.6 mm and 0.4 mm, respectively. From the above, it could be concluded that when the OLR was low, due to the limited nutrients available to the microorganisms, organic matter was first decomposed in the front compartments, while the bacteria in the back compartments could only obtain a small amount of nutrients and grow slowly. Therefore, the particle size of the granular sludge in each compartment showed a law of change from large to small along the direction of the water flow.
The granular sludge with good precipitation performance was formed in four compartments after 45 d of acclimation. As shown in Figure 3b, the particle size of granular sludge was mainly concentrated in 1.0–2.0 mm with an average value of 1.9 mm, among which the particle size greater than 3.0 mm accounted for 10.7% of the total granular sludge in the 1st compartment. The granular sludge with a particle size less than 1.0 mm accounted for the highest proportion and a particle size greater than 3.0 mm accounted for 4.5% of the total granular sludge in the 2nd compartment; the average particle size was only 1.2 mm, which was less than that in the 1st compartment. The particle size of the granular sludge was mainly concentrated in 1.0–2.0 mm with an average value of 1.6 mm, among which the particle size greater than 3.0 mm accounted for 7.9% of the total granular sludge in the 3rd compartment. The quantity of granular sludge with a large particle size in the 3rd compartment was less than that in the 1st compartment, so even though the concentration range of particle sizes was similar, the average value was quite different. The granular sludge with a particle size less than 1.0 mm accounted for the majority of the granular sludge and a particle size greater than 3.0 mm accounted for only 3.5% of the total granular sludge in the 4th compartment; the average particle size was 0.9 mm. The particle size of the granular sludge in the 4th compartment was the smallest among the four compartments, both in terms of the concentration range and the average value. From the above, it could be concluded that when the OLR was high, the particle size of the granular sludge in the 3rd compartment began to exceed that in the 2nd compartment and was second only to the 1st compartment. This was because on the one hand, the microorganisms in the 3rd compartment could also obtain adequate nutrition due to the increased availability of organic matter, whereas on the other hand, the effect of organic polymer PAM added to the sludge in the 3rd compartment gradually emerged to strengthen the sludge granulation process by reducing the REDOX capacity of the system, improving the contact and attachment, electrostatic adsorption, and adsorption bridging between the sludge particles and the microorganisms. Therefore, the average particle size of granular sludge was the largest in the 1st compartment, followed by the 3rd and the 2nd compartments, and 4th compartment was the smallest.

3.3. Sedimentation Performance

Figure 4a shows the SVI of each compartment on the 35th day of start-up. Because the 1st compartment was at the front end of the acid production stage needed to absorb a large amount of suspended solid and organic matrix in the influent for a long time, the values of SVI ranged from 54 to 112 mL/g, with an average value of 71 mL/g, indicating poor sedimentation performance. The 2nd and the 3rd compartments were in the flourishing stage of acid production and methanogenesis, and the nutrients were relatively sufficient. The values of SVI ranged from 34 to 96 mL/g and 27 to 74 mL/g, respectively, with average values of 57 mL/g and 42 mL/g, respectively, indicating good sedimentation performance. The 4th compartment was at the very end of the reactor, where the nutrients were lacking, and the metabolic capacity of the microorganisms was greatly affected. The values of SVI ranged from 47 to 98 mL/g, with an average value of 61 mL/g. Since most of the granular sludge was in the intermediate state of formation, and only a small part had been formed or was in the state of disintegration when the start-up was in the intermediate stage, the values of SVI in each compartment had a large span. The sedimentation performance was generally shown as the 3rd compartment was the best, the 2nd compartment was the second, the 4th compartment was the third best, and the 1st compartment was the worst.
Figure 4b shows the SVI of each compartment on the 45th day of start-up. The position of the 1st compartment made the sedimentation performance of the activated sludge poor, and the values of SVI ranged from 21 to 57 mL/g, with an average value of 34 mL/g. The 2nd and the 3rd compartments were located in the middle of the reactor, where the nutrients were relatively sufficient and it was unnecessary to absorb harmful substances in the influent, so the values of SVI were 18–38 mL/g and 12–36 mL/g, with average values of 26 mL/g and 17 mL/g, respectively. The micronutrients in the 4th compartment could not meet the normal metabolism of the microorganisms, and the values of SVI ranged from 18 to 64 mL/g, with an average value of 31 mL/g. The conclusion was that the sludge sedimentation performance of each compartment was still the best in the 3rd compartment, followed by the 2nd compartment, the 3rd compartment, and the 1st compartment when the granular sludge was acclimated and mature. The average value of SVI in each compartment was less than 34 mL/g, and such a low value made the granular sludge have a quite good sedimentation effect.

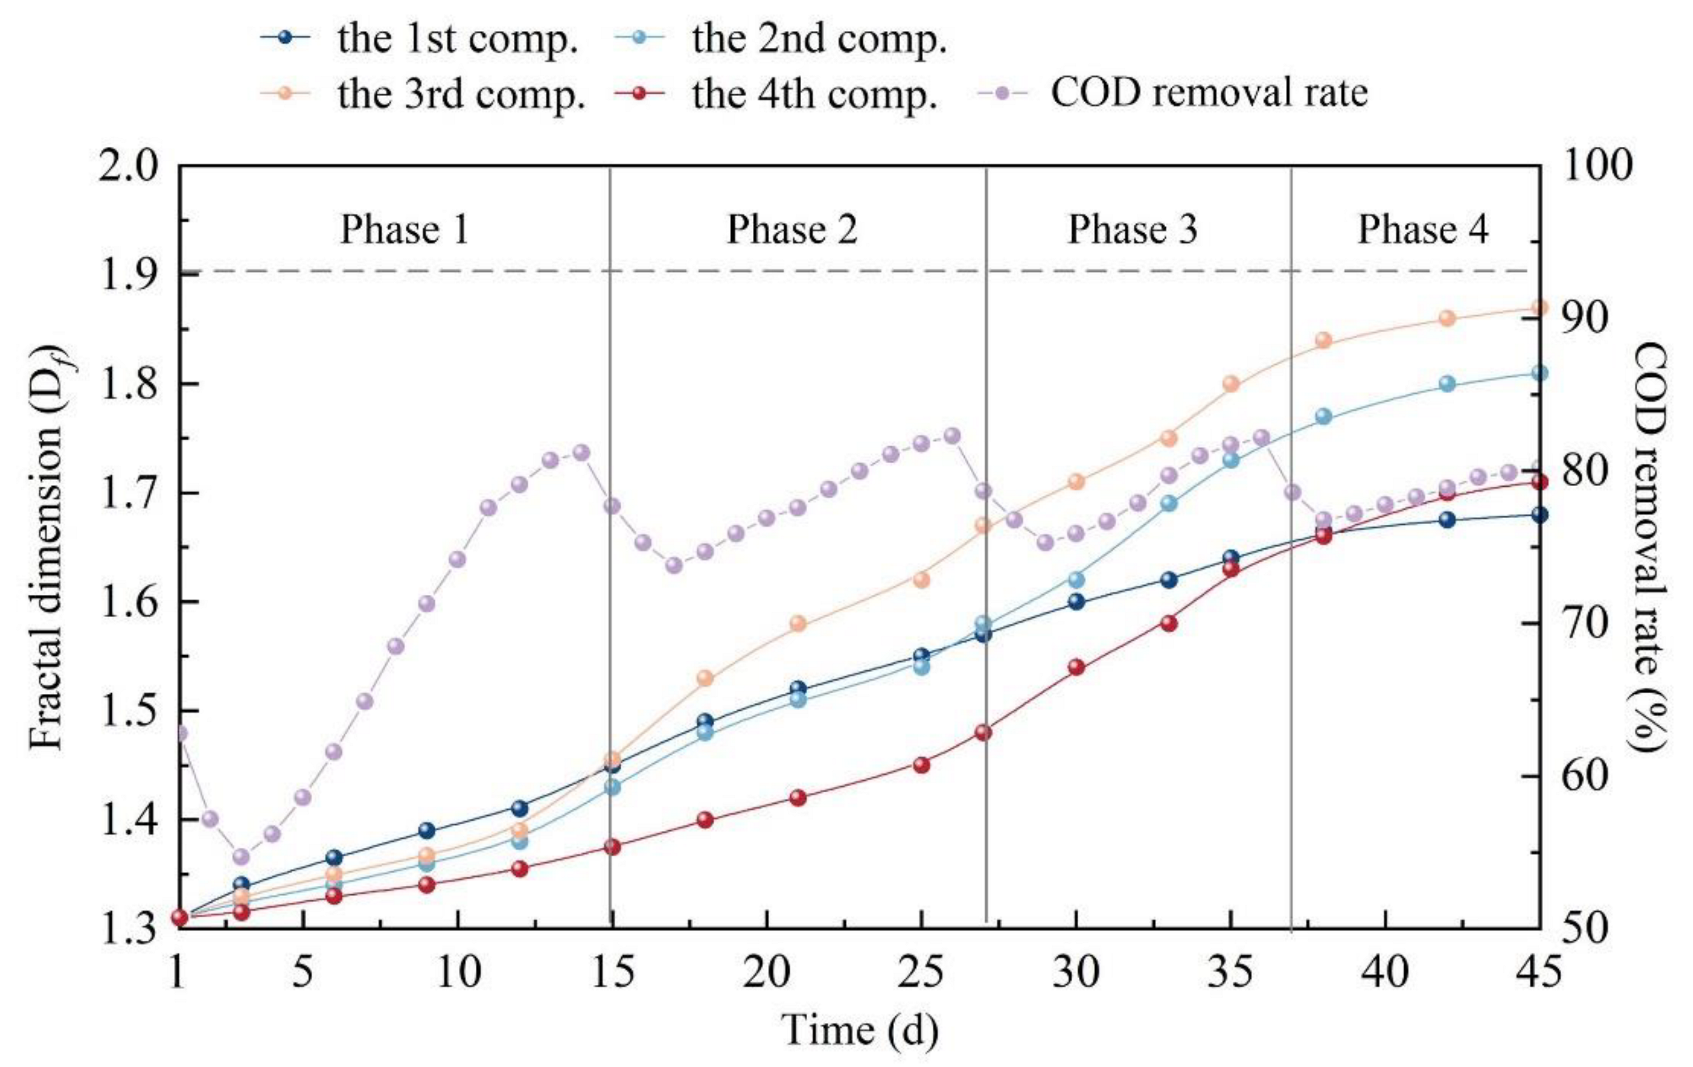
3.4. Fractal Characteristics

The two-dimensional fractal dimension can only take values between 1 and 2. It is generally believed that the larger the value of Df, the closer the granular sludge is to a spherical shape and the higher the degree of space filling, indicating that the surface of granular sludge is relatively smooth and the structure is relatively dense. The smaller the value of Df, the more irregular the shape of granular sludge and the lower the degree of space filling, indicating that the surface is relatively rough and the structure is relatively loose [24,25,26]. The correlation coefficient R2 indicates the linear relationship of lgA~lgP; the closer the value of R2 is to 1, the better the linear relationship of the curve equation is, and the worse it is otherwise [27].
Figure 5 shows the fractal dimension of granular sludge and COD removal rate at each phase during start-up.
At the 1st phase of start-up, although the values of Df for the four compartments were not high, the differences in the growth rate could still be shown. The microorganisms in the 1st compartment could obtain relatively sufficient nutrients compared with those in the rear compartments, so the proliferation rate of sludge was the fastest and the value of Df was the biggest among the four compartments. The proliferation rate of sludge was the slowest and the value of Df was the smallest for the 4th compartment because the low OLR meant that the microorganisms did not have enough nutrients compared with the 1st compartment. The proliferation rate of sludge and the value of Df showed a trend of steady increase since the 2nd and the 3rd compartments were located in the middle position and the nutrients were sufficient. Generally, the inoculated sludge had not fully adapted to the new environment and most of the sludge in each compartment was scattered and had poor sedimentation performance. The flocculent sludge with high biological activity could effectively be intercepted in the reactor to participate in the degradation of organic matter and gradually adapt to the wastewater quality due to the low OLR and lower rate of gas production in the system during this period. At the same time, the COD removal rate increased from 62.8% to 79.1%, which increased with the Df of sludge flocs increasing. The correlation coefficients R2 of the four compartments ranged from 0.957 to 0.974, indicating that the linear relationship of the curve equations was good.
Compared with the 1st phase, the values of Df for the four compartments at the 2nd phase were all increased to different degrees. The microorganisms could gather together rapidly under the traction of external force as the amount of PAM added to the anaerobic sludge gradually increased, resulting in the fastest growth of Df in the 3rd compartment. Since the OLR was still low during this period, the reactor tended to have a plug flow pattern which resulted in a shortage of nutrients and the growth of Df being slow in the 4th compartment. The 1st and the 2nd compartments were located in the front of the reactor, and the nutrients were sufficient, so the proliferation rate and Df could increase steadily. This phase was the key period for the formation of the granular sludge core, which showed that the amount of non-biological substances in the activated sludge gradually decreased, all kinds of bacteria collided with each other and bacteria adsorbed to the solid surface, and the large specific gravity particles as the core of the granular sludge were initially formed in each compartment. At this time, it was at the early stage of the granular sludge formation, so the sludge shape was irregular and the settling performance was poor. The COD removal rate kept increasing after a short decline with the gradual adaptation of microorganisms to the changed OLR increasing from the lowest value of 73.8% to 81.8%. The correlation coefficients R2 of the four compartments ranged from 0.967 to 0.982, indicating that the linear relationship of the curve equations was good.
At the 3rd phase of start-up, the values of Df in the 2nd and the 3rd compartments still maintained a high growth trend, indicating that the granular sludge in the two compartments had a smoother surface, denser structure and better sedimentation performance than the other compartments. Although the formation rate of the granular sludge in the 1st compartment was fast and the particle size increased significantly, the values of Df increased slowly due to the long-term adsorption of suspended solids and organic matter in the influent. As the increase in the OLR enabled the microorganisms in the 4th compartment to obtain appropriate nutrients, the formation rate of granular sludge in this compartment was accelerated and the values of Df gradually increased. At the early stage of this phase, flocculent sludge flocs gradually attached to the surface of the core to form micro particles. The micro particles relied on the intertwining of a large number of filamentous bacteria growing under a low OLR at the 1st and the 2nd phases to form large-sized granular microbial aggregates at the later stage. The acidogenic bacteria and methanogens formed the symbiotic and alternate system in their respective population, which was conducive to the degradation of the organic matter. However, the granular sludge structure during this period was relatively loose, and the ability to resist the hydraulic shear force and bubble cutting force was also weak. The values of Df in each compartment continued to increase and the COD removal rate kept increasing after a brief decline with the gradual adaptation of microorganisms to the changed OLR, with it increasing from the lowest values of 75.3% to 81.7%. The correlation coefficients R2 of the four compartments ranged from 0.978 to 0.987, indicating that the linear relationship of the curve equations was good.
At the 4th phase of start-up, with the increase in granular sludge size, the ability of particles to resist the hydraulic shear force and bubble cutting force increased. The bacteria continuously adhered and gathered on the surface of the particles by mass transfer inside and gradually formed a stable micro-ecosystem granular sludge from the core to the outside. Each bacterium in the particle became a member of this micro-ecosystem, and the living conditions were relatively stable. Therefore, the size of the granular sludge increased and its structure became more compact and stronger. The values of Df in the 3nd and the 2rd compartments still ranked as the first and the second during this phase. In the early stage of this phase, the values of Df in each compartment maintained a high growth trend, but the value of Df in the 4th compartment began to exceed that in the 1st compartment at the later stage, which illustrated that although the particle size of the granular sludge in the 4th compartment was relatively small, the increase in the OLR made the structure of the granular sludge in the 1st compartment loose due to the increase in gas production. As a result, the appearance structure and sedimentation performance of the granular sludge in the 4th compartment were better than those in the 1st compartment. At the later stage of this phase, the values of Df in each compartment increased slowly, indicating that the granular sludge had been mature at this time, and the values of Df would not increase much if the granular sludge continued to be cultivated and acclimated in the start-up phase. The COD removal rate only decreased by 5.4% and quickly recovered to the level before the change in just six days when the OLR changed suddenly, indicating that the granular sludge could maintain a relatively stable micro-environment and make the metabolic process continue when the influent conditions suddenly changed. The above portended that the reactor was successfully started up. The correlation coefficients R2 of the four compartments ranged from 0.981 to 0.991, indicating that the linear relationship of the curve equations was good.
As the HRT gradually reduced during the start-up phase, the changes of anaerobic bacteria to the OLR experienced a process from inadaptability to adaptation, but the amount of sludge washed out did not increase significantly compared with that at a low OLR, indicating that the activated sludge was undergoing a process of immobilization from flocculent sludge to granular sludge. The acclimated and mature granular sludge could avoid the risk of being broken and washed out due to the shear flow force and internal gas production. In addition, the formation of granular sludge could greatly shorten the diffusion distance of fermentation intermediates to hydrogen-producing acetogenic bacteria and methanogens, which was of great significance to improve the efficiency of anaerobic biodegradation. After the reactor was successfully started up, the distribution of Df in the compartments showed a trend of being the highest in the middle and being decreased on both sides to some extent. This phenomenon was due to the different positions and functions of anaerobic sludge in each compartment in the whole reactor. Although the proliferation rate of granular sludge in the 1st compartment was fast and the particle size evidently increased, the granular sludge growing in it had a rough surface, loose structure, and poor sedimentation performance due to a large number of suspended solids and an organic matrix adsorbed in the influent for a long time at the beginning of the acidogenic stage. The 2nd and the 3rd compartments were in the flourishing stage of the acidogenic and methanogenic stage, and the strong gas production and mixing effect made granular sludge with a compact structure, smooth surface, and good sedimentation performance. With the degradation of the organic matter by microorganisms along the way, microorganisms in the 4th compartment could not obtain sufficient nutrients, and the metabolism was greatly affected, so that the sludge was in the process of or about to undergo particle disintegration due to “starvation”.

4. Conclusions

In conclusion, the study showed that the mABR system is able to be considered as an important, potential technology that could fill in the gap of high-efficiency anaerobic treatment systems. Combined with the study of sludge granulation processes, it was concluded that the formation of granular sludge experienced five periods including the core formation period, microparticle formation period, microparticle fixation period, granular sludge formation period, and granular sludge maturation period. After the granular sludge was mature, the COD removal rate only decreased by 5.4% when the OLR changed suddenly and quickly recovered to the level before the change in just six days, indicating that the granular sludge could maintain a relatively stable micro-environment and make the metabolic process continue when the influent conditions suddenly changed, which portended that the reactor was successfully started up.

Author Contributions

Conceptualization and investigation, S.L. and J.N.; data curation, S.L., K.H. and N.G.; writing—original draft preparation, N.G.; writing—review and editing, S.L.; project administration and funding acquisition, S.L. and K.H. All authors have read and agreed to the published version of the manuscript.

Funding

This research was funded by the Postdoctoral Science Foundation of Heilongjiang Province of China (grant number LBH-Z21107).

Institutional Review Board Statement

Not applicable.

Informed Consent Statement

Not applicable.

Data Availability Statement

Not applicable.

Acknowledgments

The authors would like to express their appreciation to the editors and reviewers for their valuable comments and suggestions.

Conflicts of Interest

The authors declare no conflict of interest.

References

  1. Dereli, R.K.; Ersahin, M.E.; Ozgun, H.; Ozturk, I.; Jeison, D.; van der Zee, F.; van Lier, J.B. Potentials of anaerobic membrane bioreactors to overcome treatment limitations induced by industrial wastewaters. Bioresour. Technol. 2012, 122, 160–170. [Google Scholar] [CrossRef] [PubMed]
  2. Pol, L.W.H.; Lopes, S.I.D.; Lettinga, G.; Lens, P.N.L. Anaerobic sludge granulation. Water Res. 2004, 38, 1376–1389. [Google Scholar]
  3. Liu, Y.; Xu, H.L.; Yang, S.F.; Tay, J.H. Mechanisms and models for anaerobic granulation in upflow anaerobic sludge blanket reactor. Water Res. 2003, 37, 661–673. [Google Scholar] [CrossRef] [PubMed]
  4. Lettinga, G.A.F.M.; Van Velsen, A.F.M.; Hobma, S.W.; De Zeeuw, W.; Klapwijk, A. Use of the upflow sludge blanket (USB) reactor concept for biological wastewater treatment, especially for anaerobic treatment. Biotechnol. Bioeng. 1980, 22, 699–734. [Google Scholar] [CrossRef]
  5. Prats-Montalban, J.M.; Ferrer, A.; Bro, R.; Hancewicz, T. Prediction of skin quality properties by different multivariate image analysis methodologies. Chemom. Intell. Lab. Syst. 2009, 96, 6–13. [Google Scholar] [CrossRef]
  6. Duan, J.M.; Gregory, J. Coagulation by hydrolysing metal salts. Adv. Colloid Interface Sci. 2003, 100, 475–502. [Google Scholar] [CrossRef]
  7. Smoczynski, L.; Bukowski, Z.; Wardzynska, R.; Zaleska-Chrost, B.; Dluzynska, K. Simulation of Coagulation, Flocculation, and Sedimentation. Water Environ. Res. 2009, 81, 348–356. [Google Scholar] [CrossRef]
  8. Smoczynski, L.; Wardzynska, R.; Pierozynski, B. Computer simulation of the polydispersive sol coagulation process. Can. J. Chem. Eng. 2013, 91, 302–310. [Google Scholar] [CrossRef]
  9. İrdemez, Ş.; Demircioğlu, N.; Yıldız, Y.Ş.; Bingül, Z. The effects of current density and phosphate concentration on phosphate removal from wastewater by electrocoagulation using aluminum and iron plate electrodes. Sep. Purif. Technol. 2006, 52, 218–223. [Google Scholar] [CrossRef]
  10. Butler, E.; Hung, Y.T.; Yeh, R.Y.L.; Al Ahmad, M.S. Electrocoagulation in wastewater treatment. Water 2011, 3, 495–525. [Google Scholar] [CrossRef]
  11. Secula, M.S.; Creţescu, I.; Petrescu, S. An experimental study of indigo carmine removal from aqueous solution by electrocoagulation. Desalination 2011, 277, 227–235. [Google Scholar] [CrossRef]
  12. Jullien, R.; Meakin, P. Simple models for the restructuring of three-dimensional ballistic aggregates. J. Colloid Interf. Sci. 1989, 127, 265–272. [Google Scholar] [CrossRef]
  13. Mandelbrot, B.B. The Fractal Geometry of Nature; W. H. Freeman and Company: New York, NY, USA, 1982; pp. 237–239. [Google Scholar]
  14. Zhao, Y.Q. Settling behaviour of polymer flocculated water-treatment sludge II: Effects of floc structure and floc packing. Sep. Purif. Technol. 2004, 35, 175–183. [Google Scholar] [CrossRef] [Green Version]
  15. Meng, F.G.; Zhang, H.M.; Li, Y.S.; Zhang, X.W.; Yang, F.L.; Xiao, J.N. Cake layer morphology in microfiltration of activated sludge wastewater based on fractal analysis. Sep. Purif. Technol. 2005, 44, 250–257. [Google Scholar] [CrossRef]
  16. Barber, W.P.; Stuckey, D.C. The Use of the Anaerobic Baffled Reactor (ABR) for Wastewater Treatment: A Review. Water Res. 1999, 33, 1559–1578. [Google Scholar] [CrossRef]
  17. He, W.P.; Nan, J.; Li, H.Y.; Li, S.N. Characteristic analysis on temporal evolution of floc size and structure in low-shear flow. Water Res. 2012, 46, 509–520. [Google Scholar] [CrossRef]
  18. Meakin, P. Fractal aggregates. Adv. Colloid Interface Sci. 1987, 28, 249–331. [Google Scholar] [CrossRef]
  19. Spicer, P.T.; Pratsinis, S.E. Shear-induced flocculation: The evolution of floc structure and the shape of the size distribution at steady state. Water Res. 1996, 30, 1049–1056. [Google Scholar] [CrossRef]
  20. Mandelbrot, B.B.; Passoja, D.E.; Paullay, A.J. Fractal character of fracture surfaces of metals. Nature 1984, 308, 721–722. [Google Scholar] [CrossRef]
  21. Chakraborti, R.K.; Gardner, K.H.; Atkinson, J.F.; Benschoten, J.E.V. Changes in fractal dimension during aggregation. Water Res. 2003, 37, 873–883. [Google Scholar] [CrossRef]
  22. Li, S.N.; Nan, J.; Gao, F. Hydraulic characteristics and performance modeling of a modified anaerobic baffled reactor (MABR). Chem. Eng. J. 2016, 284, 85–92. [Google Scholar] [CrossRef]
  23. Li, S.N.; Nan, J.; Li, H.Y.; Yao, M. Comparative analyses of hydraulic characteristics between the different structures of two anaerobic baffled reactors (ABRs). Ecol. Eng. 2015, 82, 138–144. [Google Scholar] [CrossRef]
  24. Asraf-Snir, M.; Gitis, V. Tracer studies with fluorescent-dyed microorganisms—A new method for determination of residence time in chlorination reactors. Chem. Eng. J. 2011, 166, 579–585. [Google Scholar] [CrossRef]
  25. Spicer, P.T.; Keller, W.; Pratsinis, S.E. The effect of impeller type on floc size and structure during shear-induced flocculation. J. Colloid Interf. Sci. 1996, 184, 112–122. [Google Scholar] [CrossRef] [PubMed]
  26. Xiao, F.; Lam, K.M.; Li, X.Y.; Zhong, R.S.; Zhang, X.H. PIV characterisation of flocculation dynamics and floc structure in water treatment. Colloid. Surf. A 2011, 379, 27–35. [Google Scholar] [CrossRef] [Green Version]
  27. Smoczyński, L.; Ratnaweera, H.; Kosobucka, M.; Smoczyński, M. Image analysis of sludge aggregates. Sep. Purif. Technol. 2014, 122, 412–420. [Google Scholar] [CrossRef]
Figure 1. Schematic diagram of the experimental apparatus.
Applsci 12 12127 g001
Figure 2. Captured images of the sludge in four compartments on (a) the 12th day; (b) the 25th day; (c) the 35th day; (d) the 45th day during start-up (10×).
Applsci 12 12127 g002
Figure 3. Grid size distribution of the granular sludge in four compartments on (a) the 35th day and (b) the 45th day during start-up.
Applsci 12 12127 g003
Figure 4. SVI of four compartment on (a) the 35th day and (b) the 45th day during start-up.
Applsci 12 12127 g004
Figure 5. Fractal dimension of the sludge and COD removal rate at each phase during start-up.
Applsci 12 12127 g005
Publisher’s Note: MDPI stays neutral with regard to jurisdictional claims in published maps and institutional affiliations.

