


The Effect of Students, Computers, and Air Purifiers on Classroom Air Quality

1
Laboratory of Atmospheric Pollution and Pollution Control Engineering of Atmospheric Pollutants, Department of Environmental Engineering, Faculty of Engineering, Democritus University of Thrace, 67100 Xanthi, Greece
2
Unit of Environmental and Networking Technologies and Applications ATHENA-RIC, University Campus, Kimmeria, 67100 Xanthi, Greece
*
Author to whom correspondence should be addressed.
Appl. Sci. 2022, 12(23), 11911; https://doi.org/10.3390/app122311911
Submission received: 31 October 2022
/
Revised: 17 November 2022
/
Accepted: 20 November 2022
/
Published: 22 November 2022
(This article belongs to the Special Issue Air Quality in Indoor Environments)
Abstract
:Indoor air pollutant sources are crucial in assessing IAQ, especially when outdoor air pollutant concentrations are low. In the present study, PM mass concentrations in a range of five sizes; CO, CO2, O3, NO, NO2, and TVOC concentrations; along with temperature and relative humidity were monitored in three indoor locations of a university. The monitoring took place in a building dedicated to teaching undergraduates. The first two locations, a professor’s office and a computer centre (laboratory), were not refurbished. The classroom under study is refurbished and now is airtight, as are all of the classrooms in this building. Air purifiers were installed in all of the classrooms to prevent the transmission of infectious pollutants. In all monitored locations, people were the main indoor source of PM, CO2, and TVOC. The operation of twelve computers in the small laboratory did not contribute to the air pollution, at least for the examined pollutants. The air purifier decreased the PM concentrations, but not the gaseous air pollutants.
1. Introduction
Numerous studies by researchers from diverse disciplines have confirmed that indoor air quality (IAQ) may have adverse effects (short- and/or long-term) on human well-being, i.e., health, productivity, mood, stress, sleep, and recovery from illness [1,2,3]. The spread of biological pollutants such as SARS-CoV2 and the resulting COVID-19 pandemic highlighted the importance of controlling the IAQ [4,5].
Indoor air pollutants can be transported from outdoors, but can also be emitted from indoor sources. The building characteristics, i.e., air exchange rate, material of the indoor surfaces, and its operation (i.e., human activity), will shape the indoor atmospheric pollutant concentrations and their diurnal variation. Depending on the activities performed inside a building, atmospheric pollutants emitted indoors can be the dominant threat for poor indoor air quality [6,7,8,9].
The IAQ is of paramount importance in buildings used for learning and teaching activities [10]. For example, in recent studies, it is reported that the ventilation system type, ventilation rates, fine particle counts, and O3 and CO concentrations in 220 classrooms in the U.S.A. were found to affect the academic performance of the students [11,12]. Moreover, in these classrooms, it was found that the average indoor CO2 concentration of all classrooms during the hours of occupation was 1171 (SD = ±319) ppm [11]. Seseña et al. [13] evaluated the IAQ in eleven naturally ventilated training laboratories. In a laboratory with computers (PC.1, the smaller one), the average CO2 concentration was 876 (SD = ±250) ppm and the average CO concentration was 460 (SD = ±330) ppb.
The airborne particulate matter (PM) is the focus of interest in many studies, mainly for schools but also for higher education buildings, owing to their well-known health effects [14]. Studies in different countries reported that PM concentrations in educational buildings are affected by the occupancy, activities, building construction characteristics, their natural or mechanical ventilation, as well as the outdoor air pollution [15,16]. Argunhan and Avci [15] reported that, in a Turkish university, the average indoor PM2.5 concentration was 48.37 μgm−3 and the PM10 concentration was 107.09 μgm−3, as a result of elevated outdoor air pollution. The respective average CO2 concentration was 1415.72 ppm. Erlandson et al. [16] conducted an IAQ investigation in three buildings (retrofit, conventional, and green) of a public research university in the U.S.A. Average CO2 levels were found to be the highest in classrooms (513 ppm) in a public research university in the U.S.A [16]. PM2.5 was found to be the lowest in the retrofit building 1.5 (2.14) μgm−3, while PM4 concentrations did not substantially vary by building type. The authors discuss that the differences in occupancy in these buildings resulted in the highest mean CO2 concentrations (518 ppm) being recorded for the newly constructed green building, followed by the retrofitted building (512 ppm) and the conventional building (455 ppm). Monitoring PM with light scattering is an efficient method that provides real-time data, allowing the examination of short-term PM variations [9,17].
Furthermore, educational buildings face new challenges, such as the spread of the SARS-CoV-2 and the urgent need for energy saving. Buildings are refurbished to save energy and air purifiers are installed to improve IAQ [18,19], measures that do not always guarantee a good IAQ. Indoor CO2 concentration exceeded the value of 1000 ppm in all schools examined in a Korean study and the operation of air purifiers reduced only the PM concentrations by approximately, 30% leaving students unsatisfied with the IAQ [18]. Although the energy consumption issue and other economic issues are out of the scope of the present study, it is worth mentioning a recent work that provides an objective evaluation of different air purifiers based on their overall cost. In this work, among others, it is reported that “replacement filters and electricity costs generate most of the cost of running air purifiers” [20].
TVOC is defined as the sum of all the individual volatile organic compounds (VOC) and can be considerate as an indicator of IAQ. Indoor sources of TVOC include emissions from building material, personal care products and indoor chemical reactions. Proposed air quality guideline (AQG) values lie between 300 and 600 µg m−3 (73.35–146.7 ppb, assuming 25 °C, 1 atm, and 100 g mol−1), averaged over 8 h [21,22]. However, TVOC as a metric reveals little regarding the nature and the possible health effects of the individual organic compounds.
Indoor CO2 concentrations are a simple indicator of human presence and the emission of bio-effluents in classrooms. There is a direct correlation between indoor CO2 levels and the number of occupants, their age, and their metabolic rate [11]. In a review article, the authors conclude that “Although it is not possible to say with confidence whether CO2 alone is responsible for health effects at low exposures (<5000 ppm) and whether it is itself a pollutant, the existing guideline CO2 concentrations can be indicative of ventilation, human bio-effluent and indoor air pollution concentrations, and therefore, the current consensus that <1000 ppm, 1000–1500 ppm and >1500 ppm represent good, moderate and poor indoor air quality, respectively, seems appropriate” [23,24].
Another issue that affects academic performance is the thermal comfort in teaching rooms, apart from the concentrations of air pollutants, but this perspective is out of the scope of the present study [25,26].
The World Health Organization (WHO) has published in 2010 guidelines for indoor air quality for some selected pollutants with indoor sources [27]. The updated WHO Global Air Quality Guidelines (AQGs) [14] are based on the latest scientific findings on the short- or long-term adverse health effects of air pollution. Some new guideline concentration values are introduced for controlling atmospheric pollutants (for example, for O3). For others, the guideline values are updated to lower values than those set previously, e.g., for CO, NO2, and PM2.5 and PM10. The new guidelines are applicable to both outdoor and indoor environments. However they are not yet adopted as standards by the regulatory authorities in most countries, as well as in Europe. The proposed long-term AQG level for O3 is 60 μgm−3 (30.6 ppb, STP), as a warm season average of daily maximum 8 h concentrations, and an 8 h average of 100 μgm−3 (50.9 ppb, STP). For NO2, an AQG value of 25 μgm−3 (13.30 ppb), as a 24 h average concentration, was newly introduced. The proposed AQG level for PM2.5 is a 24 h average concentration of 15 μgm−3 and annual average of 5 μgm−3. The corresponding levels for PM10 are a 24 h average concentration of 45 μgm−3 and annual average of 15 μgm−3. For CO, the 24 h average concentration is 4 mgm−3 (3.48 ppm), the 8 h average is 10 mgm−3 (8.70 ppm), and the 1 h average is 35 mgm−3 (30.43 ppm).
The objective of the present study was to evaluate basic parameters that contribute to the IAQ in a naturally ventilated lecture classroom (recently refurbished to be airtight), a training laboratory with computers, and an office of a professor (not refurbished). These parameters included the following: PM mass concentrations in five sizes range; CO, CO2, O3, NO, NO2, and TVOC concentrations; along with temperature and relative humidity. Furthermore, in the spring of 2022, air purifiers were installed in the classrooms to prevent viruses’ transmission, such as SARS-CoV-2. The first time that an air purifier was put into operation was in October 2022, providing an excellent opportunity to examine its ability to improve indoor air quality. Hence, the effects on IAQ of the number of the students that attended each lecture, the operation of the computers, and the air purifier were evaluated in order to be able to propose appropriate actions to improve students’ performance.
2. Materials and Methods
2.1. Site Description
Indoor and outdoor atmospheric pollutants’ monitoring was conducted in the partially refurbished four-storey building in the campus of the Democritus University of Thrace (DUTH), in Xanthi, Greece. This building is intended for teaching students of the Environmental Engineering Department. It has some offices for professors and two rooms with computers configured for students’ practice.
Three campaigns were designed for three rooms. Each room presents one aspect of activities for which this building is intended, i.e., a professor’s office with a volume of 46 m3 (Office); a computer center with 12 computers, 6 desktops and 6 laptops, (Lab), with a volume of 48 m3; and a room for lectures (volume of 222 m3), with a maximum occupancy of 40 students (Class). The last campaign was conducted again in the Class in October 2022 (no heating). It was an opportunity to test the effects of a brand new air purifier installed inside the Class.
The Office and the Lab are on the second floor of the building and the Class is on the first floor. All rooms are naturally ventilated. Plastic tiles are fitted to the floor (no carpeting), while the wall is constructed from painted gypsum. The rooms have an air conditioning system, which only controls the temperature, but they were not in operation during these campaigns. The Office and Lab have old, big, single-glazed windows and old doors. On the contrary, the Class was refurbished, with new double-glazed window frames and a new door with good insulation.
2.2. Monitoring
Aerosol mass concentration measurements were conducted with a laser optical particle counter (Aerocet 531S, Met One Instruments Inc., Washington, DC, USA). Six size ranges of the PM were monitored based on their aerodynamic diameter, i.e., diameter <1 μm (PM1), <2.5 μm (PM2.5), <4 μm (PM4), <7 μm (PM7), <10 μm (PM10), and <100 μm (TSP, total suspended particles) were measured.
Air pollutants (TVOC, CO, CO2, O3, NO, and NO2) were sampled using a multi-gas sensor probe (model DirectSense II; GrayWolf Sensing Solutions; Annacotty, County Limerick, Ireland).
Both instruments also recorded air temperature and RH and were calibrated before the field experiment. The instruments were connected with a laptop and their readings were recorded simultaneously with a one-minute time step. Some outdoor atmospheric pollutant concentrations were obtained with the same instruments.
The indoor CO2 concentrations were used to estimate the air exchange rate of each room [28].
3. Results
3.1. Campaign 1: Office and Lab
During the monitoring period, only the researcher and one or two more people entered the office. In order to investigate the role of the running PCs on indoor air quality in the Office, the researcher opened the twelve PCs found in the Lab, left the room, and returned after few hours to close them. The MS was placed near the middle of the Office and, during the operation of the PCs, the door between the two rooms was left open. Figure 2a shows the indoor PM mass concentrations along with the number of people present and the number of operating PCs (in the Lab) during the working hours.
Next, the MS was transported in the middle of the Lab. In this case, the door between the two rooms was kept close. The effect of the operation of the PCs on IAQ in the Lab (as well in the Office) was examined with and without human presence. Figure 2b presents the indoor PM mass concentrations along with the number of people present and the number of operating PCs before, during, and after the practical training of the students.
During this Campaign 1, a strong north wind cleared the atmosphere outdoors. Hence, the outdoor concentrations of all of the atmospheric pollutants were low [29]. Indoors, the PM mass concentrations were also low when the rooms were empty. People’s presence, movement, and activity increased the PM concentrations indoors, as depicted in Figure 2a,b.
3.2. Campaign 2: Class (March)
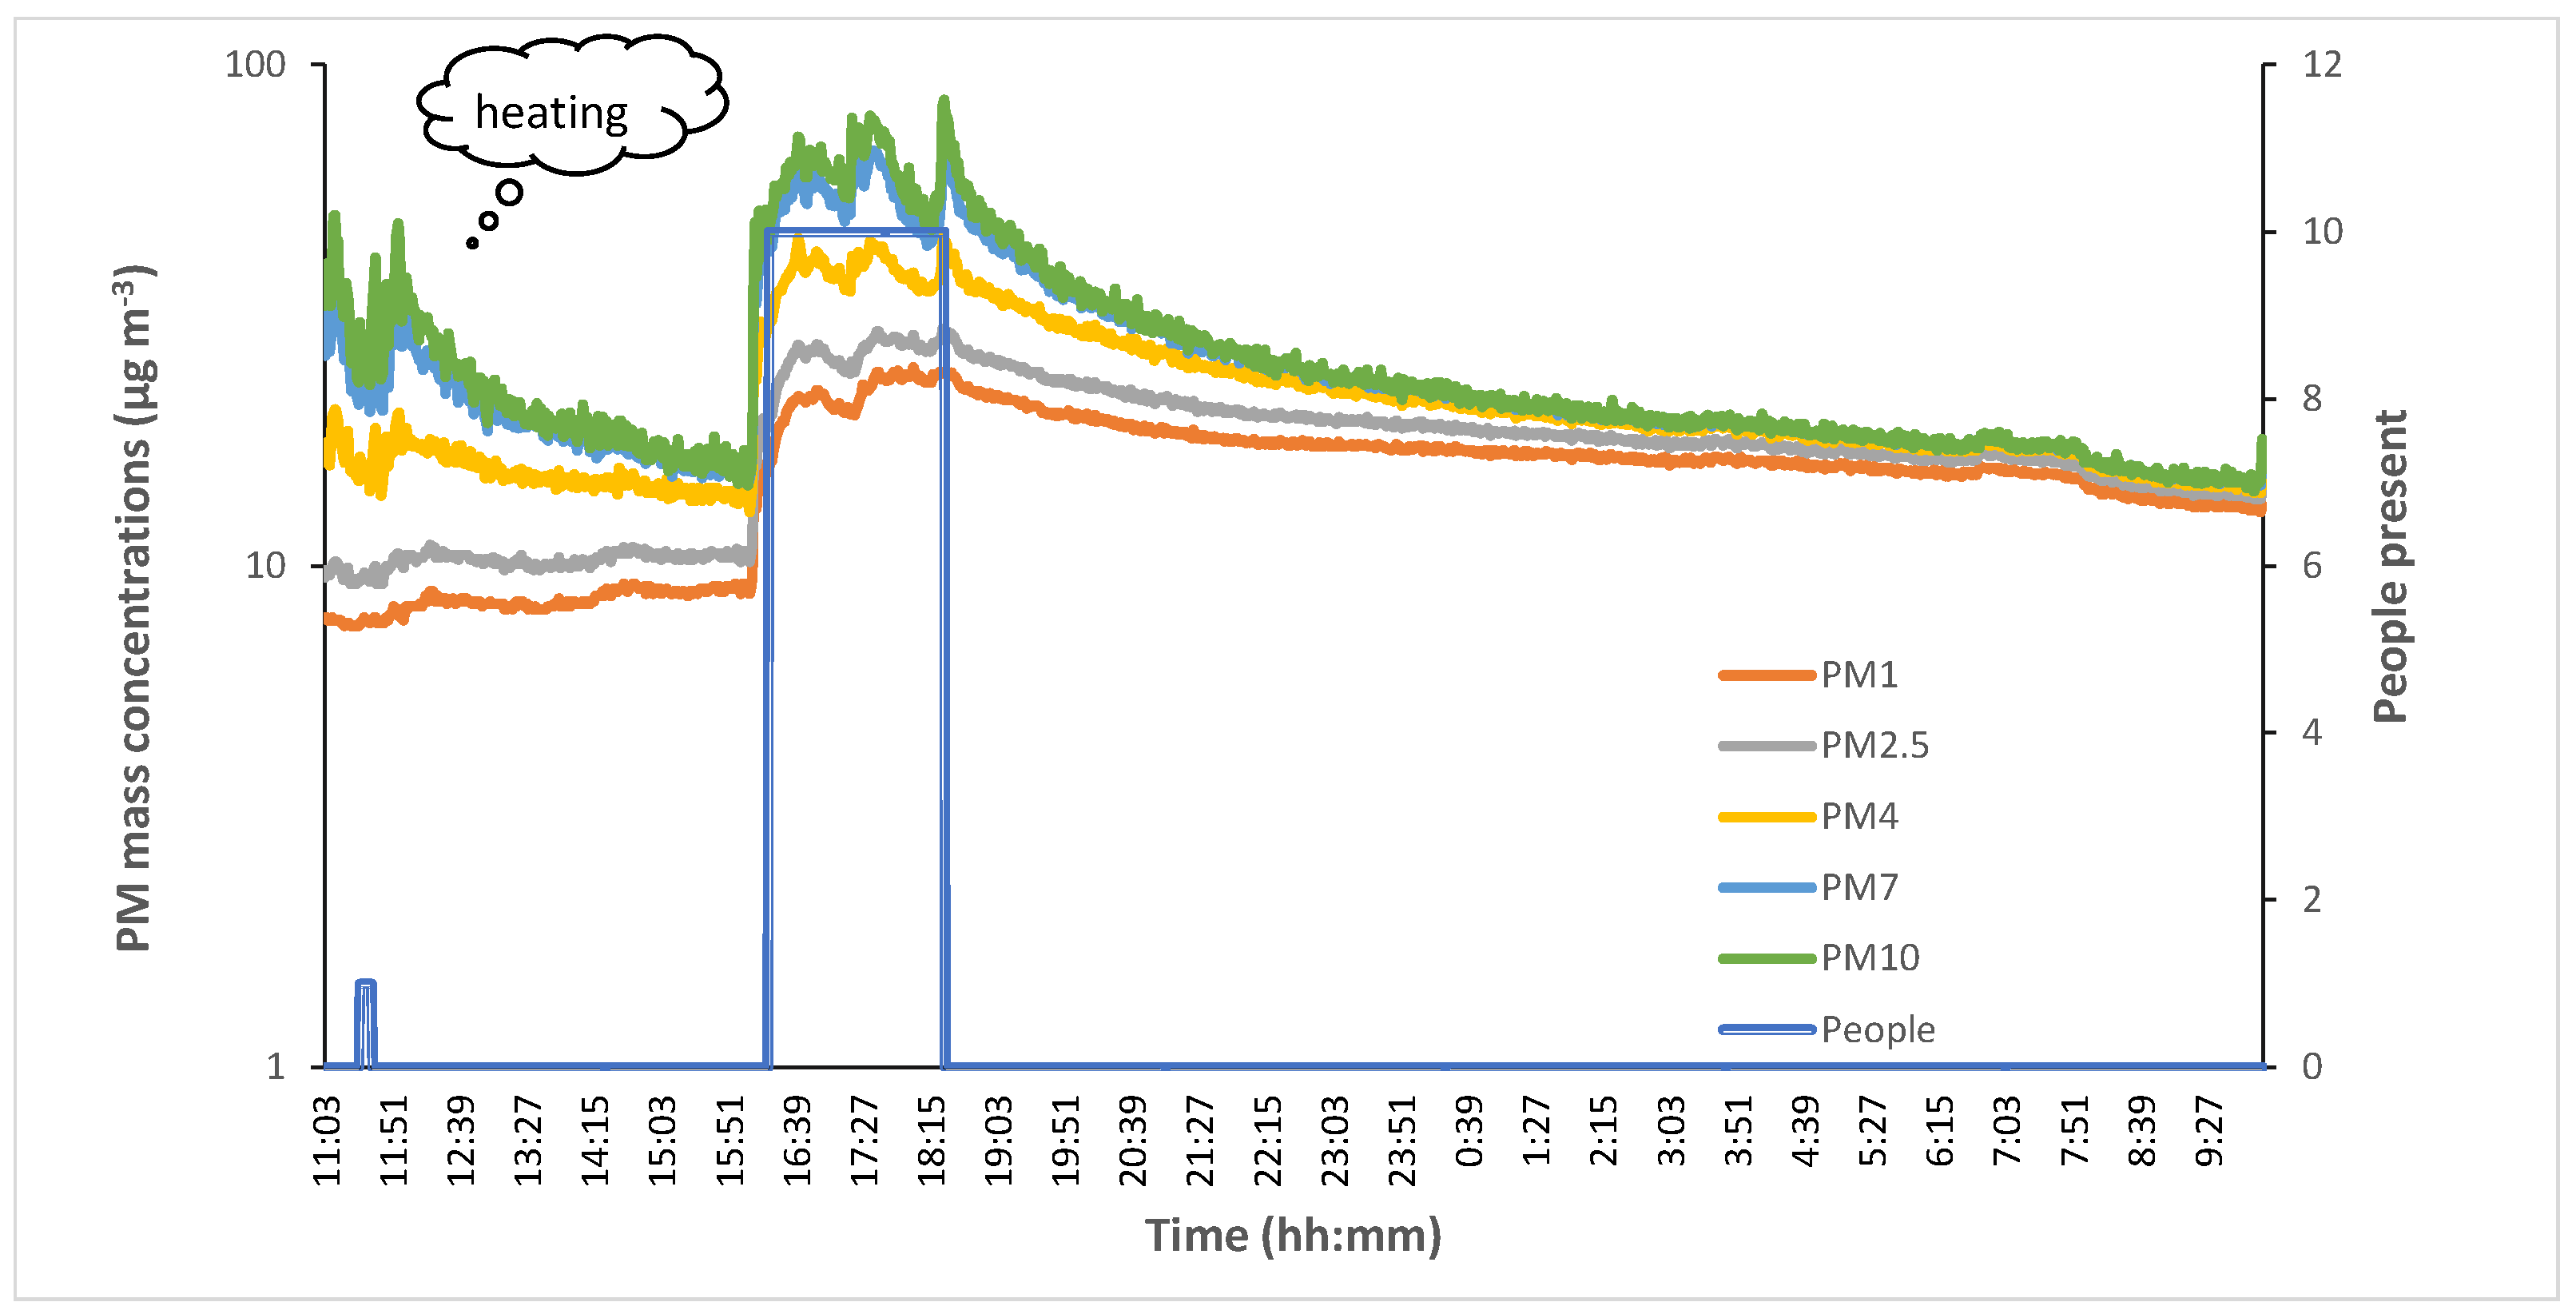
Figure 3 presents an example of the diurnal variation of the PM mass concentration inside the classroom during March 2022. Owing to the COVID-19 pandemic, the number of students that can attend each lecture was restricted to ten, but the room can hold forty persons. On this day, the researcher entered the class at 11:00 and a lecture was held from 16:00 to 19:00 with 10 students present.
The classrooms are heated with floor-mounted fan coils, from 08:00 to 12:00 h. The heating system appears to increase the PM concentrations above 4 μm. The operation of fan coils disturbs the PM concentrations in the breathing zone. They affect the deposition of 2.5, 10, and 25 μm particles, depending on the fan coil air discharge angle and the air flow rate [31].
When the number of students increased from ten to thirty students, PM concentrations increased from 11% (PM1) to 68% (PM10) and CO2 and TVOC concentrations increased by 223% and 65%, respectively, on average.
3.3. Campaign 3: Class and Air Purifier (October)
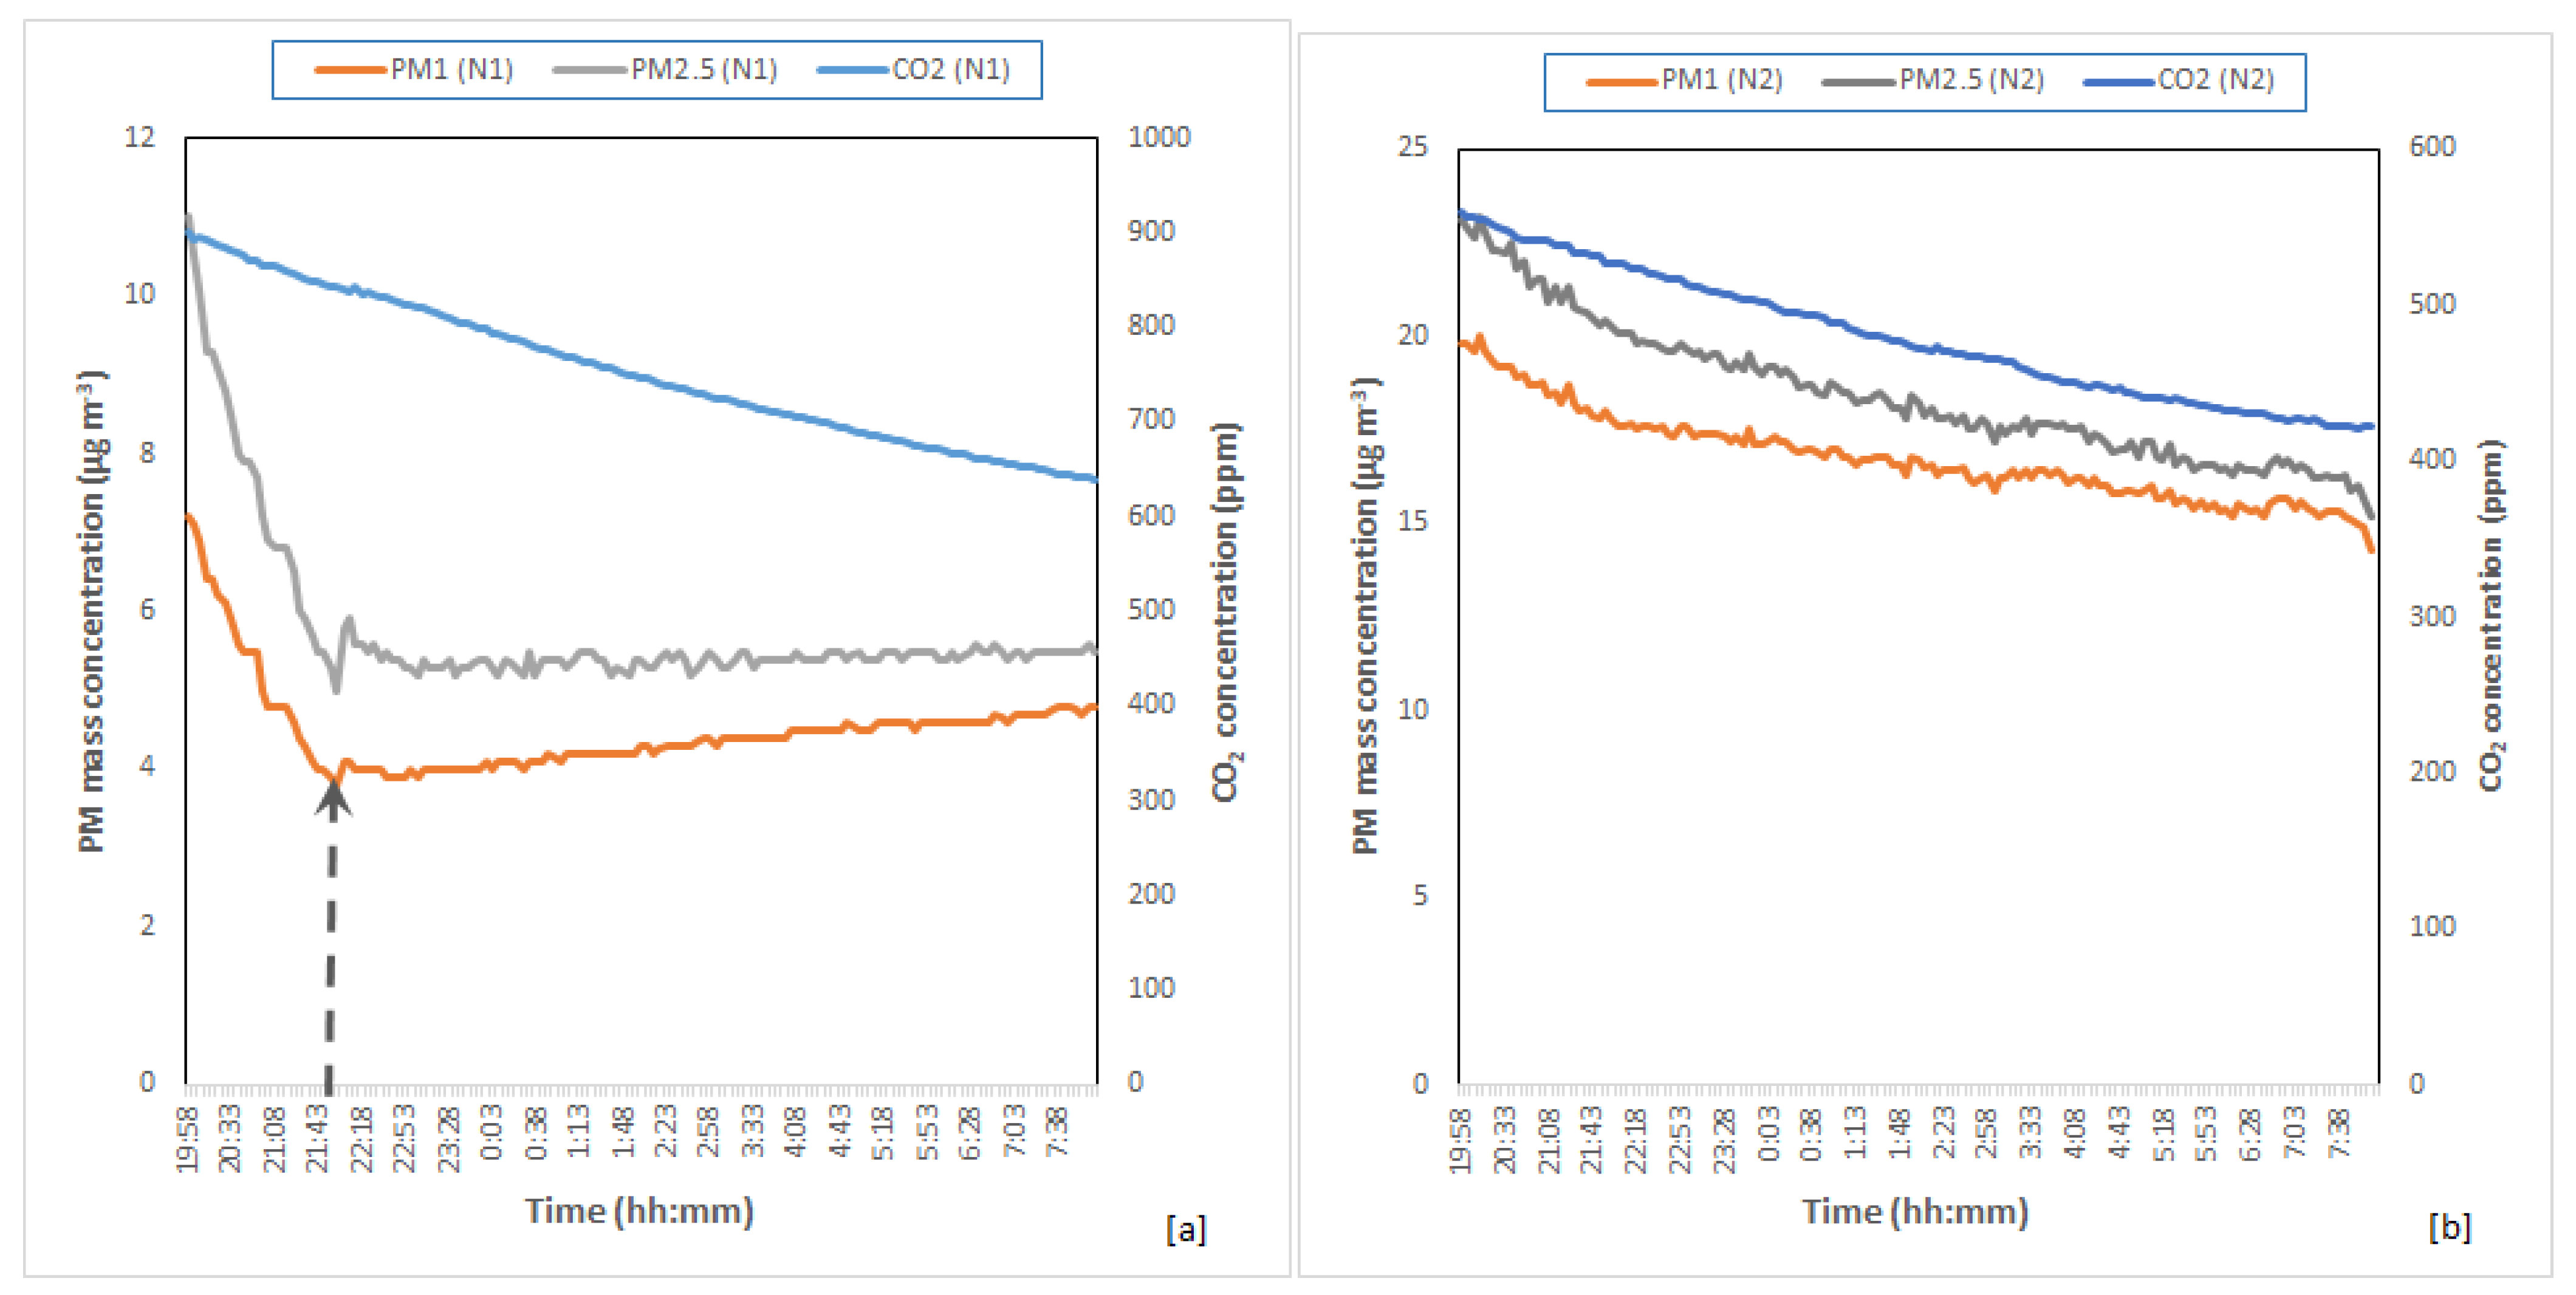
Figure 4 compares the nighttime time series of the PM1 and PM2.5 mass concentration when the air purifiers were on (Figure 3a) and another night without the air purifiers in operation (Figure 3b).
There was no heating and the windows and the door were closed. The air exchange rate (ACH) was 0.1 h−1 in both cases. Only the PM concentrations were affected by the air purifier operation. After 21:43, the researcher had to stop the purifier. The larger particles, above 2.5 μm, decayed clearly until the next morning (not presented in Figure 4a). The concentrations of PM1 and PM2.5 slightly increased after the air purifier was turned off—a battle between coagulation and decay. CO and CO2 were not affected; they decayed as they did every night. The TVOC retained an almost constant concentration on all nights. O3 was not generated by the operation of the air purifier.
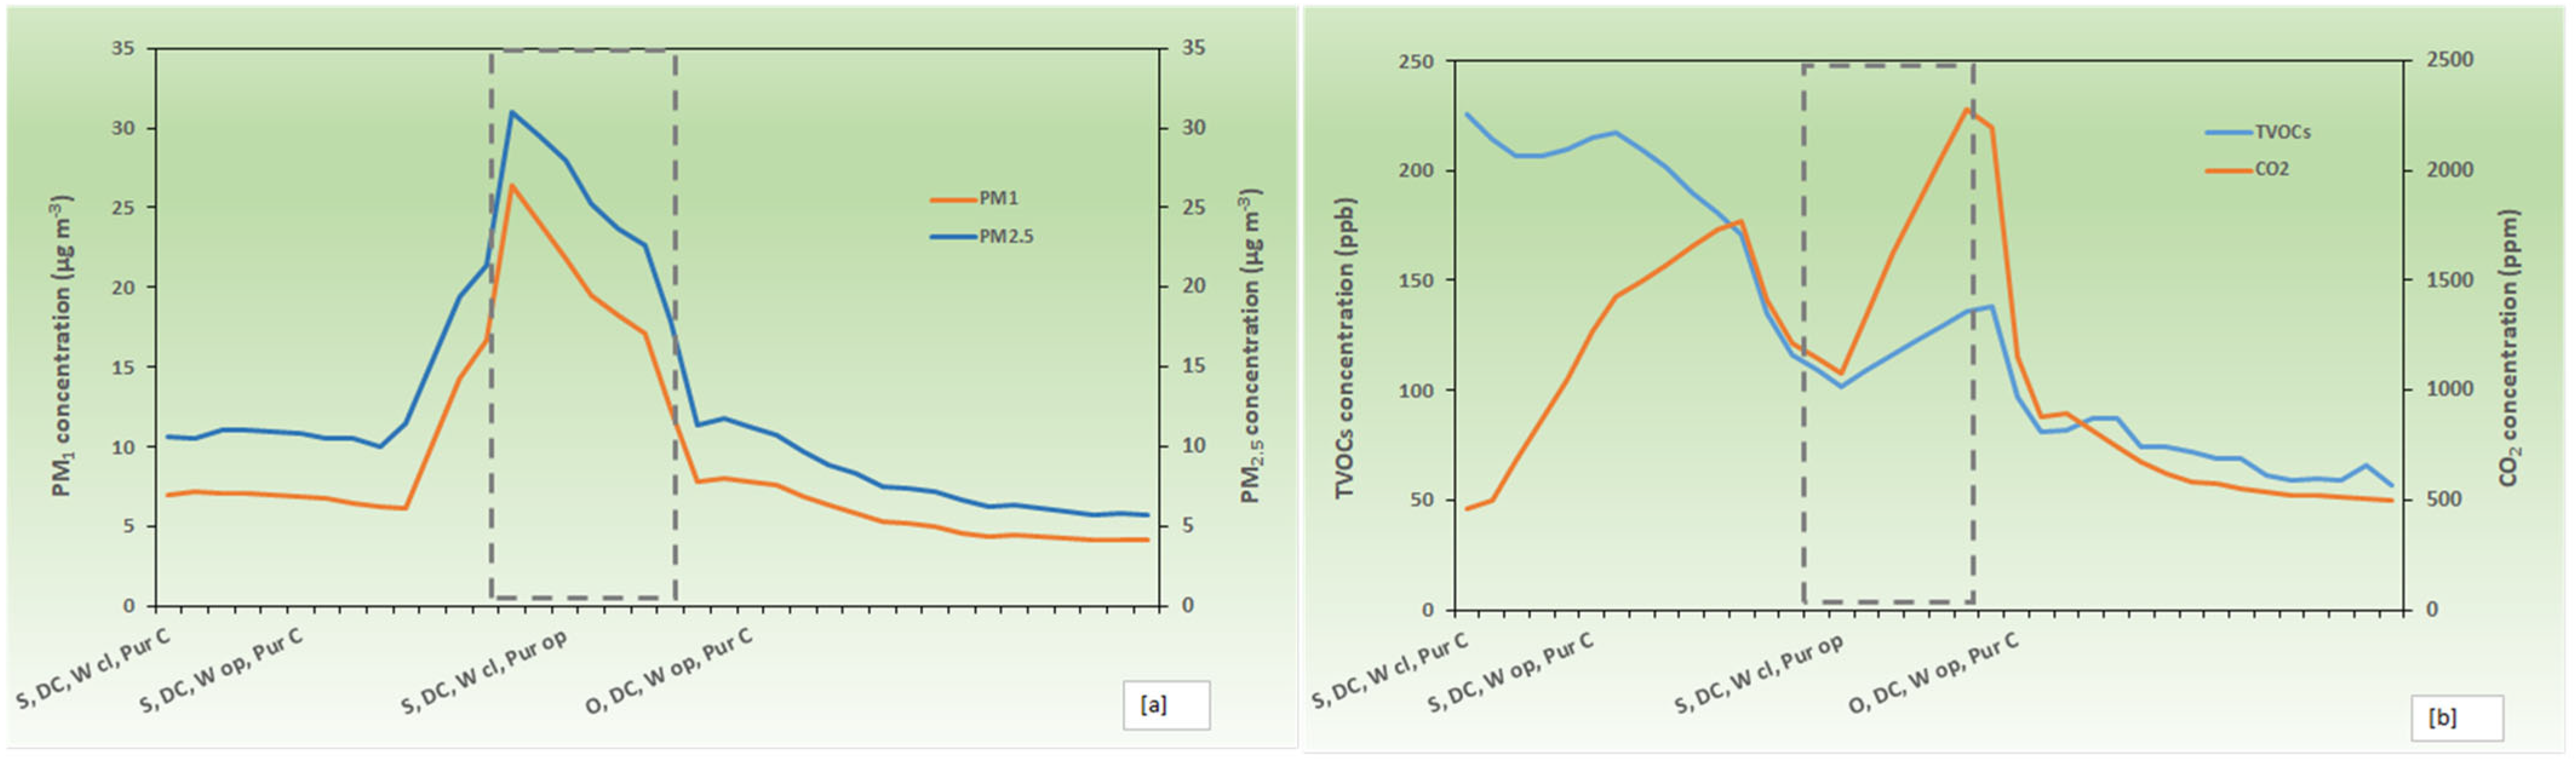
The IAQ monitoring continued during lecture times to test the air purifier. Figure 5 depicts some characteristic events in the Class, with forty students attending a lecture. After class started, students came in, left during the intermission, and then returned. The door and windows opened and closed from time to time. Although the operation of the air purifier reduced PM concentrations (Figure 5a), it did not reduce the other gaseous air pollutants (Figure 5b). The best way to reduce indoor air pollution on days with good outdoor air quality is to open the windows and doors if the weather is mild and the buildings are not heated.
Table 3 depicts the descriptive statistics of the atmospheric pollutant concentrations, the air temperature, and RH for the Campaign 2 and 3. During the third campaign, the air purifier worked occasionally, according to the experimental design selected in the present work. The concentrations in Table 3 were averaged by event, i.e., S = students present, W cl or W op = windows closed or open, DC or D op = door closed or open, O = empty room, and Pur C or Pur op = air purifier closed or open.
4. Discussion
Outdoor air pollution in the city of Xanthi (66.162 inhabitants and population density of 136.6 inhabitants/km2) is not elevated, except during times with biomass burning for central heating and during Saharan dust episodes [29]. Hence, indoor sources in buildings are crucial for the IAQ [32]. The indoor air quality data in the present study, acquired during times with low outdoor air pollution levels, can be traced to indoor air pollutant sources in our university teaching rooms, such as students and PCs’ operation. The experiments were also designed to examine the cleaning effect of air purifiers.
4.1. People’s Presence
In Campaign 1, the maximum people in the Lab was 12 students and that in the office was 2–3 persons. The effect of human debris and particle resuspension is depicted in Figure 2a,b. Walking-induced particle resuspension depends not only on the size of the particles, but also on the flooring material, the walking rate, and the RH [33]. In these rooms (no carpeting), re-suspension was significant in all size ranges [9]. The effect of the human activity on PM concentrations was more pronounced in the case of the 12 students that entered the Lab to use the computers: PM mass concentration increased during the class from 2.2 times (PM1) to 5.1 times (PM10) on average from their background levels. Air temperature was increased by 25% and RH decreased by 24% for the same period of time. Peak PM concentrations were recorded mainly in the Lab, when people entered the room. This can be attributed not only to the movement of people, but also to the increased atmospheric turbulence emerged from the opening of the door [34]. As can be seen in Figure 2, the PM concentrations had their lowest levels inside the Lab, when it was empty and there were no PCs in operation. The air exchange rate during these times was low because doors and the window were kept closed.
In Campaign 2, the number of people in the Class was usually 10 to 12 and, once, 30 students were present. Although human presence was minimized during this period, owing to COVID-19 restrictions, the PM concentrations remained higher than in the Office or in the Lab, even after the Class was empty and closed. The classrooms were refurbished and became airtight in 2021 with new windows and doors. In the classroom under study, the air exchange rate was decreased after renovation from 0.92 ± 0.37 h−1 (from past monitoring CO2 campaigns) to 0.53 ± 0.67 h−1. During lecture times, indoor concentrations can be 3 to 7 times higher than in empty classrooms. People emit particles from their skin, cloths, and by breathing, while either walking, sitting, or working. Licina et al. [35], in a series of experiments in a controlled environmental chamber, examined human emissions from several indoor activities, using stationary monitors and a personal monitor. Their experimental results have shown that the mass rate of indoor emissions tends to increase with particle size, in the range of particle size diameters between 0.3 and 10 μm. They calculate that the emission rates of total particles larger than 1 μm from a single occupant to be (average ± standard deviation) 20 ± 2.0 million particles per h for walking, and this rate was 8 ± 3 million particles per h when the occupant was seated with moderate movement. It is interesting that they found that the exposure of a sitting occupant (in their chamber, with low background PM concentrations) was 2–13 μg m−3 higher than in the case of walking, because of the heterogeneously distributed PM. The addition of a second occupant in the chamber further increased the exposure of the first occupant. A common activity in the teaching classes is the handling of paper. This activity was found to emit 105 particles per min, about two times higher than the emission associated with shedding from the human envelope itself for one occupant inside their test chamber [35]. On the contrary, computer work, as in our Lab, had a minimal effect on the personal PM10 concentrations.
Heating devices also affected the indoor PM concentrations. Classrooms are heated with floor-mounted fan coils. When they operated (usually two to four hours in the morning), they also enhanced and disturbed the PM concentrations.
4.2. Air Purifier
In Campaign 3, many more students attended the lectures in the Class. In this case, the role of the new air purifier was examined. The operation of the air purifier reduced PM concentrations, but it did not reduce the other gaseous air pollutants, as can be seen in Table 3 and Figure 4 and Figure 5. The opening of the windows with the door opened (cross ventilation), or without the door opened, reduced the indoor concentration of all of the monitored pollutants, as the outdoor air pollution was low.
In the Office and in the Lab the PM2.5 and PM10 concentrations did not exceed the AQG values. Some days in the Class, the 24 h average PM2.5 concentrations exceeded 15 μg m−3 and the 24 h average PM10 concentrations exceeded 45 μg m−3, but never when the air purifier was in operation. Although the air purifier decreases the monitored PM concentrations, it is questionable if it can also decrease the ultrafine PM, such as viruses in the size range of 100–350 nm before atmospheric aging [4,36]. In the present study, during the night, in stagnant air, the PM decrease ranged between 44% (PM1) and 73% (PM10); the larger the size of the PM, the larger the reduction. During lecture times, the PM decrease exhibited large variability due to the human activity.
4.3. PCs’ Operation
The operation of some electrical devices can affect indoor air pollutants. When computers were on, their screens became positively charged. Ionized or not airborne particles, when flying near a positively charged screen, were attracted to the screen. Either the negatively charged particles are attracted by the positive charge of the screen or the screen induced a charge in the particles, pulling the negative charges closer to it and pushing the positive charges away. In any case, particles can be attracted by the computer’s screen, stick on it, and be removed from the air. Charged particles can collide to create larger particles. Turbulence can also be created by PC fans, causing settled particles to return to the air.
In order to examine the effect of the operation of the PCs on mean PM concentrations, a one-way ANOVA was conducted. From the whole dataset the values were excluded when there was human presence, because this presence masked the PCs’ effect. ANOVA confirmed that the operation of PCs affects the mean PM mass concentrations and increased the variability in the PM concentration in all sizes. Although the results are statistically significant at p < 0.001, the mean PM concentration differences are very small, approximately 0.5 μg m−3. Therefore, the operation of PCs cannot be considered to be an important factor affecting indoor PM levels, as, for example, human presence does. Furthermore, TVOC was not increased when PCs were left on in an empty Lab for 12 h.
4.4. Gaseous Air Pollutants
Concerning the gaseous air pollutants, in any of the rooms under study, the CO2 concentrations were clearly affected by people’s breath and, after closing the rooms, they decayed to the background (outdoor) levels until the next morning. In the airtight Class, during the night time, when the class room remained empty with the door and the windows closed, this decay lasted for approximately, 12 h, i.e., a very low ACH equal to 0.1 h−1. The maximum CO2 concentration, i.e., 3130 ppm, was observed in the Class with 42 students present. When the attendance was high (30–42 students) and windows and the door were kept closed, CO2 concentrations ranged between 861 ppm (percentile 10%) and 2746 ppm (percentile 90%), indicating a moderate to poor IAQ [23]. In this building, there were no indoor CO sources, outdoor CO concentrations were low, and hence indoor concentrations were not elevated. The worst case for CO concentrations was when more than 30 students attended the class and the windows and door were closed, that is, 696.5 (SD = ±392.3) ppb. The O3 and NO2 concentrations were below the AQG proposed by WHO (2021) [14].
TVOC was enhanced by people’s presence and the operation of the PCs appeared to not contribute to their concentrations. The maximum TVOC concentration was 267 ppb and the proposed AQG of 146.7 ppb (600 μg m−3) was exceeded when 40 students were present. This is another indicator of poor IAQ. During the night, after an initial drop, TVOC concentrations remained almost constant between 82 and 121 ppb, reaching the outdoor values.
5. Conclusions
Indoor air quality (namely PM mass concentrations in five sizes range; CO, CO2, O3, NO, NO2, and TVOC concentrations; along with temperature and relative humidity) was examined in a university building. This was carried out in an office of a professor, a nearby laboratory with PCs for studying by the students, and in a classroom that is refurbished to be airtight and with a brand new air purifier. The main indoor air pollutant source was humans. PM mass concentrations increased in all size ranges when students were present, as did TVOC and CO2 concentrations. The operation of the twelve PCs in the small laboratory did not contribute to any of the air pollutants under study. Individual VOC monitoring will perhaps provide different results [37].
In the refurbished classrooms, with new frames and doors, air purifiers were installed. The air purifier can reduce the PM in all sizes, in a percentage that varies with the time, the number of students that attended a lecture, their movement, and the opening of the door and the windows. The air purifier did not reduce any other air pollutant. The most effective way to reduce all of the pollutants, such as CO2 or TVOC, was to enhance the natural ventilation with the windows and door opened, a method suitable in the case of low outdoor air pollution.
Poor air quality degrades the academic performance of the students, making life more difficult for the students and the staff. Continuous monitoring is needed to accomplish the need for clean air in any building, according to its unique characteristics.
Author Contributions
Methodology, G.D.; Formal analysis, G.L.; Investigation, G.D. and D.L.; Data curation, G.L.; Writing—original draft, G.L.; Writing—review & editing, S.R.; Supervision, S.R. All authors have read and agreed to the published version of the manuscript.
Funding
This research received no external funding.
Institutional Review Board Statement
Not applicable.
Informed Consent Statement
Not applicable.
Data Availability Statement
Data available on request due to restrictions (privacy).
Conflicts of Interest
The authors declare no conflict of interest.
References
- Krüger, E.L.; Zannin, P.H. Acoustic, thermal and luminous comfort in classrooms. Build. Environ. 2004, 39, 1055–1063. [Google Scholar] [CrossRef]
- Wyon, D.P. The effects of indoor air quality on performance and productivity. Indoor Air 2004, 14, 92–101. [Google Scholar] [CrossRef] [PubMed]
- Loupa, G. Influence of Noise on Patient Recovery. Curr. Pollut. Rep. 2020, 6, 1–7. [Google Scholar] [CrossRef]
- Loupa, G.; Karali, D.; Rapsomanikis, S. Aerosol filtering efficiency of respiratory face masks used during the COVID-19 pandemic. medRxiv 2020. [Google Scholar] [CrossRef]
- Moghadam, T.T.; Ochoa Morales, C.E.; Lopez Zambrano, M.; Bruton, K.; O’Sullivan, D.T.J. The indoor air quality, ventilation and energy nexus in the COVID-19 context. In Proceedings of the CLIMA 2022 Conference, Rotterdam, The Netherlands, 22–25 May 2022. [Google Scholar] [CrossRef]
- Rivas, I.; Fussell, J.C.; Kelly, F.J.; Querol, X. Indoor sources of air pollutants. In Indoor Air Pollution; Book Series: Issues in Environmental Science and Technology; The Royal Society of Chemistry: London, UK, 2019; pp. 1–34. ISBN 978-1-78801-617-9. [Google Scholar] [CrossRef]
- Samet, J.M.; Marbury, M.C.; Spengler, J.D. Health effects and sources of indoor air pollution. Part I. Am. Rev. Respir. Dis. 1987, 136, 1486–1508. [Google Scholar] [CrossRef]
- Spengler, J.D.; Samet, J.M.; McCarthy, J.F. Indoor Air Quality Handbook; McGraw-Hill Companies Inc.: New York, NY, USA, 2001. [Google Scholar]
- Loupa, G.; Kioutsioukis, I.; Rapsomanikis, S. Indoor-Outdoor Atmospheric Particulate Matter Relationships in Naturally Ventilated Offices. Indoor Built Environ. 2007, 16, 63–69. [Google Scholar] [CrossRef]
- Sarbu, I.; Pacurar, C. Experimental and numerical research to assess indoor environment quality and schoolwork performance in university classrooms. Build. Environ. 2015, 93, 141–154. [Google Scholar] [CrossRef]
- Deng, S.; Lau, J. Seasonal variations of indoor air quality and thermal conditions and their correlations in 220 classrooms in the Midwestern United States. Build. Environ. 2019, 157, 79–88. [Google Scholar] [CrossRef]
- Kabirikopaei, A.; Lau, J.; Nord, J.; Bovaird, J. Identifying the K-12 classrooms’ indoor air quality factors that affect student academic performance. Sci. Total Environ. 2021, 786, 147498. [Google Scholar] [CrossRef]
- Seseña, S.; Rodríguez, A.M.; Palop, M.L. Indoor air quality analysis in naturally ventilated university training laboratories: A health risk assessment. Air Qual. Atmos. Health 2022, 15, 1817–1837. [Google Scholar] [CrossRef]
- World Health Organization. WHO Global Air Quality Guidelines: Particulate Matter (PM2.5 and PM10), Ozone, Nitrogen Dioxide, Sulfur Dioxide and Carbon Monoxide; World Health Organization: Geneva, Switzerland, 2021. [Google Scholar]
- Argunhan, Z.; Avci, A.S. Statistical Evaluation of Indoor Air Quality Parameters in Classrooms of a University. Adv. Meteorol. 2018, 2018, 4391579. [Google Scholar] [CrossRef]
- Erlandson, G.; Magzamen, S.; Carter, E.; Sharp, J.L.; Reynolds, S.J.; Schaeffer, J.W. Characterization of indoor air quality on a college campus: A pilot study. Int. J. Environ. Res. Public Health 2019, 16, 2721. [Google Scholar] [CrossRef] [Green Version]
- Szczepanik-Scislo, N.; Antonowicz, A.; Scislo, L. PIV measurement and CFD simulations of an air terminal device with a dynamically adapting geometry. SN Appl. Sci. 2019, 1, 370. [Google Scholar] [CrossRef] [Green Version]
- McLeod, R.S.; Mathew, M.; Salman, D.; Thomas, C.L.P. An Investigation of Indoor Air Quality in a Recently Refurbished Educational Building. Front. Built Environ. 2022, 7, 769761. [Google Scholar] [CrossRef]
- Choe, Y.; Shin, J.-S.; Park, J.; Kim, E.; Oh, N.; Min, K.; Kim, D.; Sung, K.; Cho, M.; Yang, W. Inadequacy of air purifier for indoor air quality improvement in classrooms without external ventilation. Build. Environ. 2022, 207, 108450. [Google Scholar] [CrossRef]
- Yang, A. The cost of clean air: A price analysis of air filtration technology. arXiv 2022, arXiv:2208.06041. [Google Scholar]
- Salis, L.C.R.; Abadie, M.; Wargocki, P.; Rode, C. Towards the definition of indicators for assessment of indoor air quality and energy performance in low-energy residential buildings. Energy Build. 2017, 152, 492–502. [Google Scholar] [CrossRef]
- Shrubsole, C.; Dimitroulopoulou, S.; Foxall, K.; Gadeberg, B.; Doutsi, A. IAQ guidelines for selected volatile organic compounds (VOCs) in the UK. Build. Environ. 2019, 165, 106382. [Google Scholar] [CrossRef]
- Satish, U.; Mendell, M.J.; Shekhar, K.; Hotchi, T.; Sullivan, D.; Streufert, S.; Fisk, W.J. Is CO2 an indoor pollutant? Direct effects of low-to-moderate CO2 concentrations on human decision-making performance. Environ. Health Perspect. 2012, 120, 1671–1677. [Google Scholar] [CrossRef] [PubMed]
- Lowther, S.D.; Dimitroulopoulou, S.; Foxall, K.; Shrubsole, C.; Cheek, E.; Gadeberg, B.; Sepai, O. Low Level Carbon Dioxide Indoors—A Pollution Indicator or a Pollutant? A Health-Based Perspective. Environments 2021, 8, 125. [Google Scholar] [CrossRef]
- Nico, M.A.; Liuzzi, S.; Stefanizzi, P. Evaluation of thermal comfort in university classrooms through objective approach and subjective preference analysis. Appl. Ergon. 2015, 48, 111–120. [Google Scholar] [CrossRef] [PubMed]
- Toyinbo, O.; Shaughnessy, R.; Turunen, M.; Putus, T.; Metsämuuronen, J.; Kurnitski, J.; Haverinen-Shaughnessy, U. Building characteristics, indoor environmental quality, and mathematics achievement in Finnish elementary schools. Build. Environ. 2016, 104, 114–121. [Google Scholar] [CrossRef]
- Wolrd Health Organization. WHO Guidelines for Indoor Air Quality: Selected Pollutants; Wolrd Health Organization: Geneva, Switzerland, 2010. [Google Scholar]
- Loupa, G.; Polyzou, C.; Zarogianni, A.M.; Ouzounis, K.; Rapsomanikis, S. Indoor and outdoor elemental mercury: A comparison of three different cases. Environ. Monit. Assess. 2017, 189, 72. [Google Scholar] [CrossRef]
- Loupa, G.; Kryona, Z.P.; Pantelidou, V.; Rapsomanikis, S. Are PM2.5 in the Atmosphere of a Small City a Threat for Health? Sustainability 2021, 13, 11329. [Google Scholar] [CrossRef]
- Qian, J.; Peccia, J.; Ferro, A.R. Walking-induced particle resuspension in indoor environments. Atmos. Environ. 2014, 89, 464–481. [Google Scholar] [CrossRef]
- Taheri, M.; Zolfaghari, S.A.; Hassanzadeh, H.; Salmanzadeh, M. Numerical investigation of the effects of fan-coil airflow direction on distribution and deposition of indoor pollutant particles. J. Build. Eng. 2021, 33, 101547. [Google Scholar] [CrossRef]
- Cichowicz, R.; Stelęgowski, A. Average hourly concentrations of air contaminants in selected urban, town, and rural sites. Arch. Environ. Contam. Toxicol. 2019, 77, 197–213. [Google Scholar] [CrossRef] [Green Version]
- You, S.; Wan, M.P. Experimental investigation and modelling of human-walking-induced particle resuspension. Indoor Built Environ. 2014, 24, 564–576. [Google Scholar] [CrossRef]
- Papakonstantis, I.G.; Hathway, E.A.; Brevis, W. An experimental study of the flow induced by the motion of a hinged door separating two rooms. Build. Environ. 2018, 131, 220–230. [Google Scholar] [CrossRef]
- Licina, D.; Tian, Y.; Nazaroff, W.W. Emission rates and the personal cloud effect associated with particle release from the perihuman environment. Indoor Air 2017, 27, 791–802. [Google Scholar] [CrossRef] [PubMed] [Green Version]
- Hammond, A.; Khalid, T.; Thornton, H.V.; Woodall, C.A.; Hay, A.D. Should homes and workplaces purchase portable air filters to reduce the transmission of SARS-CoV-2 and other respiratory infections? A systematic review. PLoS ONE 2021, 16, e0251049. [Google Scholar] [CrossRef] [PubMed]
- Bako-Biro, Z.; Wargocki, P.; Weschler, C.J.; Fanger, P.O. Effects of pollution from personal computers on perceived air quality, SBS symptoms and productivity in offices. Indoor Air 2004, 14, 178–187. [Google Scholar] [CrossRef] [PubMed]
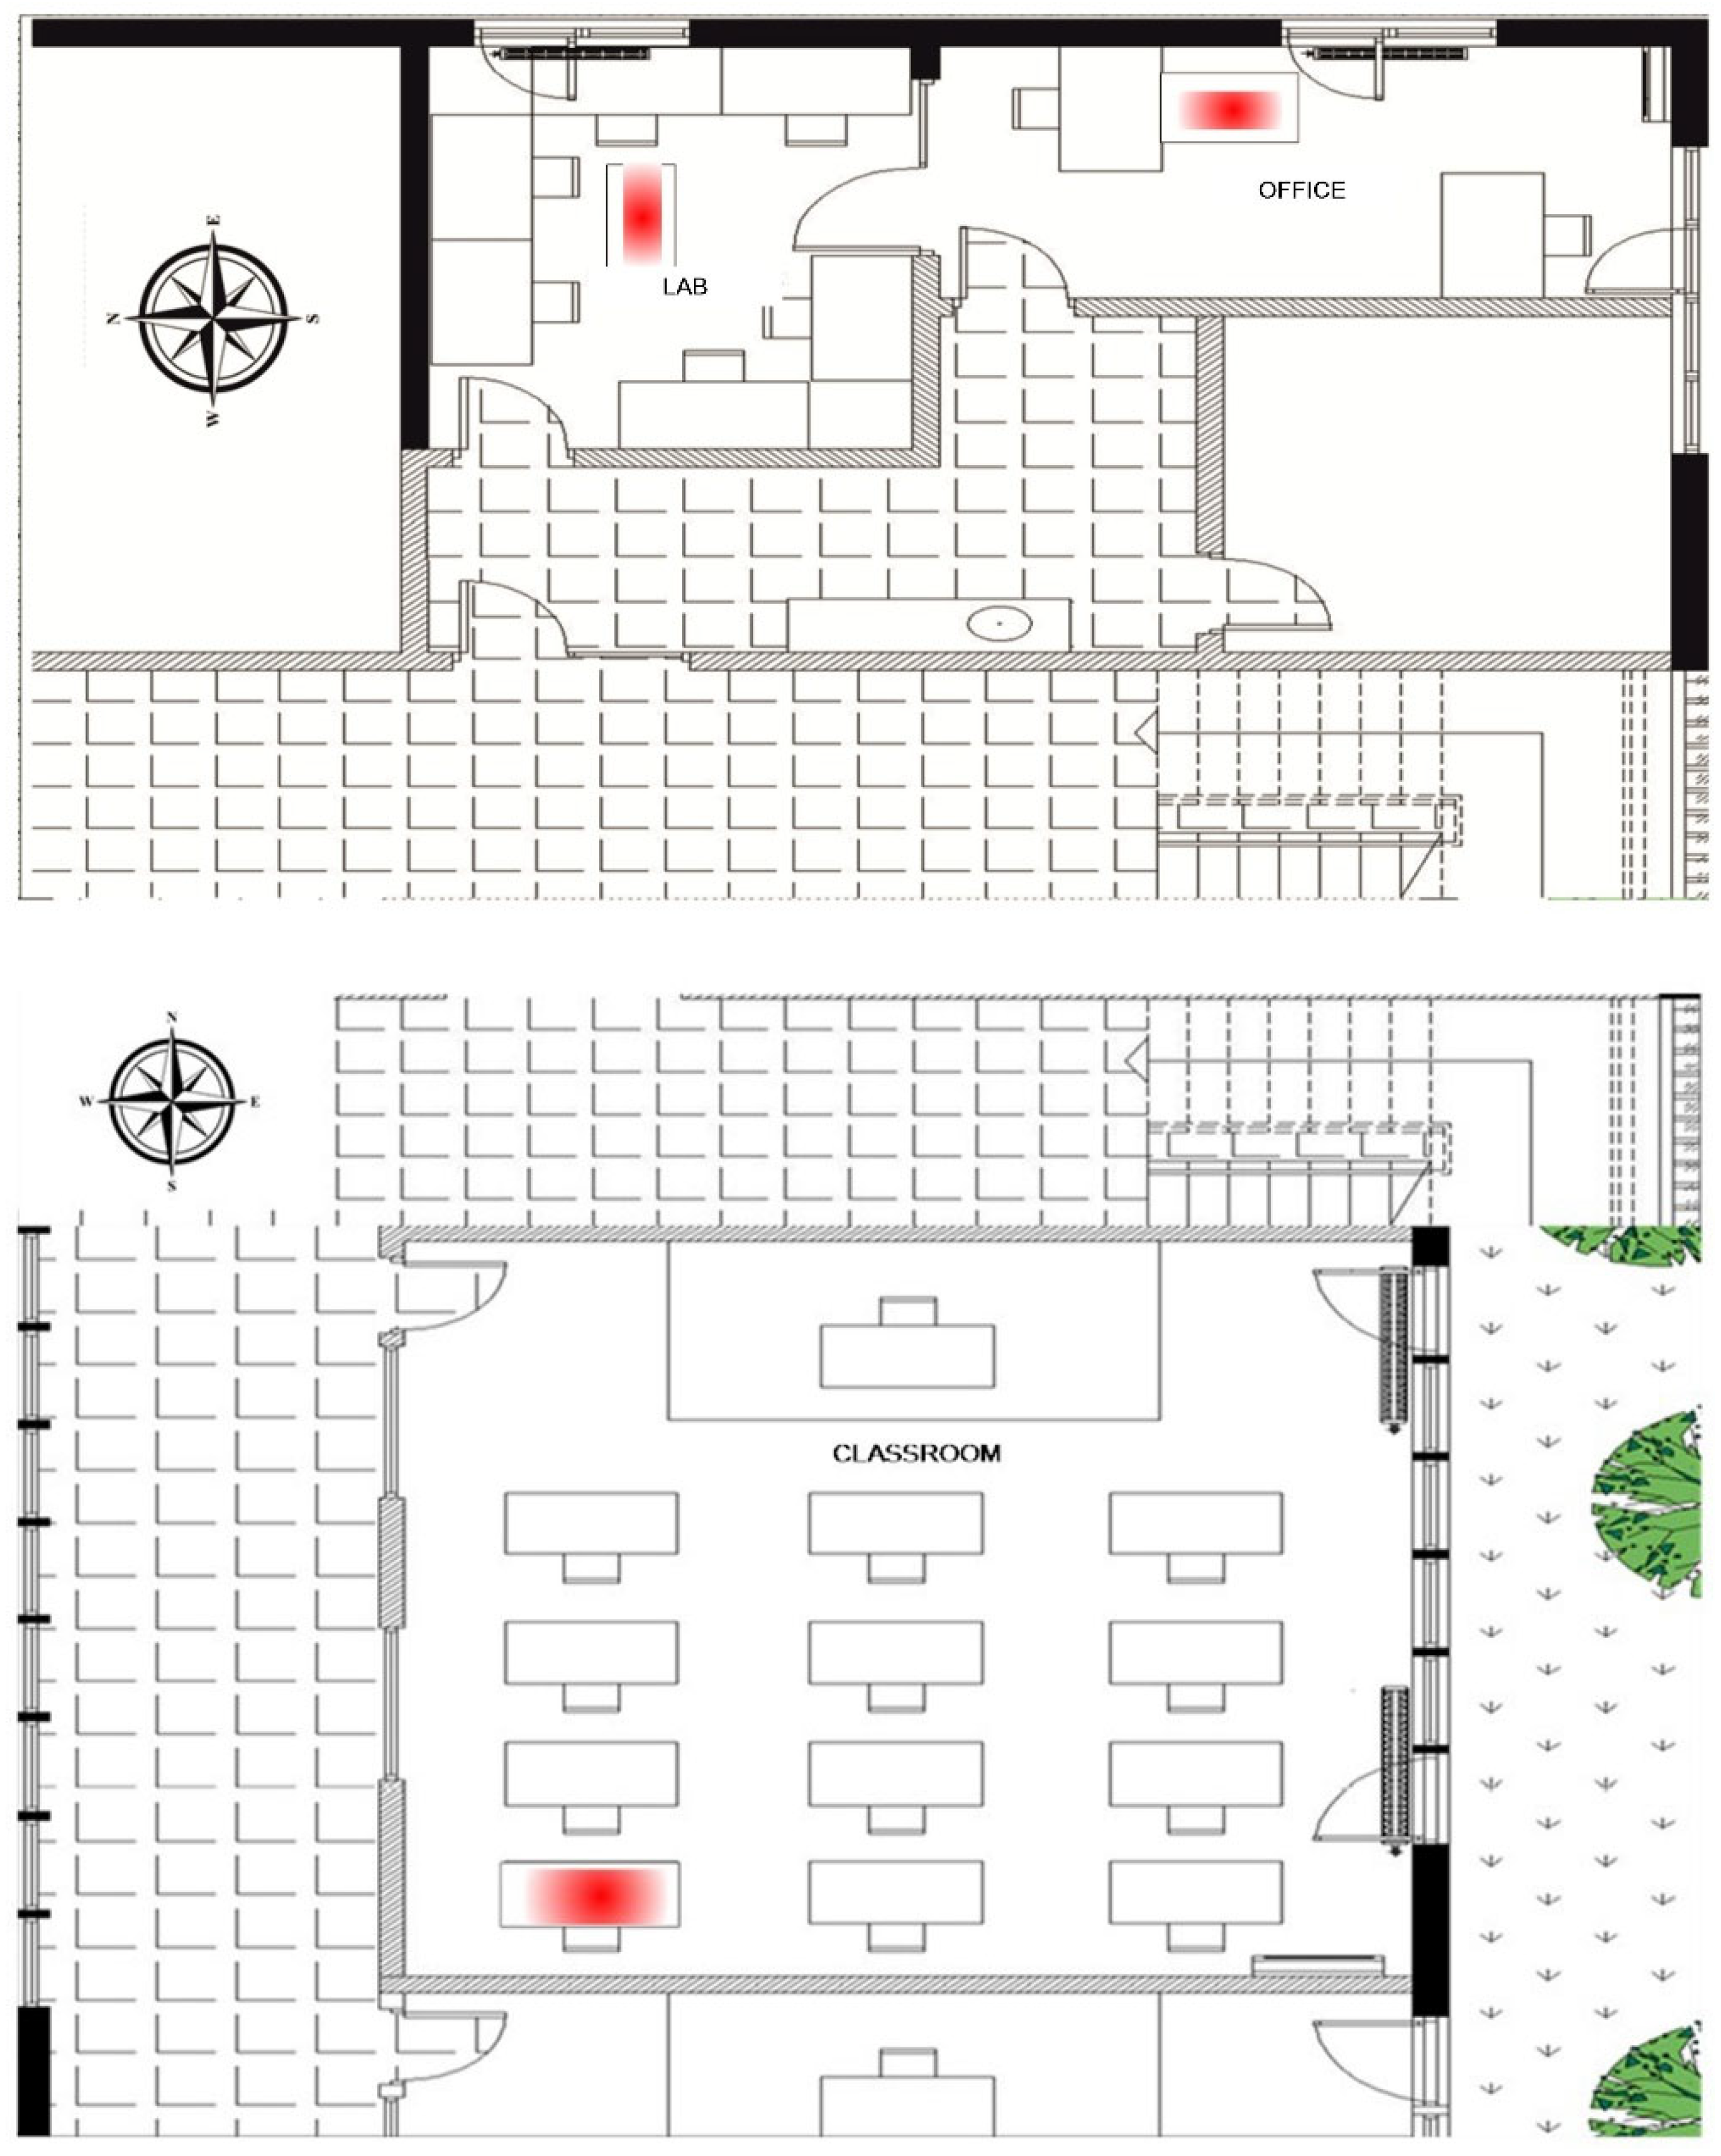
Figure 1.
Floor plans of the Office, the computer center (Lab), and the small lecture room; the red rectangle is the location of the monitoring station.
Figure 1.
Floor plans of the Office, the computer center (Lab), and the small lecture room; the red rectangle is the location of the monitoring station.

Figure 2.
(a,b) Campaign 1, Office and Lab: PM mass concentrations, number of people present, and number of operating PCs (inside the Lab).
Figure 2.
(a,b) Campaign 1, Office and Lab: PM mass concentrations, number of people present, and number of operating PCs (inside the Lab).

Figure 3.
Campaign 2, Class: PM mass concentrations and number of people present.

Figure 4.
Campaign 3, Class: Comparison of PM mass concentrations during two nights, (a) with the air purifier in operation (until 21:43 h) and (b) with no air purifier.
Figure 4.
Campaign 3, Class: Comparison of PM mass concentrations during two nights, (a) with the air purifier in operation (until 21:43 h) and (b) with no air purifier.

Figure 5.
Campaign 3, Class: The effect on PM mass concentrations (a) and on gaseous air pollutants (b) of air purifier, people’s presence, and windows or doors being opened during lectures (S = students present, W cl or W op = windows closed or open, DC or D op = door closed or open, O = empty room, and Pur C or Pur op = air purifier closed or open). The dotted rectangle depicts the operation of the air purifier.


Table 1.
Synopsis of the design of experiments.
| Campaign 1: Office and Lab 16/11/2021–23/12/2021) | |||
| Experiments | People presence | Running PCs | Number of experiment repetitions |
| 1 | Yes | No | 3 |
| 2 | No | Yes | 4 |
| 3 | Yes | Yes | 5 |
| 4 | No | No | 3 |
| Campaign 2: Classroom (15/3/2022–22/3/2022) | |||
| People presence | Opening windows and door | Number of experiment repetitions | |
| 1 | Yes | No | 4 |
| 2 | No | Yes | 5 |
| 3 | Yes | Yes | 3 |
| 4 | No | No | 3 |
| Campaign 3: Classroom (11/10/2022–15/10/2022) | |||
| People presence | Air purifier | Number of experiment repetitions | |
| 1 | Yes | No | 4 |
| 2 | No | Yes | 2 |
| 3 | Yes | Yes | 3 |
| 4 | No | No | 3 |
Table 2.
Descriptive statistics of indoor and outdoor atmospheric pollutant concentrations along with air temperature and RH (Campaign 1).
Table 2.
Descriptive statistics of indoor and outdoor atmospheric pollutant concentrations along with air temperature and RH (Campaign 1).
| Office | Lab | Outdoors | ||||
|---|---|---|---|---|---|---|
| Variable | Mean | SD | Mean | SD | Mean | SD |
| PM (μg m−3) | ||||||
| PM1 | 8.56 | 0.54 | 4.85 | 0.94 | 3.33 | 0.08 |
| PM2.5 | 10.34 | 0.91 | 5.57 | 1.42 | 5.00 | 0.19 |
| PM4 | 15.54 | 1.78 | 7.12 | 3.63 | 8.53 | 0.86 |
| PM7 | 20.93 | 2.22 | 8.54 | 7.91 | 13.25 | 1.47 |
| PM10 | 22.90 | 2.43 | 9.13 | 11.30 | 16.48 | 1.68 |
| TSP | 27.36 | 3.42 | 10.18 | 25.15 | 26.75 | 5.26 |
| Gaseous pollutants | ||||||
| TVOC (ppb) | 103.70 | 28.91 | 115.22 | 41.30 | 132.85 | 24.33 |
| CO (ppb) | 387.78 | 100.27 | 377.30 | 242.96 | 428.42 | 106.13 |
| CO2 (ppm) | 530.23 | 67.33 | 532.29 | 90.78 | 517.25 | 147.03 |
| O3 (ppb) | 10.30 | 4.10 | 9.04 | 5.54 | 12.66 | 16.41 |
| NO (ppb) | 9.07 | 3.41 | 8.34 | 5.43 | 12.15 | 7.67 |
| NO2 (ppb) | 12.08 | 2.27 | 10.22 | 7.67 | 14.11 | 3.67 |
| Microclimatic conditions | ||||||
| AT (°C) | 19.04 | 1.33 | 19.27 | 2.32 | 15.70 | 1.10 |
| RH (%) | 38.60 | 1.76 | 43.76 | 6.14 | 45.56 | 4.73 |
Table 3.
Descriptive statistics of indoor and outdoor atmospheric pollutant concentrations along with air temperature and RH (Campaign 2 and 3).
Table 3.
Descriptive statistics of indoor and outdoor atmospheric pollutant concentrations along with air temperature and RH (Campaign 2 and 3).
| Campaign 2 | Campaign 3 (by Event *) | |||||||||
|---|---|---|---|---|---|---|---|---|---|---|
| Variable | S, DC, W cl, Pur C | S, DC, W cl, Pur op | S, DC, Wop, Pur C | O, DC, Wop, Pur C | ||||||
| PM (μg m−3) | ||||||||||
| Mean | SD | Mean | SD | Mean | SD | Mean | SD | Mean | SD | |
| PM1 | 11.31 | 5.81 | 7.35 | 0.98 | 10.62 | 4.01 | 8.11 | 3.08 | 5.40 | 1.27 |
| PM2.5 | 14.32 | 7.52 | 14.26 | 3.18 | 16.50 | 4.65 | 12.57 | 3.52 | 7.69 | 1.81 |
| PM4 | 20.35 | 13.31 | 45.31 | 14.66 | 42.41 | 11.67 | 32.41 | 7.54 | 16.19 | 4.61 |
| PM7 | 25.18 | 19.83 | 95.67 | 33.25 | 85.38 | 26.58 | 68.51 | 18.95 | 29.44 | 10.24 |
| PM10 | 27.03 | 23.05 | 119.32 | 44.00 | 108.94 | 36.80 | 88.26 | 28.33 | 35.66 | 13.88 |
| TSP | 31.20 | 32.07 | 176.33 | 68.97 | 160.70 | 60.43 | 145.61 | 58.47 | 45.51 | 19.42 |
| Gaseous pollutants | ||||||||||
| TVOC (ppb) | 128.77 | 30.54 | 194.58 | 38.79 | 134.41 | 32.10 | 197.86 | 17.72 | 73.64 | 11.92 |
| CO (ppb) | 495.62 | 192.88 | 672.92 | 487.49 | 705.33 | 351.93 | 360.57 | 36.99 | 119.79 | 32.60 |
| CO2 (ppm) | 641.97 | 421.53 | 1273.92 | 554.04 | 2166.37 | 534.78 | 1559.86 | 178.67 | 684.64 | 190.85 |
| O3 (ppb) | 8.23 | 16.66 | 28.33 | 22.50 | 18.15 | 13.31 | 25.67 | 12.70 | 27.30 | 10.67 |
| Microclimatic conditions | ||||||||||
| AT (°C) | 18.66 | 2.12 | 24.87 | 1.25 | 26.05 | 0.93 | 24.40 | 0.21 | 23.65 | 0.28 |
| RH (%) | 41.13 | 9.32 | 46.00 | 5.45 | 49.67 | 5.11 | 43.44 | 0.66 | 32.86 | 2.13 |
* S = students present, W cl or Wop = windows closed or open, DC or D op = door closed or open, O = empty room, Pur C or Pur op = air purifier closed or open.
Publisher’s Note: MDPI stays neutral with regard to jurisdictional claims in published maps and institutional affiliations. |
© 2022 by the authors. Licensee MDPI, Basel, Switzerland. This article is an open access article distributed under the terms and conditions of the Creative Commons Attribution (CC BY) license (https://creativecommons.org/licenses/by/4.0/).
Share and Cite
MDPI and ACS Style
Dabanlis, G.; Loupa, G.; Liakos, D.; Rapsomanikis, S. The Effect of Students, Computers, and Air Purifiers on Classroom Air Quality. Appl. Sci. 2022, 12, 11911. https://doi.org/10.3390/app122311911
AMA Style
Dabanlis G, Loupa G, Liakos D, Rapsomanikis S. The Effect of Students, Computers, and Air Purifiers on Classroom Air Quality. Applied Sciences. 2022; 12(23):11911. https://doi.org/10.3390/app122311911
Chicago/Turabian StyleDabanlis, Georgios, Glykeria Loupa, Dimitrios Liakos, and Spyridon Rapsomanikis. 2022. "The Effect of Students, Computers, and Air Purifiers on Classroom Air Quality" Applied Sciences 12, no. 23: 11911. https://doi.org/10.3390/app122311911
Note that from the first issue of 2016, this journal uses article numbers instead of page numbers. See further details here.