
2D-LiDAR-Sensor-Based Retaining Wall Displacement Measurement System
Abstract
:1. Introduction
2. Retaining Wall Displacement Measurement Review
2.1. Problems with Retaining Wall Displacement Measuring Instruments
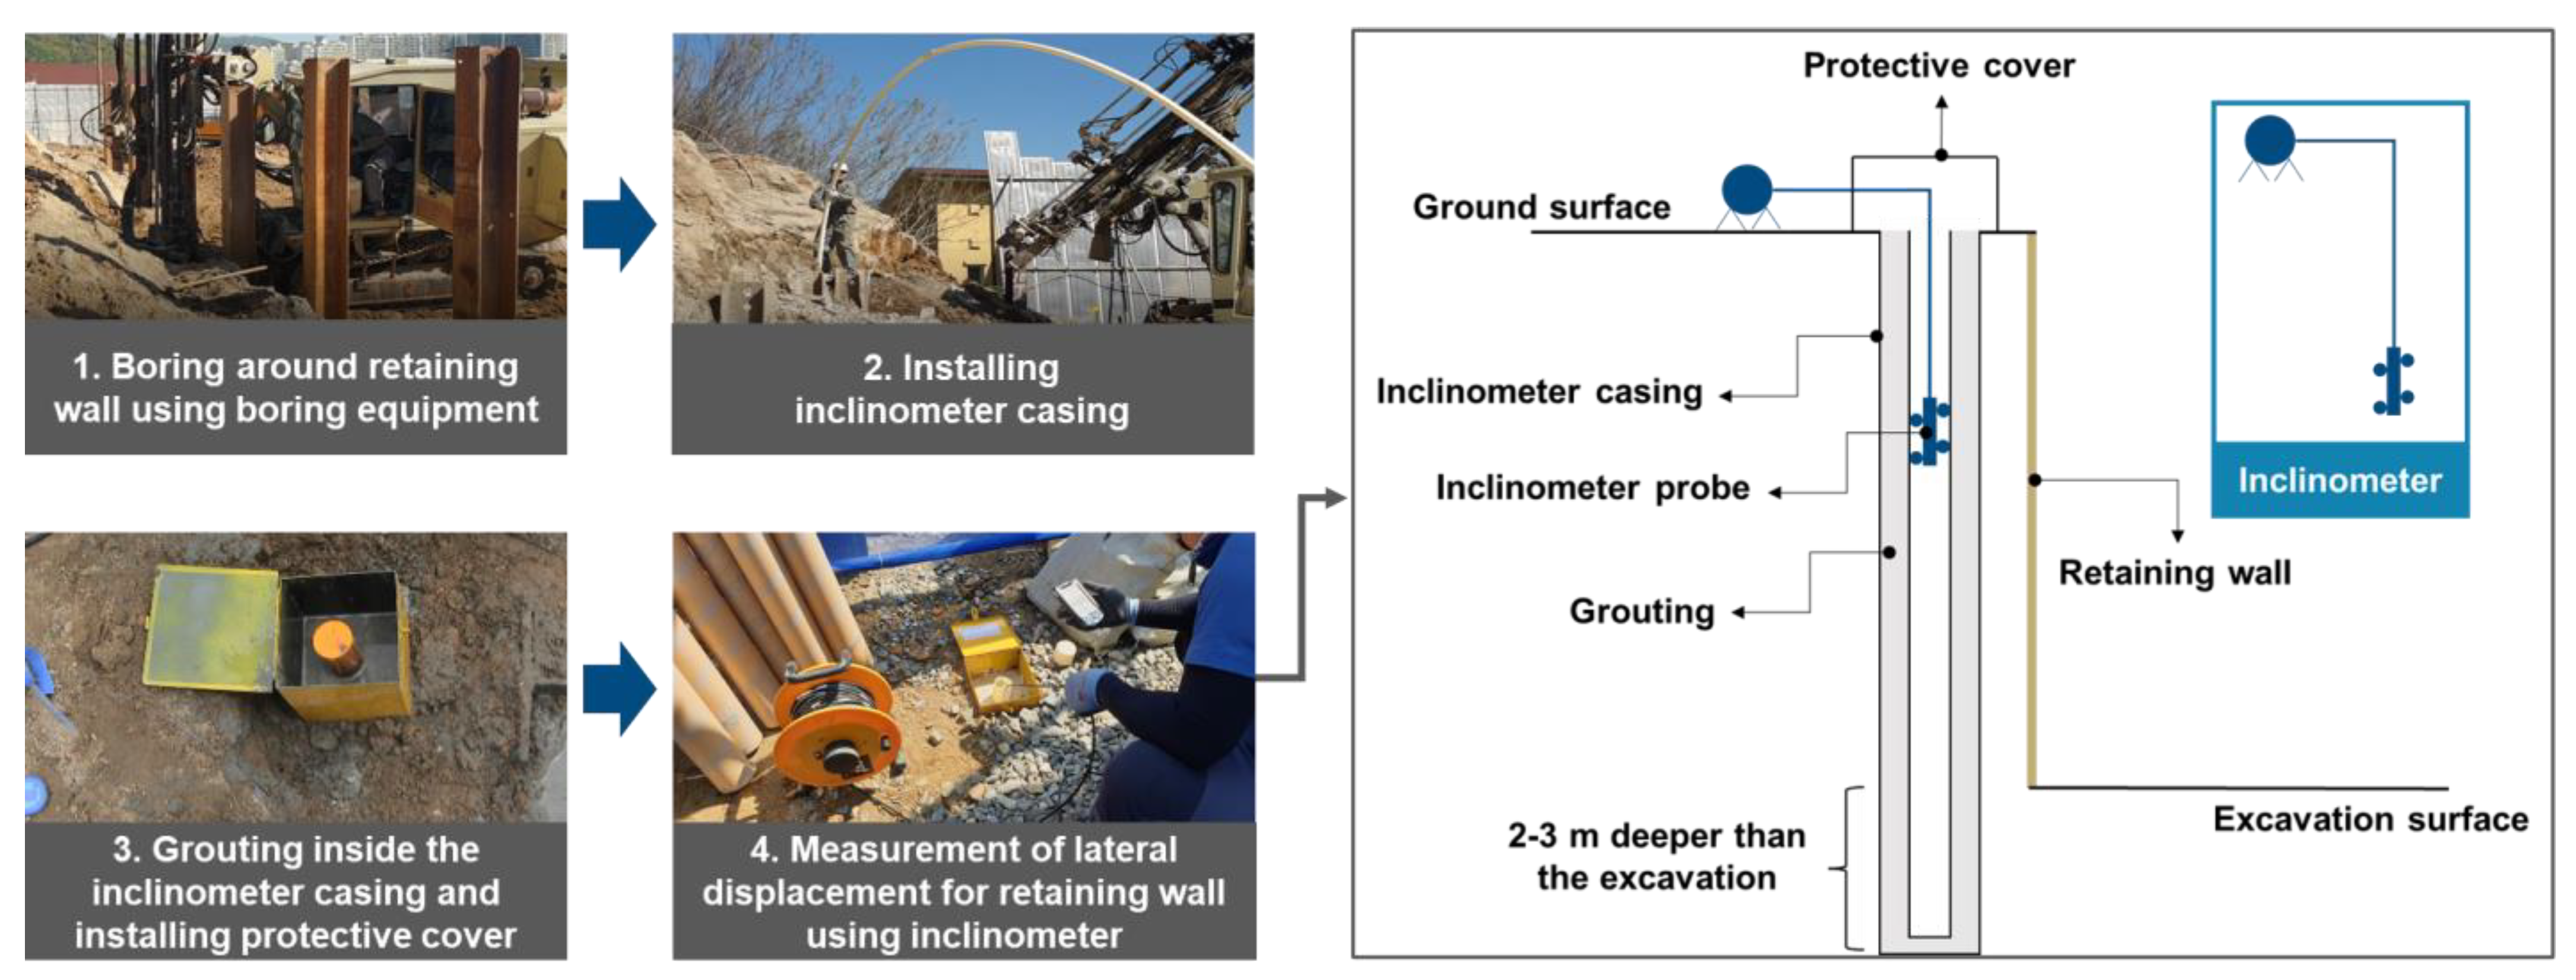
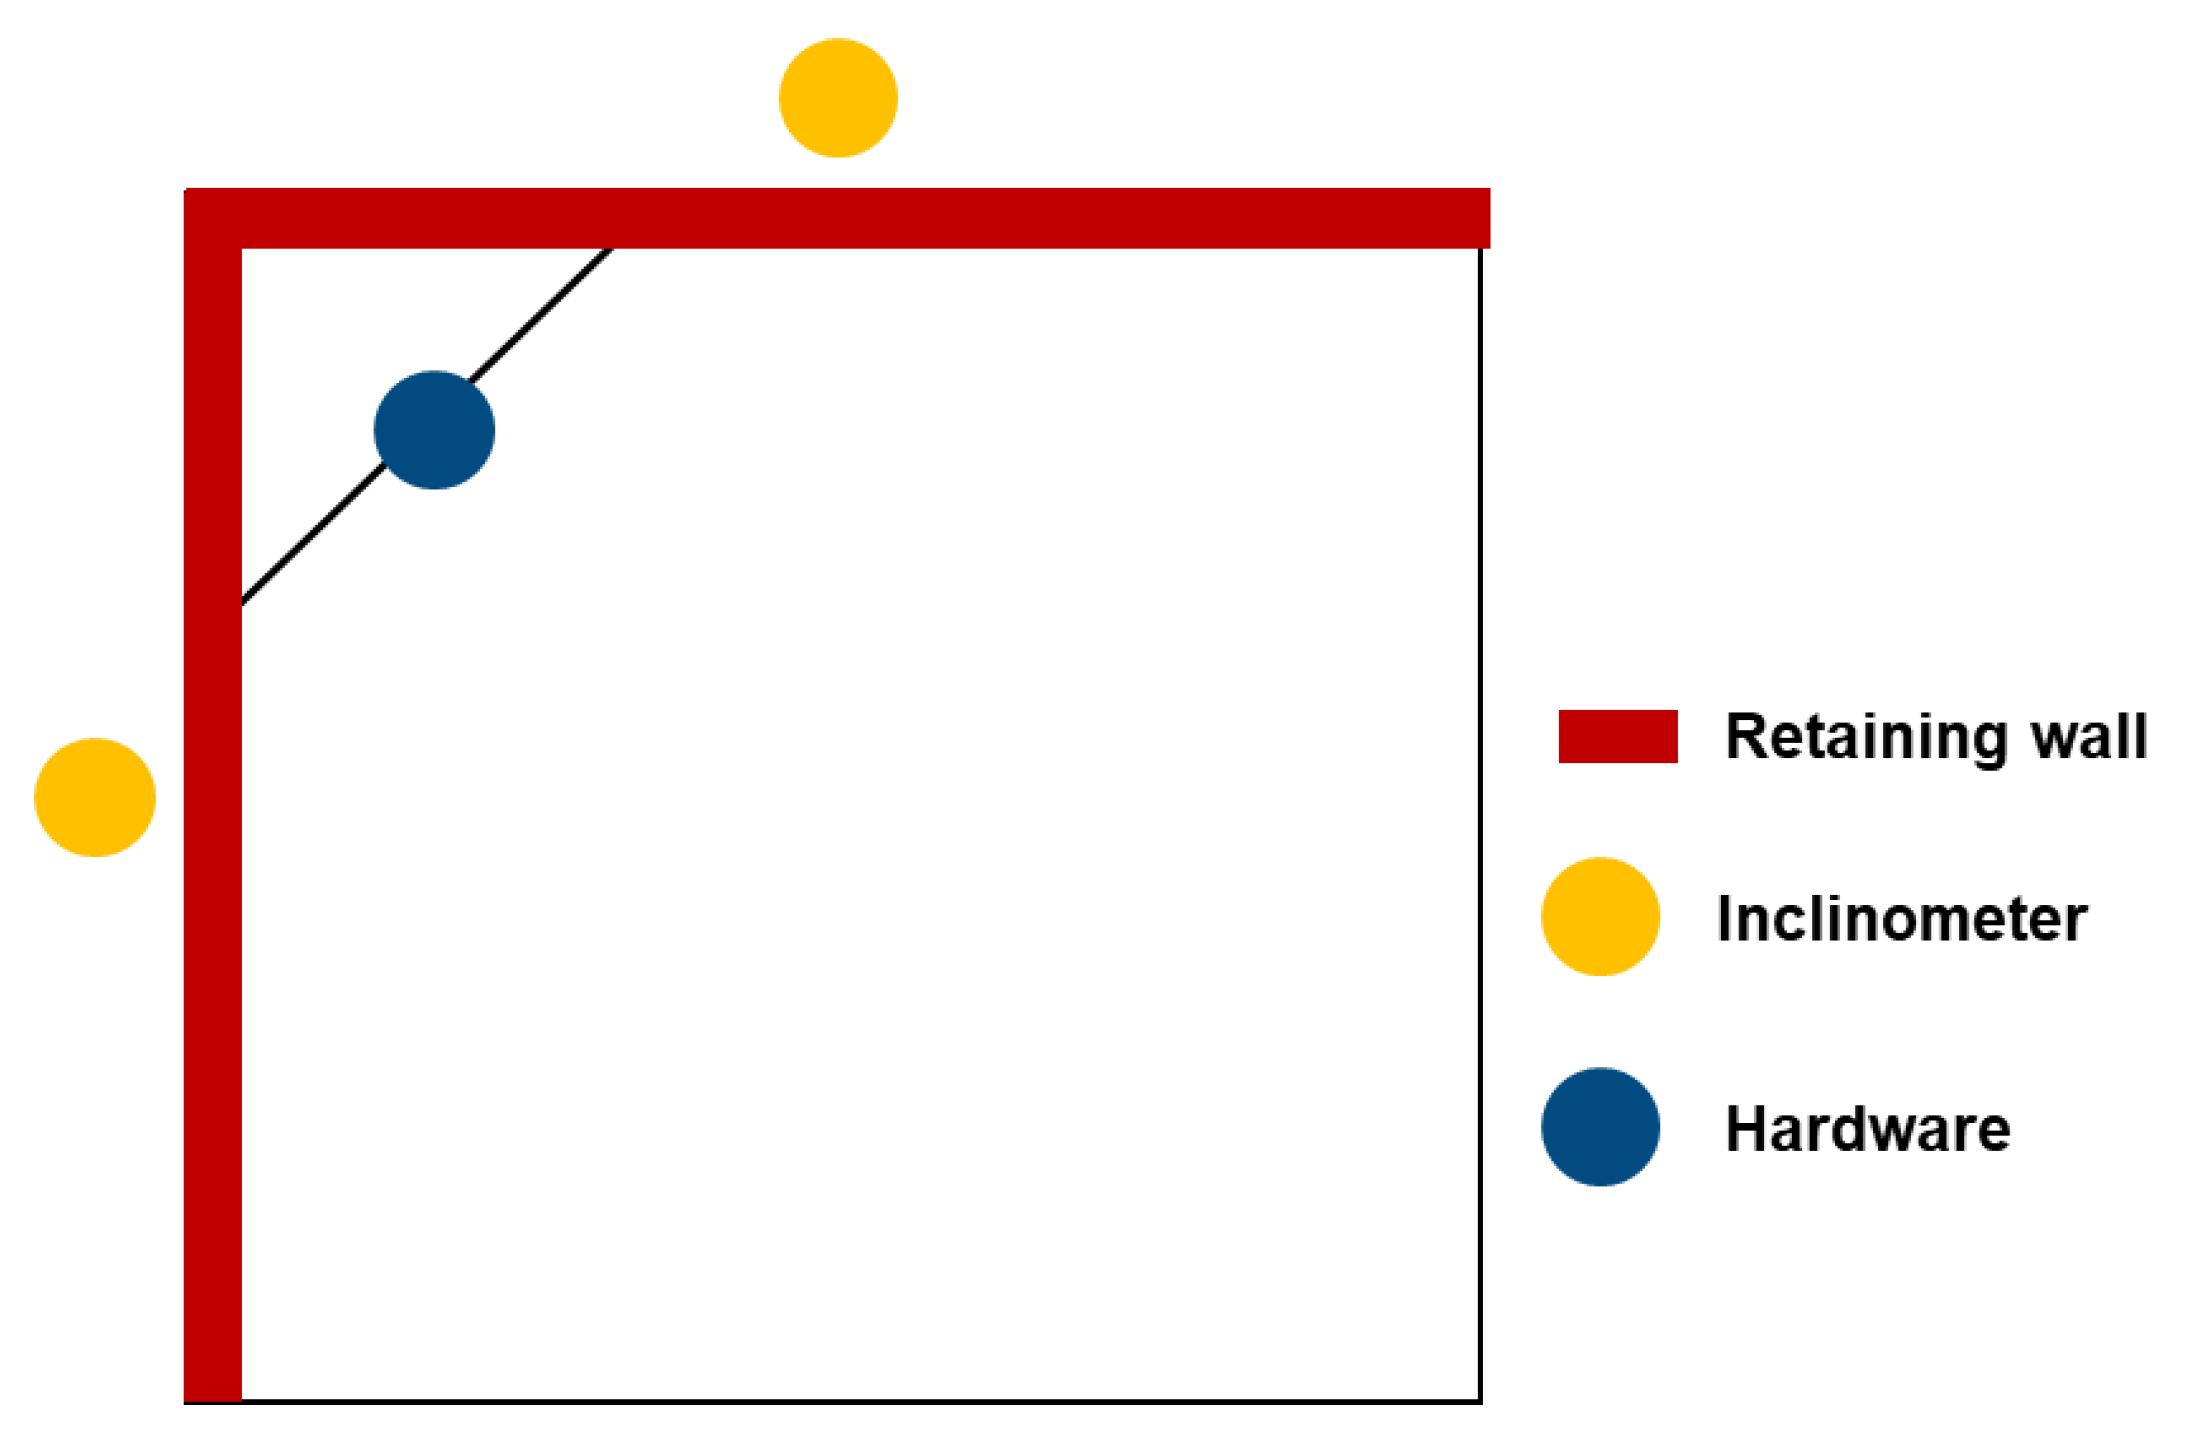
- Difficulty installing inclinometer casing
- 2.
- Measuring 2D local lateral displacement of a retaining wall
- 3.
- Measurement by manpower
2.2. Previous Studies and Technologies Related to Retaining Wall Displacement Measurement
3. Development of Retaining Wall Displacement Measurement System
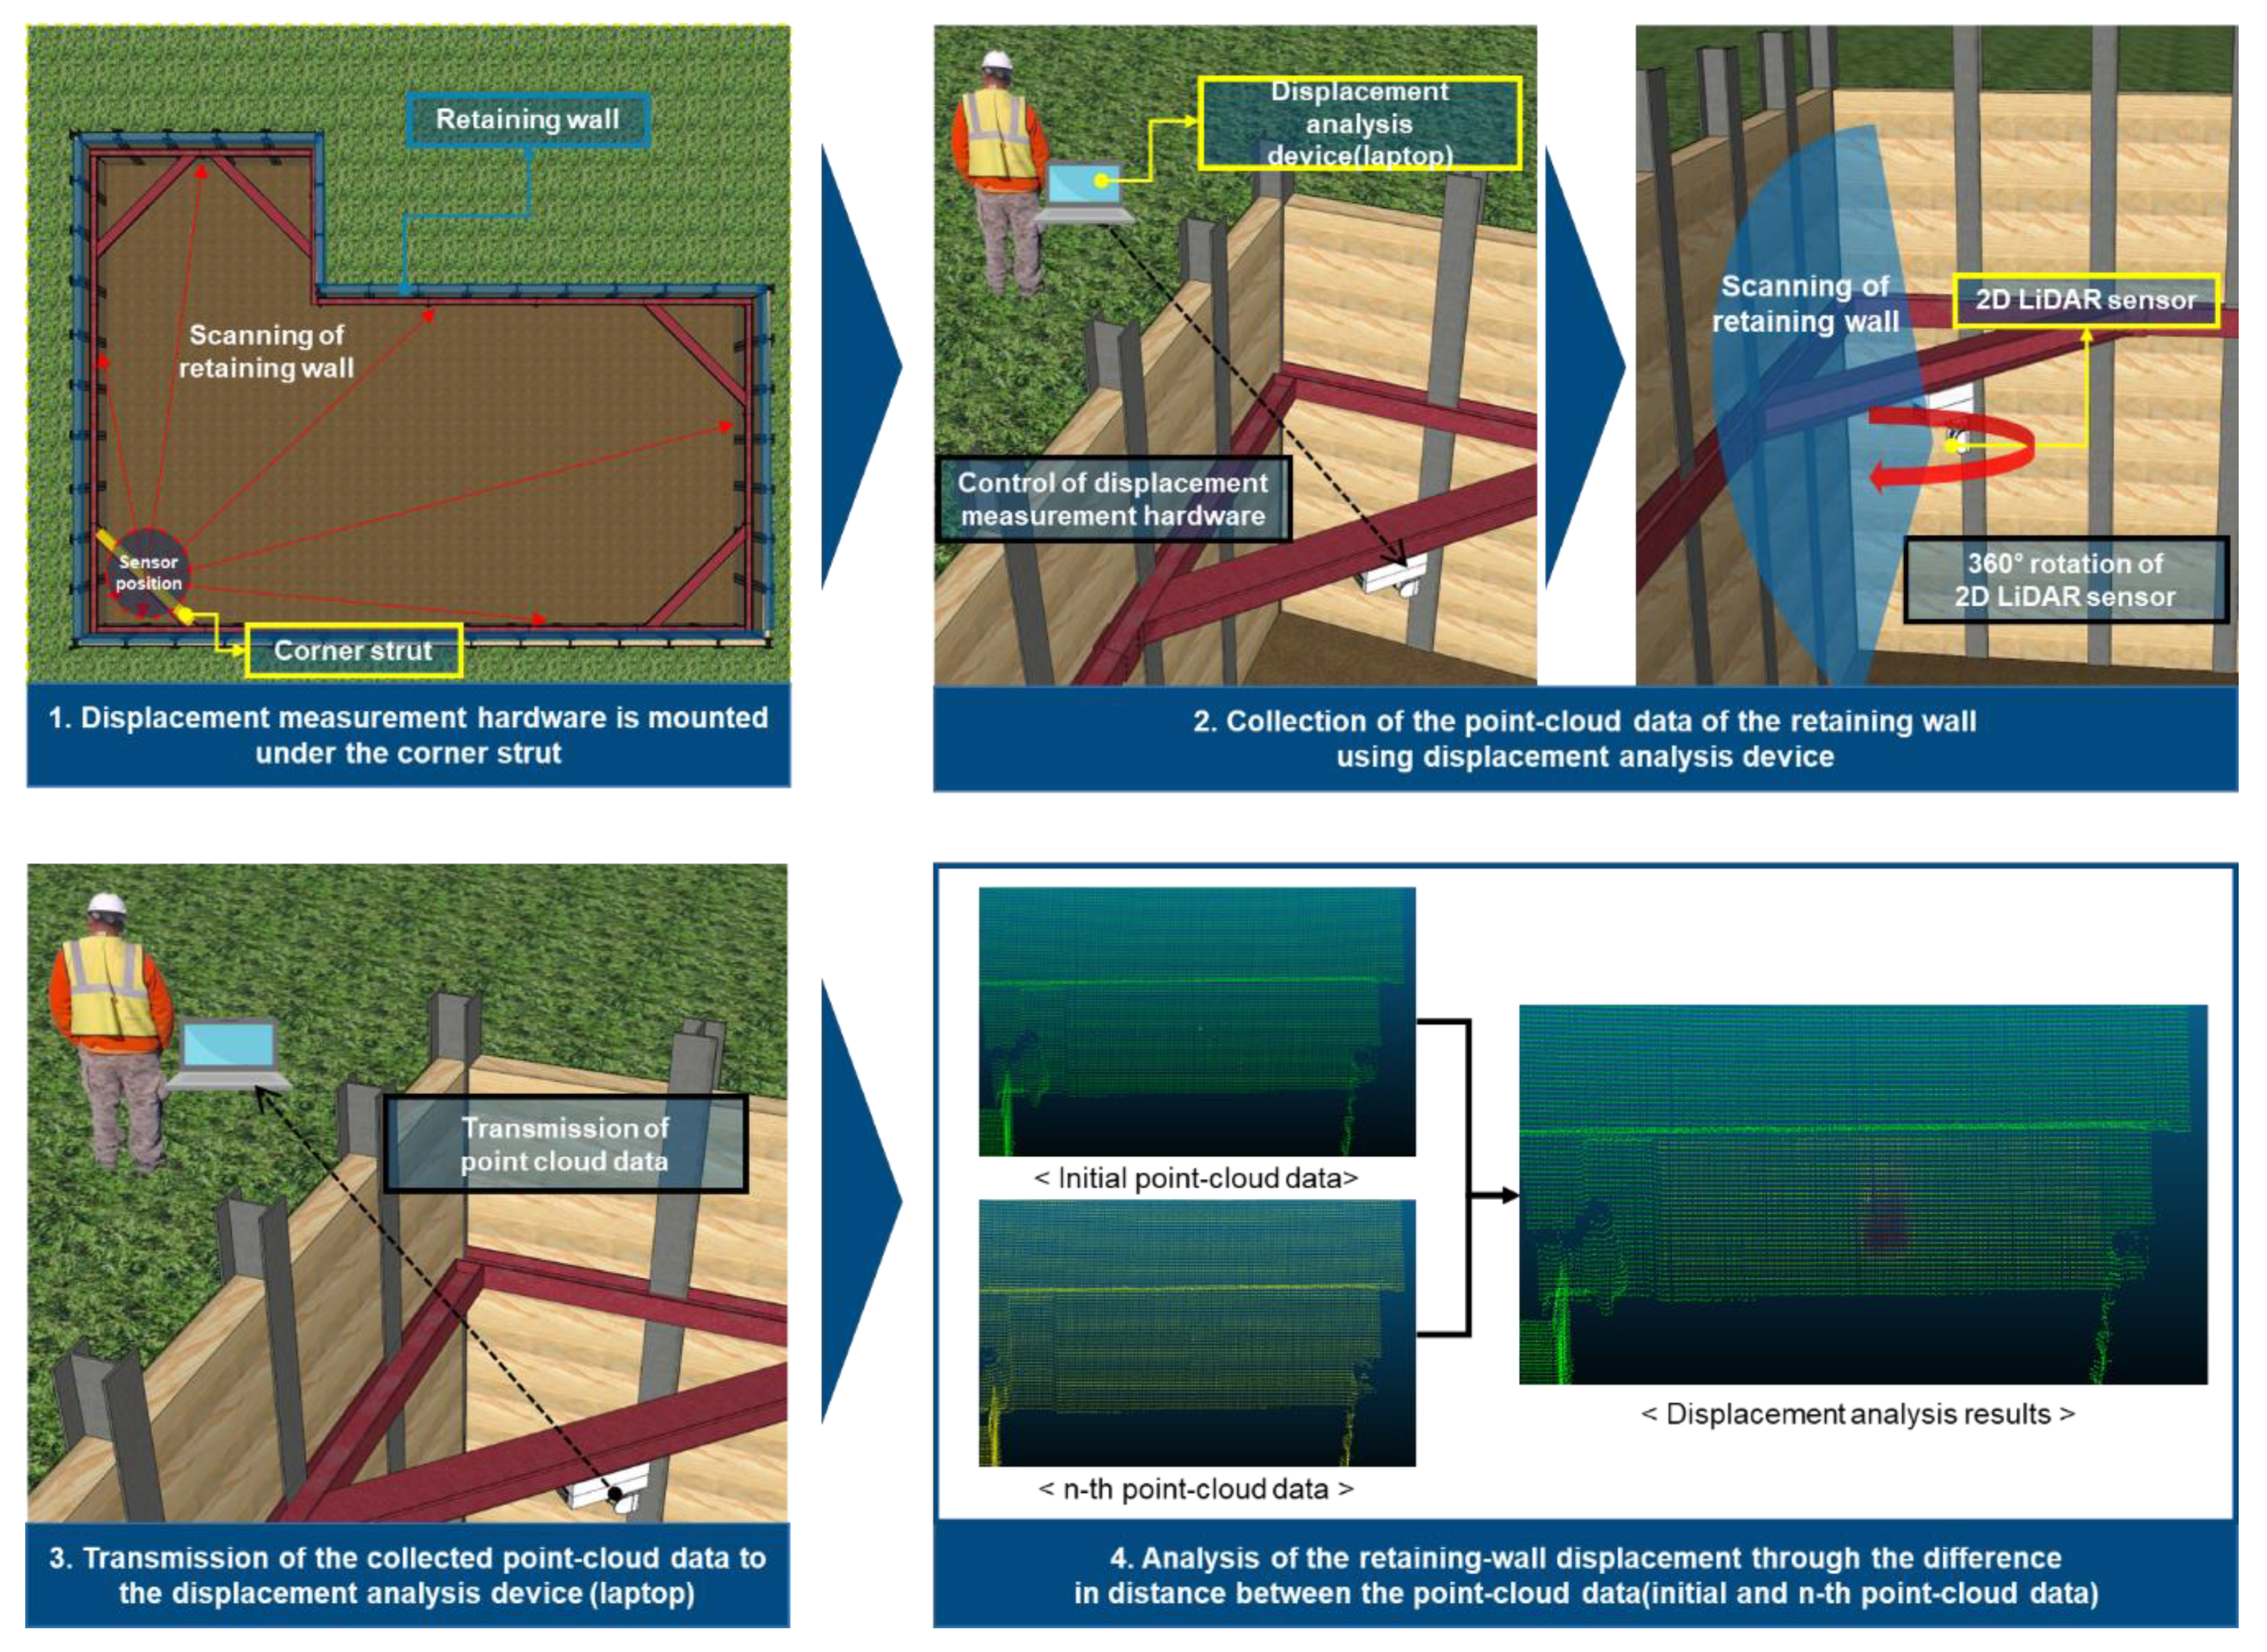
3.1. Retaining Wall Displacement Measurement Methods
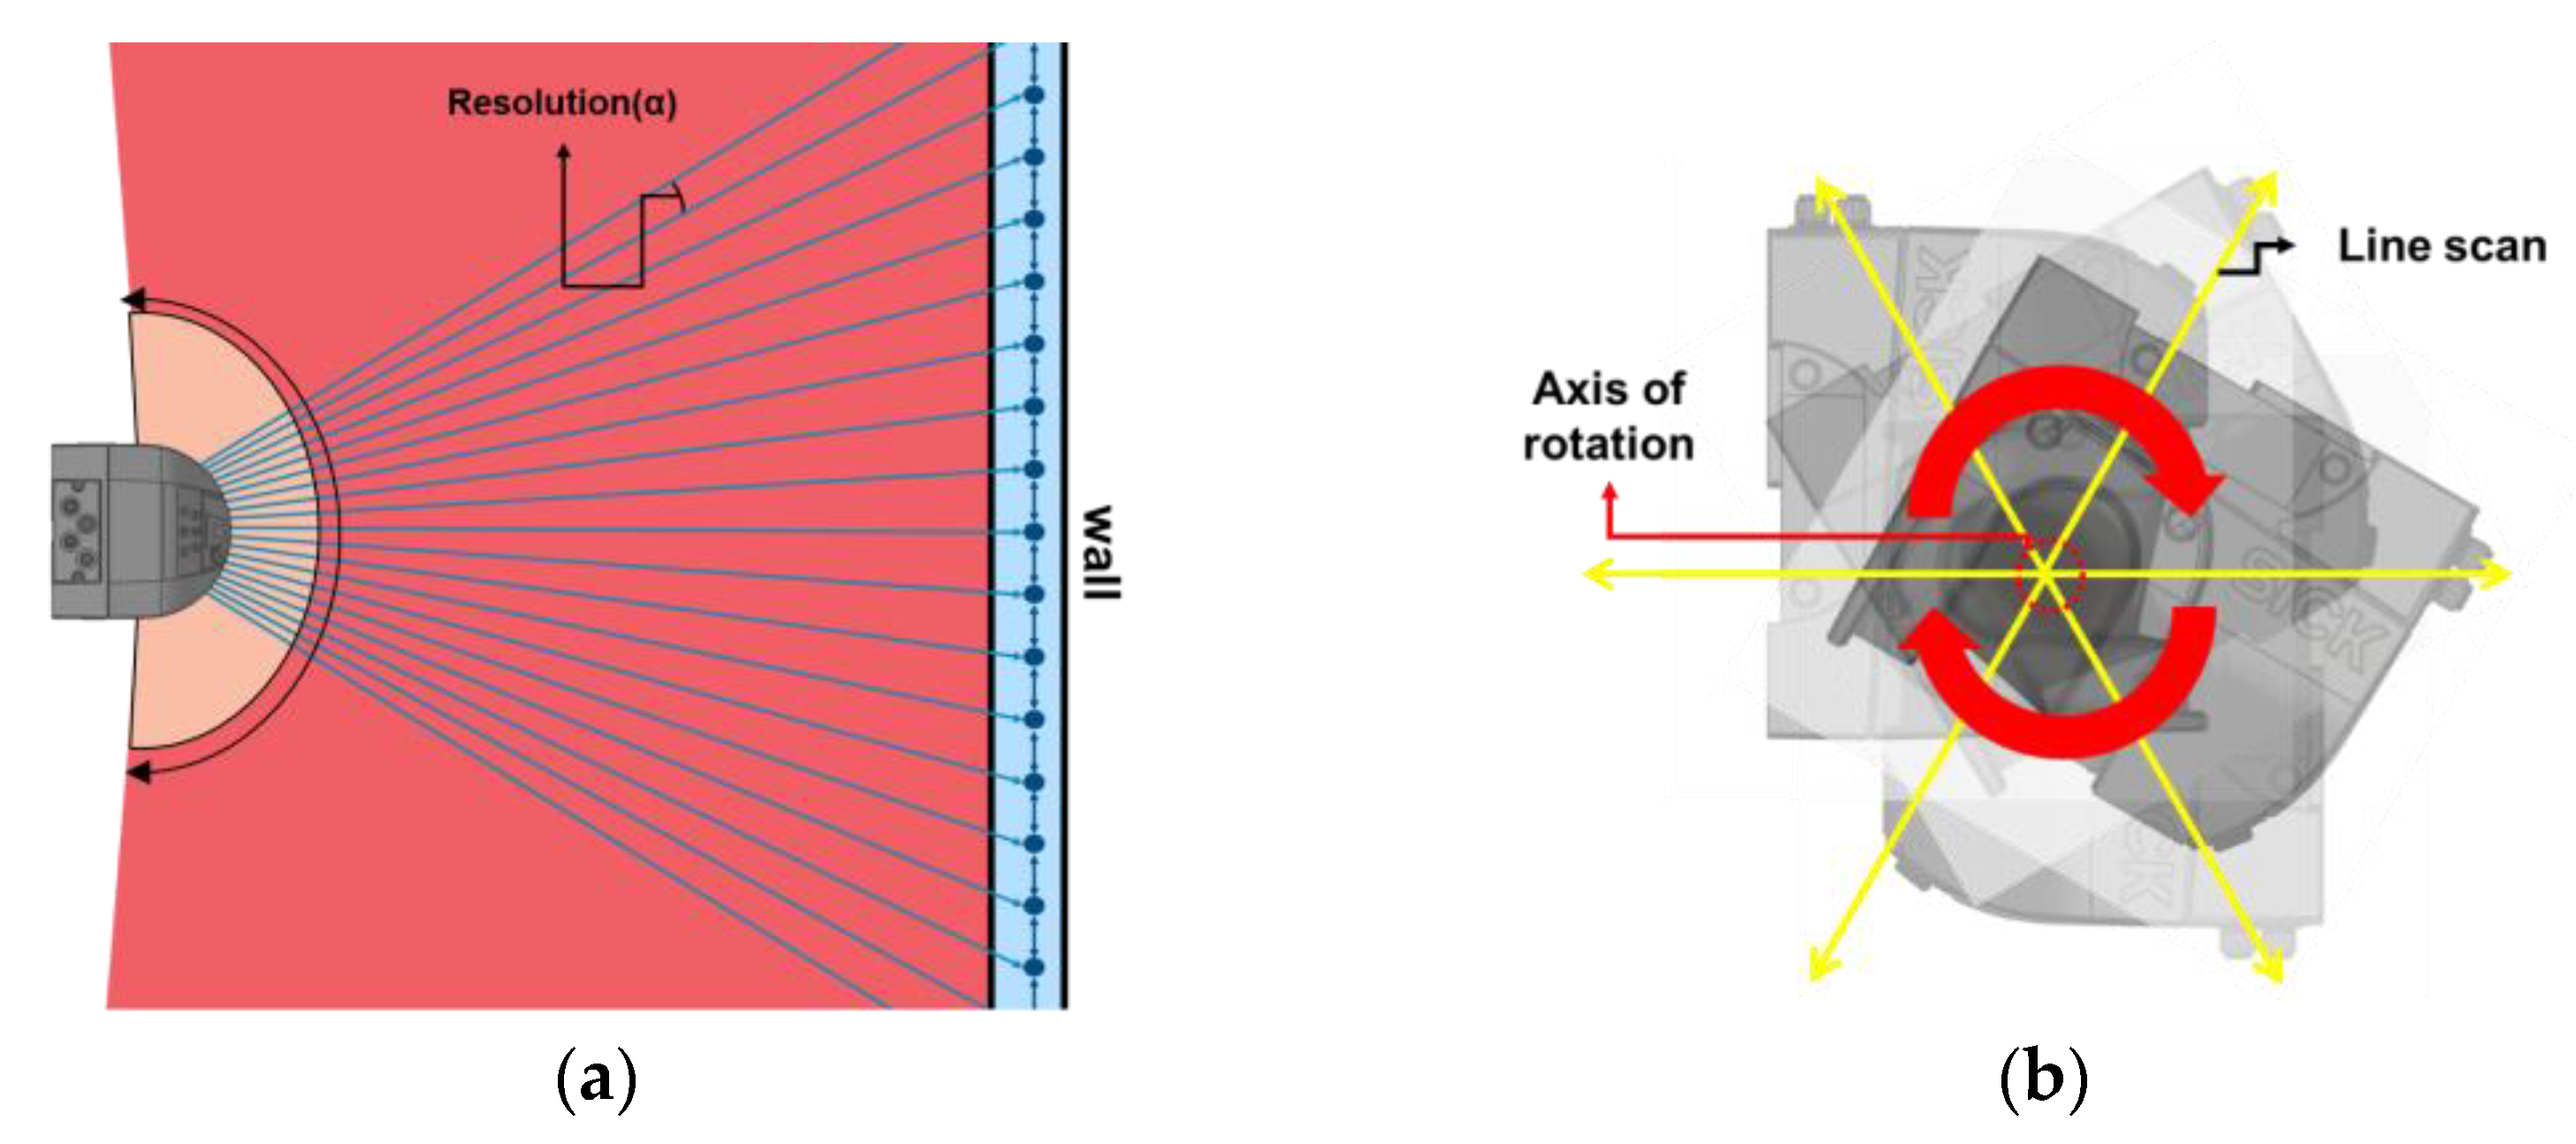
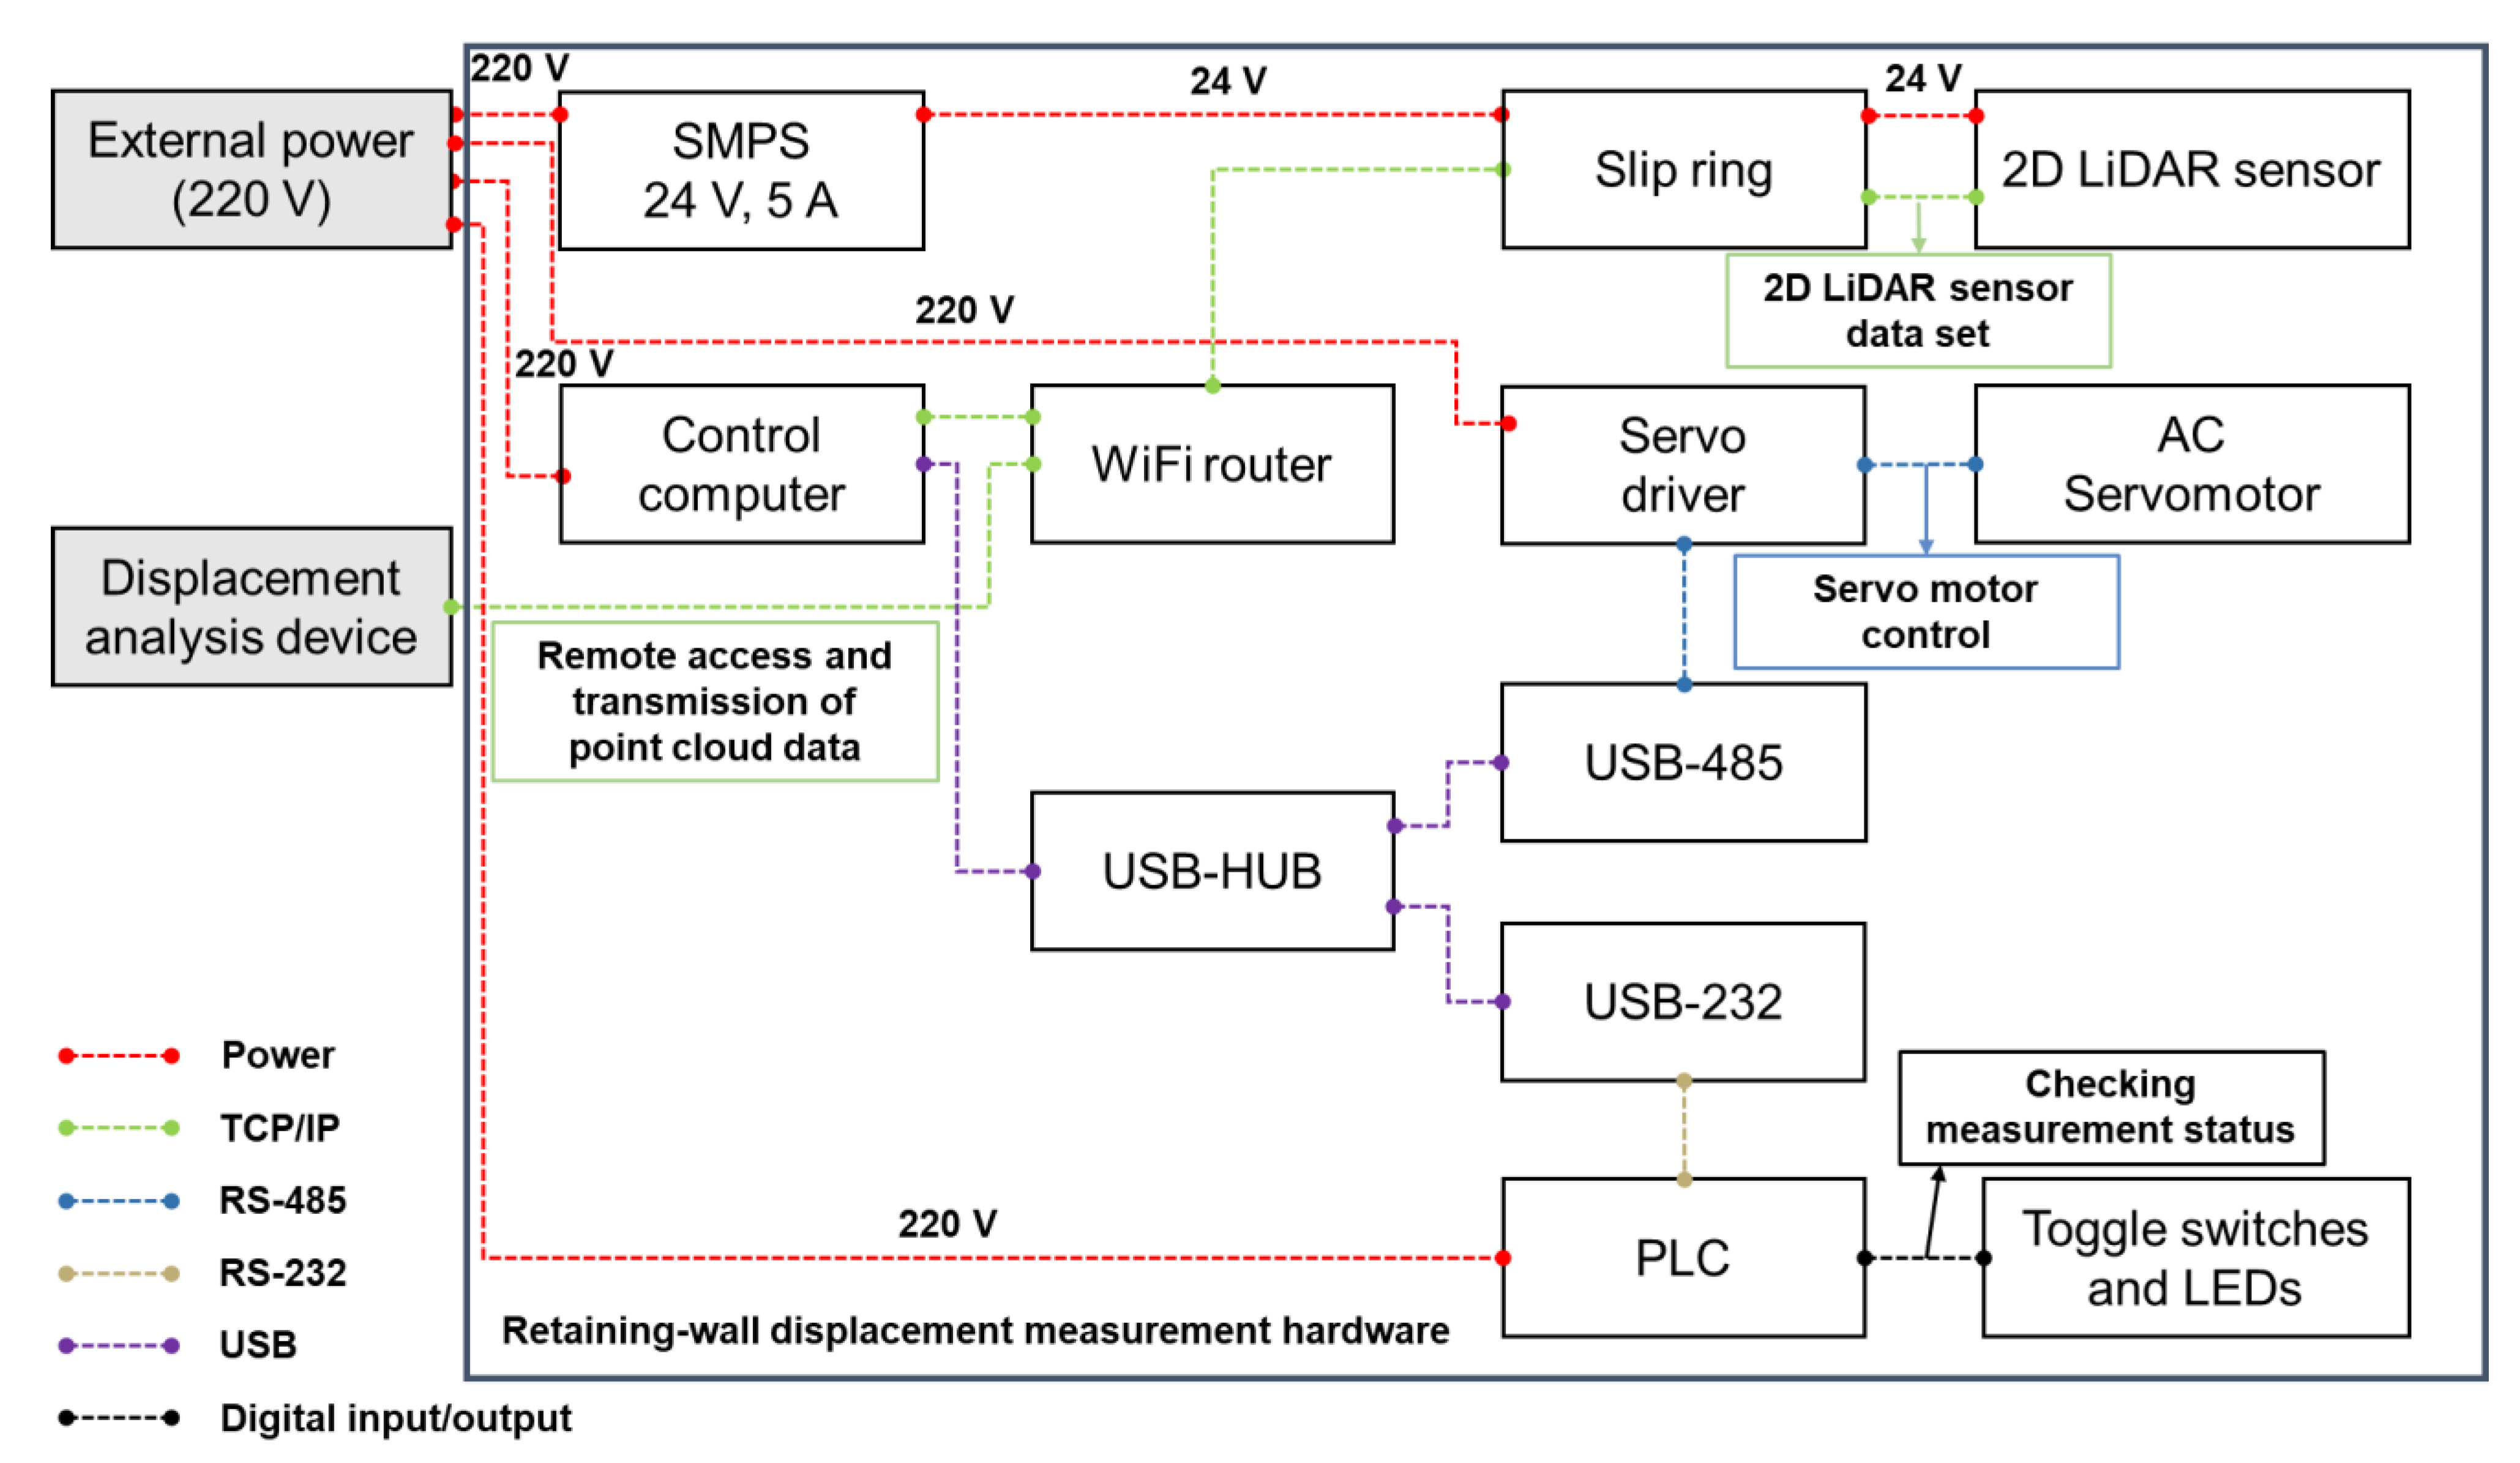
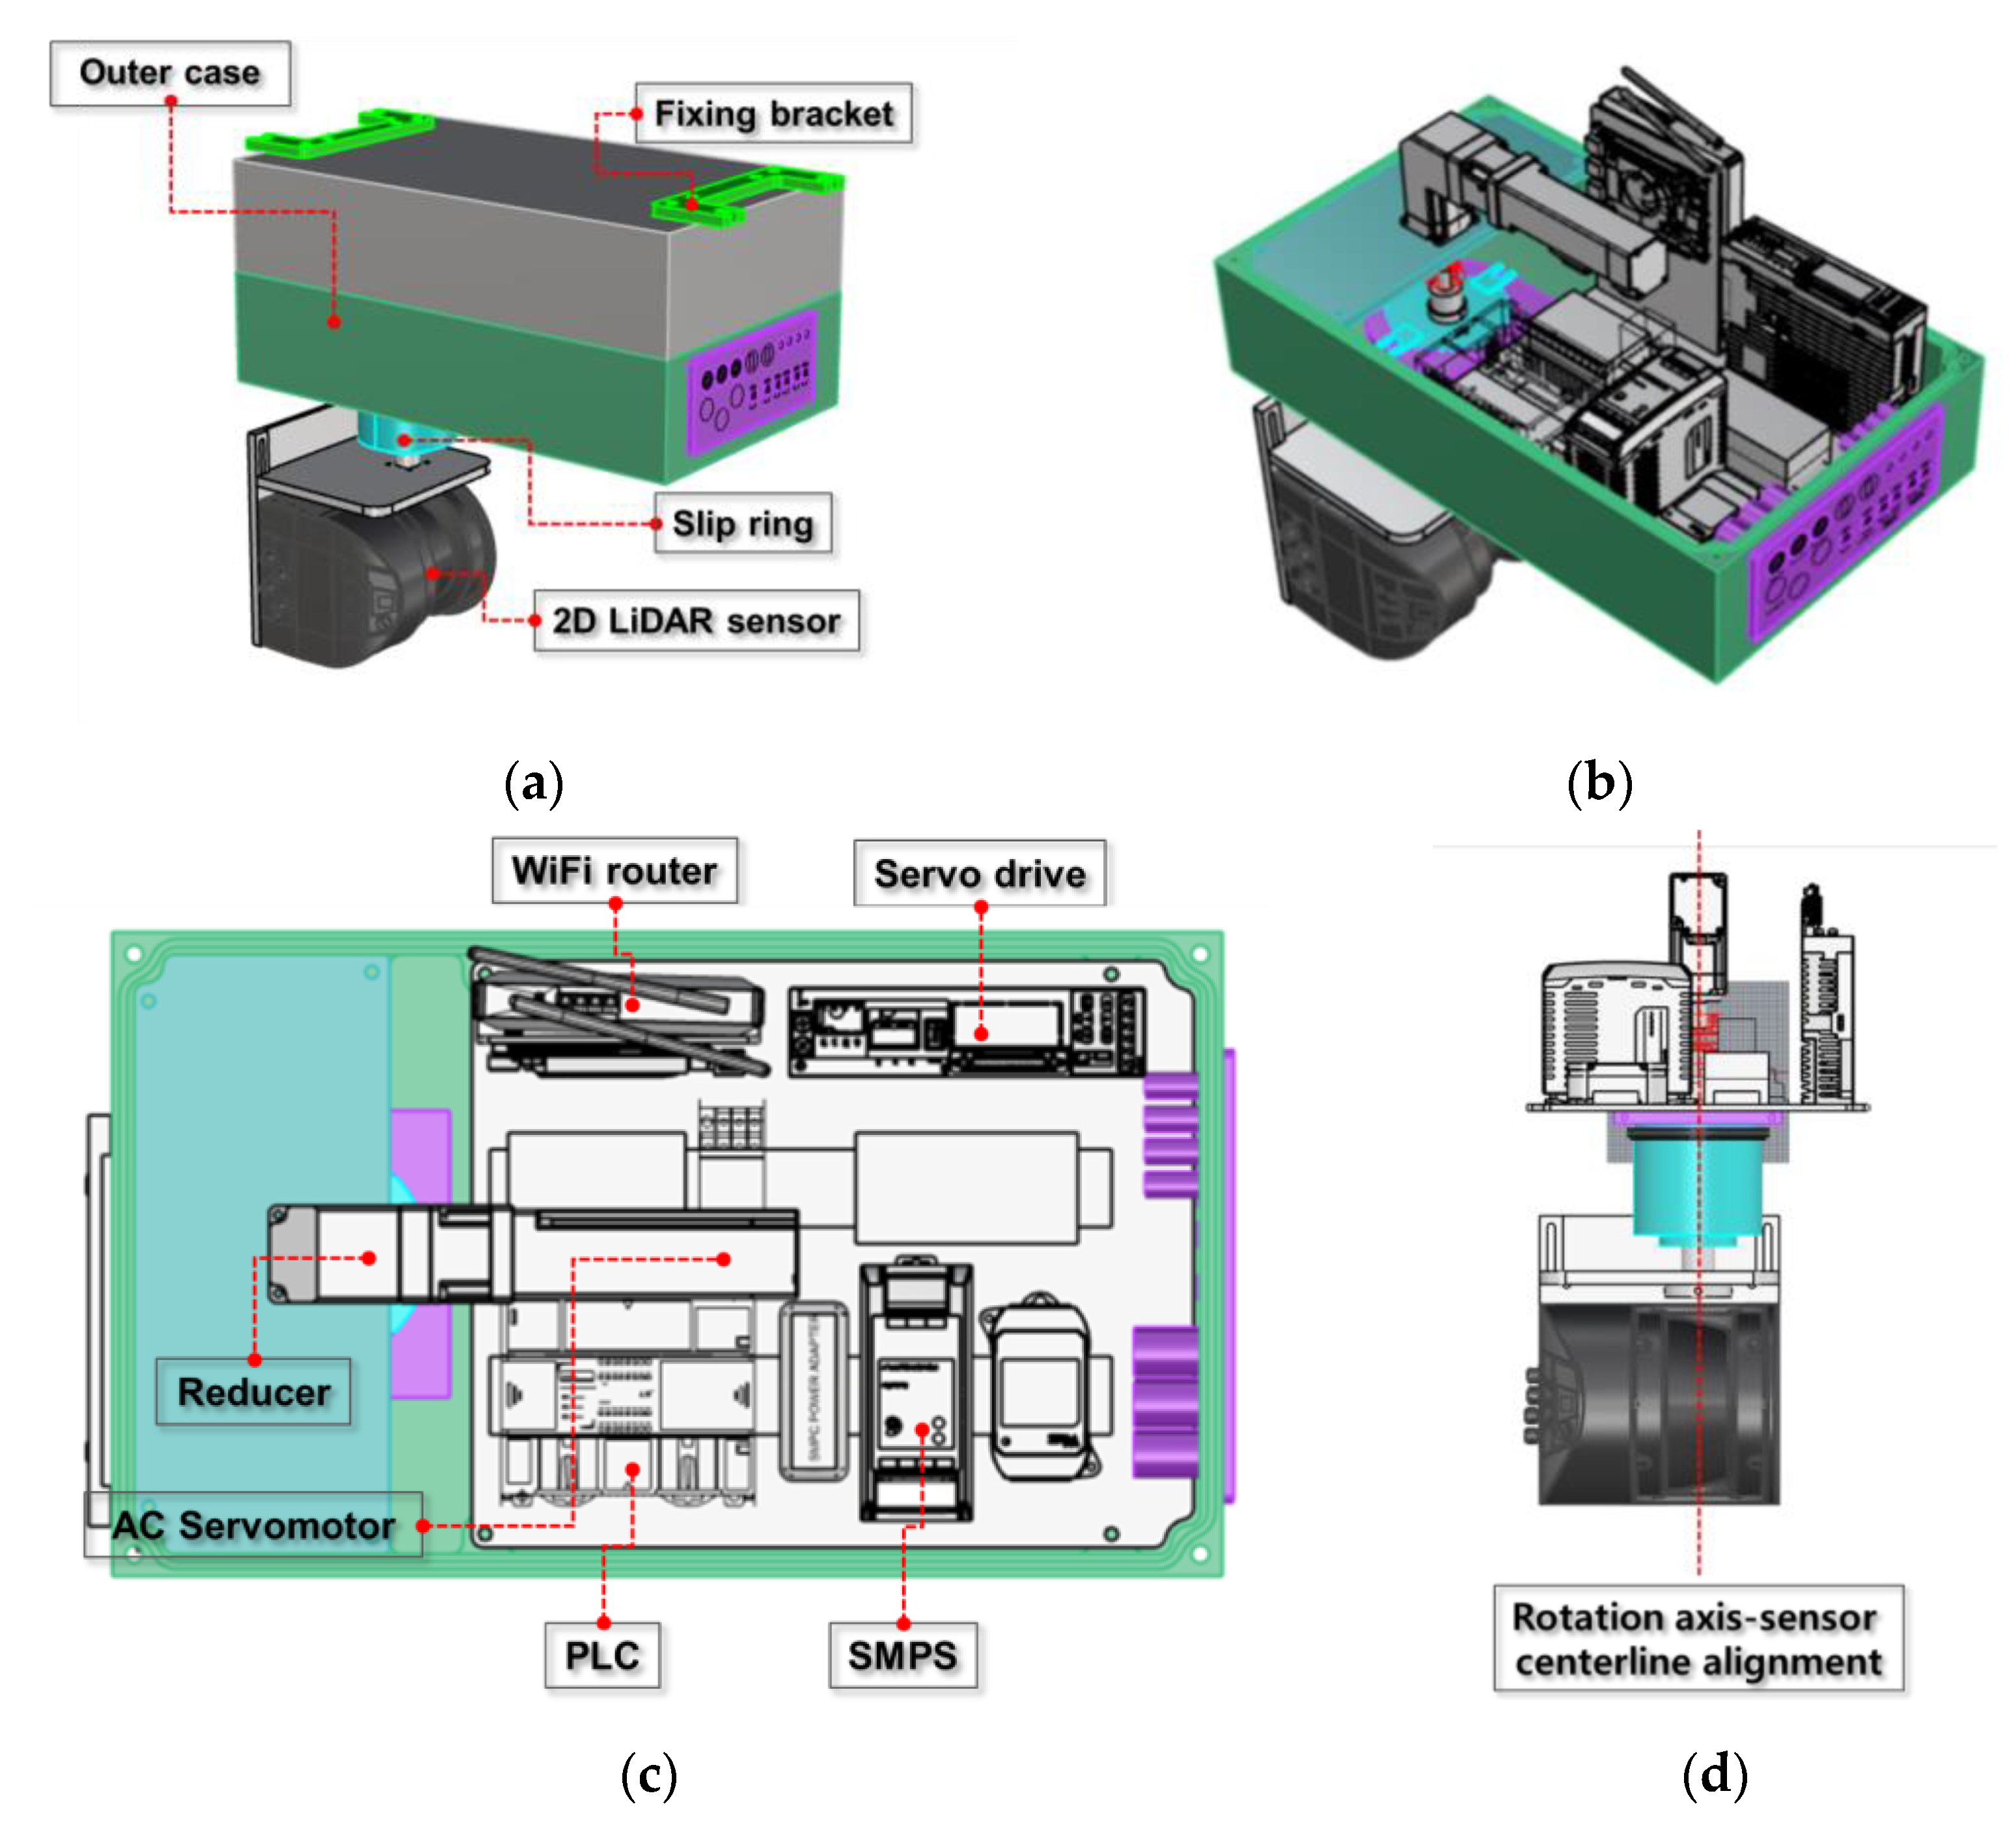
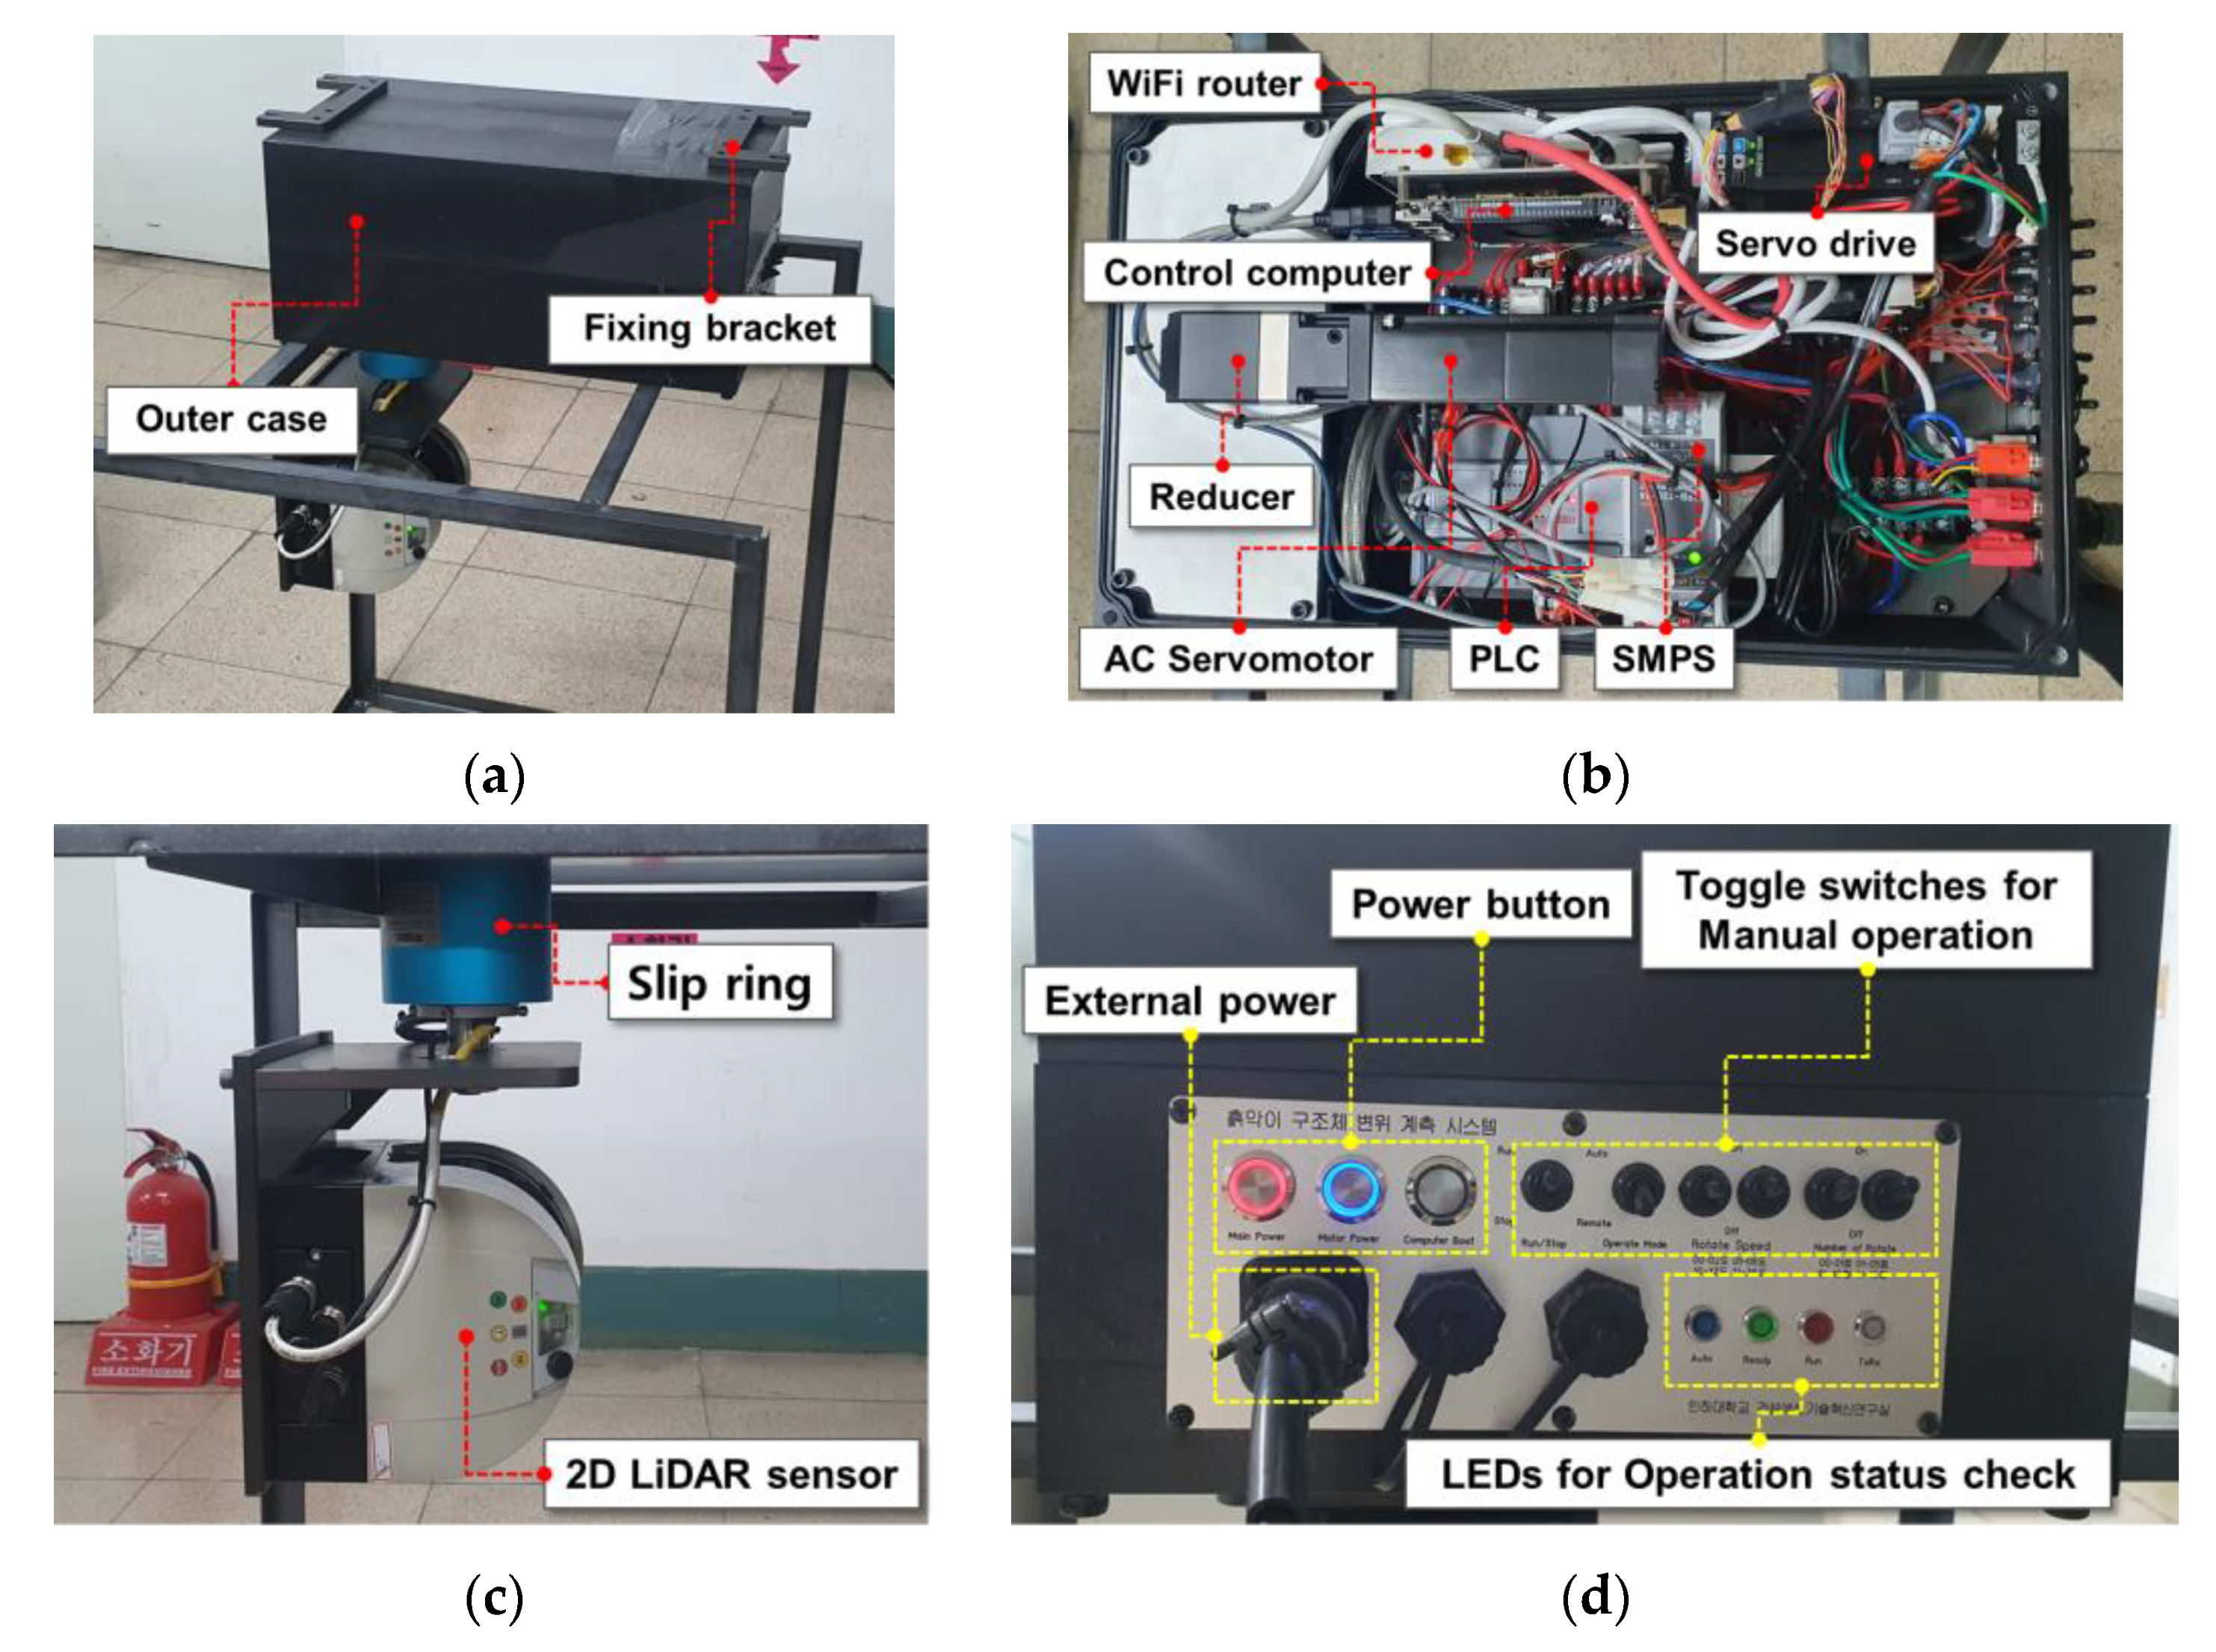
3.2. System Configuration and Design
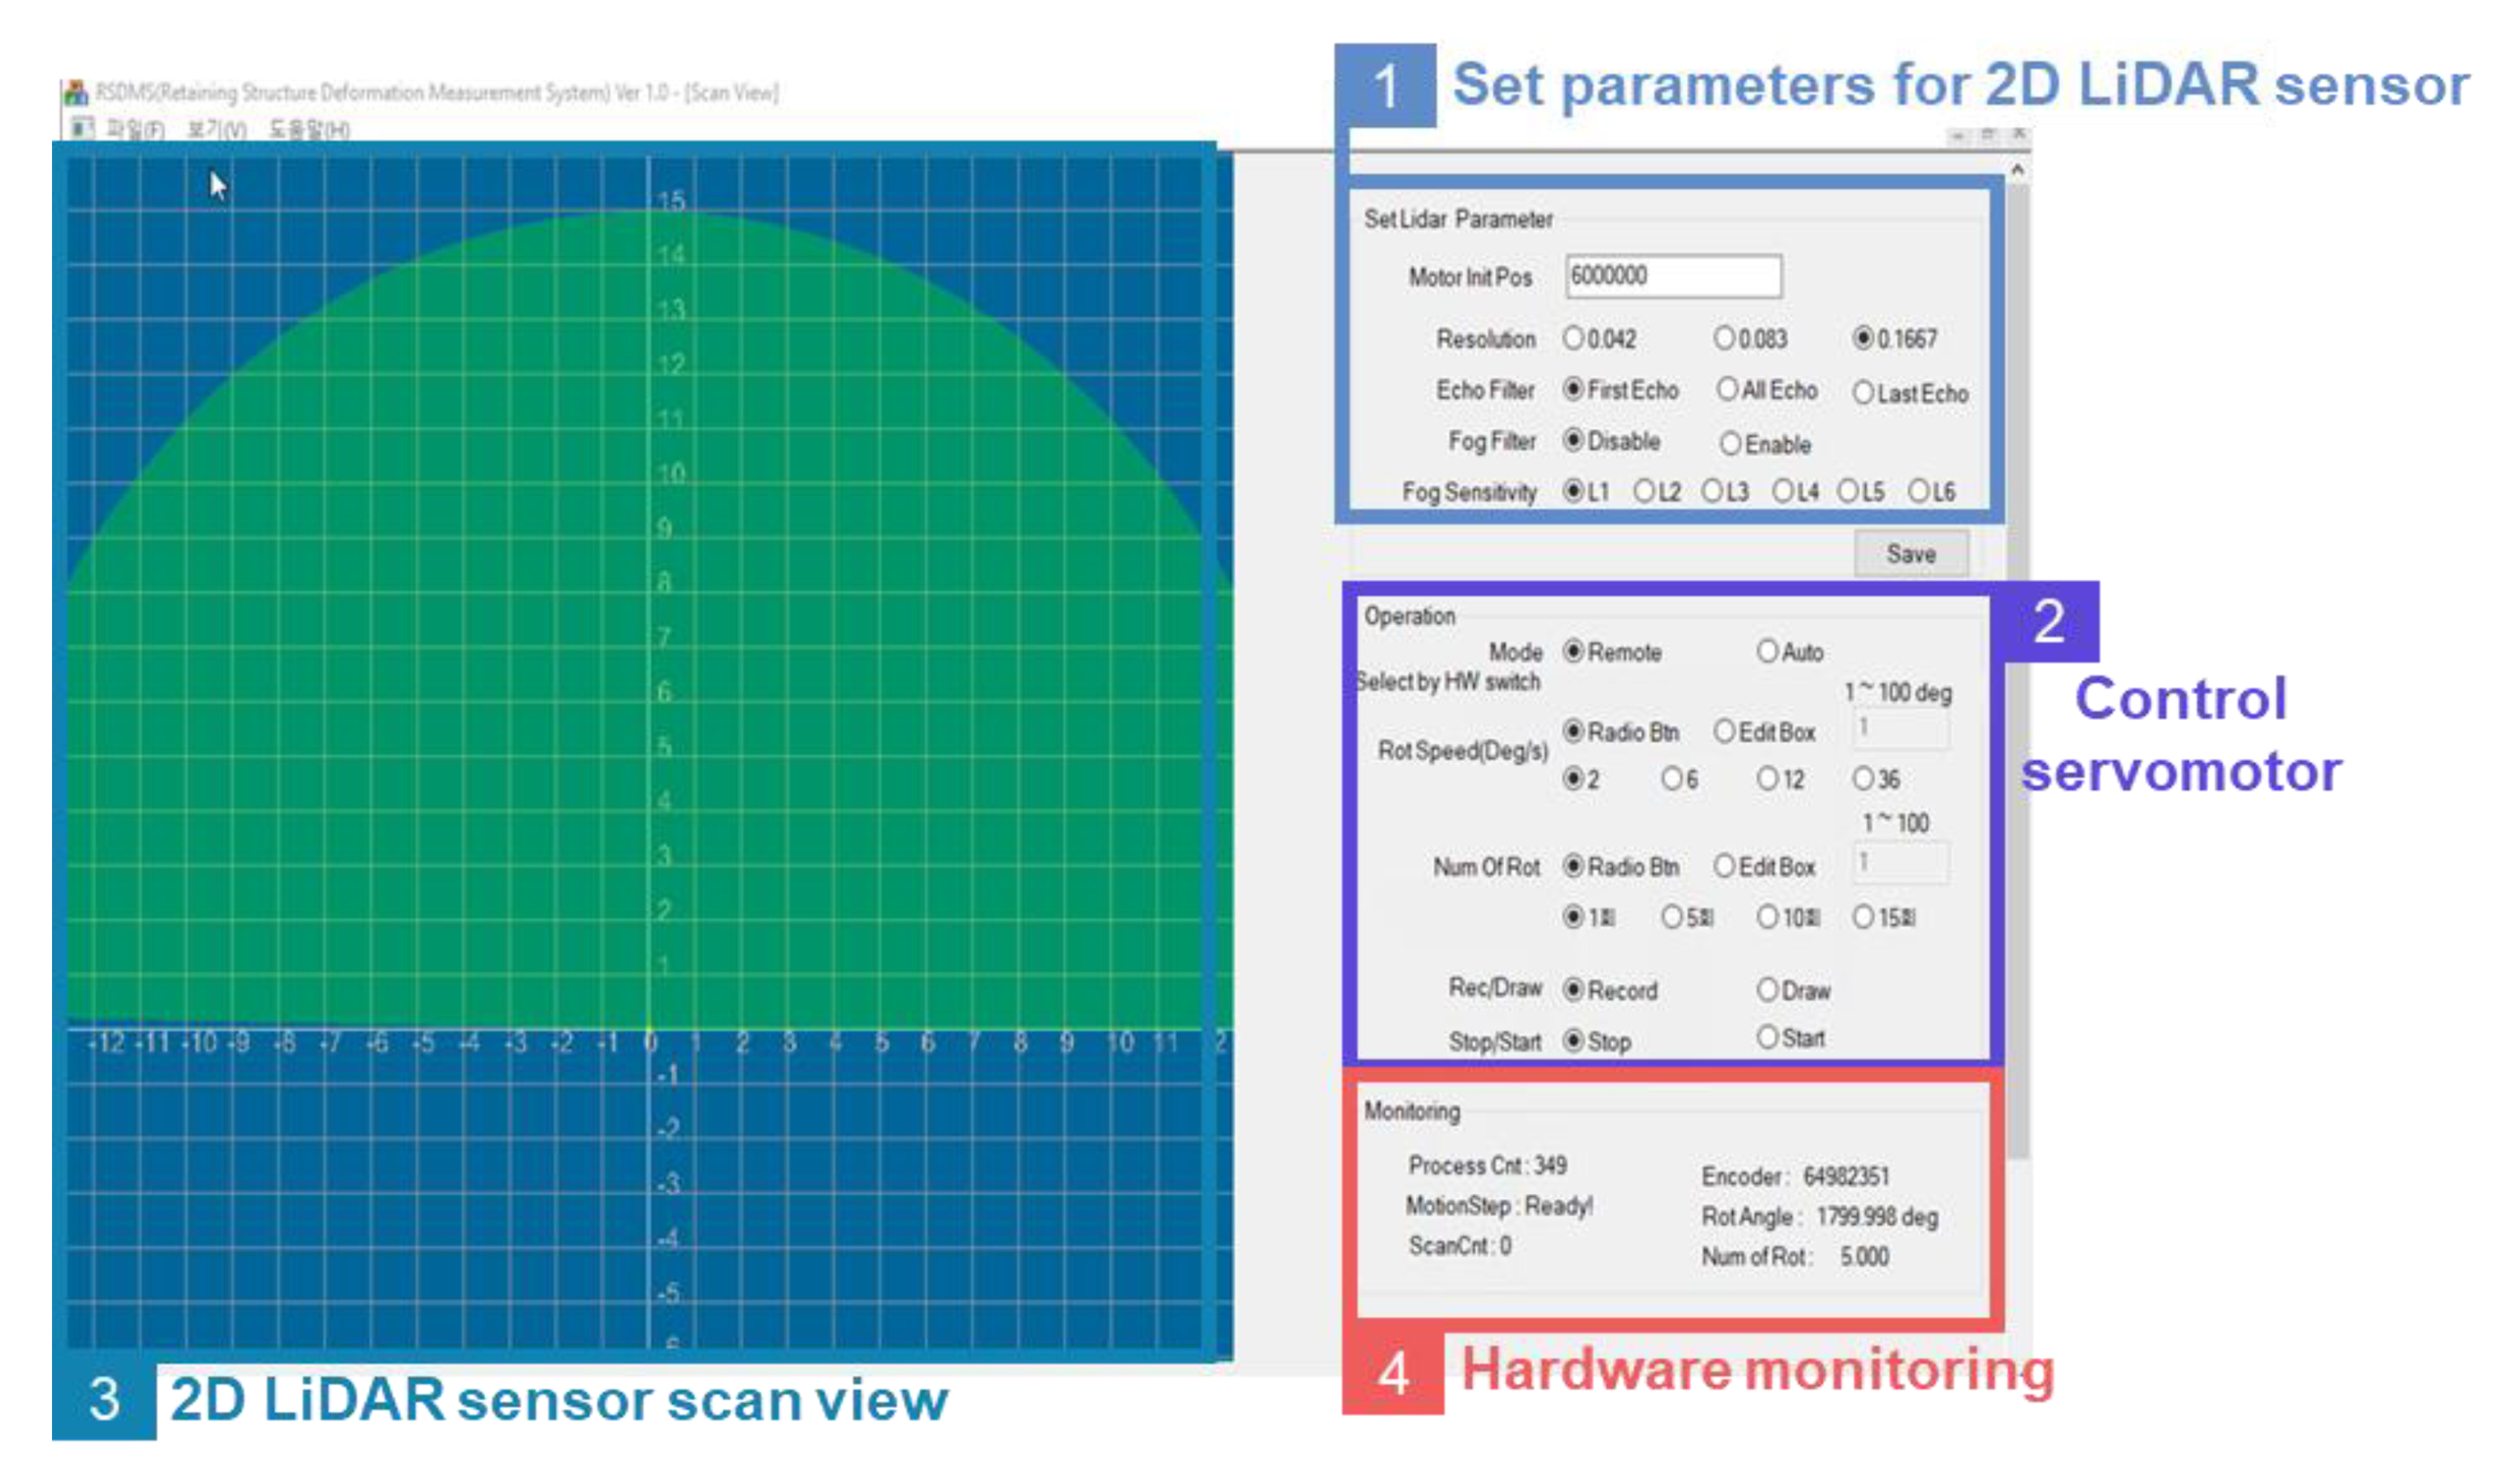
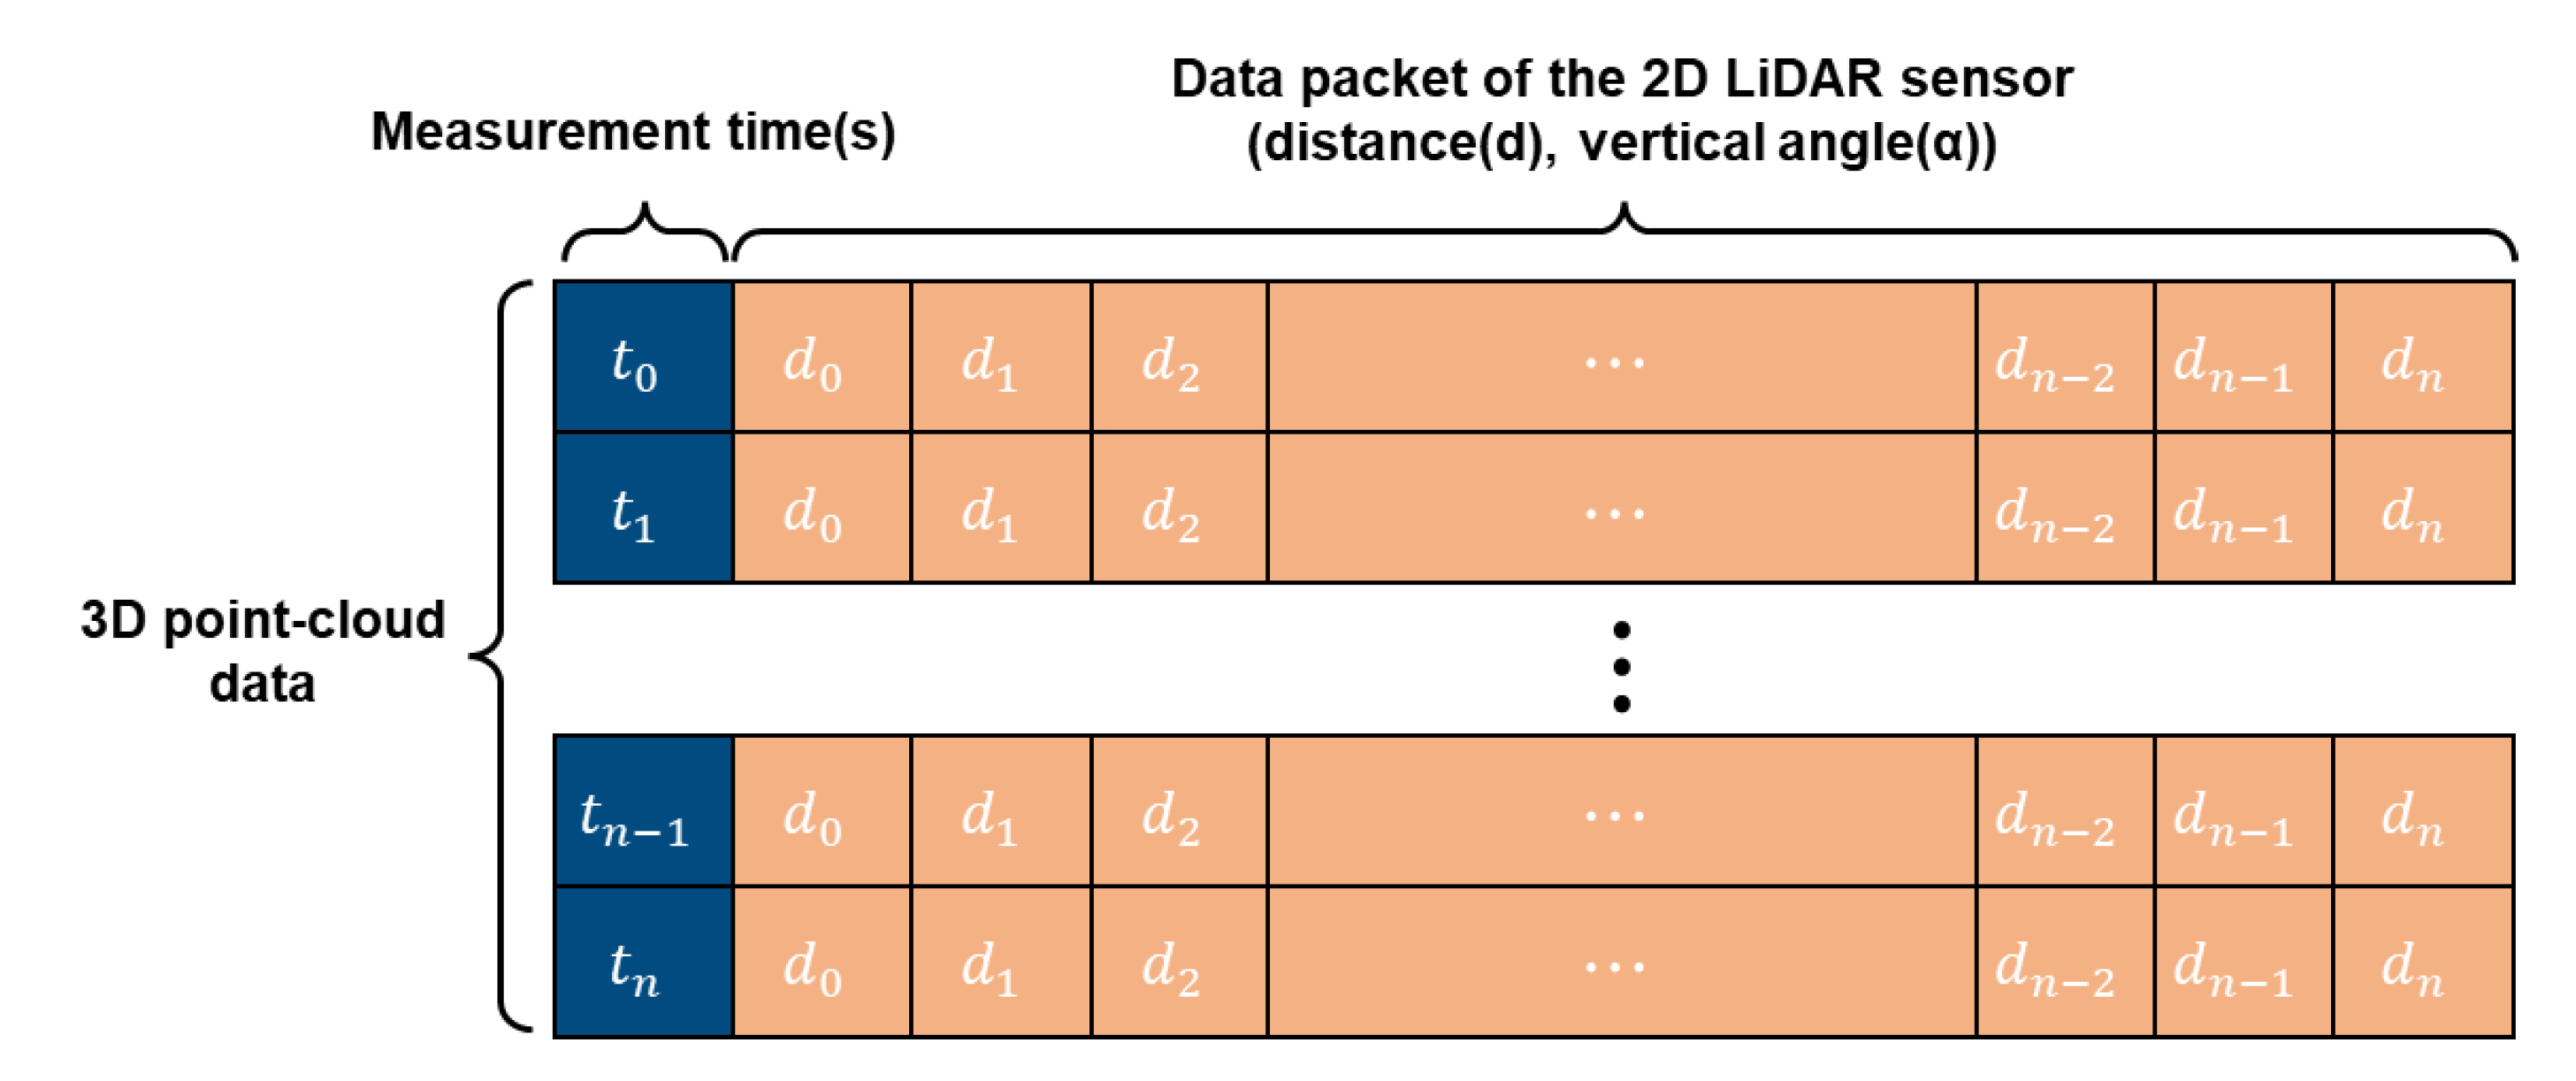
3.3. Hardware and Control Software Development
4. Performance and Economic Feasibility of a Retaining Wall Displacement Measurement System
4.1. System Performance
4.2. Economic Feasibility of System
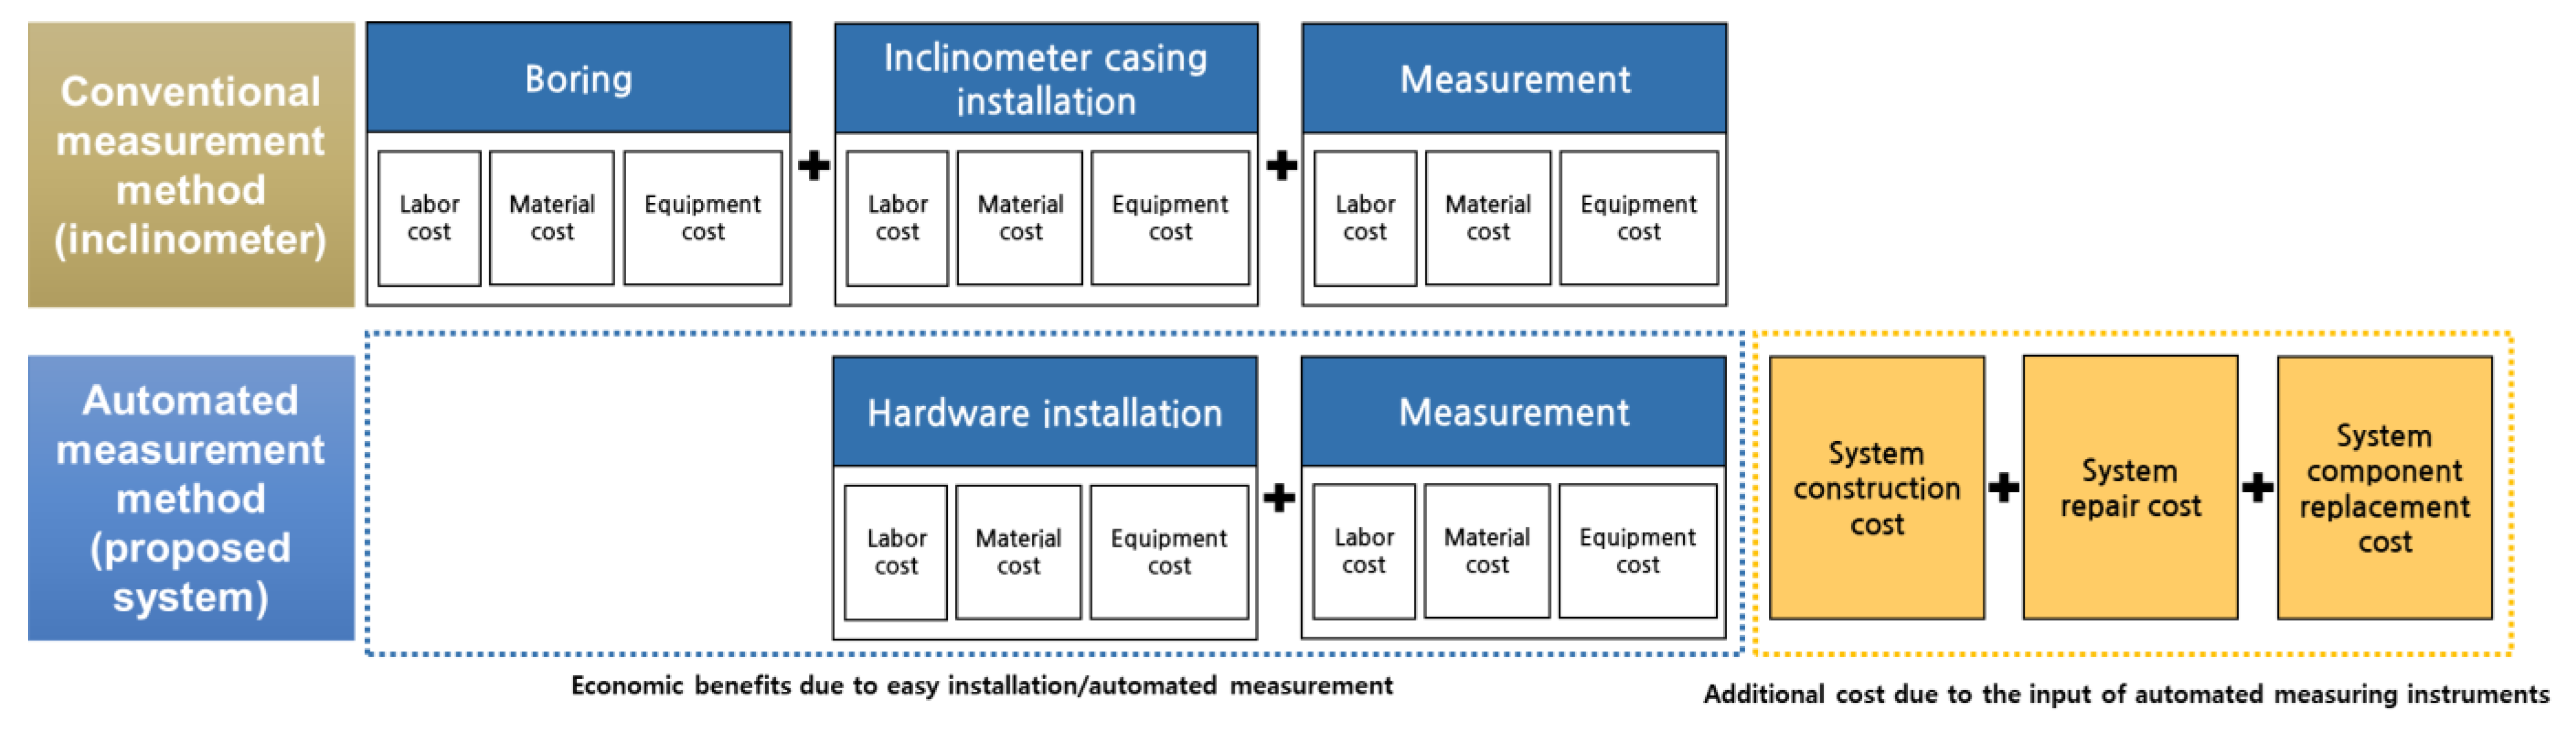
4.2.1. Definition of Lifecycle Cost Analysis Scope
4.2.2. Setting of LCC Analysis Variables and Assumptions
4.2.3. Economic Analysis
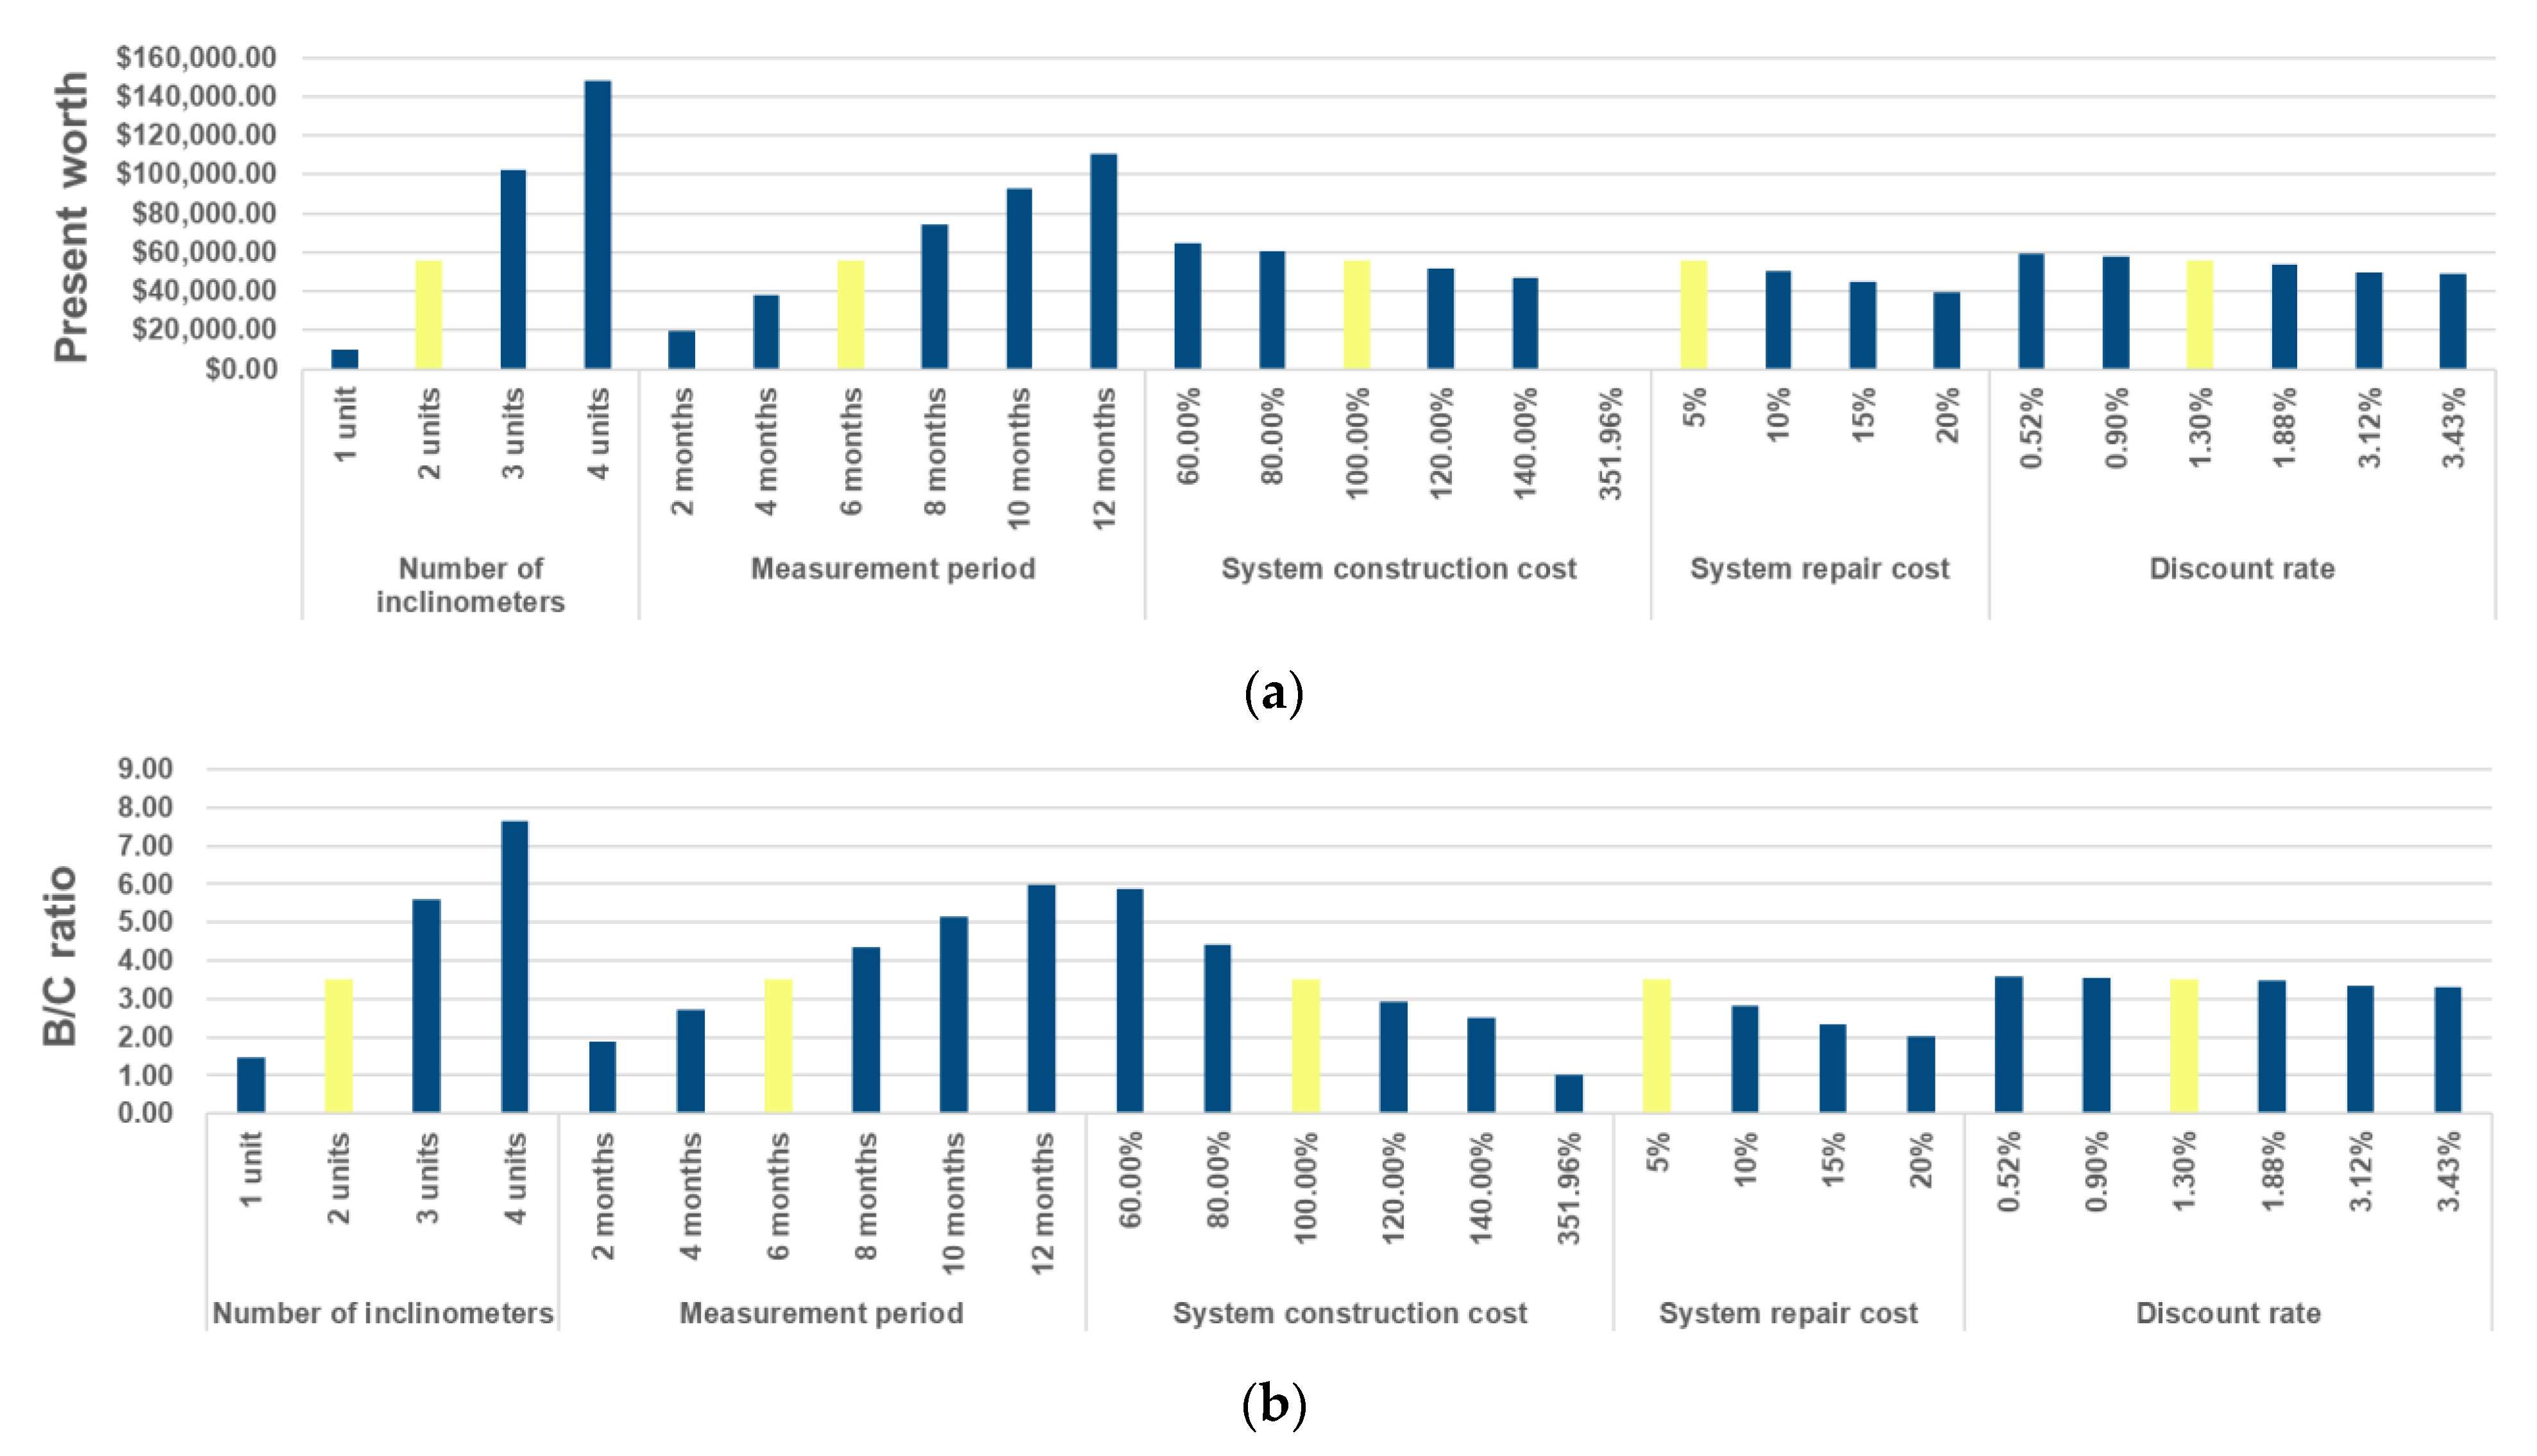
4.2.4. Sensitivity Analysis
5. Conclusions
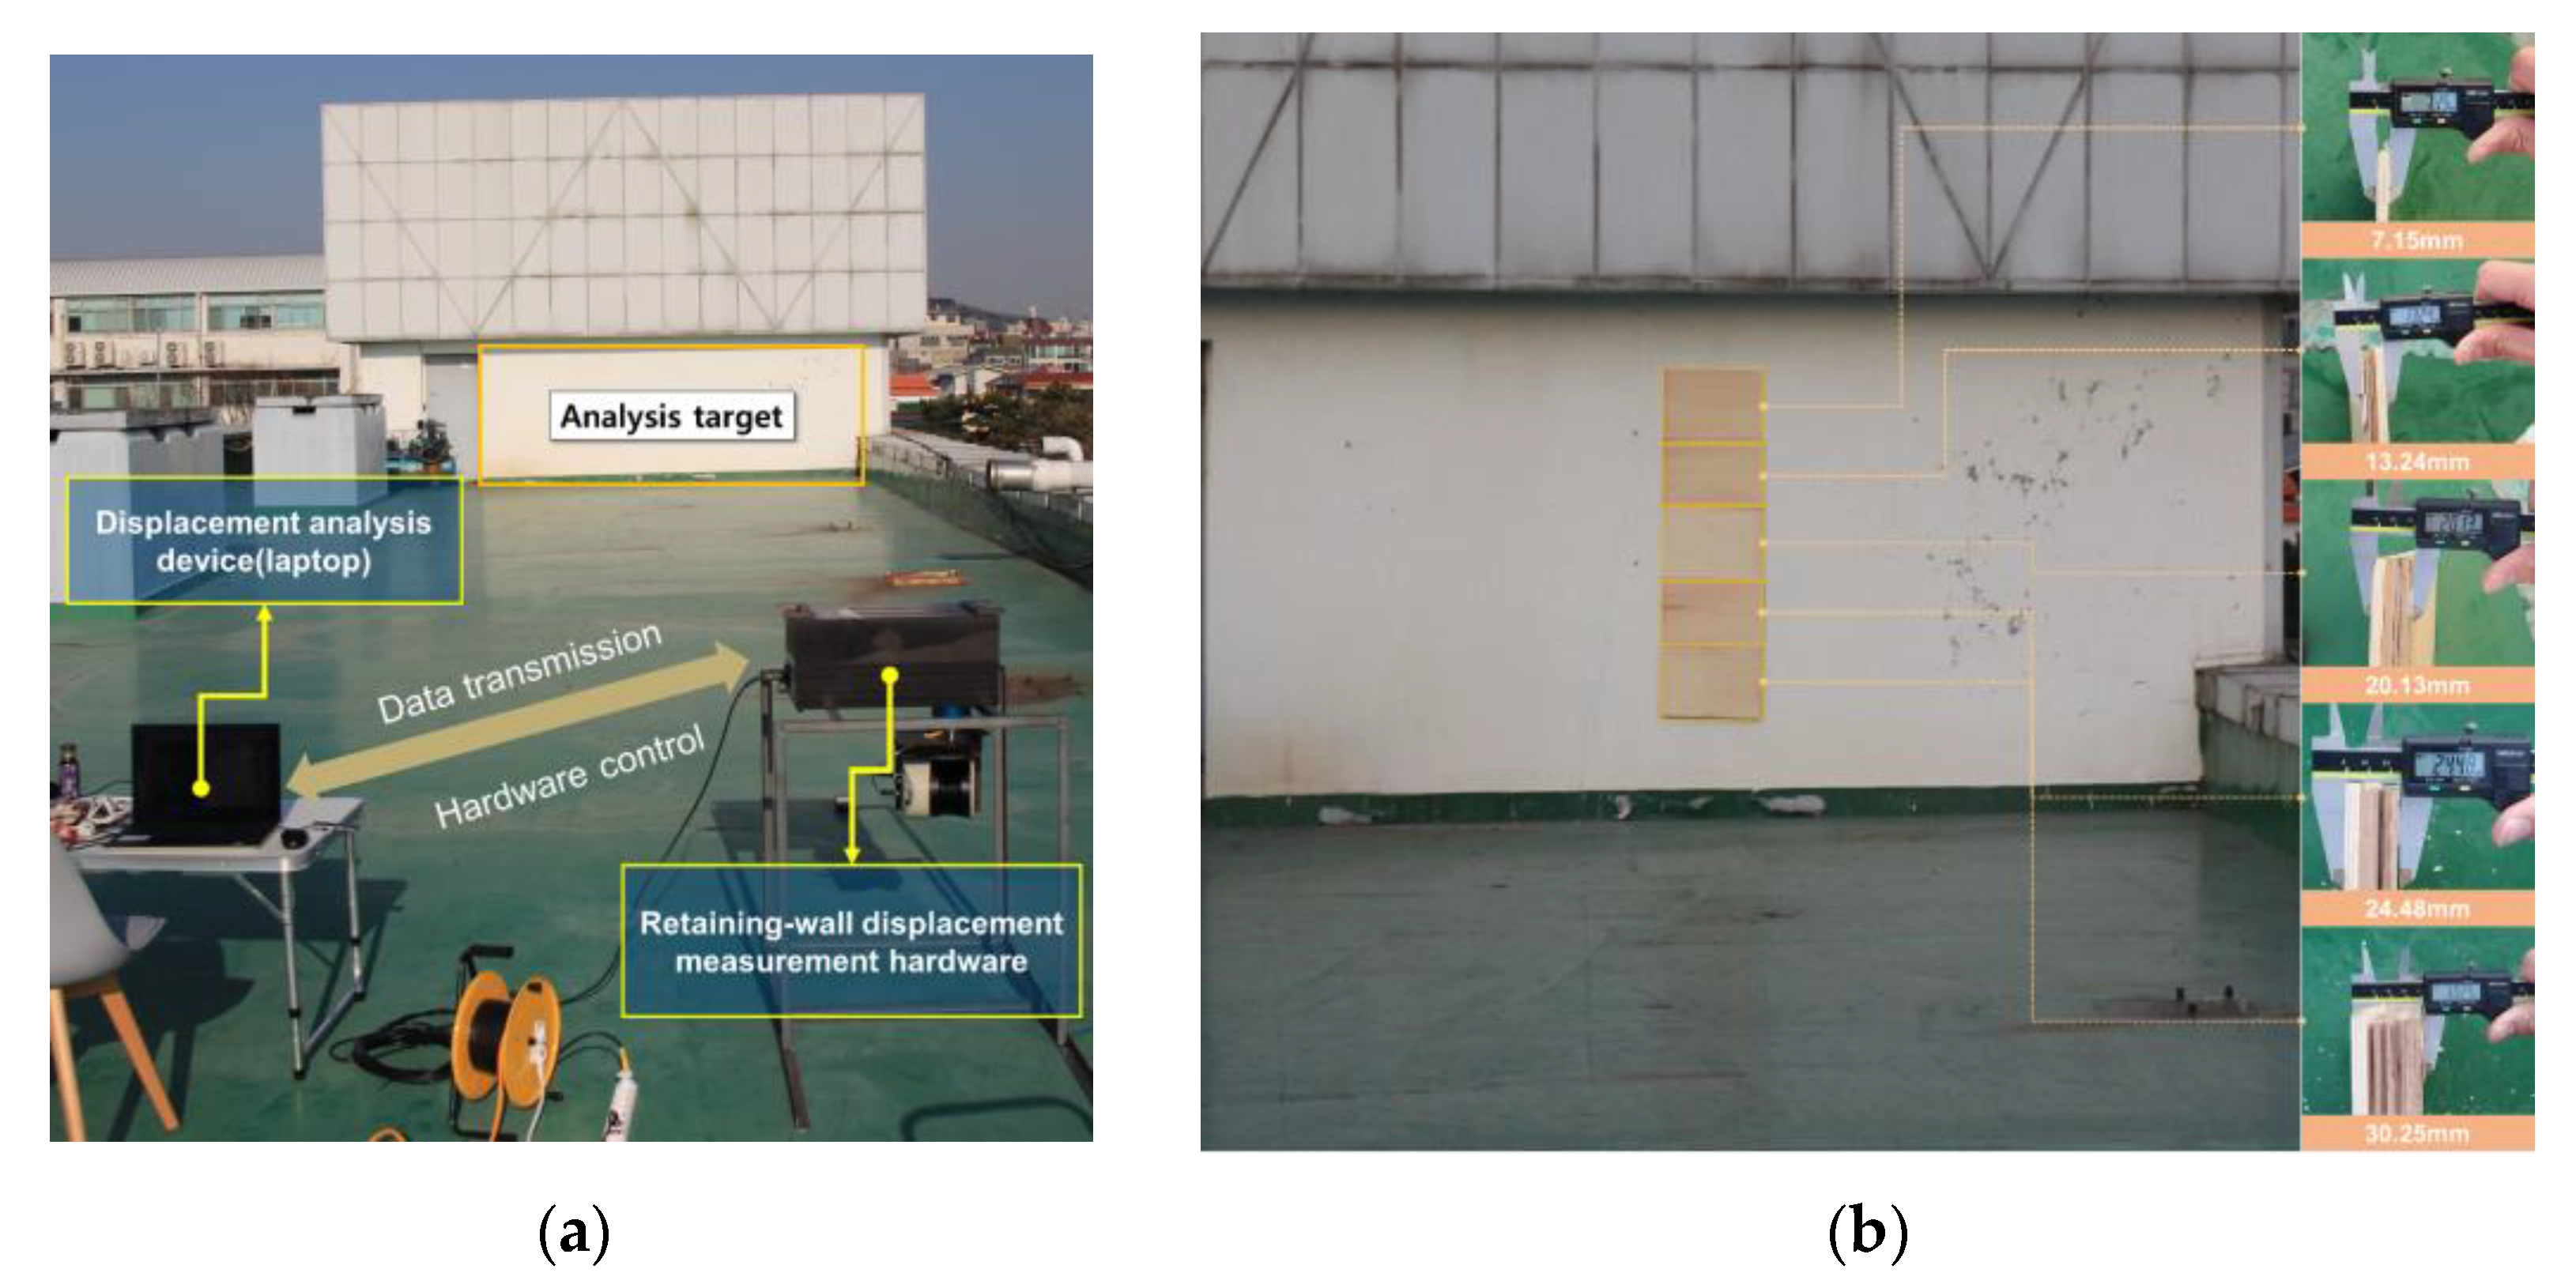
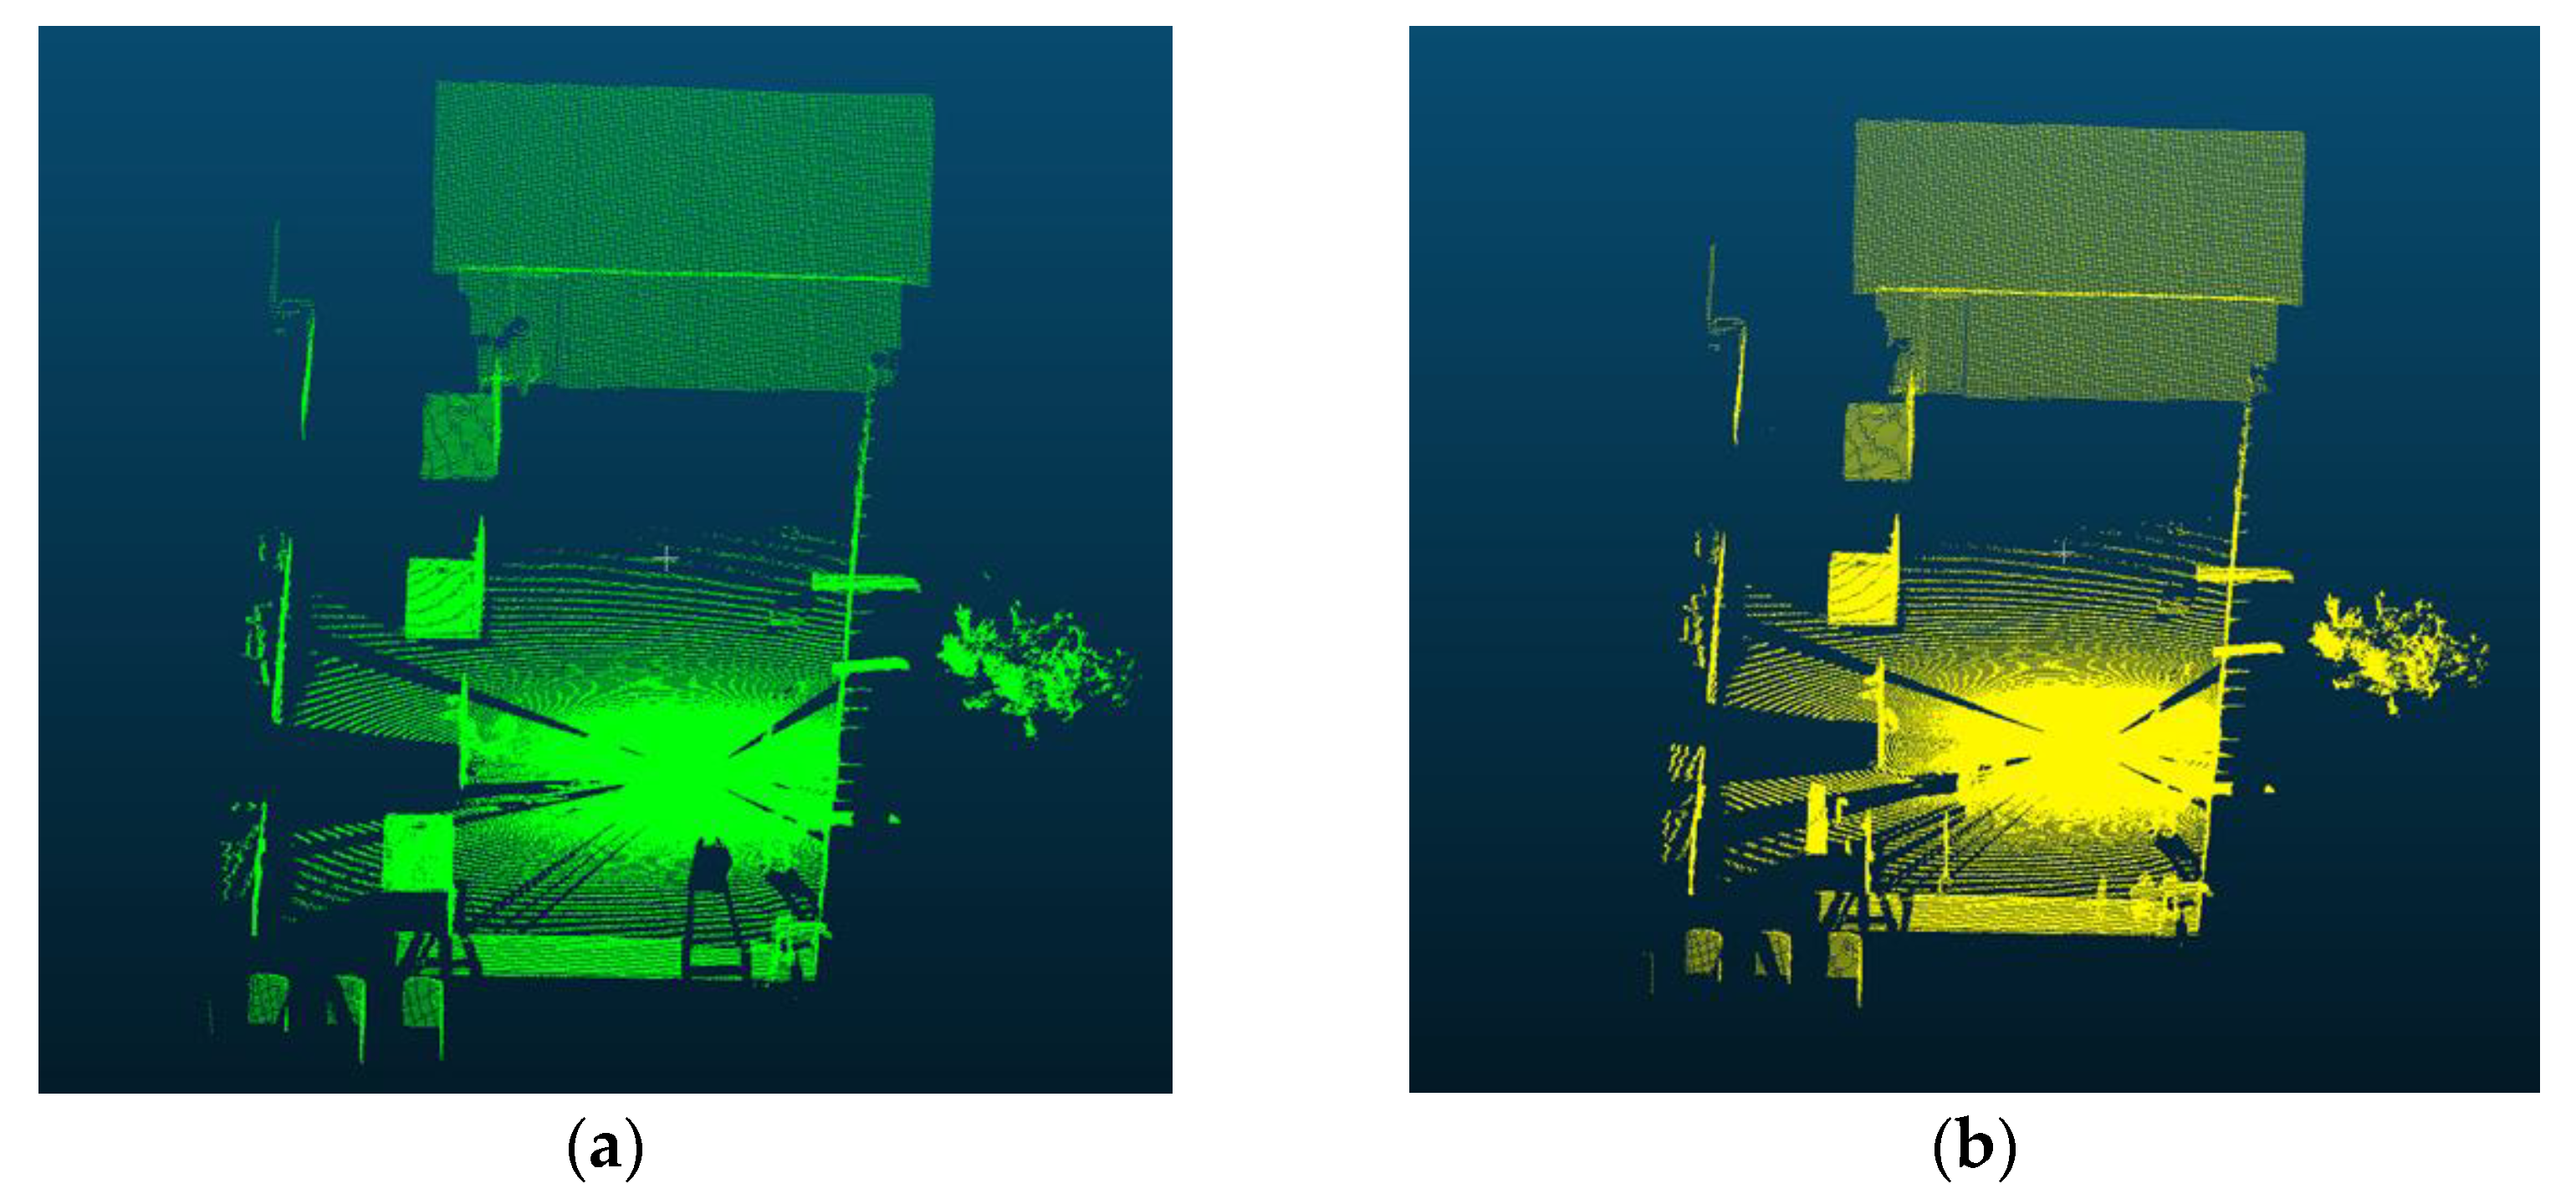
- The retaining wall displacement measurement system comprised: (1) a retaining wall displacement measurement hardware, (2) a software for controlling the hardware, and (3) a displacement analysis device. As compared to TLS, a 2D LiDAR sensor which is economical was applied to the retaining wall displacement measurement hardware. This hardware was developed to collect the point cloud data of the retaining wall by rotating the 2D LiDAR sensor at 360° at a constant speed using a servomotor. The hardware was designed so that wireless control can be performed using software for hardware control, and a displacement analysis device.
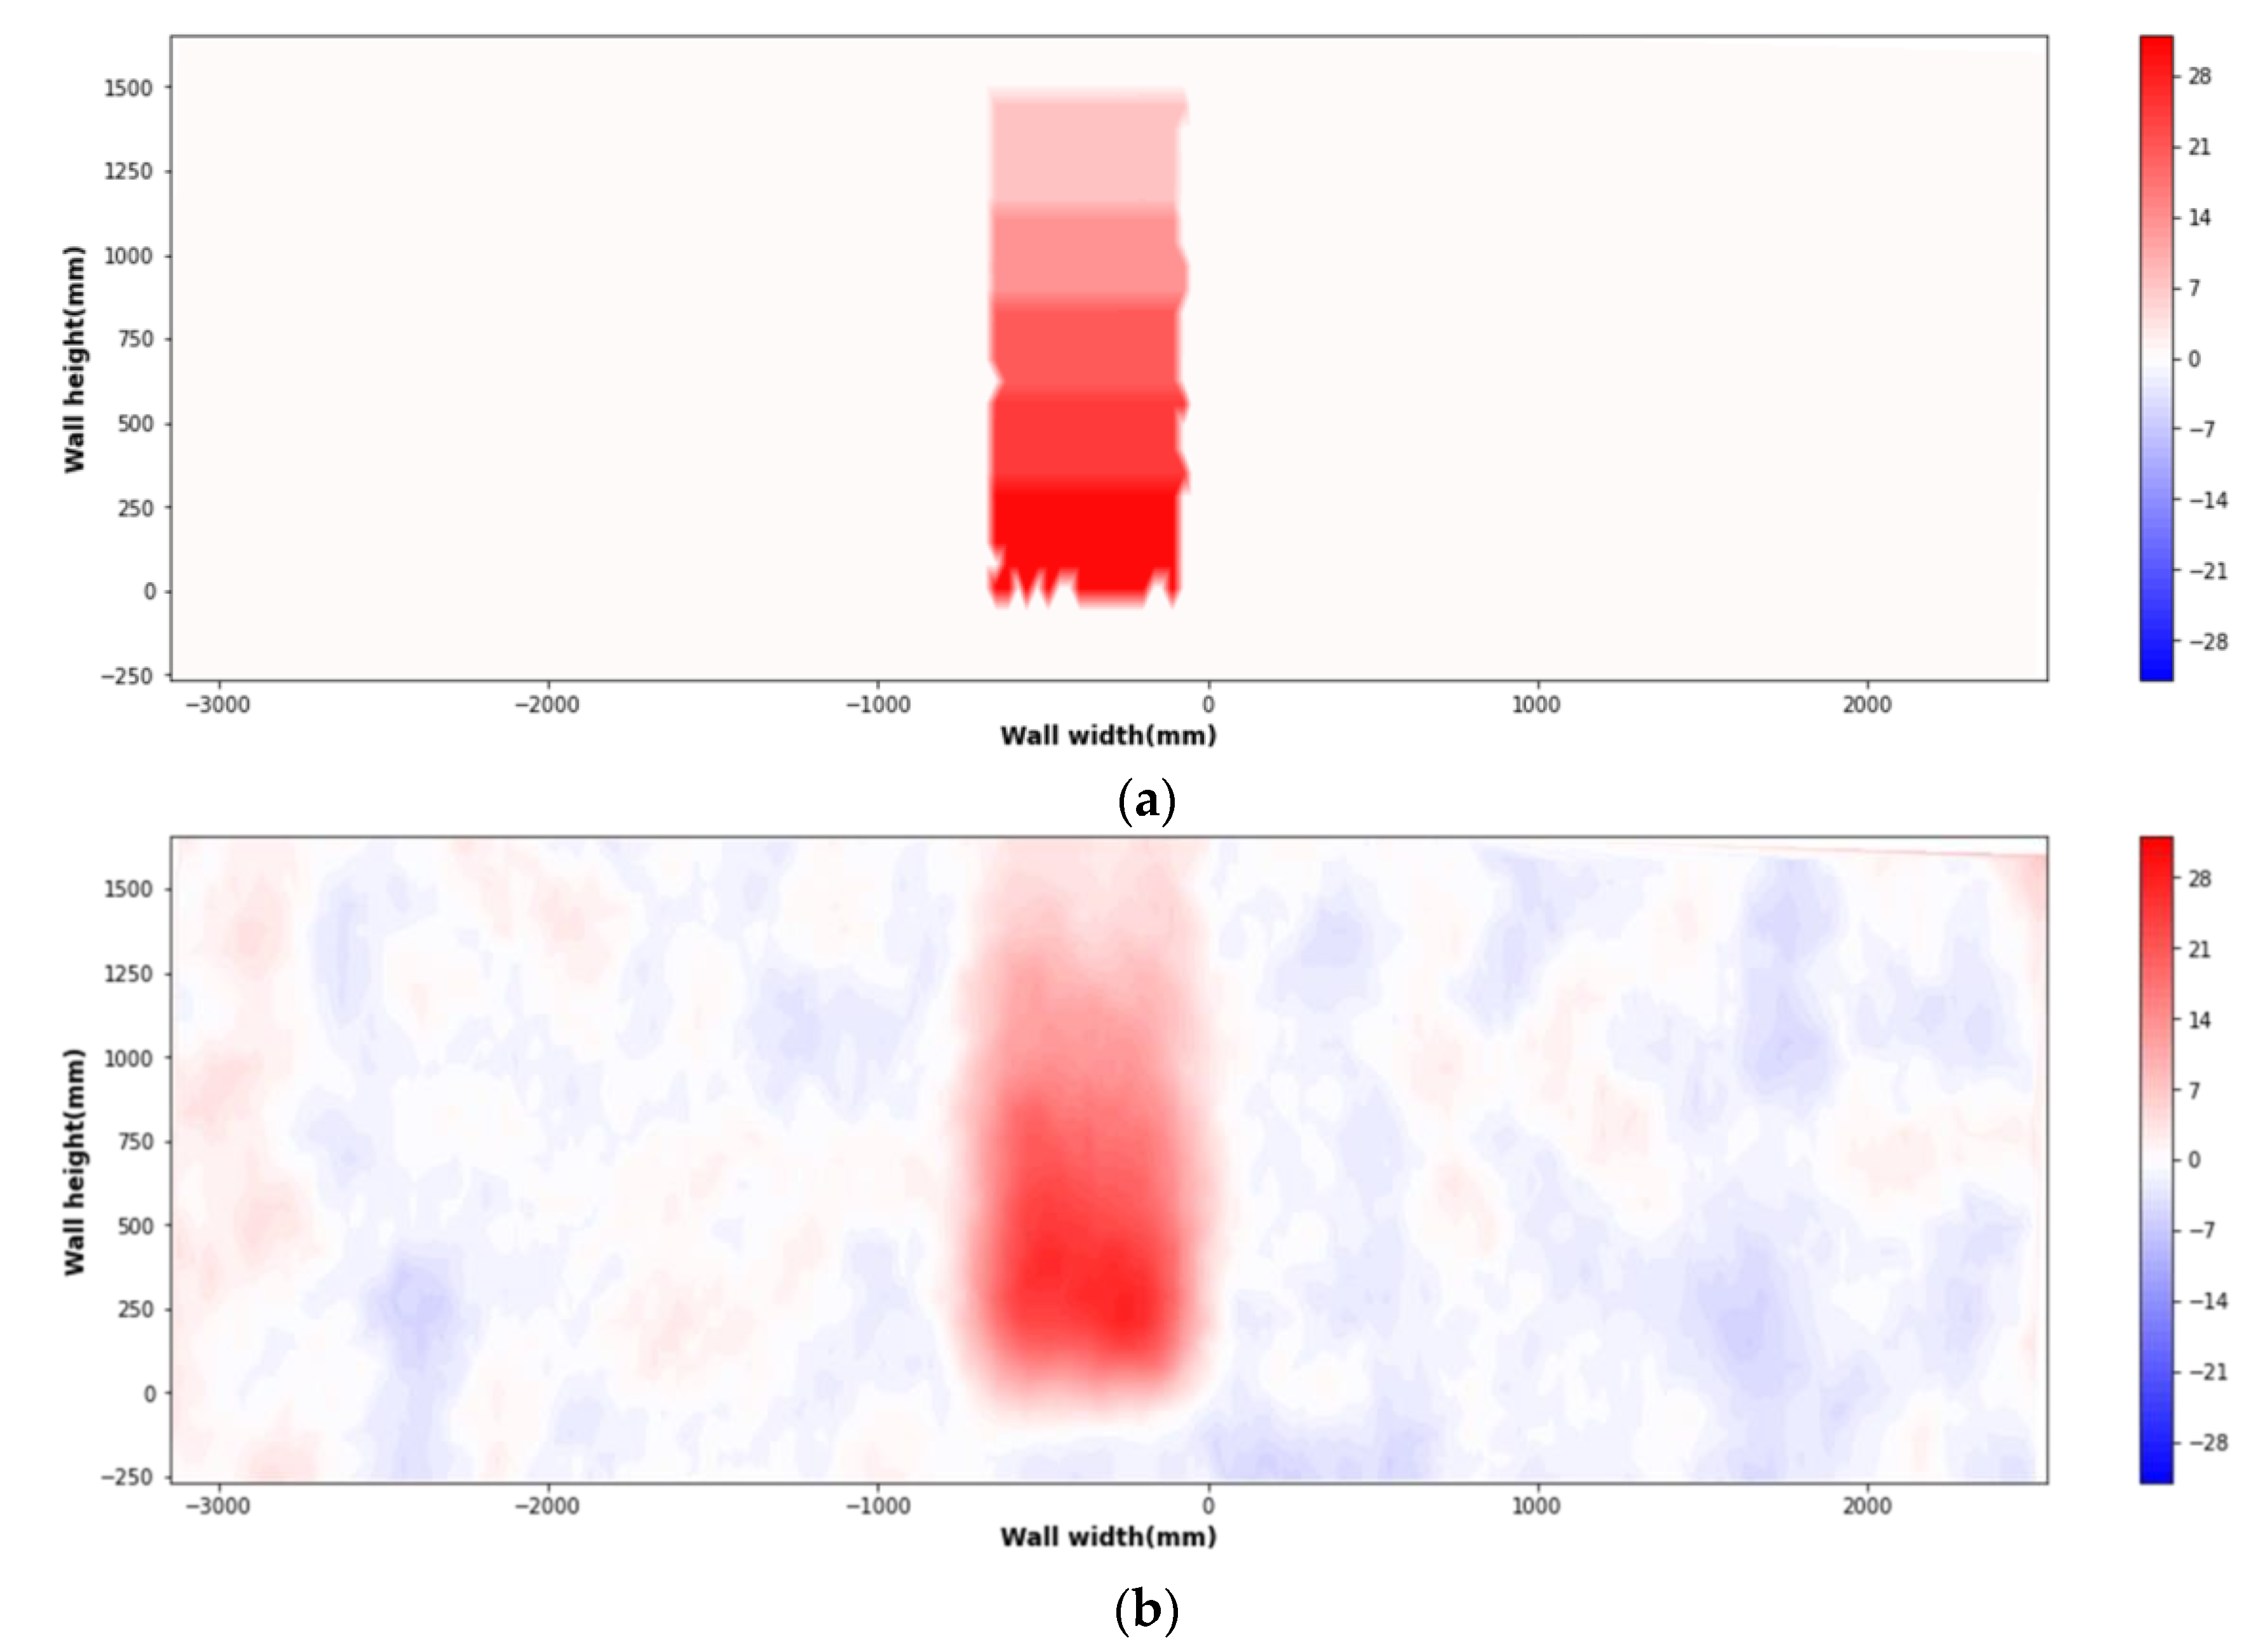
- A testbed was constructed to evaluate the displacement measurement performance of the developed system. A deformation of approximately 7.15 mm was considerably recognizable and the RMSE between the ground truth and lateral displacement predicted using the developed system was 2.82 mm. The system was considerably accurate with Korea’s lateral displacement threshold, thus revealing a high applicability in the construction sector.
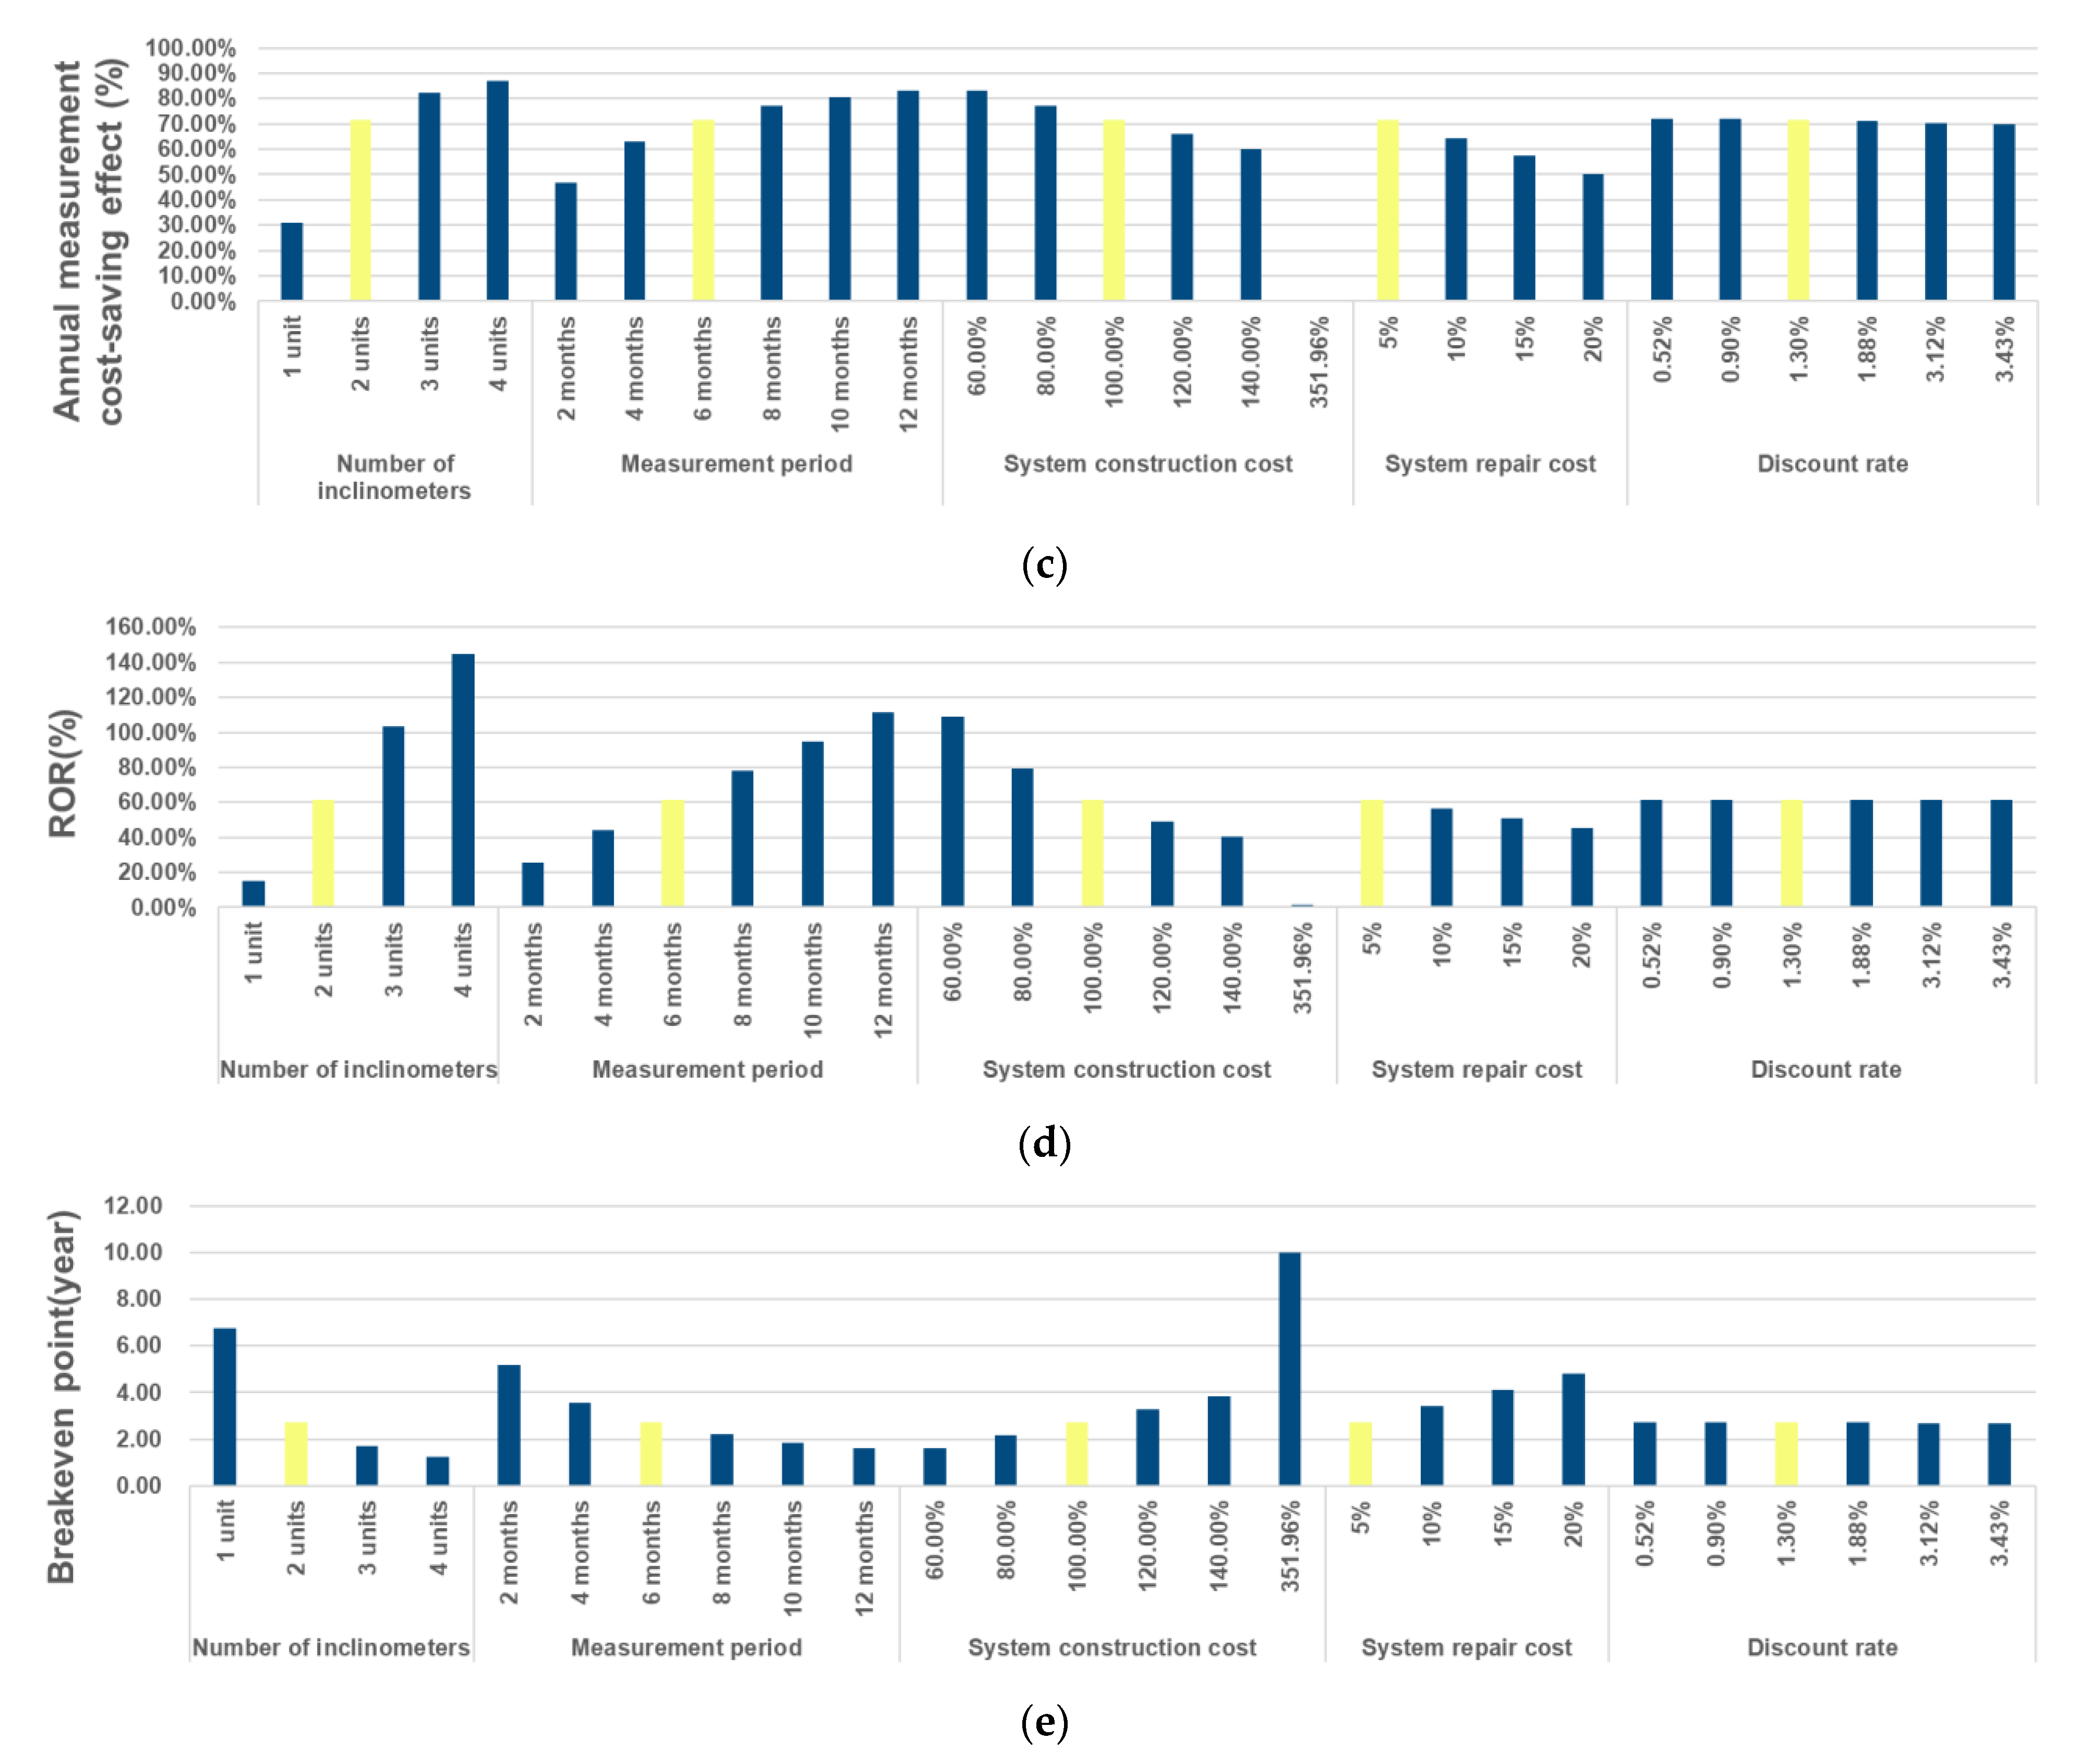
- The results of the LCC analysis revealed that the developed system had a present worth of $56,075.91, a B/C ratio of 3.52, an annual measurement cost-saving effect of 71.59%, an ROR of 61.48%, and a breakeven point of 2.71 years, revealing that it had high economic feasibility. The sensitivity analysis results showed that the developed system was economically feasible in the analysis ranges of five selected variables. Among the five variables, the economic feasibility of the system was lowest when the number of inclinometers was 1. The effects of the system construction and system repair costs, as well as the discount rate on the variability of the economic analysis results were insignificant. Since the economic feasibility of the system aggravated when the system construction cost increased by 351.96% ($42,183.82), the commercialization model of the system had to be developed to avoid exceeding this cost level.
Author Contributions
Funding
Data Availability Statement
Conflicts of Interest
Appendix A
Appendix B

| Number of Inclinometers | Current Worth Method | Benefit/Cost Ratio | Annual Work cost Reduction Rate | Rate of Return | Breakeven Point |
|---|---|---|---|---|---|
| 1 | $10,074.09 | 1.45 | 31.16% | 15.02% | 6.74 years |
| 2 (reference) | $56,075.91 | 3.52 | 71.59% | 61.48% | 2.71 years |
| 3 | $102,077.73 | 5.59 | 82.10% | 103.47% | 1.70 years |
| 4 | $148,079.54 | 7.65 | 86.93% | 144.87% | 1.24 years |
| Measurement Period | Current Worth Method | Benefit/Cost Ratio | Annual Work Cost Reduction Rate | Rate of Return | Breakeven Point |
|---|---|---|---|---|---|
| 2 months | $19,603.39 | 1.88 | 46.83% | 25.81% | 5.16 years |
| 4 months | $37,839.65 | 2.70 | 62.97% | 44.23% | 3.56 years |
| 6 months (reference) | $56,075.91 | 3.52 | 71.59% | 61.48% | 2.71 years |
| 8 months | $74,312.17 | 4.34 | 76.95% | 78.27% | 2.19 years |
| 10 months | $92,548.43 | 5.16 | 80.61% | 94.85% | 1.84 years |
| 12 months | $110,784.69 | 5.98 | 83.27% | 111.33% | 1.59 years |
| System Construction Cost | Current Worth Method | Benefit/Cost Ratio | Annual Work Cost Reduction Rate | Rate of Return | Breakeven Point |
|---|---|---|---|---|---|
| 60% ($7191.24) of the existing construction cost | $64,978.18 | 5.87 | 82.95% | 109.08% | 1.62 years |
| 80% ($9588.32) of the existing construction cost | $60,527.05 | 4.40 | 77.27% | 79.50% | 2.16 years |
| 100% ($11,985.40) of the existing construction cost | $56,075.91 | 3.52 | 71.59% | 61.48% | 2.71 years |
| 120% ($14,382.48) of the existing construction cost | $51,624.77 | 2.93 | 65.91% | 49.20% | 3.27 years |
| 140% ($16,779.56) of the existing construction cost | $47,173.63 | 2.51 | 60.22% | 40.19% | 3.83 years |
| 333.93% ($42,183.82) of the existing construction cost | $0.00 | 1.00 | 0.00% | 1.30% | 10.00 years |
| System Repair Cost | Current Worth Method | Benefit/Cost Ratio | Annual Work Cost Reduction Rate | Rate of Return | Breakeven Point |
|---|---|---|---|---|---|
| 5% ($599.27) of annual repair cost | $56,075.91 | 3.52 | 71.59% | 61.48% | 2.71 years |
| 10% ($1198.54) of annual repair cost | $50,490.31 | 2.81 | 64.46% | 56.27% | 3.41 years |
| 15% ($1797.81) of annual repair cost | $44,904.72 | 2.34 | 57.33% | 51.00% | 4.11 years |
| 20% ($2397.08) of annual repair cost | $39,319.12 | 2.01 | 50.20% | 45.66% | 4.82 years |
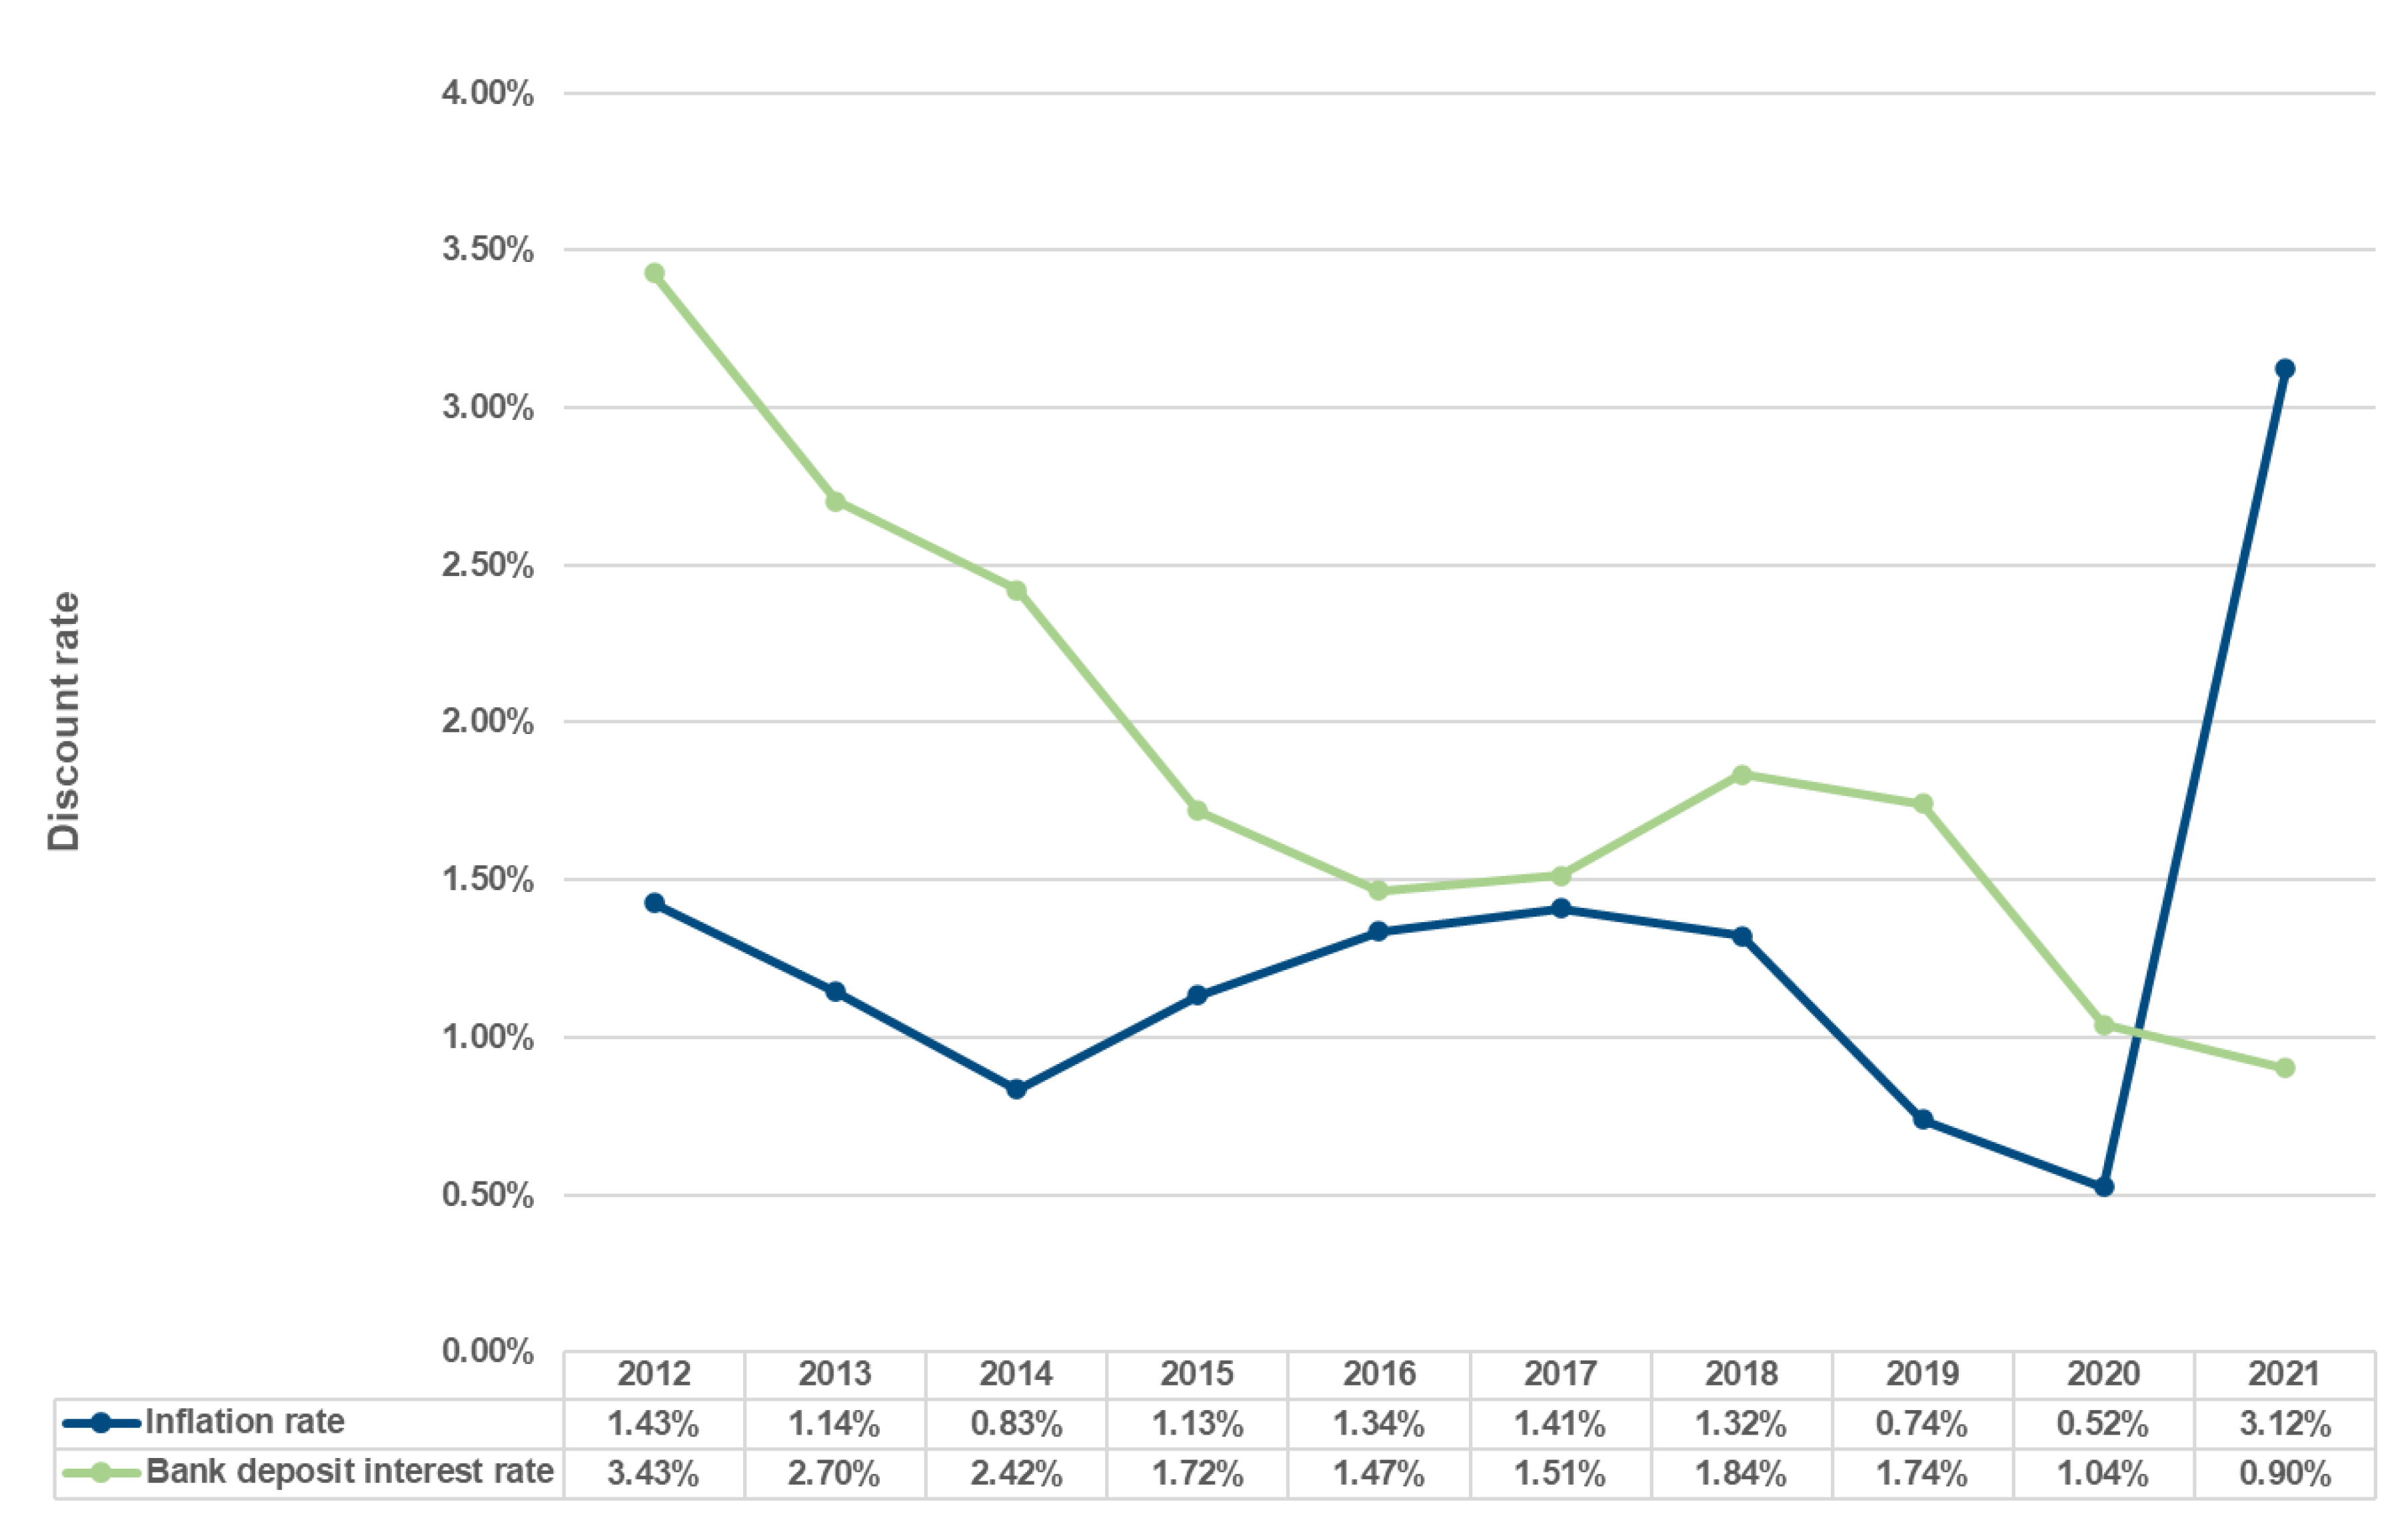
| Discount Rate | Current Worth Method | Benefit/Cost Ratio | Annual Work Cost Reduction Rate | Rate of Return | Breakeven Point |
|---|---|---|---|---|---|
| 0.52% (minimum inflation rate) | $58,984.48 | 3.60 | 72.21% | 61.48% | 2.73 years |
| 0.9% (minimum bank deposit interest rate) | $57,545.07 | 3.56 | 71.91% | 61.48% | 2.72 years |
| 1.3% (reference) | $56,075.91 | 3.52 | 71.59% | 61.48% | 2.71 years |
| 1.88% (average bank deposit interest rate) | $54,025.87 | 3.46 | 71.12% | 61.48% | 2.70 years |
| 3.12% (maximum inflation rate) | $49,940.04 | 3.34 | 70.09% | 61.48% | 2.69 years |
| 3.43% (maximum bank deposit interest rate) | $48,977.70 | 3.31 | 69.83% | 61.48% | 2.68 years |
References
- Zhao, Y.; Seo, H.; Chen, C. Displacement Mapping of Point Clouds: Application of Retaining Structures Composed of Sheet Piles. J. Civ. Struct. Health Monit. 2021, 11, 915–930. [Google Scholar] [CrossRef]
- Hashash, Y.M.A.; Song, H.; Osouli, A. Three-Dimensional Inverse Analyses of a Deep Excavation in Chicago Clays. Int. J. Numer. Anal. Methods Geomech. 2011, 35, 1059–1075. [Google Scholar] [CrossRef]
- Oats, R.C.; Escobar-Wolf, R.; Oommen, T. A Novel Application of Photogrammetry for Retaining Wall Assessment. Infrastructures 2017, 2, 10. [Google Scholar] [CrossRef] [Green Version]
- Su, Y.Y.; Hashash, Y.M.A.; Liu, L.Y. Integration of Construction As-Built Data Via Laser Scanning with Geotechnical Monitoring of Urban Excavation. J. Constr. Eng. Manag. 2006, 132, 1234–1241. [Google Scholar] [CrossRef]
- Kalenjuk, S.; Lienhart, W.; Rebhan, M.J. Processing of Mobile Laser Scanning Data for Large-Scale Deformation Monitoring of Anchored Retaining Structures along Highways. Comput.-Aided Civ. Infrastruct. Eng. 2021, 36, 678–694. [Google Scholar] [CrossRef]
- Ha, D.W.; Kim, J.M.; Kim, Y.; Park, H.S. Development and Application of a Wireless MEMS-Based Borehole Inclinometer for Automated Measurement of Ground Movement. Autom. Constr. 2018, 87, 49–59. [Google Scholar] [CrossRef]
- Chen, H.; Liang, H.; Tang, M.; Jiang, S.; Hu, H. The Real-Time Automated Monitoring System for Lateral Deflection of Underground Structures. Adv. Civ. Eng. 2020, 2020, 6102062. [Google Scholar] [CrossRef]
- RST Instruments. Monitoring Instruments for Excavation. Available online: https://rstinstruments.com/applications/infrastructure/excavation/ (accessed on 14 September 2022).
- Trimble Geotechnical IoT Solutions. Available online: https://monitoring.trimble.com/products-and-solutions/geotechnical-iot-solutions (accessed on 14 September 2022).
- Atmax Integrated Monitoring Program for Construction Measurement. Available online: http://www.atmacs.co.kr/php/theme/asktheme/at_business02.php (accessed on 14 September 2022).
- Specto Technology Wireless Tilt Monitoring. Available online: https://www.spectotechnology.com/product/wireless-tilt-monitoring/ (accessed on 14 September 2022).
- Oskouie, P.; Becerik-Gerber, B.; Soibelman, L. Automated Measurement of Highway Retaining Wall Displacements Using Terrestrial Laser Scanners. Autom. Constr. 2016, 65, 86–101. [Google Scholar] [CrossRef]
- Lin, Y.-J.; Habib, A.; Bullock, D.; Prezzi, M. Application of High-Resolution Terrestrial Laser Scanning to Monitor the Performance of Mechanically Stabilized Earth Walls with Precast Concrete Panels. J. Perform. Constr. Facil. 2019, 33, 04019054. [Google Scholar] [CrossRef]
- Seo, H. Long-Term Monitoring of Zigzag-Shaped Concrete Panel in Retaining Structure Using Laser Scanning and Analysis of Influencing Factors. Opt. Lasers Eng. 2021, 139, 106498. [Google Scholar] [CrossRef]
- Ko, Y.; Seo, S.; Jin, T.; Chung, M. Feasibility Evaluation of the 3D-DIC Non Contact Measurement System Using Small-Scaled Model Test of Earth Retaining Wall. Int. J. Geo-Eng. 2021, 12, 12. [Google Scholar] [CrossRef]
- Aldosari, M.; Al-Rawabdeh, A.; Bullock, D.; Habib, A. A Mobile LiDAR for Monitoring Mechanically Stabilized Earth Walls with Textured Precast Concrete Panels. Remote Sens. 2020, 12, 306. [Google Scholar] [CrossRef] [Green Version]
- Ha, Y.S.; Lee, J.; Kim, Y.T. Performance Evaluation of Feature Matching Techniques for Detecting Reinforced Soil Retaining Wall Displacement. Remote Sens. 2022, 14, 1697. [Google Scholar] [CrossRef]
- Gikas, V. Three-Dimensional Laser Scanning for Geometry Documentation and Construction Management of Highway Tunnels during Excavation. Sensors 2012, 12, 11249–11270. [Google Scholar] [CrossRef] [PubMed] [Green Version]
- González-Aguilera, D.; Gómez-Lahoz, J.; Sánchez, J. A New Approach for Structural Monitoring of Large Dams with a Three-Dimensional Laser Scanner. Sensors 2008, 8, 5866–5883. [Google Scholar] [CrossRef] [Green Version]
- Gojcic, Z.; Zhou, C.; Wieser, A. F2S3: Robustified Determination of 3D Displacement Vector Fields Using Deep Learning. J. Appl. Geod. 2020, 14, 177–189. [Google Scholar] [CrossRef]
- Cha, G.; Park, S.; Oh, T. A Terrestrial LiDAR-Based Detection of Shape Deformation for Maintenance of Bridge Structures. J. Constr. Eng. Manag. 2019, 145, 04019075. [Google Scholar] [CrossRef]
- Washington State Department of Transportation. Geotechnical Design Manual M 46-03; Washington State Department of Transportation: Vancouver, WA, USA, 2022.
- Maher, T.; Basha, A.M.; Abo-Raya, M.M.; Zakaria, M.H. General Deformation Behavior of Deep Excavation Support Systems: A Review. Glob. J. Eng. Technol. Adv. 2022, 10, 039–057. [Google Scholar] [CrossRef]
- Ministry of Land Infrastructure and Transport of Korea. Ground Measurement during Construction; Ministry of Land Infrastructure and Transport of Korea: Sejong, Korea, 2021.
- John, D. Geotechnical Instrumentation for Monitoring Field Performance Research; John Wiley and Sons: Hoboken, NJ, USA, 1982. [Google Scholar]
- Mclandrich Arup, S.M.; Hashash, Y.M.A.; O’riordan, N.J. Networked Geotechnical Near Real-Time Monitoring for Large Urban Excavation Using Multiple Wireless Sensors; Missouri University of Science and Technology: Rolla, MO, USA, 2013. [Google Scholar]
- Moon, S.; Choi, E.; Hyun, J. Safety Management of the Retaining Wall Using USN Sonar Sensors. Korean J. Constr. Eng. Manag. KICEM 2011, 12, 22–30. [Google Scholar] [CrossRef] [Green Version]
- Kim, J.-S.; Lee, G.-Y.; Kim, Y.S. Conceptual Design and Displacement Recognition Performance Verification of Displacement Measurement System for Retaining Wall Structure Based on Laser Sensor. Korean J. Constr. Eng. Manag. 2022, 23, 64–72. [Google Scholar] [CrossRef]
- Malikov, S.; Ohlmann-Lauber, J. A Contribution to the Application of the 2D Laserscanner SICK LMS511 for Deformation Analysis; Technische Universität München: Munich, Germany, 2014; Volume 22, ISBN 9783943683233. [Google Scholar]
- Lague, D.; Brodu, N.; Leroux, J. Accurate 3D Comparison of Complex Topography with Terrestrial Laser Scanner: Application to the Rangitikei Canyon (N-Z). ISPRS J. Photogramm. Remote Sens. 2013, 82, 10–26. [Google Scholar] [CrossRef]
- Korea Engineering & Consulting Association. Standard Quantity per Unit of Ground Survey of Korea; Korea Engineering & Consulting Association: Seoul, Korea, 2017. [Google Scholar]
- Ministry of Land, Infrastructure and Transport of Korea. Standard Quantity per Unit of Construction Work of Korea; Ministry of Land, Infrastructure and Transport of Korea: Sejong, Korea, 2022.
- Korea Engineering & Consulting Association. Wages Survey Report of Engineering Companies of Korea; Korea Engineering & Consulting Association: Seoul, Korea, 2021. [Google Scholar]
- Construction Association of Korea. Report on the Wage Status of the Construction Industry of Korea; Construction Association of Korea: Seoul, Korea, 2022. [Google Scholar]
- Korea Price Information Corp. Price Information Magazine of Korea. Available online: http://www.kpi.or.kr/ (accessed on 14 September 2022).
- Construction Association of Korea. Cost Calculation Table of Construction Machinery of Korea; Construction Association of Korea: Seoul, Korea, 2022. [Google Scholar]
- Public Procurement Service of Korea. Service Life; Public Procurement Service of Korea: Daejeon, Korea, 2018.
- Bank of Korea. Consumer Price Index of Korea. Available online: https://ecos.bok.or.kr/#/ (accessed on 16 September 2022).
- Bank of Korea. The Weighted Average Interest Rate of a Deposit Bank. Available online: https://ecos.bok.or.kr/#/SearchStat (accessed on 16 September 2022).


| Author/Company | Category | Object | Main Measurement Technologies | Stage |
|---|---|---|---|---|
| Ha et al., 2018 [6] | Article | Excavation retaining wall | MEMS-based inclinometer, and CDMA module | Field test |
| Chen et al., 2020 [7] | Article | Excavation retaining wall | Inclinometer, data integrator, and gateway | Field test |
| RST [8] | Product | Excavation retaining wall | MEMS inclinometer, data loggers, and gateway | Commercialization |
| Trimble [9] | Product | Retaining wall | Tiltmeter, laser-tilt sensors, data loggers, and gateway | Commercialization |
| Atmax [10] | Product | Retaining wall | Inclinometer and data loggers | Commercialization |
| Specto Technology [11] | Product | Retaining wall | Tiltmeter and data loggers | Commercialization |
| Author | Category | Measurement Technology | Object | Stage |
|---|---|---|---|---|
| Su et al., 2006 [4] | Article | TLS | Retaining wall for excavation | Field test |
| Hashash et al., 2011 [2] | TLS | Retaining wall for excavation | Field test | |
| Zhao et al., 2021 [1] | TLS | Retaining wall for excavation | Field test | |
| Oskouie et al., 2016 [12] | TLS | Retaining wall for highway | Laboratory experiments (simulation) | |
| Lin et al., 2019 [13] | TLS | Retaining wall for highway | Field test | |
| Seo, 2021 [14] | TLS | Retaining wall for tunnel | Field test | |
| Aldosari et al., 2020 [16] | MLS | Retaining wall for highway | Field test | |
| Kalenjuk et al., 2021 [5] | MLS | Retaining wall for highway | Field test | |
| Oat et al., 2017 [3] | Vision (photogrammetry) | Retaining wall | Laboratory experiments | |
| Ko et al., 2021 [15] | Vision (D.I.C.) | Retaining wall for excavation | Laboratory experiments | |
| Ha et al., 2022 [17] | Vision (KAZE) | Retaining wall | Laboratory experiments |
| Parameter | Value | |
|---|---|---|
| 2D LiDAR sensor | Resolution | 0.1667° |
| Frequency | 25 Hz | |
| Servomotor | Rotation speed | 2°/s |
| Number of rotations | 1 | |
| M3C2 algorithm | Core points | All point cloud data |
| DM3C2 (normal scale) | 300 mm | |
| dM3C2 (projection scale) | 300 mm | |
| HM3C2 (height) | 3000 mm | |
| Parameters | |
|---|---|
| Excavation depth | 3 m |
| Boring depth (Excavation depth + 2 m) | 5 m |
| Inclinometer | 2 units |
| Hardware | 1 unit |
| Measurement period | 6 months |
| Number of measurements | 48 |
| Input Cost | Conventional Method | |||
|---|---|---|---|---|
| Item | Unit Cost | Quantity | Cost | |
| Labor cost | Intermediate technician | $160.95/person | 0.12 person | $22.53 |
| Special worker | $132.33/person | 0.17 person | $25.14 | |
| Ordinary worker | $105.46/person | 0.23 person | $28.47 | |
| Borer | $141.36/person | 0.23 person | $38.17 | |
| Construction machine operator | $168.06/person | 0.11 person | $18.49 | |
| Labor cost per unit boring depth ($/m) | $122.02/m | |||
| Material cost | Single-core barrel (HX × 1.0 m) | $138.69/box | 0.01 box | $1.39 |
| Metal crown bit (HX) | $37.96/box | 0.025 box | $0.95 | |
| Drive pipe head (HX) | $43.80/box | 0.01 box | $0.44 | |
| Drive pipe shoe (HX) | $36.50/box | 0.01 box | $0.36 | |
| Drive pipe (HX × 1.0 m) | $90.51/box | 0.01 box | $0.91 | |
| Material cost per boring depth ($/m) | $4.04/m | |||
| Equipment cost | Boring equipment (54HP) | $28.55/h | 0.88 h | $25.13 |
| Equipment cost per unit boring depth ($/m) | $25.13/m | |||
| Work cost per unit boring depth ($/m) = labor cost + material cost + equipment cost | $151.19/m | |||
| Boring cost ($) = work cost per unit boring depth × boring depth × number of inclinometers | $1511.92 | |||
| Input Cost | Conventional Method | Automated Method | ||||
|---|---|---|---|---|---|---|
| Item | Unit Cost | Quantity | Cost | Quantity | Cost | |
| Labor cost | Intermediate technician | $169.18/person | 0.40 person | $67.67 | 0.40 person | $67.67 |
| Special worker | $140.42/person | 0.80 person | $112.34 | - | $0 | |
| Ordinary worker | $112.17/person | 1.60 person | $179.47 | 0.13 person | $14.58 | |
| Intermediate skilled technician | $142.07/person | 0.80 person | $113.66 | - | $0 | |
| Steelworker | $158.18/person | - | $0 | 0.34 person | $53.78 | |
| Welder | $174.26/person | - | $0 | 0.17 person | $29.62 | |
| Construction machine operator | $168.06/person | - | $0 | 0.04 person | $6.72 | |
| Labor cost per installed unit ($/number of units) | $473.13/number of units | $172.38/number of units | ||||
| Material cost | Inclinometer casing (Boring depth + 1 m) | $8.76/m | 6 m | $52.55 | - | $0 |
| Protective box | $72.99/box | 1 box | $72.99 | - | $0 | |
| Miscellaneous materials (% of the sum of inclinometer casing and protective box) | $125.55 | 5% | $6.28 | - | $0 | |
| Material cost per installed unit ($/number of units) | $131.82/number of units | $0/number of units | ||||
| Equipment cost | Crane | $51.72/h | - | $0 | 0.29 h | $15.00 |
| Equipment cost per installed unit ($/number of units) | $0/number of units | $15.00/number of units | ||||
| Work cost per installed unit ($/number of measuring instruments) = labor cost + material cost + equipment cost | $604.96/number of units | $187.38/number of units | ||||
| Installation cost ($) = work cost per installed unit × number of measuring instruments | $1209.92 | $187.38 | ||||
| Input Cost | Conventional Method | Automated Method | ||||
|---|---|---|---|---|---|---|
| Item | Unit Cost | Quantity | Cost | Quantity | Cost | |
| Labor cost | Intermediate technician | $169.18/person | 0.10 person | $16.92 | - | $0 |
| Special worker | $140.42/person | 0.20 person | $28.08 | - | $0 | |
| Beginner technician | $133.28/person | 0.20 person | $26.66 | 0.20 person | $26.66 | |
| Labor cost per measurement | $71.66 | $26.66 | ||||
| Material cost | Cost of using the inclinometer | $14.06 | 0.20 | $2.81 | - | $0 |
| Material cost per measurement | $2.81 | $0 | ||||
| Work cost per measurement ($/number of measurements) = labor cost + material cost | $74.47/number of measurements | $26.66/number of measurements | ||||
| Inclinometer installation cost ($) = work cost per measurement × number of measurements × number of measuring instruments | $7149.09 | $1279.47 | ||||
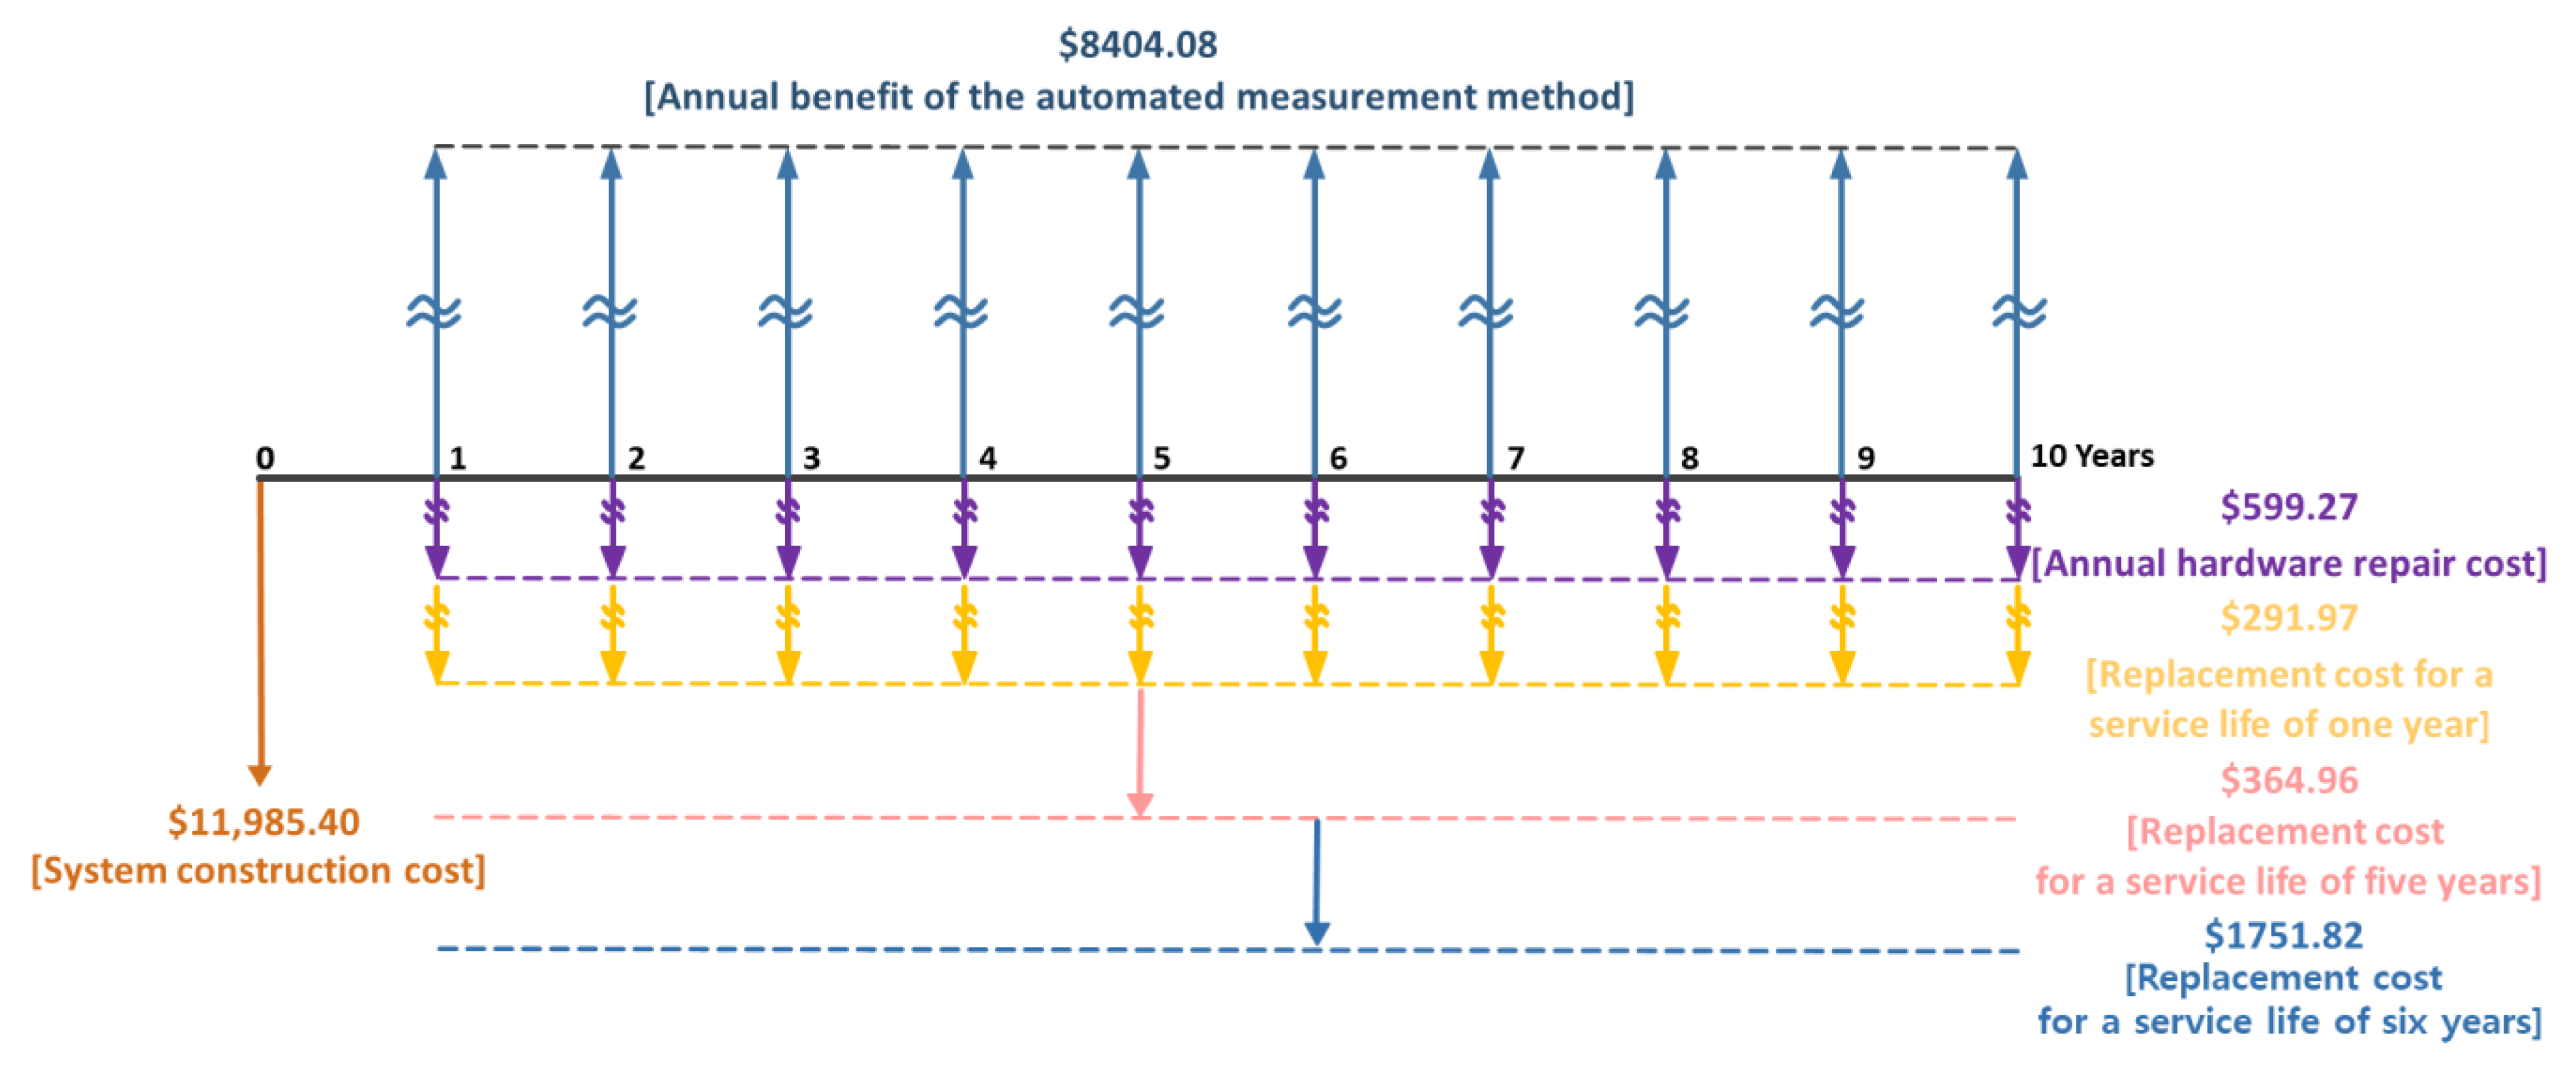
| Product | Service Life (Years) | Cost ($) | |
|---|---|---|---|
| Component | 2D LiDAR sensor (LMS511-10100 PRO) | 10 | $5474.45 |
| Bracket | 10 | $218.98 | |
| Servomotor | 10 | $306.57 | |
| Reducer | 10 | $291.97 | |
| Slip ring | 5 | $255.47 | |
| Servomotor driver | 5 | $109.49 | |
| PLC | 10 | $218.98 | |
| Control computer | 6 | $656.93 | |
| Control and drive unit case | 10 | $729.93 | |
| Power | 10 | $145.99 | |
| Bolts and other consumables | 1 | $291.97 | |
| Displacement analysis device | 6 | $1094.89 | |
| Assembly cost | - | $1094.89 | |
| Test cost | - | $1094.89 | |
| Construction cost of the retaining wall displacement measurement system | $11,985.40 | ||
| Economic Analysis | Definition |
|---|---|
| Present worth analysis | A method of comparing benefits and costs by converting all the benefits and costs in the cash flow diagram into the present worth. |
| B/C ratio analysis | A method of evaluating the degree to which the benefit exceeds the cost by analyzing the ratio of the benefit to the cost converted into the present worth. |
| Annual measurement cost-saving effect analysis | A method of identifying the annual measurement cost-saving effect of introducing a system by comparing the annual benefit and cost under the assumption that the benefit and cost are identical in different years. |
| ROR analysis | A method of deriving the rate of return that differentiates between the benefit and cost converted into the present worth zero. |
| Breakeven point analysis | A method of deriving the breakeven point between the benefit and cost converted into the present worth. |
| Present Worth | B/C Ratio | Annual Measurement Cost-Saving Effect | ROR | Breakeven Point |
|---|---|---|---|---|
| $56,075.91 | 3.52 | 71.59% | 61.48% | 2.71 years |
| Variable | Range |
|---|---|
| Number of inclinometers | 1–4 |
| Measurement period | 2–12 months |
| System construction cost | 60–140% of the existing construction cost |
| System repair cost | 5–20% of the system construction cost every year |
| Discount rate | 0.52–3.43% |
Publisher’s Note: MDPI stays neutral with regard to jurisdictional claims in published maps and institutional affiliations. |
© 2022 by the authors. Licensee MDPI, Basel, Switzerland. This article is an open access article distributed under the terms and conditions of the Creative Commons Attribution (CC BY) license (https://creativecommons.org/licenses/by/4.0/).
Share and Cite
Kim, J.-S.; Lee, G.-y.; Kim, Y.S. 2D-LiDAR-Sensor-Based Retaining Wall Displacement Measurement System. Appl. Sci. 2022, 12, 11335. https://doi.org/10.3390/app122211335
Kim J-S, Lee G-y, Kim YS. 2D-LiDAR-Sensor-Based Retaining Wall Displacement Measurement System. Applied Sciences. 2022; 12(22):11335. https://doi.org/10.3390/app122211335
Chicago/Turabian StyleKim, Jun-Sang, Gil-yong Lee, and Young Suk Kim. 2022. "2D-LiDAR-Sensor-Based Retaining Wall Displacement Measurement System" Applied Sciences 12, no. 22: 11335. https://doi.org/10.3390/app122211335