

Considering the Effect of Non-Propagating Cracks on Fatigue Limit Prediction in the Critical Distance Method Framework
Abstract
:1. Introduction
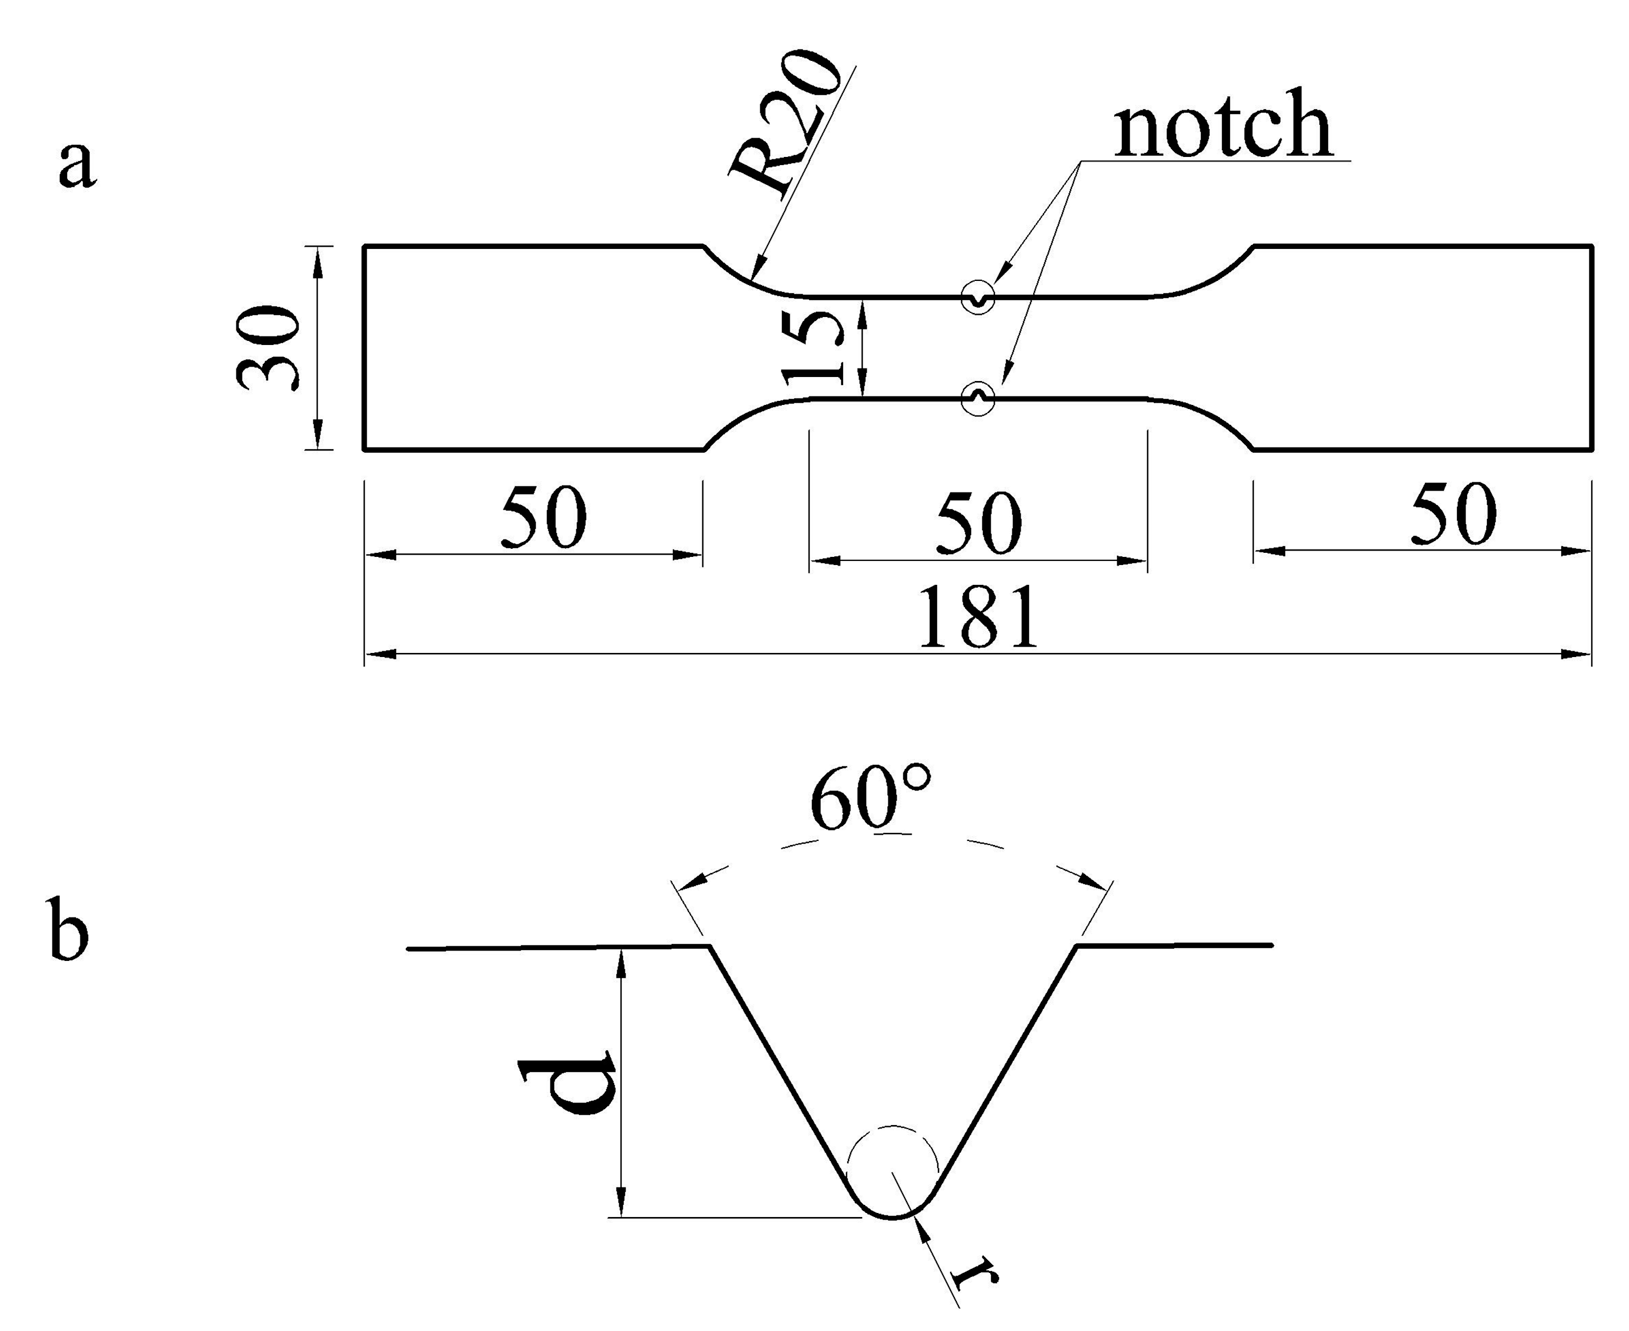
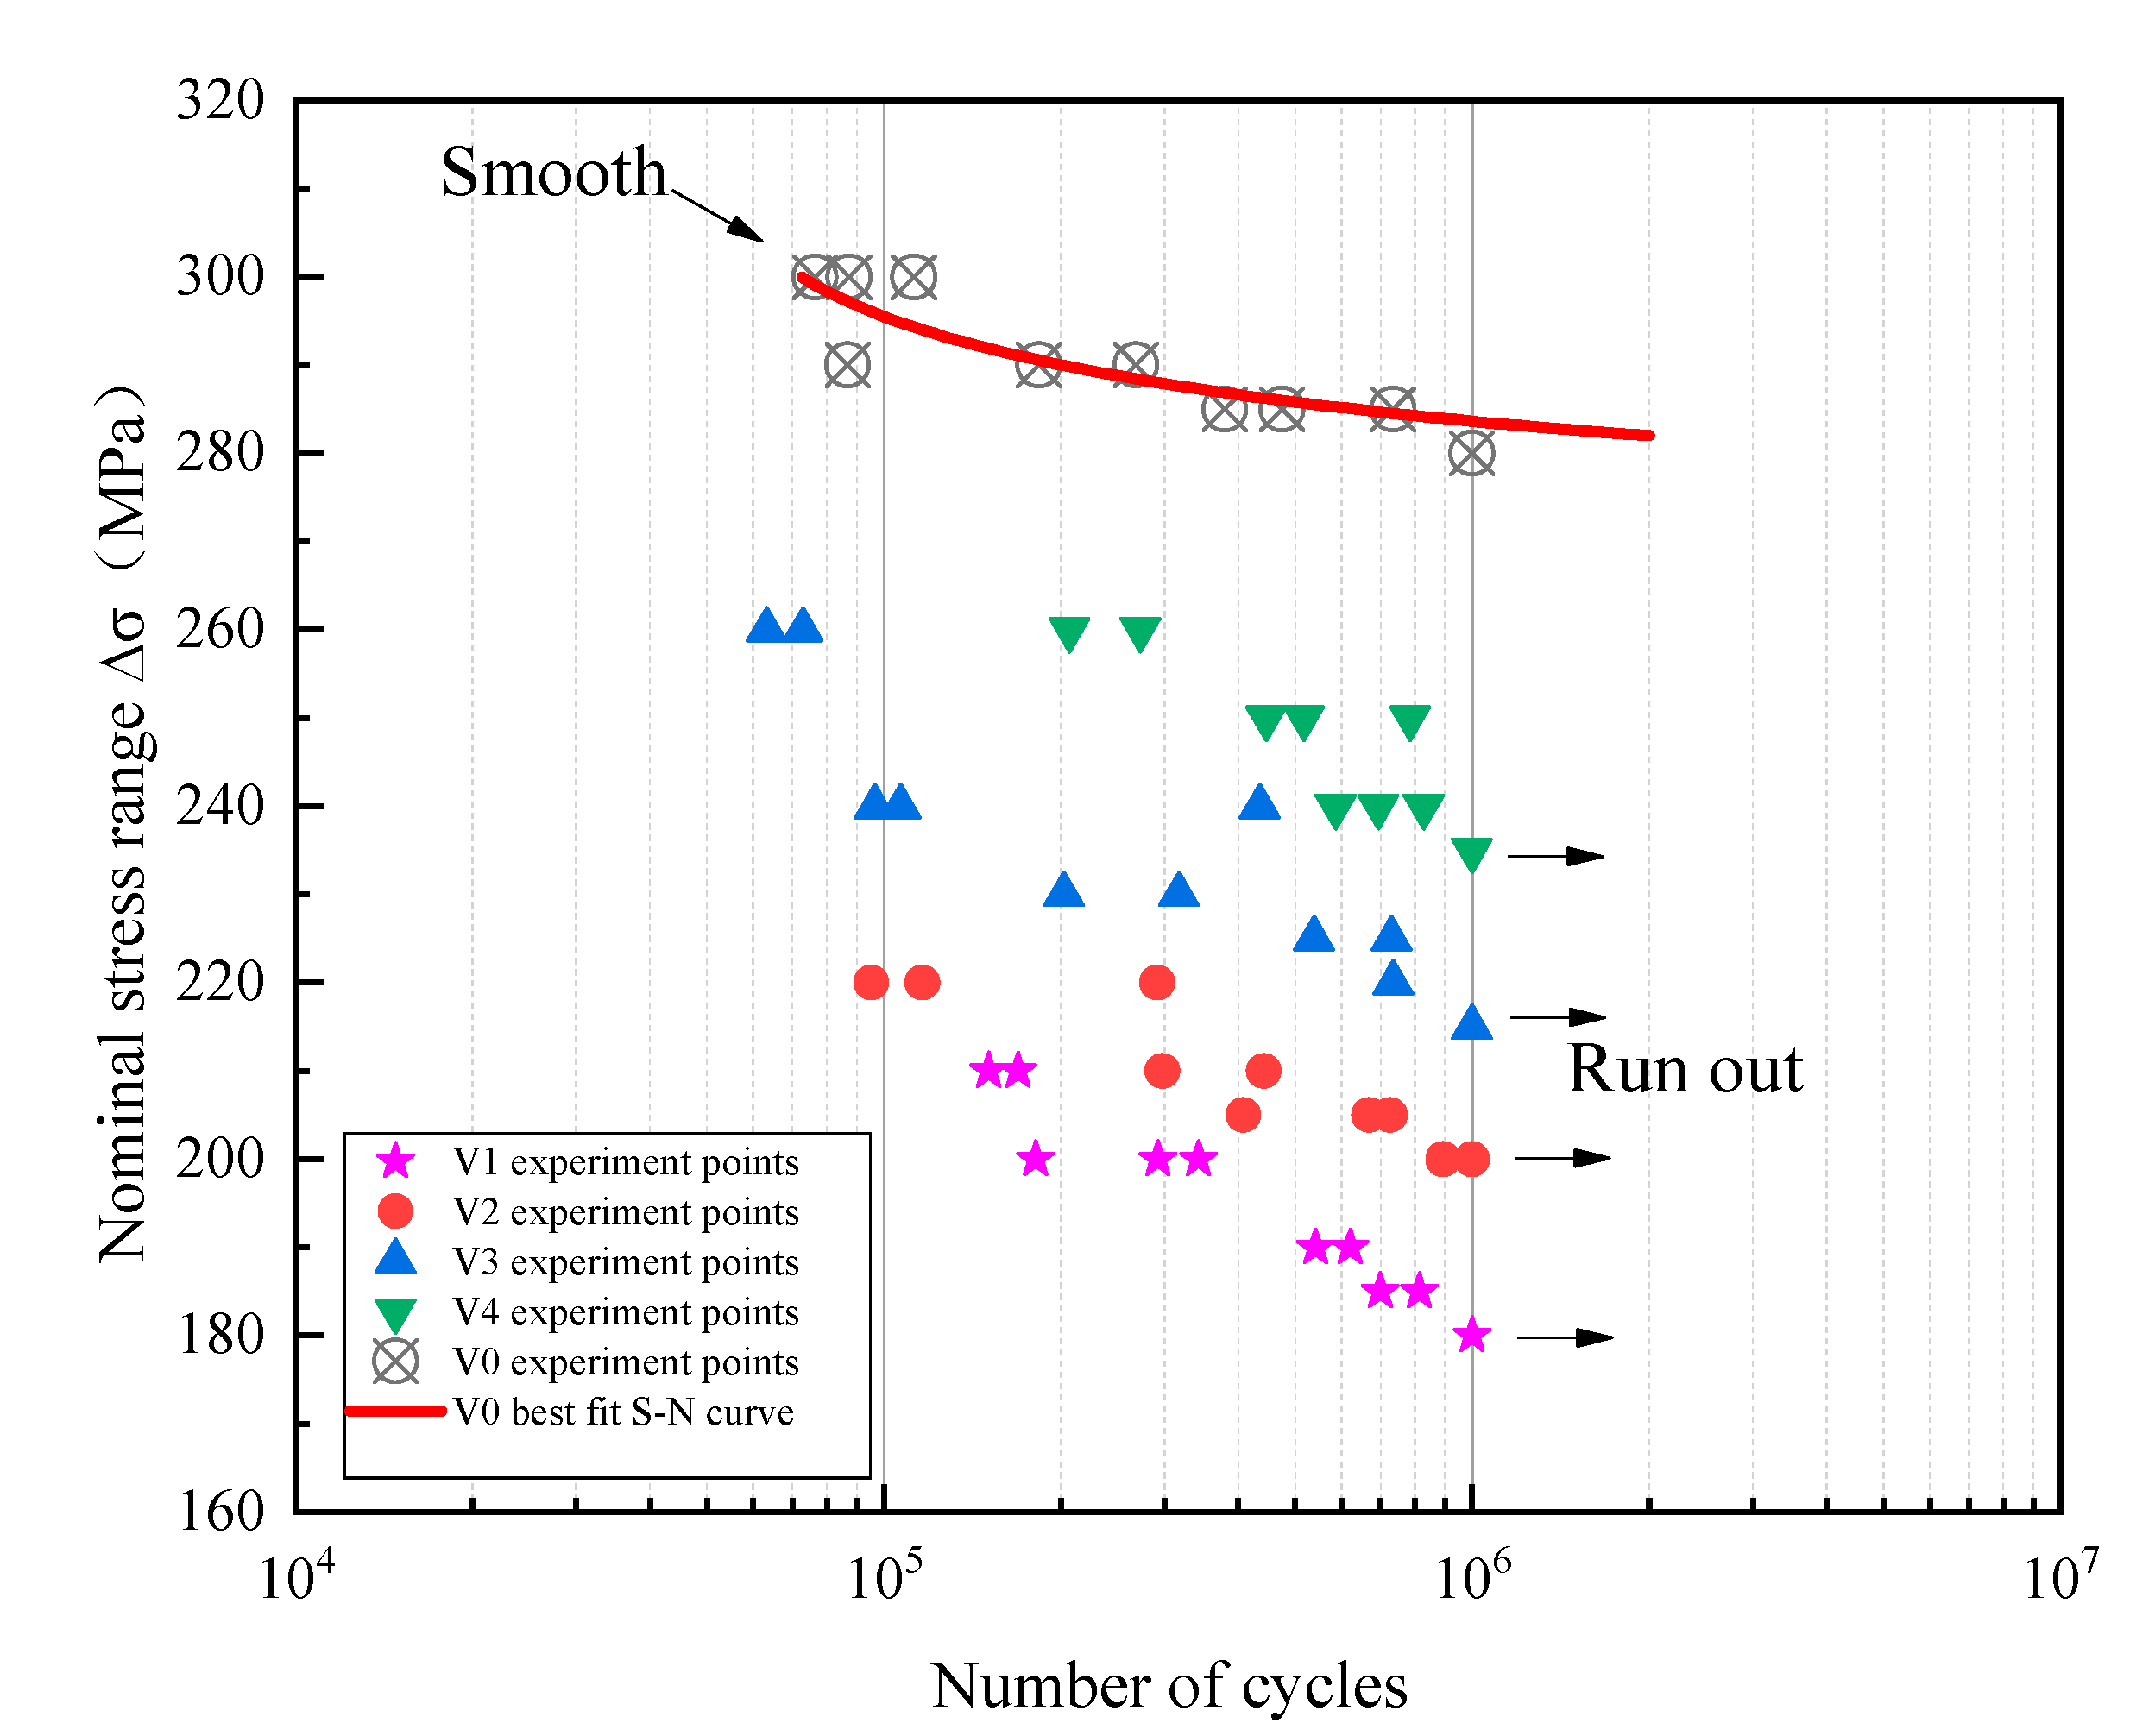
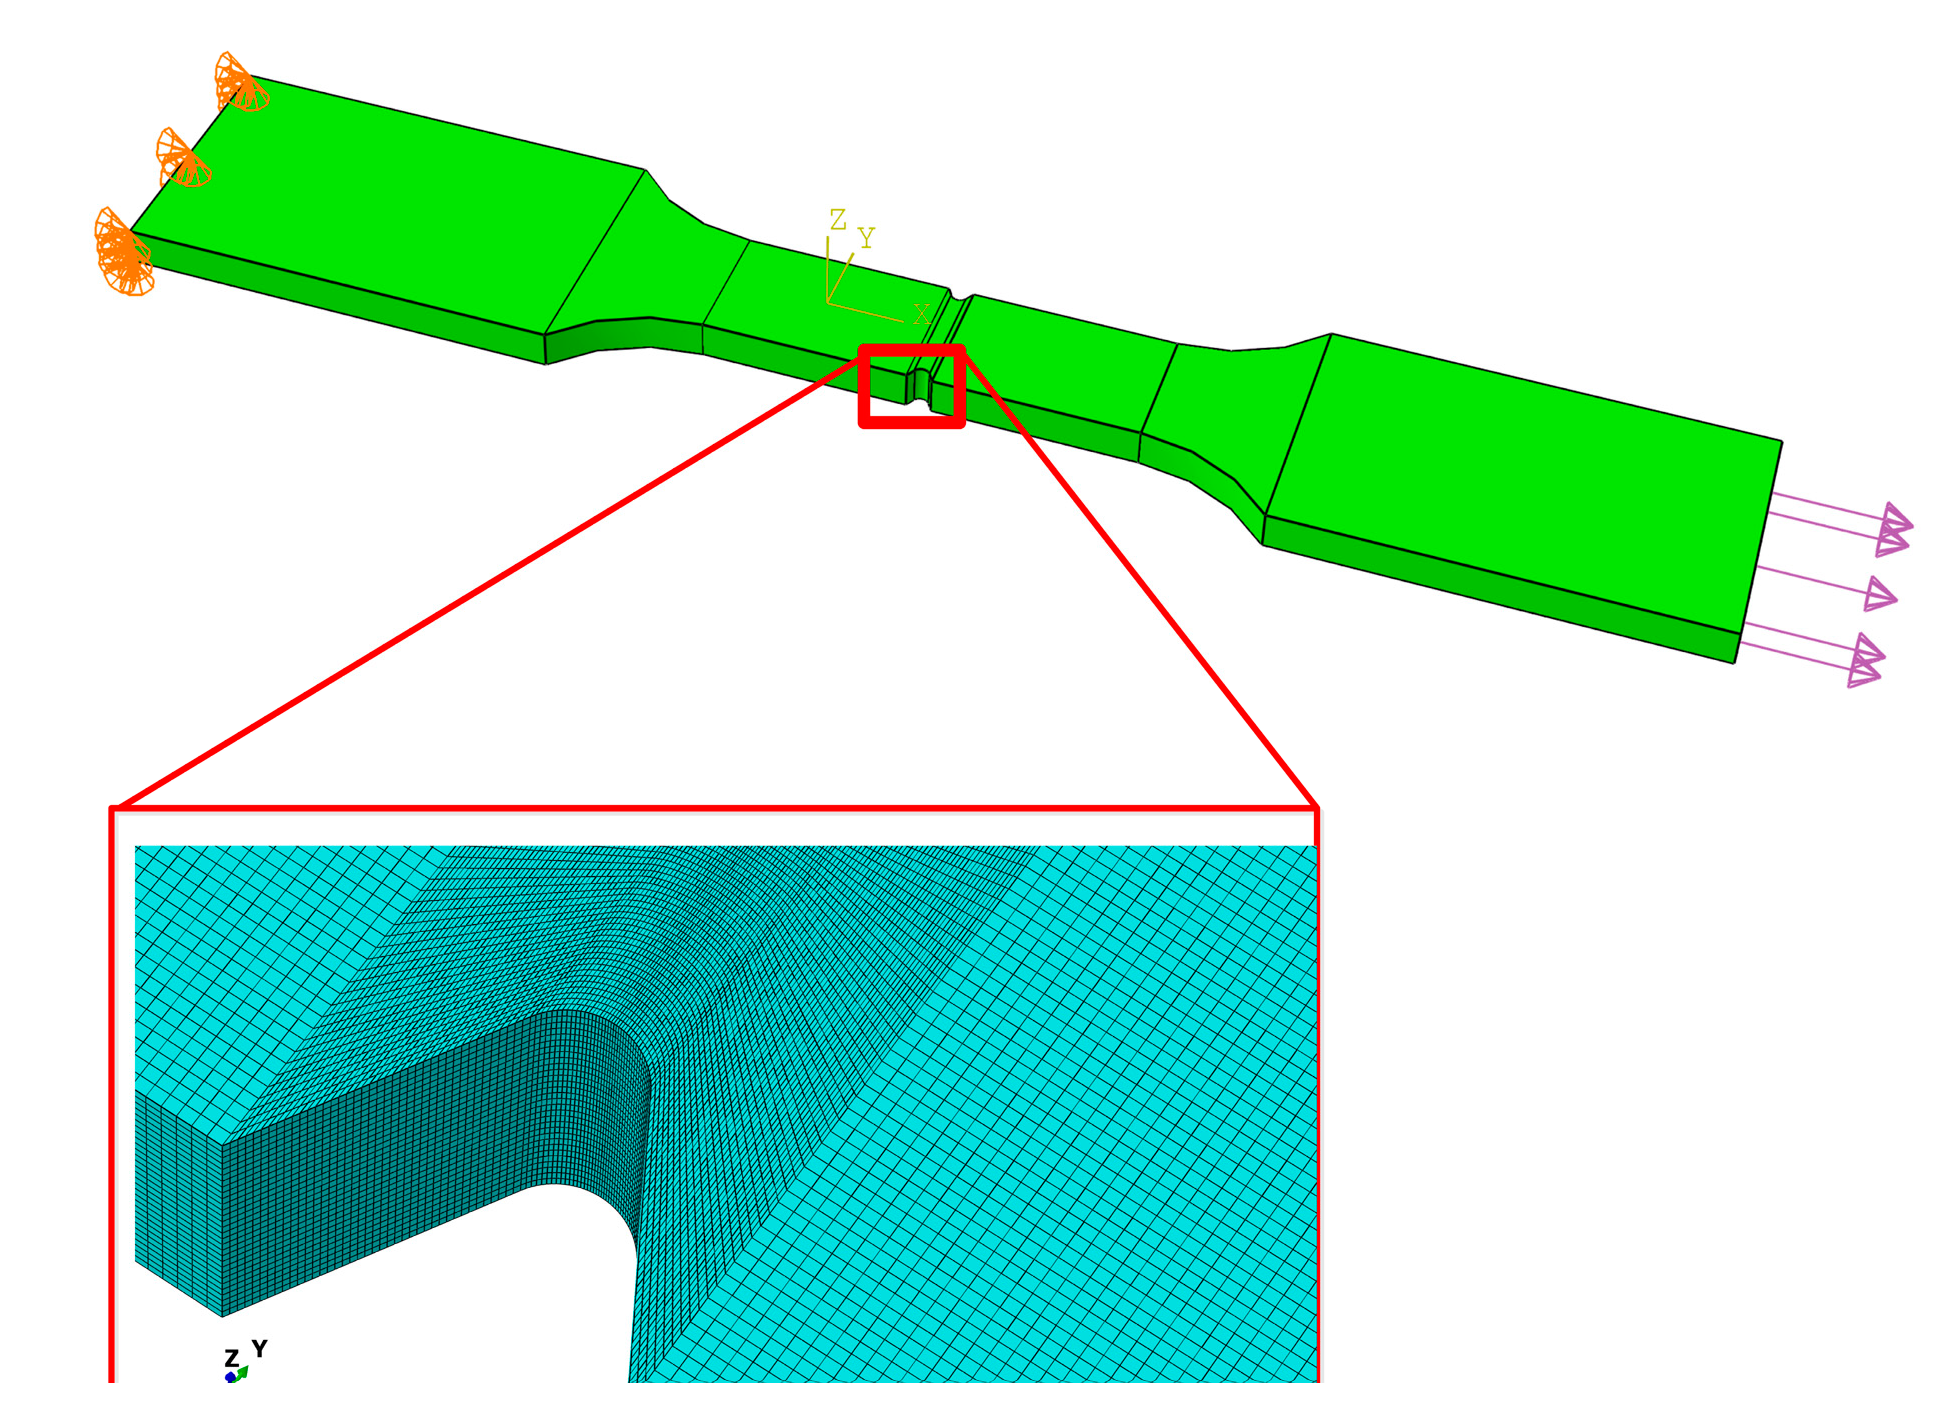
2. Experiment
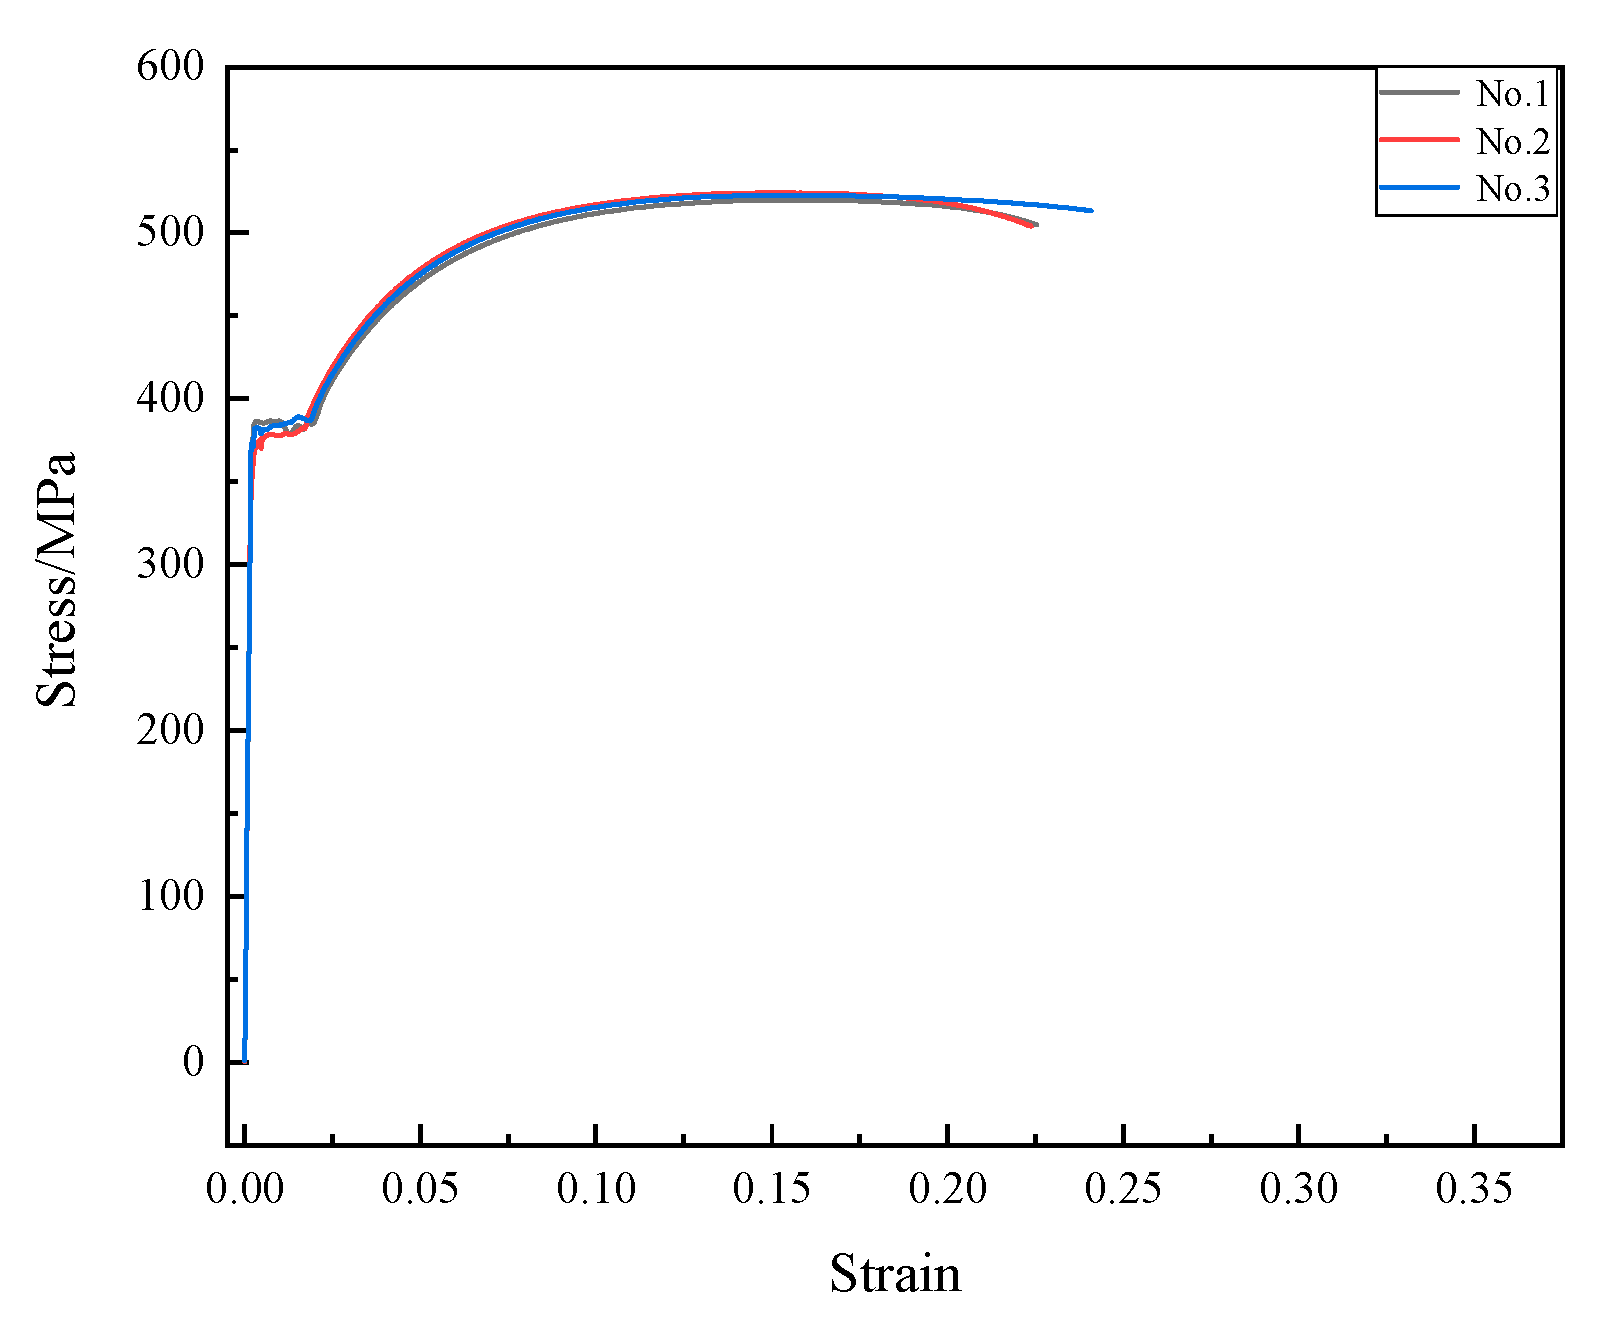
2.1. Material and Specimen
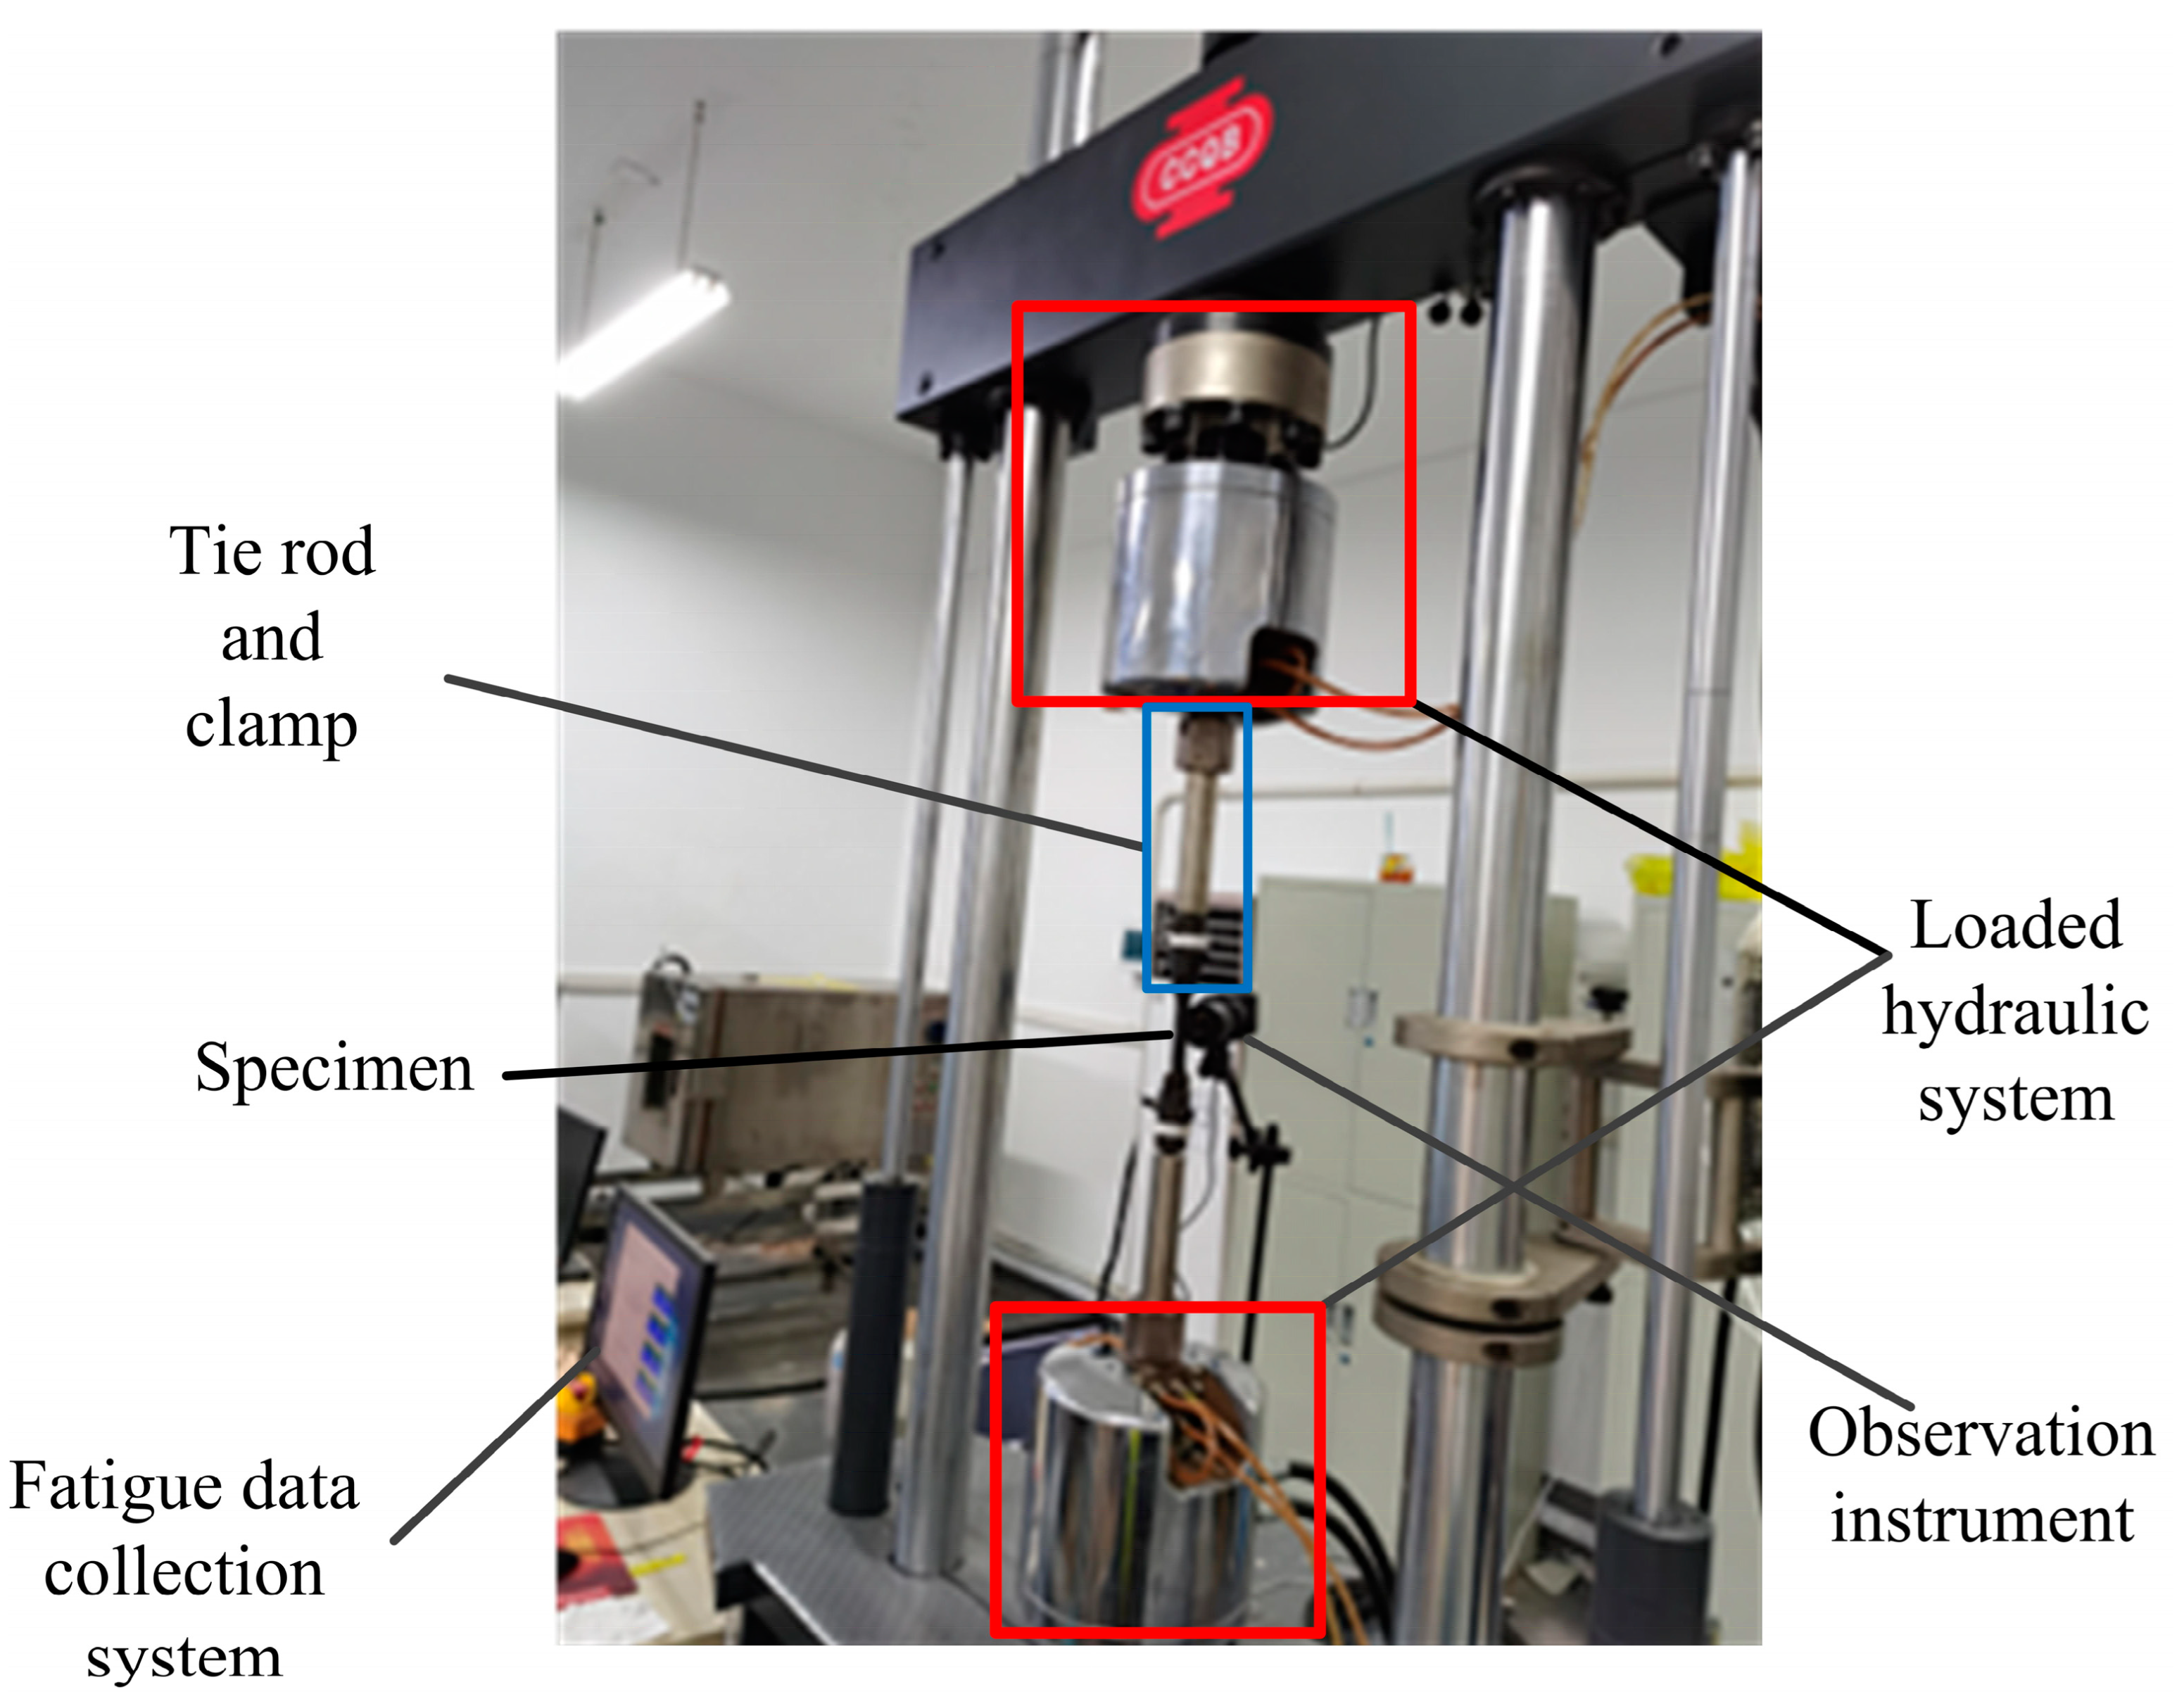
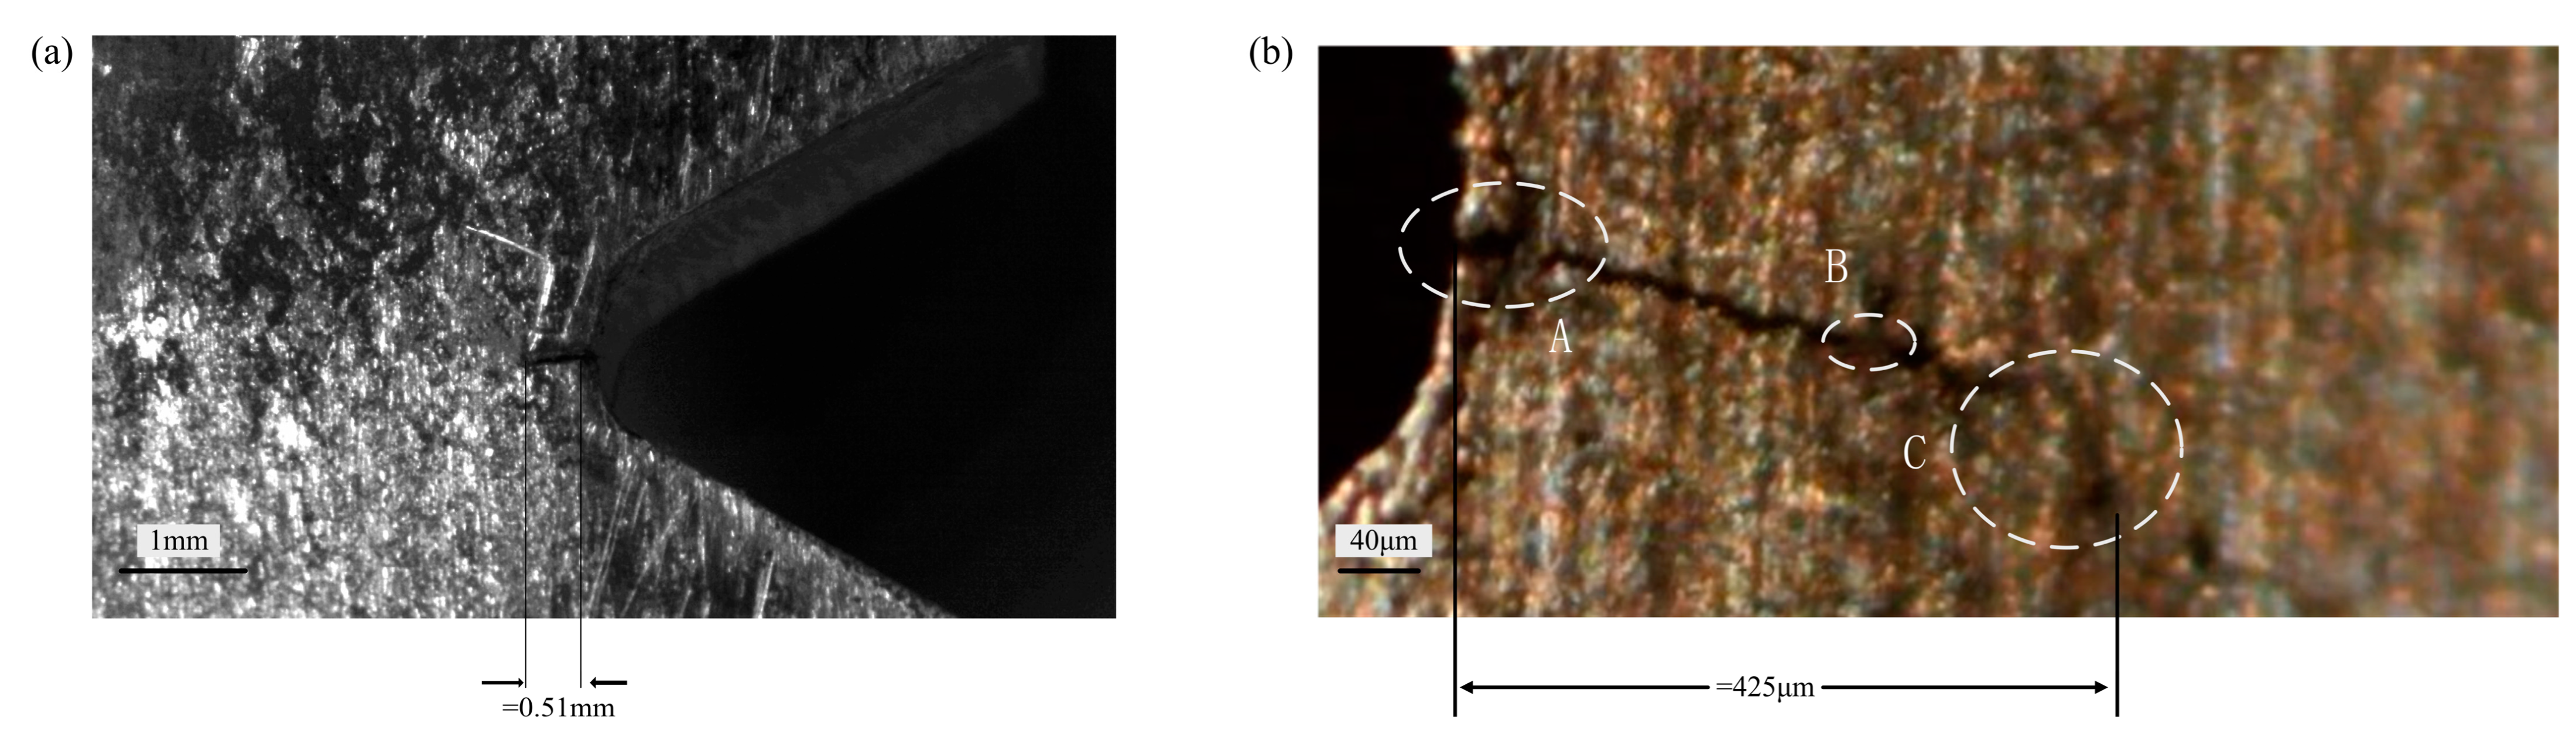
2.2. Fatigue Test Method and Results
3. The Conventional Critical Distance Method
3.1. Theory of Critical Distance (TCD)
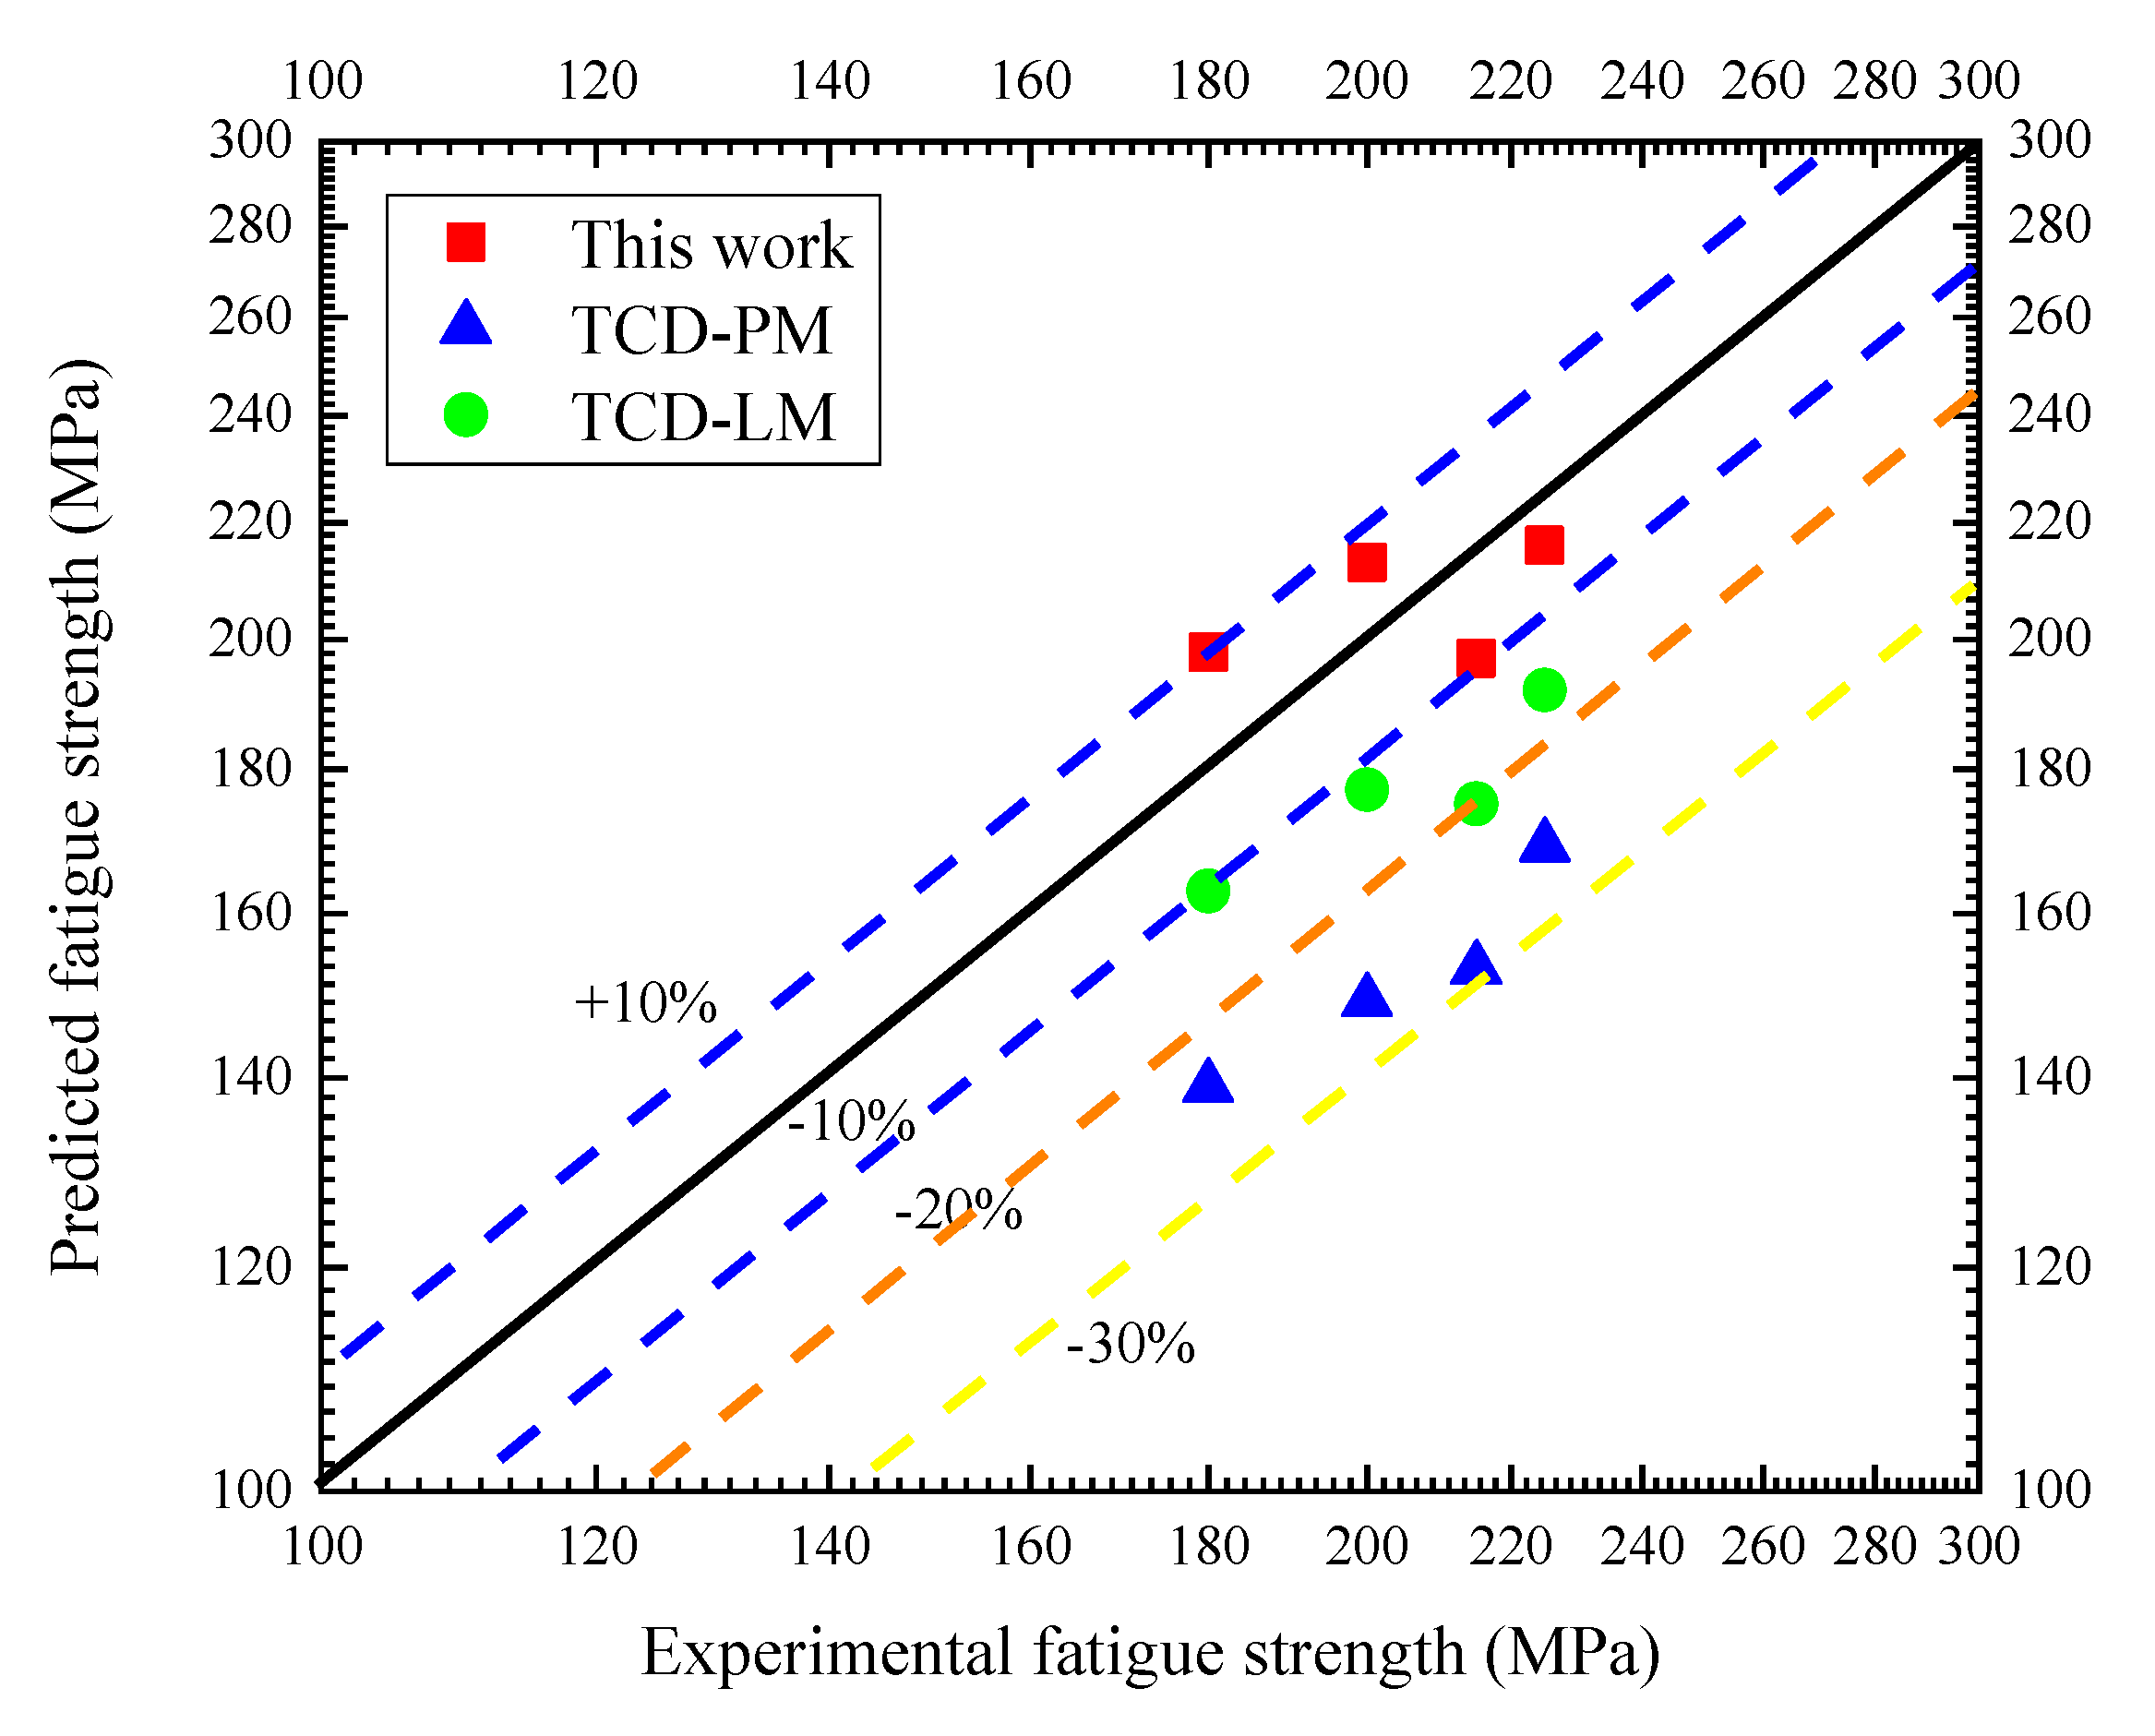
3.2. Predicting Fatigue Strength Using the Conventional TCD
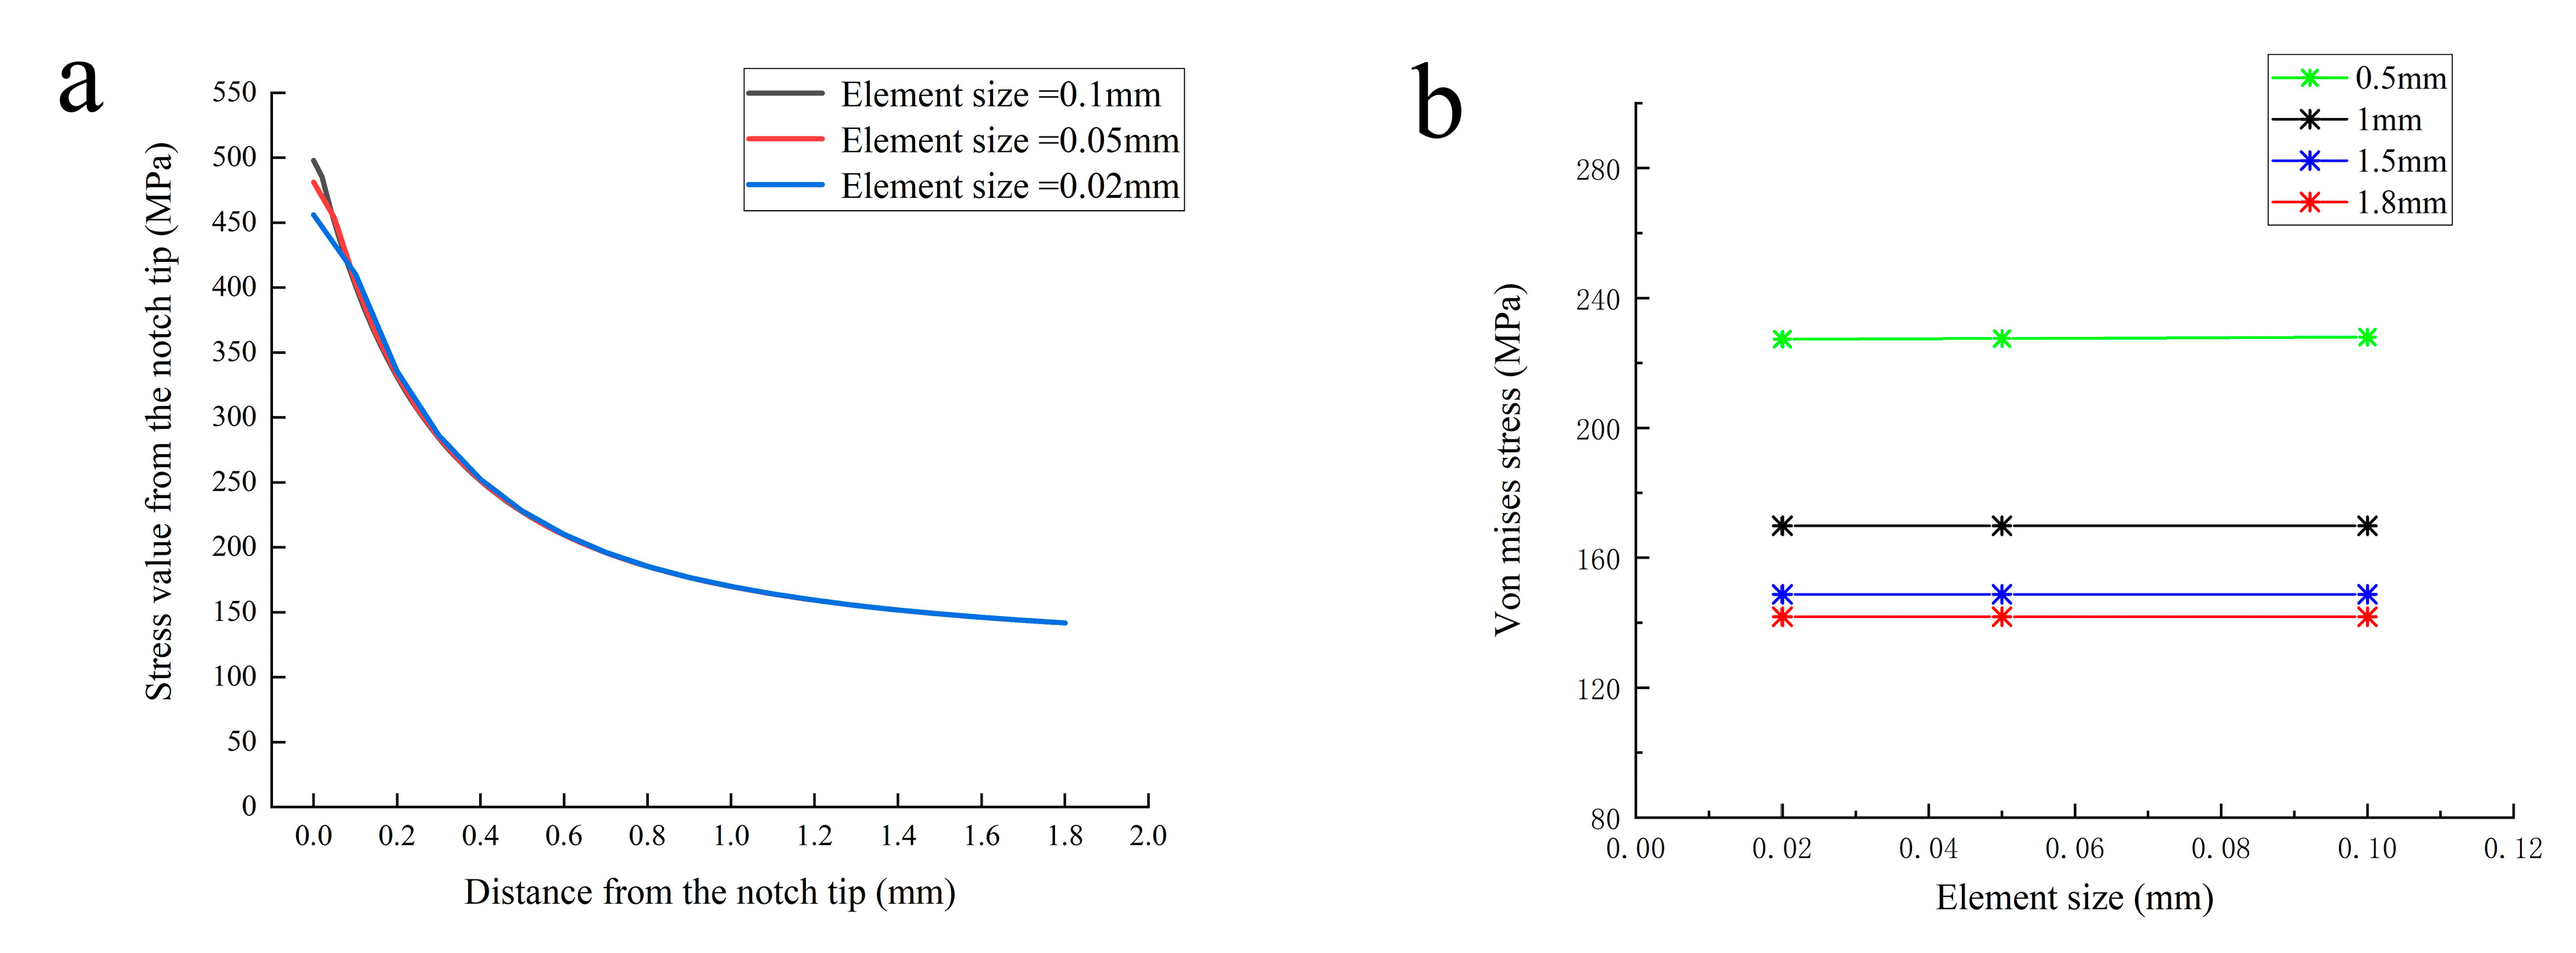
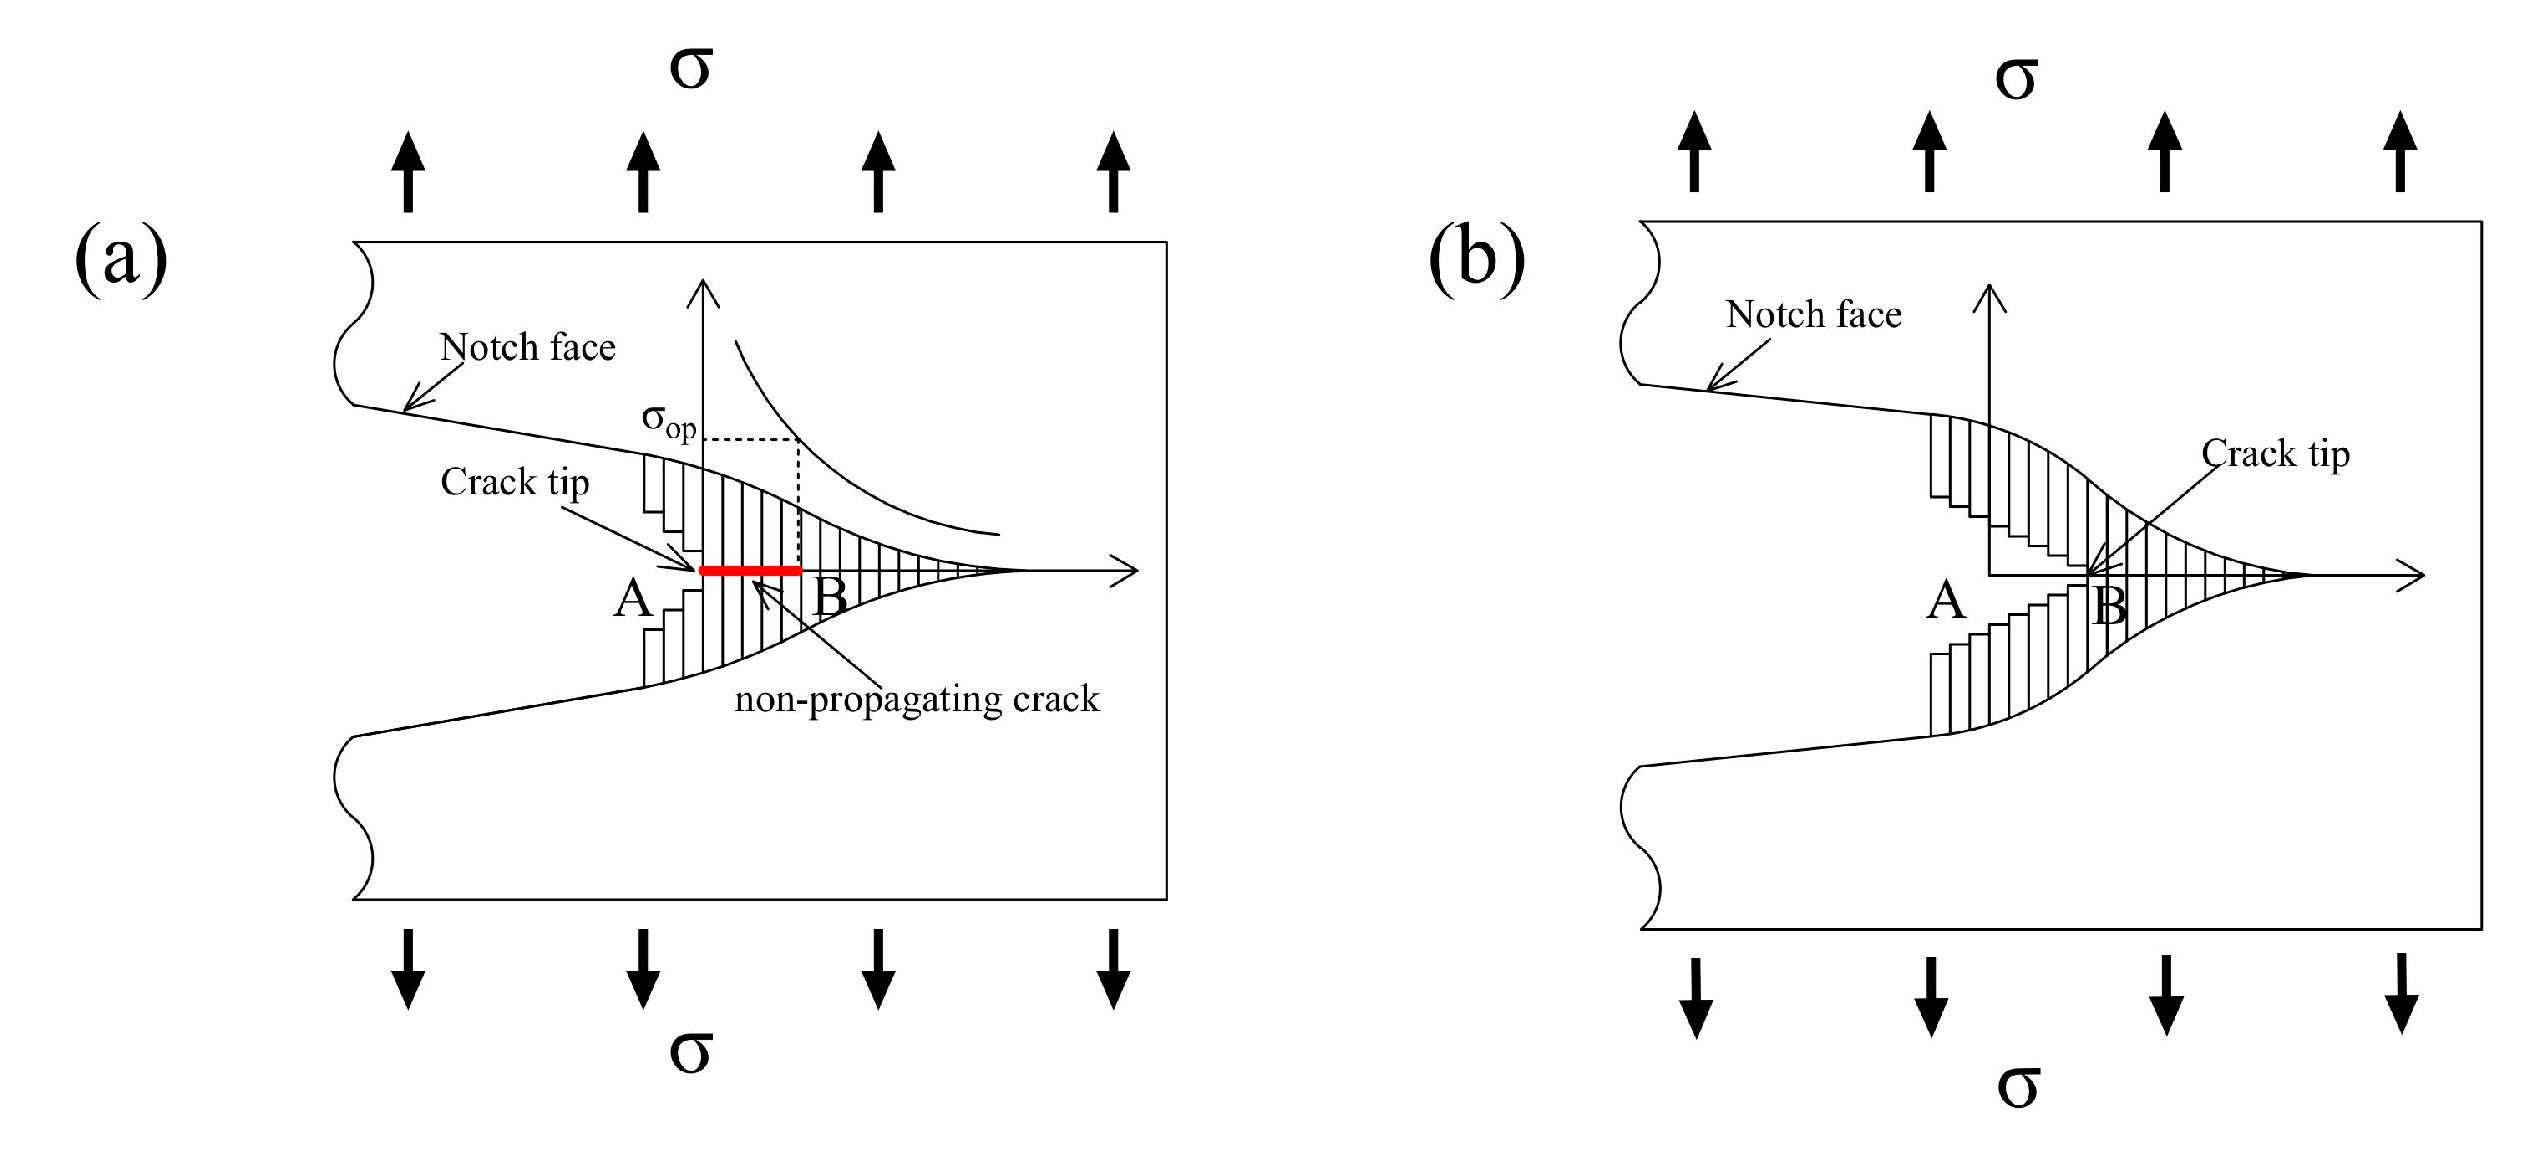
4. Proposed Method for Notch Fatigue Analysis
4.1. Theoretical Background of the Proposed Model
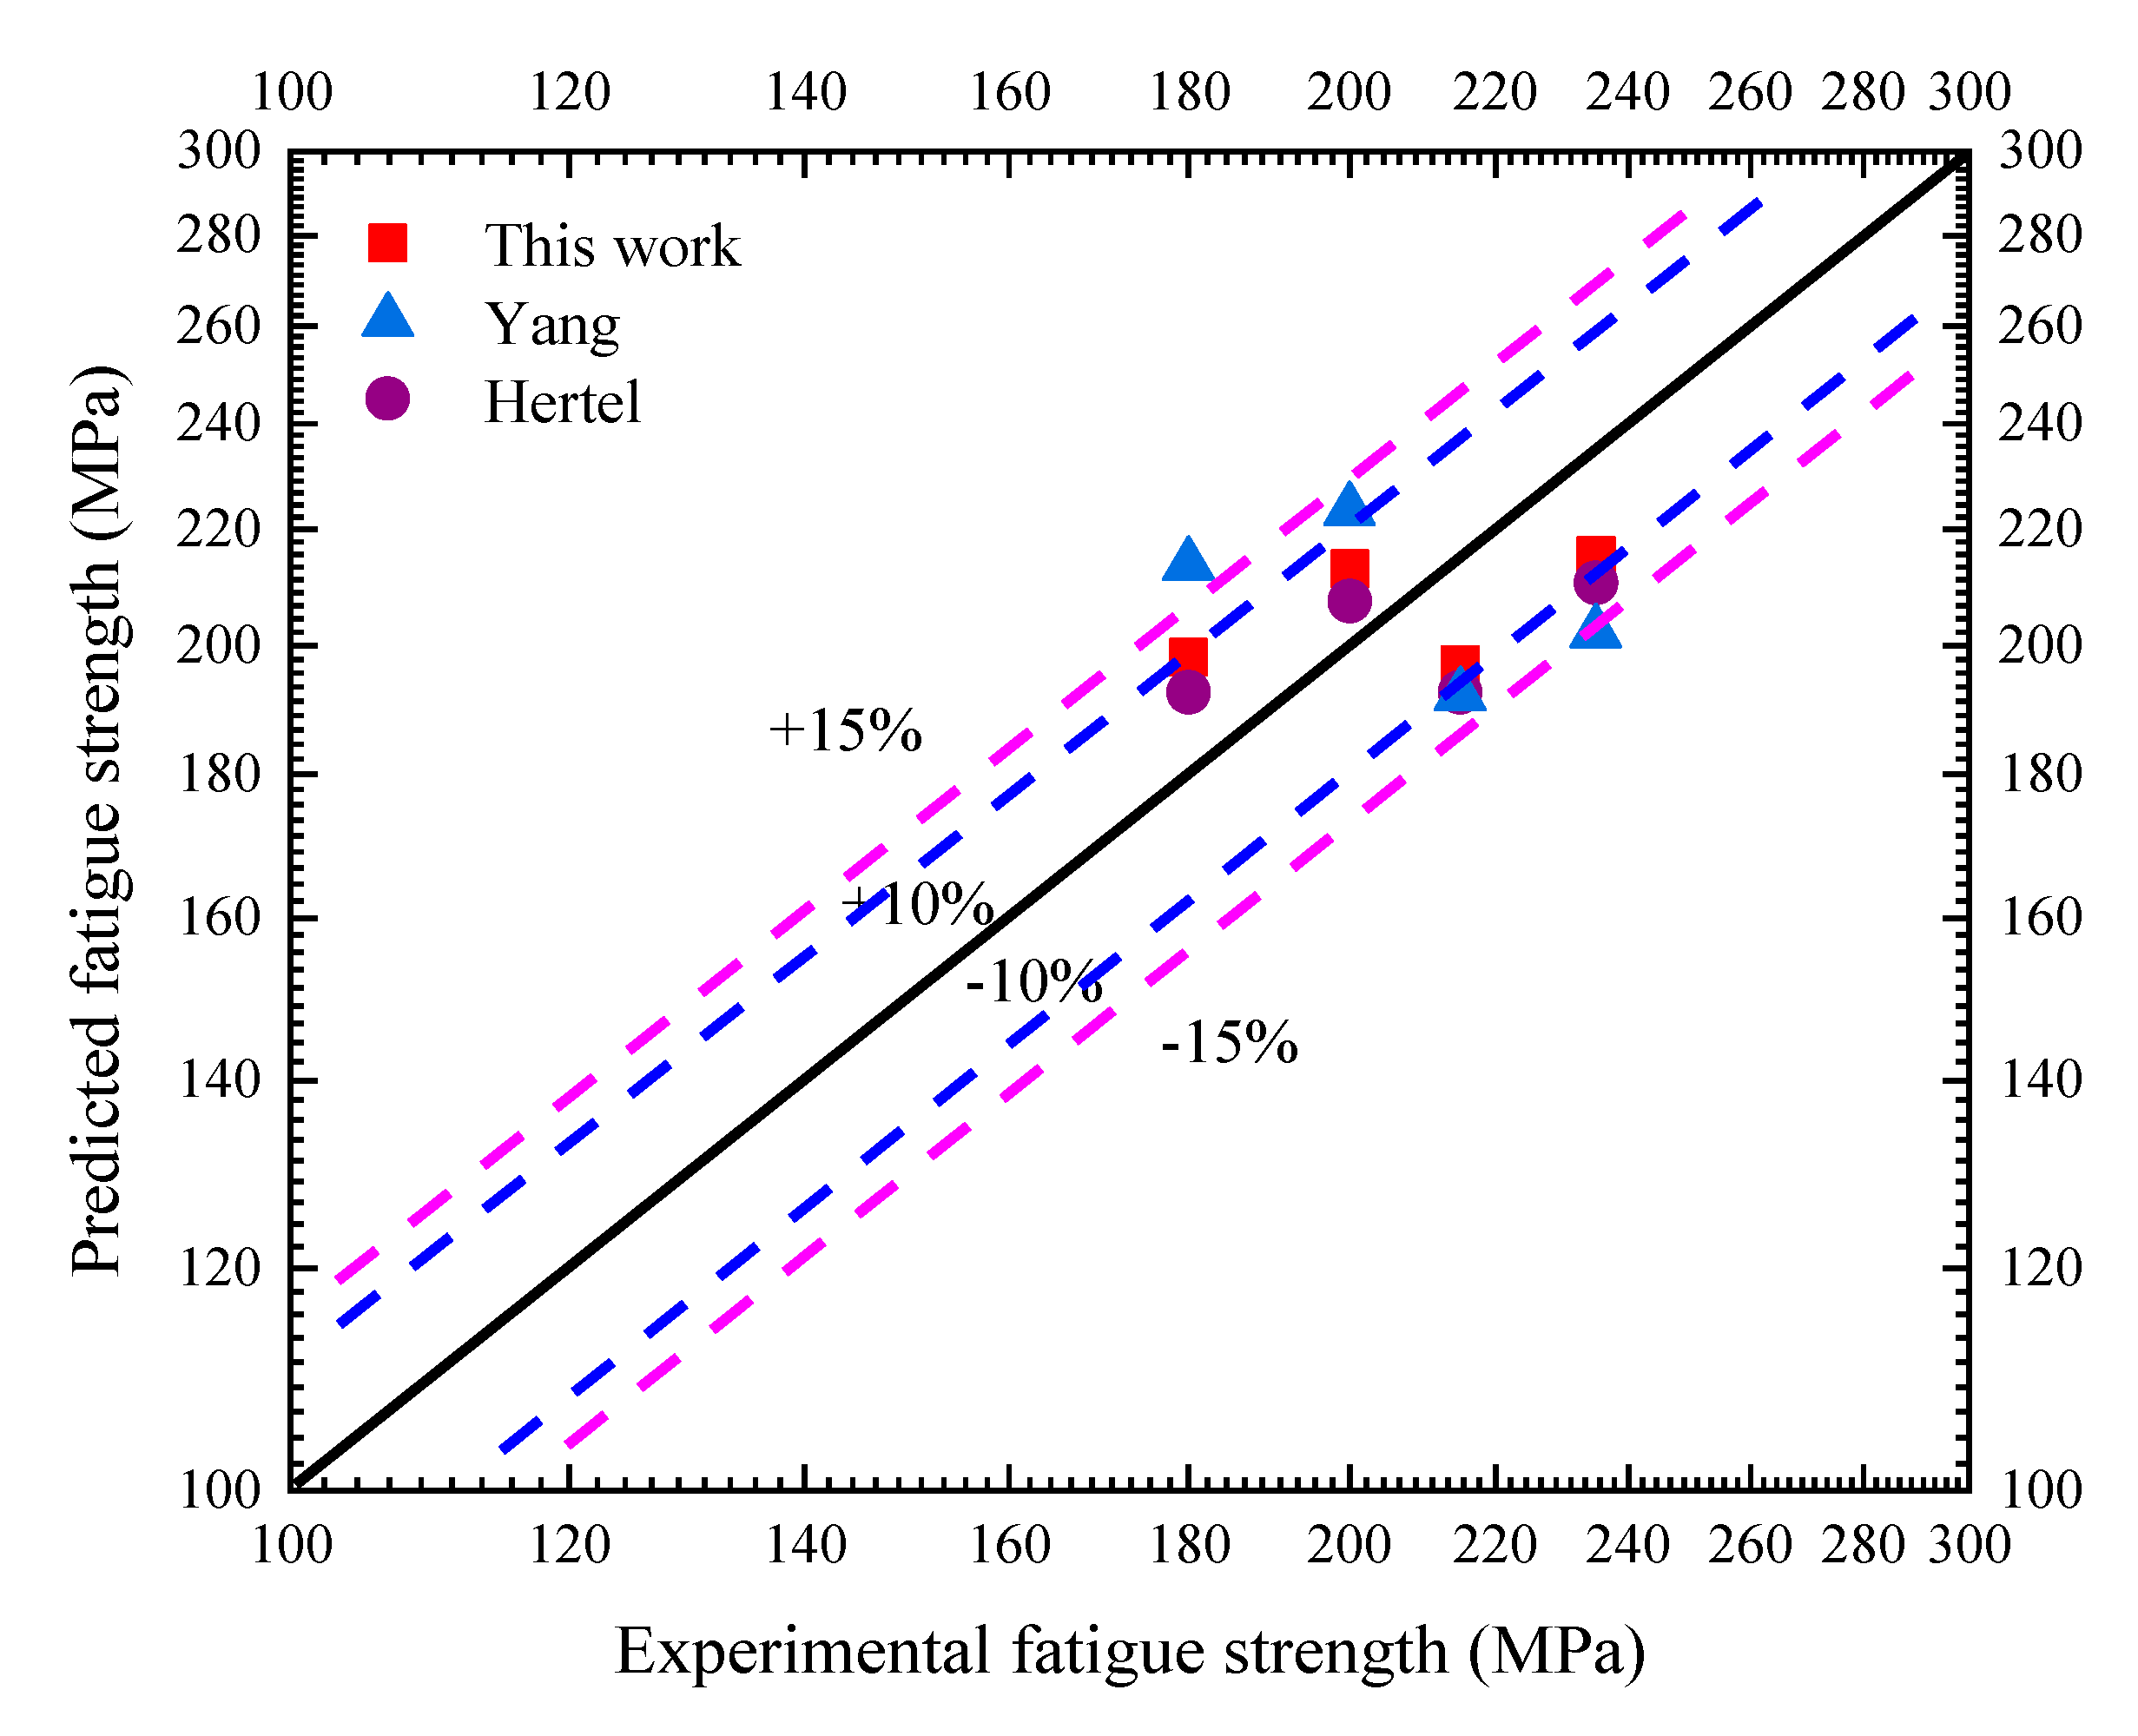
4.2. Model Verification and Analysis
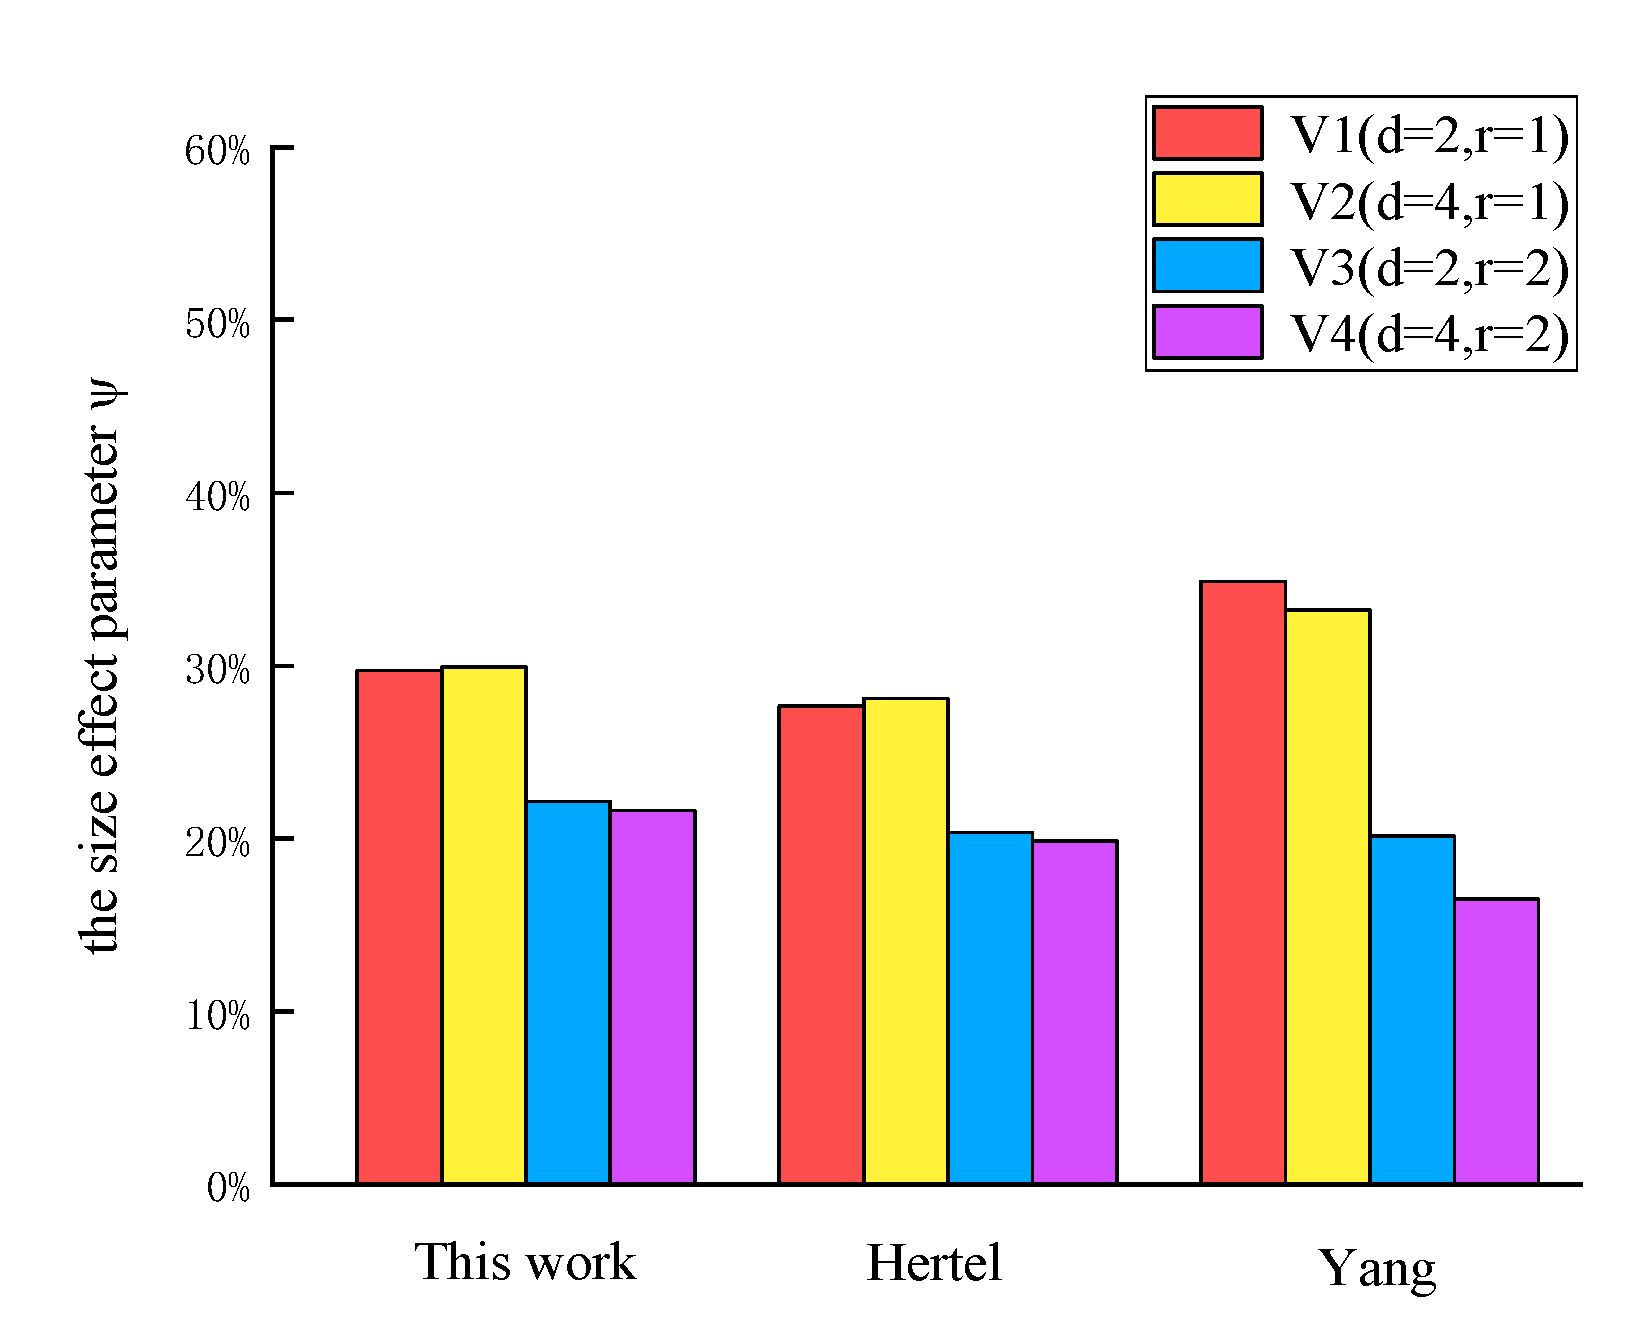
4.3. Size Effect of Critical Distance
4.4. Correlation of Critical Distance Size Effects and Notch Geometry Size
5. Conclusions
- For the fatigue limit of the V-shaped small notch of Q345qD material, the prediction results of the conventional critical distance method are conservative, and the model proposed in the present study is in good agreement with the experimental results.
- The proposed model can provide a reference for dealing with the critical distance size effect, and the recommended model in present study has almost the same prediction accuracy as the published model that considering the critical size effect.
- The influence of the size effect on the fatigue limit is negatively correlated with the root radius, and the notch radius is the main factor in the influence of size effect on the fatigue limit.
Author Contributions
Funding
Data Availability Statement
Conflicts of Interest
References
- Taylor, D.; O’Donnell, M. Notch geometry effects in fatigue: A conservative design approach. Eng. Fail. Anal. 1994, 1, 275–287. [Google Scholar] [CrossRef]
- Papadopoulos, I.V.; Panoskaltsis, V.P. Invariant formulation of a gradient dependent multiaxial high-cycle fatigue criterion. Eng. Fract. Mech. 1996, 55, 513–528. [Google Scholar] [CrossRef]
- Neuber, H. Theory of Notch Stresses; Springer: Berlin/Heidelberg, Germany, 1958. [Google Scholar]
- Lewandowski, J.; Rozumek, D. Fatigue Crack Growth in Welded S355 Samples Subjected to Bending Loading. Metals 2021, 11, 1394. [Google Scholar] [CrossRef]
- Rozumek, D.; Marciniak, Z. Fatigue properties of notched specimens made of FeP04 steel. Mater. Sci. 2012, 47, 462–469. [Google Scholar] [CrossRef] [Green Version]
- Araújo, J.; Susmel, L.; Pires, M.; Castro, F. A multiaxial stress-based critical distance methodology to estimate fretting fatigue life. Tribol. Int. 2017, 108, 2–6. [Google Scholar] [CrossRef]
- Ronchei, C.; Vantadori, S. Notch fatigue life estimation of Ti-6Al-4V. Eng. Fail. Anal. 2021, 120, 105098. [Google Scholar] [CrossRef]
- Shen, J.; Fan, H.; Zhang, G.; Pan, R.; Wang, J.; Huang, Z. Influence of the stress gradient at the notch on the critical distance and life prediction in HCF and VHCF. Int. J. Fatigue 2022, 162. [Google Scholar] [CrossRef]
- Pereira, J.; de Jesus, A.; Xavier, J.; Correia, J.; Susmel, L.; Fernandes, A. Low and ultra-low-cycle fatigue behavior of X52 piping steel based on theory of critical distances. Int. J. Fatigue 2020, 134, 105482. [Google Scholar] [CrossRef]
- Sun, S.-S.; Yu, X.-L.; Chen, X.-P.; Liu, Z.-T. Component structural equivalent research based on different failure strength criterions and the theory of critical distance. Eng. Fail. Anal. 2016, 70, 31–43. [Google Scholar] [CrossRef]
- Zhu, S.-P.; He, J.-C.; Liao, D.; Wang, Q.; Liu, Y. The effect of notch size on critical distance and fatigue life predictions. Mater. Des. 2020, 196, 109095. [Google Scholar] [CrossRef]
- Pinto, A.; Talemi, R.; Araújo, J. Fretting fatigue total life assessment including wear and a varying critical distance. Int. J. Fatigue 2022, 156, 106589. [Google Scholar] [CrossRef]
- Taylor, D. Geometrical effects in fatigue: A unifying theoretical model. Int. J. Fatigue 1999, 21, 413–420. [Google Scholar] [CrossRef]
- Taylor, D.; Wang, G. The validation of some methods of notch fatigue analysis. Fatigue Fract. Eng. Mater. Struct. 2000, 23, 387–394. [Google Scholar] [CrossRef]
- Taylor, D.; Barrett, N.; Lucano, G. Some new methods for predicting fatigue in welded joints. Int. J. Fatigue 2002, 24, 509–518. [Google Scholar] [CrossRef]
- Peterson, R.E. Notch Sensitivity; Sines, G., Waisman, J.L., Eds.; Metal Fatigue, McGraw-Hill: New York, NY, USA, 1959. [Google Scholar]
- Lanning, D.B.; Nicholas, T.; Haritos, G.K. On the use of critical distance theories for the prediction of the high cycle fatigue limit stress in notched Ti–6Al–4V. Int. J. Fatigue 2005, 27, 45–57. [Google Scholar] [CrossRef]
- Lanning, D.B.; Nicholas, T.; Palazotto, A. The effect of notch geometry on critical distance high cycle fatigue predictions. Int. J. Fatigue 2005, 27, 1623–1627. [Google Scholar] [CrossRef]
- Yamashita, Y.; Ueda, Y.; Kuroki, H.; Shinozaki, M. Fatigue life prediction of small notched Ti–6Al–4V specimens using critical distance. Eng. Fract. Mech. 2010, 77, 1439–1453. [Google Scholar] [CrossRef]
- Wang, J.; Yang, X. HCF strength estimation of notched Ti–6Al–4V specimens considering the critical distance size effect. Int. J. Fatigue 2012, 40, 97–104. [Google Scholar] [CrossRef]
- Hertel, O.; Vormwald, M. Statistical and geometrical size effects in notched members based on weakest-link and short-crack modelling. Eng. Fract. Mech. 2012, 95, 72–83. [Google Scholar] [CrossRef]
- Wang, R.; Li, D.; Hu, D.; Meng, F.; Liu, H.; Ma, Q. A combined critical distance and highly-stressed-volume model to evaluate the statistical size effect of the stress concentrator on low cycle fatigue of TA19 plate. Int. J. Fatigue 2017, 95, 8–17. [Google Scholar] [CrossRef]
- Li, C.; Xie, L.; Xie, Y.; Liu, S.; Mu, T.; Xu, X. Calculation of characteristic size and fatigue life of structural members with blunt notches. Eng. Fract. Mech. 2020, 239, 107310. [Google Scholar] [CrossRef]
- Sun, S.S.; Wan, S.M.; Wang, H.; Zhang, Y.; Xu, X.M. Study of component high cycle bending fatigue based on a new critical distance approach. Eng. Fail. Anal. 2019, 102, 395–406. [Google Scholar]
- Takahashi, Y.; Yoshitake, H.; Nakamichi, R.; Wada, T.; Takuma, M.; Shikama, T.; Noguchi, H. Fatigue limit investigation of 6061-T6 aluminum alloy in giga-cycle regime. Mater. Sci. Eng. A 2014, 614, 243–249. [Google Scholar] [CrossRef]
- Verdu, C.; Adrien, J.; Buffière, J. Three-dimensional shape of the early stages of fatigue cracks nucleated in nodular cast iron. Mater. Sci. Eng. A 2008, 483–484, 402–405. [Google Scholar] [CrossRef]
- Limodin, N.; Verreman, Y. Fatigue strength improvement of a 4140 steel by gas nitriding: Influence of notch severity. Mater. Sci. Eng. A 2006, 435–436, 460–467. [Google Scholar] [CrossRef]
- Miller, K.J. The two thresholds of fatigue behavior. Fatigue Fract. Eng. Mater. Struct. 1993, 16, 931–939. [Google Scholar] [CrossRef]
- Madia, M.; Schork, B.; Bernhard, J.; Kaffenberger, M. Multiple crack initiation and propagation in weldments under fatigue loading. Procedia Struct. Integr. 2017, 7, 423–430. [Google Scholar] [CrossRef]
- Lukas, P.; Kunz, L.; Weiss, B.; Stickler, R. Non-damaging notches in fatigue. Fatigue Fract. Eng. Mater. Struct. 1986, 9, 195–204. [Google Scholar] [CrossRef]
- Marrow, T.; Cetinel, H. Short fatigue cracks in austempered ductile cast iron (ADI). Fatigue Fract. Eng. Mater. Struct. 2000, 23, 425–434. [Google Scholar] [CrossRef]
- Frost, N.E. Non-Propagating Cracks in Vee- Notched Specimens Subject to Fatigue Loading. Aeronaut. Q. 1957, 8, 1–20. [Google Scholar] [CrossRef]
- Murakami, Y. Metal Fatigue: Effects of Small Defects and Nonmetallic Inclusions; Elsevier: Amsterdam, The Netherlands, 2002. [Google Scholar]
- Miller, K.J. The short crack problem. Fatigue Eng. Mater. Struct. 1982, 5, 223–232. [Google Scholar] [CrossRef]
- Miller, K.J. Materials science perspective of metal fatigue resistance. Mater. Sci. Technol. 1993, 9, 453–462. [Google Scholar] [CrossRef]
- Asai, K. Experimental validation of a fracture-mechanics model for evaluating fretting-fatigue strength by focusing on non-propagating cracks. Tribol. Int. 2014, 76, 14–22. [Google Scholar] [CrossRef]
- Molokov, K.; Domashevskaia, Y. Estimation of Endurance Limits of Welded Joints by the Criterion of Non-propagating Cracks. Procedia Eng. 2017, 206, 479–486. [Google Scholar] [CrossRef]
- Steimbreger, C.; Chapetti, M.D. Fatigue strength assessment of butt-welded joints with undercuts. Int. J. Fatigue 2017, 105, 296–304. [Google Scholar] [CrossRef]
- Susmel, L.; Taylor, D. Non-propagating cracks and high-cycle fatigue failures in sharply notched specimens under in-phase Mode I and II loading. Eng. Fail. Anal. 2007, 14, 861–876. [Google Scholar] [CrossRef]
- Noda, N.A.; Sera, M.; Takase, Y. Stress concentration factors for round and flat test specimens with notches. Int. J. Fatigue 1995, 17, 163–178. [Google Scholar] [CrossRef]
- Zong, L.; Shi, G.; Wang, Y. Experimental investigation on fatigue crack behavior of bridge steel Q345qD base metal and butt weld. Mater. Des. 2015, 66, 196–208. [Google Scholar] [CrossRef]
- Habib, K.; Koyama, M.; Tsuchiyama, T.; Noguchi, H. Fatigue crack non-propagation assisted by nitrogen-enhanced dislocation planarity in austenitic stainless steels. Int. J. Fatigue 2017, 104, 158–170. [Google Scholar] [CrossRef]
- Fukumura, N.; Suzuki, T.; Hamada, S.; Tsuzaki, K.; Noguchi, H. Mechanical examination of crack length dependency and material dependency on threshold stress intensity factor range with dugdale model. Eng. Fract. Mech. 2015, 135, 168–186. [Google Scholar] [CrossRef]
- Elber, W. The significance of fatigue crack closure. Damage Tolerance in Aircraft Structures; ASTM STP: West Conshohocken, PA, USA, 1971; Volume 486, pp. 230–242. [Google Scholar]
- Maierhofer, J.; Gänser, H.-P.; Pippan, R. Modified Kitagawa–Takahashi diagram accounting for finite notch depths. Int. J. Fatigue 2015, 70, 503–509. [Google Scholar] [CrossRef]
- Zerbst, U.; Vormwald, M.; Pippan, R.; Gänser, H.P.; Baudoux, C.S.; Madia, M. About the fatigue crack propagating threshold of metals as a design criterion. Eng. Fract. Mech. 2016, 153, 190–243. [Google Scholar] [CrossRef]
- Jason, C.T.; Frederick, V.; Lawrence, J. A crack closure model for predicting the threshold stresses of notches. Fatigue Fract. Eng. Mater. Struct. 1993, 16, 93–114. [Google Scholar]
- ASTM E647-15e1; Standard Test Method for Measurement of Fatigue Crack Growth Rates. ASTM International: West Con-shohocken, PA, USA, 2015.
- Tubei, V.; Toda, H.; Hassanipour, M.; Hirayama, K.; Takakuwa, O.; Takeuchi, A.; Uesugi, M. 3D short fatigue crack closure be-havior in Ti–6Al–4V alloy investigated using in-situ high resolution synchrotron X-ray tomography. Eng. Fract. Mech. 2021, 249, 107755. [Google Scholar] [CrossRef]
- Bantounas, I.; Dye, D.; Lindley, T.C. The effect of grain orientation on fracture morphology during high-cycle fatigue of Ti–6Al–4V. Acta Mater. 2009, 57, 3584–3595. [Google Scholar] [CrossRef] [Green Version]
- Hassanipour, M.; Watanabe, S.; Hirayama, K.; Li, H.; Toda, H.; Uesugi, K.; Takeuchi, A. Assessment of predominant micro-structural features controlling 3D short crack growth behavior via a surrogate approach in Ti–6Al–4V. Mater. Sci. Eng. A 2019, 751, 351–362. [Google Scholar] [CrossRef]
- Li, B.; Jiang, C.; Noguchi, H.; Liu, L. Revealing the mechanism of critical root radius in notch fatigue limit based on crack closure concept. Int. J. Fatigue 2020, 130, 105261. [Google Scholar] [CrossRef]


| Specimen No. | Type | Notch Depth (mm) | Root Radius (mm) |
|---|---|---|---|
| V0 | smooth | 0 | ∞ |
| V1 | notch | 2 | 1 |
| V2 | notch | 4 | 1 |
| V3 | notch | 2 | 2 |
| V4 | notch | 4 | 2 |
| NO. | V1 | V2 | V3 | V4 |
|---|---|---|---|---|
| Kt-FEA | 2.91 | 2.64 | 2.26 | 1.99 |
| Kt-Noda [40] | 2.92 | 2.64 | 2.23 | 1.98 |
| Deviation | −0.3% | 0% | 1.3% | 0.5% |
| Specimen No. | Experimental Value (MPa) | PM (MPa) | Deviation | LM (MPa) | Deviation |
|---|---|---|---|---|---|
| V1 | 180 | 139 | −22.65% | 163 | −9.45% |
| V2 | 200 | 149 | −25.38% | 177 | −11.70% |
| V3 | 215 | 153 | −28.84% | 175 | −18.60% |
| V4 | 235 | 169 | −28.18% | 192 | −18.14% |
| Specimen No. | Critical Distance (mm) | ||
|---|---|---|---|
| Yang | Hertel | Proposed | |
| V1 | 0.725 | 0.572 | 0.620 |
| V2 | 0.657 | 0.572 | 0.620 |
| V3 | 0.563 | 0.572 | 0.620 |
| V4 | 0.496 | 0.572 | 0.620 |
Publisher’s Note: MDPI stays neutral with regard to jurisdictional claims in published maps and institutional affiliations. |
© 2022 by the authors. Licensee MDPI, Basel, Switzerland. This article is an open access article distributed under the terms and conditions of the Creative Commons Attribution (CC BY) license (https://creativecommons.org/licenses/by/4.0/).
Share and Cite
Zhou, Z.; Guan, D. Considering the Effect of Non-Propagating Cracks on Fatigue Limit Prediction in the Critical Distance Method Framework. Appl. Sci. 2022, 12, 10994. https://doi.org/10.3390/app122110994
Zhou Z, Guan D. Considering the Effect of Non-Propagating Cracks on Fatigue Limit Prediction in the Critical Distance Method Framework. Applied Sciences. 2022; 12(21):10994. https://doi.org/10.3390/app122110994
Chicago/Turabian StyleZhou, Zhuo, and Deqing Guan. 2022. "Considering the Effect of Non-Propagating Cracks on Fatigue Limit Prediction in the Critical Distance Method Framework" Applied Sciences 12, no. 21: 10994. https://doi.org/10.3390/app122110994