Article

A Characterization Method for Pavement Structural Condition Assessment Based on the Distribution Parameter of the Vehicle Vibration Signal

1
School of Civil Engineering, Southeast University, Nanjing 211189, China
2
The Key Laboratory of Road and Traffic Engineering, Ministry of Education, Tongji University, Shanghai 201804, China
*
Author to whom correspondence should be addressed.
Appl. Sci. 2022, 12(2), 683; https://doi.org/10.3390/app12020683
Submission received: 15 December 2021 / Revised: 6 January 2022 / Accepted: 9 January 2022 / Published: 11 January 2022

Abstract

:

Featured Application

This article has potential applications in rapid pavement structure evaluation based on vehicle vibration.

Abstract

A pavement structural survey plays a vital role in road maintenance and management. This study was intended to explore the feasibility of a non-stop pavement structure assessment method by analyzing the vibration data from a vehicle sensor. In this study, three falling weight deflectometer (FWD) tests and four vehicle vibration tests were conducted on five pavement structures. The FWD test results show that the continuously reinforced composite pavement has a higher structural stiffness than the semi-rigid base asphalt pavement. According to the statistical distribution of vehicle acceleration, a distribution parameter, the peak probability density (PPD), was proposed. The correlation coefficient (−0.722) of the center deflection (D1) and PPD indicates a strong correlation between the two variables. Therefore, PPD is strongly correlated with pavement structural stiffness. This study proposed a novel characterization method for pavement structural conditions based on the distribution parameter of the vehicle vibration signal.

1. Introduction

The good structural condition of infrastructure is the basis for ensuring its safe operation and providing the corresponding services. Therefore, structural health monitoring (SHM) has always been a hot spot in the engineering industry. Among SHM methods, vibration-based SHM uses the dynamic response of structures such as acceleration to reflect the structural condition [1]. This method has the merit of remote testing, while the drawbacks are that it requires an installation cost, and the power should be more accessible.
During the operation of a pavement, its structural stiffness is weakening year by year. Obtaining the structural condition of the pavement is an essential part of a pavement condition survey and evaluation, which is the basis for the transport agencies to make maintenance decisions, ensure the pavement’s structural security, and maintain its level of service.
The assessment methods of pavement structure conditions mainly include the core-drilling method, dynamic deflection method, and some innovative methods using distributed fiber and ground-penetrating radar, etc. [2,3]. The core-drilling sampling method is inconvenient to use because it destroys the pavement structure and interrupts traffic. Therefore, it is often adopted for verification rather than testing. In contrast, the dynamic deflection method has a broader application. Researchers have mainly studied the performance evaluation of pavement structure based on the modulus back-calculation and deflection basin parameters [4,5,6]. The former has received more attention.
In 1977, Hou [7] proposed a method in his doctoral dissertation to compare the error between the two deflections was minimal. Later, many researchers adopted a similar idea to invert the structural layer modulus based on the falling weight deflectometer (FWD) deflection basin data. As time went by, some scholars employed advanced analytical techniques such as neural networks, genetic algorithms to solve the non-uniqueness of the solution in modulus inversion. Li and Wang [8] developed an artificial neural network and genetic algorithm (ANN-GA) method to back-calculate the layer moduli of flexible pavement from the falling weight deflectometer (FWD) test. The back-calculated parameters can be directly applied to the mechanistic-empirical design for pavement overlays.
Deflection data analysis can effectively evaluate the performance of pavement structure, but this kind of method requires parking before testing. Closing roads will affect traffic flow; therefore, it is difficult to apply on roads with heavy traffic. This study explores the feasibility of a non-stop pavement structure assessment method by analyzing vehicle vibration data.
Pavement condition includes structural condition and surface condition. Pavement condition surveys based on vehicle vibration primarily focus on surface performance [9,10], including pavement roughness [11], surface stresses such as potholes and transverse cracks, etc. [12,13,14]. Still, there are very few studies on pavement structures. In fact, the vibration of a vehicle running on the pavement can reflect structural conditions to a certain extent, and only this relationship may be implicit.
Inspired by vibration-based structural health monitoring, Yang and co-workers demonstrated for the first time the feasibility of analyzing a bridge structure through the vibration signals of the driven vehicle [15]. Over the past years, they still focused on this issue and have conducted a series of analyses, from the initial extraction of the first-order frequency to the determination of modal parameters such as multi-order frequencies, damping, and mode shapes, then to damage identification and location, and expansion joint detection, etc. [16,17,18,19]. Unlike traditional SHM, these methods are called indirect SHM (ISHM) because the sensors are installed on a moving vehicle rather than on the structure itself [20]. ISHM has the merits of being mobile, economic, and efficient [19]. In response to the problem that the manually extracted features are not very sensitive to damage, Liu, et al. [21] proposed a physics-guided algorithm to extract an effective feature to determine the damage in a bridge.
With the rapid development of smartphones, in recent years, there has been some research on ISHM, based on the data obtained by the built-in sensors of smartphones [22,23]. These data are mainly derived from a triaxial accelerometer, a global positioning system (GPS), and an inertial measurement unit (IMU). This kind of method has an even lower cost and can collect more data. By using a smartphone, Quqa, et al. [1] explored the feasibility of using bicycles to extract common modal parameters of structures, namely the natural frequency modal shape and the operating deflection shape (ODS), which has been demonstrated on a footbridge in Italy.
From the above analysis, it can be seen that the research objects of the vehicle-vibration-based method mainly focus on the bridge structure or the pavement surface condition. However, the analysis of the pavement structure condition through indirect vehicle vibration needs more research. Therefore, this study intends to analyze this aspect, aiming to provide a method of characterizing pavement structural conditions based on characteristic parameters of vibration signal distribution. The result may provide a basic methodological framework for studying the pavement structural performance evolution in the long-term operation process.
This paper is organized as follows. Section 2 introduces the test conditions, including the pavement conditions and experiment conditions; Section 3 analyzes the results of the dynamic deflection test and the vehicle vibration test and then establishes a link between the two; Section 4 presents some discussion about the proposed method and Section 5 states the conclusion of this study.

2. Test Introduction

2.1. Pavement Condition
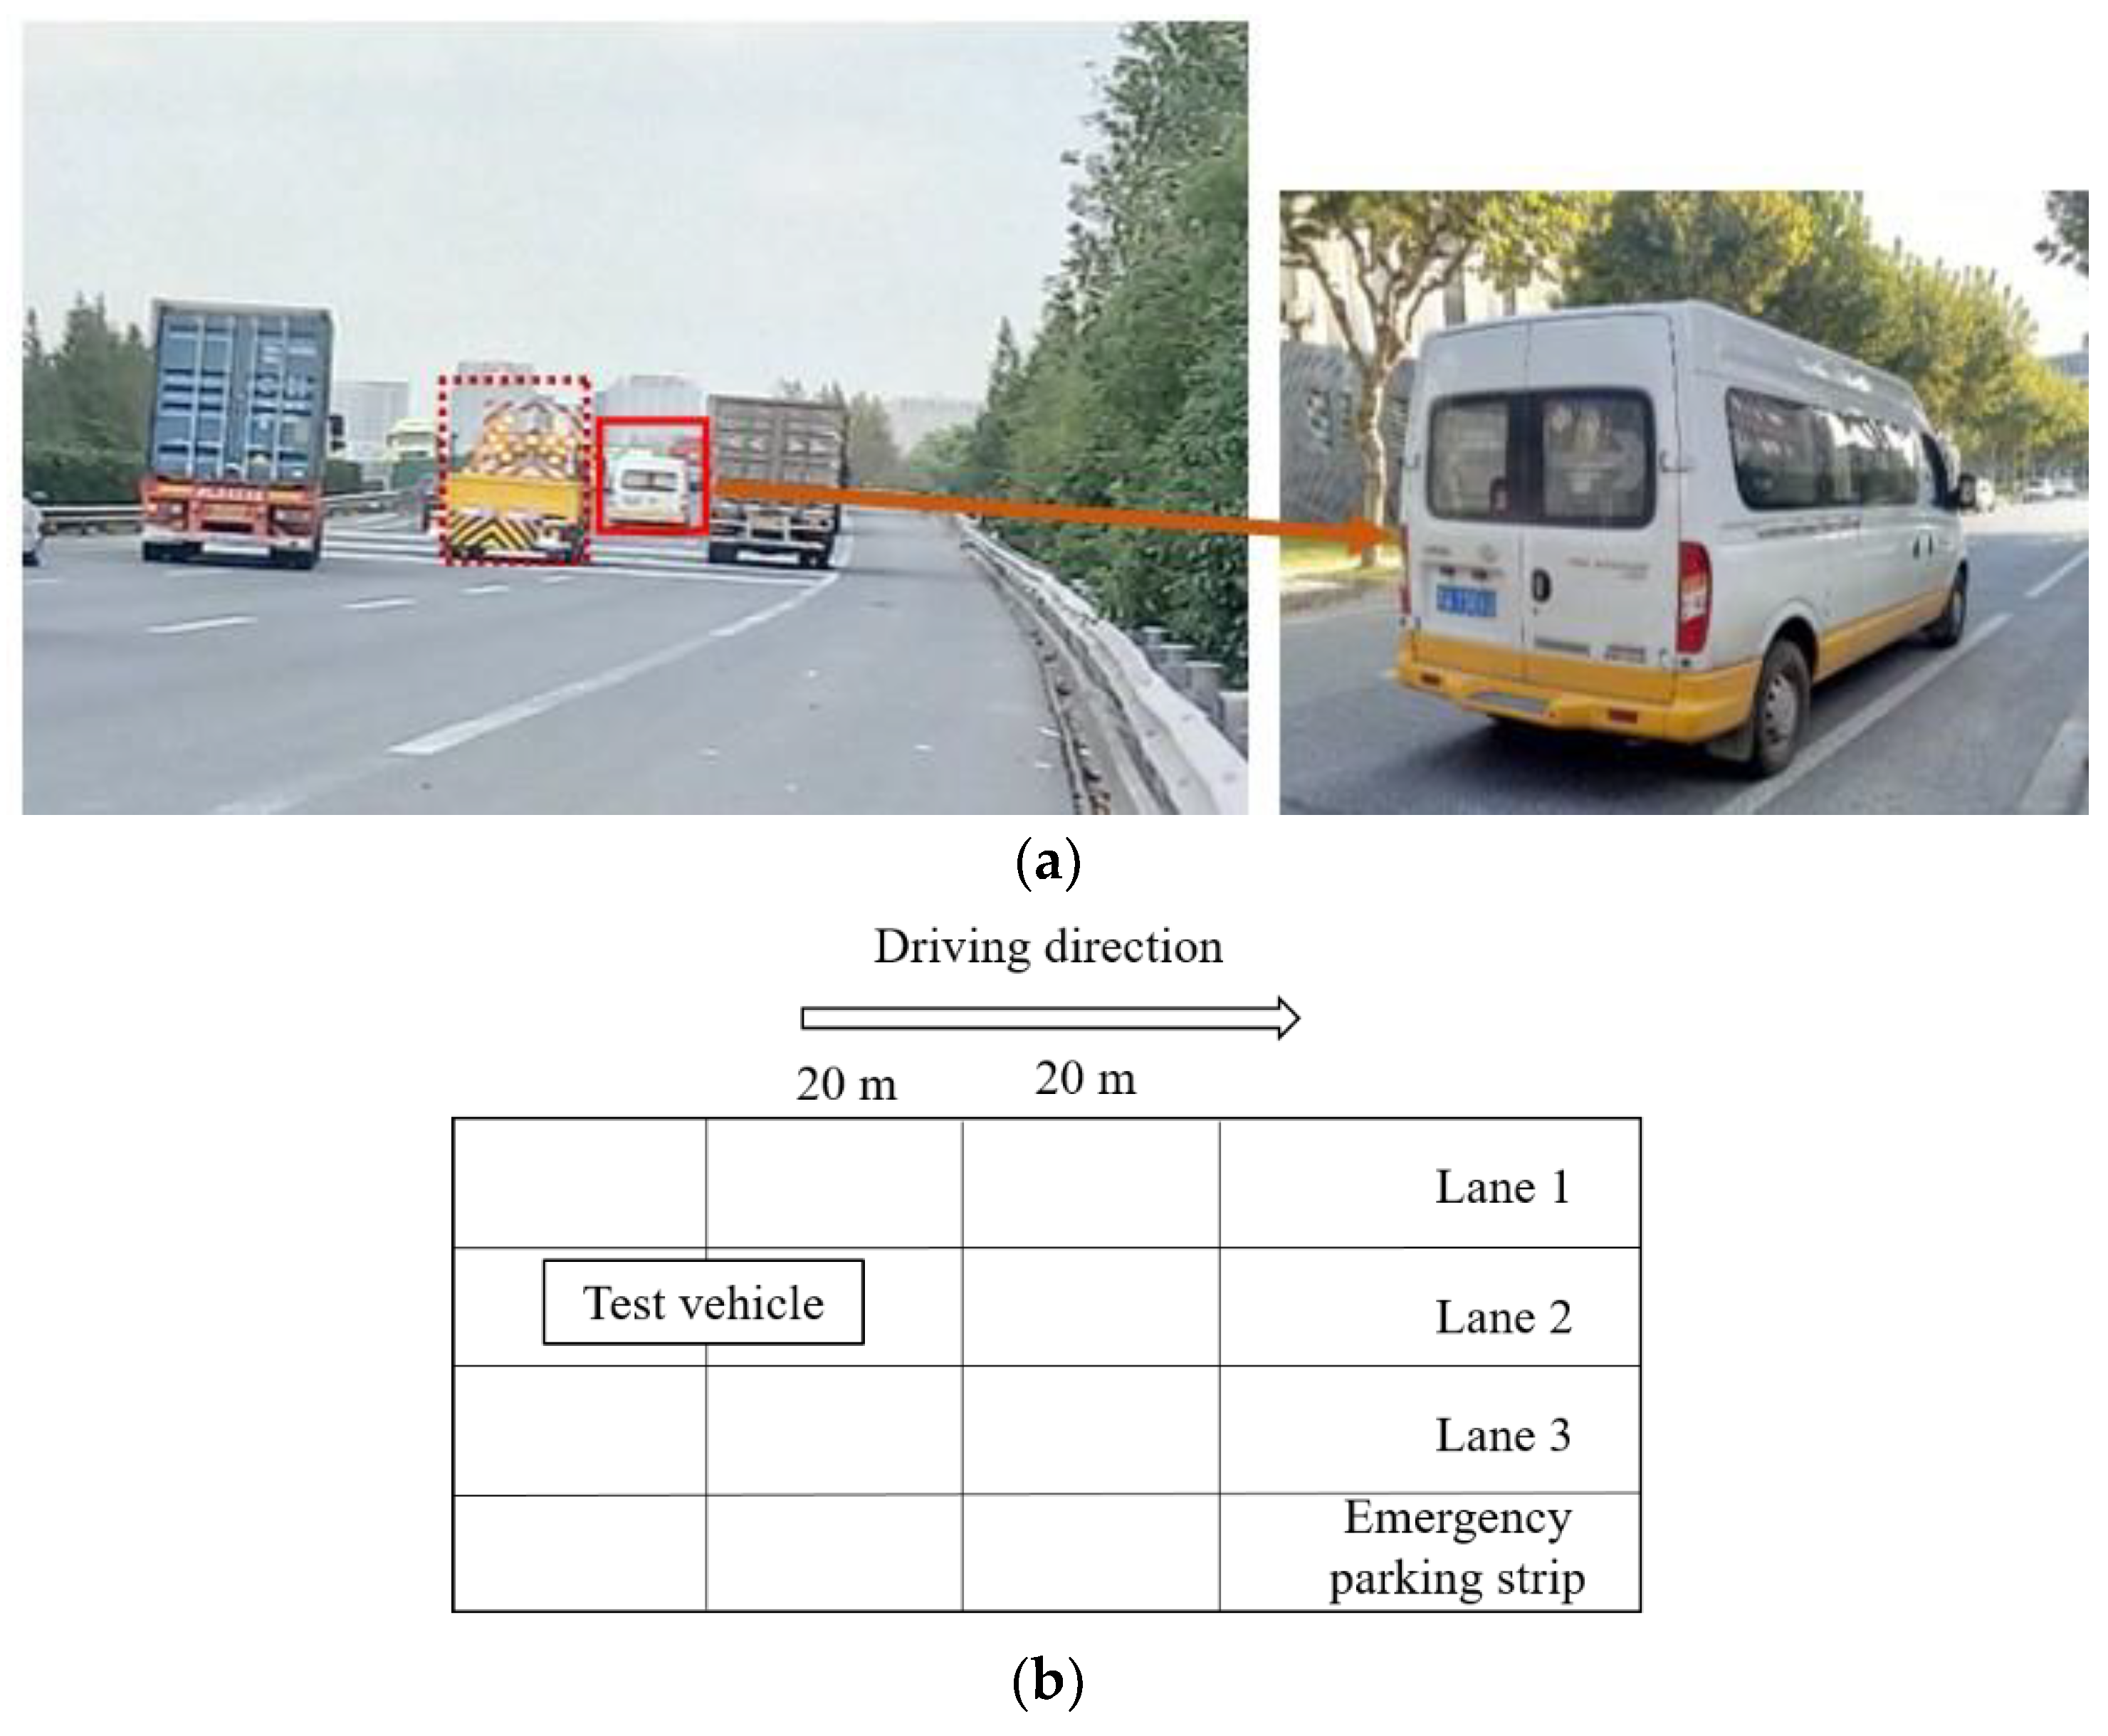
The authors conducted four vehicle vibration tests and three dynamic deflection tests on five pavement structures in Shanghai from 2018 to 2021. Five test sections were selected, including three continuously reinforced composite pavements with different structures, one semi-rigid base asphalt pavement, and one pavement that was the junction of a composite section and a semi-rigid base section. The basic parameters of the test section are shown in Table 1.
It can be seen from Table 2 that the surface layer of the five test sections had the same structure, that is, 4 cm SMA-13 + 6 cm AC-20C. The base, subbase, and subgrade structures were quite different.

2.2. Test Condition

This study carried out three FWD tests and four vibration tests on the test sections in 2018, 2019, 2020, and 2021. To avoid the interference of temperature, the temperature of these tests were close, as shown in Table 3.

2.2.1. Deflection Test

Evaluating the pavement structure based on the collected pavement surface deflection derived from the falling weight deflectometer (FWD) is common. The multipoint vehicle-mounted falling weight deflectometer (SHN-FWD-MV) was used in this study, as displayed in Figure 1a. The test was conducted every 20 m along the longitudinal direction. The schematic diagram of the field test is shown in Figure 1b.
The deflection basin data were obtained through the test results of nine displacement sensors. The distances between the nine sensors and the center point of the load were 0, 200, 300, 450, 600, 900, 1200, 1500, and 1800 mm, numbered d1~d9, and the corresponding sensor values were D1~D9. The load size was 50 kN, and the load plate radius was 15 cm.

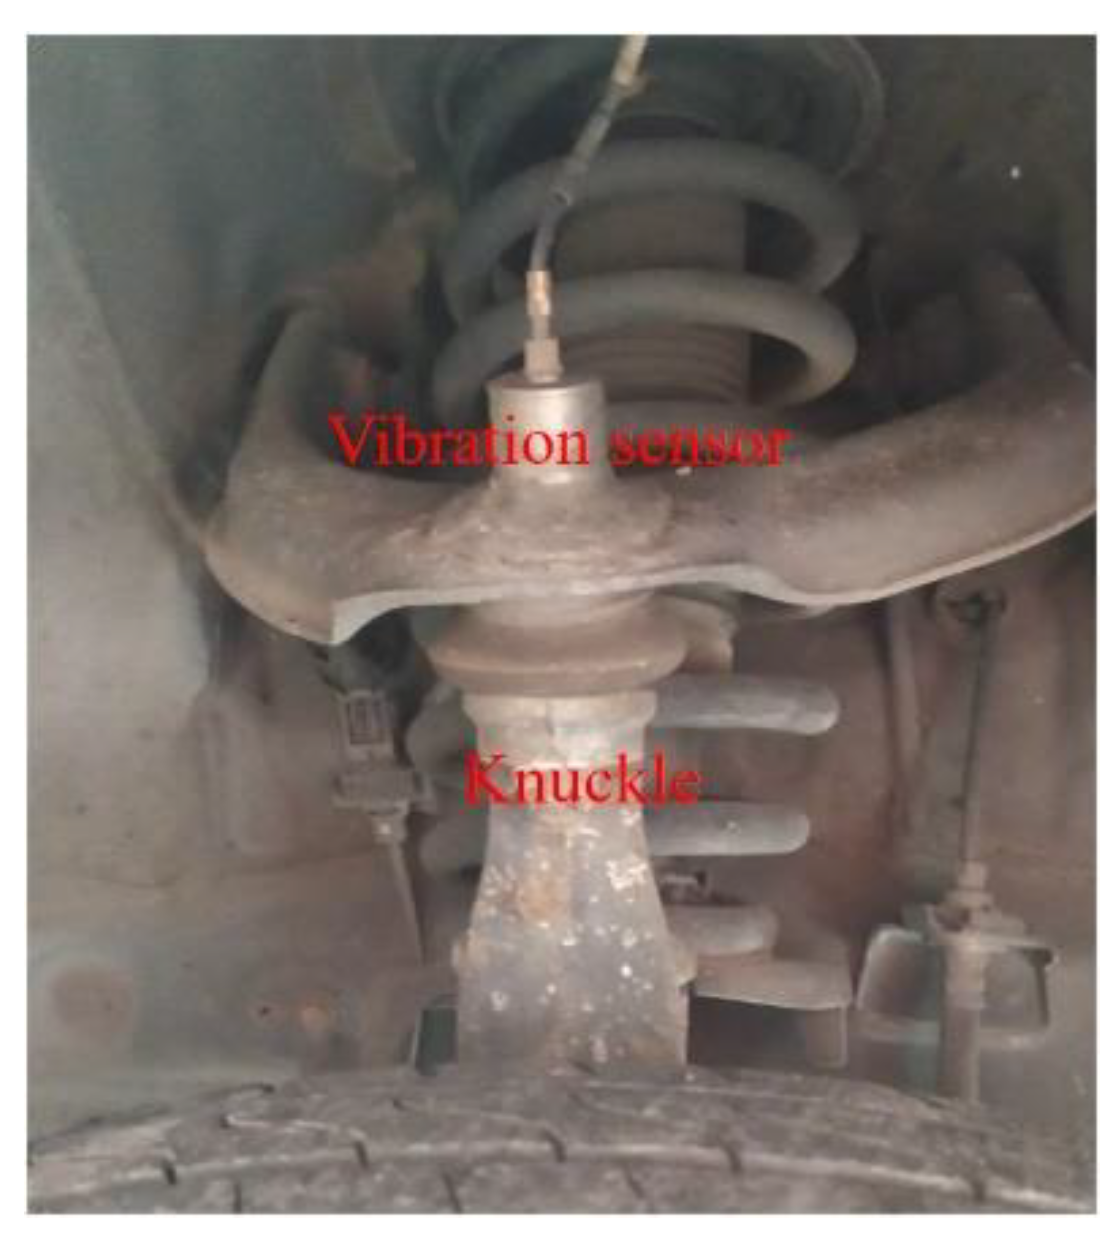
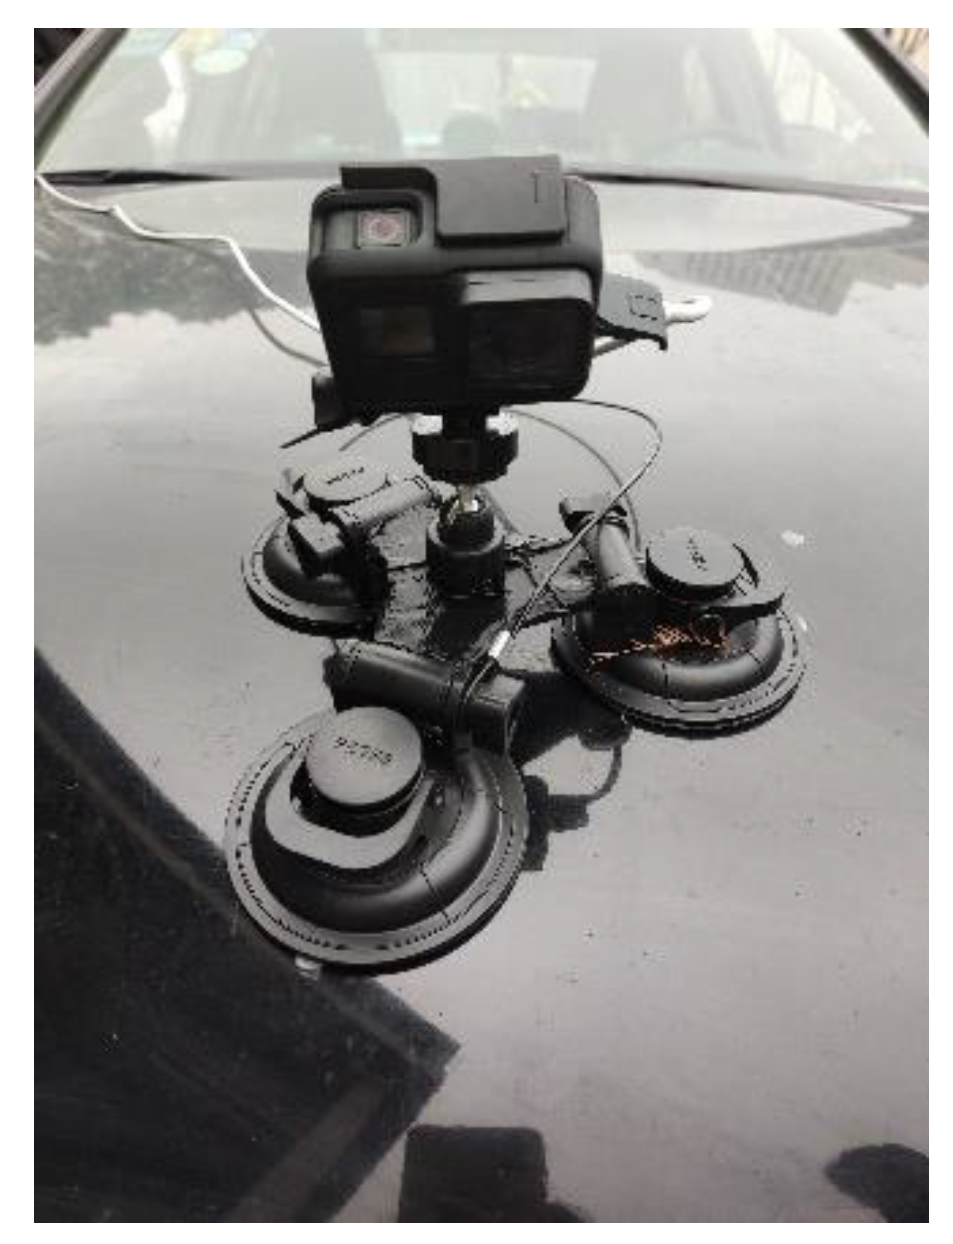
2.2.2. Vehicle Vibration Test

The test equipment included a test car, a vibration sensor, a constant current adapter, a data acquisition card, and a laptop computer. For the placement position, some studies simply place the sensors on the vehicle floor, seat, or center console for ease of installation. Still, these locations are far away from where the tires and the pavement are in contact and have passed the vibration damping system; therefore, the vibration is relatively small and less sensitive. In this study, the vibration sensor was installed on the knuckle of the right front wheel, which is not subjected to the vibration damping system and thus is more sensitive to pavement conditions. The sensor position is shown in Figure 2. A motion camera was used to record the surface condition of the testing pavement, which was installed on the hood, as shown in Figure 3.
Increasing the sampling frequency generally can obtain more information, which is conducive to identifying pavement conditions. However, meanwhile, high sampling frequency leads to a large amount of data storage and lower computation efficiency. The sampling frequency of the vehicle vibration test was 1280 Hz.
After installing the vibration test equipment and adjusting the test parameters, we drove the test vehicle at a uniform speed on the five test sections. When a vehicle is traveling at a high speed, the tire may jump off the ground at certain positions, which is contrary to the assumption that the distance between the tire and the pavement surface is zero [24]. Therefore, the driving speed should not be too high, and the vehicle speed was maintained at 70 km/h during the test. The traffic volume of the test sections is large, and there may be congestion during the weekday, therefore, the tests were implemented on weekend afternoons.

3. Test Result Analysis

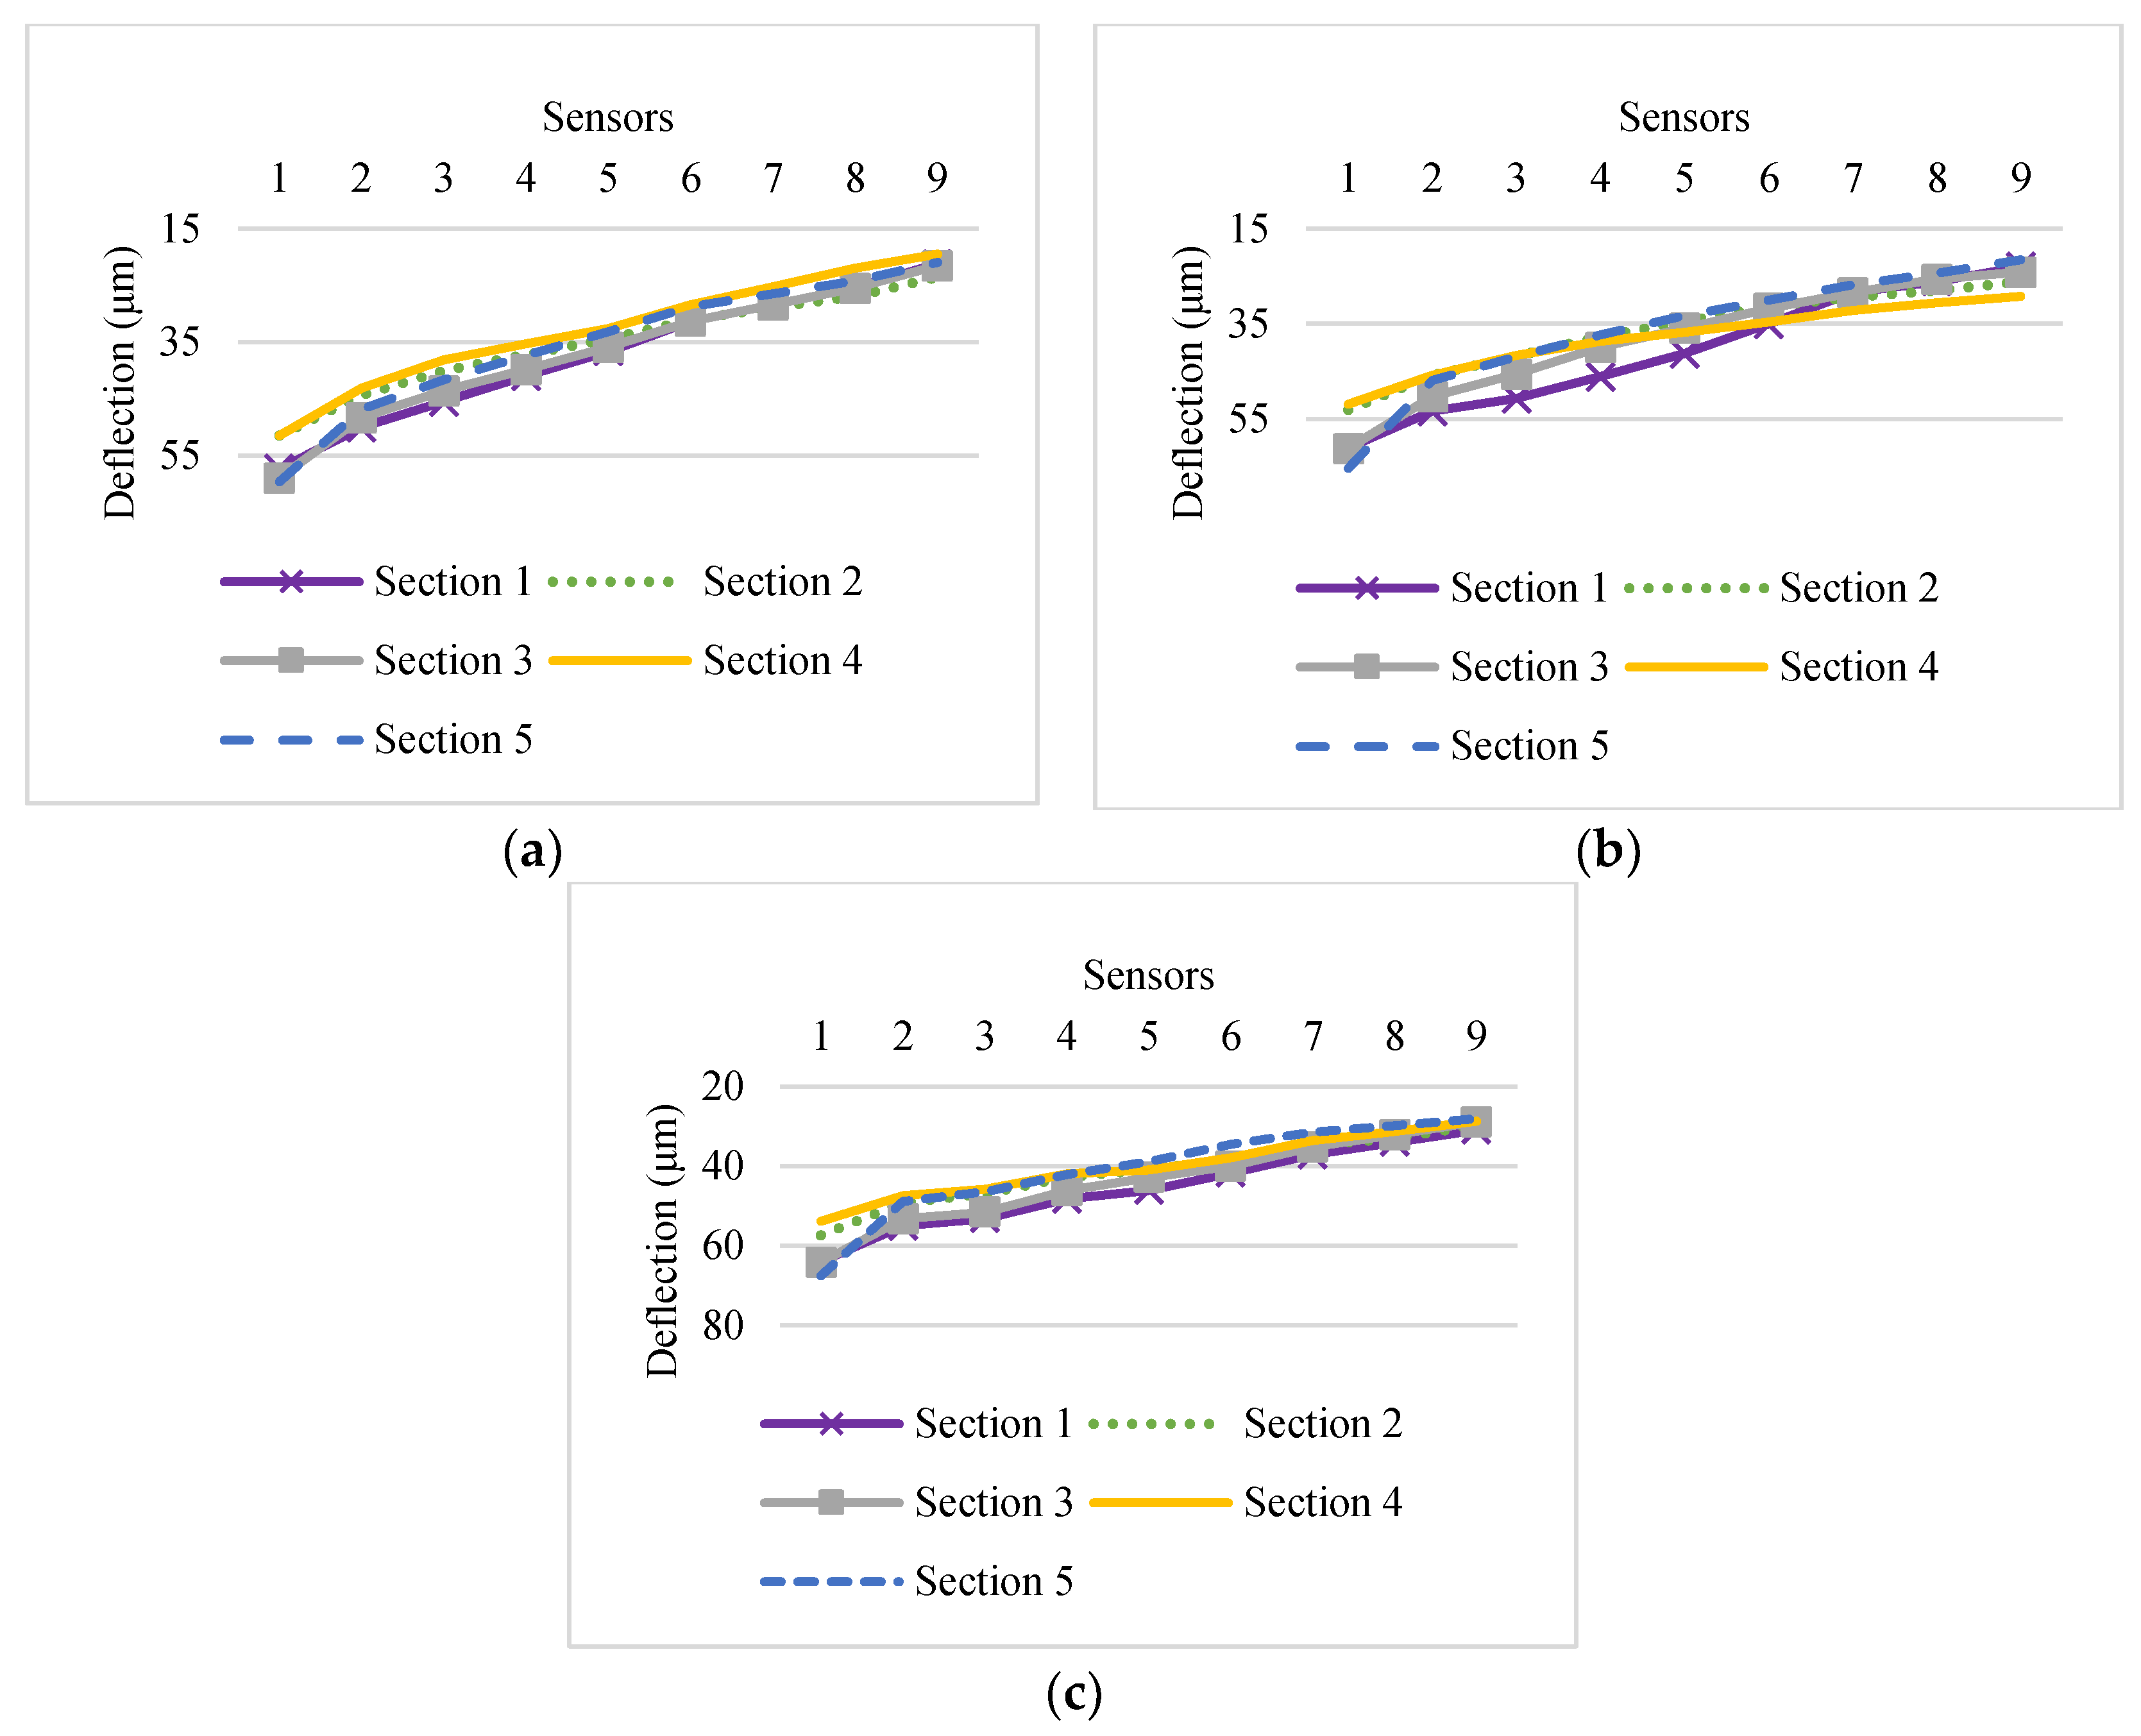
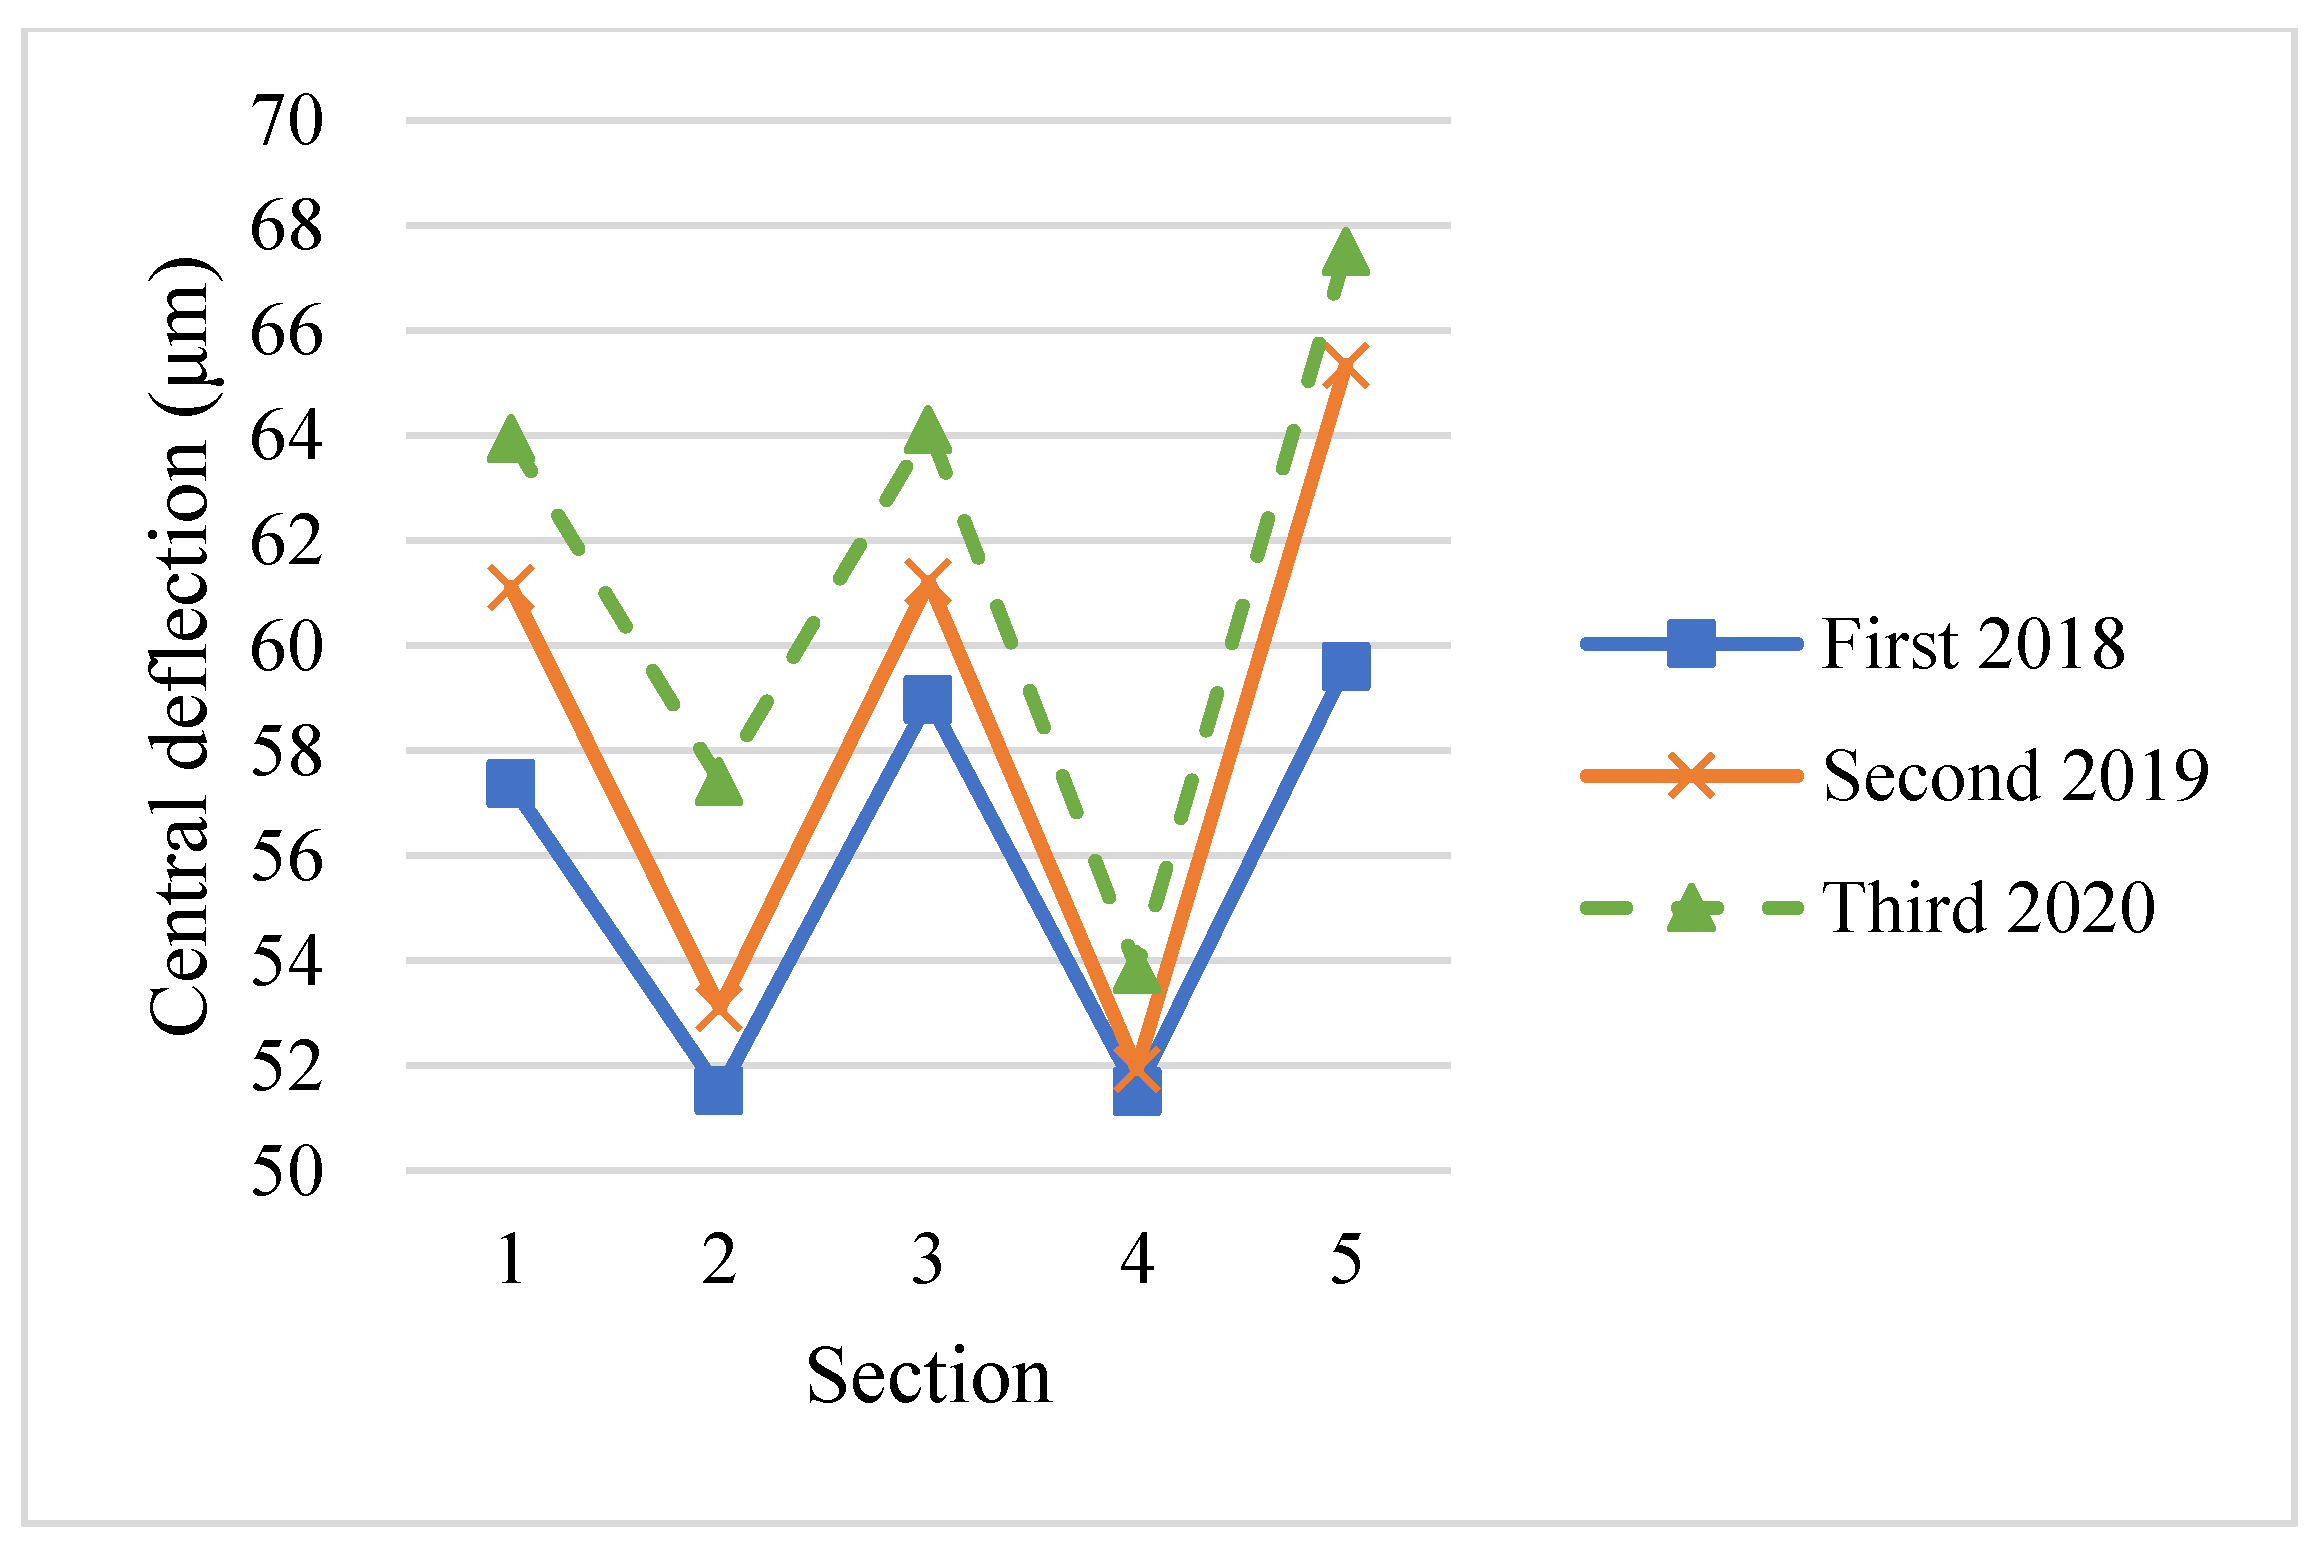
3.1. Deflection Test

Each measuring point was hammered three times during the pavement surface deflection test. The first stroke is for trial and the average deflection value of the second and third strokes was used for analysis. There were 11 measuring points in each section when the length of the test section was 200 m, and the interval was 20 m. The average value of the 11 measuring points was taken to draw the deflection basin diagram, which is shown in Figure 4. The central deflection of the five sections in the three tests is shown in Figure 5.
The central deflection (D1) is generally used to evaluate the overall structural stiffness of the pavement. The larger the D1 is, the lower the structural stiffness is. According to Figure 4 and Figure 5:
  • The structural stiffness of the continuously reinforced composite pavement (Section 2 and Section 4) is better than the semi-rigid base asphalt pavement (Section 5);
  • The structural stiffness of the junction (Section 3) of the two pavement structures is in the middle;
  • Although Section 1 is a composite pavement, its structural stiffness is worse than that of Section 2 and Section 4 because the subbase of Section 1 is weak among the five pavements (see Table 2);
  • With the extension of the operating time, D1 has increased, indicating that the pavement structural stiffness has decreased.

3.2. Vehicle Acceleration Analysis

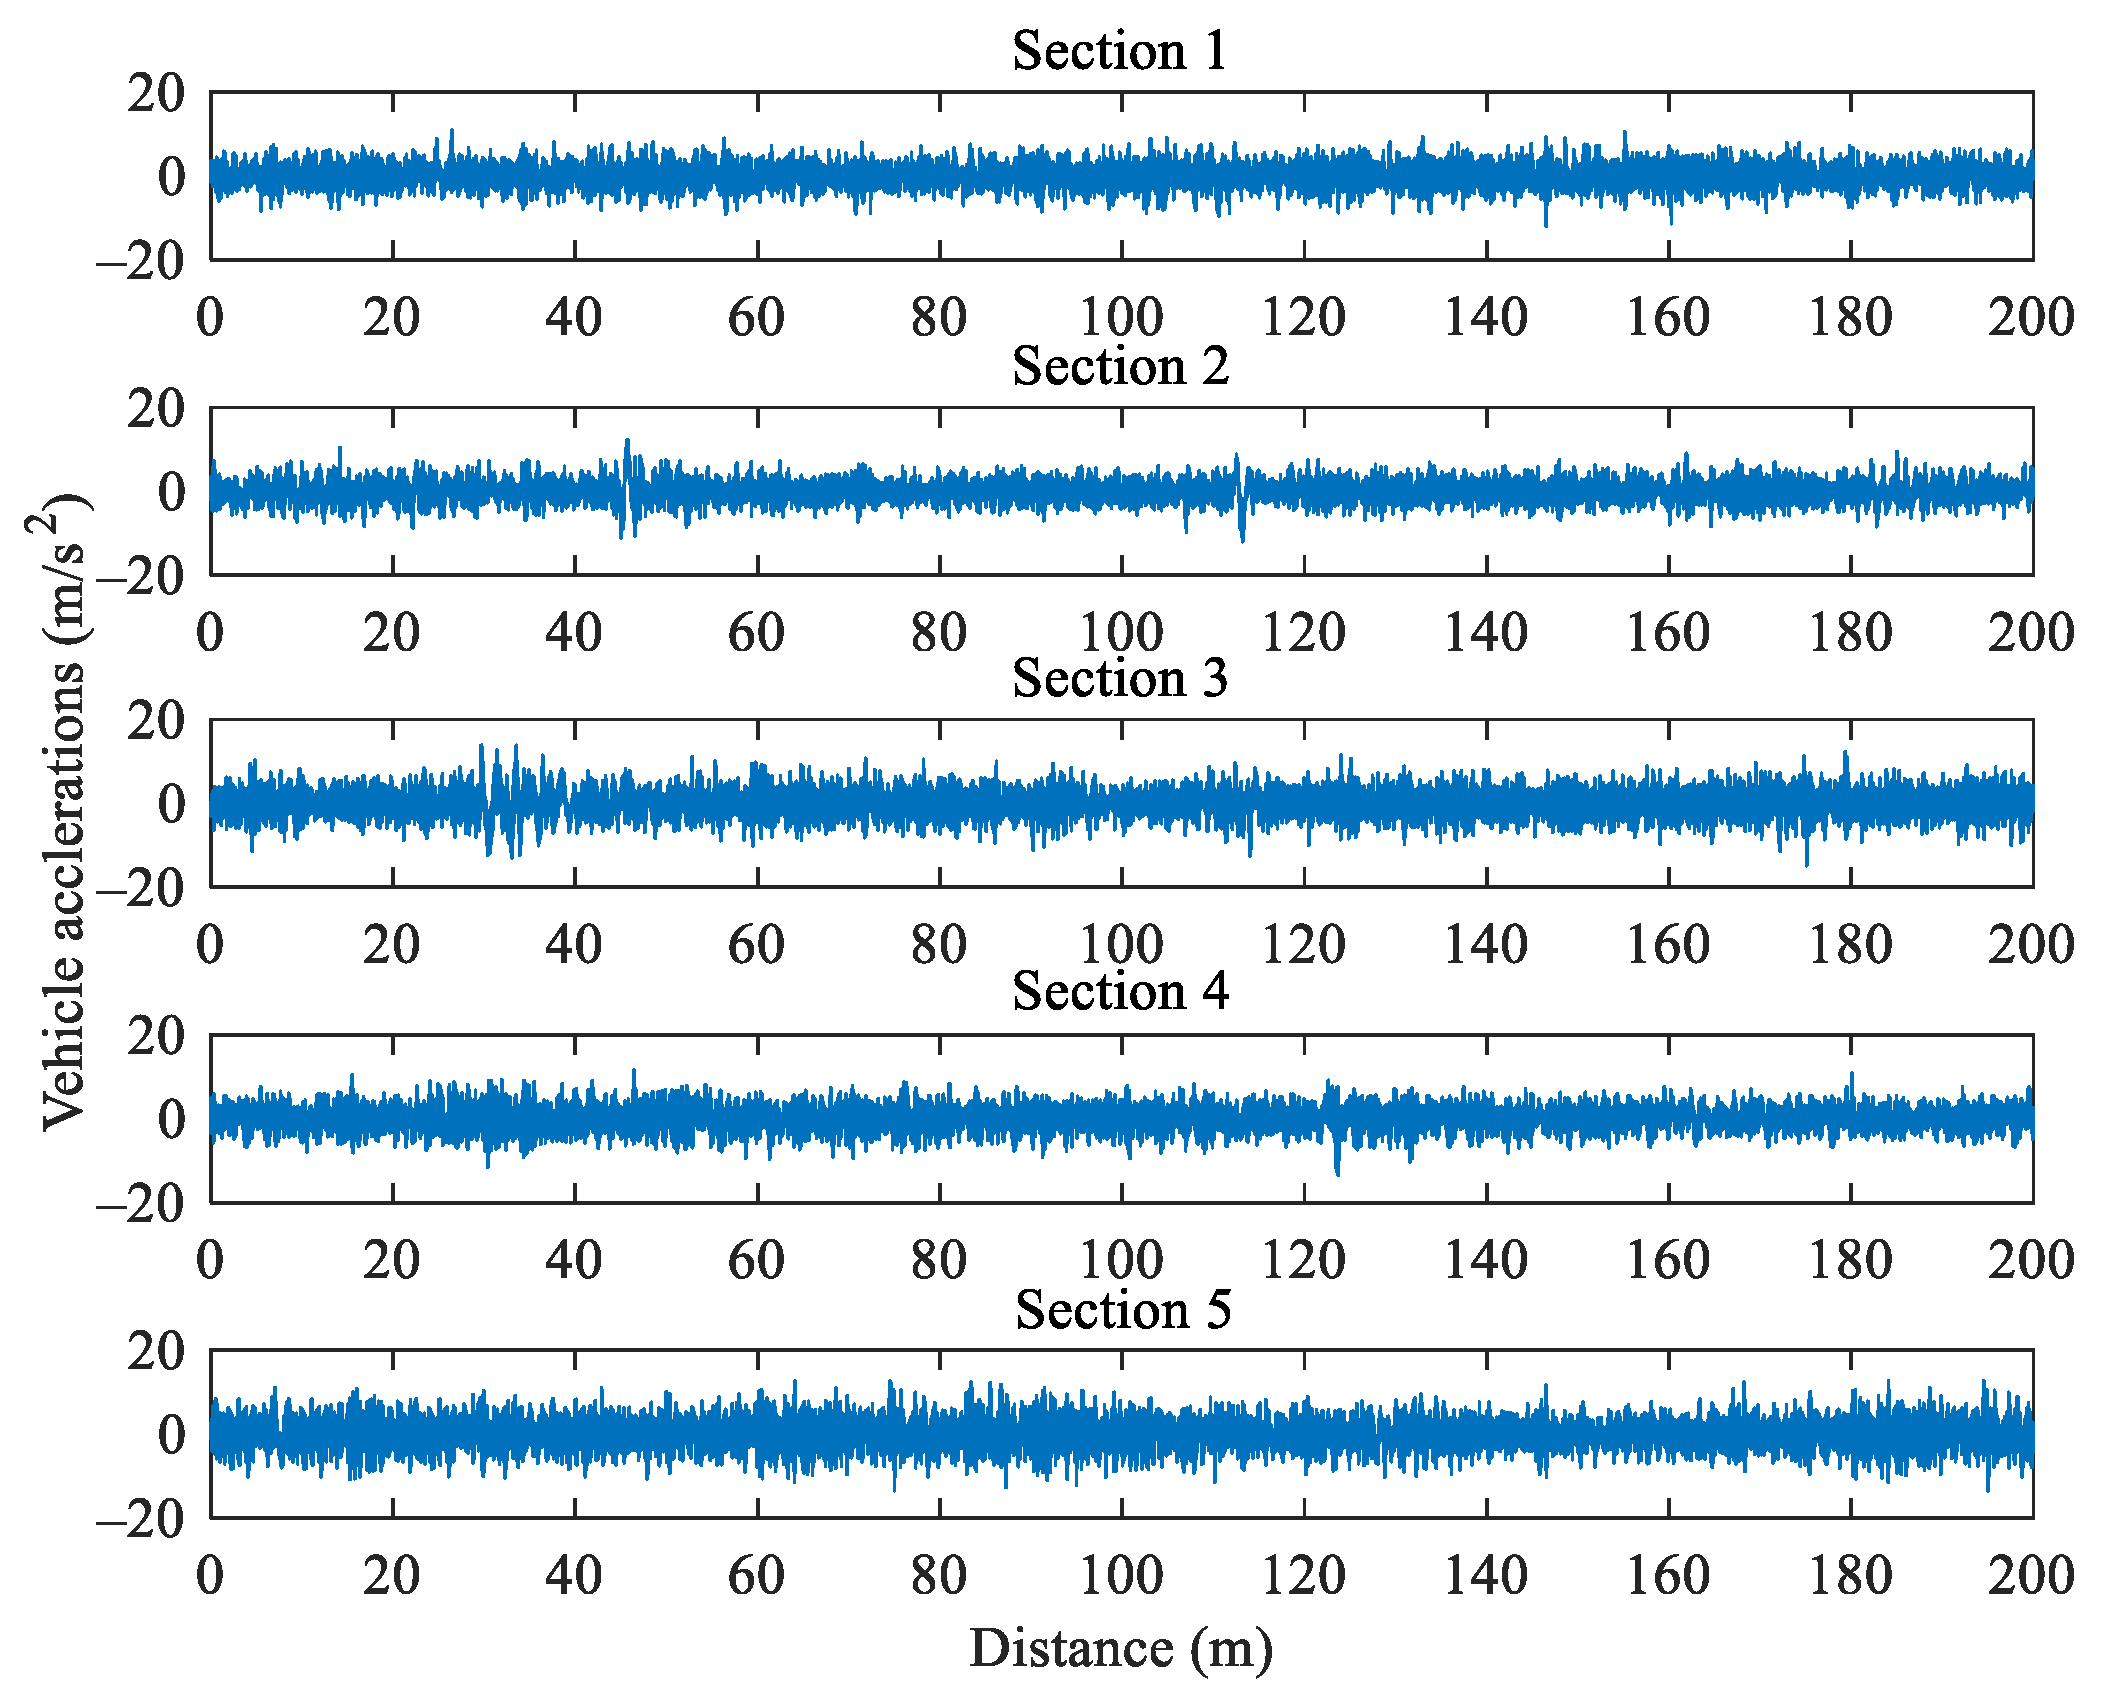
3.2.1. Accelerogram Analysis

The vehicle acceleration mainly comes from the road excitation while driving, and the inertia force of the engine. The vehicle acceleration when only the engine was running and that when the vehicle was driving on a road pavement is shown in Figure 6. Figure 6 shows that the acceleration induced by the engine was quite small compared with that induced by the road. It also means that the placement of the vibration sensor was rational.
Noises were inevitably introduced during the vibration test, including the engine noise and the instrument noise, etc. Wavelet denoising is considered to be one of the best tools in engineering signal analysis [25]. Therefore, we used the wavelet transform to denoise the raw data. The wavelet basis we used was Symlet 3 and the decomposition level was 3. These parameters are not fixed and should be determined according to the signal itself (such as signal sampling frequency, etc.) and the actual situation of engineering applications. The vibration data below were all processed after the denoising.
The time-domain waveforms of the first vehicle vibration test on the five sections are shown in Figure 7. It appears that the vehicle acceleration of Section 3 and Section 5 are relatively large. Apart from that, the difference in the vehicle acceleration in each section is not obvious, and further analysis is needed.

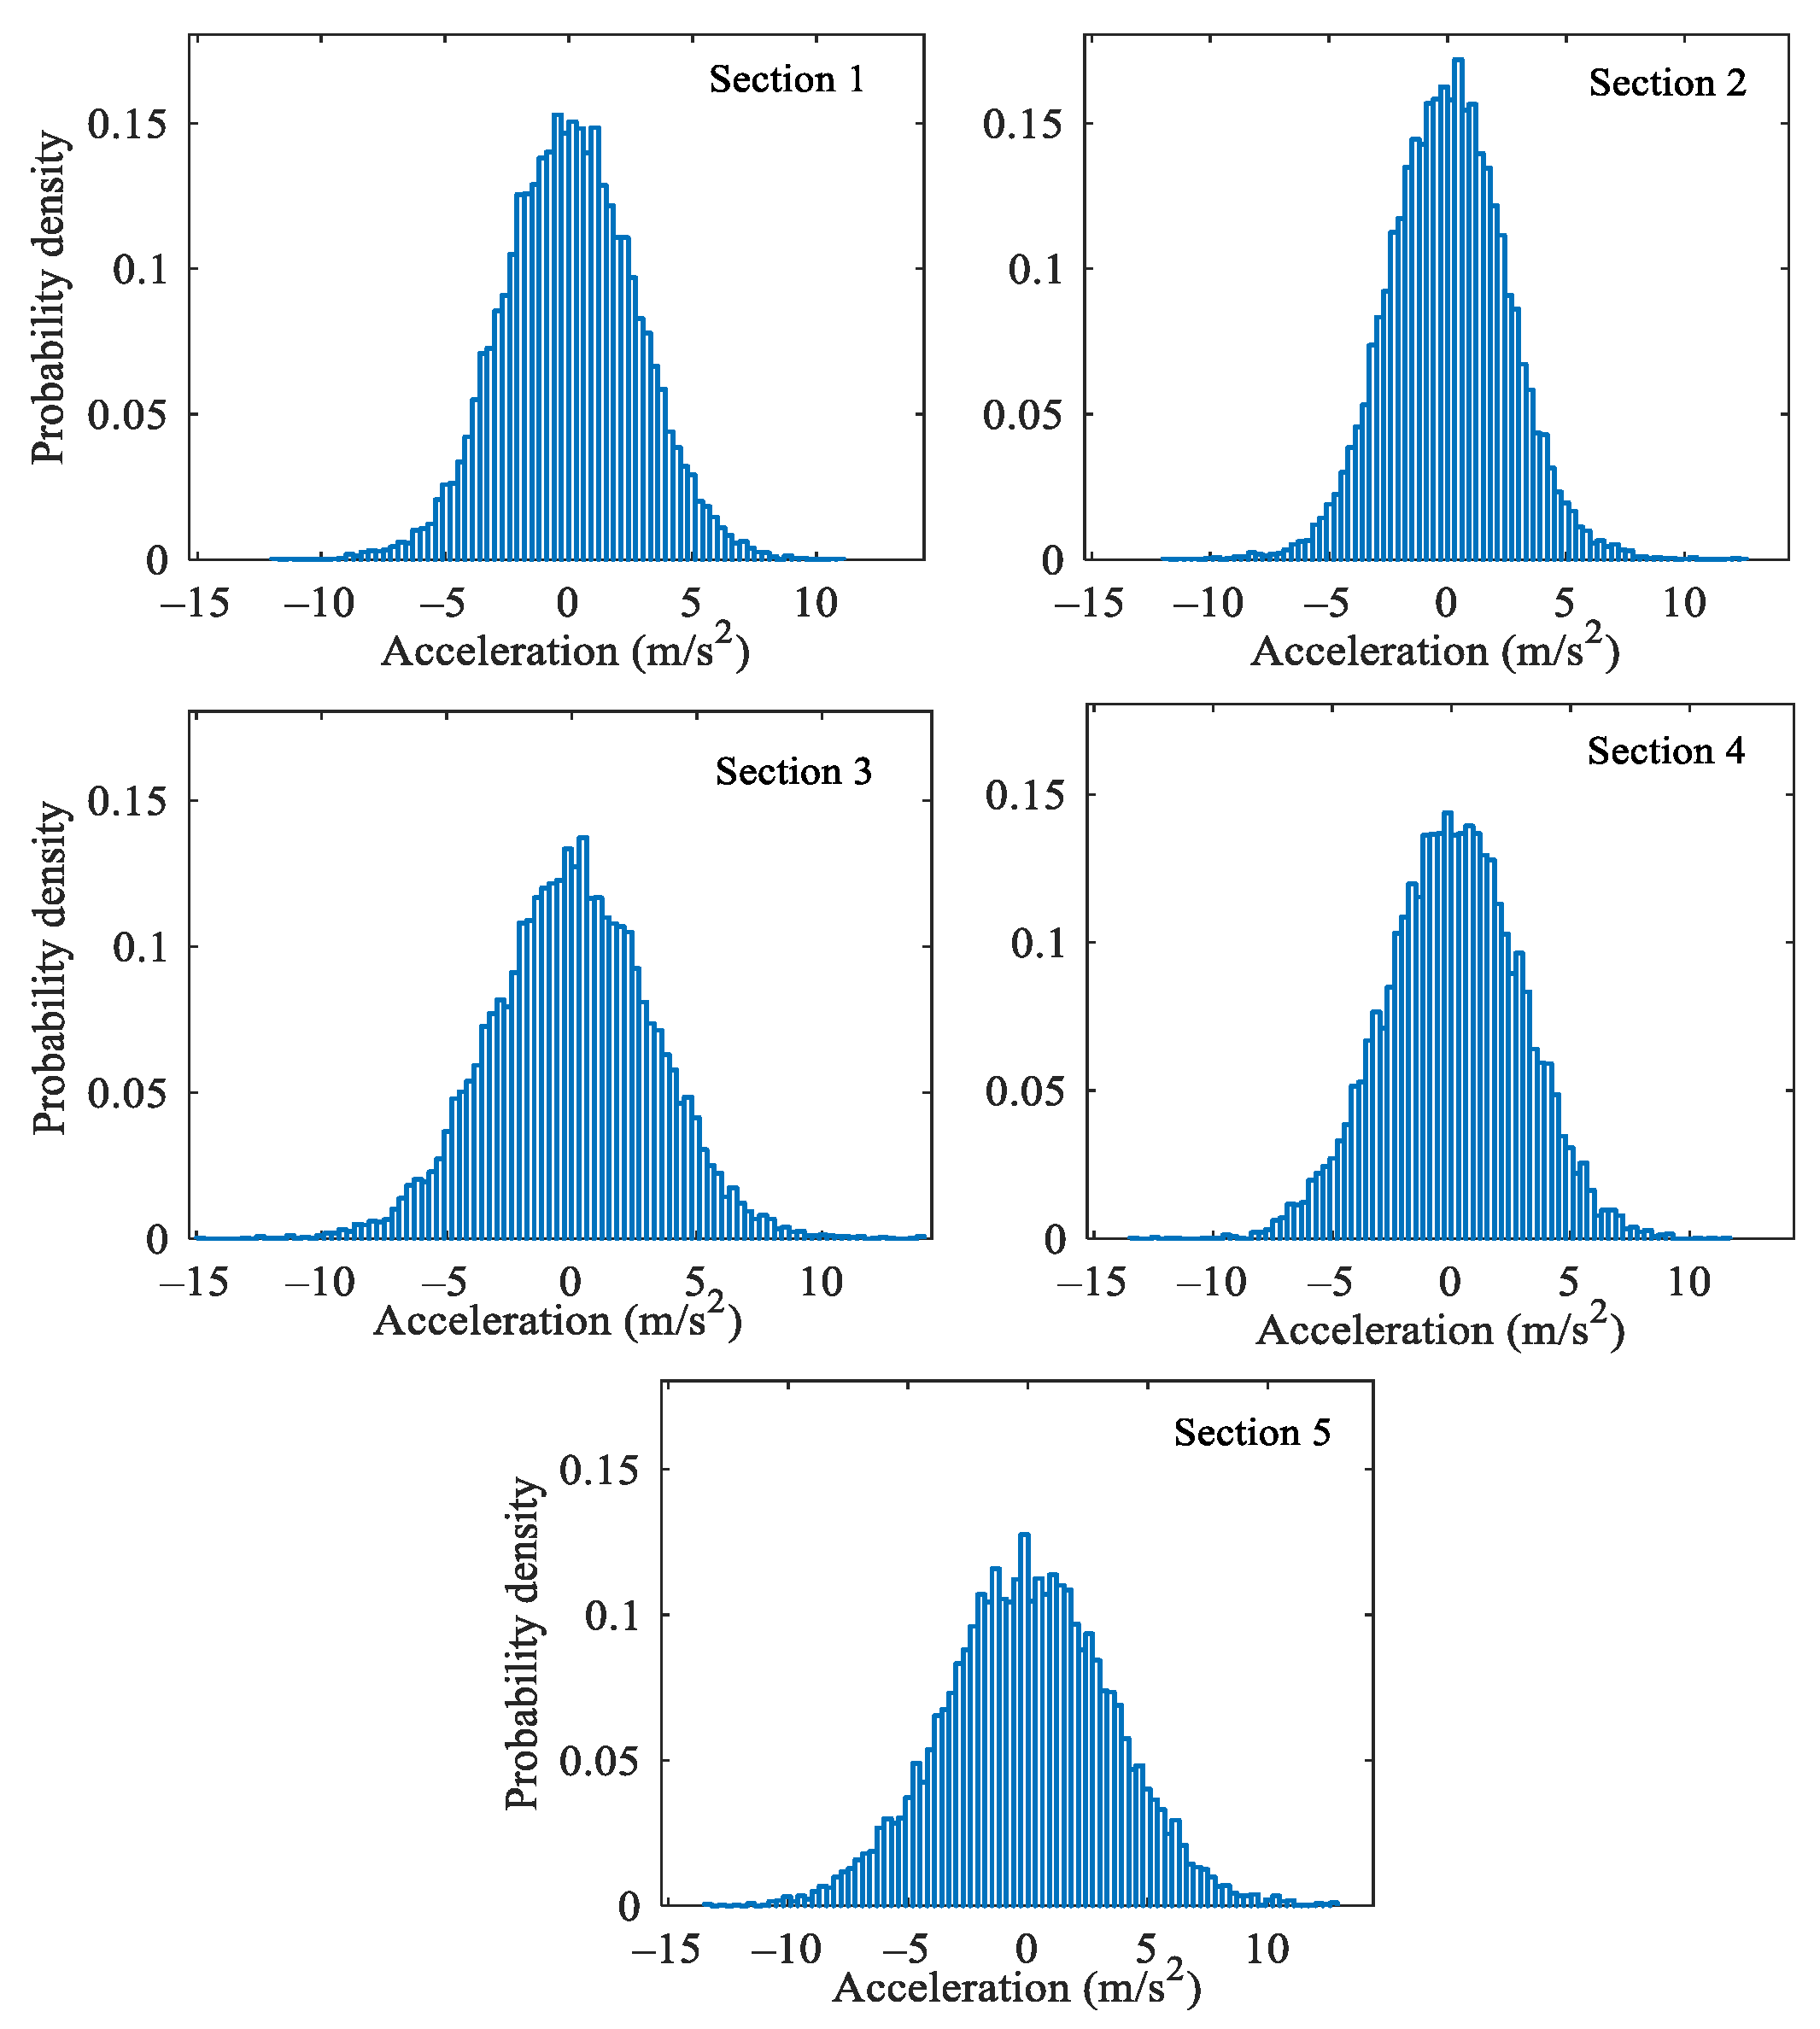
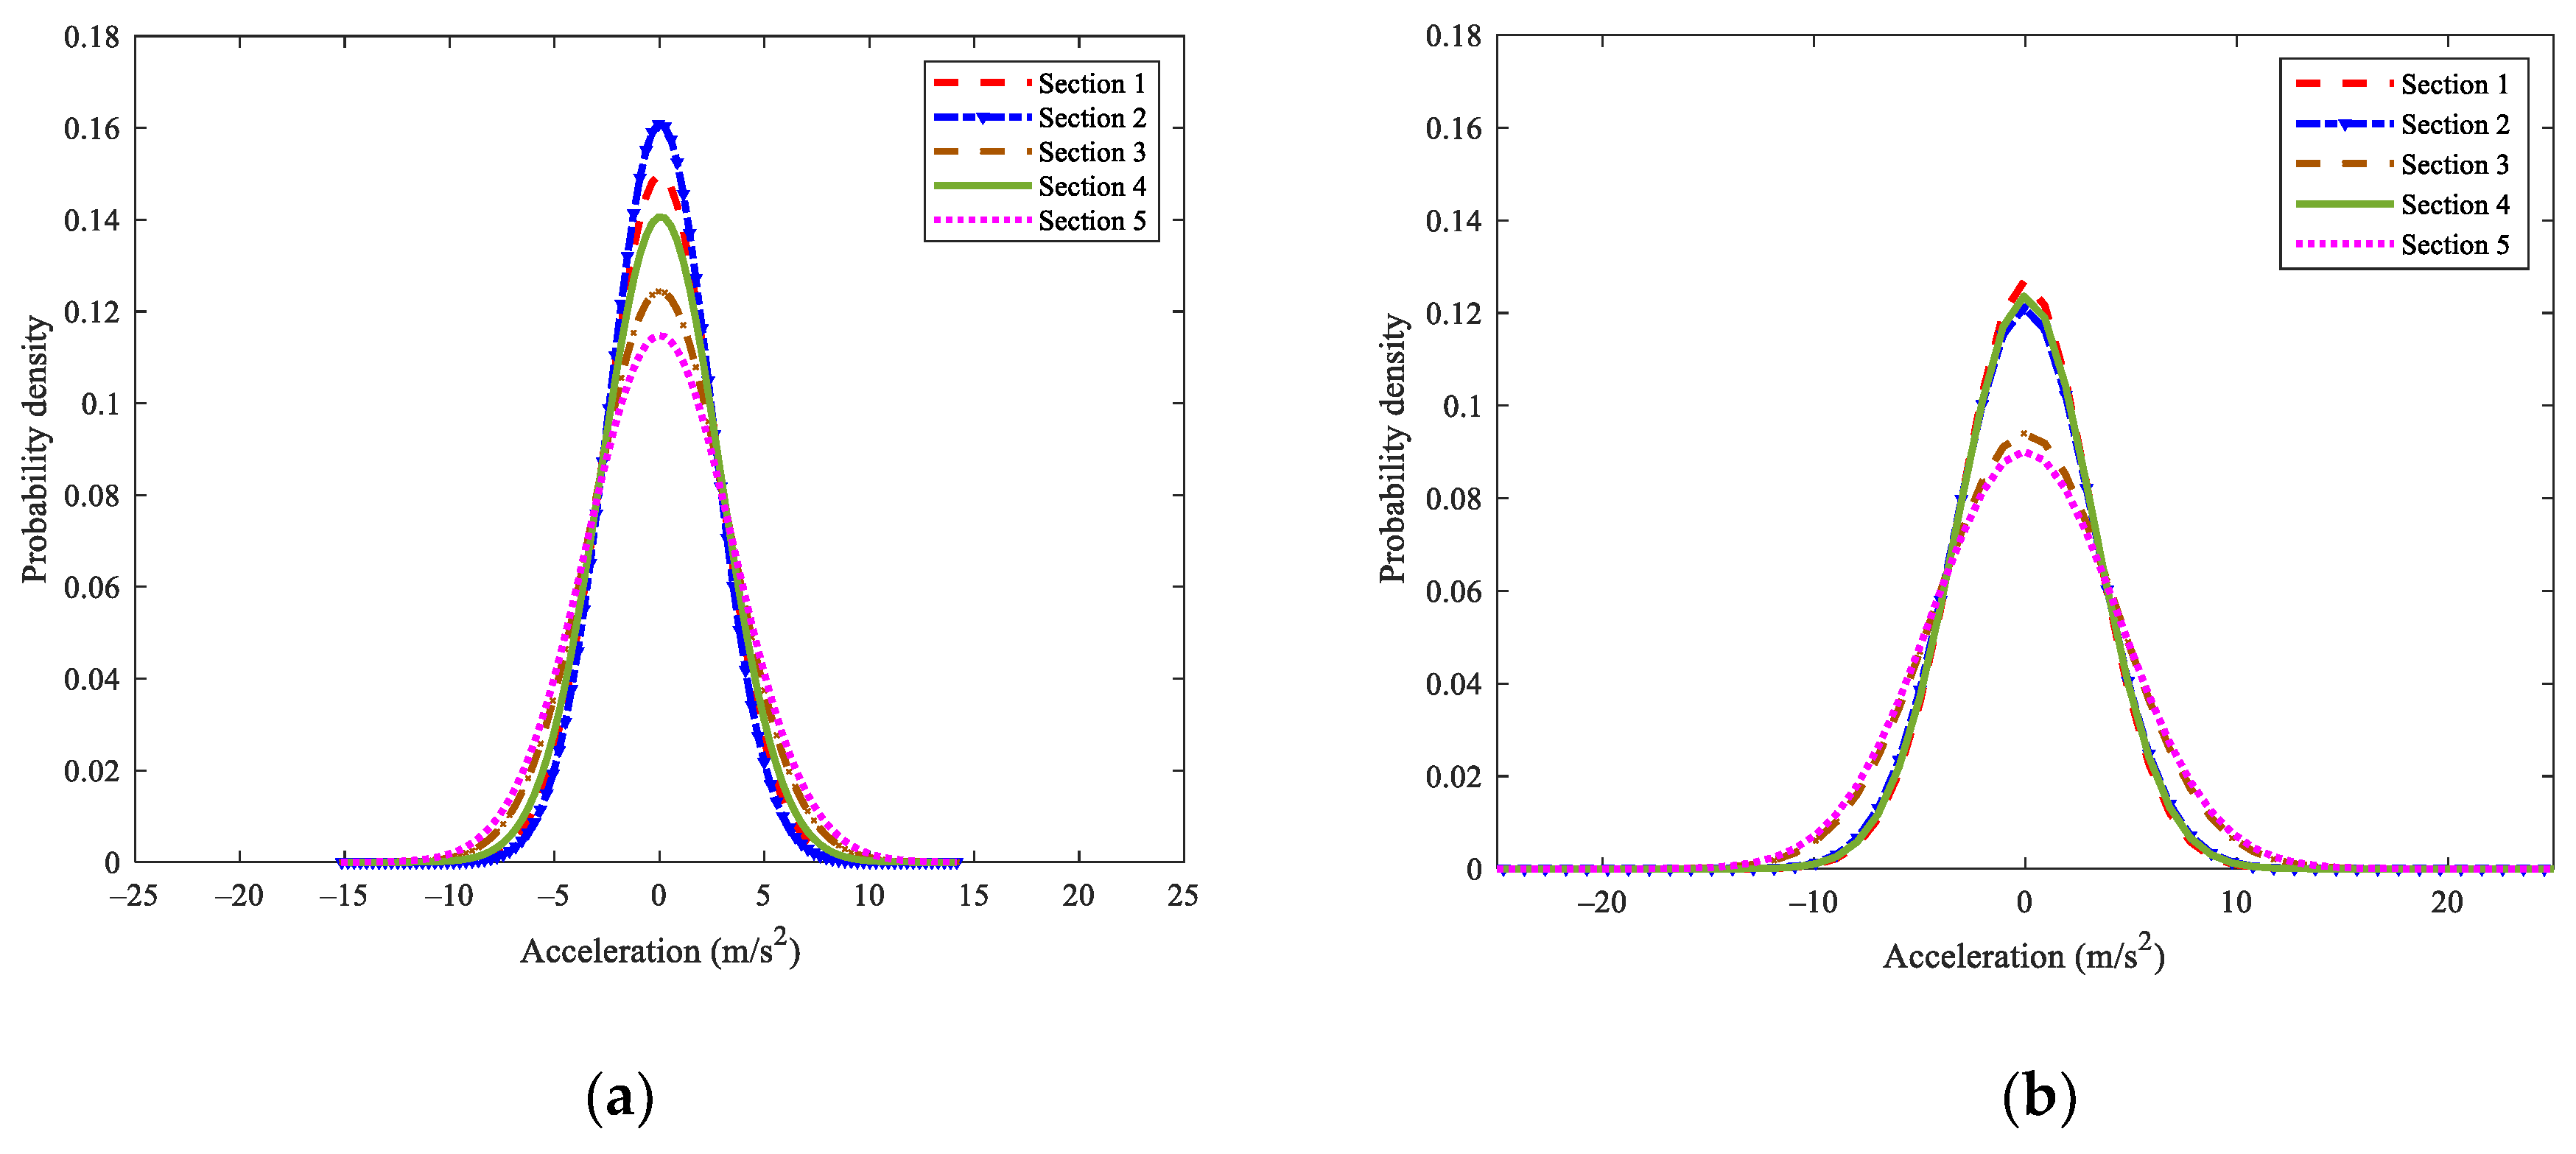
3.2.2. Acceleration Statistical Analysis

In order to make a statistical analysis of the vehicle vibration acceleration of 5 sections, the probability density distribution histogram of the acceleration at the first test is drawn in Figure 8. Through the Kolmogorov–Smirnov test, the vehicle acceleration data are found to be normally distributed since the p-value is larger than 0.05. The acceleration probability density fitting graphs of the four tests are drawn in Figure 9.
According to Figure 9, for the continuously reinforced composite pavement (Section 1, Section 2 and Section 4), the probability density distribution is relatively concentrated, and the curve is steeper. The probability density distribution is more scattered, and the curve is gentler for the semi-rigid base asphalt pavement (Section 5). For the junction of the two pavements (Section 3), the probability density distribution map is located between the two. From the perspective of the longitudinal time series, compared with the previous test, the probability density distribution curve of the latter test has a lower height and a larger width.
To quantify the above description, we calculated the width and height of the probability density distribution curve. The height is easy to understand, that is, the maximum probability density. Suppose the width is defined as the width of the abscissa axis, that is, the difference between the maximum acceleration and the minimum acceleration. In that case, it is easily affected by some abnormal values. Therefore, the width here is defined as the width of two inflection points on both sides of the probability density distribution curve. The point of inflection is the point where the second derivative of the function is zero.
Acceleration datum x obeys normal distribution; μ is the mean, and σ is the standard deviation. The probability density distribution function is as follows:
f ( x ) = 1 2 π σ exp ( ( x μ ) 2 2 σ 2 )
Find the second derivative of f(x) as follows:
f ( x ) = 1 2 π σ exp ( ( x μ ) 2 2 σ 2 ) [ ( x μ σ 2 ) 2 1 σ 2 ]
Let f ( x ) = 0, and we can find that the function has two solutions:
x 1 = μ + σ ,   x 2 = μ σ
In this study, the mean value of the vibration acceleration is calculated as 0; therefore, the two solutions of the function are as follows:
x 1 = σ ,   x 2 = σ
Therefore, on both sides of the probability density distribution curve, there are two symmetrical inflection points, that is, the width of the curve is 2σ.
By substituting x = μ into Equation (1), the peak probability density (PPD) can be computed as follows:
PPD = 1 2 π σ
It can be seen that the height and width of the probability density distribution curve are only related to σ; hence we only need one parameter. The height is more evident in the figure than the width, and the final parameter selected is the peak height of the probability density distribution curve, that is, PPD.

3.3. Correlation Analysis of Vehicle Acceleration and Pavement Surface Deflection

Table 2 shows that the surface layer of the five test sections has the same structure, namely 4 cm SMA-13 and 6 cm AC-20C. Moreover, the surface condition is quite similar according to the video recorded by the motion camera. Therefore, it is reasonable to compare the vehicle acceleration and pavement surface deflection.
Pearson’s correlation coefficient is commonly used to measure the correlation between two variables (the peak probability density of acceleration and central deflection). In statistics [26], Pearson’s correlation coefficient (r) can measure the correlation between two variables, −1 ≤ r ≤ 1. If r is positive, there is a positive correlation between the two variables, and the larger the value of r is, the stronger the correlation is. A negative r value means the two variables have a negative correlation; the smaller the value, the stronger the correlation. There is no correlation between the two variables if r is 0.
The relationship between the correlation degree of the variable and |r| is shown in Table 4.
For the peak probability density (PPD) and the center deflection (D1), their scatter diagram is shown in Figure 10. The greater the acceleration probability density is, the smaller the center deflection is. There is a linear correlation between the two variables so that the Pearson correlation coefficient can be used for evaluation.
The Pearson correlation coefficient (r) between PPD and D1 is calculated to be −0.722. According to Table 4, there is a strong negative correlation between them. D1 is negatively correlated with pavement structural stiffness. Therefore, it can be concluded that a strong positive correlation exists between PPD and the pavement structural stiffness. The greater the PPD is, the higher the stiffness of the pavement structure is. The reason may be that the stronger pavement causes the vehicle to vibrate more frequently. Frequent vibrations will cause the vehicle acceleration to cross zero more frequently, which means that the probability of a vehicle acceleration value being zero is greater. When the abscissas are equally spaced, greater probability means higher probability density. This result preliminarily proves that the vehicle acceleration can reflect the pavement’s structural stiffness.

4. Discussions

A pavement structural survey is a complex issue that requires either laborious work or advanced equipment. Assessing a pavement’s structural stiffness through vehicle vibration signals has the merits of convenience, low cost, and being non-destructive. However, it is a relatively novel approach that lacks sufficient research. A vibration-based pavement structural survey is challenging, and this study analyzed its feasibility.
According to the result of this study, the structural difference between the continuously reinforced composite pavement and semi-rigid base asphalt pavement is easy to distinguish. However, classifying three types of continuously reinforced composite pavement (A, B and C) is still arduous because their pavement structure is similar. In our future research, we need to improve the proposed method by adjusting the testing vehicle (such as increasing the weight) and developing thorough data analysis methods.
The road surface is paved with a temperature-influenced material, the asphalt mixture. Temperature changes would lead to changes in the pavement structural stiffness. Therefore, the surface deflection obtained by the FWD test usually requires temperature correction. The vehicle vibration test obtains the vehicle acceleration through the contact between the tire and the road, so the data would also be affected by the temperature. In this study, each vehicle vibration test and the corresponding deflection test were carried out on the same day. The temperatures were relatively similar, avoiding the influence of ambient temperature. However, in future research, the impact of temperature changes on the test data and results should be considered for a more detailed analysis.

5. Conclusions

In this study, a preliminary exploration was made on the evaluation of pavement structure conditions based on vehicle vibration. For the five pavement structures, four vehicle vibration tests and three pavement surface deflection tests were conductedfrom 2018 to 2021. According to the results of the FWD test, the pavement structure stiffness is relatively high for the continuously reinforced composite pavement. The structural stiffness of the semi-rigid base asphalt pavement is poor. For the junction of the composite pavement and the semi-rigid base pavement, the structural stiffness is middling. With the increase in the operating time, the pavement structural stiffness decreased.
According to the vehicle vibration test result, the peak probability density (PPD) of vehicle vibration acceleration was relatively large for the pavement section with high structural stiffness; the value was relatively small for the pavement with poor structural stiffness. However, for the three types of continuously reinforced composite pavements with slight differences in structural stiffness, it is difficult to describe the structural differences using this indicator.
The correlation analysis between the PPD of vehicle vibration acceleration and the center deflection (D1) shows that the correlation coefficient is −0.722, which is a strong positive correlation. Therefore, it can be inferred that the vehicle vibration acceleration can reflect the stiffness of the pavement structure to a certain extent, but the exact relationship between the two needs further research and analysis. This may be due to the lightweight of the test car and the insufficient sensitivity of the structure. Subsequent tests can be carried out with heavier vehicles in order to have a higher sensitivity to structural performance.

Author Contributions

Conceptualization, W.W.; funding acquisition, Q.Y.; investigation, W.W. and S.Z.; methodology, W.W.; software, Q.Y.; writing—original draft, S.Z. All authors have read and agreed to the published version of the manuscript.

Funding

This research was funded by National Natural Science Foundation of China, grant number 51778482.

Institutional Review Board Statement

Not applicable.

Informed Consent Statement

Not applicable.

Data Availability Statement

The data presented in this study are available on request from the corresponding author, Wang Weiguo, 230188209@seu.edu.cn.

Conflicts of Interest

The authors declare no conflict of interest.

References

  1. Quqa, S.; Giordano, P.F.; Limongelli, M.P. Shared micromobility-driven modal identification of urban bridges. Autom. Constr. 2021, 134, 104048. [Google Scholar] [CrossRef]
  2. Zhao, H.D.; Wu, D.F.; Zeng, M.Y.; Zhong, S. A Vibration-Based Vehicle Classification System using Distributed Optical Sensing Technology. Transp. Res. Rec. 2018, 2672, 12–23. [Google Scholar] [CrossRef]
  3. Guattari, C.; D’Amico, F.; Benedetto, A. Integrated road pavement survey using GPR and LFWD. In Proceedings of the XIII Internarional Conference on Ground Penetrating Radar, Lecce, Italy, 21–25 June 2010. [Google Scholar]
  4. Mehta, Y.; Roque, R. Evaluation of FWD data for determination of layer moduli of pavements. J. Mater. Civ. Eng. 2003, 15, 25–31. [Google Scholar] [CrossRef]
  5. Lai, J.C.; Liu, J.; Huang, C.W. The Application of Frequency-Temperature Superposition Principle for Back-Calculation of Falling Weight Deflectometer. Appl. Sci. 2020, 10, 132. [Google Scholar] [CrossRef] [Green Version]
  6. Xie, Z.; Cong, L.; Guo, Z. Evaluation of Subsoil Modulus for Asphalt Pavement Based on FWD Deflection Basin Parameter. J. Highw. Transp. Res. Dev. 2009, 26, 28–31. [Google Scholar]
  7. Hou, Y. Evaluation of Layered Material Properties from Measured Surface Deflection. Ph.D. Thesis, University of Utah, Salt Lake, UT, USA, 1977. [Google Scholar]
  8. Li, M.Y.; Wang, H. Development of ANN-GA program for backcalculation of pavement moduli under FWD testing with viscoelastic and nonlinear parameters. Int. J. Pavement Eng. 2019, 20, 490–498. [Google Scholar] [CrossRef]
  9. Seraj, F.; Van Der Zwaag, B.J.; Dilo, A.; Luarasi, T.; Havinga, P. Roads: A road pavement monitoring system for anomaly detection using smart phones. In Lecture Notes in Computer Science (Including Subseries Lecture Notes in Artificial Intelligence and Lecture Notes in Bioinformatics); Springer: Cham, Switzerland, 2016; pp. 128–146. [Google Scholar]
  10. Chuang, Y.; Perng, N.H.; Han, J.Y. Pavement performance monitoring and anomaly recognition based on crowdsourcing spatiotemporal data. Autom. Constr. 2019, 160, 102882. [Google Scholar] [CrossRef]
  11. Liu, C.L.; Wu, D.F.; Li, Y.S.; Jiang, S.C.; Du, Y.C. Mathematical insights into the relationship between pavement roughness and vehicle vibration. Int. J. Pavement Eng. 2020. [Google Scholar] [CrossRef]
  12. Harikrishnan, P.M.; Gopi, V.P. Vehicle Vibration Signal Processing for Road Surface Monitoring. IEEE Sens. J. 2017, 17, 5192–5197. [Google Scholar] [CrossRef]
  13. Yang, Q.; Zhou, S.S. Identification of asphalt pavement transverse cracking based on vehicle vibration signal analysis. Road Mater. Pavement Des. 2021, 20, 1780–1798. [Google Scholar] [CrossRef]
  14. Mednis, A.; Strazdins, G.; Zviedris, R.; Kanonirs, G.; Selavo, L. Real time pothole detection using Android smartphones with accelerometers. In Proceedings of the 2011 International Conference on Distributed Computing in Sensor Systems (DCOSS 2011), Barcelona, Spain, 27–29 June 2011. [Google Scholar]
  15. Yang, Y.B.; Lin, C.W.; Yau, J.D. Extracting bridge frequencies from the dynamic response of a passing vehicle. J. Sound. Vib. 2004, 272, 471–493. [Google Scholar] [CrossRef]
  16. Lin, C.W.; Yang, Y.B. Use of a passing vehicle to scan the fundamental bridge frequencies: An experimental verification. Eng. Struct. 2005, 27, 1865–1878. [Google Scholar] [CrossRef]
  17. Yang, Y.B.; Yau, J.D.; Urushadze, S. Scanning the modal coupling of slender suspension footbridges by a virtual moving vehicle. Eng. Struct. 2019, 180, 574–585. [Google Scholar] [CrossRef]
  18. Yang, Y.; Jia, B.Y.L. Structural damage identification of a bridge from a passing test vehicle using frequency domain method. In Mechanics of Structures and Materials: Advancements and Challenges, Proceedings of the 24th Australasian Conference on the Mechanics of Structures and Materials, ACMSM24 2016, Perth, Australia, 6–9 December 2016; CRC Press/Balkem: Perth, Australia, 2017; pp. 1125–1130. [Google Scholar]
  19. Yang, Y.B.; Yang, J.P. State-of-the-Art Review on Modal Identification and Damage Detection of Bridges by Moving Test Vehicles. Int. J. Struct. Stab. Dyn. 2018, 18, 1850025. [Google Scholar] [CrossRef]
  20. Cerda, F.; Garrett, J.; Bielak, J.; Barrera, J.; Zhuang, Z.; Chen, S.; McCann, M.; Kovaevi, J.; Rizzo, P. Indirect structural health monitoring in bridges: Scale experiments. In Proceedings of the Sixth International Conference on Bridge Maintenance, Safety and Management, Stresa, Italy, 8–12 July 2012; pp. 346–353. [Google Scholar]
  21. Liu, J.; Chen, B.; Chen, S.; Berges, M.; Bielak, J.; Noh, H. Damage-Sensitive and Domain-Invariant Feature Extraction for Vehicle-Vibration-Based Bridge Health Monitoring. In Proceedings of the ICASSP, IEEE International Conference on Acoustics, Speech and Signal Processing, Barcelona, Spain, 4–8 May 2020; pp. 3007–3011. [Google Scholar]
  22. Feng, M.; Fukuda, Y.; Mizuta, M.; Ozer, E. Citizen sensors for SHM: Use of accelerometer data from smartphones. Sensors 2015, 15, 2980–2998. [Google Scholar] [CrossRef] [PubMed] [Green Version]
  23. McGetrick, P.J.; Hester, D.; Taylor, S.E. Implementation of a drive-by monitoring system for transport infrastructure utilising smartphone technology and GNSS. J. Civ. Struct. Health Monit. 2017, 7, 175–189. [Google Scholar] [CrossRef] [Green Version]
  24. Du, Y.C.; Liu, C.L.; Wu, D.F.; Jiang, S.C. Measurement of International Roughness Index by Using Z-Axis Accelerometers and GPS. Math. Probl. Eng. 2014, 2014, 928980. [Google Scholar] [CrossRef] [PubMed] [Green Version]
  25. Wang, J.; Tang, X. Wavelet Denoise Method Applied in Load Spectrum Analysis of Engineering Vehicles. Adv. Mater. Res. 2010, 108, 1320–1325. [Google Scholar] [CrossRef]
  26. David, S.M.; William, N. Methods of describing correlations: Scatter diagrams and correlation coefficients. In Statistics: Concepts and Controversies, 8th ed.; CMC Publishing House: Golden, CO, USA, 2017; pp. 280–385. [Google Scholar]
Figure 1. FWD field test and the schematic diagram. (a) FWD field test. (b) The schematic diagram of FWD test.
Applsci 12 00683 g001
Figure 2. The vibration sensor.
Applsci 12 00683 g002
Figure 3. The motion camera.
Applsci 12 00683 g003
Figure 4. Deflection basin of each test. (a) The first test. (b) The second test. (c) The third test.
Applsci 12 00683 g004
Figure 5. D1 of five sections in three tests.
Applsci 12 00683 g005
Figure 6. The vehicle acceleration when only the engine is running and when driving on a pavement.
Applsci 12 00683 g006
Figure 7. The time-domain diagram of the acceleration at the first test.
Applsci 12 00683 g007
Figure 8. The probability density histogram of vehicle acceleration.
Applsci 12 00683 g008
Figure 9. The normal fitting diagram of the probability density of vehicle acceleration. (a) The first test. (b) The second test. (c) The third test. (d) The fourth test.
Applsci 12 00683 g009aApplsci 12 00683 g009b
Figure 10. Relationship between PPD and D1.
Applsci 12 00683 g010
Table 1. Basic parameters of the test section.
SectionLengthStructureCross-Section
1200 mContinuously reinforced composite pavement ATwo-way 4-lane
2200 mContinuously reinforced composite pavement BTwo-way 6-lane
3200 mContinuously reinforced composite pavement B + semi-rigid base pavementTwo-way 6-lane
4200 mContinuously reinforced composite pavement CTwo-way 6-lane
5200 mSemi-rigid base pavementTwo-way 6-lane
Table 2. Schematic diagram of the pavement structures.
Section 1Section 2Section 3Section 4Section 5
4 cm SMA-13
(SBS modified)
4 cm SMA-13
(SBS modified)
4 cm SMA-13
(SBS modified)
4 cm SMA-13
(SBS modified)
4 cm SMA-13
(SBS modified)
4 cm SMA-13
(SBS modified)
6 cm AC-20C
(anti-rutting agent)
6 cm AC-20C
(anti-rutting agent)
6 cm AC-20C
(anti-rutting agent)
6 cm AC-20C
(anti-rutting agent)
6 cm AC-20C
(anti-rutting agent)
6 cm AC-20C
(anti-rutting agent)
26 cm continuously reinforced concrete26 cm continuously reinforced concrete8 cm AC-25C
(rock asphalt modification)
26 cm continuously reinforced concrete26 cm continuously reinforced concrete8 cm AC-25C
(rock asphalt modification)
----0.6 cm slurry seal--0.6 cm slurry seal0.6 cm slurry seal
20 cm cold regeneration (three-slag base regeneration)20 cm plain concrete40 cm cement stabilized macadam20 cm plain concrete40 cm cement stabilized crushed stone leveling layer40 cm cement stabilized macadam
20 cm graded gravel
Table 3. Date and temperature.
Test1st2nd3rd4th
Date23 September 20189 September 201920 September 202021 May 2021
Temperature22~27 °C23~28 °C21~27 °C22~27 °C
Table 4. Correlation degree of the variable.
|r|0.8~1.00.6~0.80.4~0.60.2~0.40~0.2
Correlation degreeVery strong StrongMiddleWeakVery weak or no correlation
Publisher’s Note: MDPI stays neutral with regard to jurisdictional claims in published maps and institutional affiliations.

