
The Dependence of Ultrasonic Velocity in Ultra-Low Expansion Glass on Temperature

 , ,
, ,
Abstract
:1. Introduction
2. Principle and Method of Ultrasonic Velocity Measurement
2.1. Principle of the Ultrasonic Velocity Measurement
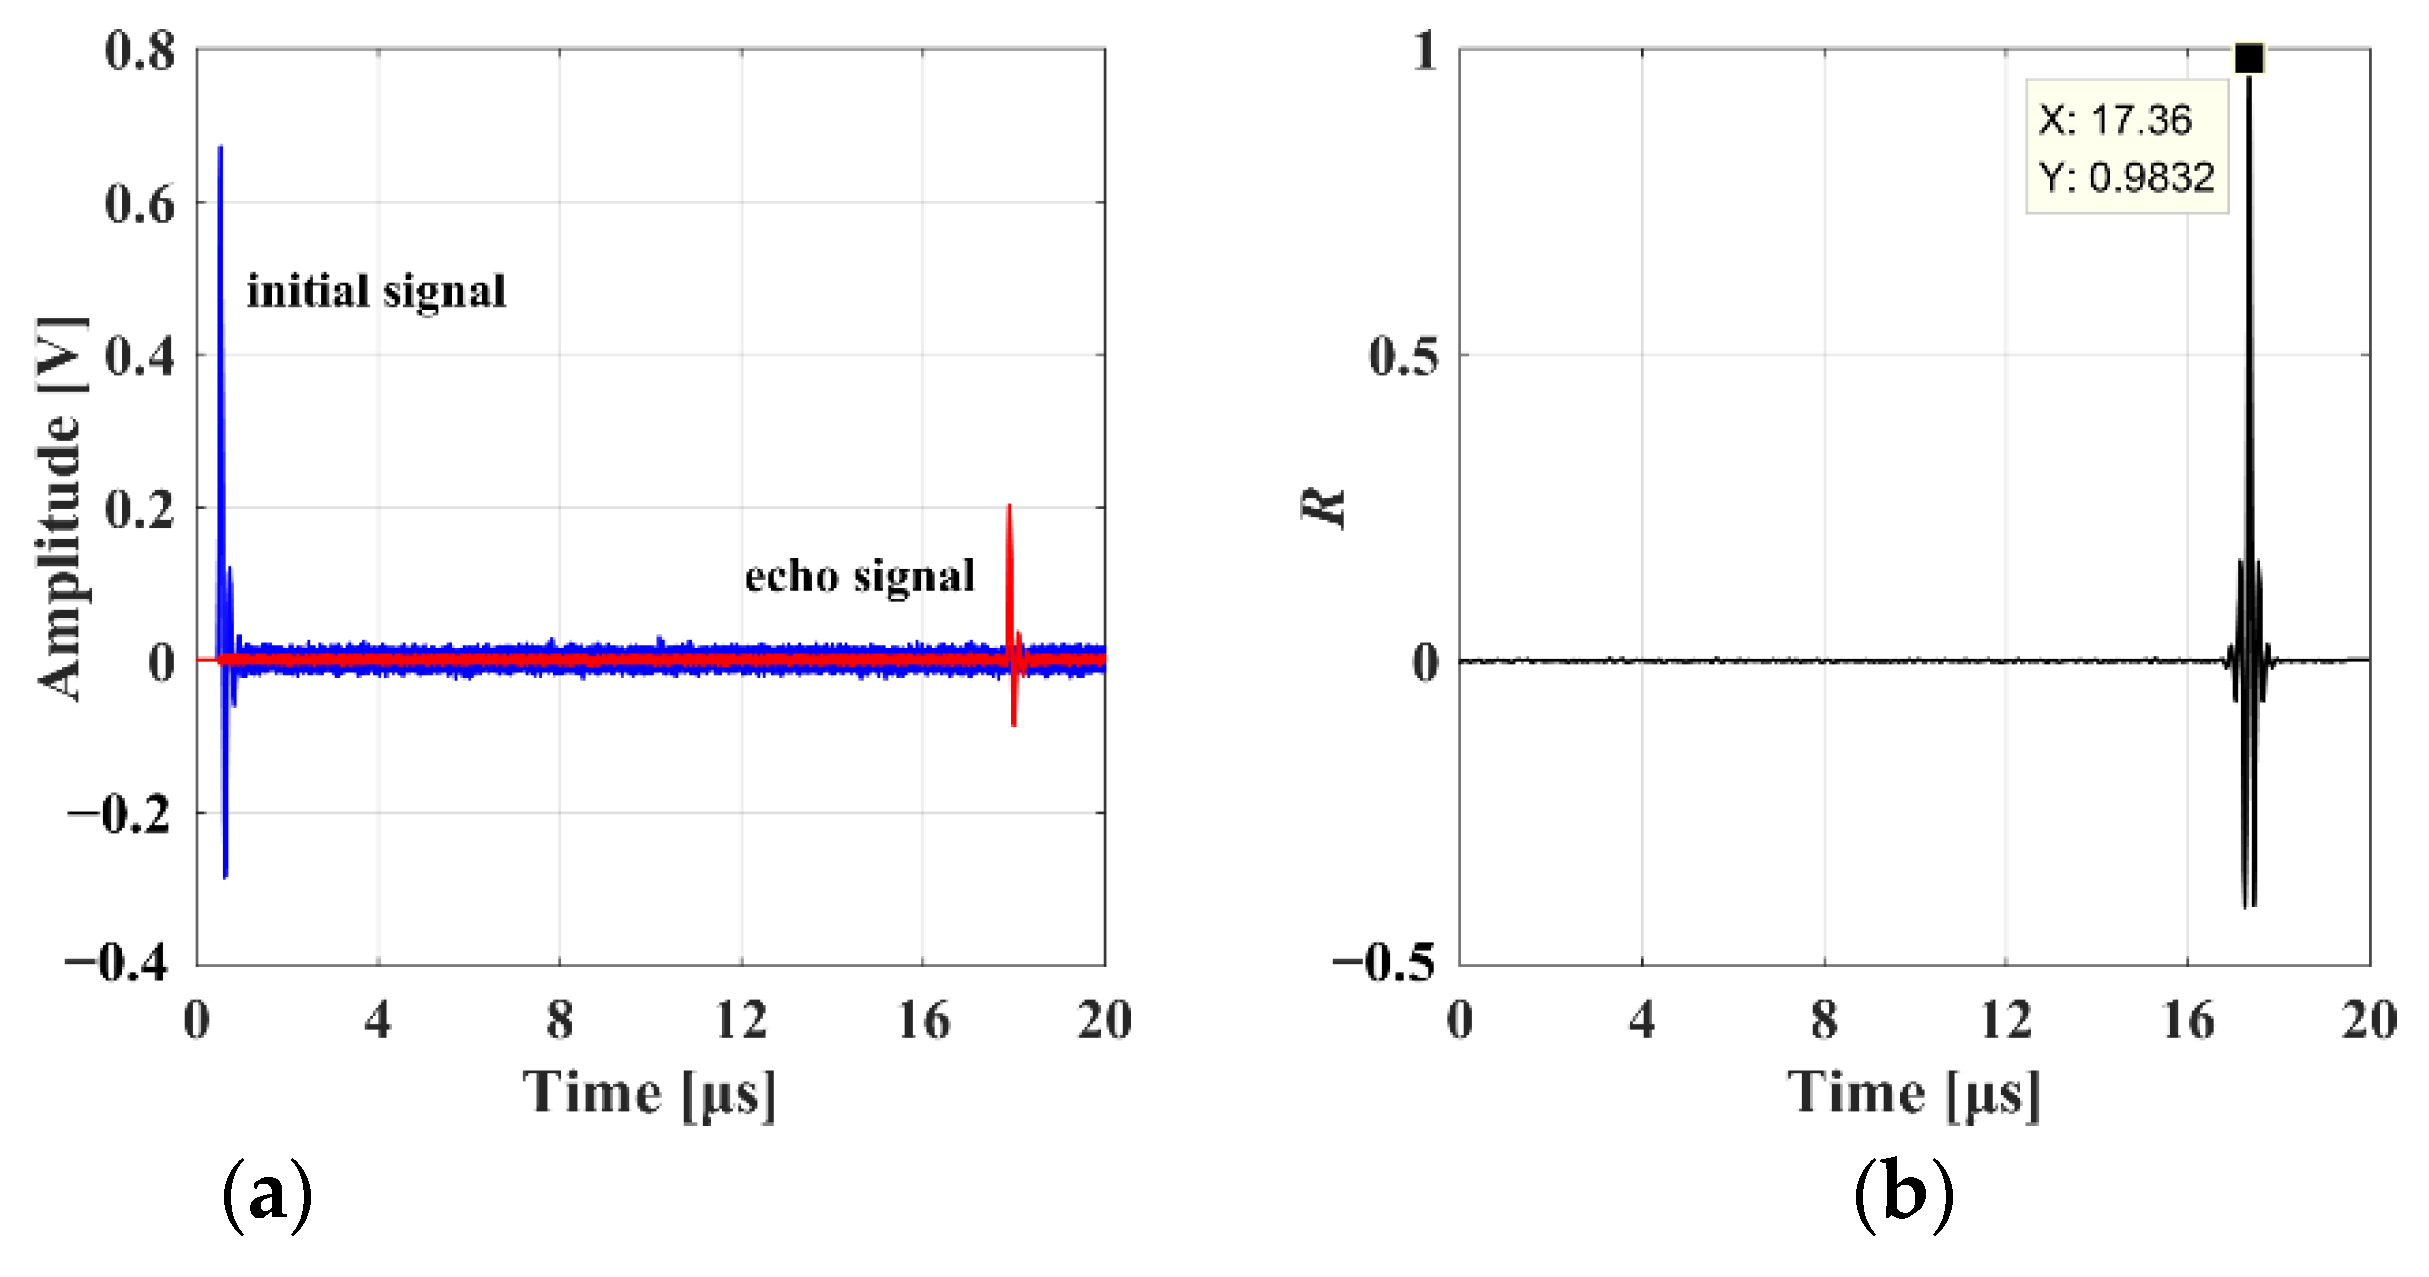
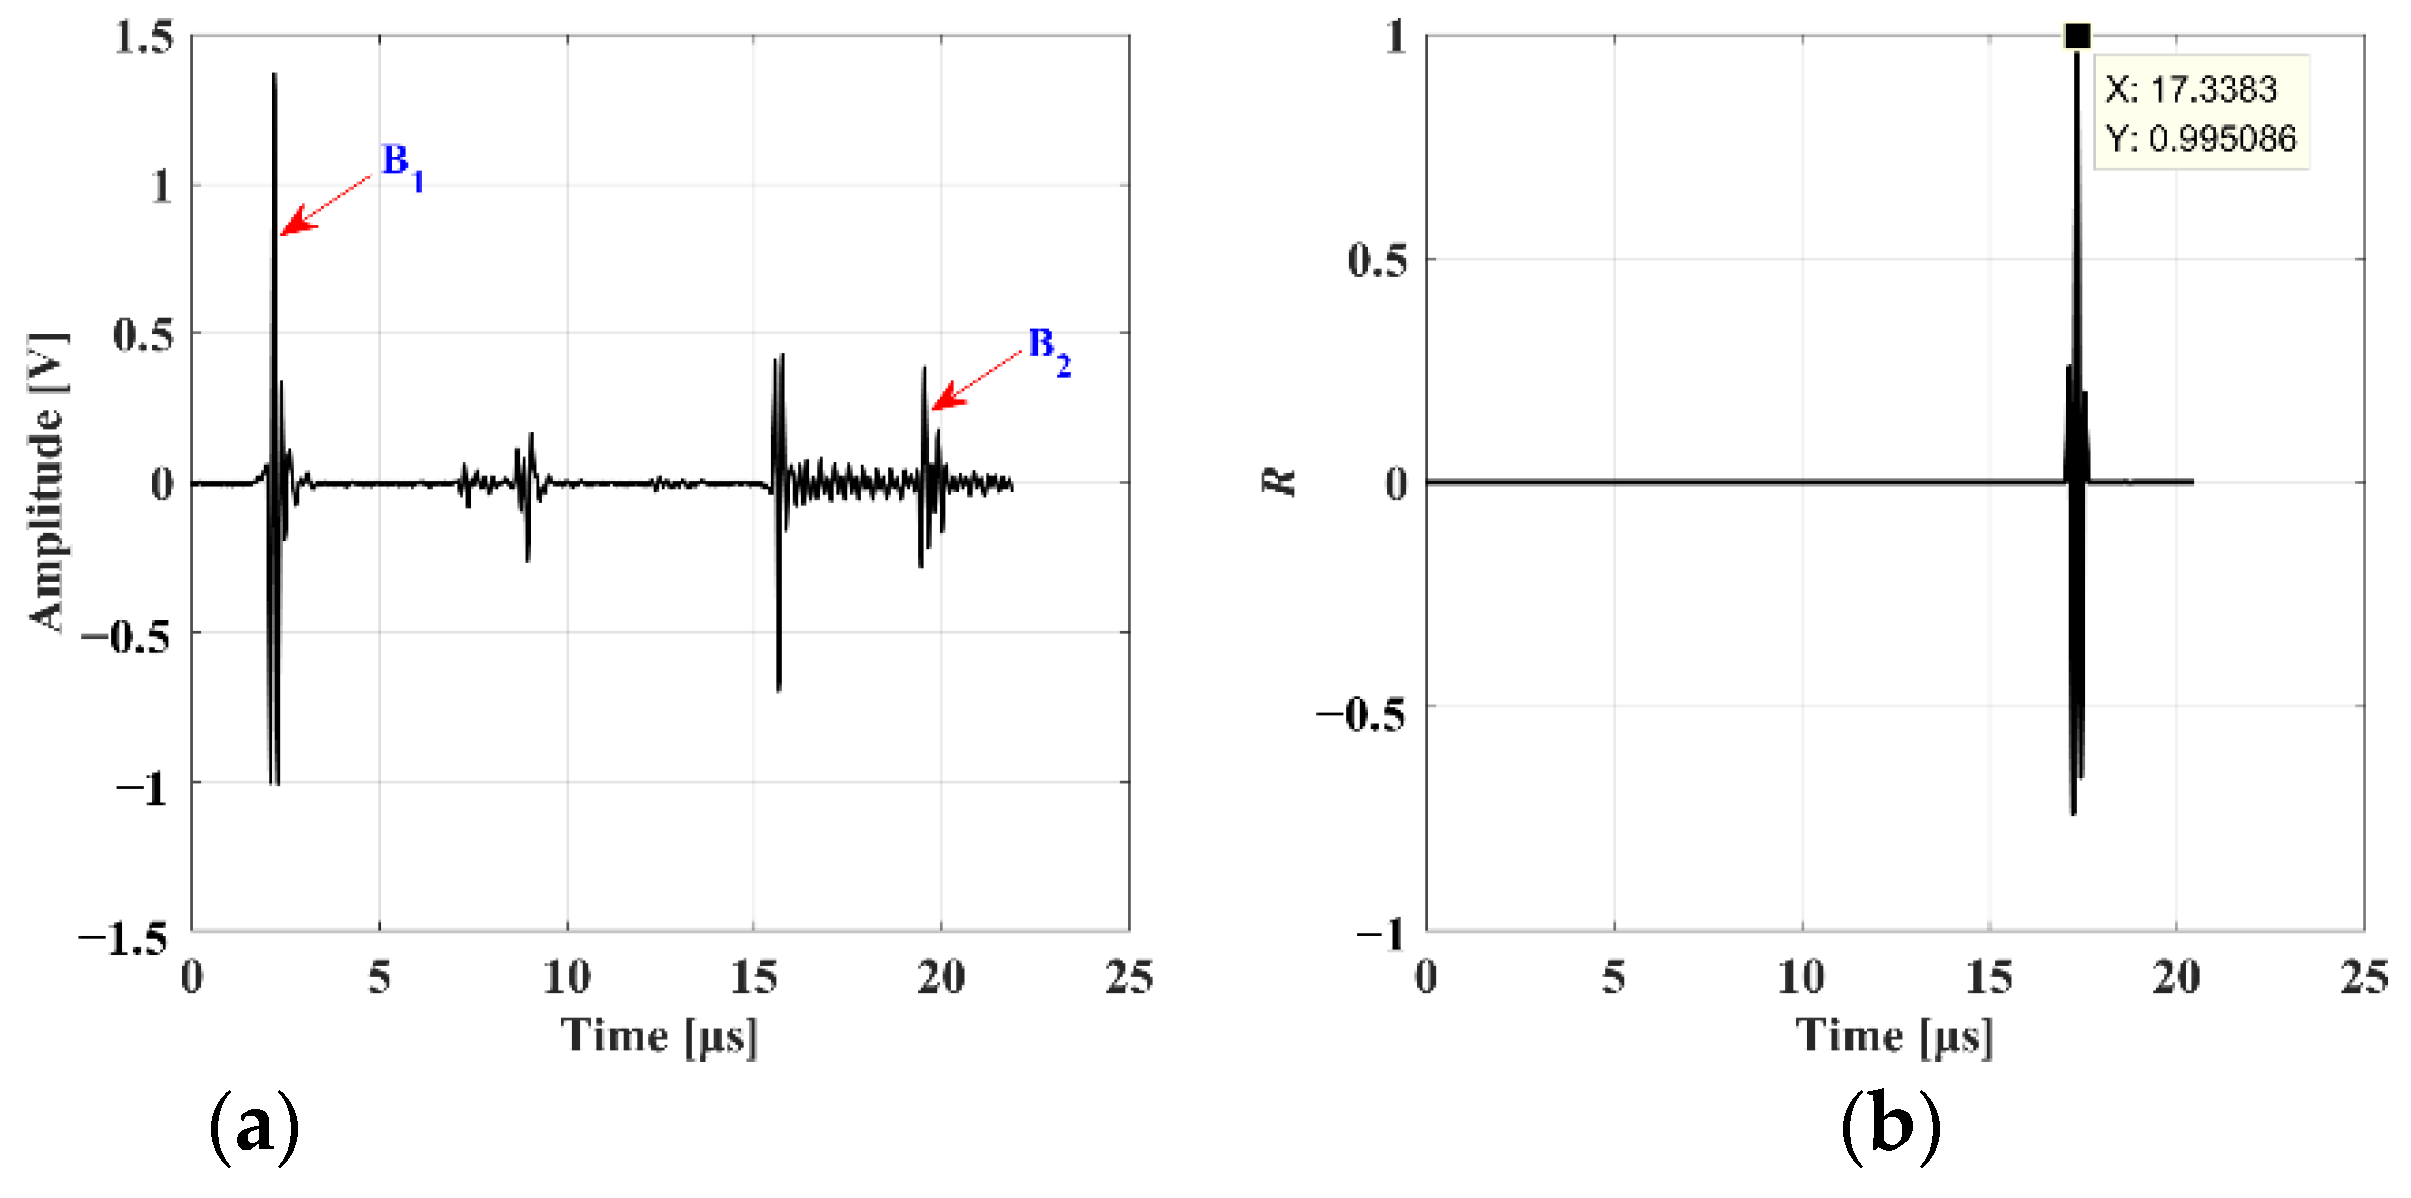
2.2. Correlation Method for Measuring the TOF
2.2.1. The Correlation Calculation Principle
2.2.2. Simulation of the Correlation Method
3. Theoretical Model between Ultrasonic Velocity and Temperature
4. Tested Material and Experimental Setup
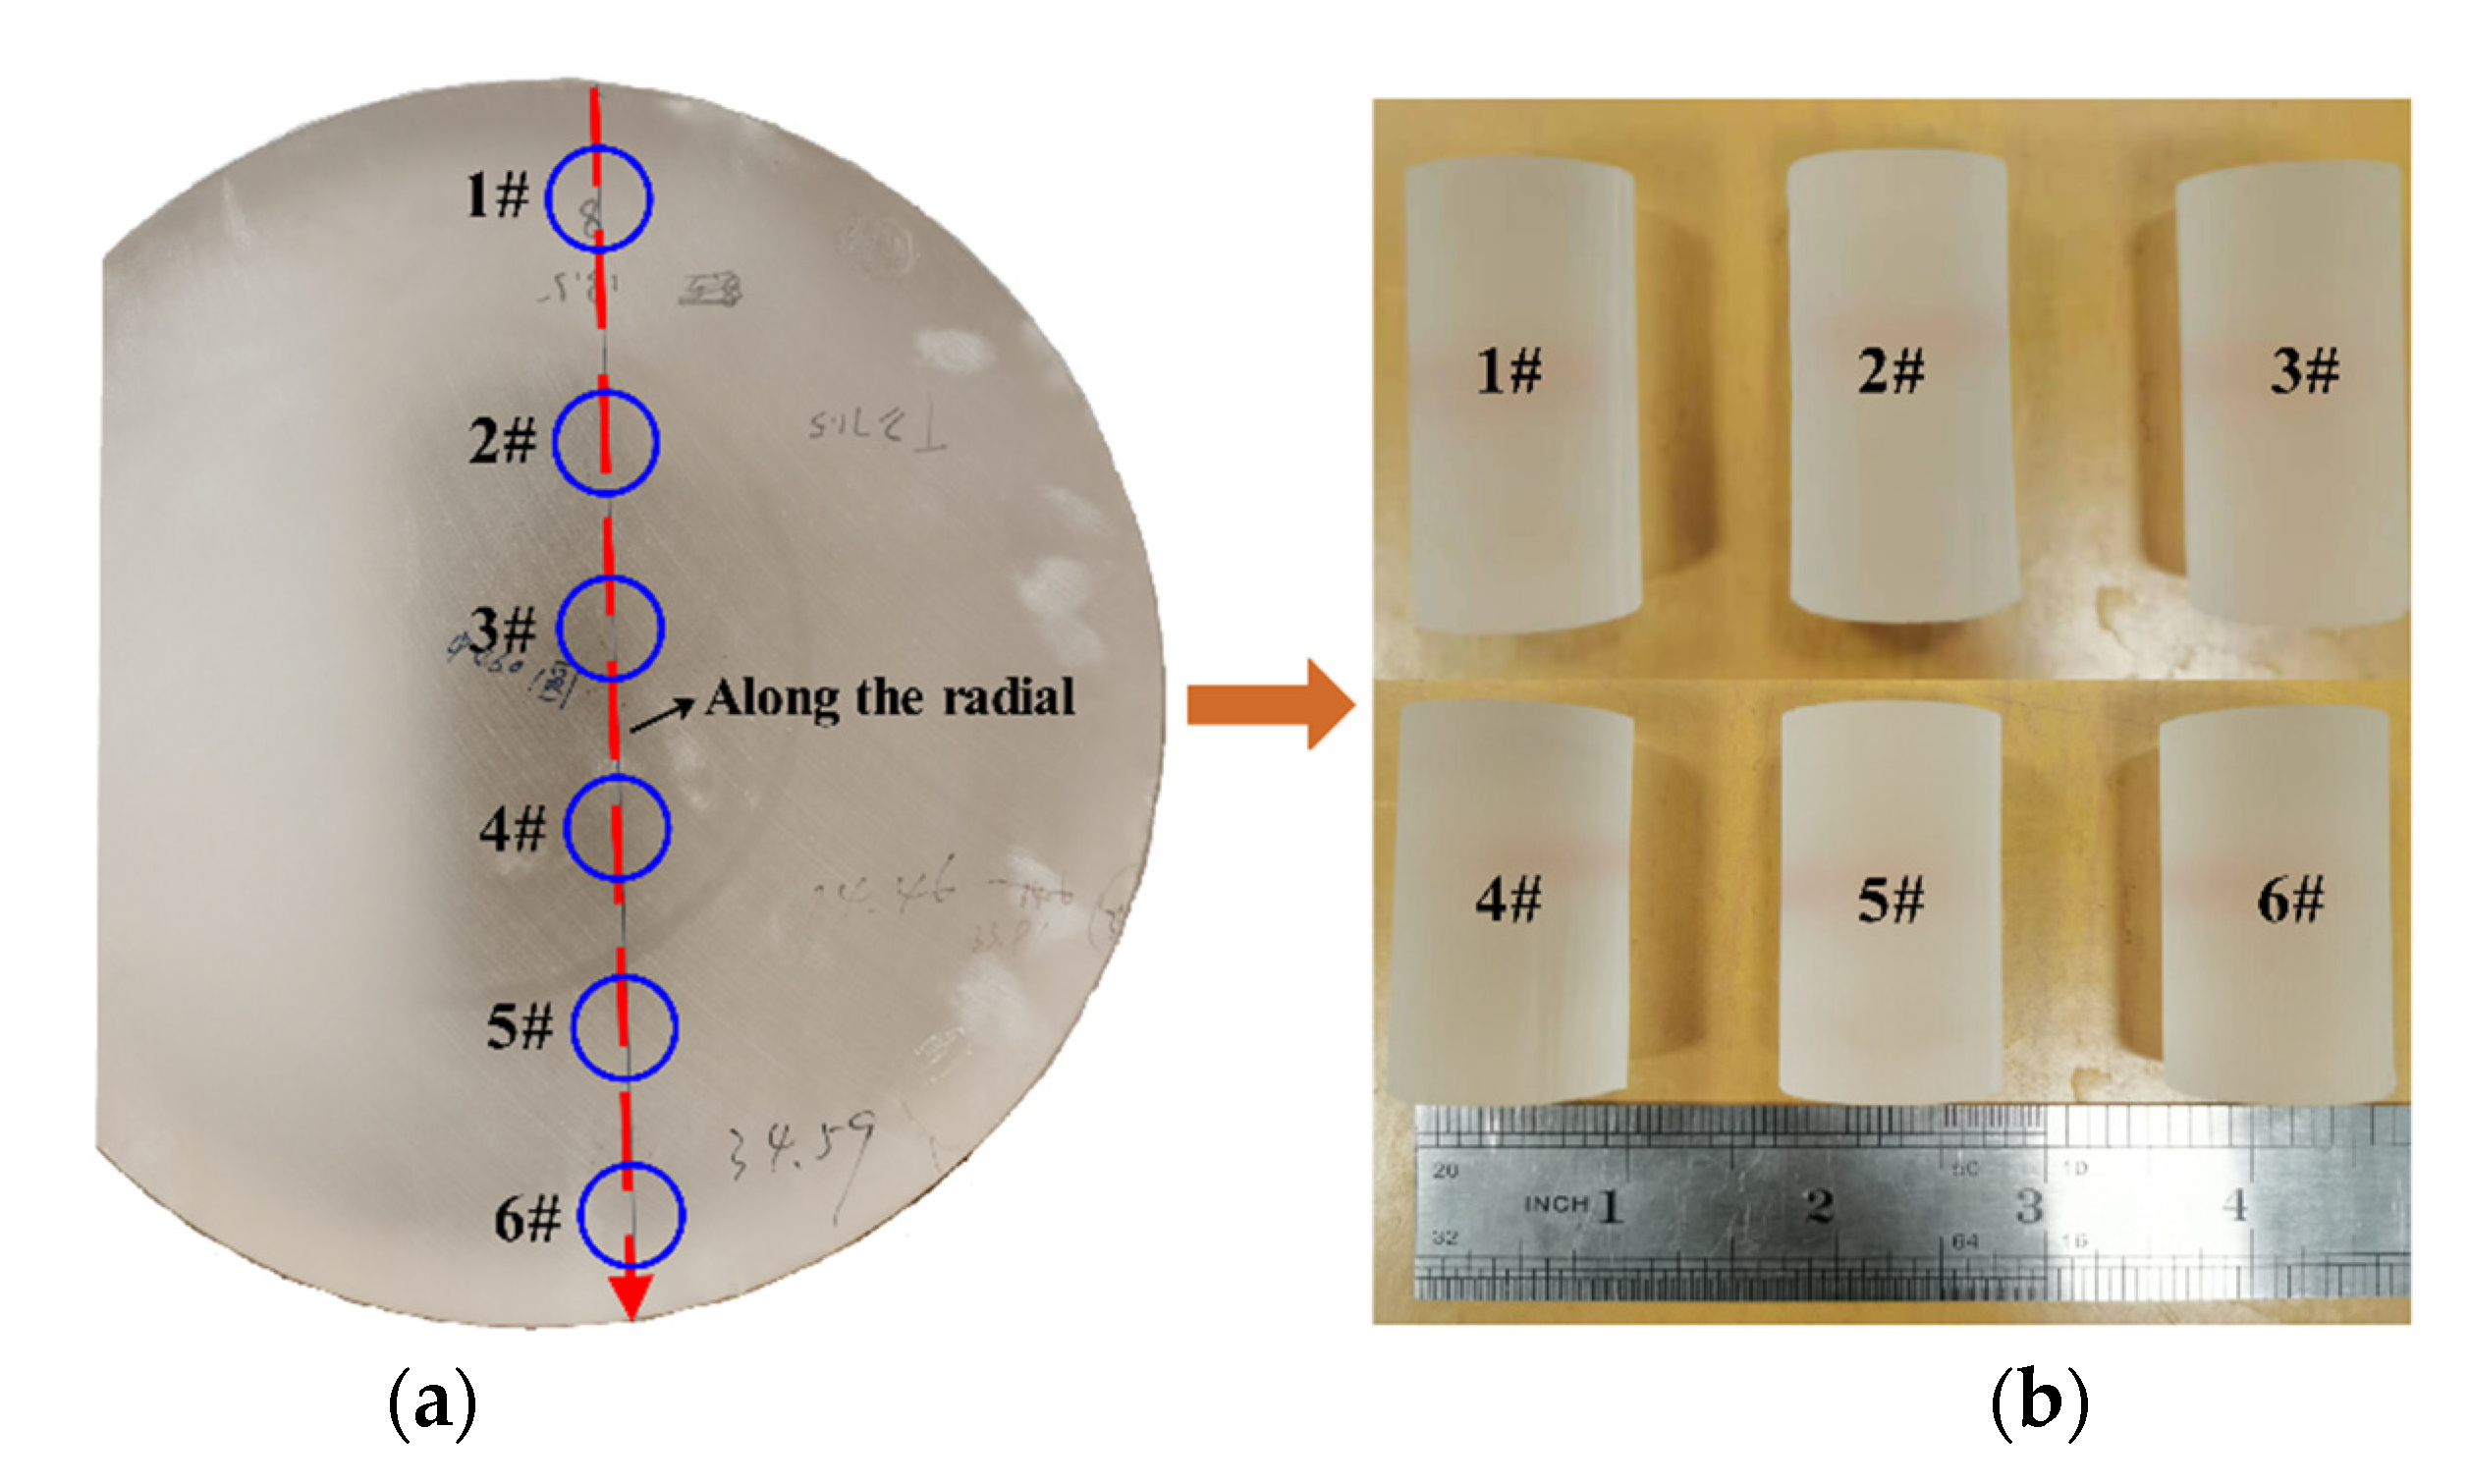
4.1. Materials and Sample Preparation
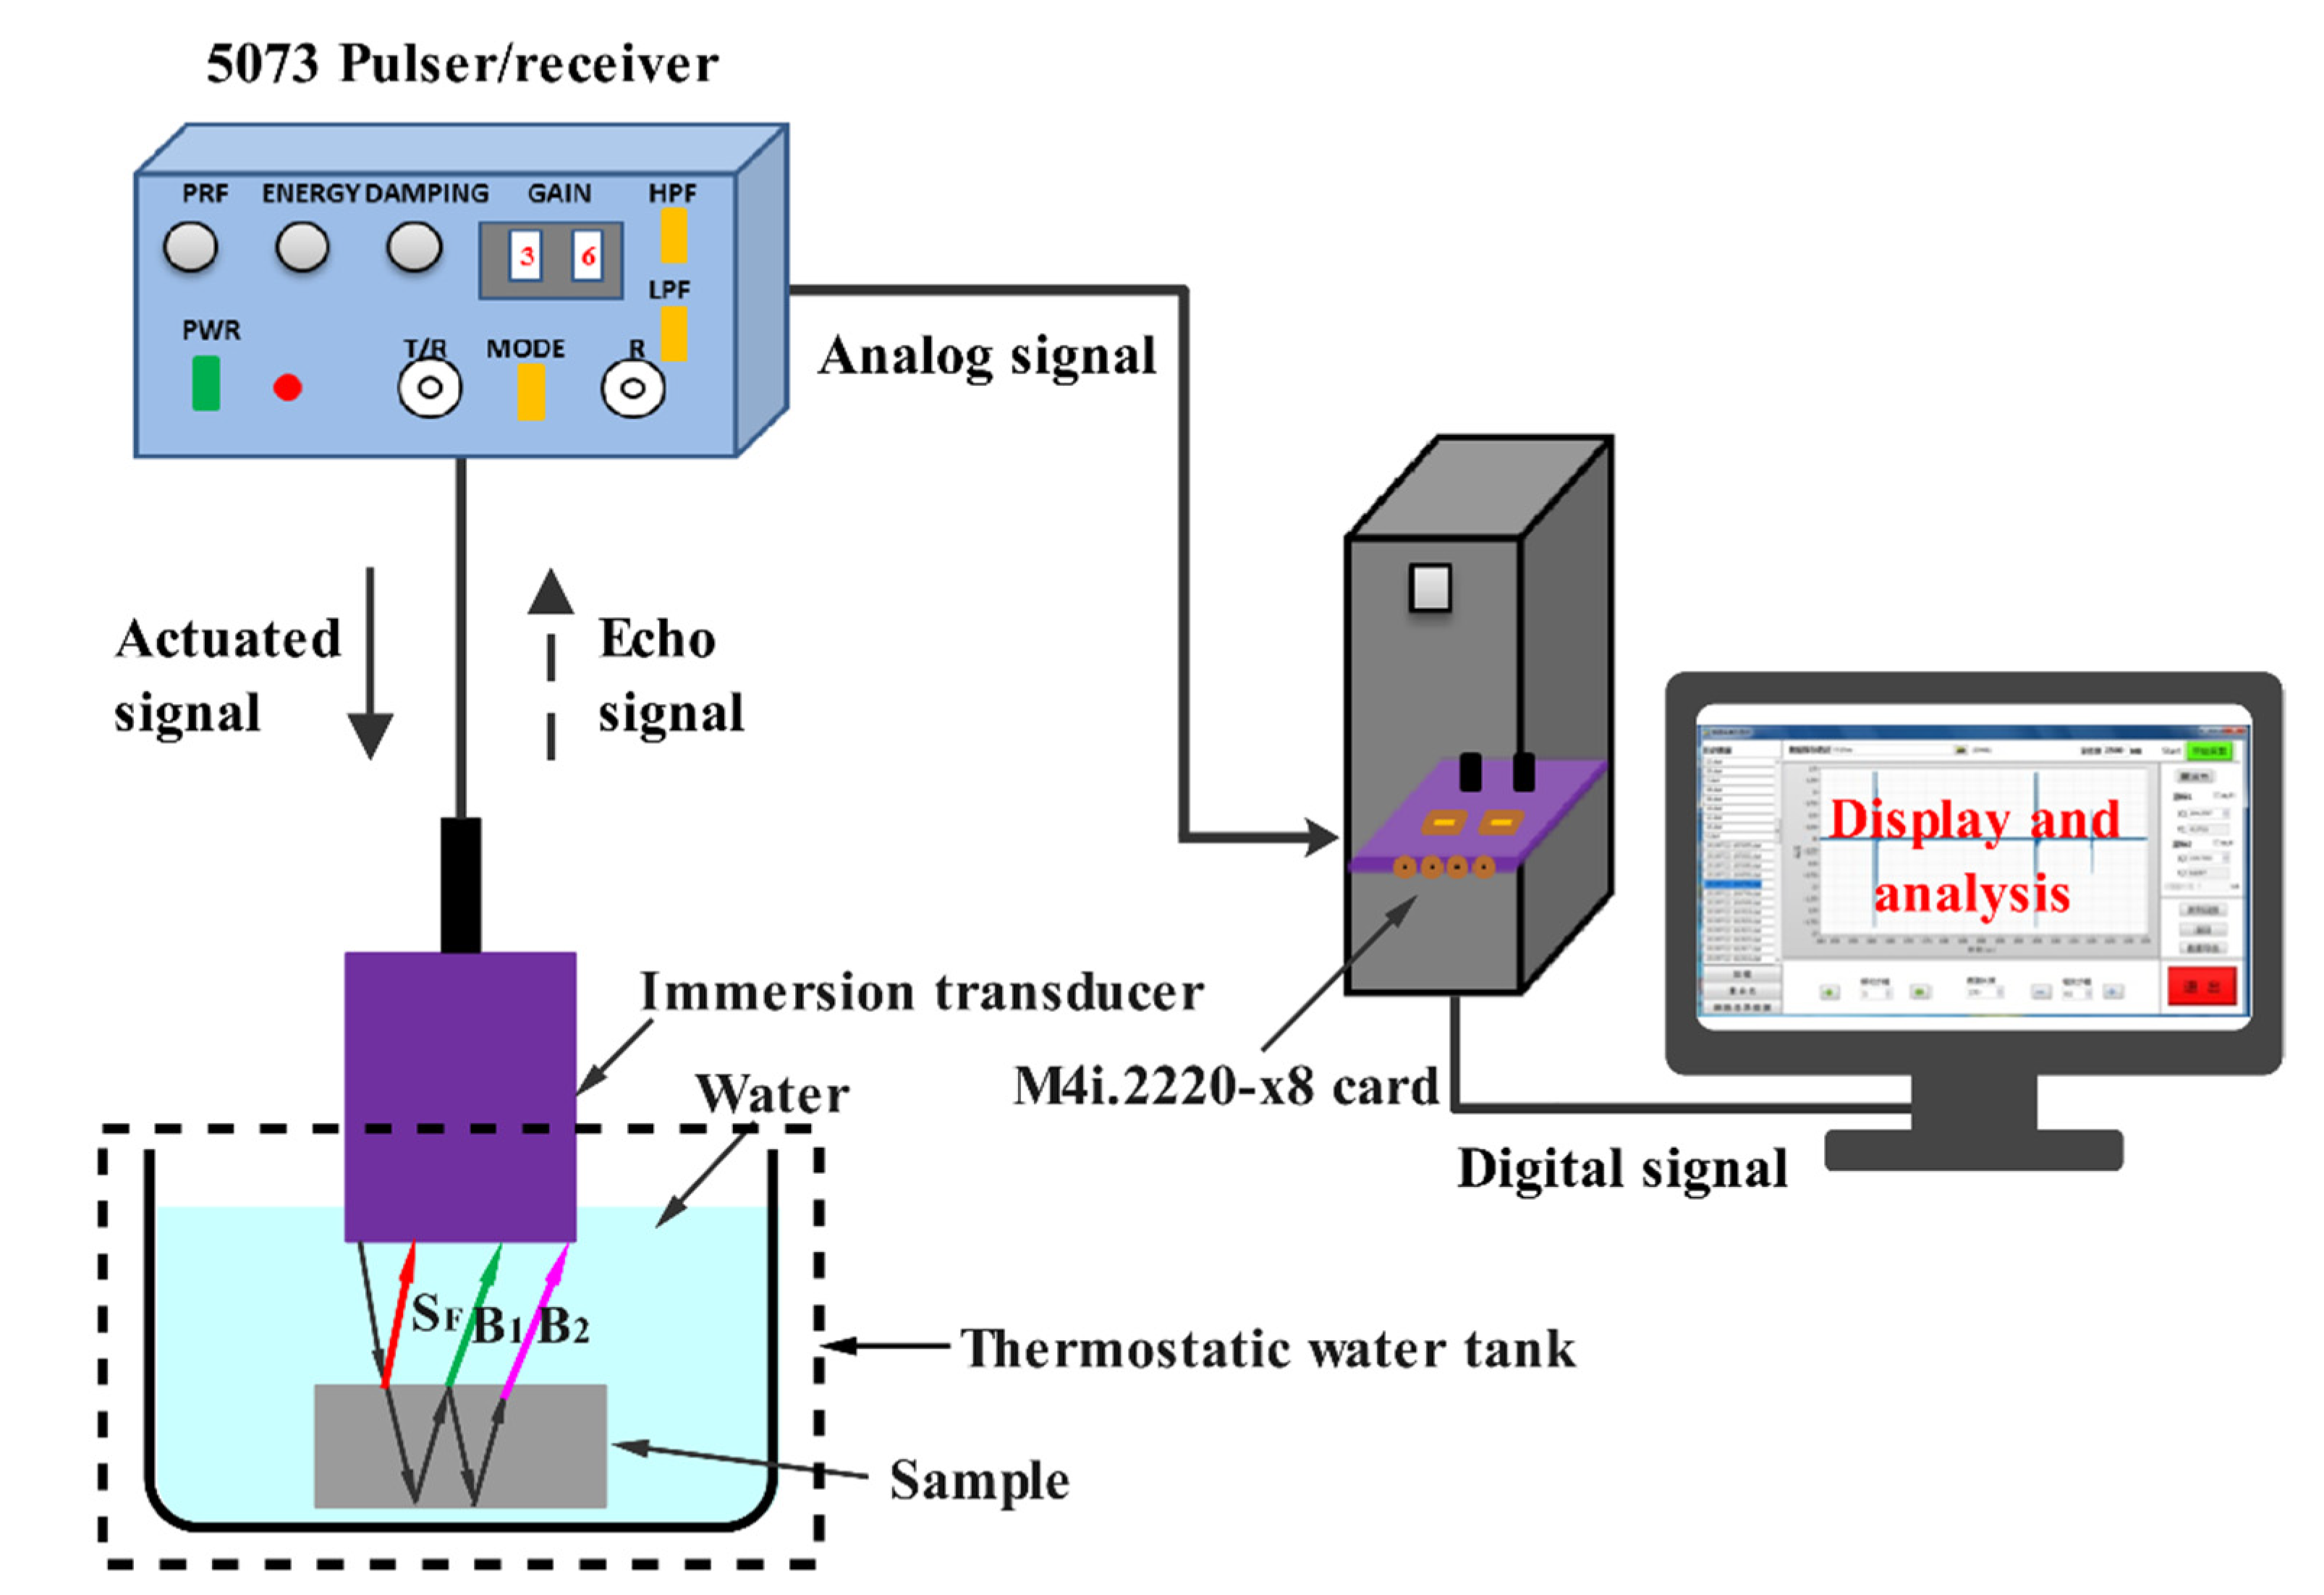
4.2. Ultrasonic Measurement System
5. Results and Discussion
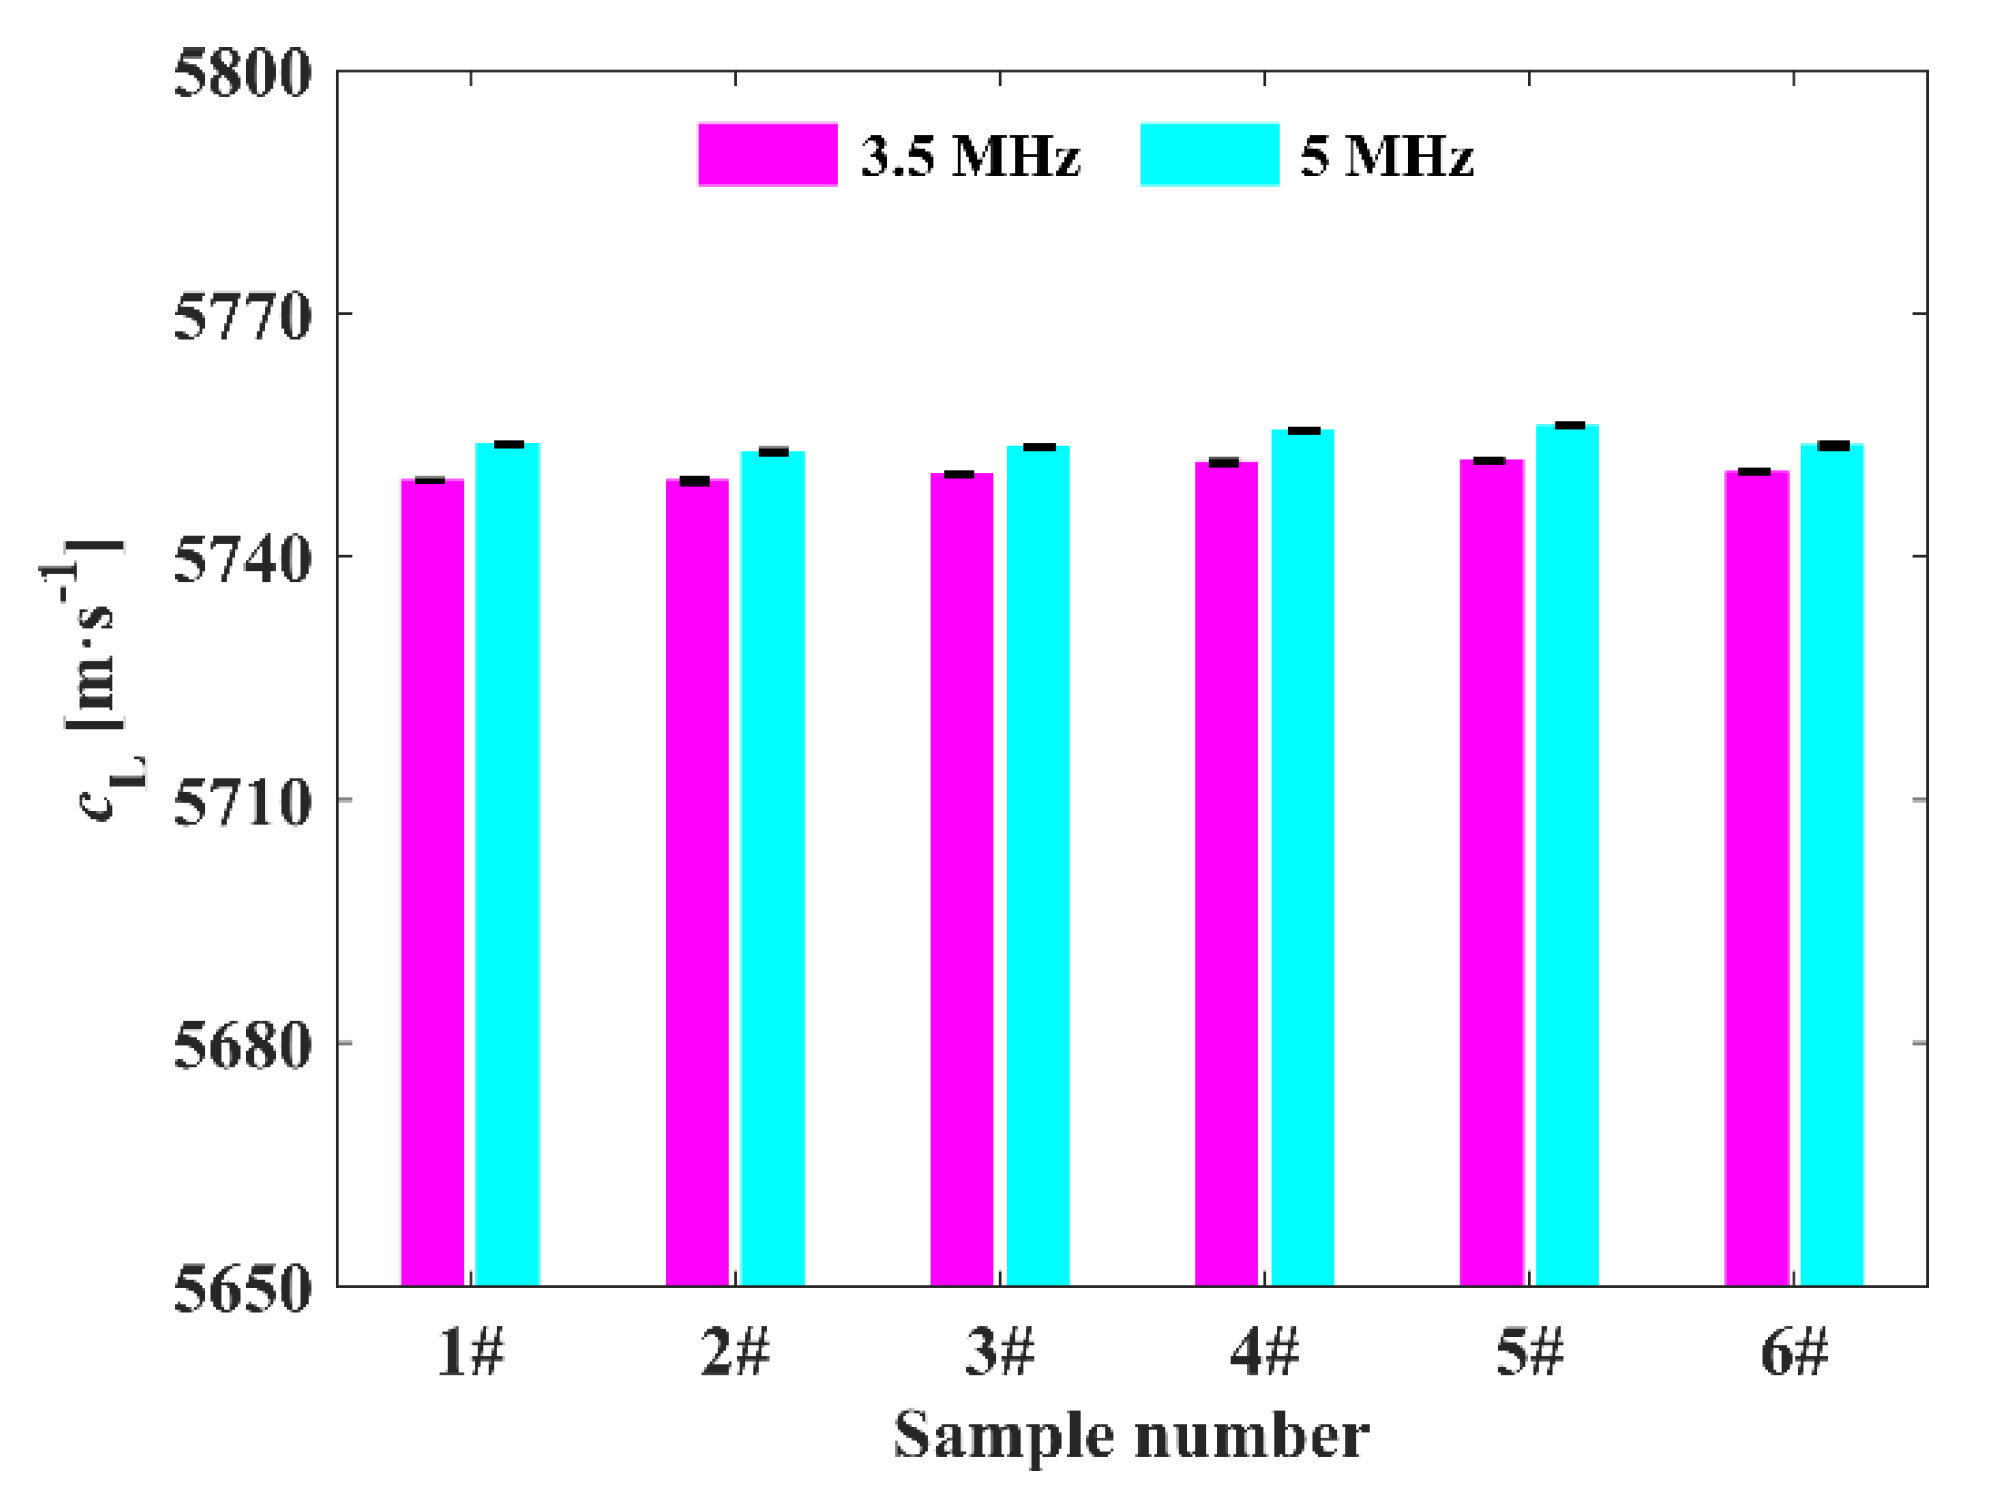
5.1. Measurement at a Single Temperature
5.1.1. Uncertainty Analysis
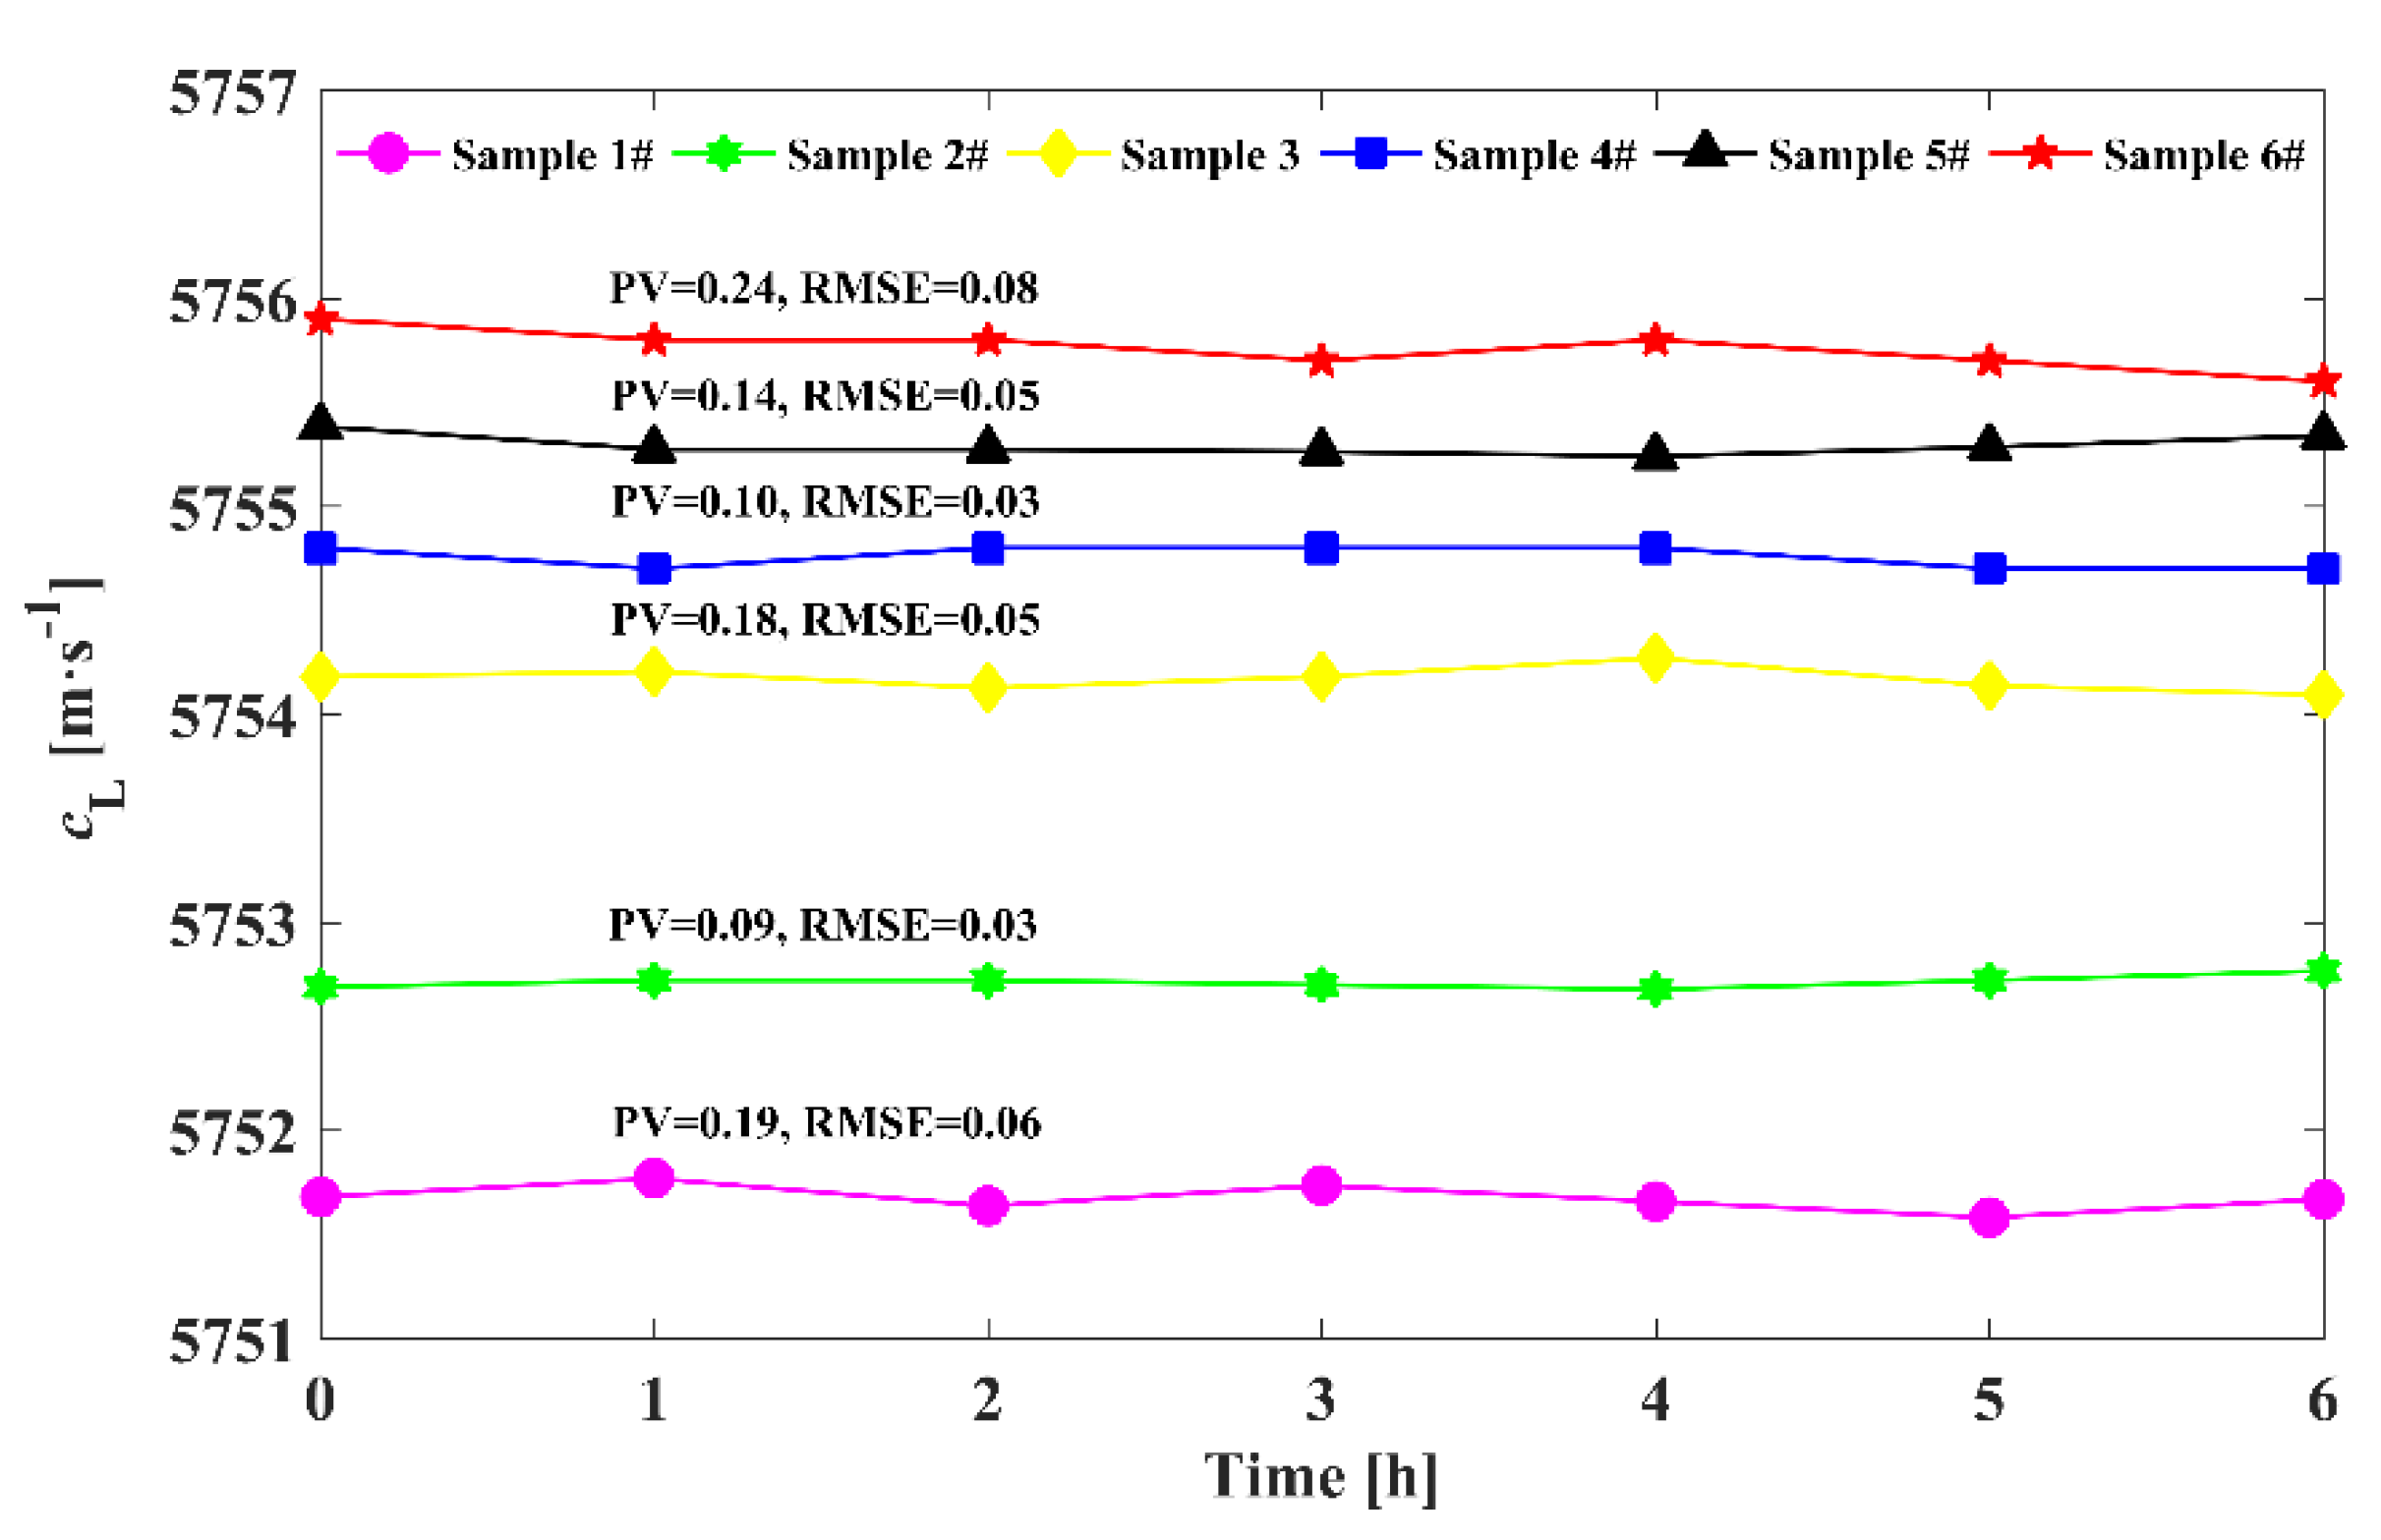
5.1.2. Stability of Measurement
5.2. Measurement and Analysis of –T Data
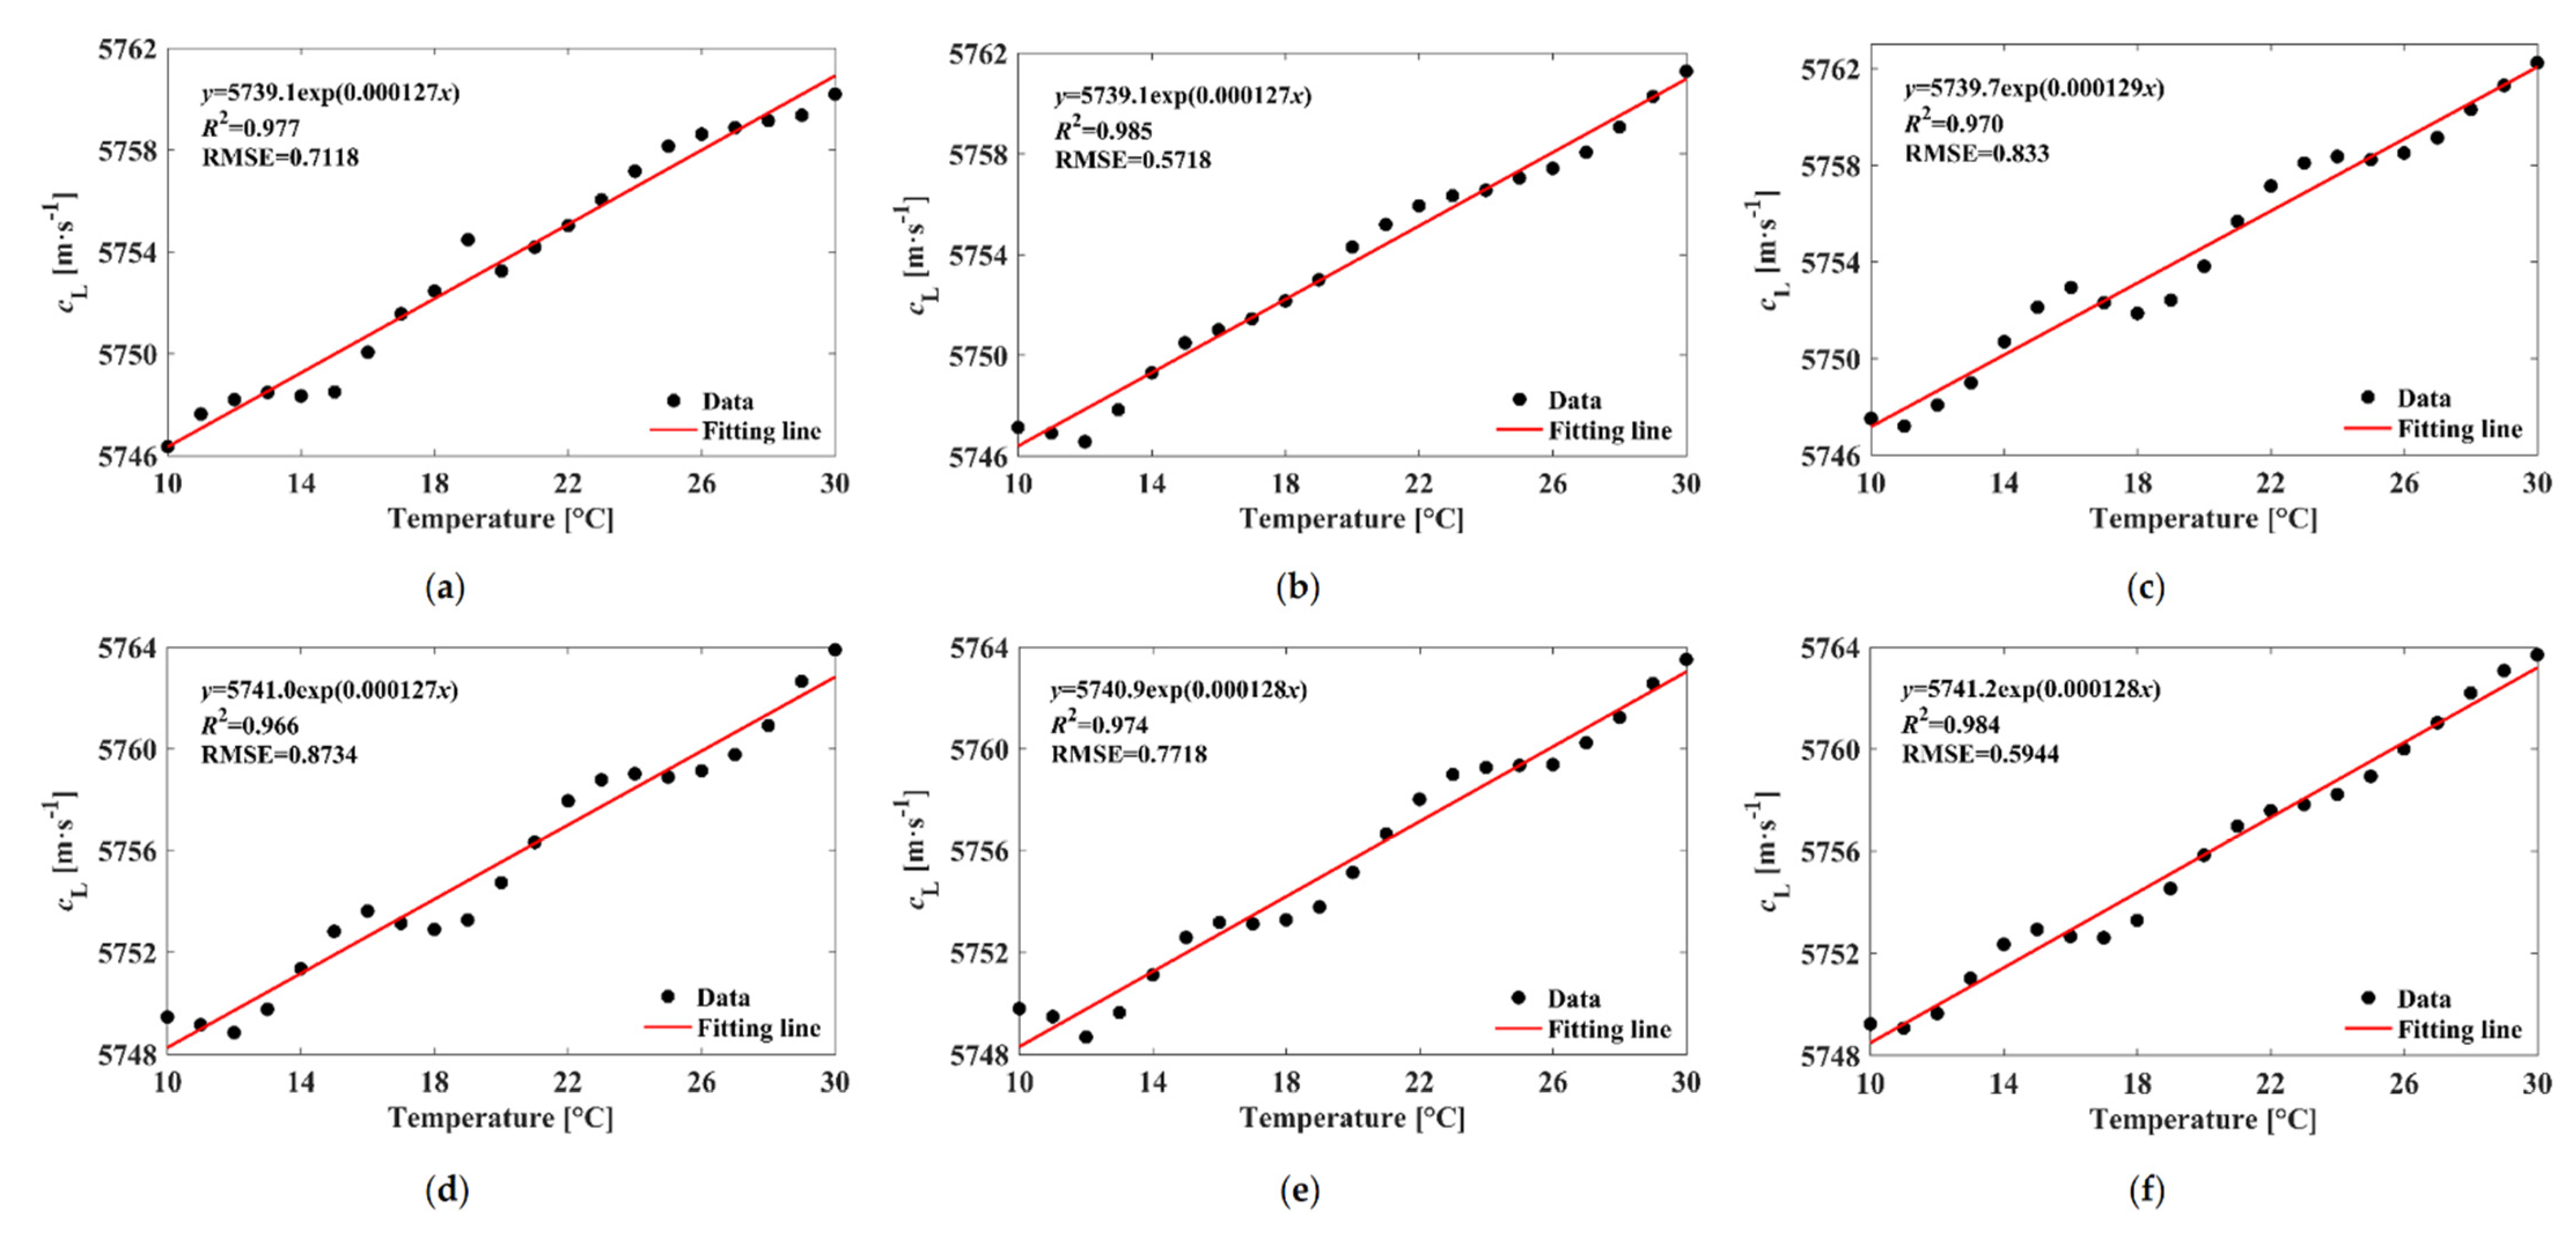
5.2.1. Acquisition of –T Data
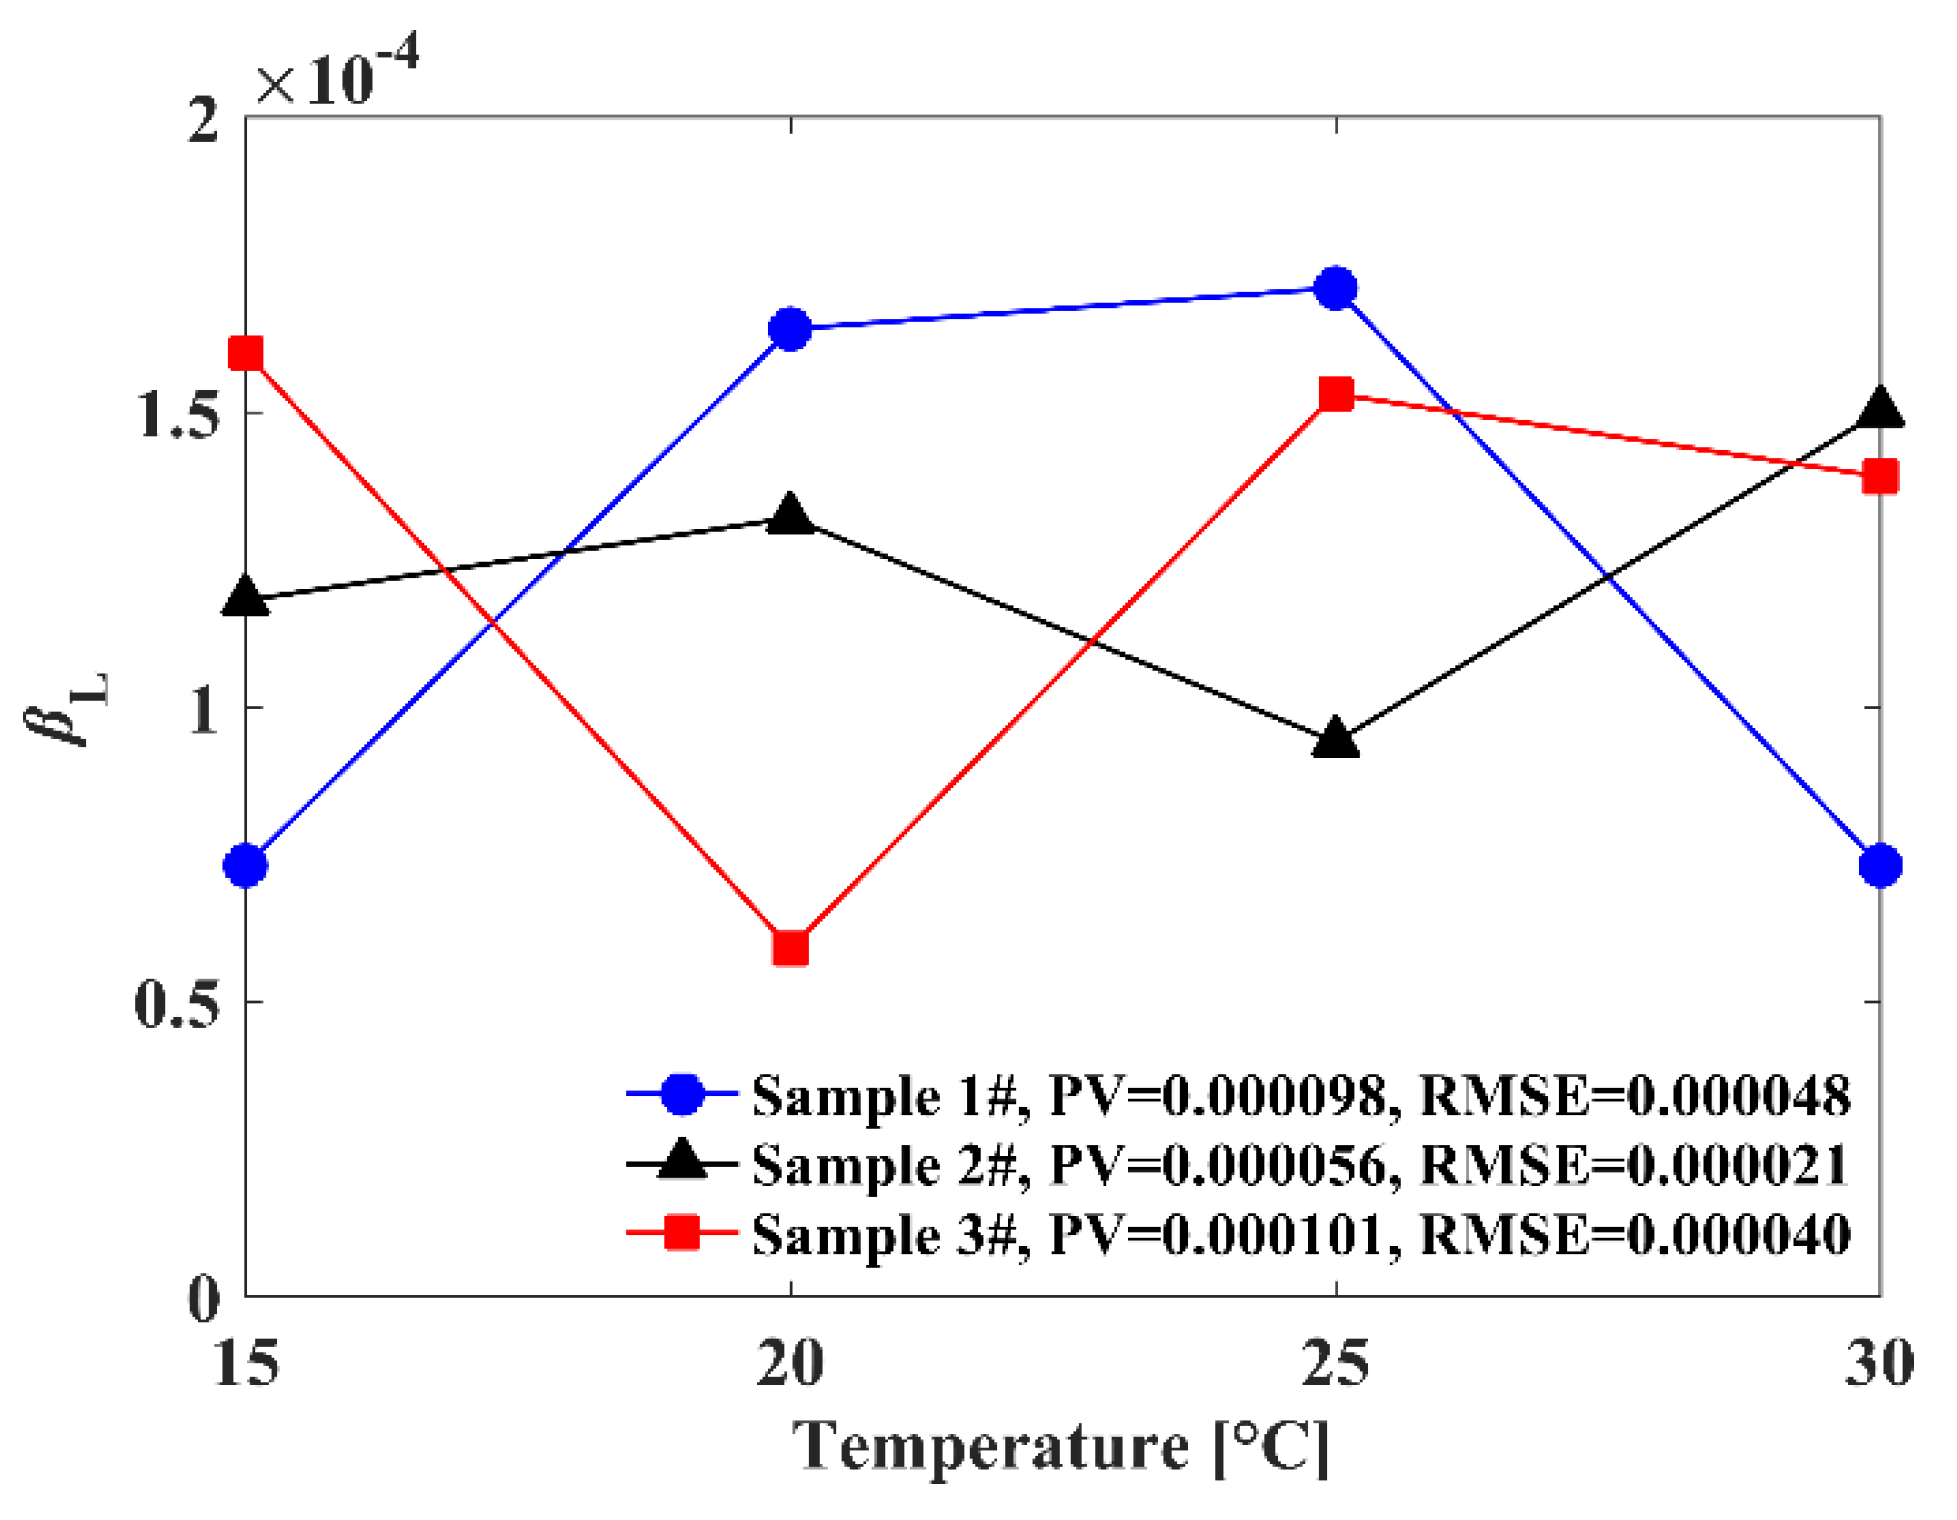
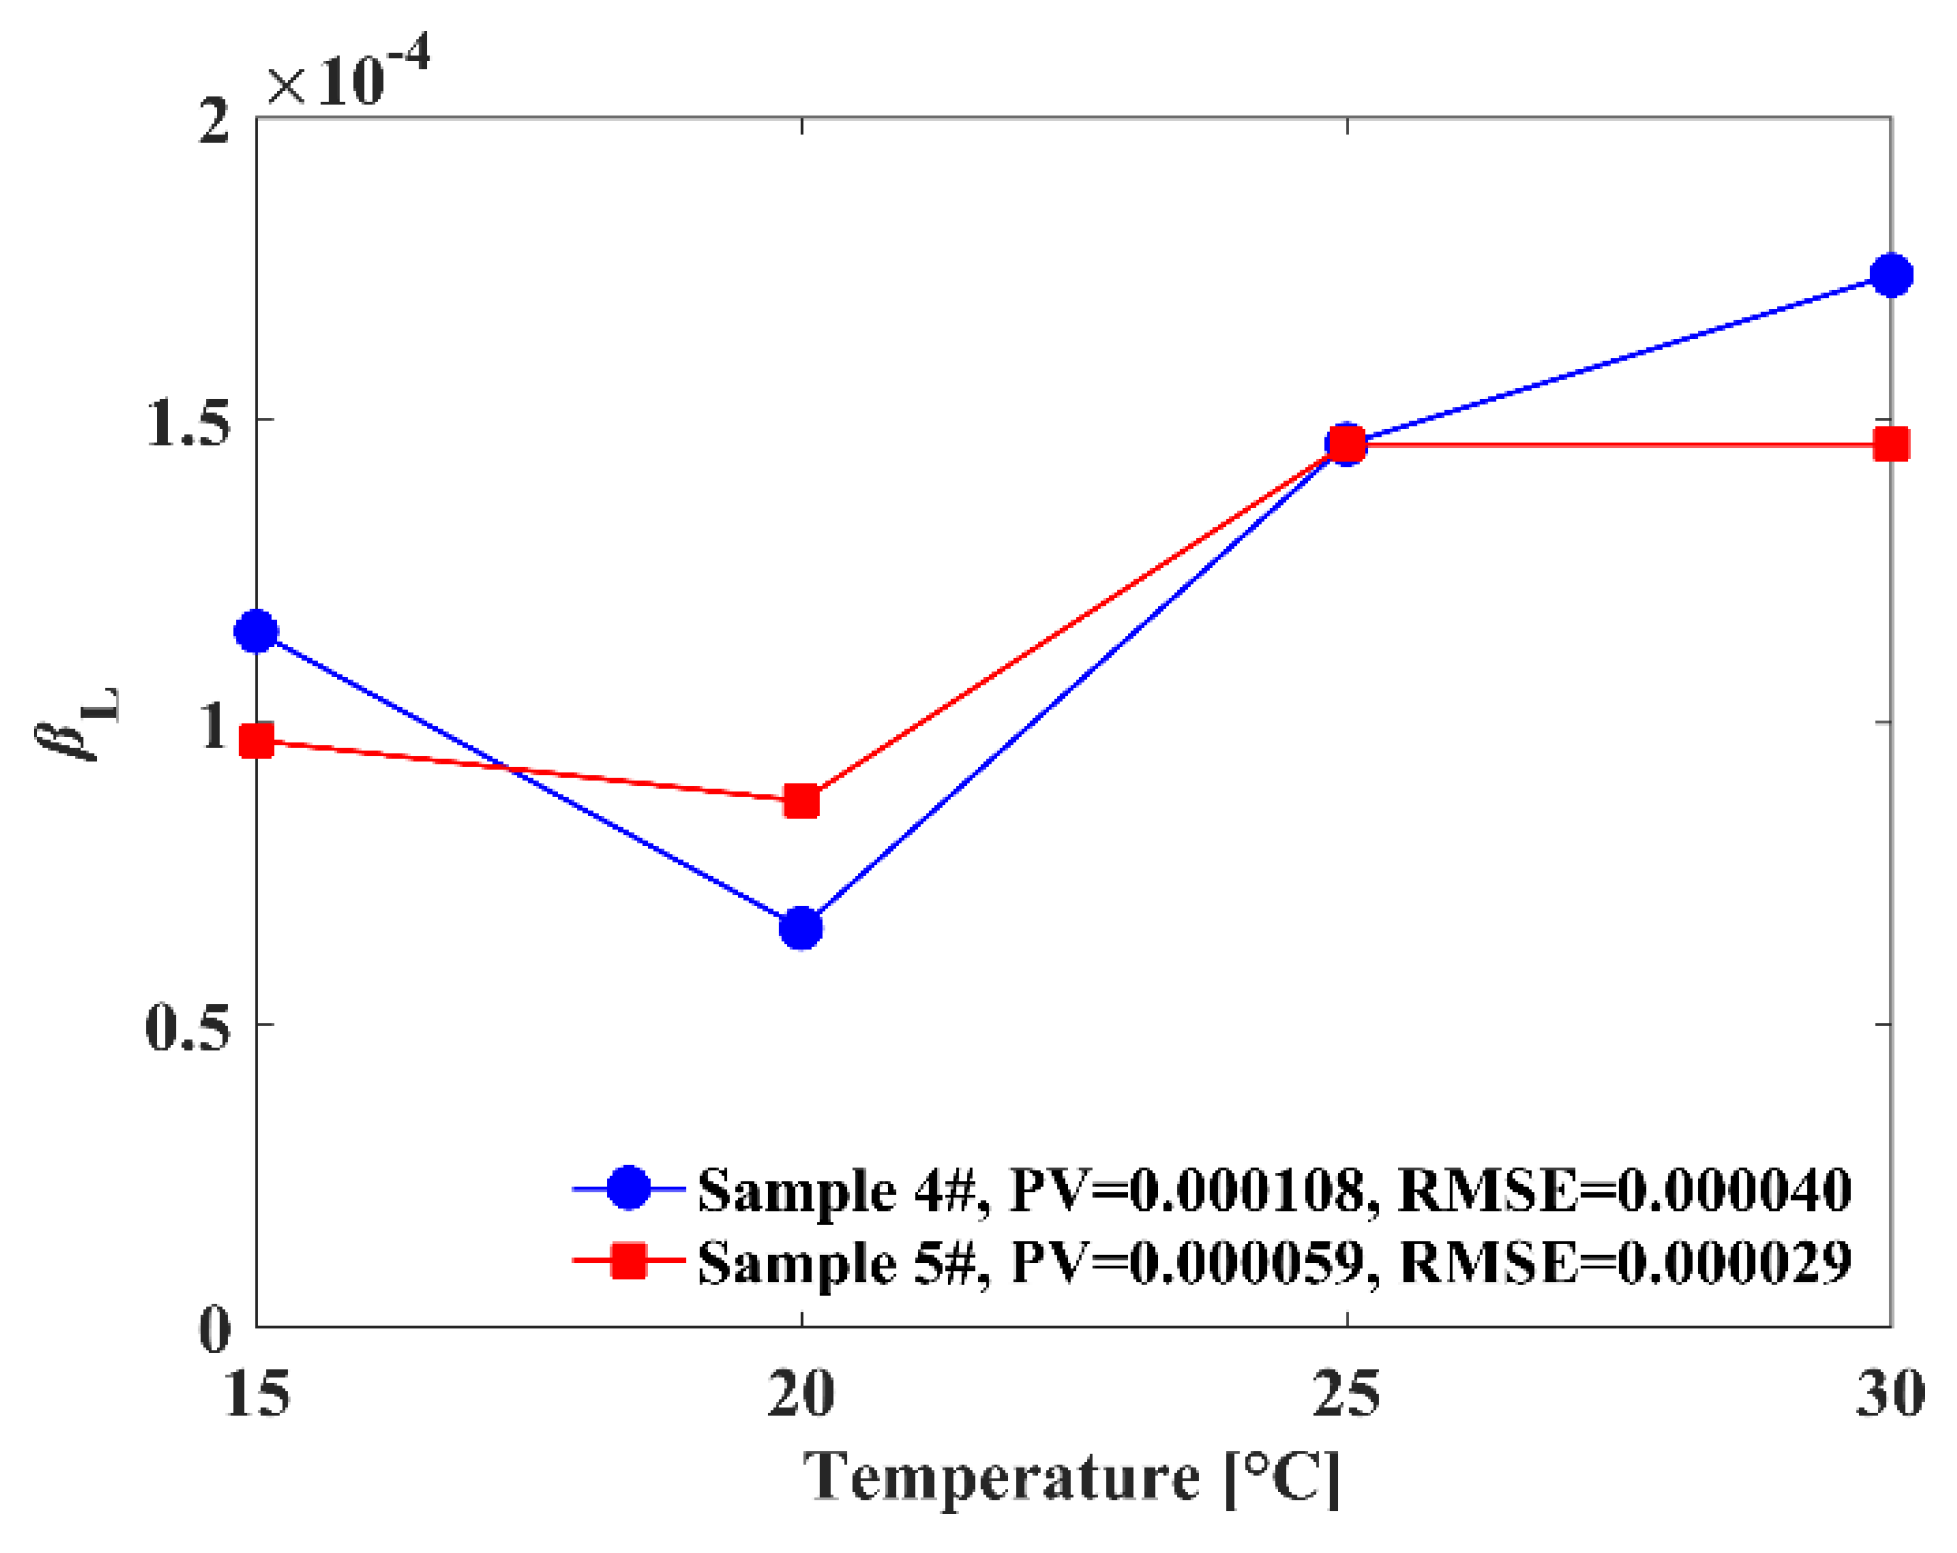
5.2.2. Analysis of the Change in the with T
5.3. Accuracy Validation of –T Model
6. Conclusions
- 1.
- The proposed pulse reflection immersion method provides reliable and stable measurements of the ultrasonic echo signal of ULE glass, and the calculation of the signal based on the correlation method can be used to conveniently and accurately extract the ultrasonic TOF of the tested sample and then obtain the ultrasonic velocity.
- 2.
- The application of the proposed method for six ULE samples with different CTE values indicates that ultrasonic velocity increases as the experimental temperature is increased. Furthermore, the –T exponential model was theoretically analyzed and experimentally fitted. The predicted using the exponential model at ten random temperature points shows good agreement with the actual measured ultrasonic velocities at the same temperature.
Author Contributions
Funding
Institutional Review Board Statement
Informed Consent Statement
Data Availability Statement
Conflicts of Interest
References
- VanBrocklin, R.R.; Edwards, M.J.; Wells, B. Review of Corning’s capabilities for ULE mirror blank manufacturing for an extremely large telescope. In Proceedings of the SPIE—The International Society for Optical Engineering, Orlando, FL, USA, 6 July 2006; Volume 6273, p. 627301. [Google Scholar]
- Kendrick, S.E.; Stahl, H.P. Large aperture space telescope mirror fabrication trades. In Proceedings of the SPIE—The International Society for Optical Engineering, Marseille, France, 12 July 2008; Volume 7010, p. 70102G. [Google Scholar]
- Plummer, W.A.; Hagy, H.E. Precision thermal expansion measurements on low expansion optical materials. Appl. Opt. 1968, 7, 825–831. [Google Scholar] [CrossRef]
- Imai, H.; Okaji, M.; Kishii, T.; Sagara, H.; Aikawa, H.; Kato, R. Measurement of thermal expansivity of low-expansion glasses by interferometric methods: Results of an interlaboratory comparison. Int. J. Thermophys. 1990, 11, 937–947. [Google Scholar] [CrossRef]
- Kato, R.; Azumi, T.; Maesono, A. Measurement of thermal expansion of low-expansion glasses by a laser interferometric thermal expansion meter. High Temp.-High Press. 1991, 23, 615–620. [Google Scholar]
- Hagy, H.E.; Smith, A.F. Sandwich seal in the development and control of sealing glasses. J. Can. Ceram. Soc. 1969, 38, 63–68. [Google Scholar]
- Hagy, H.E.; Best, M.E. Comparison of two high-precision nondestructive measurement methods for evaluating thermal expansion differences in the 8.3-m ultralow-expansion Subaru primary mirror blank. Appl. Opt. 1996, 35, 1126–1128. [Google Scholar] [CrossRef]
- Gulati, S.T.; Hagy, H.E. Theory of the narrow sandwich seal. J. Am. Ceram. Soc. 2006, 61, 260–263. [Google Scholar] [CrossRef]
- Hagy, H.E. High precision photoelastic and ultrasonic techniques for determining absolute and differential thermal expansion of titania–silica glasses. Appl. Opt. 1973, 12, 1440–1446. [Google Scholar] [CrossRef] [PubMed]
- Hagy, H.E.; Shirkey, W. Determining absolute thermal expansion of titania–silica glasses: A refined ultrasonic method. Appl. Opt. 1975, 14, 2099–2103. [Google Scholar] [CrossRef] [PubMed]
- Barshan, B. Fast processing techniques for accurate ultrasonic range measurements. Meas. Sci. Technol. 2000, 11, 45–50. [Google Scholar] [CrossRef]
- Xia, N.; Zhao, P.; Zhang, J.; Xie, J.; Fu, J. Investigation of ultrasound velocity measurements of polymeric parts with different surface roughness. Polym. Test. 2020, 81, 106231. [Google Scholar] [CrossRef]
- Zhao, P.; Peng, Y.; Yang, W. Crystallization measurements via ultrasonic velocity: Study of poly (lactic acid) parts. J. Polym. Sci. Part B Polym. Phys. 2015, 53, 700–708. [Google Scholar] [CrossRef]
- Jenot, F.; Ouaftouh, M.; Duquennoy, M.; Ourak, M. Corrosion thickness gauging in plates using Lamb wave group velocity measurements. Meas. Sci. Technol. 2001, 12, 1287–1293. [Google Scholar] [CrossRef]
- Kim, Y.H.; Song, S.J.; Lee, J.K. Technique for measurements of elastic wave velocities and thickness of solid plate from access on only one side. Jpn. J. Appl. Phys. 2005, 44, 5240–5243. [Google Scholar] [CrossRef]
- Hu, E.; Wang, W. The elastic constants measurement of metal alloy by using ultrasonic nondestructive method at different temperature. Math. Probl. Eng. 2016, 2016, 6762076. [Google Scholar] [CrossRef] [Green Version]
- Zhao, P.; Xia, N.; Zhang, J. Measurement of molecular orientation using longitudinal ultrasound and its first application in in-situ characterization. Polymer 2020, 187, 122092. [Google Scholar] [CrossRef]
- Edwards, M.J.; Bullock, E.H.; Morton, D.E. Improved precision of absolute thermal expansion measurements for ULE glass. In Proceedings of the SPIE—The International Society for Optical Engineering, Denver, CO, USA, 11 November 1996; Volume 2857, pp. 58–63. [Google Scholar]
- Leydier, A.; Mathieu, J.; Despaux, G. The two coupling fluids method for ultrasonic velocity measurement. Application to biological tissues. Meas. Sci. Technol. 2009, 20, 095801. [Google Scholar] [CrossRef]
- Souri, D. Ultrasonic velocities, elastic modulus and hardness of ternary Sb-V2O5-TeO2 glasses. J. Non-Cryst. Solids 2017, 470, 112–121. [Google Scholar] [CrossRef]
- Minh, H.N.; Du, J.; Raum, K. Estimation of thickness and speed of sound in cortical bone using multifocus pulse-echo ultrasound. IEEE Trans. Ultrason. Ferroelectr. Freq. Control 2019, 67, 568–579. [Google Scholar] [CrossRef] [PubMed]
- Daugschies, M.; Rohde, K.; Glüer, C.C.; Barkmann, R. The preliminary evaluation of a 1 MHz ultrasound probe for measuring the elastic anisotropy of human cortical bone. Ultrasonics 2014, 54, 4–10. [Google Scholar] [CrossRef] [PubMed]
- Gulati, S.T. Mechanical properties of SiO2 vs. SiO2-TiO2 bulk glasses and fibers. MRS Online Proc. Libr. 1991, 244, 67–84. [Google Scholar] [CrossRef]
- Jiang, Z. Effect of temperature on ultrasonic velocity and stress measurement (in Chinese). Nondestruct. Test. 1999, 21, 245–248. [Google Scholar]
- Perepechko, I.; Leib, G. Acoustic Methods of Investigating Polymers; Mir Publishers: Moscow, Russia, 1975. [Google Scholar]
- Lillie, H.R.; Ritland, H.N. Fine annealing of optical glass. J. Am. Ceram. Soc. 1954, 37, 466–473. [Google Scholar] [CrossRef]


| No. | Thickness (mm) | CTE (5~35 °C) (ppb/°C) |
|---|---|---|
| 1# | 49.936 | −1 |
| 2# | 49.932 | 0 |
| 3# | 49.937 | 1 |
| 4# | 49.940 | 2 |
| 5# | 49.941 | 2 |
| 6# | 49.927 | 3 |
| No. | R2 | RMSE | |
|---|---|---|---|
| 1# | 127 | 0.977 | 0.7118 |
| 2# | 127 | 0.985 | 0.5718 |
| 3# | 129 | 0.970 | 0.8330 |
| 4# | 127 | 0.966 | 0.8734 |
| 5# | 128 | 0.974 | 0.7718 |
| 6# | 128 | 0.984 | 0.5944 |
| No. | Temperature (°C) | |δ| % | |||
|---|---|---|---|---|---|
| 10.2 | 5745.5 | 5746.3 | −0.8 | 0.014 | |
| 1# | 12.7 | 5748.1 | 5748.2 | −0.1 | 0.002 |
| 14.3 | 5749.6 | 5749.3 | 0.3 | 0.005 | |
| 15.2 | 5749.4 | 5750.0 | −0.6 | 0.010 | |
| 17.6 | 5750.3 | 5751.7 | −1.4 | 0.024 | |
| 21.8 | 5754.4 | 5754.8 | −0.4 | 0.007 | |
| 23.5 | 5754.9 | 5756.1 | −1.2 | 0.021 | |
| 25.6 | 5457.1 | 5757.6 | −0.5 | 0.009 | |
| 26.0 | 5757.5 | 5757.9 | −0.4 | 0.007 | |
| 27.9 | 5759.4 | 5759.3 | 0.1 | 0.002 | |
| 10.8 | 5747.5 | 5746.8 | 0.7 | 0.012 | |
| 3# | 12.4 | 5747.9 | 5748.0 | −0.1 | 0.002 |
| 15.2 | 5751.7 | 5750.1 | 1.6 | 0.028 | |
| 16.5 | 5751.5 | 5751.0 | 0.5 | 0.009 | |
| 16.9 | 5751.4 | 5751.3 | 0.1 | 0.002 | |
| 18.4 | 5751.5 | 5752.4 | −0.9 | 0.016 | |
| 23.3 | 5757.3 | 5756.1 | 1.2 | 0.021 | |
| 24.3 | 5757.2 | 5756.8 | 0.4 | 0.007 | |
| 25.6 | 5757.5 | 5757.8 | −0.3 | 0.005 | |
| 29.0 | 5761.1 | 5760.3 | 0.8 | 0.014 | |
| 5# | 10.6 | 5750.4 | 5749.7 | 0.7 | 0.012 |
| 11.3 | 5750.2 | 5750.2 | 0.0 | 0.000 | |
| 13.5 | 5752.1 | 5751.8 | 0.3 | 0.005 | |
| 14.1 | 5753.1 | 5752.3 | 0.8 | 0.014 | |
| 15.1 | 5754.4 | 5753.0 | 1.4 | 0.024 | |
| 17.5 | 5754.2 | 5754.8 | −0.6 | 0.010 | |
| 20.3 | 5756.8 | 5756.8 | 0.0 | 0.000 | |
| 25.2 | 5760.3 | 5760.5 | −0.2 | 0.003 | |
| 25.9 | 5760.4 | 5761.0 | −0.6 | 0.010 | |
| 29.9 | 5764.8 | 5763.9 | 0.9 | 0.016 | |
Publisher’s Note: MDPI stays neutral with regard to jurisdictional claims in published maps and institutional affiliations. |
© 2022 by the authors. Licensee MDPI, Basel, Switzerland. This article is an open access article distributed under the terms and conditions of the Creative Commons Attribution (CC BY) license (https://creativecommons.org/licenses/by/4.0/).
Share and Cite
Wei, W.; Zhang, Y.; Du, Z.; Song, M.; Zhang, Y.; Liu, H. The Dependence of Ultrasonic Velocity in Ultra-Low Expansion Glass on Temperature. Appl. Sci. 2022, 12, 577. https://doi.org/10.3390/app12020577
Wei W, Zhang Y, Du Z, Song M, Zhang Y, Liu H. The Dependence of Ultrasonic Velocity in Ultra-Low Expansion Glass on Temperature. Applied Sciences. 2022; 12(2):577. https://doi.org/10.3390/app12020577
Chicago/Turabian StyleWei, Wenqing, Yongfeng Zhang, Zongzheng Du, Minwei Song, Yuanyuan Zhang, and Hong Liu. 2022. "The Dependence of Ultrasonic Velocity in Ultra-Low Expansion Glass on Temperature" Applied Sciences 12, no. 2: 577. https://doi.org/10.3390/app12020577