Article

Design of the System for the Analysis of Disinfection in Automated Guided Vehicle Utilisation

1
Department of Industrial Engineering, Faculty of Mechanical Engineering, University of Žilina, Univerzitná 8215/1, 010 26 Žilina, Slovakia
2
Faculty of Electrical Engineering and Information Technology, Institute of Robotics and Cybernetics, Slovak University of Technology, Ilkovičova 3, 812 19 Bratislava, Slovakia
*
Author to whom correspondence should be addressed.
Appl. Sci. 2022, 12(19), 9644; https://doi.org/10.3390/app12199644
Submission received: 29 July 2022 / Revised: 7 September 2022 / Accepted: 23 September 2022 / Published: 26 September 2022
(This article belongs to the Topic Modern Technologies and Manufacturing Systems, 2nd Volume)

Abstract

:
The article’s main goal is to describe the system design for the analysis of disinfection automated guided vehicle (AGV) utilisation so that the AGV’s optimal number can be determined. The simulation was used as the system’s main tool, allowing a relatively objective approach to imitate real system behaviour. With the proposed system, it is possible to determine the utilisation of AGVs and the number of necessary AGVs that carry out disinfection of the premises through the superstructure platforms. In the simulation model, two main modes of disinfection of ground AGV were tested. A regular circuit is carried out at specific intervals as well as a dynamic evaluation of the area and its possible contamination. When the area reaches a certain threshold, the instruction to disinfect the area is triggered. Experiments were carried out for a different number of AGVs, with the possible restriction of entry in the presence of the patient, and for a combination of specialised AGVs. Based on the results, we can conclude that the use of only surface-disinfecting AGVs is limited by the movement of patients and does not bring the same results as the use of a combination of surface- and air-disinfecting specialised AGVs.

1. Introduction

The health sector is currently under enormous pressure, especially to cope with staff shortages and the loss of capacity due to staff infections with the coronavirus and various other diseases. Health facilities are generally among the most at-risk areas of infection with various viruses or infections [1]. Therefore, maintaining a clean environment in these facilities is crucial for reducing future pressure on medical capacity. However, ensuring proper disinfection to prevent transfers places increased demands on the staff who must carry out these cleaning procedures [2].
Some disinfection activities of the staff cannot be replaced, but some can be automated and transferred to the disinfection automated guided vehicle (AGV) [3]. An AGV is a device that can move in an area autonomously and, during its movement, disinfect the area through disinfection equipment.
Presently, we can see an increase in interest in such technologies globally [4]. This is also thanks to the development of security systems, which are most important in areas with a high movement of people and prevent collisions with unexpected obstacles [5]. Such obstacles are all objects and people in the area for whom the control system has no information [6]. The algorithms of the AGV control unit are designed to be able to perform the specified disinfection task safely and reliably. When a new task is received, it is first verified that the AGV system can perform the task. The estimated electricity consumption needed to perform the task is then calculated, which consists of the sum of the routes of the movements necessary to complete the task and the consumption needed to return the AGV to its starting position [7,8]. Consequently, this estimated consumption is compared with the current battery status. If the current battery status is insufficient, the AGV will reject the task and request a transfer to the nearest free charging station [9,10].
For the application of technologies such as AGV and determining the number needed for deployment, static calculations with the alignment of schedules [11] and verification by simulation is required [12]. The simulation allows the dynamic verification of solutions with a view to various interactions that cannot be incorporated into static calculations [13,14,15].
The AGV would be irrelevant when disinfecting the premises without the additional superstructure equipment carrying out the disinfection. Currently, ultraviolet (UV) ray disinfection [16,17,18] and disinfection by spraying detergent [19] are among the most advanced technologies for disinfection. Today, a wide range of disinfectant UV AGV robots have different characteristics for radiation levels as well as the necessary distance from the surface [20,21]. The basic disadvantage of these UV cleaners in the case of the disinfection of surfaces is the period of exposure of human skin to radiation [22]. When spraying disinfectant, this cleaning must take precedence, especially if no one is in the area.
On the basis of research [23,24], it is possible to predict that by 2030, there will be a shortage of approximately 15 million workers in the global health sector, even in countries with high incomes. It is therefore necessary to find solutions that will partially improve this situation through the development and expansion of the application of existing technologies [25]. The ability to disinfect the environment, the flexibility [26], and the relatively low cost of performing the function point to the future use of disinfectant AGVs in practice. In the future, a significantly higher application of AGVs in the healthcare sector can be expected in a wide range of activities [27]. It is expected that the size of the medical robotics market, which also includes AGVs worldwide, will increase by 31.9 billion from 2022 to 2030 [28].
Compared to classic disinfection by a worker, the efficiency of the application of such devices is comparable. In the case of UV disinfection, if it is performed by an AGV in one moment, the area of disinfection will significantly increase [29]. However, it should be noted that using AGVs on the curved surfaces of disinfected objects reduces its effectiveness [30]. From a financial point of view, according to [31], the basic prerequisite for the application of AGVs in the disinfection process is a shift system, so it is only financially profitable with a two/three shift system regarding logistics personnel.
AGVs have mainly been used in healthcare as service robots that transport medicines or medical supplies [32,33]. Most of the work focused on this area has defined the effectiveness of the disinfection in terms of range of distance and general use, for example in [18,34,35,36]. The task that can be assessed, but has not been solved, in the field of disinfection AGVs is to determine a system that could quite precisely define the number of AGVs needed for disinfection by evaluating their utilisation in defining disinfection routes and disinfection areas.
The core of this article is a description of the system used to determine the disinfection ground of AGVs for analysing the necessary number of such devices. The system uses simulation and allows for the consideration of the generation of disinfection tasks at regular intervals and the generation of tasks based on the dynamics of human movement and necessary visits to a particular area. The design system enables us to precisely determine the usage of AGVs, even for specialised and autonomous types of AGV.

2. Materials and Methods

The system for disinfection automated guided vehicle utilisation analysis consists of four blocks, as shown in the diagram below (Figure 1).
First, it is necessary to collect all relevant data that will be necessary for the compilation of the simulation model of the system (Block A). In Figure 2, the content of Block A is provided.
The first step of the block (A1) is the collection of data that express the time characteristics of a patient’s entry into the system to ensure the dynamic creation of disinfection tasks. This step is followed by the determination of the time and its distribution for each activity that is in the implementation system (A2), such as the treatment times or the time of completion of the form by the patient. The next step is determining the probability that a patient can visit a particular destination to properly model their movement in the system (A3). The last step of the block is to determine how many patients can be at a specific destination at the same time (A4).
Next, Block B of the system aims to create a simulation model of the system, namely, the patient and medical parts. A representation of the steps for this block can be seen in Figure 3.
The first step in Block B is to define the modelled system’s obstacles where the disinfecting AGV will be used (B1). This step creates a basic layout and marks places where the AGV cannot enter as well as walls, columns, or other obstacles in the area. The next step is to define the shift model according to which the health department works (B2). This information is especially important for the parts where simulated activities are either completed, interrupted, or continued without a break. Step B3 involves the definition of the measured intervals of the patient’s entry into the system, i.e., when the patient enters and begins the process of service. Step B4 has the task of defining an individual entity’s attributes that will control its logic in the whole system. For example, it may be sorting patients by severity, as each will require a different treatment time. Suppose we have a defined logic for patients. In that case, we can determine which destinations they visit while staying in the system (B5) as well as defining the logic of the sequence of visits to different destinations (B6). The last step of the block defines the nodes from which data can be received during the simulation to generate disinfection tasks (B7).
Block C also aims to model the system, namely, its disinfection AGV part (Figure 4).
In the first step of Block C, it is necessary to define the charging and parking places for the disinfection AGVs (C1). The next step is to create the paths for the disinfection AGVs and connect these charging stations to them (C2). This is followed by the definition of the logic of the path logic (C3), i.e., in which direction the AGV can move, as well as the definition of the information and events that we want to trigger after the AGV’s entry and exit from the path. The following step defines the system’s input and computational variables (C4). The fifth step is to define the table that contains the task queue for the disinfectant AGV (C5), where all of the tasks that the disinfectant AGV must perform in the system will be written. This step is followed by defining the link between computational variables and the AGV task table, which will link the whole system and ensure the correct entry of the task for disinfection in the dynamically emerging movement of patients. If there are tasks in the system that are performed at regular intervals, then there are generators of tasks that write tasks (C7). This step is followed by determining the AGV attributes (C8), including its speed, acceleration, deacceleration, dimensions, availability, and battery properties. Consequently, the charging logic as well as the logic of assigning tasks to free AGVs, including the AGV letting go on the path for the performance of these tasks (C9). The last step of the block is setting the initialisation number of AGVs (C10) that will be placed in the model during validation and verification.
The system’s final block (D) is the execution of simulation experiments, which include determining the use of disinfectant AGVs as well as the required number. The process of the last block is displayed in Figure 5.
The first step of the last block is validating and verifying the simulation model with the system (D1). Within this block, we will ensure that the model, through its behaviour and logic, resembles a real system so we can move on to conducting the experiments. The next step is to define the simulation experiments that will be carried out (D2). It is mainly about experimenting with the inputs to the system, including the number of disinfectant AGVs. Experiments may also include the arrival times of patients in the system or service times. Subsequently, a simulation is launched with planned simulation experiments (D3) in order to obtain the use of disinfection AGVs. In the next step, the statistics are evaluated (D4). Based on an evaluation, it is determined whether the results are satisfactory. There are two options for branches. Based on the results, branch “no” is planning new experiments. For branch “yes”, we can proceed to the last step. The last step is to determine the necessary number of disinfectant AGVs that are optimal for the area and the distance from the patients’ entry point of view.

Input Data for Validation

The input data for individual patient types and lengths of treatment entering the simulation are based on historical data, with a portion measured prior to the COVID-19 pandemic from January 2020 to December 2020. The data were not loaded with COVID-19 patients, as they were sorted at the entrance to the hospital in another place.
Within the basic logic of patient sorting, the three types of patients are arranged in the priority order of acute, urgent, and non-urgent, with an incidence of 36.00%, 50.00%, and 14.00%, respectively. They may need care in the trauma, surgical, or internal ambulance, where the percentage of their incidence is 36.60%, 19.70%, and 43.70%, respectively.
Step A1 defines the following time characteristics of the patient’s entry into the system (Figure 6). These statistics were determined on the basis of annual historical data.
Step A2 identifies the following time characteristics for patients staying at the destinations (Table 1).
The data defined within step A4 is listed in the text before Table 1. Within step A4, the capacity limitation was not considered in this case. Attributes that belong to the disinfection ground AGV are the following: speed, 0.4 m/s; charge, 330 Ah; basic consumption, 5 A; battery capacity, 330 Ah; charge current, 66 A; driving consumption, 15 A; and battery reserve, 60 Ah.

3. Results

3.1. Creation of Model

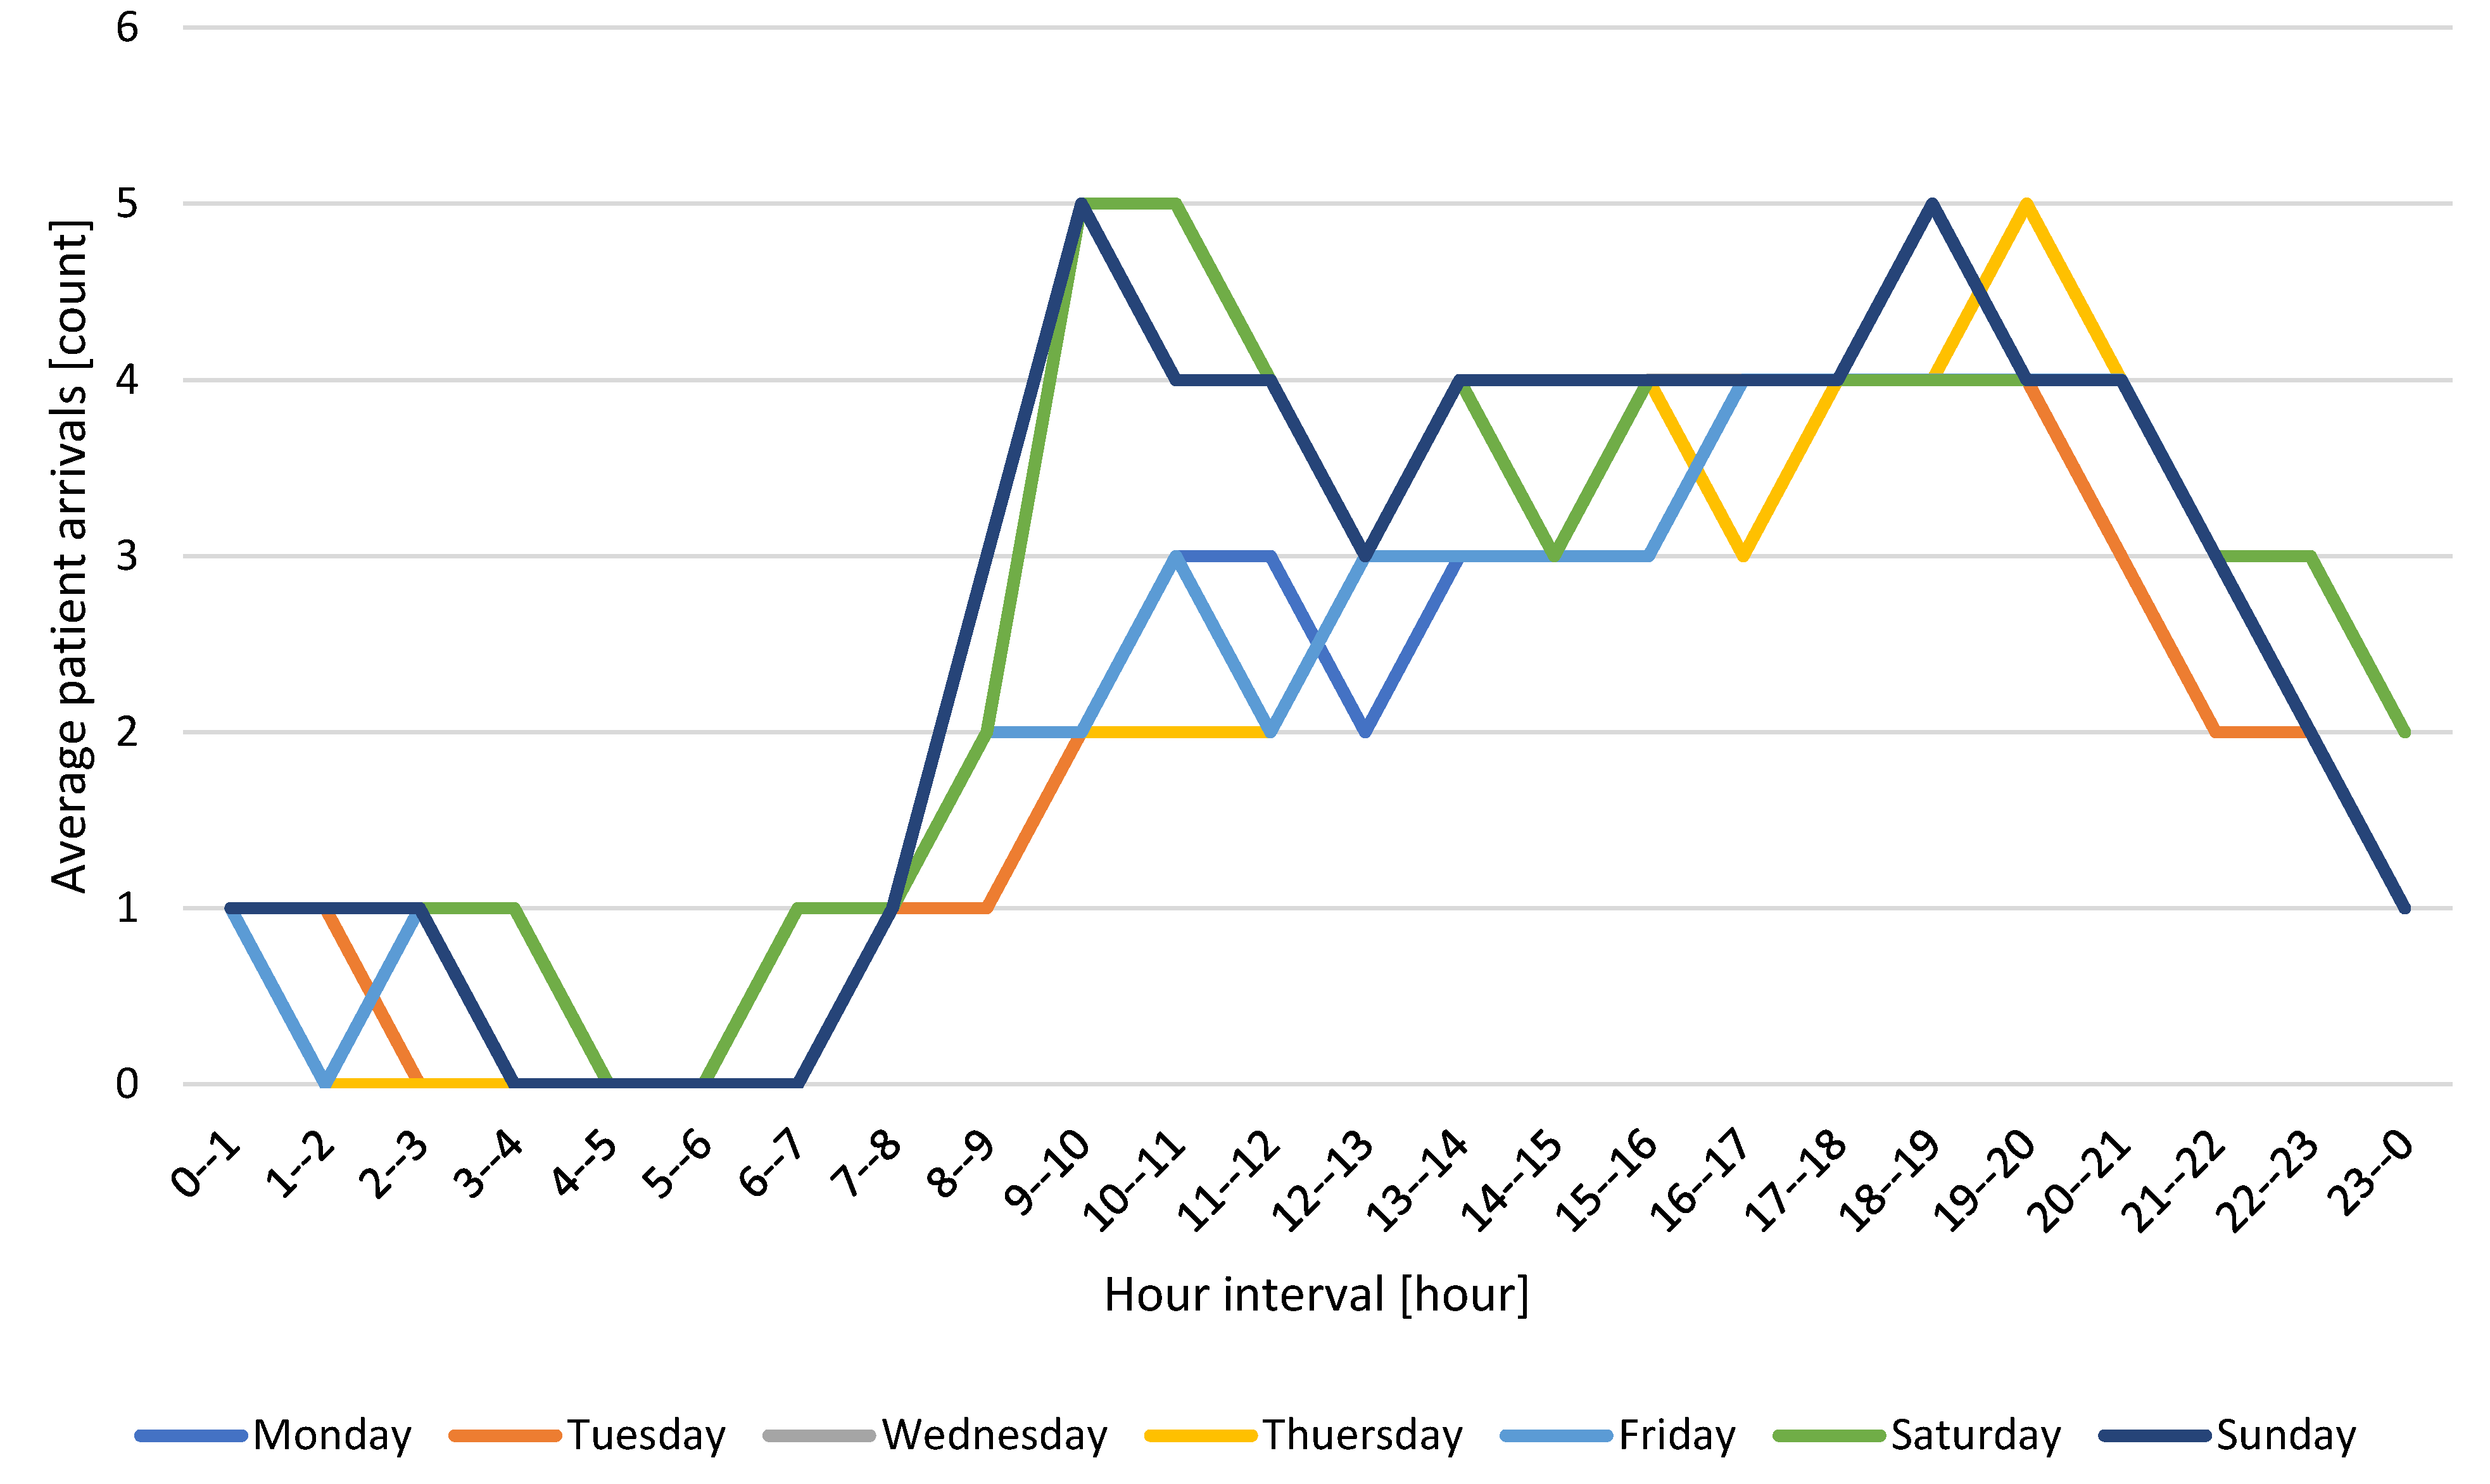
The procedure was applied to the experimental definition of the number of disinfectant AGVs for urgent reception in Zilina, Slovakia, to validate the proposed system. The simulation model, as well as simulation runs, are realised in Siemens’s Tecnomatix Plant Simulation 16 software. The processor used for computing power was an Intel(R) Core (TM) i9-10850K CPU @ 3.60 GHz with 16 GB RAM and a Nvidia t1000 4 GB graphics card, with each thread performing 20 simulation runs at a time. The simulation model itself was created in Tecnomatix Plant Simulation 16 software, which allows the definition of logic through the programming language SimTalk 2.0. Step B1 included the creation of walls and pillars and a drawing area that AGVs could not visit. Within step B2, a 24-h format was established in which doctors and nurses worked. For the model within step B3, patients’ inputs to the system were defined as listed in Figure 6. Within step B4, patients’ logic is derived from them (
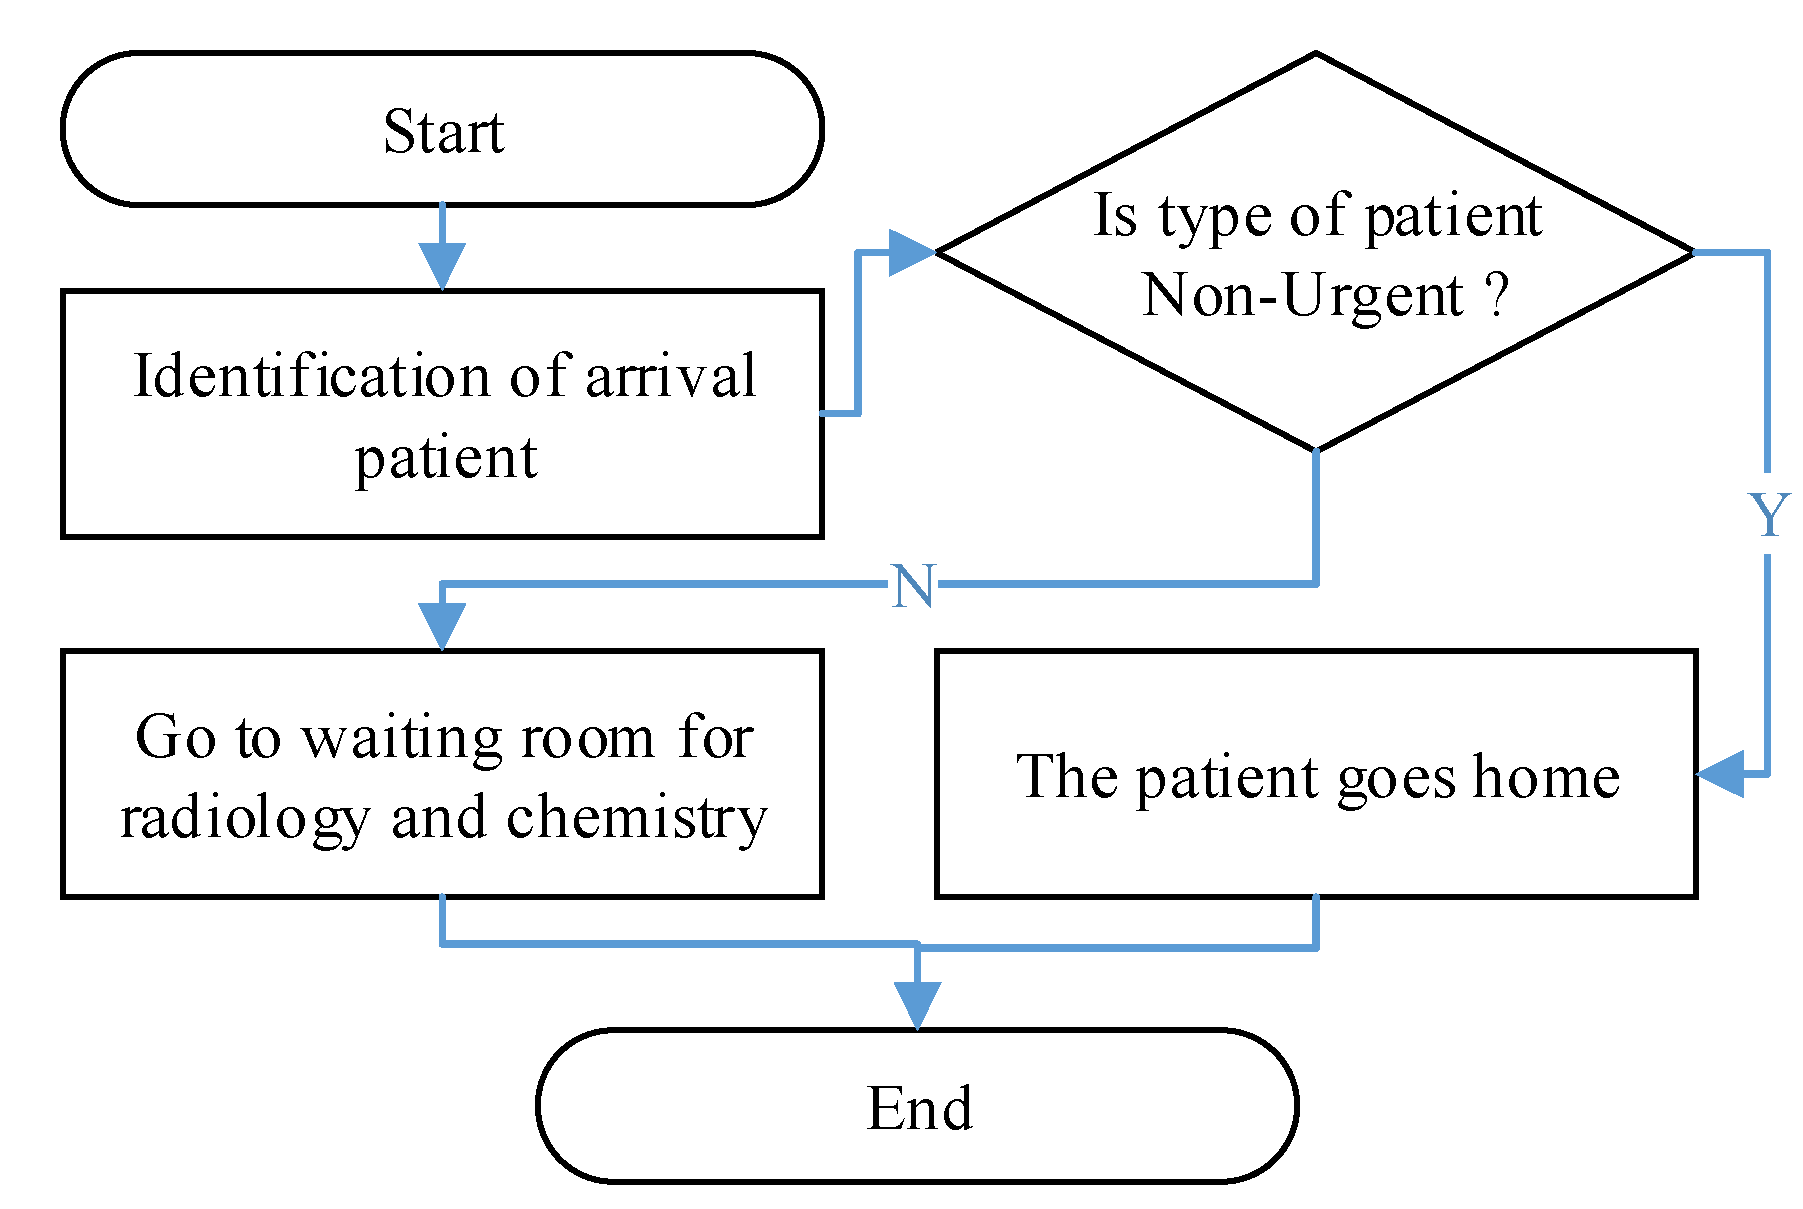
Table 1), and the percentage of their incidence is defined by the target destinations in B5. On this basis, the movement of patients can be defined as B6. The decision-making nodes then collect the data used by the disinfectant AGV (B7). The final layout is displayed in Figure 7, and an example of the logic of patient decision making at the exit of the surgical ambulance is schematically shown in Figure 8.
The symbols and colours on the layout represent the following objects: turquoise represents the walls that divide the space, the red hatched part represents rooms where disinfection is not carried out by the AGV, green marks the points where data are collected about the patient’s presence, and red points represent places where the activity is carried out, for example, registration, treatment, and other actions. The blue lines represent the connectors and represent the direction of movement of the patients.
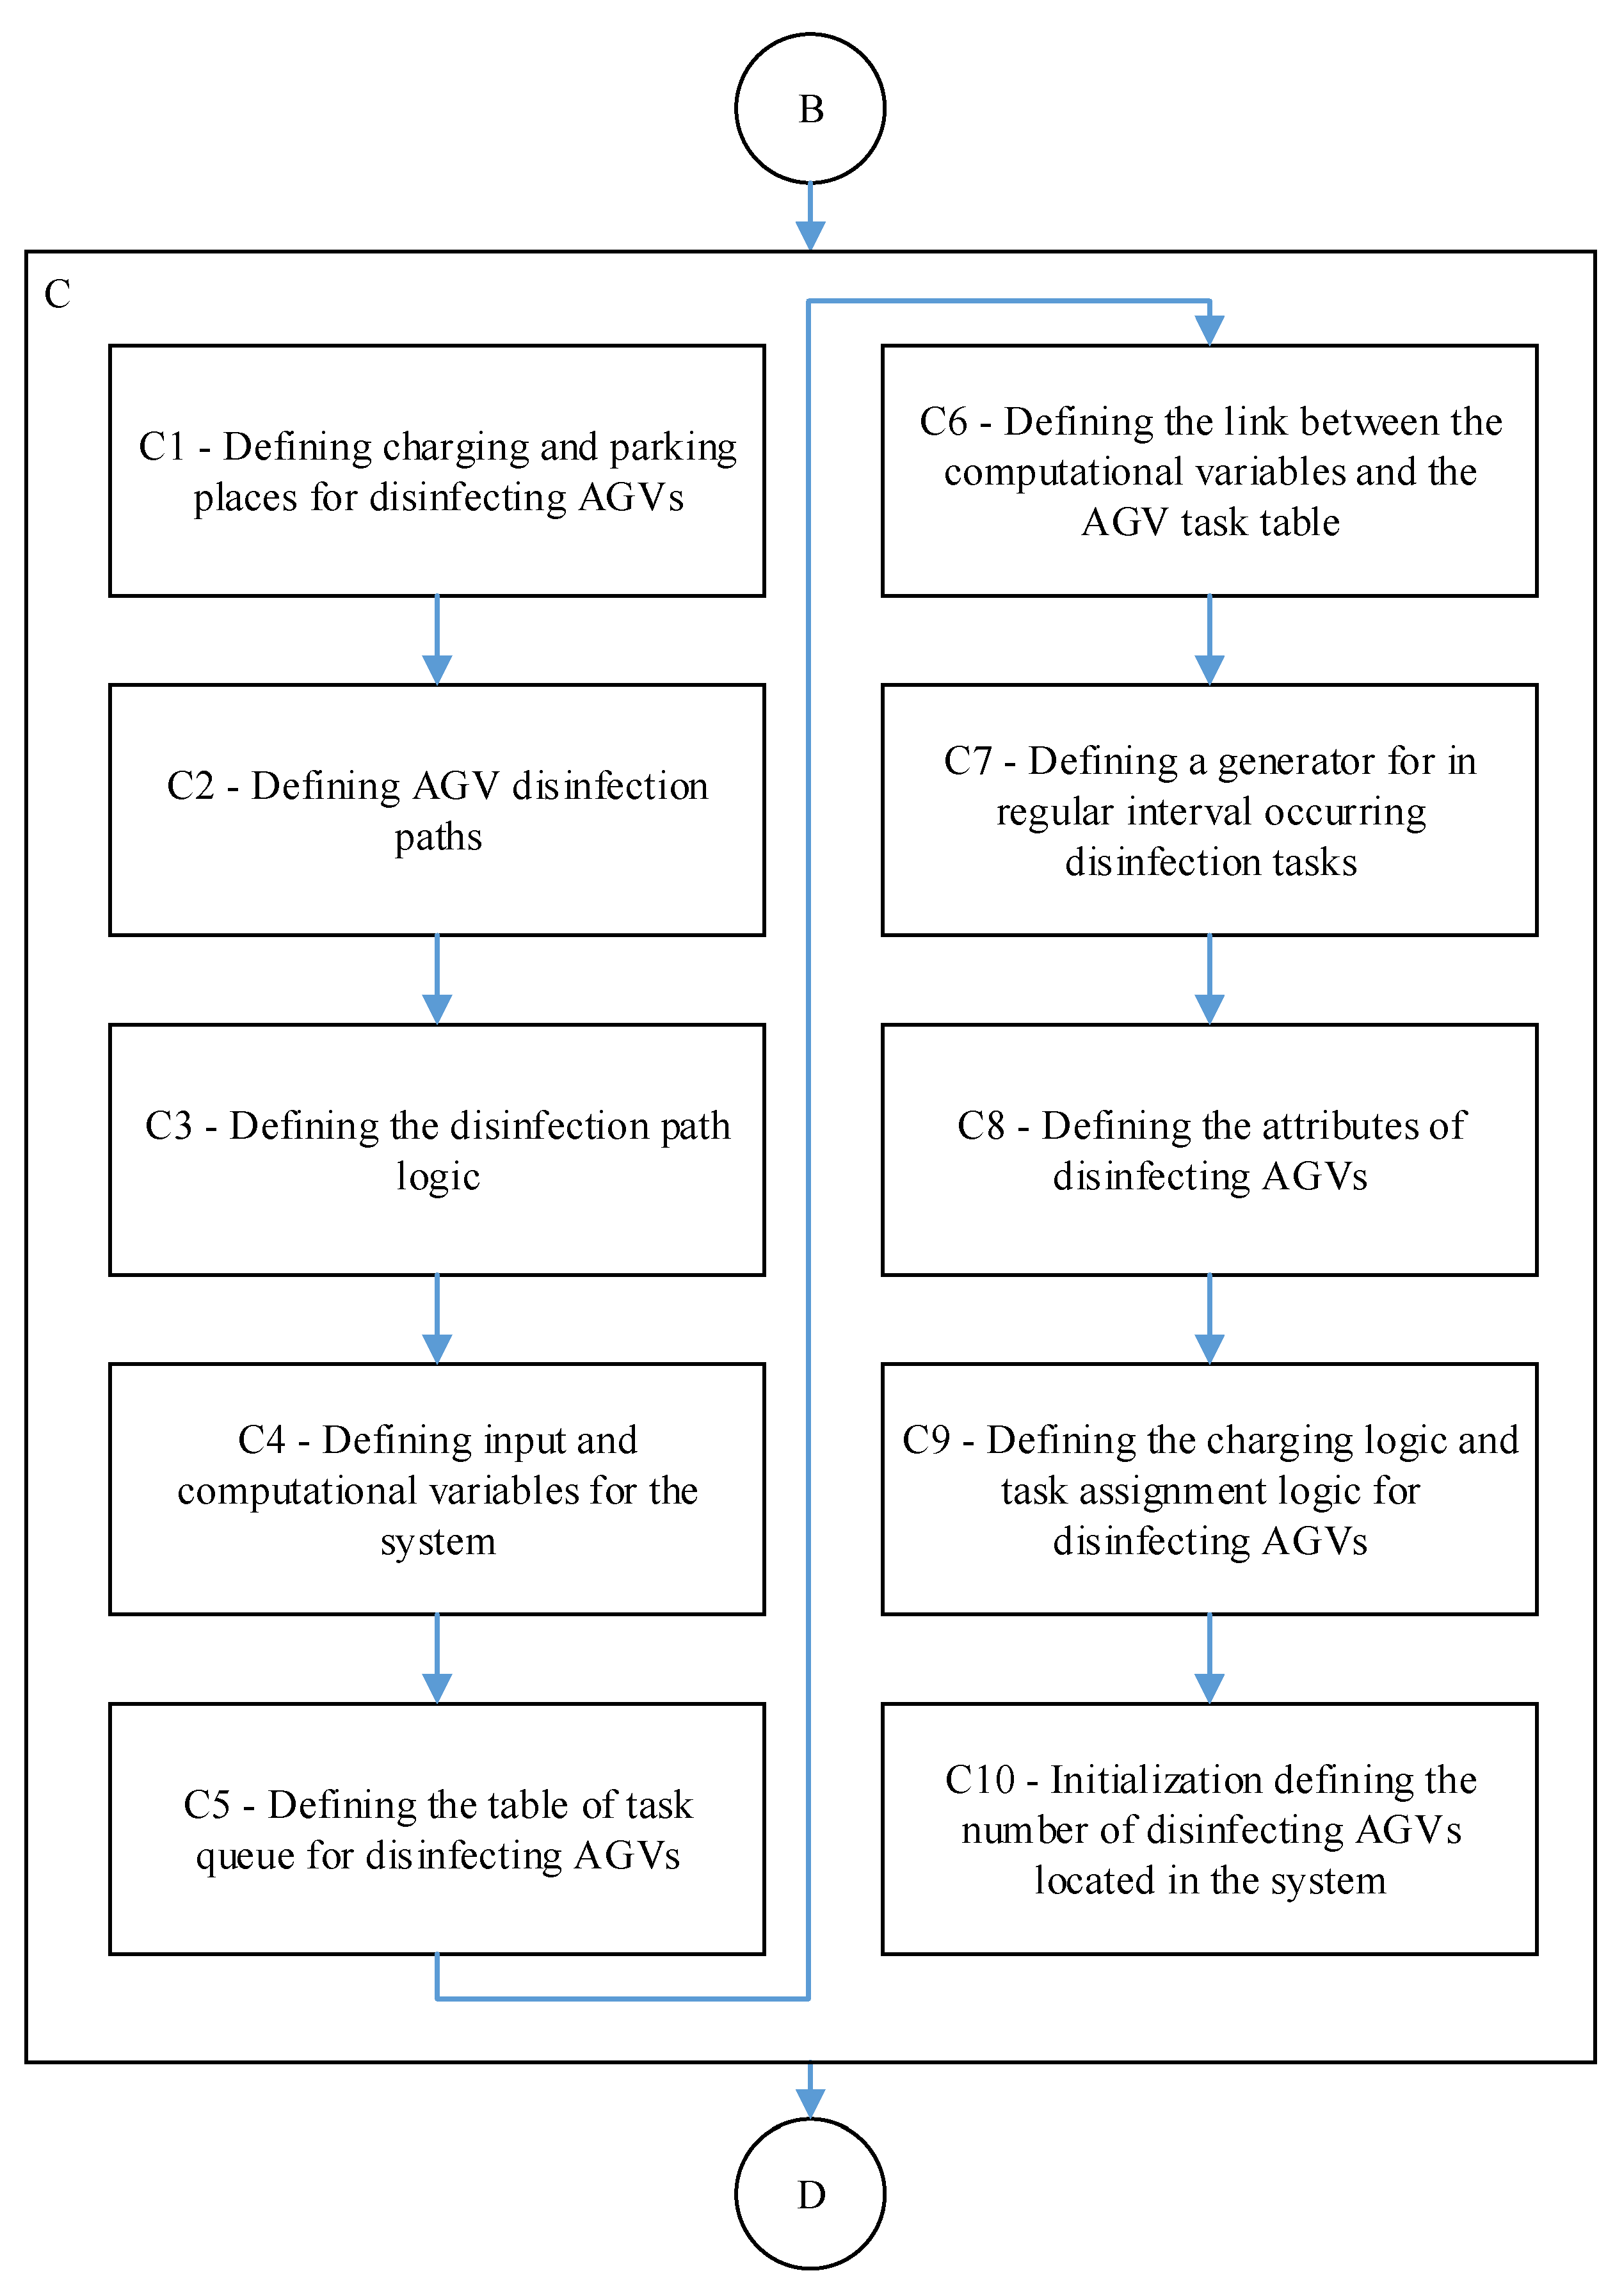
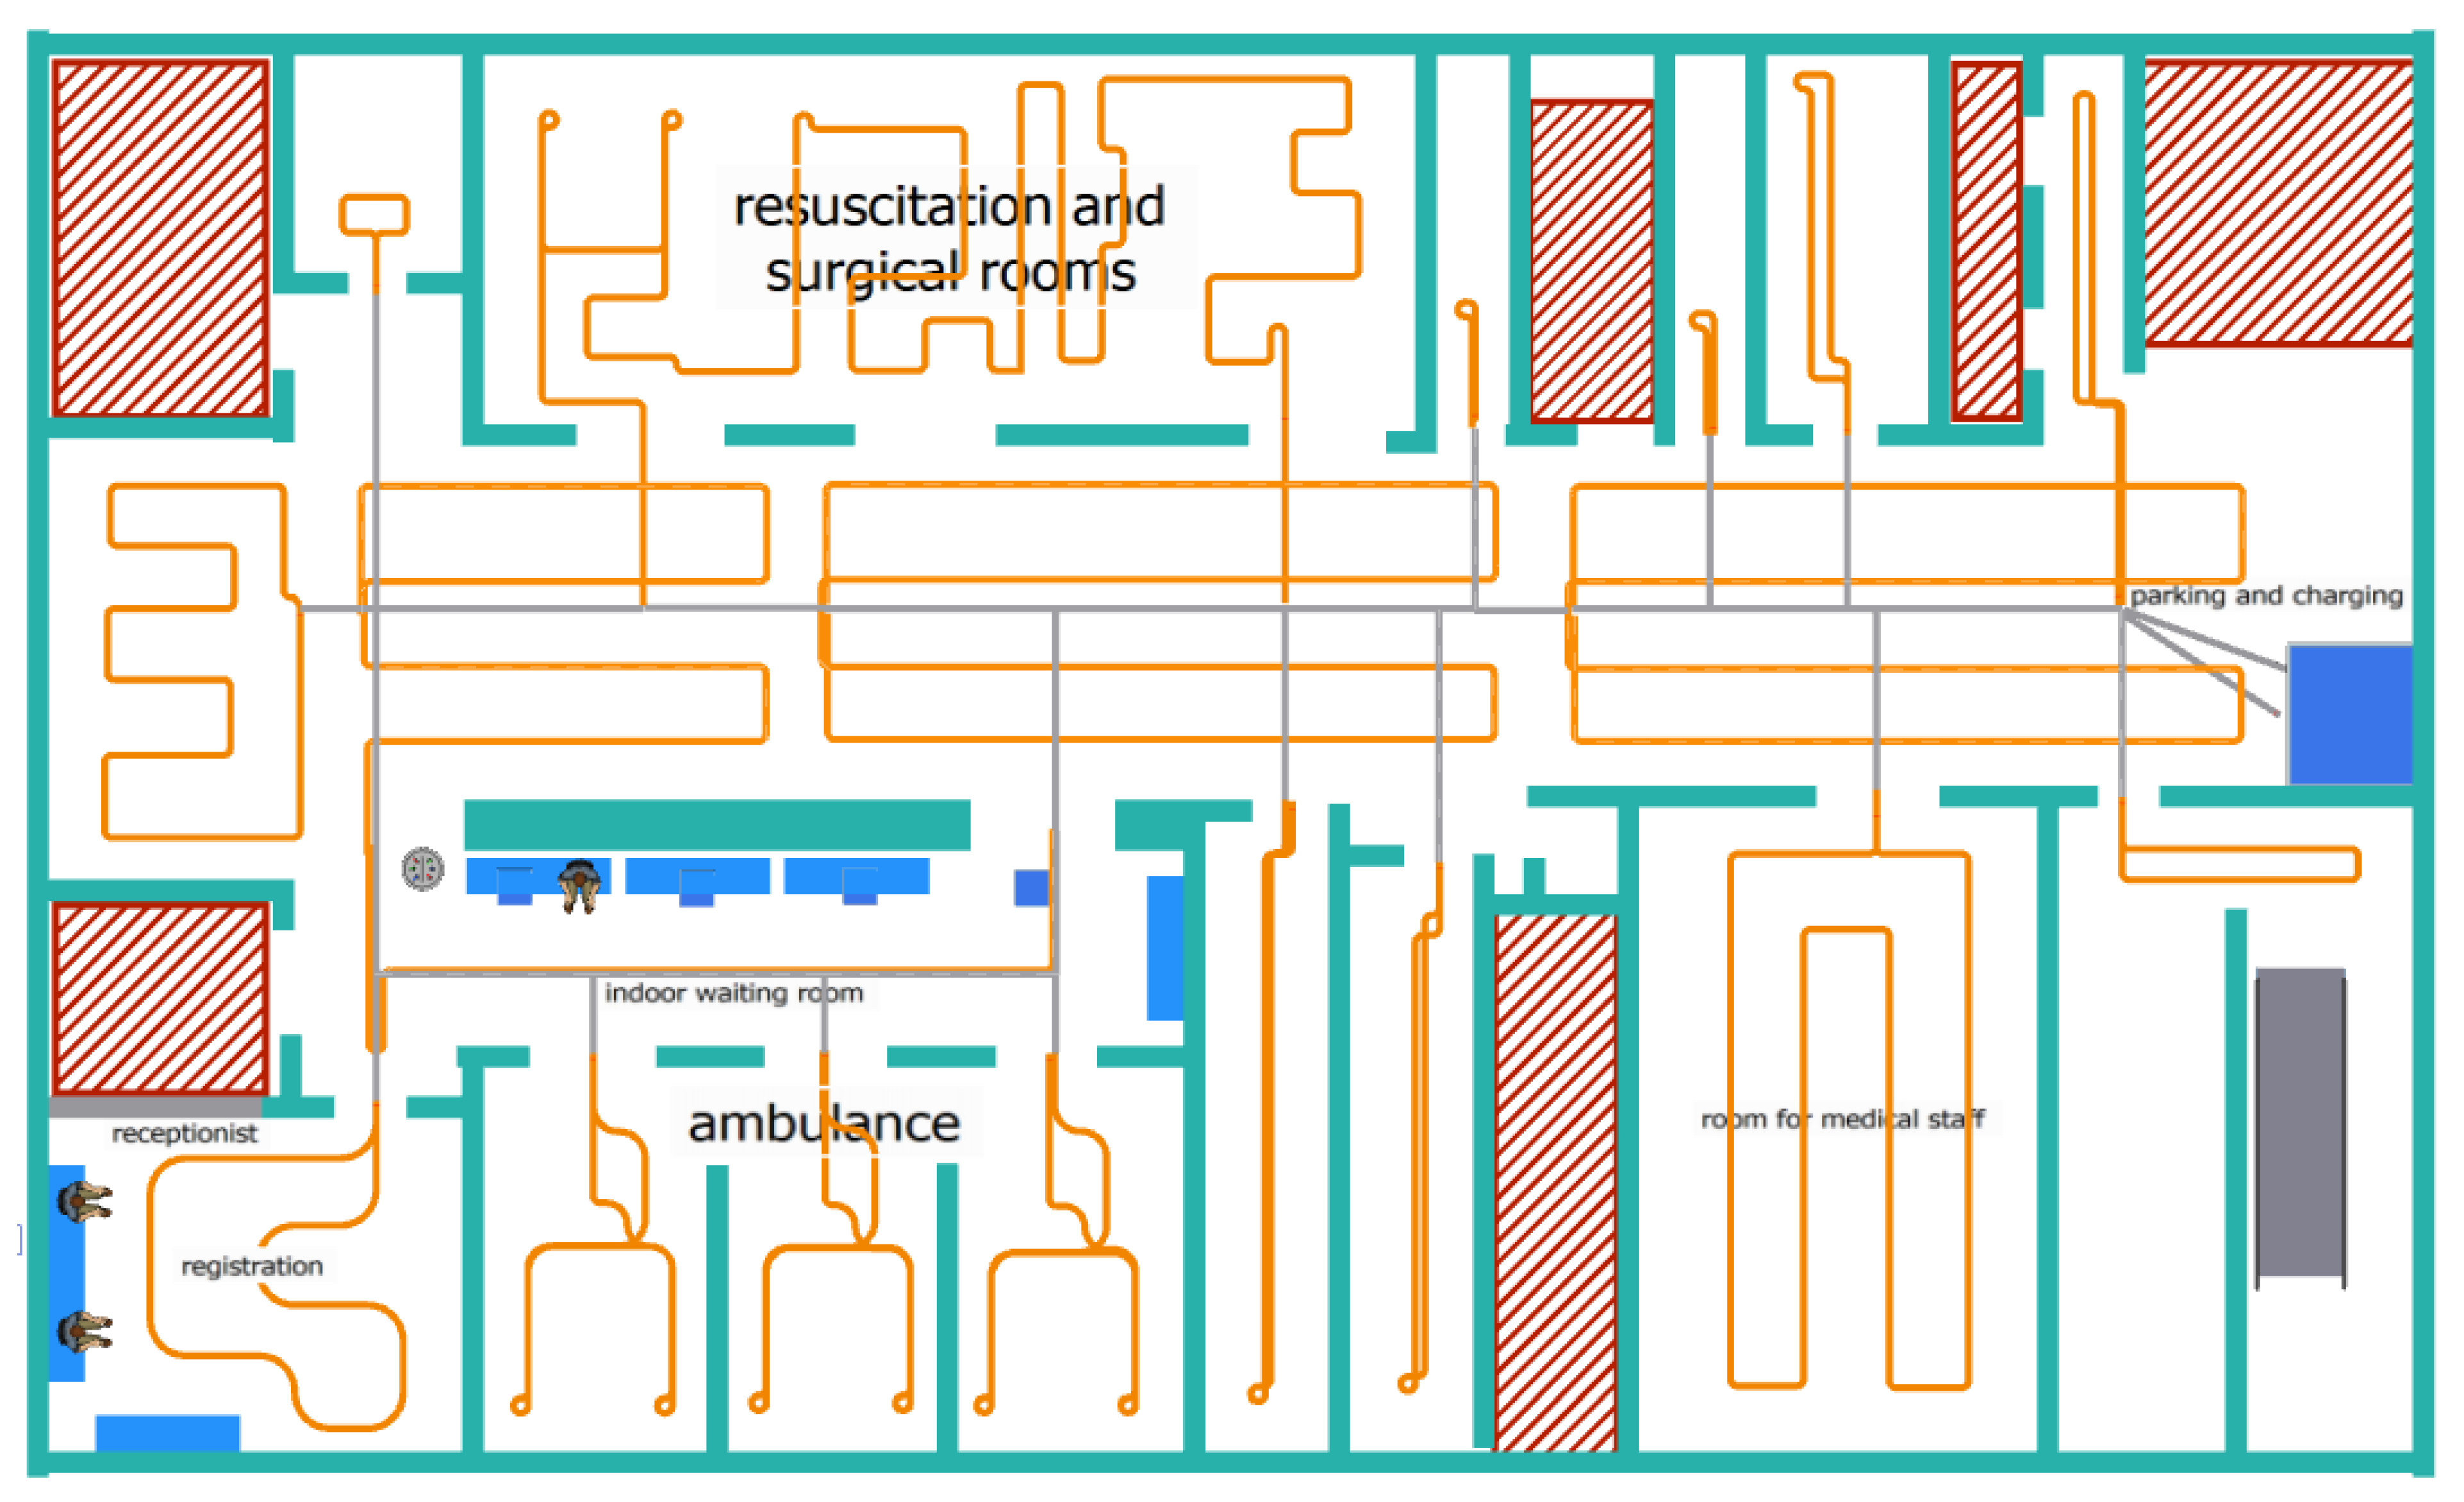
In the simulation model within step C1, one location was determined as the main charging point where the AGV was charged. In this place, the AGV stayed whenever it did not have a defined task or when the battery level fell below the specified reserve value. Within step C1, based on the spatial constraints defined in B1 (for example, ambulation or hall) and the characteristics of the disinfection superstructure that have been set, model 1 m has been established as an effective reach zone for carrying out disinfection tasks (Figure 9).
The symbols and colours on the layout represent the following objects: turquoise represents the walls dividing the space, the red hatched part represents the rooms where disinfection is not carried out by AGV, the grey lines are the access routes of the disinfection ground AGV along which movement is possible in both directions, and the orange lines are the individual disinfection routes, which are unidirectional.
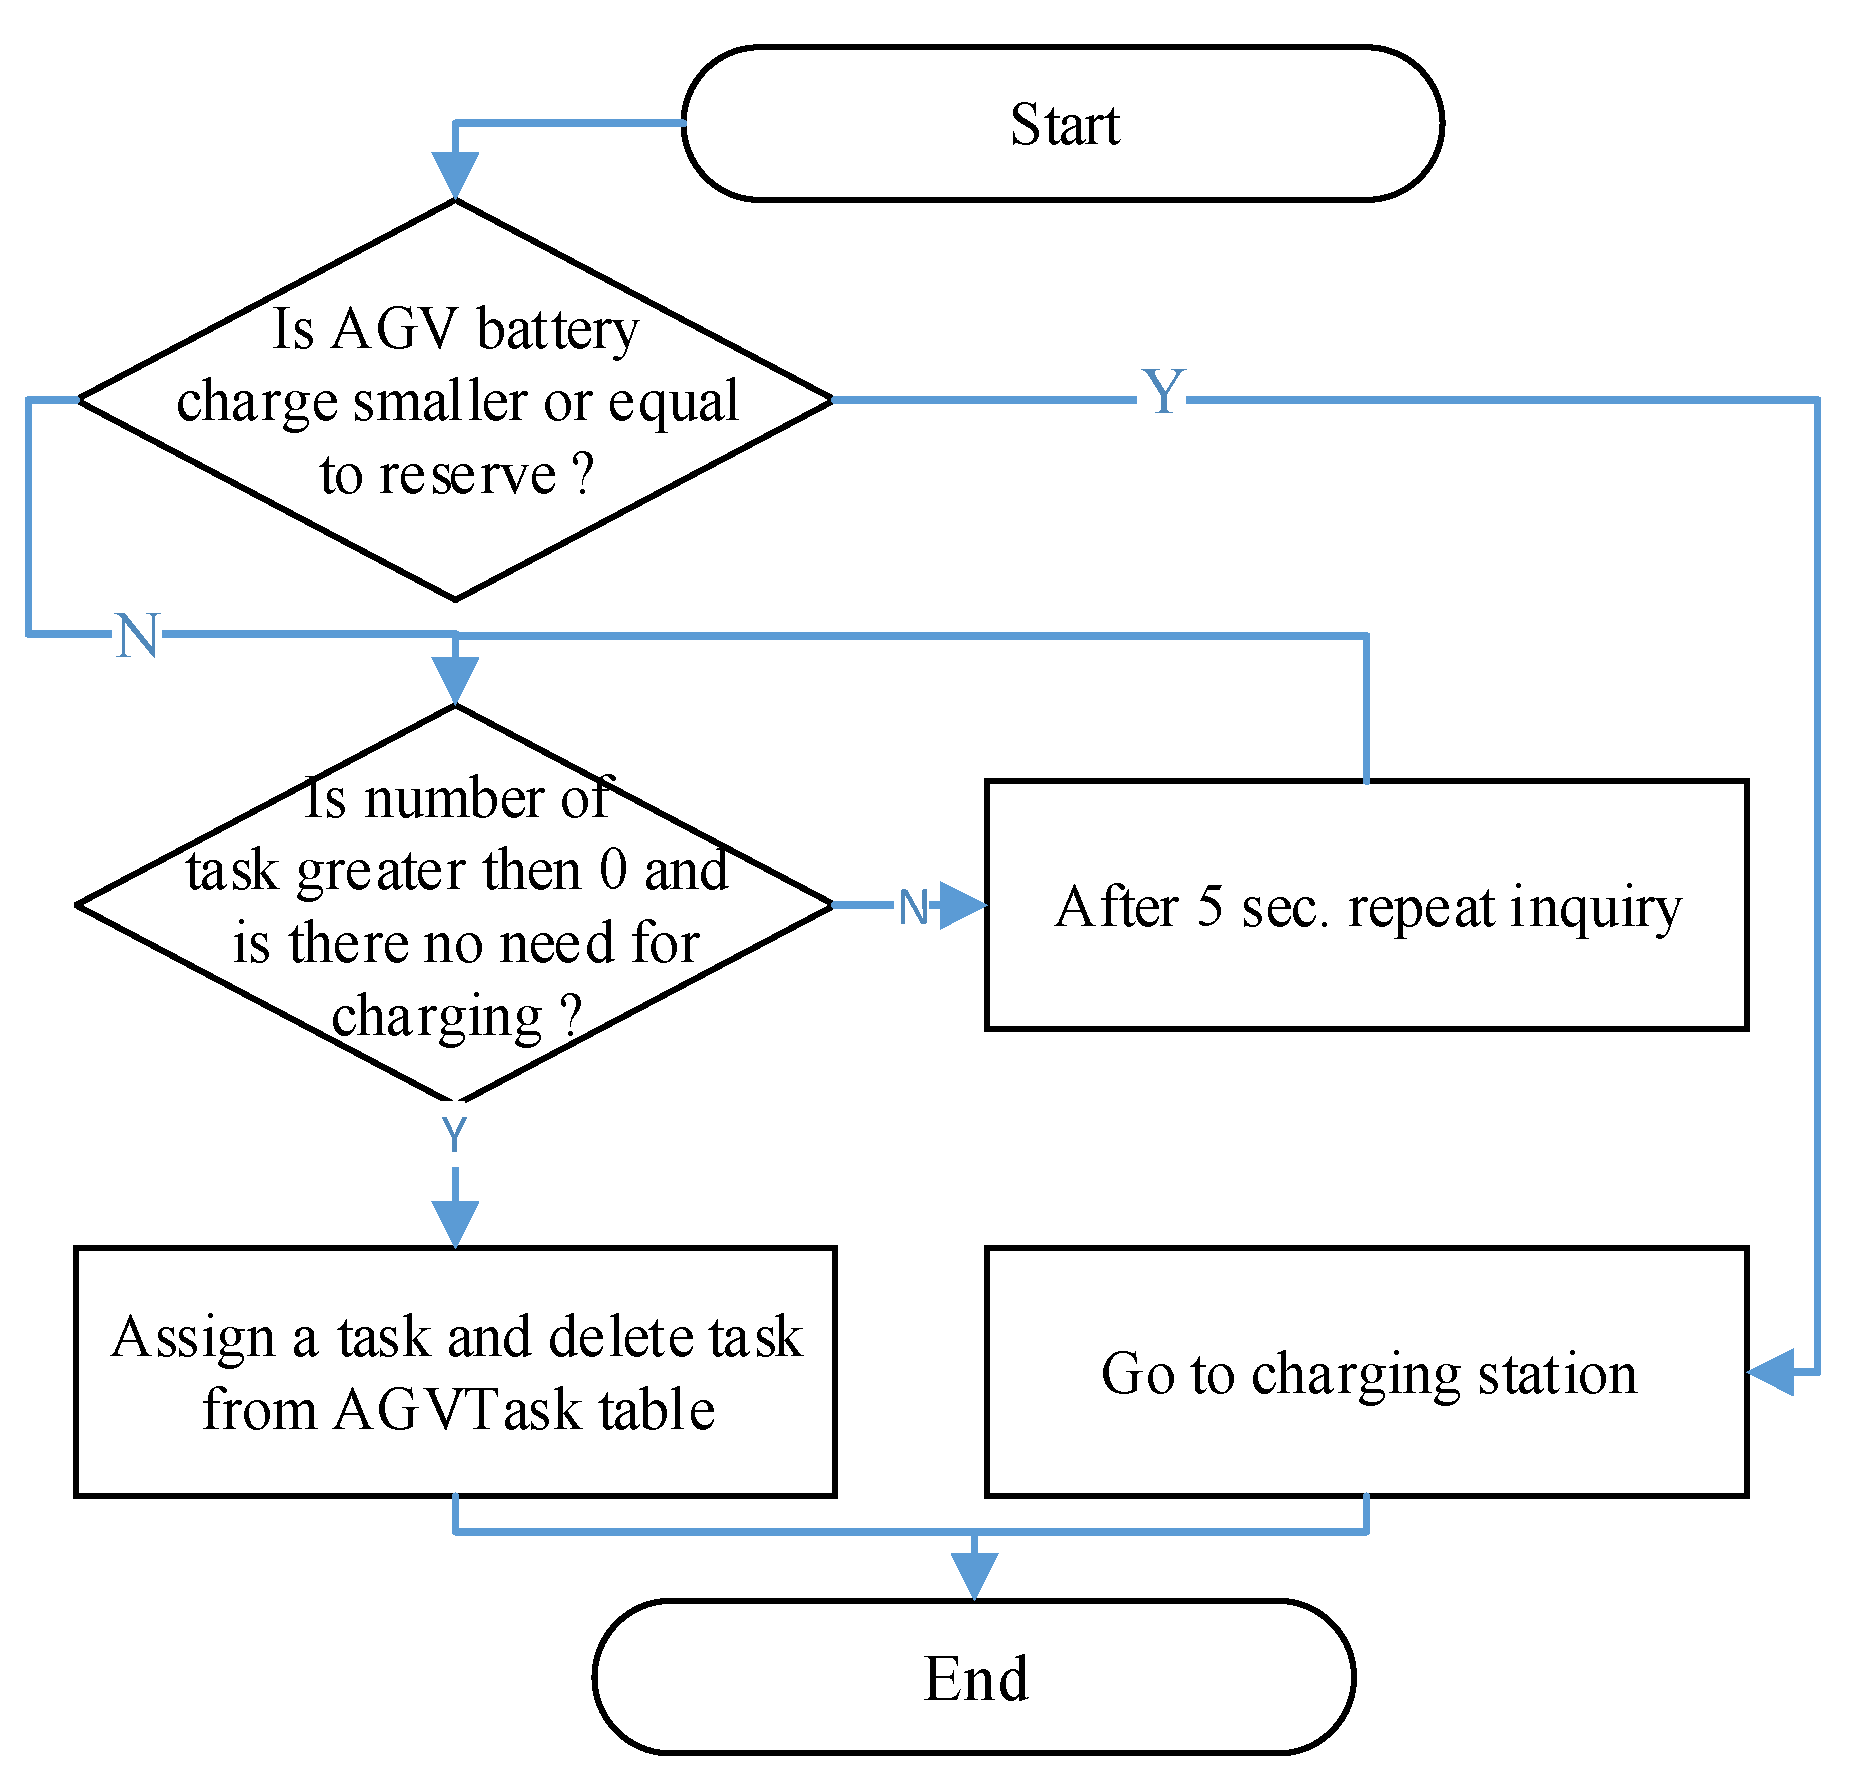
The basic logic of the path was to control the possibility of assigning another task if there was no AGV task in the queue. The AGV returned to the parking place. If the task is in the queue, the AGV starts performing it and indicates that it is being performed. If the battery level is insufficient, the AGV returns to the charging station (Figure 10).
Within step C4, multiple variables must work in the system to help with calculations and decision making (e.g., area of possible contamination or number of patients and their length of stay). There is a table in the model that records all C5 tasks called AGVTask. If the task starts to be performed, it is deleted from this queue, and the next task comes first. In the case of premises from dynamically generated tasks, the following prioritisation works for assigning the task: surgical 1, outpatient doctors 2, waiting room 3, and reception 4. Other tasks are not prioritised and are written according to the time of generation. Within step C6, generally, all variables are linked to be updated through calculation through methods and event triggers that are triggered based on the nature of the variable (for example, the Reception Number of Patients variable is updated with each output and input to the reception location). Some variables are static and change manually, for example, the point weight for patient arrival (Patient Arrive Weight) and staying in the system for a minute (Patient Stay Weight for Minute). The level of possible contamination is calculated from the number of inputs to the location having a point value of 7 and a minute’s stay in the location, which has a value of 1. An example of the calculation is if two people came in and the second patient was in the system for 10 min, then the calculation is 2 × 7 + 1 × 10. For circuits where regular disinfection occurs, generators are used to run a method that writes tasks to the task queue C7. If it is a dynamic circuit, a calculation is carried out that checks the level of possible contamination in the monitored locations. If it reaches the critical level set at 50, the task is entered into the task queue. Within step C8, the setting of the AGV battery attributes begin.
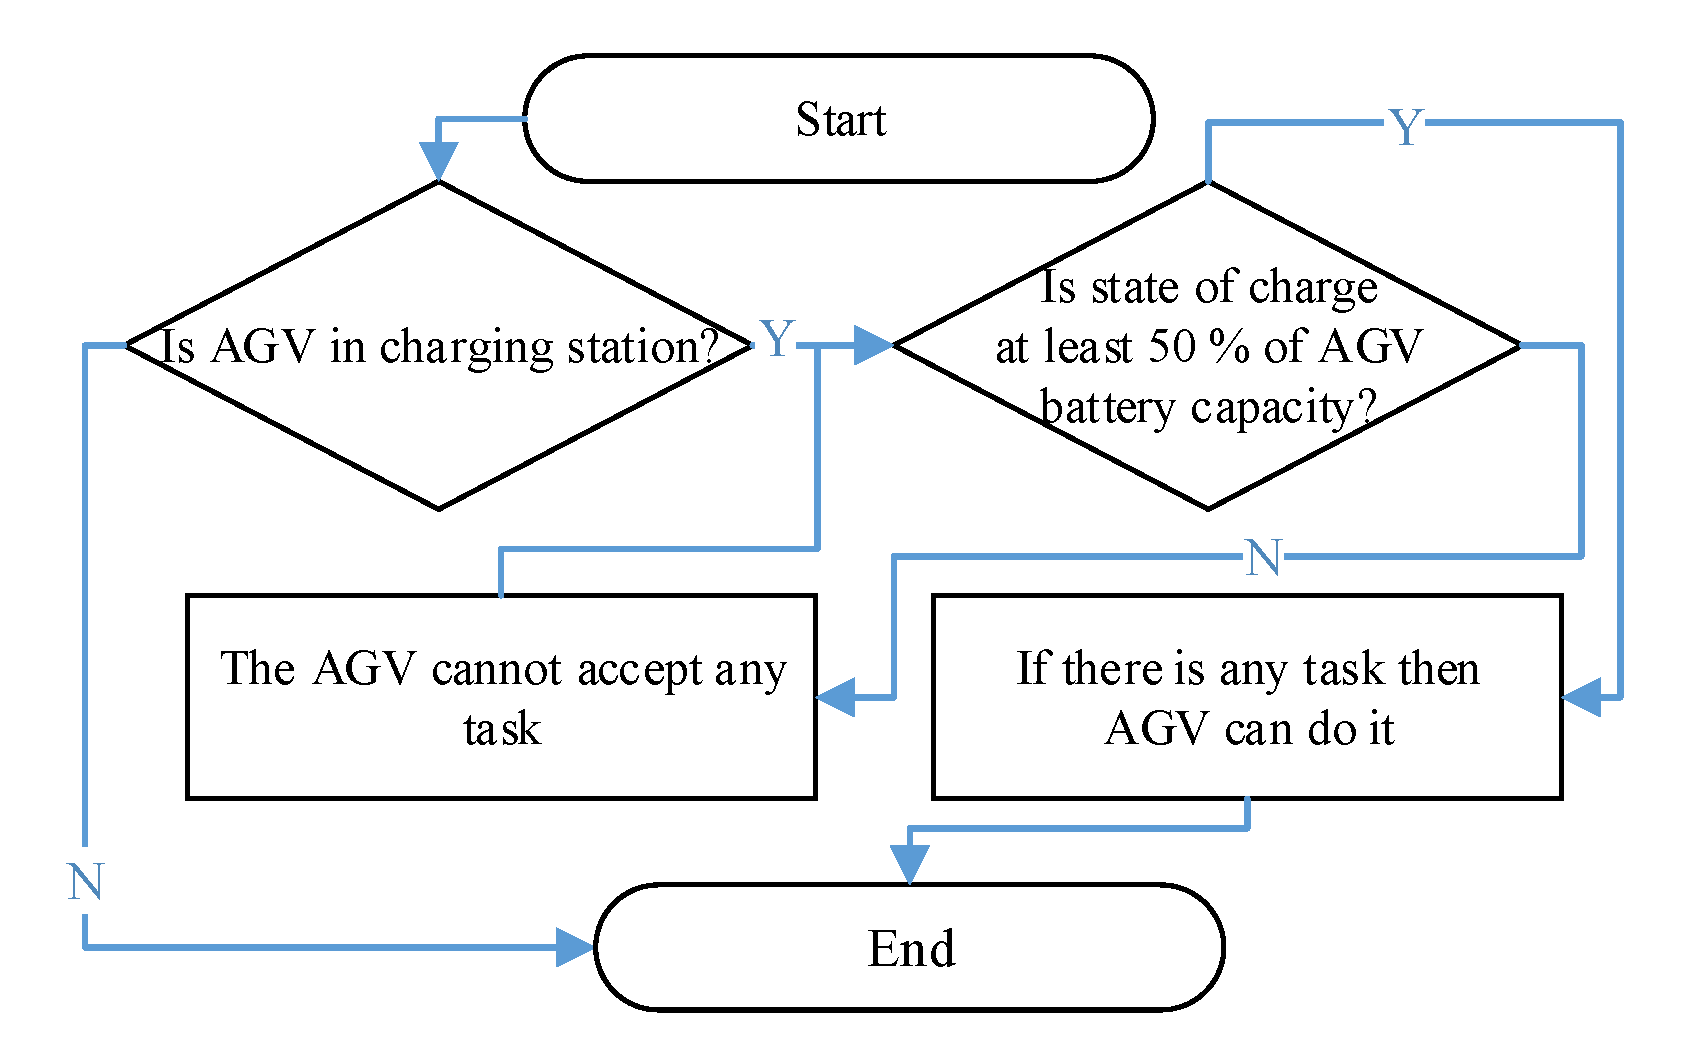
The charging logic within step C9 is defined so that the battery level never slips below the critical reserve limit, which in our case is 60 Ah (Figure 11). In the charging process, when charging after reaching the reserve, the AGV can then leave charging if it is necessary to perform the task only when the battery charge level is 50% of its total capacity.
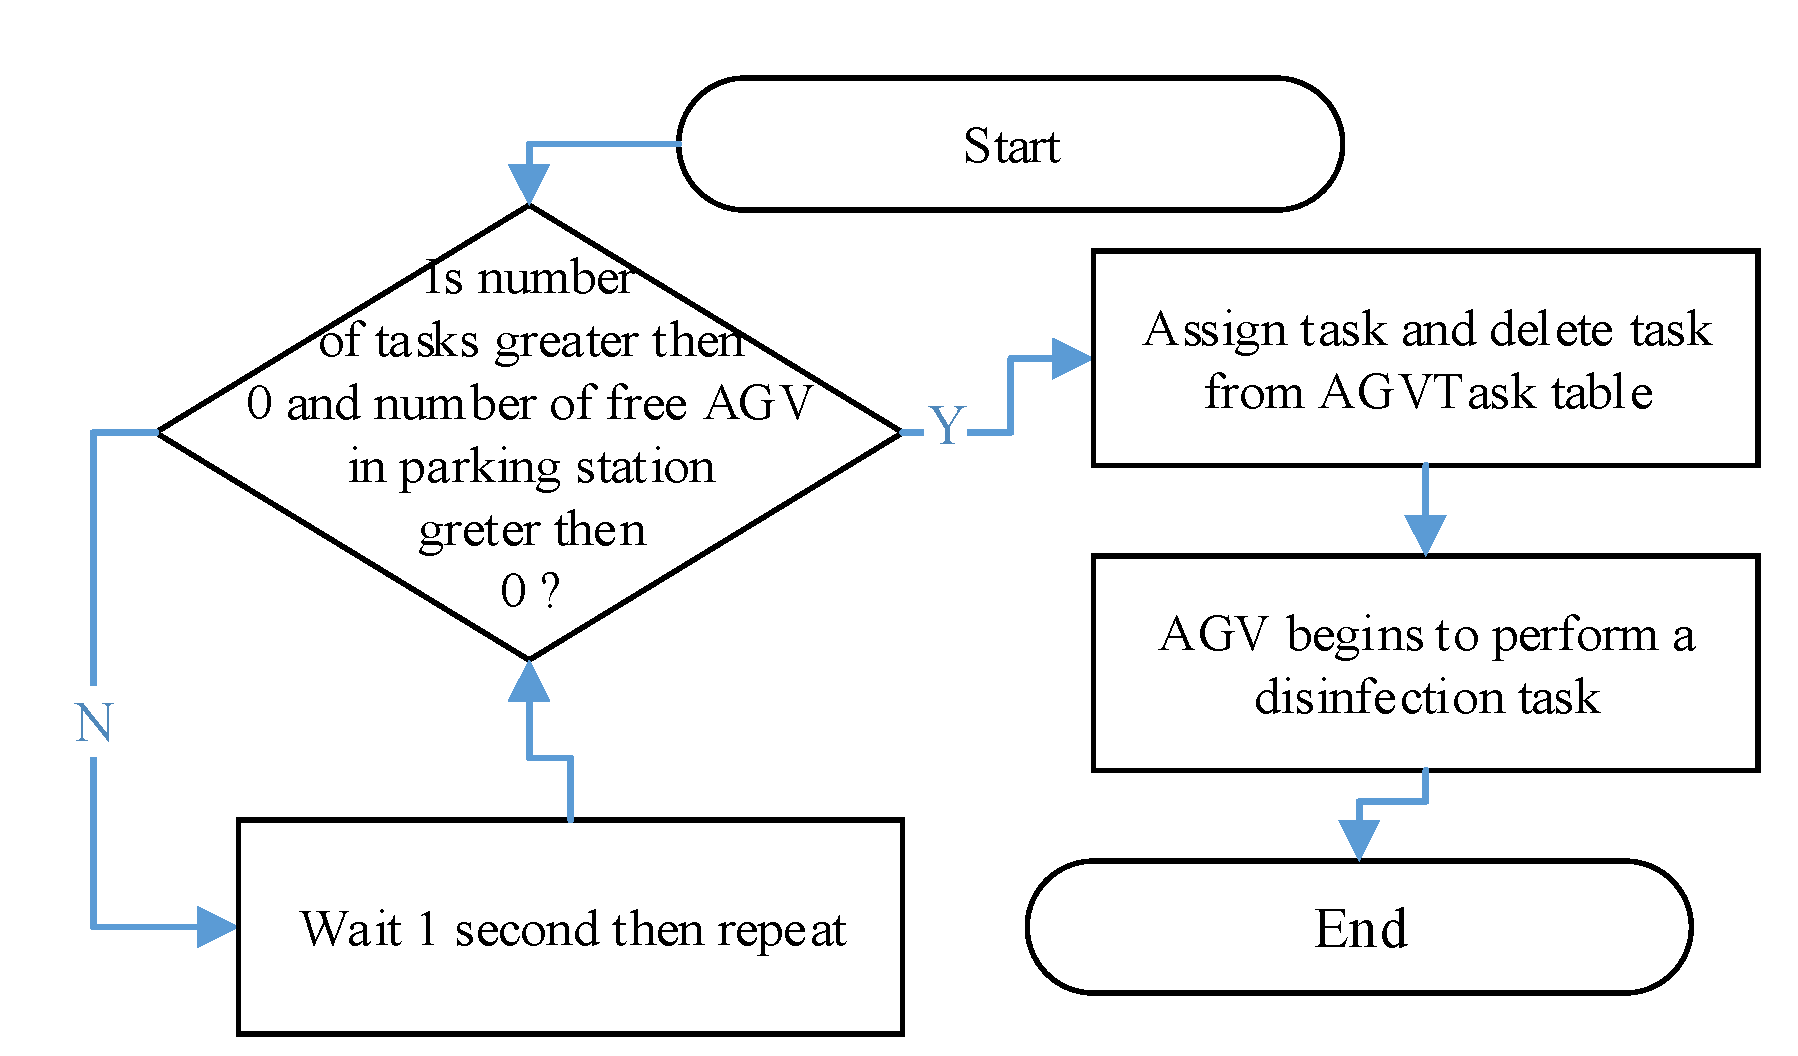
The assignment of a task to an AGV located at the parking/charging place is carried out on the basis of rules on whether the AGV is charging and, at the same time, whether there is a task in the task queue (Figure 12).
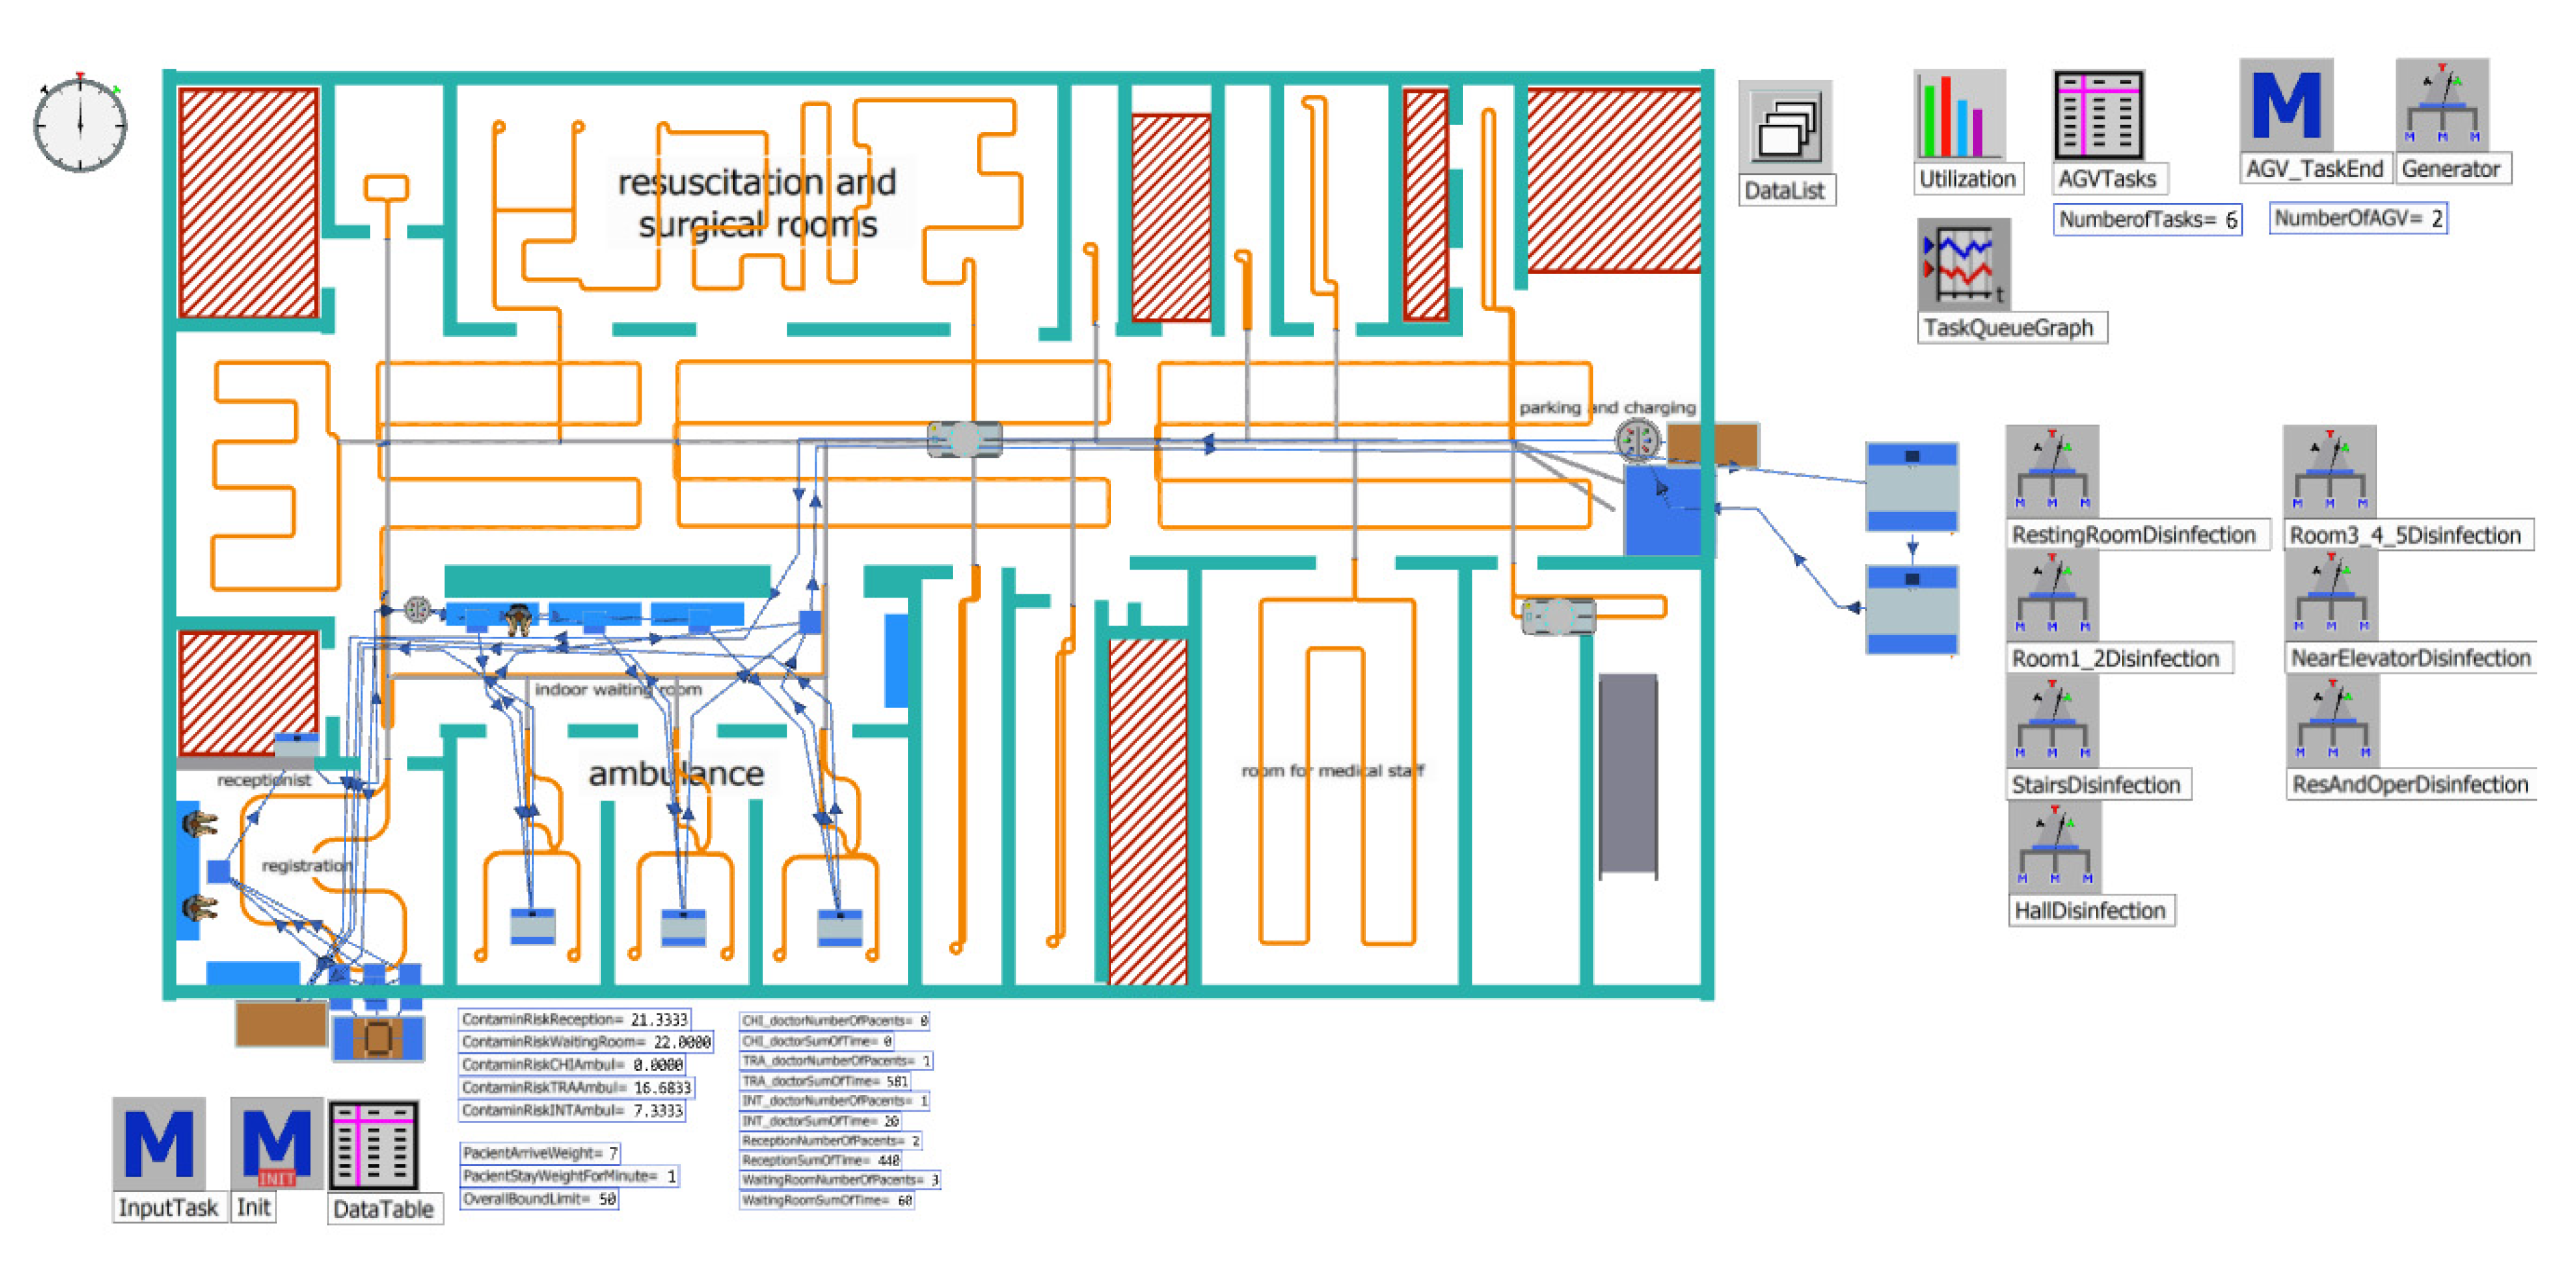
The last step of the block is to define the initialisation number of AGV disinfection units (C10) that will be used for the verification and validation of the entire model (D1). Because the AGV system is not implemented, a portion of the logic of patients is verified and validated. The AGV design is verified to comply with the proposed logic. The simulation model after verification and validation is shown in Figure 13.
Figure 13 represents the combination of Figure 7 and Figure 9 in one dynamic model. The other objects are Tecnomatix Plant Simulation software objects that create the overall logic of the model (for example, methods containing the program, tables, generators, and variables).
In our case, Step D2 defines the number of experiments: there are 20 experiments with 30 repetitions, where the first five experiments consist of testing one to five AGV with an assumed distribution of the number of incoming patients derived from historical data. Thus, the second group of experiments, six to ten, tested the location of one to five disinfectant AGVs with an increased patient input of two per hour. In both cases, AGV could enter the area even if there were patients or during treatment. Experiments 11 to 20 consisted of integrating a rule where the disinfectant AGV could enter the area only when no patient was there. The first five experiments, with the expected distribution of patients, entered the system over time, and the last five experiments had an increased number of patients of two for an hour. The verification itself was carried out for a period of 28 days.

3.2. Experiment Results

Table 2 and Table 3 show statistics on the use of the disinfection AGV as well as the average number of tasks waiting to be completed each minute. Statistics for the estimation errors of the realised simulation experiments are shown in Table 4 and Table 5. The graphical representation is shown in
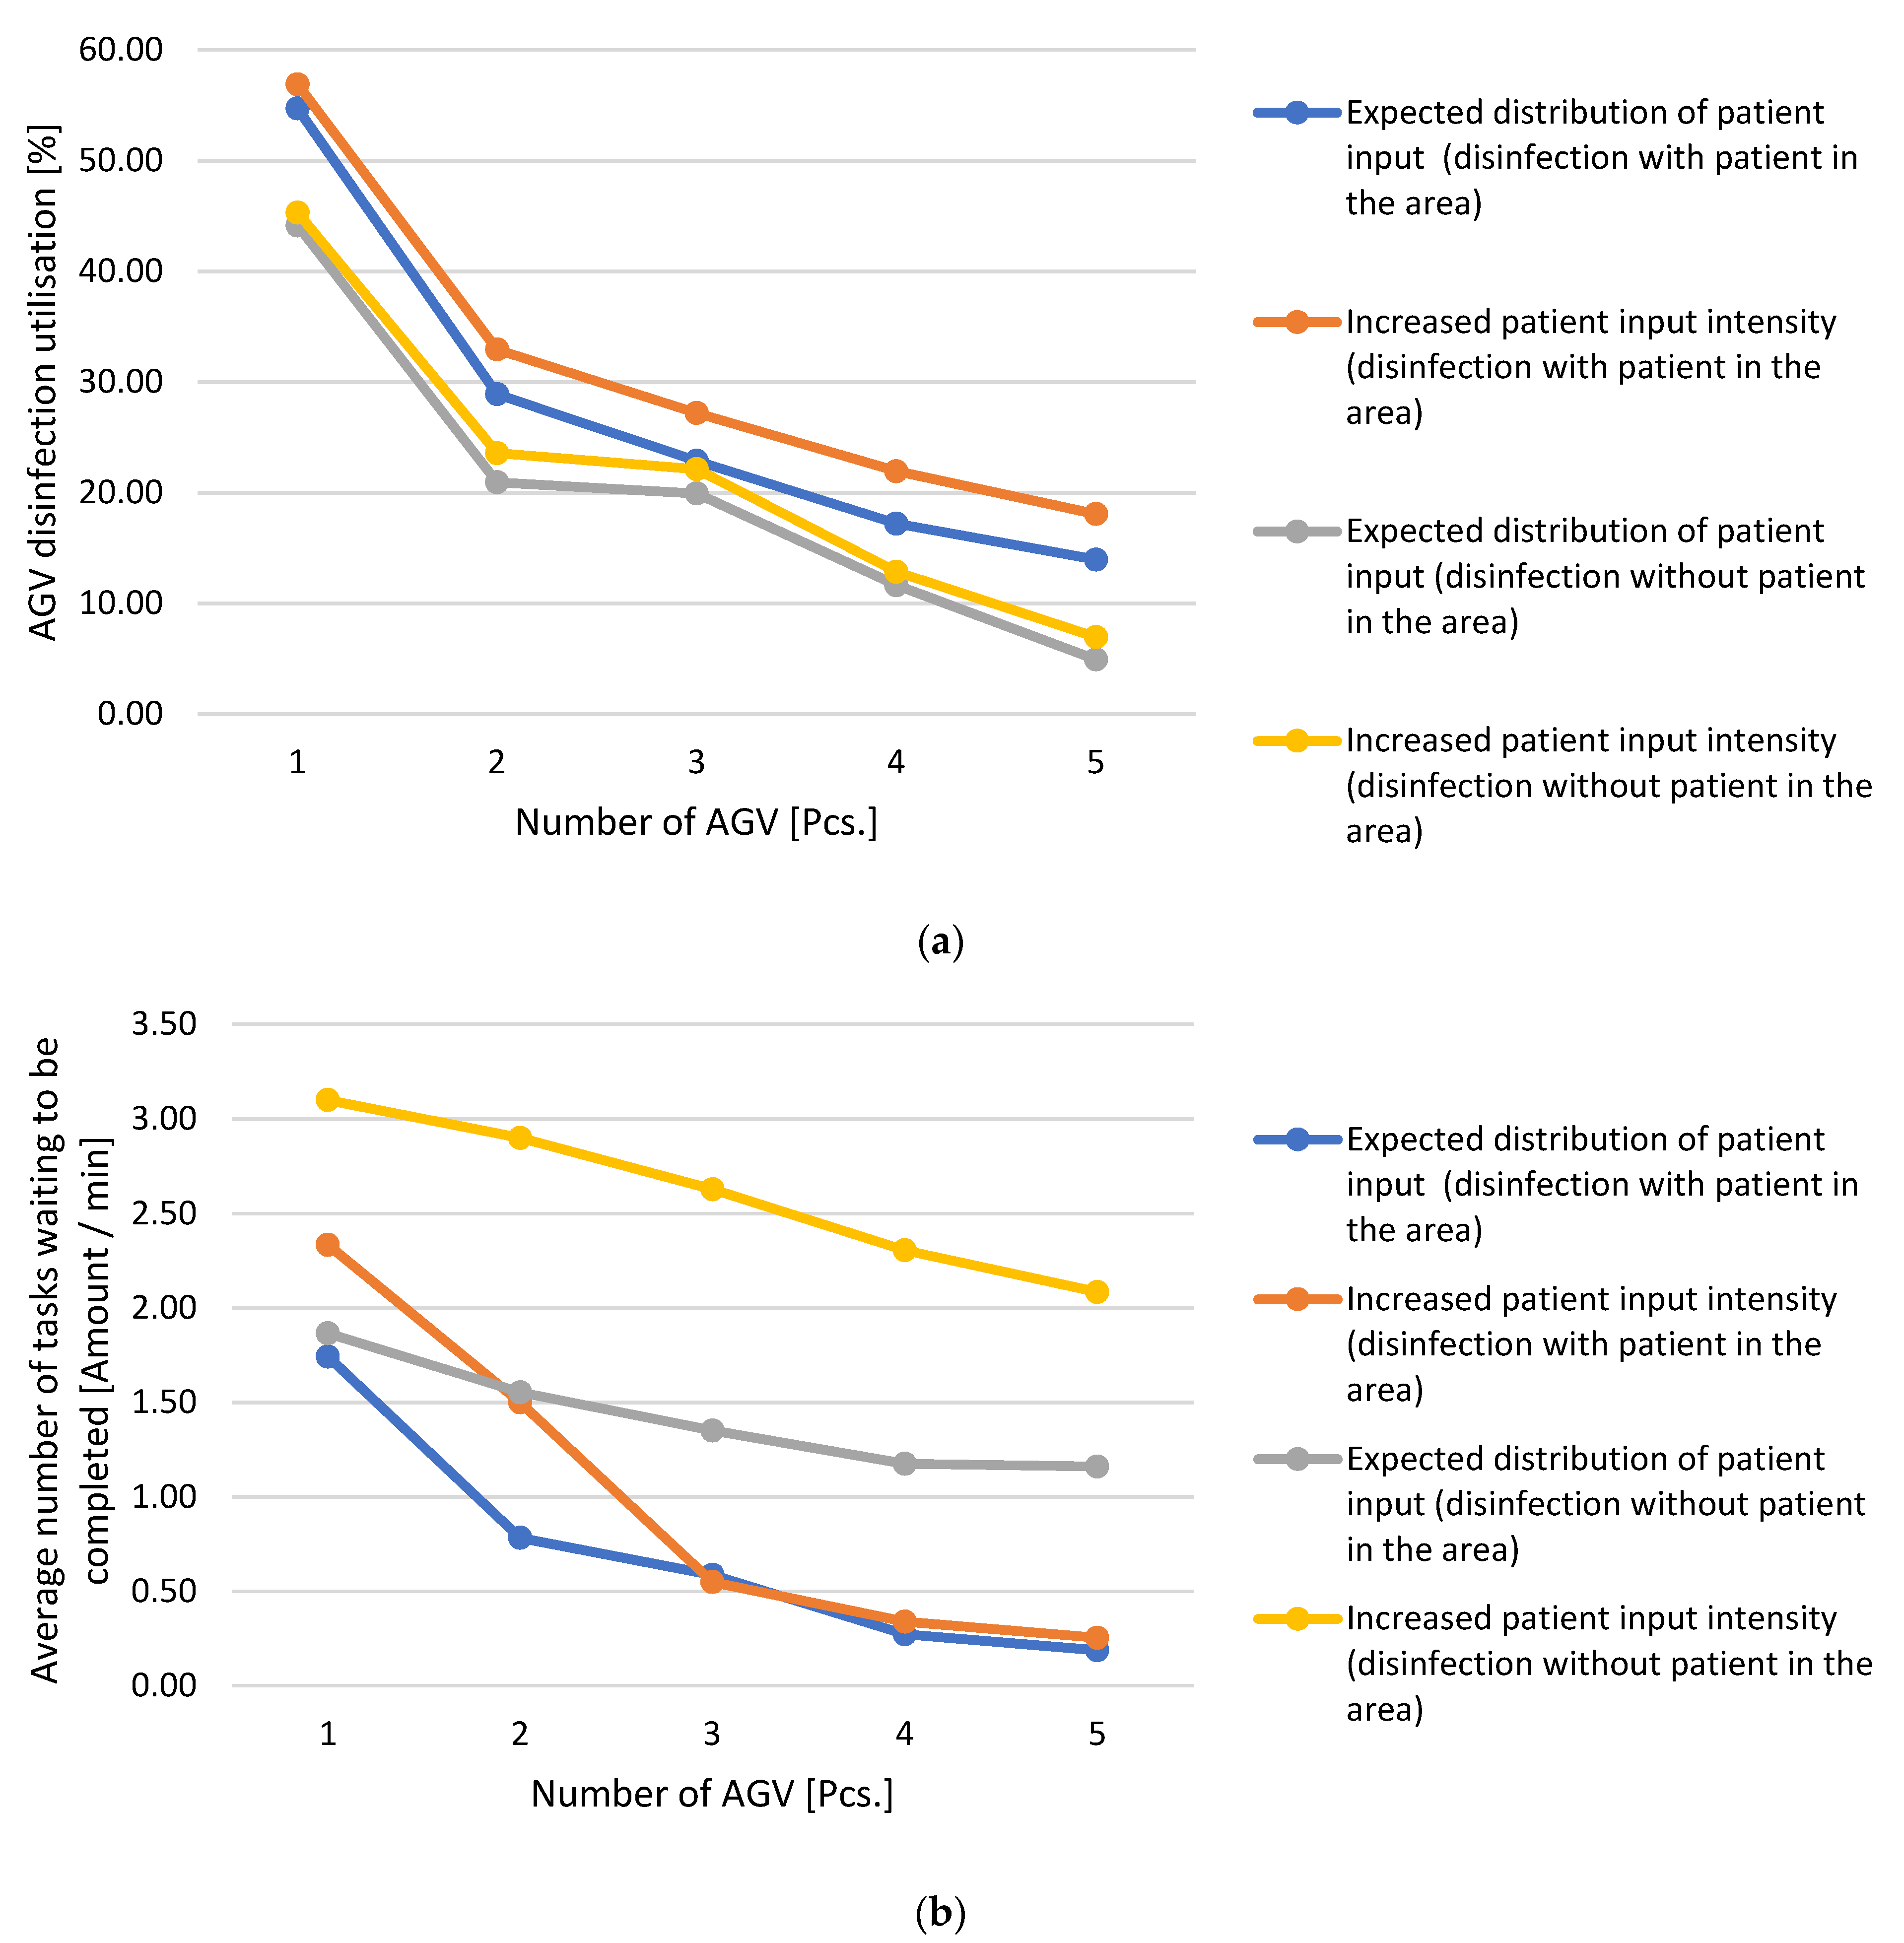
 Figure 14.
From the results of the experiments shown in Figure 13a,b, the following findings can be stated: if a case with the expected distribution of patients is considered without a limitation that is based on patient movement, it can be observed that with the increasing number of disinfection AGVs, the average number of waiting tasks and AGV utilisation decreases. The most significant downward shift for both parameters was between using one and two disinfection AGVs. The decrease is smaller when using two or more AGVs, and when adding more AGVs, the decrease in utilisation and the number of waiting tasks are roughly the same. This is due to the fact that the AGV that completed its task and asked for the next one was always closer than the AGV that parked at the charging point and accepted the task. As a result, the AGVs that were at the charging point were not used and only left when several tasks entered the queue at once or the inquiring, returning AGV did not have a sufficient battery level.
In the case of an increase in patient input intensity without limiting the movement of patients, the same effect was also visible. The development was the same, and the different values were mainly due to the higher number of generated tasks derived from the higher movement of patients around the space.
In experiments involving the condition that no patient should be near an AGV in the disinfection area, it was observed that the average number of tasks was affected by the fact that even if an AGV was free, it could not enter the area. This reduced AGV utilisation; for the average number of tasks, this was probably the most noticeable fact. The AGVs, therefore, waited for the space to be emptied, which was reflected in the parameters, and even a higher number of AGVs could not increase it.
When the patient input intensity increased, the periods without patients were shortened, which worsened both parameters, even though the difference in the expected patient entry in terms of utilisation was not as visible as the number of pending tasks.
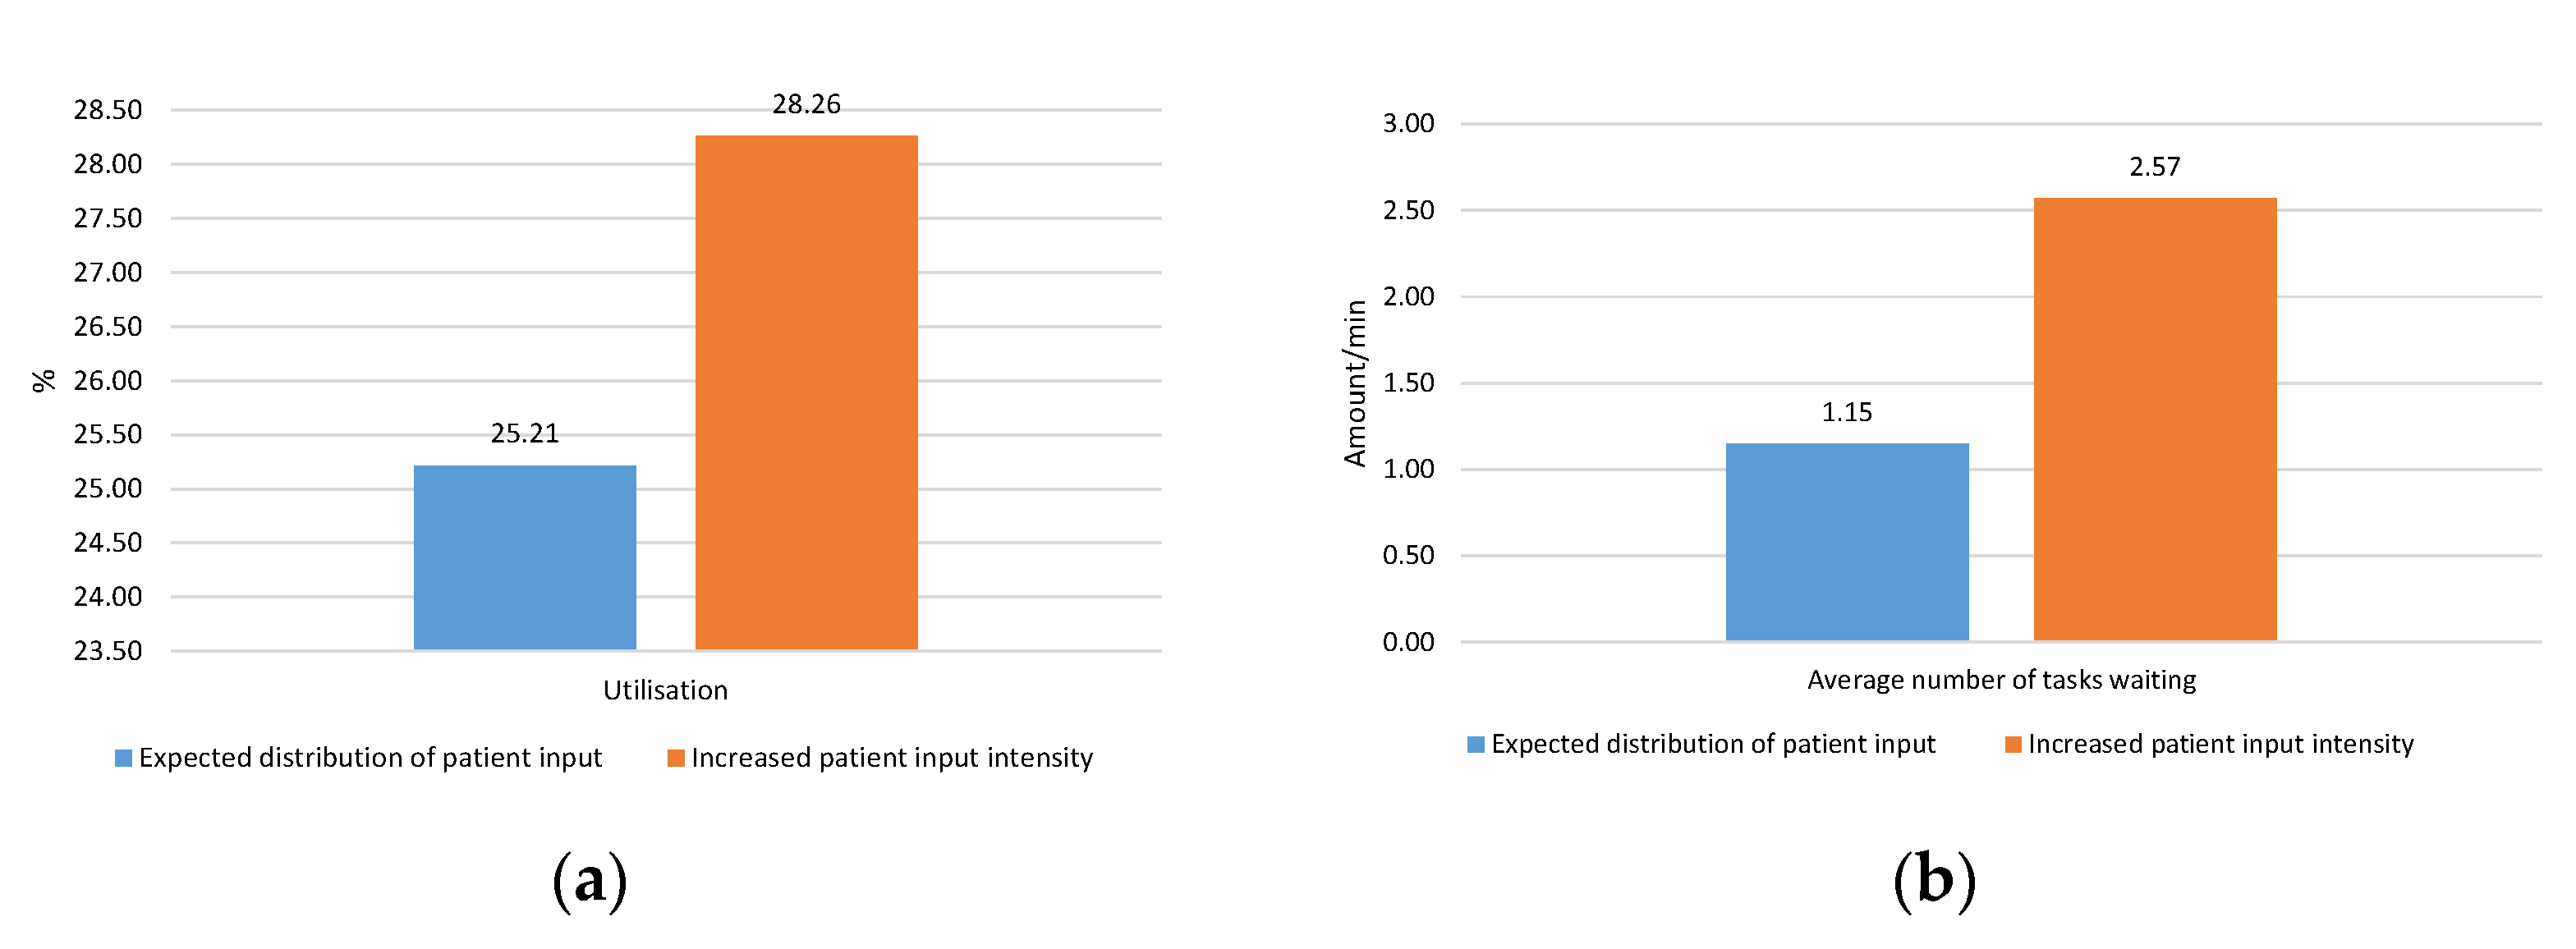
Only one AGV would be ideal in terms of utilisation, but it is insufficient for the waiting task indicator. Because multiple tasks can be generated dynamically at times, and there may be a period without generated tasks or a waiting period for entry into the area for disinfection, the utilisation is significantly affected. Therefore, based on the results, an experiment was carried out in which two disinfectant AGVs were placed in the system, where one was intended for air purification in the area even if there were patients. The second AGV disinfected surfaces and could only enter the system when it was without patients. The results of the simulation experiments performed are listed in Table 6, and the graphical expression is given in Figure 15.
These results show that this solution is the most suitable solution based on a look at the limitations of disinfectant AGVs as well as the number of waiting tasks and utilisation. This solution is most suitable if we consider the possible future maximum load on AGVs due to the increased patient arrival rate. With regard to the average number of waiting tasks, it was 1.15 waiting tasks every minute versus 1.55 acquired with consideration of restricting entry at disqualification. Moreover, in the case of an increased patient arrival rate of 2.57, this value is better than the value of 2.9 from the experiment with the limitation of the AGV move. The deterioration of the value compared to the experiment in the absence of restrictions on the entry of the AGV can be explained by the specialisation of each AGV, where a higher percentage of tasks was created for AGV disinfecting areas without the presence of patients. With regard to the utilisation and values of 25.21% and 28.26%, it can be concluded that compared to a solution without specialisation and limiting the movement of disinfectant AGVs at 20.95% and 23.57%, this is better utilisation because it no longer had to wait for the patients’ departure. The results of the utilisation of disinfectant AGVs may be improved by extending the area where AGVs operate where disinfection tasks can be generated in order to supplement the period without tasks and ensure that the disinfecting AGVs are better utilised.

4. Discussion and Conclusions

Modern service mobile robotic systems are prospective technologies whose application areas are constantly expanding. Healthcare remains the domain of medics, where most of the activities are performed by people, but parts of these activities can be transferred to machines. Disinfection is a regular, routine activity for doctors that consumes a significant amount of their time. Part of these activities can be transferred to robotic devices, such as disinfectant ground AGVs, which are becoming more popular. At its core, the article describes the design of a system that uses simulation, through which it is possible to define the utilisation and the number of these disinfectant AGVs used to disinfect the premises. Using real-time data, the designed system that determines the utilisation of disinfectant AGVs was applied to an urgent care reception in Zilina. The determination of the number of devices considers both dynamically generated tasks and regularly occurring tasks. The results show that, by using simulations, we can quite precisely define the occurrence of dynamically generated tasks, where the main indicator of their occurrence is the number of visits by the patient and their stay in the location.
The main benefit of the article is the precise use of an approach that takes into account the simulated dynamics of patient movement based on historical data in determining the number of disinfectant AGVs, so it is not only a static calculation based on the size of the disinfected area. In standard practice, the number of disinfecting AGVs depends on the size of the disinfected area and the reach of the disinfecting medium, while if it is a matter of the surfaces of the cleaning equipment, another factor is the time in which they must complete the disinfection. The simulation model makes it possible to take into account the dynamics of people’s movement, which is not possible with a static calculation, and thus we can define the number of disinfecting AGVs even outside the specified time frame. Of course, the dynamics of randomly created tasks can be different in each facility where disinfectant AGVs will be used. Medical or other healthcare personnel, for example, may enter the task to assess the situation. The article was used for the calculation of the patients’ length of stay in the system as well as the number of arrivals. As soon as the layout of the space changes, it is necessary to implement new simulation runs for the analysis. It is the system for determining the number of AGVs through simulation that guarantees a relatively quick determination of outputs when inputs are changed. As soon as the inputs change, it is always necessary to verify the entire system as well as to evaluate the results obtained by simulation during the experiments.
The main limitation of the research itself was that each AGV has different distances for disinfection as well as other numerical characteristics. Therefore, the paths, as well as the speed of movement, can be different. The system is suitable for facilities where regular motion and access pathways can be defined. If there is a frequent change of area, it cannot be determined precisely for future utilisation of disinfectant AGVs. An agent-based simulation would need to be utilised based on the programme and randomly produced obstacles once an ambient sensing system and random movement due to barriers were used, basically determining the utilisation even in such a dynamically changing space. Today, there are two types of vehicles in the disinfection ground AGV area, divided according to their ability to choose a route, with one following predefined circuits and the other navigating autonomously. The simulation itself in the Tecnomatix Plant Simulation software makes it possible to realise interactions that approach agent-based simulation, but the simulated AGV itself was tied to the route, therefore the results obtained do not require the use of a full agent-based simulation.
The future direction of research in this area would therefore consist of creating a model that could jointly mimic the behaviour of the disinfectant AGVs with random motion pathways. Such a model must consider the spatial obstacles that will arise in different locations during the simulation, whether they are people or other obstacles. In addition, the trajectory of the movement of the disinfection AGV will have to be random in the designated disinfected area, which will significantly increase the demand for computational power.

Author Contributions

Conceptualisation, Š.M.; methodology, Ľ.D.; software, M.O.; formal analysis, L.M.; investigation, Š.M.; resources, Š.M.; data curation, M.O.; writing—review and editing, M.O. and L.M.; visualisation, Ľ.D.; supervision, M.K.; project administration, M.K.; funding acquisition, M.K. All authors have read and agreed to the published version of the manuscript.

Funding

This research was funded by University of Žilina grant number 313011ASY4.

Institutional Review Board Statement

Not applicable.

Informed Consent Statement

Not applicable.

Data Availability Statement

The data presented in this study are available on request from the corresponding author. Due to company privacy, the full text of the data is not publicly available.

Acknowledgments

This article was funded by the University of Žilina project 313011ASY4—“Strategic implementation of additive technologies to strengthen the intervention capacities of emergencies caused by the COVID-19 pandemic”.

Conflicts of Interest

The authors declare no conflict of interest.

References

  1. Büchler, A.C.; Ragozzino, S.; Wicki, M.; Spaniol, V.; Jäger, S.; Seth-Smith, H.M.B.; Goldenberger, D.; Hinic, V.; Egli, A.; Frei, R.; et al. Patients Exposed to Vancomycin-Resistant Enterococci during in-Hospital Outbreaks in a Low Endemic Setting: A Proposal for Risk-Based Screening. Antimicrob. Resist. Infect. Control 2022, 11, 60. [Google Scholar] [CrossRef] [PubMed]
  2. Fukuda, Y.; Ando, S.; Fukuda, K. Knowledge and Preventive Actions toward COVID-19, Vaccination Intent, and Health Literacy among Educators in Japan: An Online Survey. PLoS ONE 2021, 16, e0257552. [Google Scholar] [CrossRef] [PubMed]
  3. Sarker, S.; Jamal, L.; Ahmed, S.F.; Irtisam, N. Robotics and Artificial Intelligence in Healthcare during COVID-19 Pandemic: A Systematic Review. Robot. Auton. Syst. 2021, 146, 103902. [Google Scholar] [CrossRef] [PubMed]
  4. Micieta, B.; Fusko, M.; Binasova, V.; Furmannova, B. Business Model Canvas in Global Enterprises. In Proceedings of the 19th International Scientific Conference Globalization and Its Socio-Economic Consequences 2019-Sustainability in the Global-Knowledge Economy, Rajecke Teplice, Slovakia, 9–10 October 2019; Kliestik, T., Ed.; EDP Sciences: Ulis, France, 2020; Volume 74, p. 02010. [Google Scholar] [CrossRef]
  5. Rakyta, M.; Fusko, M.; Haluška, M.; Grznár, P. Maintenance Support System for Reconfigurable Manufacturing Systems. In Proceedings of the the 26th DAAAM Intern. Symposium on Intelligent Manufacturing and Automation, Zadar, Croatia, 21–24 October 2015; pp. 1102–1108. [Google Scholar] [CrossRef]
  6. Micieta, B.; Durica, L.; Binasova, V. New Solution of Abstract Architecture for Control and Coordination Decentralized Systems. Teh. Vjesn. 2018, 25, 135–143. [Google Scholar] [CrossRef]
  7. Long, J.; Zhang, C.L. The Summary of AGV Guidance Technology. In Manufacturing Engineering and Automation Ii, Pts 1–3; Zhang, L.C., Zhang, C.L., Horng, J.H., Chen, Z., Eds.; Trans Tech Publications Ltd.: Stafa-Zurich, Switzerland, 2012; Volume 591–593, pp. 1625–1628. [Google Scholar] [CrossRef]
  8. Gregor, M.; Hodon, R.; Grznar, P.; Mozol, S. Design of a System for Verification of Automatic Guided Vehicle Routes Using Computer Emulation. Appl. Sci. 2022, 12, 3397. [Google Scholar] [CrossRef]
  9. Yinghai, W.; Haoming, Z.; Soon, P.L. Research on Power Consumption of Lithium Ion Battery Protection Circuit. In Modern Technologies in Materials, Mechanics and Intelligent Systems; Huang, X.Y., Zhu, X.B., Xu, K.L., Wu, J.H., Eds.; Trans Tech Publications Ltd.: Durnten-Zurich, Switzerland, 2014; Volume 1049, pp. 582–585. [Google Scholar] [CrossRef]
  10. Marková, I.; Oravec, M.; Osvaldová, L.M.; Sventeková, E.; Jurč, D. Magnetic Fields of Devices during Electric Vehicle Charging: A Slovak Case Study. Symmetry 2021, 13, 1979. [Google Scholar] [CrossRef]
  11. Bubenik, P.; Plinta, D. Interactive Scheduling System. Manag.-J. Contemp. Manag. Issues 2005, 10, 89–98. [Google Scholar]
  12. Grznar, P.; Gregor, M.; Gaso, M.; Gabajova, G.; Schickerle, M.; Burganova, N. Dynamic Simulation Tool for Planning and Optimisation of Supply Process. Int. J. Simul. Model 2021, 20, 441–452. [Google Scholar] [CrossRef]
  13. Stefanik, A.; Grznar, P.; Micieta, B. Tools for Continual Process Improvement-Simulation and Benchmarking. In Annals of DAAAM for 2003, Proceedings of the 14th International DAAAM Symposium: Intelligent Manufacturing & Automation: Focus on Reconstruction and Development, Sarajevo, Bosnia and Herzegovina, 22–25 October 2003; Katalinic, B., Ed.; Daaam Int Vienna: Wien, Austria, 2003; pp. 443–444. [Google Scholar]
  14. Sasik, R.; Haluska, M.; Madaj, R.; Gregor, M.; Grznar, P. Development of the Assembly Set for the Logistic Transport Solution. In Latest Methods of Construction Design; Dynybyl, V., Berka, O., Petr, K., Lopot, F., Dub, M., Eds.; Springer International Publishing Ag: Cham, Switzerland, 2016; pp. 81–86. [Google Scholar] [CrossRef]
  15. Vavrik, V.; Fusko, M.; Buckova, M.; Gaso, M.; Furmannova, B.; Staffenova, K. Designing of Machine Backups in Reconfigurable Manufacturing Systems. Appl. Sci. 2022, 12, 2338. [Google Scholar] [CrossRef]
  16. Severin, B.F.; Suidan, M.T. Ultraviolet disinfection for municipal wastewater. Chem. Eng. Prog. 1985, 81, 37–44. [Google Scholar]
  17. Gray, N.F. Chapter Thirty-Four-Ultraviolet Disinfection. In Microbiology of Waterborne Diseases, 2nd ed.; Percival, S.L., Yates, M.V., Williams, D.W., Chalmers, R.M., Gray, N.F., Eds.; Academic Press: London, UK, 2014; pp. 617–630. [Google Scholar] [CrossRef]
  18. Rubaek, T.; Cikotic, M.; Falden, S. Evaluation of the UV-Disinfection Robot. Available online: https://prhoinsa.com/images/pdf/uvd/UVDR-Whitepaper.pdf (accessed on 9 June 2022).
  19. Disinfection Robots Will Open the Era of Intelligent Epidemic Prevention. Available online: https://www.tzbotautomation.com/news/disinfection-robots-will-open-the-era-of-intel-51399744.html (accessed on 6 June 2022).
  20. Begić, A. Application of Service Robots for Disinfection in Medical Institutions. Adv. Technol. Syst. Appl. II 2017, 28, 1056–1065. [Google Scholar] [CrossRef]
  21. Karabegović, I.; Dolecek, V. The Role of Service Robots and Robotic Systems in the Treatment of Patients in Medical Institutions. Adv. Technol. Syst. Appl. 2017, 3, 9–25. [Google Scholar] [CrossRef]
  22. Lotti, T.M.; Gianfaldoni, S. Ultraviolet A-1 in Dermatological Diseases. In Ultraviolet Light in Human Health, Diseases and Environment; Ahmad, S.I., Ed.; Advances in Experimental Medicine and Biology; Springer International Publishing: Cham, Switzerland, 2017; Volume 996, pp. 105–110. [Google Scholar] [CrossRef]
  23. Liu, J.X.; Goryakin, Y.; Maeda, A.; Bruckner, T.; Scheffler, R. Global Health Workforce Labor Market Projections for 2030; Working Paper; World Bank: Washington, DC, USA, 2016. [Google Scholar] [CrossRef]
  24. Liu, J.X.; Goryakin, Y.; Maeda, A.; Bruckner, T.; Scheffler, R. Global Health Workforce Labor Market Projections for 2030. Hum. Resour. Health 2017, 15, 11. [Google Scholar] [CrossRef] [PubMed]
  25. Maheboob, S.A.; Landge, P.M.G. Automated Guided Vehicle (Agv) System in Healthcare Facility. Int. J. Innov. Eng. Res. Technol. 2018, 1–6. [Google Scholar]
  26. Beaulieu, M.; Bentahar, O. Digitalization of the Healthcare Supply Chain: A Roadmap to Generate Benefits and Effectively Support Healthcare Delivery. Technol. Forecast. Soc. Change 2021, 167, 120717. [Google Scholar] [CrossRef]
  27. Miller, G. Hospital Automated Guided Vehicle (AGV) Market Recovery and Analysis Report|Dmt, Utmtn, Dnh. Available online: https://www.bignewsnetwork.com/news/272218613/hospital-automated-guided-vehicle-agv-market-recovery-and-analysis-report--dmt-utmtn--dnh (accessed on 5 September 2022).
  28. Worldwide-Medical-Robotics-Market-Size. Available online: https://www.statista.com/statistics/1321270/worldwide-medical-robotics-market-size/ (accessed on 5 September 2022).
  29. Kowalski, W. UV Surface Disinfection. In Ultraviolet Germicidal Irradiation Handbook: UVGI for Air and Surface Disinfection; Kowalski, W., Ed.; Springer: Berlin/Heidelberg, Germany, 2009; pp. 233–254. [Google Scholar] [CrossRef]
  30. Chen, J.; Loeb, S.; Kim, J.-H. LED Revolution: Fundamentals and Prospects for UV Disinfection Applications. Environ. Sci. Water Res. Technol. 2017, 3, 188–202. [Google Scholar] [CrossRef]
  31. Permann, S. Automated Guided Vehicles and Autonomous Mobile Robots in Hospitals. Master Thesis, TU Wien, Wien, Austria, 2021. [Google Scholar]
  32. Holland, J.; Kingston, L.; McCarthy, C.; Armstrong, E.; O’Dwyer, P.; Merz, F.; McConnell, M. Service Robots in the Healthcare Sector. Robotics 2021, 10, 47. [Google Scholar] [CrossRef]
  33. Bhosekar, A.; Işık, T.; Ekşioğlu, S.; Gilstrap, K.; Allen, R. Simulation-Optimization of Automated Material Handling Systems in a Healthcare Facility. IISE Trans. Healthc. Syst. Eng. 2021, 11, 316–337. [Google Scholar] [CrossRef]
  34. Khyasudeen, M.F.; Buniyamin, N. Autonomous Ground Vehicle (COR-AGV) Disinfectant System Using Far-UVC Light Exposure. J. Electr. Electron. Syst. Res. 2022, 20, 1–10. [Google Scholar] [CrossRef]
  35. Córdoba., M. Development of an AGV Robot Based on ROS for Disinfection in Clinical Environments. Bachelor’s Thesis, University of Barcelona, Barcelona, Spain, 2021. [Google Scholar]
  36. Yao, Q.-H.; Zhu, Q.-Y. Investigation of the Contamination Control in a Cleaning Room with a Moving AGV by 3D Large-Scale Simulation. J. Appl. Math. 2013, 2013, e570237. [Google Scholar] [CrossRef] [Green Version]
Figure 1. Blocks of a system for the analysis of disinfection automated guided vehicle utilisation.
Applsci 12 09644 g001
Figure 2. Block A phase of data collection needed to create a simulation model.
Applsci 12 09644 g002
Figure 3. Block B phase of simulation model creation for the patient and medic parts.
Applsci 12 09644 g003
Figure 4. Block C phase of the creation of the simulation model for the disinfection AGV.
Applsci 12 09644 g004
Figure 5. Block D simulation experiments: realisation, determination of disinfection AGV utilisation, and required number.
Applsci 12 09644 g005
Figure 6. Average daily arrival rates during the week.
Applsci 12 09644 g006
Figure 7. Layout and logic of patient movement shown through connectors.
Applsci 12 09644 g007
Figure 8. Logic of patient decision making at the exit of the surgical ambulance, schematically.
Applsci 12 09644 g008
Figure 9. Created paths in the simulation model. The grey lines are marked access paths and the orange lines are individual disinfection paths.
Applsci 12 09644 g009
Figure 10. Task assignment logic and returning to a parking charging point schematically.
Applsci 12 09644 g010
Figure 11. AGV charging logic, schematically.
Applsci 12 09644 g011
Figure 12. Task assignment logic for AGV, schematically.
Applsci 12 09644 g012
Figure 13. Creating a simulation model designed for experiments.
Applsci 12 09644 g013
Figure 14. Results of simulation experiments processed graphically: (a) for AGV disinfection utilisation; (b) for an average number of tasks waiting to be completed.
Applsci 12 09644 g014
Figure 15. Graphical representation of simulation experiment results for the combined use of surface and spatial disinfection AGV: (a) utilisation; (b) average number of waiting tasks.
Applsci 12 09644 g015
Table 1. Duration of treatment at each workplace.
Patient LogicType of Patient
AcuteUrgentNon-Urgent
TraumaTriangular (1:01:12, 1:01:12, 5:55:48)Triangular (10:48, 10:48, 1:40:48)Uniform (0:36, 10:12)
SurgicalTriangular (1:01:12, 1:01:12, 8:52:12)Triangular (10:48, 10:48, 1:42:00)Uniform (1:48, 10:48)
InternalTriangular (1:01:12, 1:01:12, 7:04:48)Triangular (10:48, 10:48, 1:42:36)Uniform (0:36, 10:12)
RadiologyTriangular (27:00, 12:36, 59:24)Triangular (38:00, 18:44, 1:13:11)-
BiochemistryTriangular (1:48, 1:12, 3:00)-
Table 2. Results of realised simulation experiments for disinfection with patients at locations.
Expected Distribution of Patient InputIncreased Patient Input Intensity
1 Pc. of AGV2 Pcs. of AGV3 Pcs. of AGV4 Pcs. of AGV5 Pcs. of AGV1 Pc. of AGV2 Pcs. of AGV3 Pcs. of AGV4 Pcs. of AGV5 Pcs. of AGV
Utilisation of disinfection AGV (%)54.7128.9022.8817.2113.9656.8832.9427.2021.9418.08
Average number of tasks waiting to be executed (amount/min)1.740.780.590.270.192.331.500.550.340.25
Table 3. Results of simulation experiments carried out for disinfection if no patients are in the area.
Expected Distribution of Patient InputIncreased Patient Input Intensity
1 Pc. of AGV2 Pcs. of AGV3 Pcs. of AGV4 Pcs. of AGV5 Pcs. of AGV1 Pc. of AGV2 Pcs. of AGV3 Pcs. of AGV4 Pcs. of AGV5 Pcs. of AGV
Utilisation of disinfection AGV (%)44.1420.9519.9411.664.9445.2923.5722.1312.866.96
Average number of tasks waiting to be executed (amount/min)1.871.551.351.171.163.102.902.632.312.08
Table 4. Estimation error of realised simulation experiments for disinfection with patients in locations.
Expected Distribution of Patient InputIncreased Patient Input Intensity
1 Pc. of AGV2 Pcs. of AGV3 Pcs. of AGV4 Pcs. of AGV5 Pcs. of AGV1 Pc. of AGV2 Pcs. of AGV3 Pcs. of AGV4 Pcs. of AGV5 Pcs. of AGV
Standard error of estimate1.126841.170941.285561.187461.198841.279221.097281.172681.305851.24733
Table 5. Estimation error of simulation experiments carried out for disinfection if no patients are in the area.
Expected Distribution of Patient InputIncreased Patient Input Intensity
1 Pc. of AGV2 Pcs. of AGV3 Pcs. of AGV4 Pcs. of AGV5 Pcs. of AGV1 Pc. of AGV2 Pcs. of AGV3 Pcs. of AGV4 Pcs. of AGV5 Pcs. of AGV
Standard error of estimate1.092051.107691.116841.315311.205870.888021.034641.308211.080211.27884
Table 6. Results of simulation experiments carried out for the combined use of surface and space disinfection by AGV.
Average Number of Tasks Waiting (amount/min)Utilisation (%)
Expected distribution of patient input 1.1525.21
Increased patient input intensity2.5728.26
Publisher’s Note: MDPI stays neutral with regard to jurisdictional claims in published maps and institutional affiliations.

