
Experimental and Numerical Studies on Fatigue Characteristics of CFRP Shaft Tube

1
Institute of Advanced Material and Manufacturing Technology, Wuhan University of Technology, Wuhan 430070, China
2
Hubei Key Laboratory of Digital Manufacturing, Wuhan University of Technology, Wuhan 430070, China
3
Hubei Provincial Engineering Technology Research Center for Magnetic Suspension, Wuhan University of Technology, Wuhan 430070, China
4
School of Mechanical and Electrical Engineering, Wuhan University of Technology, Wuhan 430070, China
*
Author to whom correspondence should be addressed.
Appl. Sci. 2022, 12(18), 8933; https://doi.org/10.3390/app12188933
Submission received: 13 August 2022
/
Revised: 1 September 2022
/
Accepted: 2 September 2022
/
Published: 6 September 2022
(This article belongs to the Topic Fatigue and Fracture Assessment of Structural Components and Materials)
Abstract
:Carbon Fiber Reinforced Plastic (CFRP) shaft tube structure is widely applied in different fields, including aerospace, automotive, and wind power. Since CFRP shaft tube is often subjected to bending fatigue loads, it is of great significance to research its bending fatigue characteristics. Because of its unique advantages, such as a smaller size, lighter weight, and the outstanding ability to form a sensor network, the Fiber Bragg Grating (FBG) sensor is very applicable for health monitoring research of composite material structures. Taking the CFRP shaft tube under bending load as the research object, based on the theory of composite material mechanics and applying the research idea of combining simulation analysis and experiment, the fatigue life, residual stiffness, and fatigue damage evolution of CFRP tubes under three-point bending fatigue loading were studied. Moreover, the fatigue characteristics of CFRP tubes under different fatigue loading were analyzed. At the same time, the ultrasonic phased array was used to obtain the fatigue damage evolution rule by scanning and analyzing the damage to the CFRP shaft tube after different fatigue loading times. Through the application of the FBG sensors, the whole process of fatigue evolution of the CFRP shaft tube was fully monitored.
1. Introduction
Carbon Fiber Reinforced Plastic (CFRP) has the advantages of high specific strength, fatigue resistance, corrosion resistance, and heat resistance. O’Dwyer et al. [1,2,3,4] described how, due to their excellent properties, carbon fiber composite materials are widely used in aerospace, new energy, rail transit, and other fields. However, the CFRP shaft tube structure is often subjected to alternating loads during service. Although the stress is lower than its ultimate strength, the internal micro-cracks will slowly expand, thereby causing matrix cracking, delamination and fiber fracture, and other fatigue damages in the structure. As a result, serious accidents are likely to be caused by the structural strength, stiffness, and other mechanical properties of the attenuation, which brings hidden danger to the use of composite components. Therefore, by exploring its fatigue characteristics under a three-point bending fatigue load, and mastering its fatigue damage evolution mechanism, it is of great significance to formulate timely inspection and maintenance strategies for CFRP shaft tubes and improve the reliability and safety of the tubes during service.
At present, scholars both at home and abroad have done a lot of basic research on the fatigue damage mode of composite materials, the evolution mechanism of fatigue damage, fatigue life, and damage detection. He et al. [5] proposed that the three-point bending fatigue characteristics of CFRP laminates under different fatigue load levels and fatigue loading frequencies were studied. Koch et al. [6] put forward the stiffness failure criterion and the residual stiffness degradation model. They also established the theoretical analysis model of the fatigue life of CFRP laminates. The anisotropy of composite materials enables its fatigue characteristics to be improved, and experimental testing is therefore required to explore the evolution mechanism of composite material fatigue characteristics.
Neidigk et al. [7,8,9,10,11,12,13] mentioned that the commonly used methods for damage detection of composite materials are ultrasonic testing, acoustic emission testing, vibration testing, and radiographic testing, etc. Specifically, ultrasonic testing and radiographic testing are both static damage detection methods, and real-time dynamic damage monitoring cannot be performed during the operation of the structure. As a new type of optical sensor, Fiber Bragg Grating (FBG) sensor is superior to traditional electrical sensors in terms of stability, anti-interference, and durability, and also lighter in weight and small in size. When the FBG sensor is loaded, the grating will deform, causing the center wavelength of the FBG sensor to drift. The central wavelength information of the FBG sensor is collected and converted into the strain information of the point to be measured. Okabe and Yashiro et al. [14,15,16,17] put forward that through the introduction of technology into the damage monitoring of composite materials, the shortcomings of conventional damage detection technologies such as ultrasonic testing and radiographic testing can be effectively overcome. Takeda, Ogasawara, and Yokozeki [18] pointed out that the feasibility of using FBG sensors to evaluate composite material damage has been verified. Guo et al. [19] found through experiments that FBG sensors have good fatigue resistance. Chiang C C [20] et al. used FBG sensors to monitor the fatigue damage evolution process of graphite/epoxy resin composites. The results show that the fatigue damage evolution process of composite materials can be preliminarily identified through the changes in the spectral shape and center wavelength of the FBG sensor.
In this paper, the CFRP shaft tube under a three-point bending load is taken as the research object. Based on composite material mechanics and damage mechanics theory, the fatigue characteristics of the CFRP shaft tube under different bending fatigue loads are analyzed, and the fatigue damage evolution mechanism of the CFRP shaft tube is obtained. The ultrasonic phased array scans and analyzes the damage of the CFRP shaft tube after different fatigue loading times, thereby finally obtaining the fatigue damage evolution law. In addition, the feasibility of the FBG sensor to monitor the fatigue process of the CFRP shaft tube online was verified by pasting the FBG sensor on the surface of the CFRP shaft tube to measure the strain information during the three-point bending fatigue experiment.
2. Numerical Investigations
The finite element model of the CFRP shaft tube was established in ABAQUS software. In this paper, the Hashin failure criterion is used as the fatigue damage failure criterion of the CFRP shaft tube. First, the CFRP shaft tube model was subjected to a quasi-static three-point bending simulation analysis, and hence the elastic ultimate load of the CFRP shaft tube was obtained. Based on the elastic ultimate load, the three-point bending fatigue load of the CFRP shaft tube was determined. Secondly, the three-point bending fatigue characteristics of the CFRP shaft tube model under different fatigue loads are well studied, and the fatigue life and residual stiffness of the shaft tube were obtained. Finally, the evolution mechanism of three-point bending fatigue damage of the CFRP shaft tube model was studied.
2.1. Constitutive Models for Composite Materials
It is generally considered that the volume unit of the composite single-layer plate structure is composed of two parts: the matrix unit and the fiber unit. Based on this, the composite material single-layer plate structure can be regarded as an orthotropic elastomer with three mutual Vertical elastic planes of symmetry. According to the relevant theory of composite mechanics, for anisotropic composite materials, the constitutive relation is shown in Formula (1):
Formula (1) can be abbreviated as:
In Formulas (1) and (2), the subscripts 1, 2, and 3 respectively represent the main directions of the three elastic symmetry planes; is the normal stress, is the shear stress, is the shear strain, is the line strain, is the stiffness matrix and is the stiffness coefficient.
If the strain energy is considered, it can be seen by a derivation that there are only 21 independent stiffness coefficients in the elastic material stiffness matrix; for an orthotropic single-layer plate, because there are 3 orthogonal elastic symmetry planes, there are only 21 independent stiffness coefficients in the stiffness matrix. There are 9 independent stiffness coefficients, then Equation (1) can be simplified as:
When the composite laminate structure is subjected to fatigue load, different forms of damage will appear inside the structure. With the increase in fatigue loading times, the damage inside the laminate structure will gradually expand until the composite structure finally fails. In the process of fatigue failure of composite structure, its bearing capacity will also gradually decrease. When analyzing the fatigue problem of composite material structure, it is necessary to update the stiffness matrix of composite material to the stiffness matrix after performance attenuation in real time. Assuming that the stiffness reduction matrix is K, the stiffness matrix after attenuation can be expressed as:
By substituting Equation (4) into Equation (3), the stress update at the next moment can be obtained.
2.2. Quasi-Static Bending Fatigue Simulation Analysis
The establishment of the shaft tube model refers to GB/T 1449-2005 while taking into account the preparation conditions of the test piece and the size of the three-point bending fixture of the fatigue testing machine. The shaft tube’s inner diameter is 51 mm, the outer diameter is 59.8 mm, and the length is 400 mm. According to the common lay-up principle of carbon fiber composites, four lay-up angles of 0°, ±45°, and 90° were selected, and the lay-up method was symmetric lay-up. The final laying scheme of the CFRP shaft tube is [0/90/45/02/±45/0/−45/0/90] s, with a total of 22 layers and a thickness of 0.2 mm in one layer. The carbon fiber composite material shaft tube test piece used in this paper is FAW200RC38 prepreg produced by Zhongfu Shenying Carbon Fiber Co., Ltd. (China Jiangsu). Its main components are T700 carbon fiber and epoxy resin. Table 1 shows the material properties of FAW200RC38 prepreg.
In Table 1, are the elastic modulus in the three main directions respectively, and are the Poisson’s ratios in the 12, 23, and 13 directions. are the shear modulus in the 1–2, 2–3, and 1–3 planes respectively, and are the tensile strengths in the three main directions respectively. represent the compressive strength in the three main directions, are the shear strength in the 1–2, 1–3, and 2–3 planes, respectively, and are the fiber longitudinal directions. And transverse tensile fracture toughness, are the fiber longitudinal and transverse compressive fracture toughness respectively, and is the density. The material properties of the prepreg interface elements are shown in Table 2.
In the table, , and represent the longitudinal, transverse, and out-of-plane stiffness of the prepreg interface element, respectively; , and represent the maximum nominal stress corresponding to type I, type II, and type III failures, respectively; , , is the fracture toughness corresponding to the failure modes I, II and III, respectively, and is the power exponent.
In the property module of ABAQUS, we define the layup according to the predetermined layup scheme, assign the material parameters in Table 1 to the fiber layer of the shaft tube, and set the physical thickness of the fiber layer to 0.19 mm; set the material parameters in Table 2 to the adhesive layer assigned to the shaft tube, and set the physical thickness of the adhesive layer to 0.01 mm.
There is contact between the CFRP shaft tube, the loading head, and the support seat, and the corresponding contact properties should be set in the simulation analysis software for the places where there is contact.
Regarding the friction properties between the shaft tube, the indenter, and the support seat, in this paper, a set of control tests are designed in the simulation, and the tests with no friction and a friction coefficient of 0.1 are adopted respectively. Under the same model information, the maximum load of the output shaft tube is the same, so the simulation contact property in this paper is set to frictionless.
The type of contact pair used in this paper is face-to-face contact, the contact property is set to hard contact, and it is considered that there is no friction between the contact pairs, allowing the loading indenter to separate from the shaft tube after the loading is completed. The loading indenter and the support seat are both rigid body parts. When setting the main contact surface of the contact pair, the side of the rigid body part in contact with the shaft tube should be selected as the main surface of the contact pair, which is conducive to the convergence of the calculation results.
The boundary conditions of the finite element model of the CFRP shaft tube are shown in Figure 1. The three-point bending loading displacement of the shaft tube is 20 mm, and the loading speed is 1 mm/min.
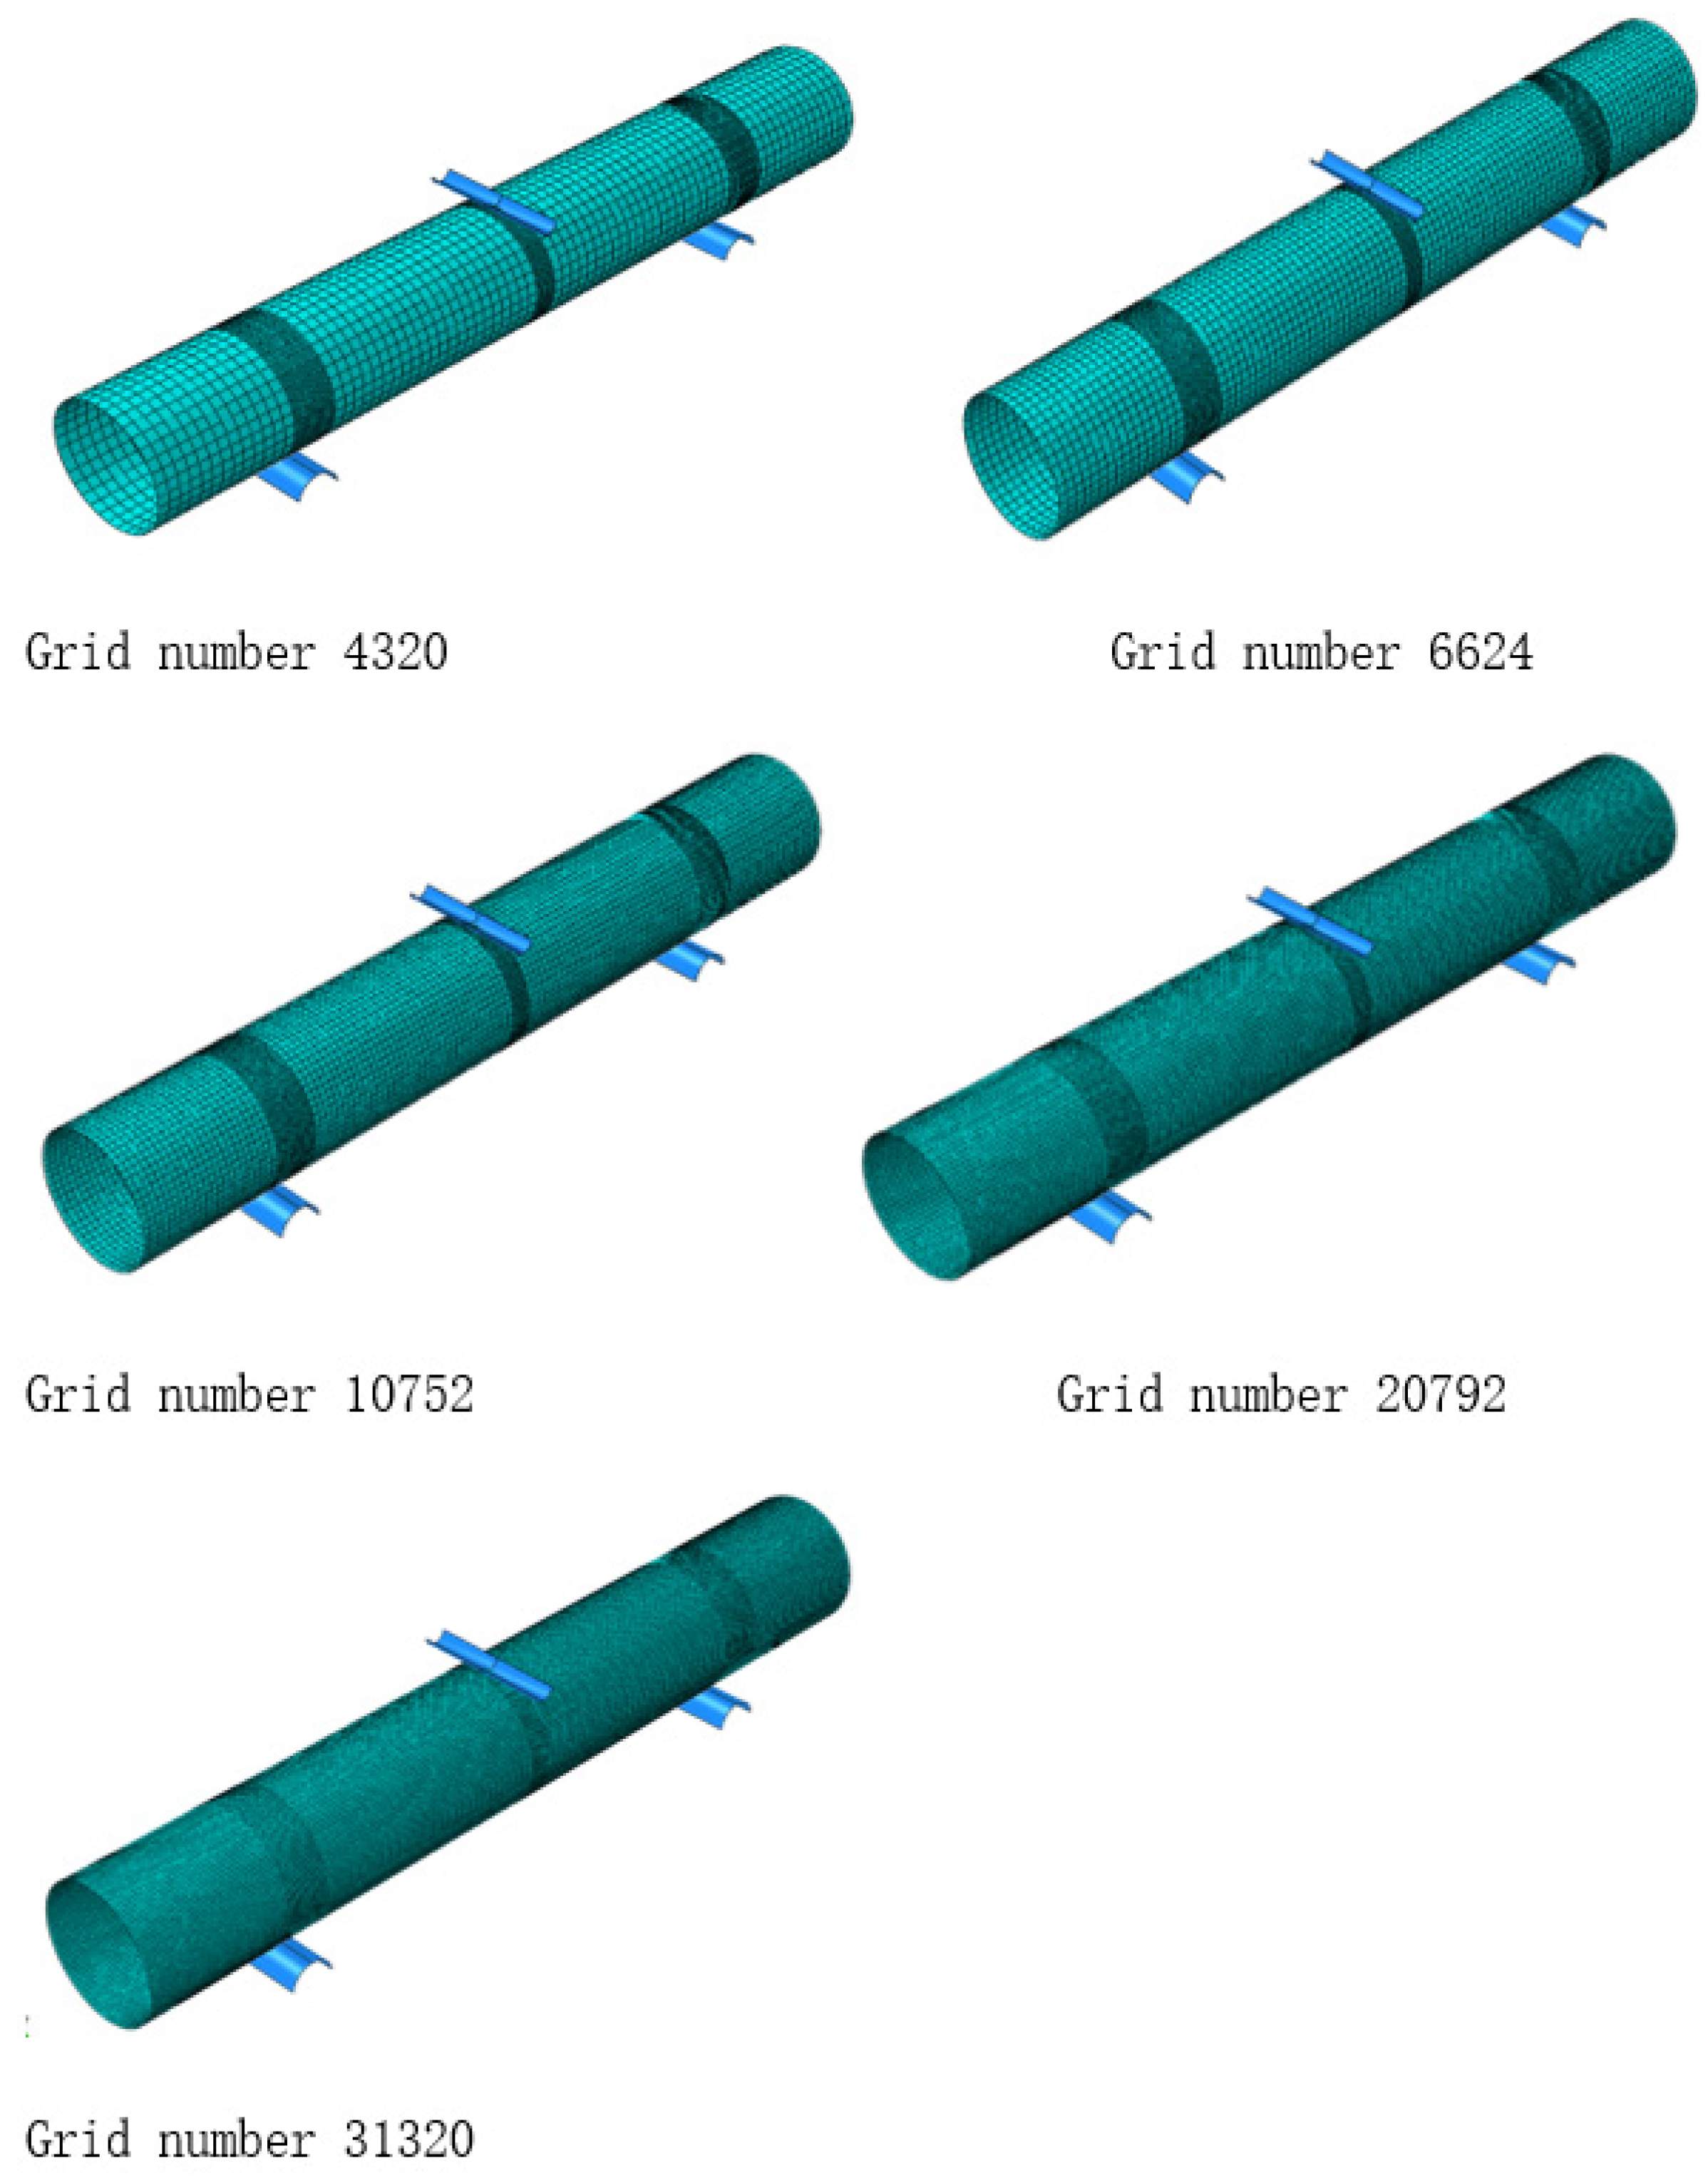
The mesh element shape of the axle tube is set to quadrilateral element, and the element type is S4R, which is meshed by structured meshing technology. The quasi-static simulation of the shaft tube using five sets of structural meshes with different degrees of density is shown in Figure 2, and the ultimate load of the output shaft tube is shown in Table 3 to analyze the mesh convergence.
It can be seen from Table 3 that the limit load values of grid numbers 4 and 5 are not very different; the trend is stable, and the convergence is good. Therefore, the final grid for dividing the shaft tube finite element model is grid number 4 with the number of elements fixed at 20,792.
The analysis step type of the quasi-static analysis is Dynamic Explicit, and the geometric nonlinear switch Nlgeom is set to ON; the automatic incremental step type is adopted, and the number of steps of the maximum incremental step is not limited. The mass scaling factor is set to 1000. The output of the field variable setting of the article is the stress field of the shaft tube, and the output of the historical variable is the displacement U2 of the reference point of the loading head and the support reaction force RF2.
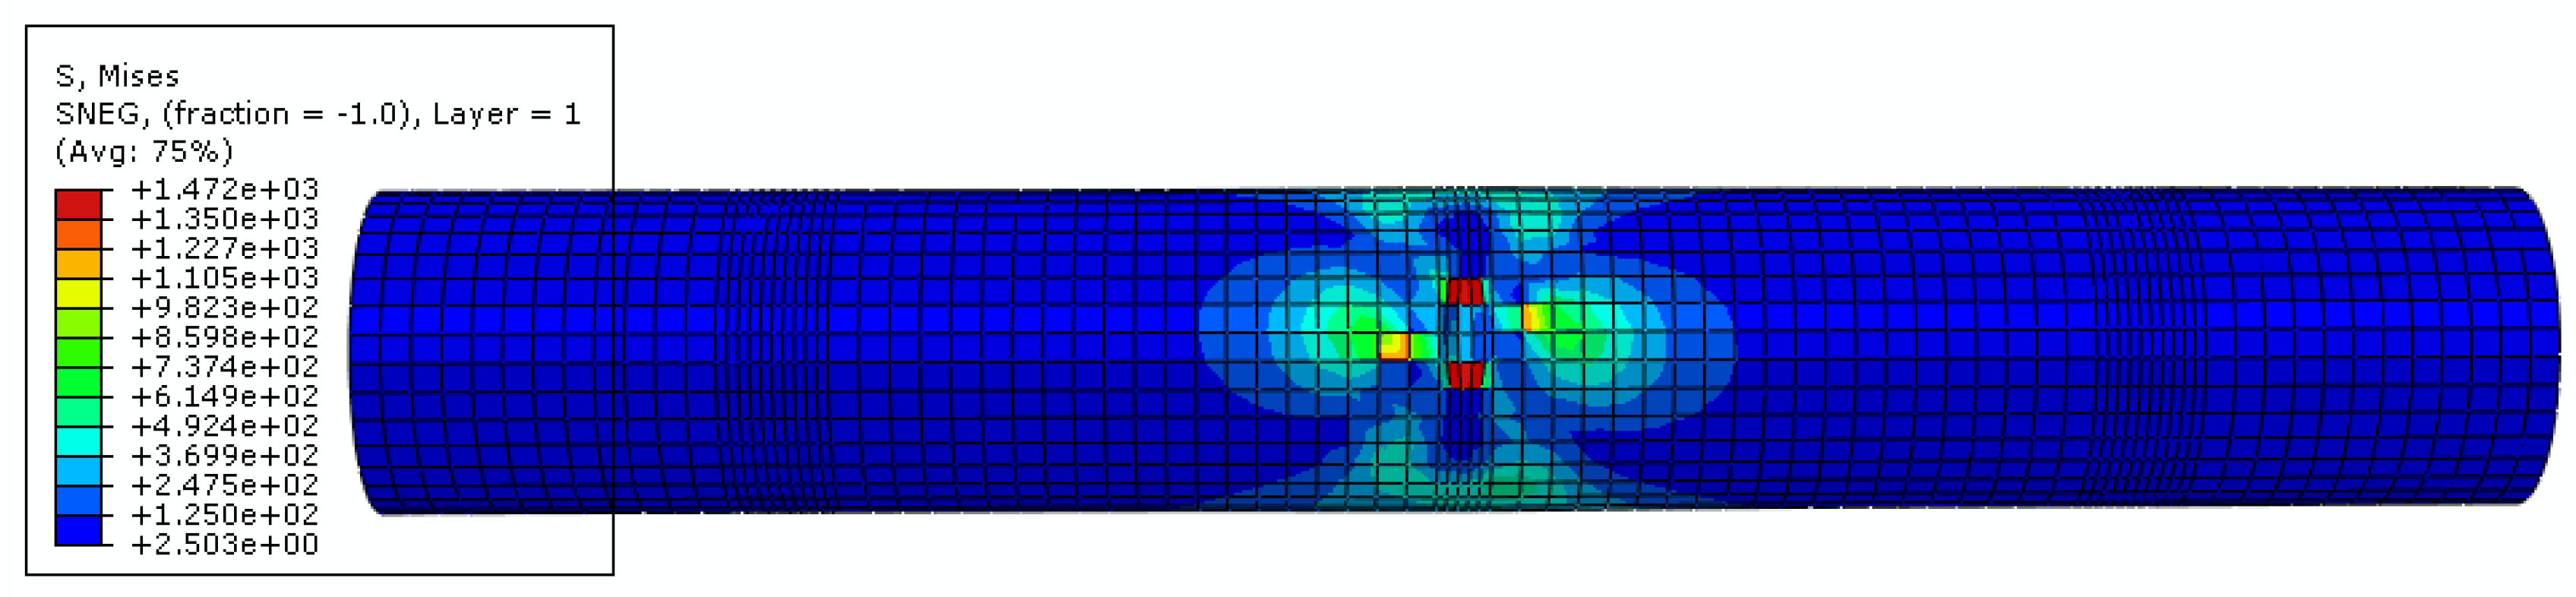
The stress field of the CFRP shaft tube quasi-static three-point bending is shown in Figure 3. It can be seen from the figure that there are dents in the contact parts of the shaft tube and the loading head and the supporting seat, and the dents at the shaft tube and the loading head are larger, indicating that the contact part of the shaft tube and the loading head is damaged. Therefore, the final crush failure of the shaft tube is the contact area between the shaft tube and the loading head.
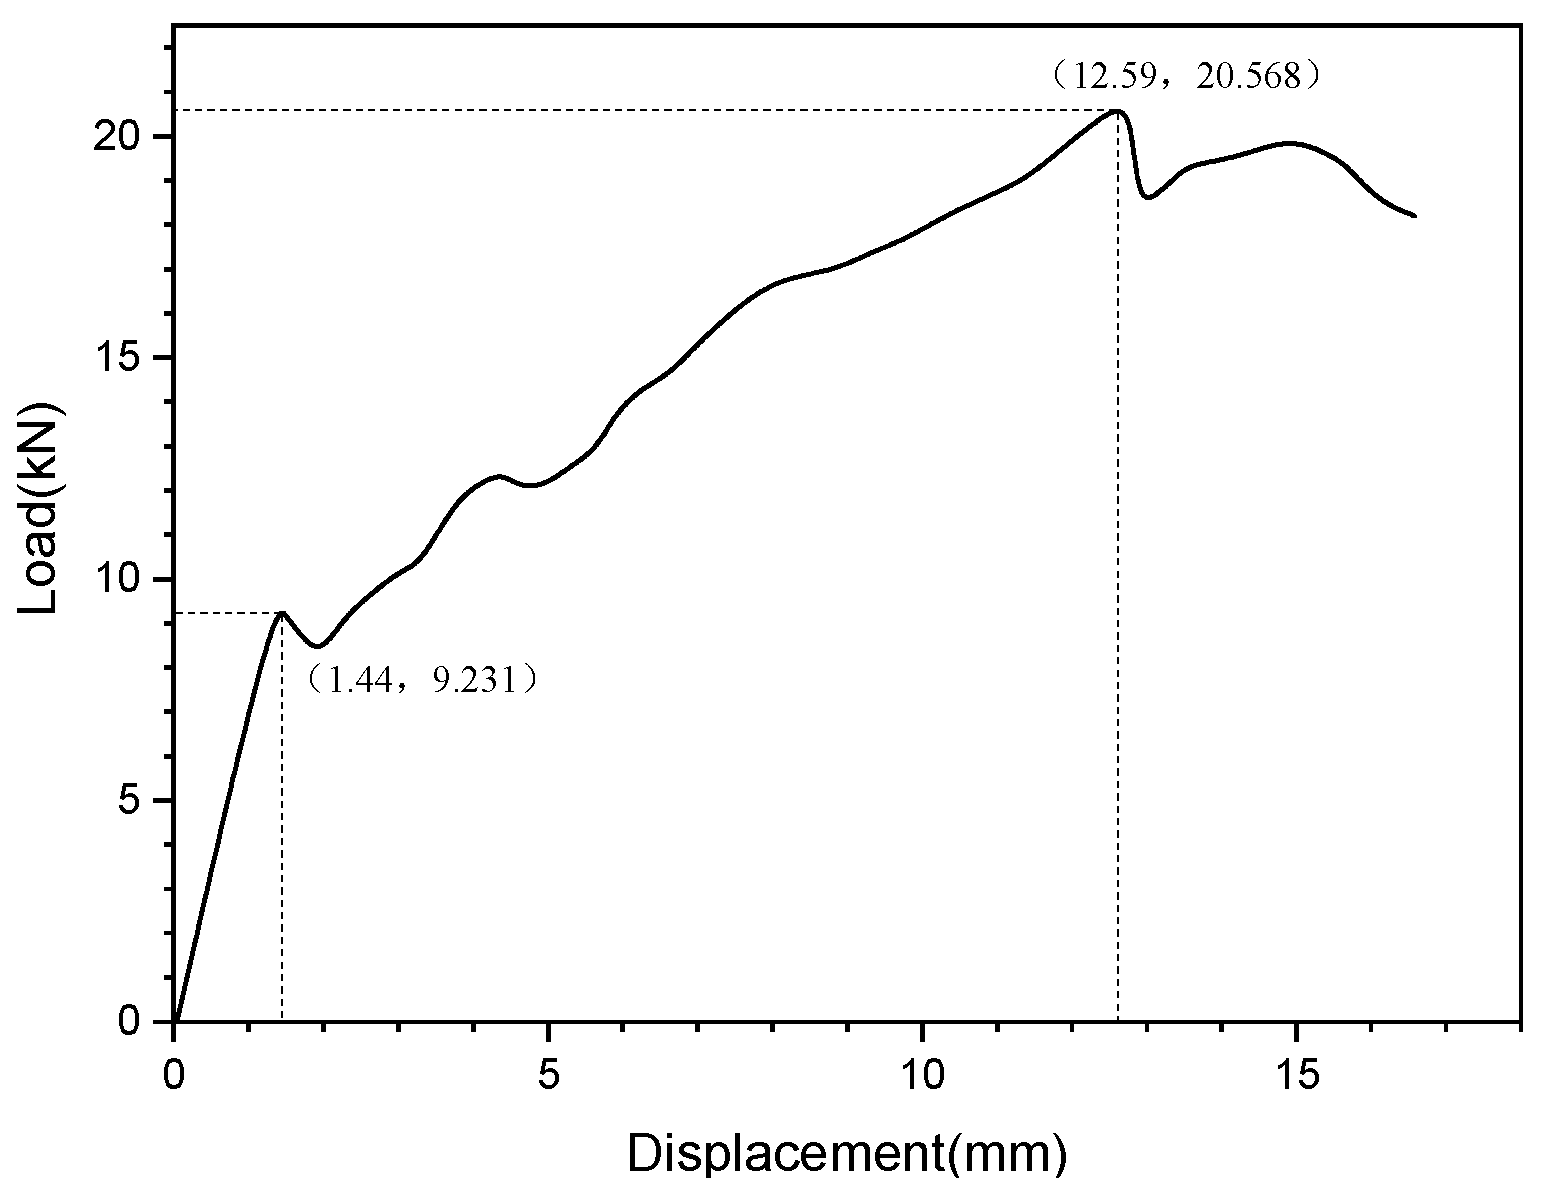
The quasi-static three-point bending simulation obtains the displacement-load curve of the CFRP shaft tube in the loading direction, as shown in Figure 4.
It can be seen from Figure 4 that the loading displacement is 0–1.44 mm, and the load and displacement have a linear relationship, indicating that the CFRP shaft tube is in the linear elastic stage at this stage, and the shaft tube has not yet been damaged. The loading displacement is 1.14–12.59 mm, and the load first decreases and then rises to a peak value with the increase of the loading displacement, indicating that there is damage inside the CFRP shaft tube at this stage. This is mainly matrix damage, and the fiber damage is less significant. The displacement-load curve continued to rise and reached a peak value. After the loading displacement reached 12.59 mm, the displacement-load curve of the shaft tube showed a significant downward trend, indicating that the fiber components inside the shaft tube also began to be damaged. The maximum load value of the shaft tube in the linear elastic stage is 9231 N, which can be used to determine the three-point bending fatigue loading load of the shaft tube. The coordinate of the peak point of the displacement-load curve of the axle tube is (12.59 mm, 20,568 N), which indicates that the limit displacement that the axle tube can bear during the quasi-static three-point bending loading process is 12.59 mm, and the corresponding limit load is 20,568 N.
2.3. Fatigue Simulation Analysis
To study the fatigue characteristics of the shaft tube under different fatigue loads, 70%, 75%, and 80% of the shaft tube elastic limit load are selected as the peak values of the shaft tube fatigue load (That is, the load factor is 0.7, 0.75, and 0.8). The loading frequency is 5 Hz, the stress ratio is 10, and the load form is a sinusoidal wave.
The specific expression of fatigue load is shown in the Formula (5).
In the formula, , is defined as the load factor, . According to the quasi-static three-point bending simulation result, the elastic limit of the shaft tube is 9231 N, that is .
After applying a fatigue load to the axle tube, the simulation calculates the stress strain of the model. The damage failure mode of composite materials was judged according to the Hashin failure criterion [21]. The elements are degraded accordingly using a fracture toughness-based stiffness degradation model. The CFRP shaft tube is considered to eventually have fatigue failure if the tensile failure element of any layered fiber in the CFRP shaft tube extends to the upper half circumference of the shaft tube.
2.3.1. Fatigue Life of CFRP Shaft Tube under Different Load Coefficient
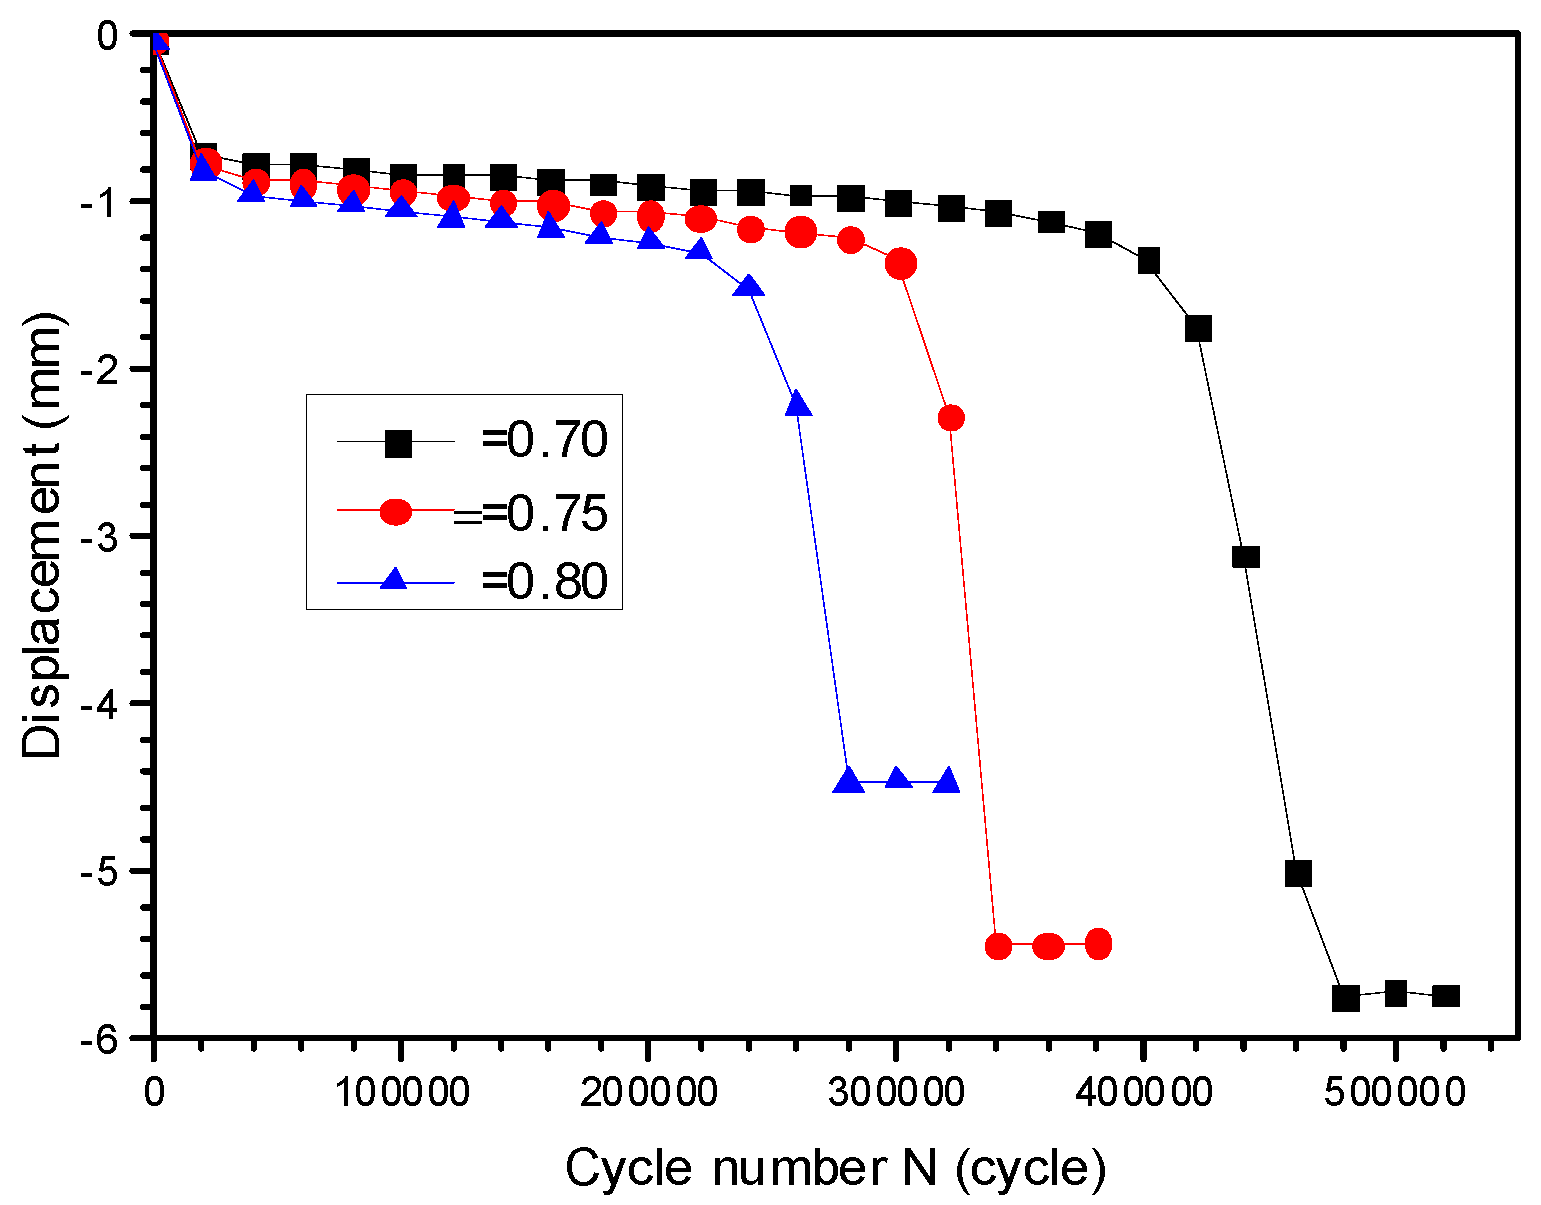
The displacement-cycle number curve of the loading head when the output load coefficients are 0.7, 0.75, and 0.8 respectively, are shown in Figure 5.
Taking the load factor of 0.7 as an example, it can be seen from Figure 4 that when the number of cycles N = 420,000, the displacement begins to decrease significantly, and the shaft tube has lost most of its bearing capacity. When N = 480,000, the downward trend of the curve disappears, indicating that the bearing capacity of the shaft tube has already been completely lost. At the same time, the shaft tube has been fatigued and damaged, and the fatigue life of the shaft tube is 480,000 cycles. In summary, the analysis shows that when the load factor is set to 0.7, 0.75, and 0.8, the fatigue life of the shaft tube is 480,000, 340,000, and 280,000 cycles, respectively. The smaller the load factor, the longer the fatigue life of the shaft tube.
2.3.2. Residual Stiffness of CFRP Shaft Tube under Different Load Coefficients
The ratio of the amplitude of fatigue load to the displacement amplitude of the shaft tube in the loading direction is defined as the residual stiffness of the shaft tube. The residual stiffness reflects the bearing capacity of the composite structure. Under the condition of no damage to the structure, the fatigue life and damage to the structure can be predicted by continuous measurement. The residual stiffness-cycle number curve of the CFRP shaft tube under different load coefficients is shown in Figure 6.
It can be seen from Figure 6 that the residual stiffness of the shaft tube generally shows a downward trend of “fast-slow-fast” with the increase in the number of cycles. The decline rate of the residual stiffness curve of the shaft tube is closely related to the damage evolution, and the larger the load factor, the faster the decline rate of the residual stiffness of the shaft tube.
2.4. Simulation Results of Fatigue Damage Evolution
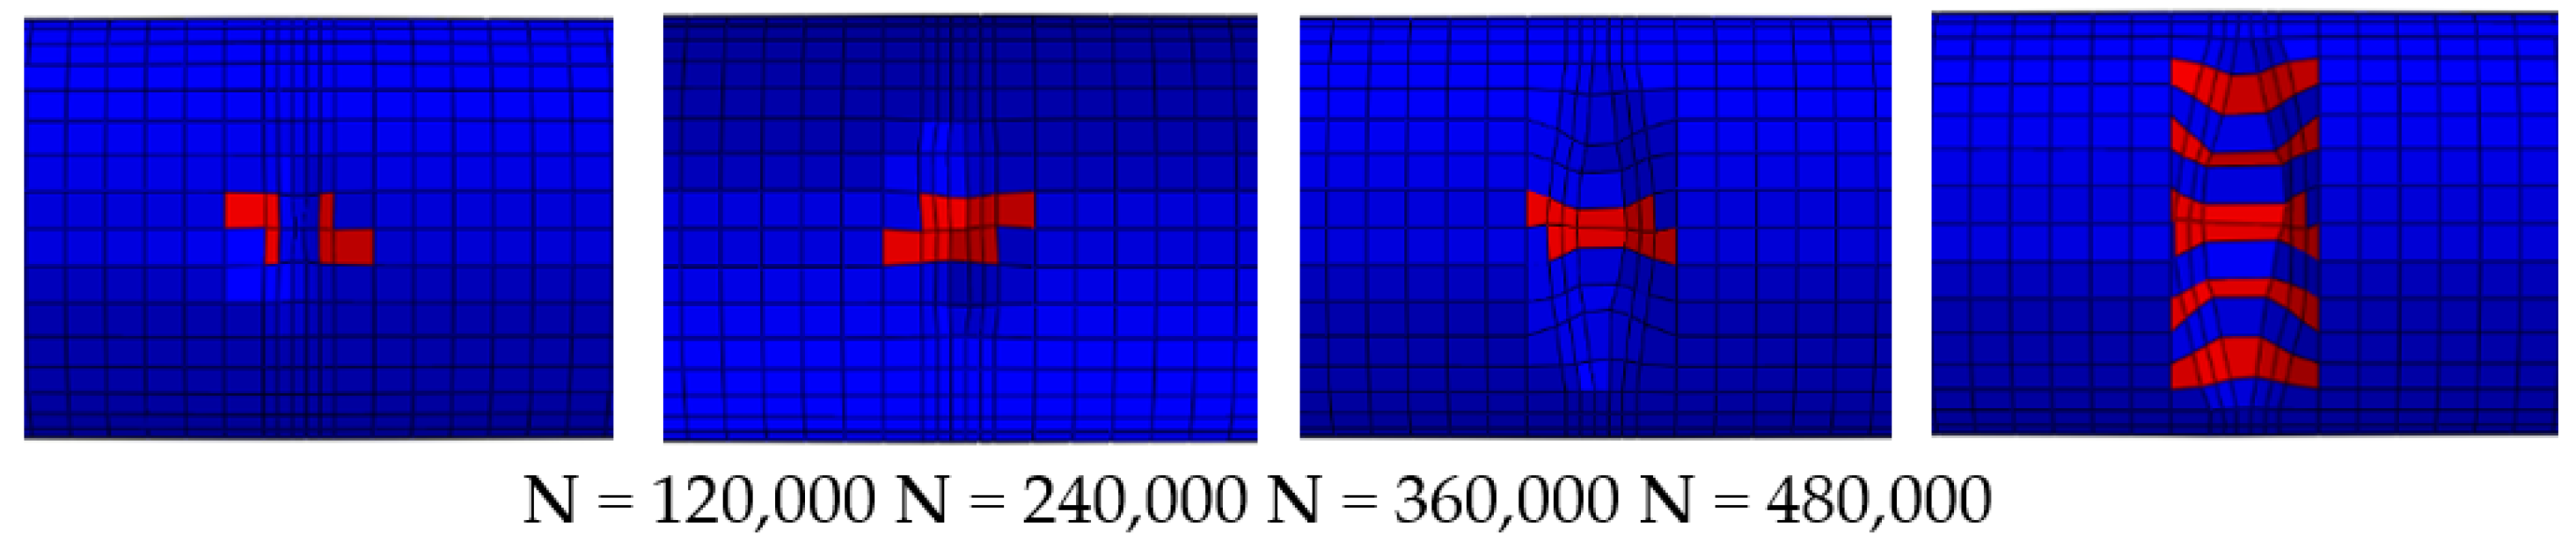
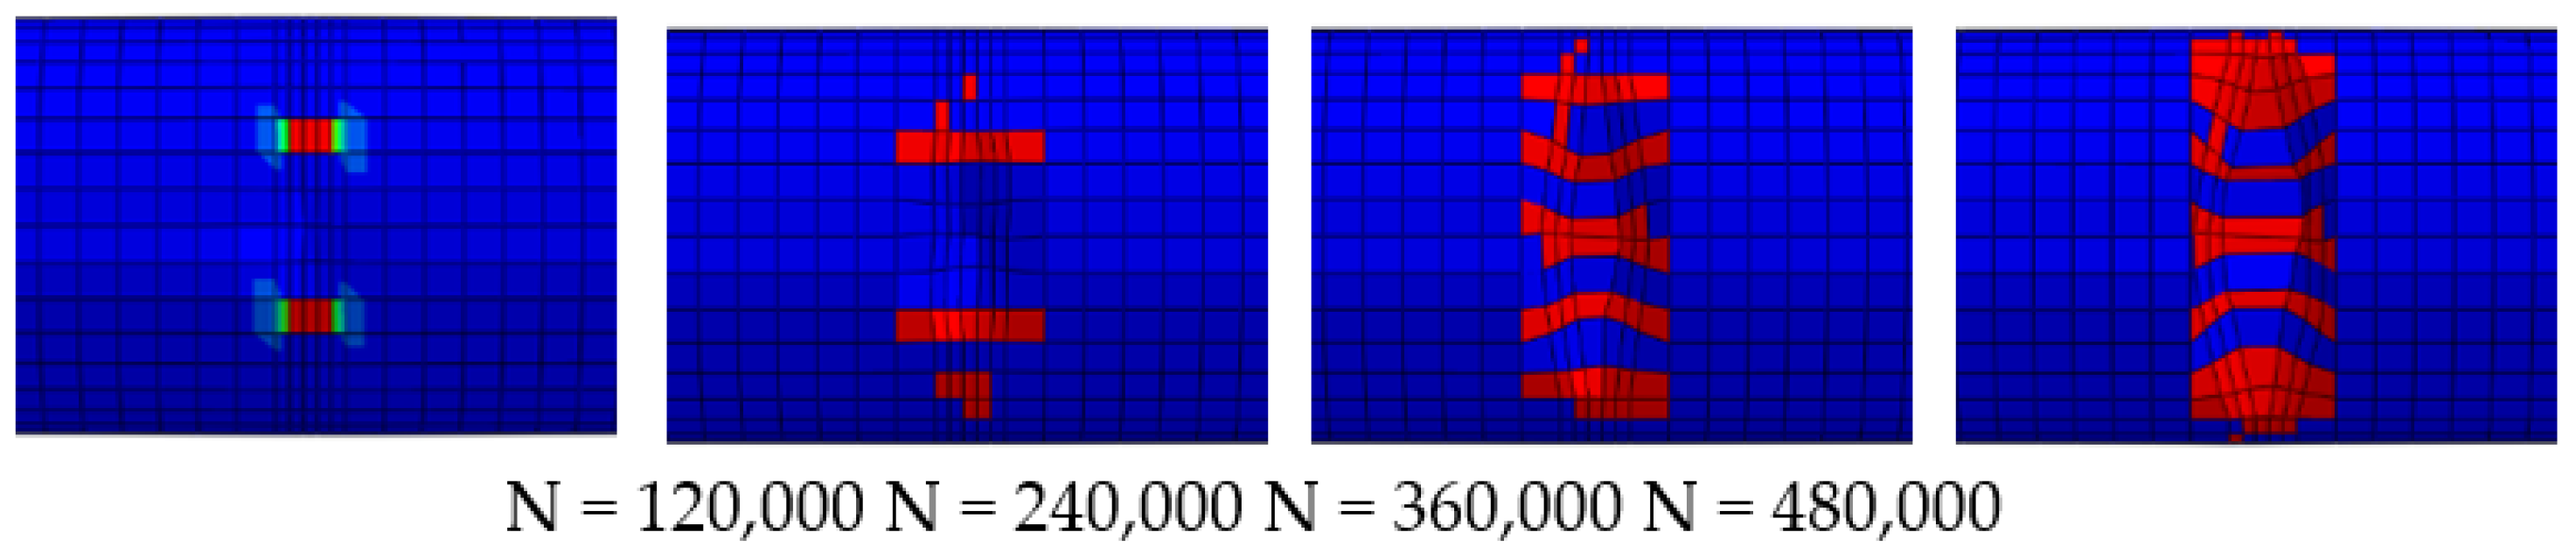
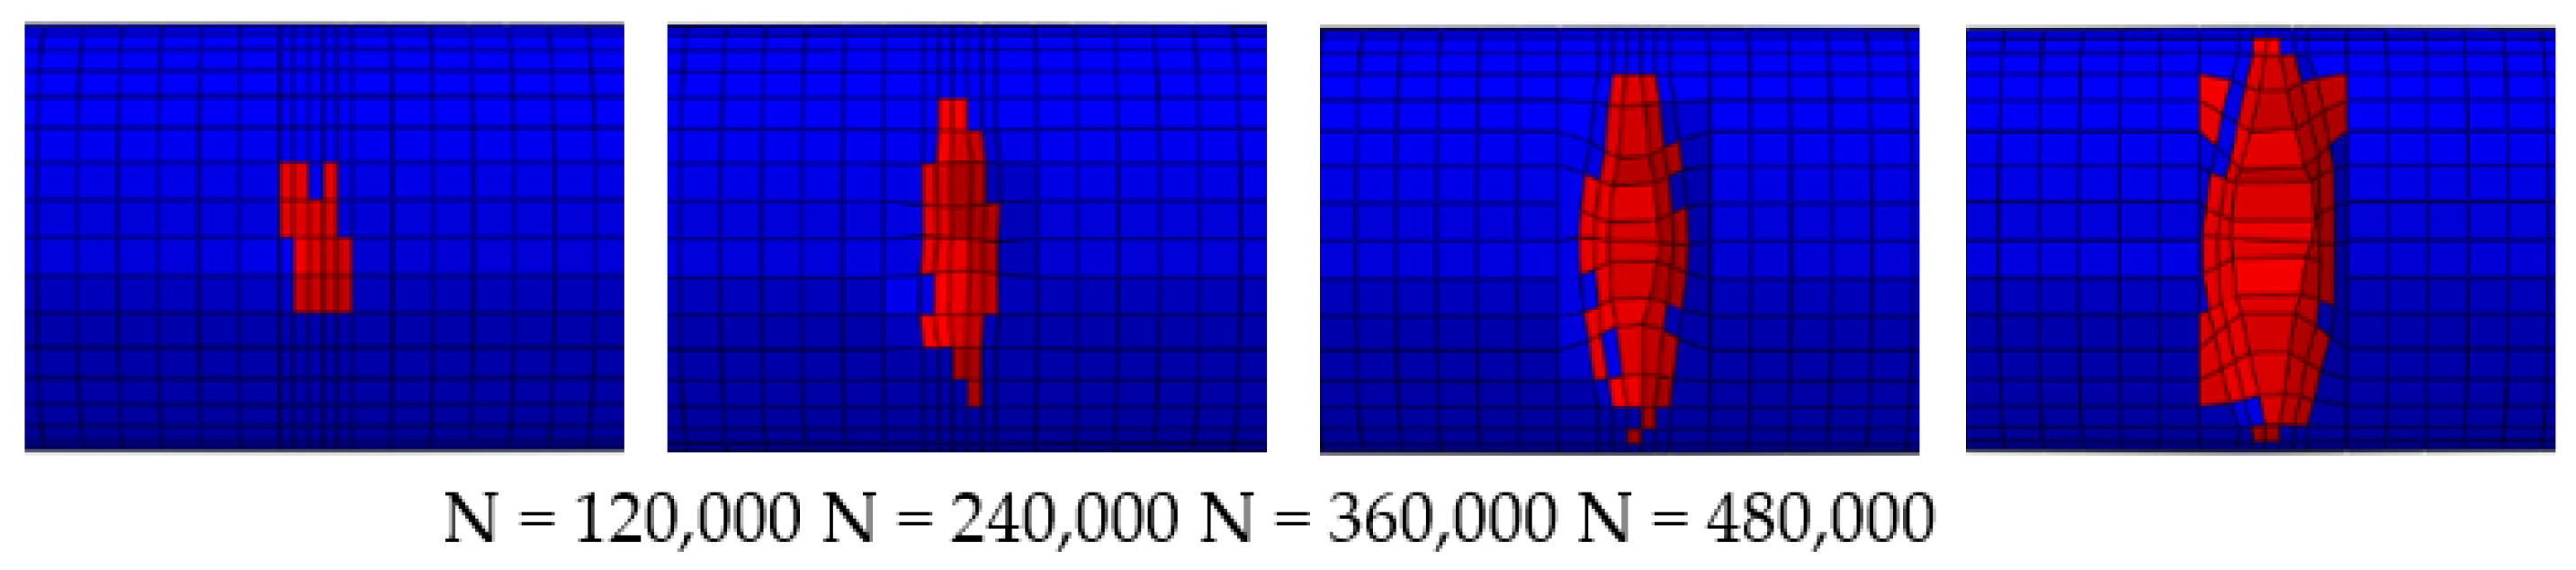
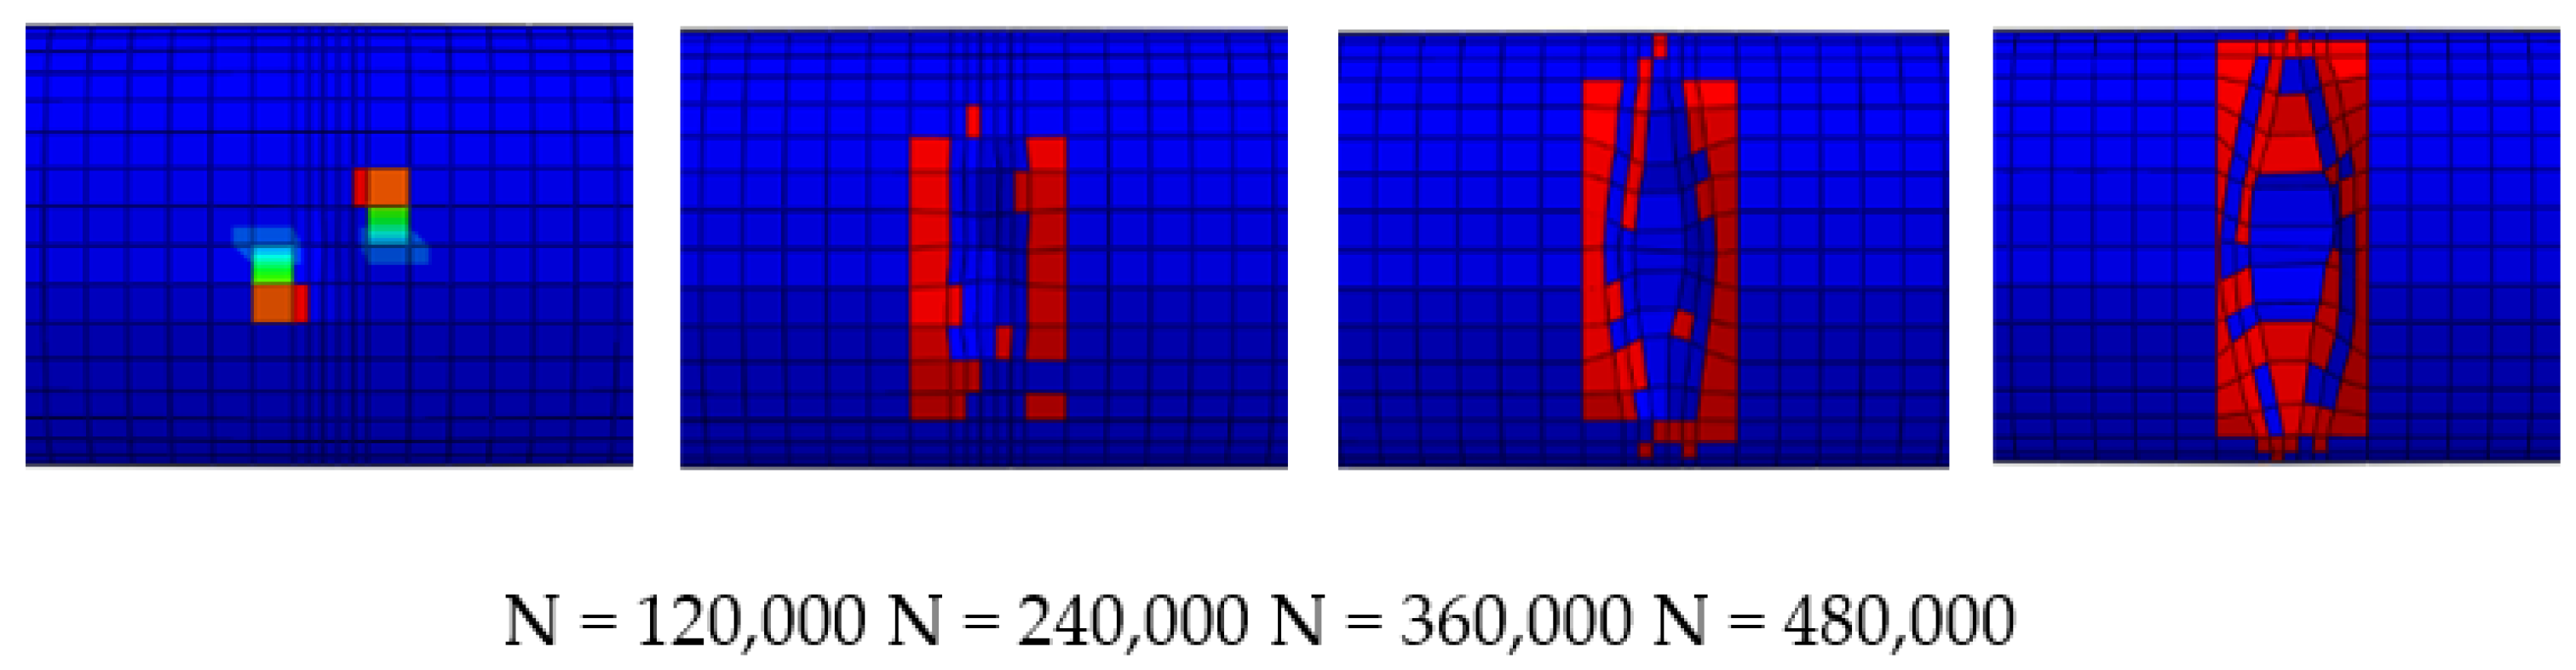
The three-point bending fatigue damage evolution law of CFRP shaft tube under different load factors is similar, thus selecting the result of load factor 0.7 for analysis. When the load coefficient is 0.7, the fatigue life of the shaft tube is 480,000 cycles, and the fatigue loading interval is set at 120,000 to check the damage information of the shaft tube once until the final fatigue failure of the shaft tube.
The damage cloud diagrams of the contact area between the shaft tube and the loading indenter can be seen in Figure 7, Figure 8, Figure 9 and Figure 10, in which the blue indicates that the unit is not damaged, while the red indicates that the unit is fatigued.
It can be seen from Figure 7, Figure 8, Figure 9 and Figure 10 that while the shaft tube is loaded 120,000 times, only a few elements of the shaft tube have fatigue failure. As the shaft tube is loaded 240,000 times, the main damage forms are matrix tensile and matrix compression damage. When the tube is loaded 360,000 times, the matrix tensile and matrix compression damage has expanded to the upper half of the shaft tube, the area covered by fiber compression damage has also increased significantly, but the fiber tensile damage area has not increased obviously. As the cycle is loaded 480,000 times, the matrix compression and fiber compression damaged area are the largest, and the fiber tensile damage area has practically expanded to the upper half of the shaft tube. To sum up, the final fatigue failure of the shaft tube depends on the fiber tensile failure, as the main damage forms are matrix compression and fiber compression damage.
3. Experimental Procedure
At present, there is no unified standard for testing the bending performance of composite shaft tubes. In this paper, the quasi-static three-point bending test of CFRP shaft tubes was carried out according to GB/T 1449-2005 “Experimental Methods for the Bending Performance of Fiber-Reinforced Plastics”. Firstly, a quasi-static three-point bending experiment was carried out on the CFRP shaft tube test piece, and the three-point bending fatigue loading load of the CFRP shaft tube was determined. Secondly, a three-point bending fatigue test was carried out to study Fatigue life and fatigue damage evolution law under the different fatigue loading of the CFRP shaft tube and using an ultrasonic phased array to perform damage scanning analysis on the CFRP shaft tube after different fatigue loading times. At the same time, the FBG sensor is used to monitor the strain information of the CFRP shaft tube during the three-point bending fatigue loading process, which verifies the feasibility of the FBG sensor to monitor the fatigue process of the composite material online.
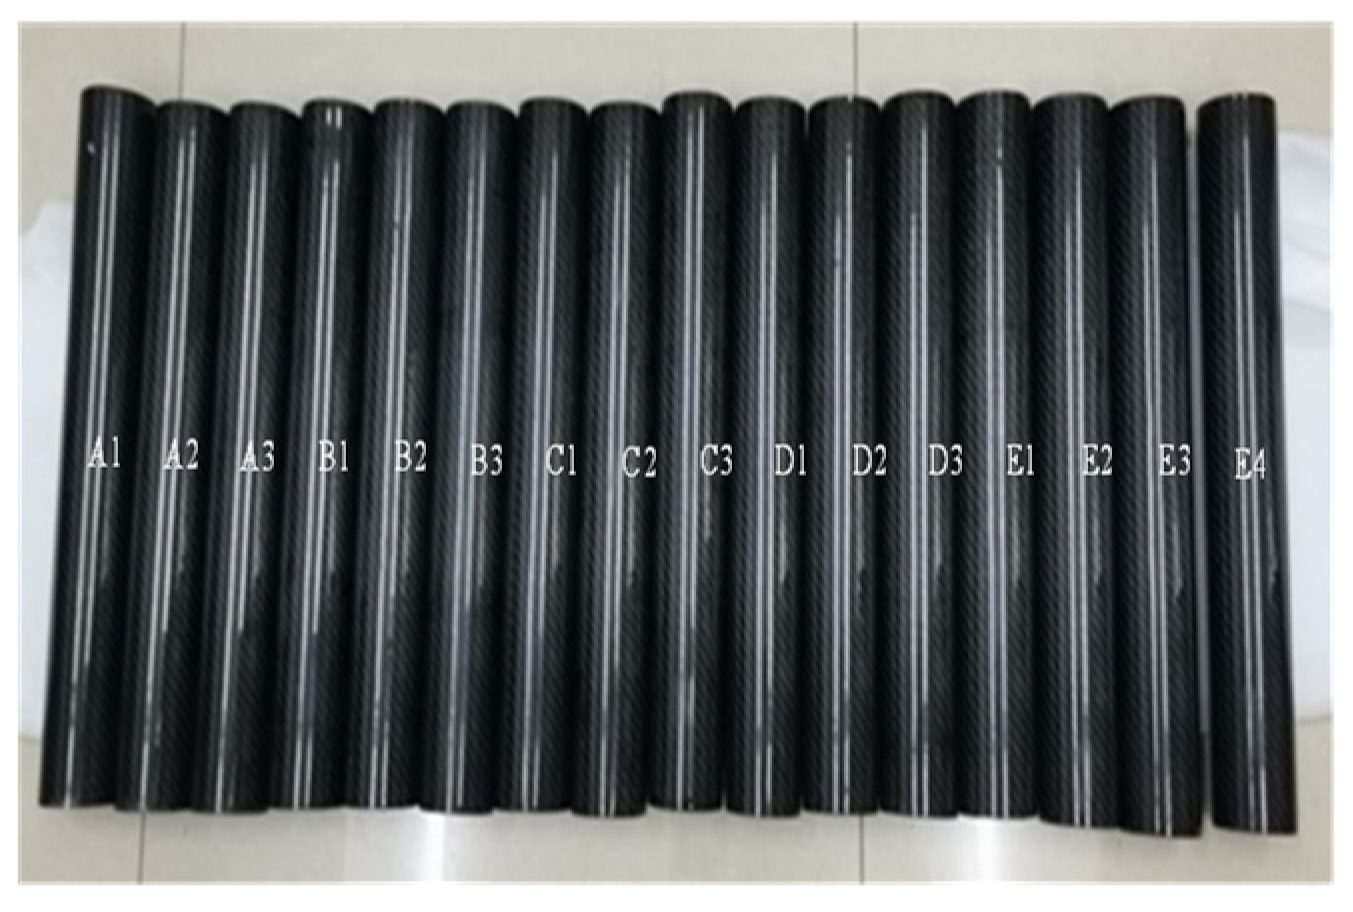
A total of 16 specimens of CFRP shaft tubes were prepared, as shown in Figure 11, for reference to the simulation size of CFRP shaft tubes in Section 2.1.
The quantity, number, and purpose of each group of test pieces are shown in Table 4.
3.1. Static Tests
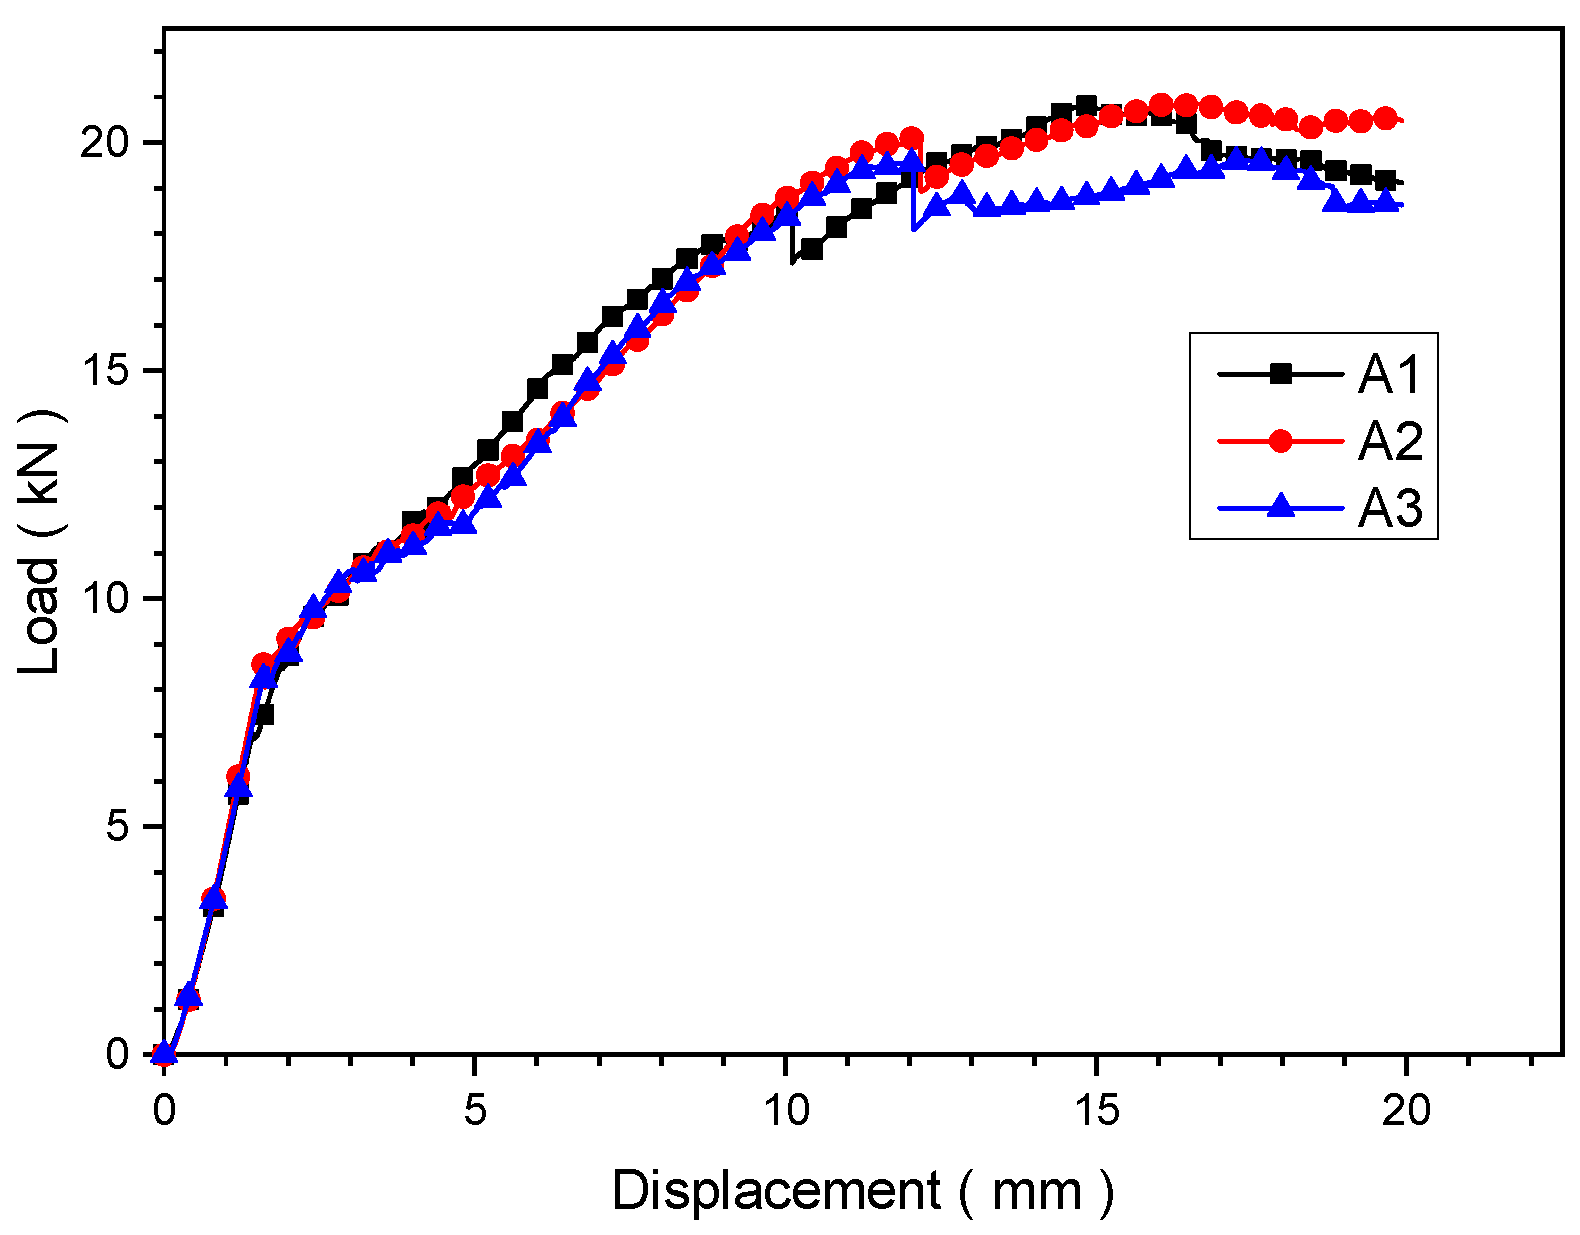
A microcomputer-controlled electronic universal testing machine designed by Rigel Instrument Co., Ltd. is used to conduct quasi-static three-point bending experiments on the three CFRP shaft tubes of A1, A2, and A3 in group A in this study. The span of the support base of the universal testing machine is adjusted to 250 mm, the displacement control mode was used for loading at a speed of 1 mm/min and the sampling frequency was set at 5 Hz. The load-displacement curve of the quasi-static three-point bending experiment is shown in Figure 12.
Extract the elastic ultimate load and ultimate load of the CFRP shaft tube test piece, and the results can be obtained from Table 5.
It can be seen from Table 3 that the elastic limit load of test piece A1 is quite different from the elastic limit load of test pieces A2 and A3, and it needs to be eliminated. Taking the average of the experimental results of test pieces A2 and A3, the elastic ultimate load is 8546.5 N, and the ultimate load is 20,202.5 N.
3.2. Fatigue Tests
3.2.1. Experimental Process
The CFRP shaft tube three-point bending fatigue test system is mainly composed of fatigue testing machines, ultrasonic phased array flaw detector, fiber grating demodulator, computer, etc., as shown in Figure 13.
3.2.2. Experimental Conditions
- 1.
- Determination of fatigue loading load
In the three-point bending fatigue test, the Instron 1341 electro-hydraulic servo fatigue testing machine was used to load the CFRP shaft tube. The loading mode was force-controlled loading, and the loading frequency was 5 Hz. Three-point bending fatigue experiments were carried out on the experimental parts of Group B, C, and D, and the load coefficients corresponding to the fatigue load were 0.7, 0.75, and 0.8, respectively.
According to the results of the quasi-static three-point bending experiment of CFRP shaft tube, the elastic limit of CFRP shaft tube is 8546.5 N, and the specific expressions of the three fatigue loads of CFRP shaft tube while the load coefficient is 0.7, 0.75, and 0.8 are as follows:
- 2.
- Fatigue damage evolution experiment of CFRP shaft tube based on ultrasonic scanning
Before the ultrasonic scanning of the CFRP shaft tube, the basic operating parameters of the Mentor ultrasonic phased array flaw detector need to be set. It is divided into 4 steps sound velocity measurement, TCG calibration, sensitivity calibration, scanning detection, etc. The specific settings of each step are as follows:
- Sound speed measurement
The purpose of sound velocity measurement is to measure the sound velocity of the material under test to reduce measurement errors. In this paper, the backside echo method is used to measure the sound velocity of carbon fiber composites. This method only requires a carbon fiber specimen of known thickness, and two consecutive backside echoes are received by two A gates to calculate the propagation time of ultrasonic waves in the specimen. Thereby, the speed of sound of the carbon fiber composite material can be calculated. The thickness of the test block used to measure the speed of sound in this paper is 8 mm, the gain during the measurement is set to 28 dB, the probe delay is set to 3.2 us, and the endpoint of the range is set to 17 mm, the reference 1 is set to 8 mm, and the reference 2 is set to 16 mm; the carbon fiber is finally measured. The speed of sound for the composite is 2981 mps.
- TCG calibration
TCG calibration is also called time gain calibration. Its purpose is to correct the gain of the reflected echoes at different depths of the test piece to make them reach the same amplitude so that defects of the same size at different depths can be successfully detected. In this paper, flat-bottomed specimens with different depths of flat-bottomed holes are used for TCG calibration. The thickness of the specimens is 8 mm. Three flat-bottomed holes with a diameter of 3 mm are drilled on the bottom of the flat-bottomed specimen. The depths of the three holes are 1 mm, 2 mm, and 4 mm respectively. The type of TCG calibration is the back surface echo of different depths, the number of TCG points is set to 3, and the amplitude tolerance is set to 10%. During the calibration process, use A-scan to record the emission wave of each flat-bottomed hole in turn, and ensure that for each TCG point the echo amplitude error is within 10%. After TCG calibration is completed, the reflected waves of defects with the same amplitude but located in different thickness directions of the material will be displayed as echoes of the same amplitude through A-scan.
- Sensitivity calibration
The purpose of sensitivity calibration is to perform gain correction on the reflected echoes of defects with the same depth and the same size but different sound paths, so that they can reach the same amplitude (generally 80% of the wave height), to avoid the angle sensitivity error. The specimen for sensitivity calibration in this paper is the same as the specimen for TCG calibration. A gate is used to receive the reflected echo from the flat-bottomed hole of the specimen. By adjusting the gain, the wave height of the transmitted echo is 80%, and the sensitivity calibration is completed.
- Scanning detection
After completing the above three steps, you can enter the scanning inspection interface, which provides A-scan and B-scan inspection functions, which can quickly locate the defects of the test piece. Since the wall thickness of the CFRP shaft tube is 4.4 mm, the endpoint of the range is set to 5 mm, and the A gate is placed in front of 4.4 mm, to detect defects in the thickness direction of the CFRP shaft tube and reflect the wave height reaching 40% of the bottom surface. The waves are treated as defect echoes; the CFRP shaft tube can be scanned for damage by continuously moving the ultrasound probe.
After the parameters are set, the Mentor ultrasonic phased array flaw detector is used to ultrasonically scan the 4 scanning points of the CFRP shaft tube before fatigue loading to check the initial defects of the CFRP shaft tube.
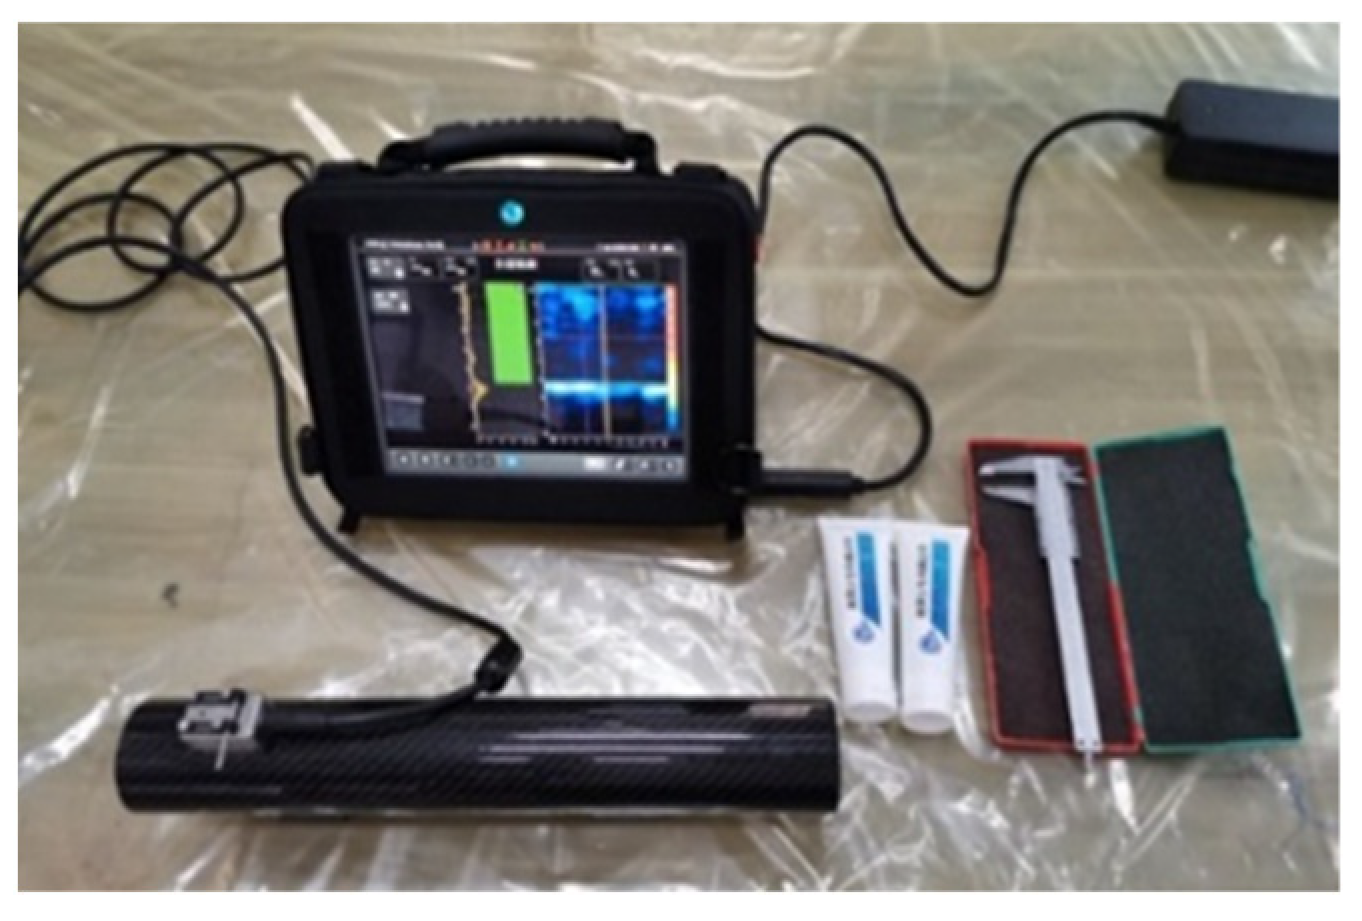
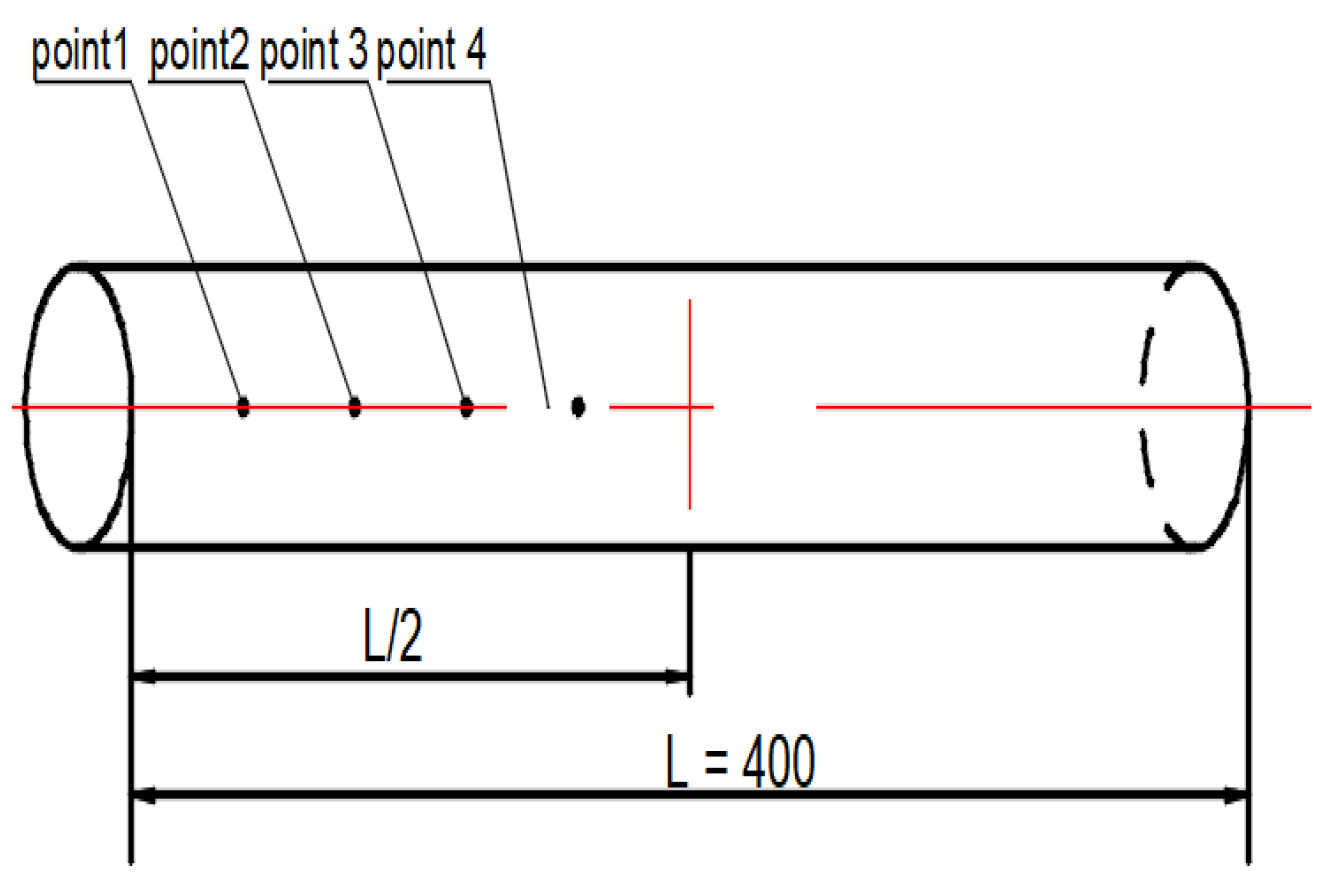
This study uses the Mentor ultrasonic phased array flaw detector produced by GE to scan and analyze the damage of the 4 CFRP shaft tubes numbered E1, E2, E3, E4 after different cycles, and the experimental site of ultrasound scanning is shown in Figure 14. The load factor corresponding to the fatigue load applied by the test pieces in group E is 0.7. Due to the symmetry of the three-point bending loading, 4 identical damage scan points are selected on average along the axis at L/2 of each CFRP shaft tube, as shown in Figure 15.
- 3.
- CFRP shaft tube FBG sensor network layout.
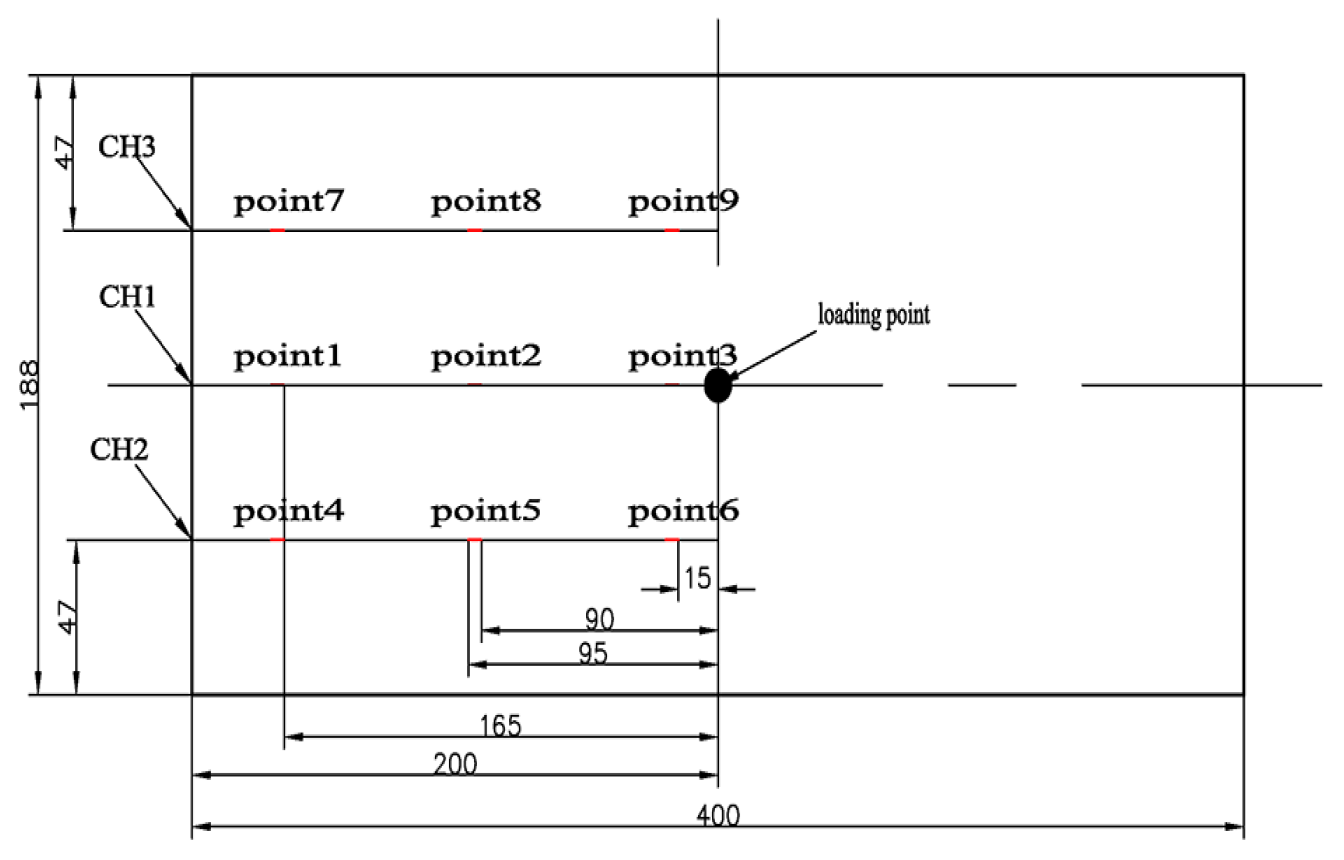
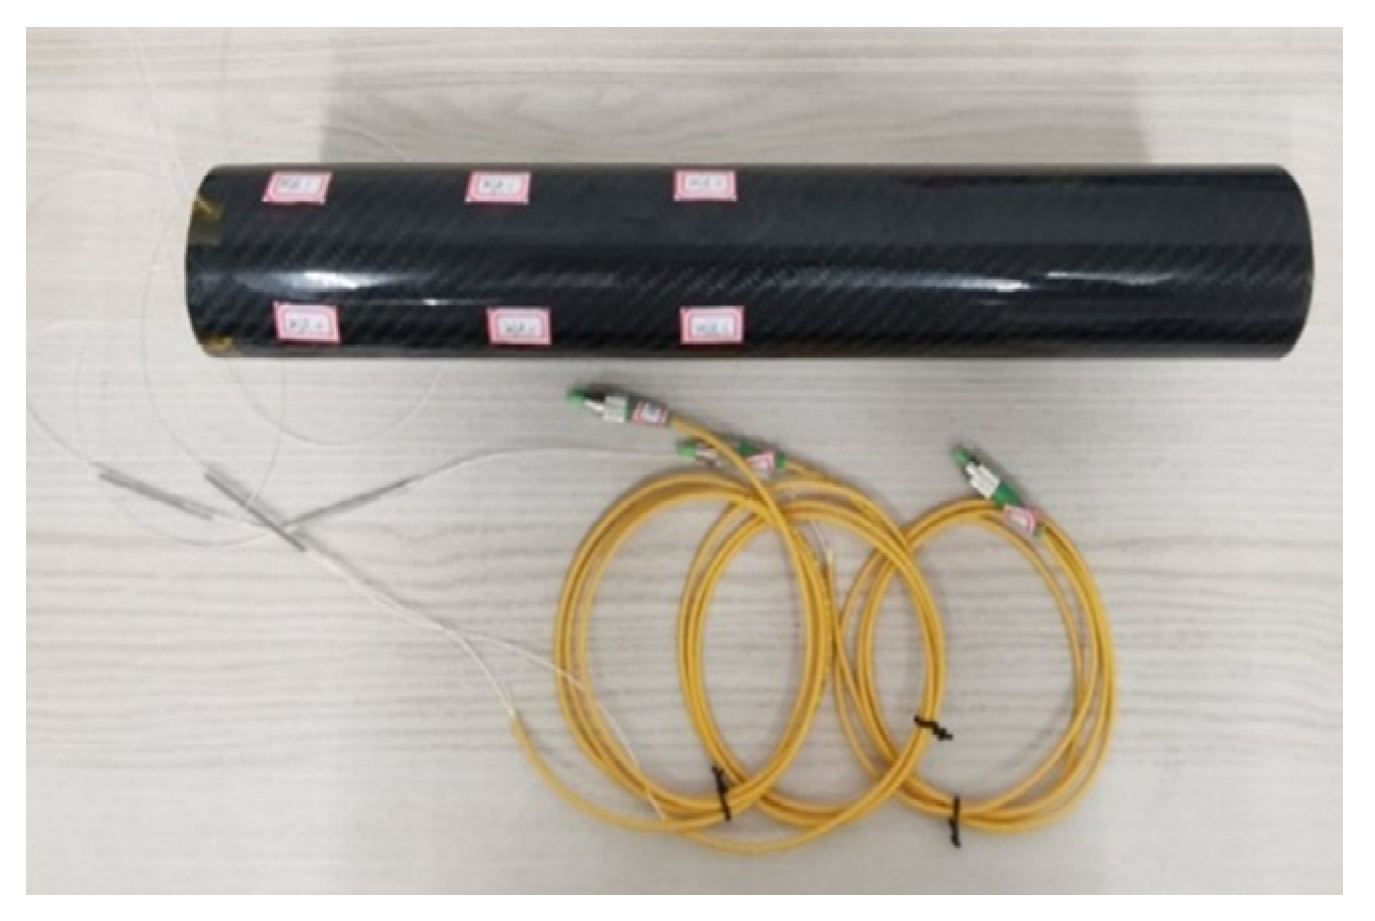
Refer to the simulation analysis result, select 9 strain measuring points on the CFRP shaft tube, numbered measuring point 1, measuring point 2, measuring point 3, …, measuring point 9. The series channel of measuring point 1, measuring point 2, and measuring point 3 is CH1. The series channel of measuring point 4, measuring point 5, and measuring point 6 is CH2. The series channel of measuring point 7, measuring point 8, and measuring point 9 is CH3. The layout diagram of the FBG sensor network of the CFRP shaft tube is shown in Figure 16. In this study, the center wavelengths assigned to the FBG sensors at each measurement point of each fiber channel are 1537 nm, 1543 nm, and 1547 nm in order. Figure 17 shows the CFRP shaft tube with the FBG sensor attached.
3.3. Results and Analysis
3.3.1. Fatigue Life of Test Pieces under Different Load Factors
As shown in Table 6, the average fatigue life of the test pieces of group B, group C, and group D are 440,071 times, 311,114 times, and 254,563 times respectively. Thus, this study shows that the larger the load factor, the larger the fatigue loading load, and the smaller the fatigue life of the CFRP shaft tube.
Comparing the experimental average values of fatigue life of CFRP shaft tubes under different load factors with the fatigue simulation results, as shown in Table 7.
3.3.2. Residual Stiffness of Test Pieces under Different Load Factors
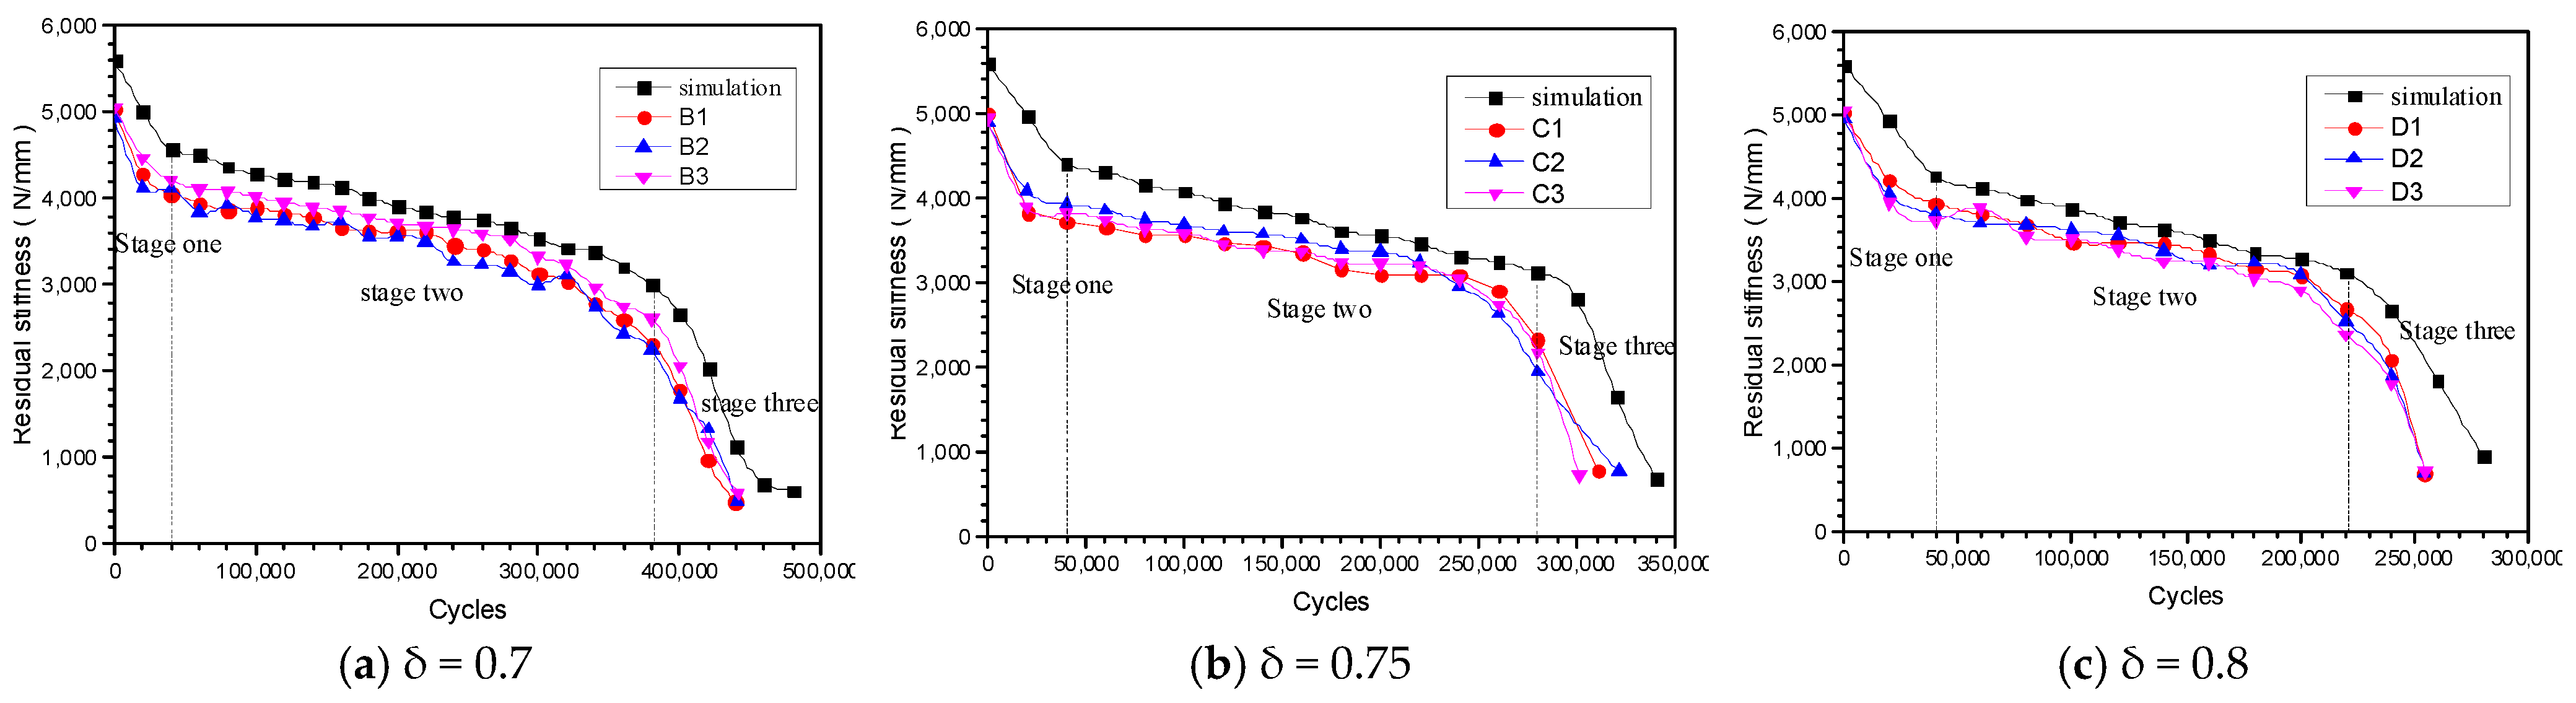
The experiment obtained the residual stiffness-cycle number curve under different load factors, and the simulated residual stiffness curve is also integrated into Figure 18.
It can be seen from Figure 17 that the residual stiffness of the CFRP shaft tube experiment and simulation under different load coefficients generally decreases with the increase of the number of cycles, and the decline process of the residual stiffness shows a three-stage “fast-slow-fast feature”. In the first stage, the decrease in the residual stiffness of the CFRP shaft tube is mainly caused by damage to the CFRP shaft tube matrix. In the second stage, the stiffness of the CFRP shaft tube decreases slowly. This is because as the fatigue loading progresses, the matrix damage expands to a certain extent, the main load-bearing component fiber of the CFRP shaft tube begins to be damaged, but the fiber’s bearing capacity is stronger. In the third stage, the main load-bearing component fibers of the CFRP shaft tube greatly reduce the load-bearing capacity due to the fatigue load and cause the final fatigue failure of the CFRP shaft tube. Therefore, the residual stiffness of the CFRP shaft tube will decrease significantly in the third stage.
3.3.3. Fatigue Damage Evolution Experiment of Test Pieces Based on Ultrasonic Scanning
The ultrasound scan results of the test pieces E1, E2, E3, and E4 are similar. In this paper, taking experimental piece E1 as an example, ultrasonic scanning analysis was conducted on the damage of each scanning point when N = 0 (before fatigue loading), N = 72,000, N= 216,000, N = 396,000, N = 432,000, and N = 440,160 (fatigue failure). The results are shown in Figure 19.
In Figure 19, take the ultrasound scan image of scan point 1 at N = 0 as an example. The left side of the image is the A-scan result, which is used to monitor the defect reflection wave of the CFRP shaft tube in the thickness direction (that is, before the bottom wave). The right side of the image is the B-scan result, the red horizontal bar is the bottom wave, and the image above the bottom wave is the damage of the CFRP shaft tube in the thickness direction. The darker the color indicates that the more serious the damage inside the CFRP shaft tube. If a large area of damage occurs inside, the bottom wave will become blurred or even disappear.
When N = 0, the bottom wave in the B-scan images of each scanning point is very clear, with only a few green spots and no obvious damage, indicating that there are some small original defects in the CFRP shaft tube before fatigue loading. At N = 72,000, no obvious damage was observed. As N = 216,000, the bottom wave in the B-scan image of scan point 4 begins to become fuzzy, and more green patches can be seen, indicating that the fatigue damage at scan point 4 has begun to appear to a relatively low degree, while no obvious damage has been seen in the other three scan points. While N = 396,000, the bottom wave has completely disappeared in the B-scan image of scanning point 4, and the red spot increases, indicating that the fatigue damage of scanning point 4 is further expanded. Fatigue damage has begun to appear at scanning points 3, and no obvious damage has been seen at scanning points 1 and 2. When N = 432,000, a large area of red patches appeared in the image of Scan point B of scan point 4, and relatively serious fatigue damage appeared at scan point 4, while the fatigue damage at scan point 3 was constantly expanding. No obvious damage was found at scan point 1 and scan point 2. At N = 440,160, the CFRP shaft tube had fatigue failure, and the fatigue damage of scanning point 4 was very serious, and the fatigue damage of scanning point 3 was also very serious. Only minor damage appeared at scanning points 1 and 2, and no obvious fatigue damage was observed.
To sum up, the fatigue damage of the CFRP shaft tube initially appeared at scanning point 4 nearest to the loading head. With the progress of fatigue loading, the fatigue damage became more and more serious and gradually expanded to scanning point 3. No obvious fatigue damage was observed at scanning points 1 and 2 in the process of fatigue loading.
3.3.4. Strain of Each Measuring Point of Test Pieces under Different Load Factors
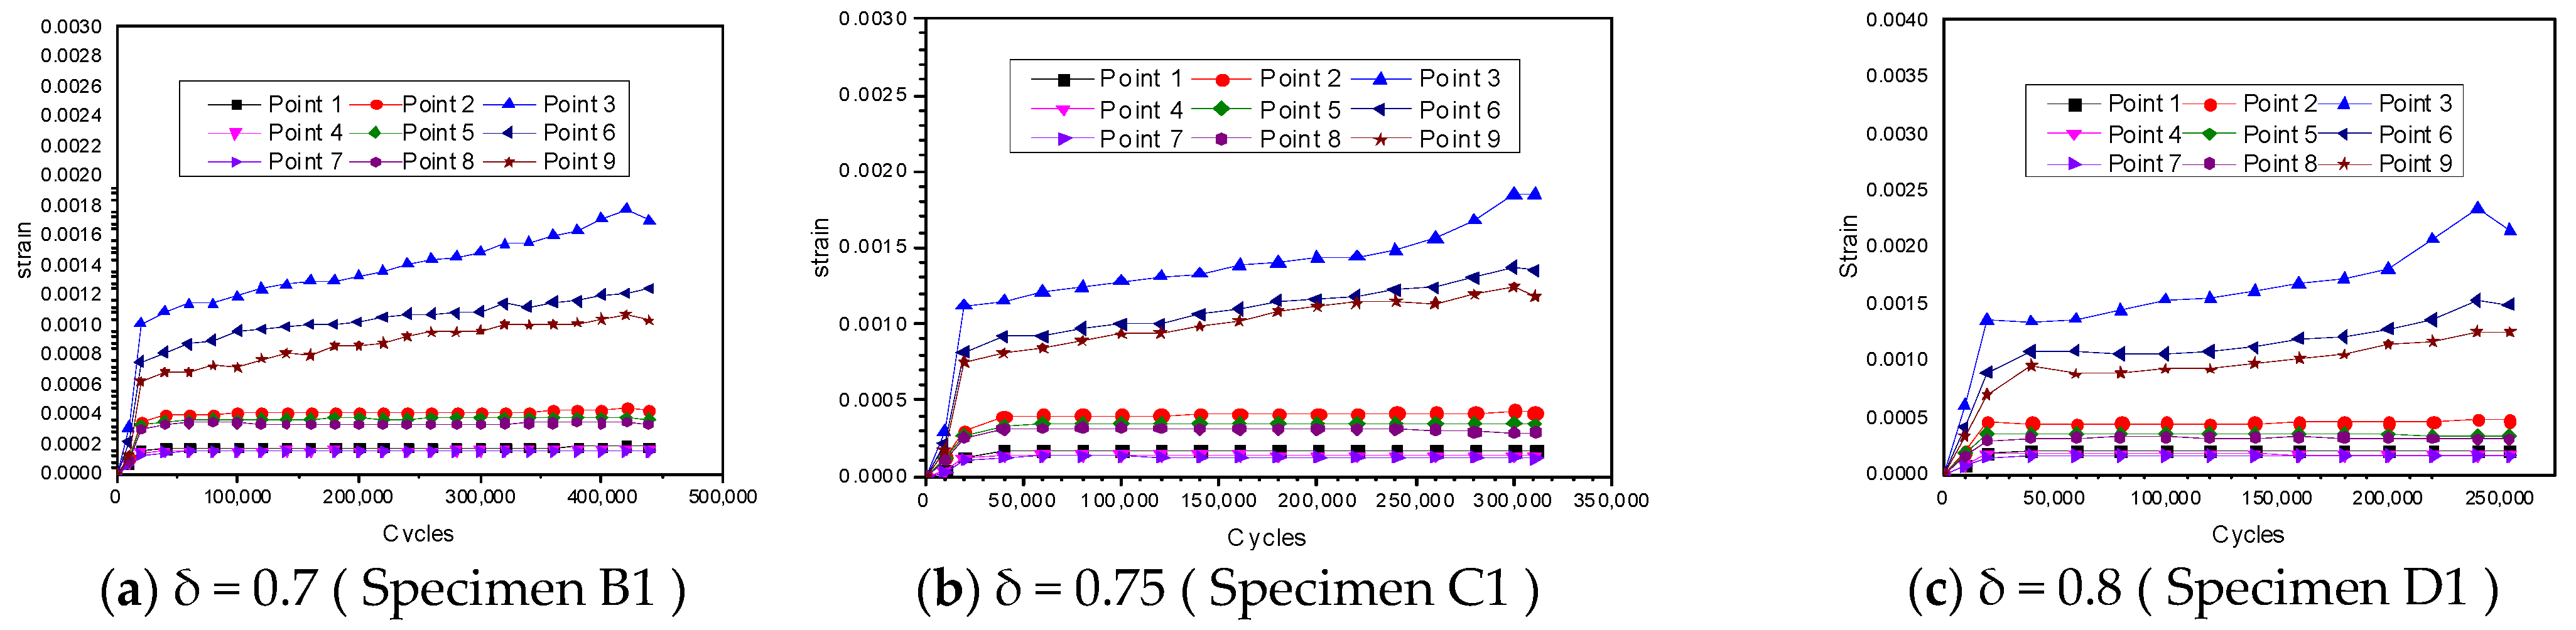
The FBG sensors are used to measure the strain value of each measuring point of the CFRP shaft tube under different load factors, and the measurement results are similar. The strain measurement results of the test points B1, C1, and D1 are shown in Figure 20a–c, respectively.
It can be seen from Figure 20 that the change law of the strain-cycle number curve at each measurement point of the CFRP shaft tube under different load factors is similar. Taking the load factor of 0.7 as an example, the strain value of each measuring point increases with the increase in the number of cycles. In the initial stage of fatigue loading, the strain value of each measuring point of the CFRP shaft tube increases greatly, and in the middle and late stages of fatigue loading. The strain increase of each measuring point is small. In addition, the strain value of measuring point 3, measuring point 6, and measuring point 9 is greater than the strain value of other measuring points, indicating that the force is also greater than that of other measuring points.
To further study the law of fatigue damage evolution of shaft tubes and monitor the damage evolution process, the cycle times of performance mutation points in Figure 4, Figure 5, Figure 18, and Figure 20 were extracted, as shown in Table 8.
It can be seen from Table 8 that the law of the change of the number of cycles at the inflection point under different load factors is similar. Taking a load factor of 0.7 as an example, there is a difference of about 5% in the number of cycles between the simulation and the experimental residual stiffness at an inflection point 1. The experimental strain and the simulated displacement inflection point appear relatively earlier. The difference between the simulated residual stiffness, the experimental residual stiffness, the number of cycles of inflection point 2 of the simulated displacement, and the experimental strain are all within 10%.
3.4. Discussion
The relative error is within 10% by comparing the fatigue life test average value of the CFRP shaft tube under different load factors with the fatigue simulation results. Because the CFRP shaft tube test piece prepared may have some initial defects due to the preparation process and other reasons, the fatigue life obtained by simulation analysis is greater than that obtained by experiment. Ultrasonic scanning results show that during the three-point bending fatigue loading process, the fatigue damage mainly occurs in the area where the loading head contacts the CFRP shaft tube, conforming to the results of simulation analysis of fatigue damage evolution of CFRP shaft tube, and the accuracy of ultrasonic scanning analysis of fatigue damage evolution is verified. The FBG sensors pasted on the surface of the CFRP shaft tube can measure the strain information of each measurement point during the fatigue loading process and sense the stress of each measurement point. This verifies that it is feasible to use FBG sensors to monitor the three-point bending fatigue process of CFRP shaft tubes.
4. Conclusions
This paper takes the CFRP shaft tube under a three-point bending load as the research object. Following the theory of composite material mechanics and damage mechanics, its fatigue life, residual stiffness, and fatigue damage evolution law under three-point bending fatigue load are studied by using the research idea of combining simulation analysis and experiment. In the comparative analysis of the results of the experiment and simulation, it is shown that the fatigue life error is within 10% and that the experimental value of residual stiffness is slightly smaller than the simulated value, while with the same overall trend of the two. The ultrasonic phased array flaw detector was used to analyze the damage to the CFRP shaft tube after different fatigue loading times. The two results are found to be in good agreement compared with the simulation analysis result of fatigue damage evolution. By pasting the FBG sensor on the surface of the CFRP shaft tube, an online fatigue monitoring system for the CFRP shaft tube based on FBG sensing was constructed. In addition, the FBG sensors were used to monitor the strain information of the CFRP shaft tube during the fatigue process, with full monitoring of the whole process of fatigue evolution of the CFRP shaft tube.
Author Contributions
Methodology, G.D.; validation, formal analysis, writing—original draft preparation, X.Y.; visualization, X.G. and visualization J.X. All authors have read and agreed to the published version of the manuscript.
Funding
This work was supported by the National Science Foundation of China (Project No. 51775400), the Hubei Provincial Key Science and Technology Innovation Project (Project No. 2014AAA005), and Fundamental Research Funds for the Central Universities (WUT: 2017III044).
Institutional Review Board Statement
Not applicable.
Informed Consent Statement
Not applicable.
Data Availability Statement
Not applicable.
Conflicts of Interest
The authors declare no conflict of interest.
References
- O’Dwyer, D.; O’Dowd, N.; McCarthy, C. Numerical micromechanical investigation of interfacial strength parameters in a carbon fibre composite material. J. Compos. Mater. 2013, 48, 749–760. [Google Scholar] [CrossRef]
- Wicaksono, S.; Chai, G.B. Life prediction of woven CFRP structure subject to static and fatigue loading. Compos. Struct. 2015, 119, 185–194. [Google Scholar] [CrossRef]
- Yu, Q.; Wu, Y. Fatigue retrofitting of cracked steel beams with CFRP laminates. Compos. Struct. 2018, 192, 232–244. [Google Scholar] [CrossRef]
- Gong, M.; Sun, S.; Sun, L.; Tian, A.; Li, Q. Simulation and experimentation of wide frequency electromagnetic shielding coating used for carbon fiber composite materials of track vehicles. Int. J. Mod. Phys. B 2019, 33, 1940020. [Google Scholar] [CrossRef]
- Yang, T.; He, M.; Niu, X.; Du, Y. Experimental investigation of the three-point bending fatigue prop-series of carbon fiber composite laminates. Adv. Mater. Sci. 2017, 1, 7–13. [Google Scholar]
- Koch, I.; Zscheyge, M.; Tittmann, K.; Gude, M. Numerical fatigue analysis of CFRP components. Compos. Struct. 2017, 168, 392–401. [Google Scholar] [CrossRef]
- Neidigk, S.; Le, J.; Roach, D.; Duvall, R.; Rice, T. Use of nondestructive inspection and fiber optic sensing for damage characterization in carbon fiber fuselage structure. In Proceedings of the SPIE Smart Structures and Materials + Nondestructive Evaluation and Health Monitoring, San Diego, CA, USA, 9–13 March 2014; Volume 9063, pp. 1–8. [Google Scholar] [CrossRef]
- Fernandes, H.; Zhang, H.; Figueiredo, A.; Ibarra-Castanedo, C.; Guimarares, G.; Maldague, X. Carbon fiber composites inspection and defect characterization using active infra-red thermography: Numerical simulations and experimental results. Appl. Opt. 2016, 55, 46–53. [Google Scholar] [CrossRef] [PubMed]
- Shan, N. Applications Research in Ultrasonic testing of Carbon Fiber Composite Based on an Optical Fiber F-p Sensor. In Proceedings of the Eighth International Symposium on Advanced Optical Manufacturing and Testing Technology, Suzhou, China, 7 November 2016; Volume 9685, pp. 1–6. [Google Scholar] [CrossRef]
- Amaro, A.M.; Reis, P.N.B.; Moura MFSF de Santos, J.B. Damage detection on laminated composite materials using several NDT techniques. Insight Non-Destr. Test. Cond. Monit. 2012, 54, 14–20. [Google Scholar] [CrossRef]
- Stawiarski, A.; Muc, A.; Kędziora, P. Damage Detection, Localization and Assessment in Multilayered Composite Structure with Delaminations. Key Eng. Mater. 2013, 542, 193–204. [Google Scholar] [CrossRef]
- Intan, B.; Murat, S.; Khalili, P.; Fromme, P. Impact Damage Detection in Composite Panels us-ing Guided Ultrasonic Waves. In Proceedings of the 40th Annual Review of Progress in Quantitative Nondestructive Evaluation: Incorporating the 10th International Conference on Barkhausen Noise and Micromagnetic Testing, Baltimore, MD, USA, 21–26 July 2013; pp. 286–293. [Google Scholar] [CrossRef]
- Papa, I.; Lopresto, V.; Langella, A. Ultrasonic inspection of composites materials: Application to detect impact damage. Int. J. Lightweight Mater. Manuf. 2020, 4, 37–42. [Google Scholar] [CrossRef]
- Okabe, T.; Yashiro, S. Damage detection in holed composite laminates using an embedded FBG sensor. Compos. Part A Appl. Sci. Manuf. 2012, 43, 388–397. [Google Scholar] [CrossRef]
- Werneck, M.M.; Allil, R.C.S.B.; Ribeiro, B.A.; de Nazaré, F.V.B. A Guide to Fiber Bragg Grating Sensors. In Current Trends in Short- and Long-Period Fiber Gratings; Intech: London, UK, 2013; pp. 1–24. [Google Scholar]
- Materials, C. Overview of Fiber Optic Sensor Technologies for Strain/Temperature Sensing Applications in Composite Materials. Sensors 2016, 16, 99. [Google Scholar] [CrossRef]
- Kinet, D.; Megret, P.; Goossen, K.W.; Qiu, L.; Heider, D.; Caucheteur, C. Fiber Bragg Grating Sensors toward Structural Health Monitoring in Composite Materials: Challenges and Solutions. Sensors 2014, 14, 7394–7419. [Google Scholar] [CrossRef] [PubMed]
- Takeda, S.I.; Yokozeki, T.; Ogasawara, T. Damage monitoring of polymer-lined carbon fiber-reinforced plastic using small-diameter fiber Bragg grating sensors. J. Reinf. Plast. Compos. 2015, 34, 454–462. [Google Scholar] [CrossRef]
- Guo, Z.; Feng, J.; Wang, H.; Hu, H.; Zhang, J. Fiber Bragg Grating Sensors for Fatigue Monitoring of Composite. Polym. Polym. Compos. 2013, 21, 553–560. [Google Scholar] [CrossRef]
- Chiang, C.C.; Shin, C.S.; Lin, C.L. Application of the embedded optical fiber Bragg grating sensors in detecting the internal fatigue damage of Gr/epoxy laminated composites. Chin. J. Mech. Eng. 2006, 27, 801–807. [Google Scholar]
- Hashin, Z. Failure Criteria for Unidirectional Fiber Composites. J. Appl. Mech. 1980, 47, 329–334. [Google Scholar] [CrossRef]
Figure 1.
Boundary conditions of finite element model of CFRP shaft tube.

Figure 2.
Different densities of axial tube grids.

Figure 3.
Quasi−static bending stress field of CFRP shaft tube.

Figure 4.
Quasi-static bending displacement-load curve of CFRP shaft tube.

Figure 5.
Displacement—cycle number curve of loading head.

Figure 6.
Residual stiffness—cycle number curve.

Figure 7.
Tensile damage evolution of shaft tube fibers.

Figure 8.
Compression damage evolution of shaft tube fibers.

Figure 9.
Tensile damage evolution of shaft tube matrix.

Figure 10.
Compression damage evolution of shaft tube matrix.

Figure 11.
Specimen of CFRP shaft tube.

Figure 12.
The load-displacement curve of the quasi-static bending experiment.

Figure 13.
Fatigue test system. (a) Schematic diagram of the fatigue test system. (b) Site diagram of the fatigue test system.
Figure 13.
Fatigue test system. (a) Schematic diagram of the fatigue test system. (b) Site diagram of the fatigue test system.

Figure 14.
Field diagram of CFRP shaft tube ultrasonic scanning experiment.

Figure 15.
Schematic diagram of ultrasonic scanning point.

Figure 16.
Schematic diagram of FBG sensor network layout.

Figure 17.
CFRP shaft tube pasted with FBG sensor.

Figure 18.
Residual stiffness—cycle number curve of CFRP shaft tube experiment and simulation.

Figure 19.
Ultrasonic scanning results of experimental piece E1.

Figure 20.
Strain−cycle number curve of each measuring point of CFRP shaft tube under different load factors.
Figure 20.
Strain−cycle number curve of each measuring point of CFRP shaft tube under different load factors.


Table 1.
Material properties of FAW200RC38 prepreg.
| Parameter | Value | Parameter | Value |
|---|---|---|---|
| 142 | 1900 | ||
| 9 | 51 | ||
| 9 | 51 | ||
| 0.32 | 1100 | ||
| 0.46 | 130 | ||
| 0.32 | 130 | ||
| 4.6 | 72 | ||
| 3.08 | 72 | ||
| 4.6 | 70 | ||
| 50 | 75 | ||
| 0.25 | 0.75 | ||
| 1620 |
Table 2.
Material properties of prepreg interface elements.
| Parameter | Value | Parameter | Value |
|---|---|---|---|
| 9.7 | 55 | ||
| 6.5 | 120 | ||
| 6.5 | 120 | ||
| 0.28 | 1.45 | ||
| 0.495 | 1570 | ||
| 0.495 |
Table 3.
Ultimate loads for different mesh number.
| Grid Number | Number of Grid Cells (Units) | Simulation Limit Load (N) |
|---|---|---|
| 1 | 4320 | 23,024 |
| 2 | 6624 | 22,418 |
| 3 | 10,752 | 20,321 |
| 4 | 20,792 | 20,568 |
| 5 | 31,320 | 20,564 |
Table 4.
The number, quantity, and application of CFRP shaft tube test pieces.
| Group | Quantity | Number | Application |
|---|---|---|---|
| A | 3 | A1~A3 | Quasi-static test |
| B | 3 | B1~B3 | Fatigue test (δ = 0.7) |
| C | 3 | C1~C3 | Fatigue test (δ = 0.75) |
| D | 3 | D1~D3 | Fatigue test (δ = 0.8) |
| E | 4 | E1~E4 | Fatigue damage evolution |
Table 5.
Elastic limit load and a limit load of CFRP shaft tube test pieces.
| Specimen | Elastic Limit Load (N) | Ultimate Load (N) |
|---|---|---|
| A1 | 7063 | 20,801 |
| A2 | 8608 | 20,860 |
| A3 | 8485 | 19,545 |
Table 6.
Fatigue life of CFRP shaft tube test parts under different load coefficients.
| Load Factor | Specimen Life (Times) | Average Value | ||
|---|---|---|---|---|
| 0.7 | B1 | B2 | B3 | 440,071 |
| 438,920 | 440,260 | 441,032 | ||
| 0.75 | C1 | C2 | C3 | 311,114 |
| 310,670 | 321,323 | 301,350 | ||
| 0.8 | D1 | D2 | D3 | 254,563 |
| 254,362 | 254,563 | 254,763 | ||
Table 7.
Fatigue life experiment and simulation analysis results of CFRP pipe under different loads.
Table 7.
Fatigue life experiment and simulation analysis results of CFRP pipe under different loads.
| Load Factor | Fatigue Life (Times) | Difference (Times) | Relative Errors | |
|---|---|---|---|---|
| Experimental Average Value | Simulated Value | |||
| 0.7 | 440,071 | 480,000 | 39,929 | 9.07% |
| 0.75 | 311,114 | 340,000 | 28,886 | 9.28% |
| 0.8 | 254,563 | 280,000 | 25,437 | 9.99% |
Table 8.
Cycle times of simulation and experimental mechanical performance mutation points under different load factors.
Table 8.
Cycle times of simulation and experimental mechanical performance mutation points under different load factors.
| Load Factor | Inflection Point | Experiment Strain (Cycle Times) | Simulation Displacement (Cycle Times) | Experiment Residual Stiffness (Cycle Times) | Simulation Residual Stiffness (Cycle Times) |
|---|---|---|---|---|---|
| 0.7 | Point 1 | 19,300 | 20,459 | 39,080 | 41,065 |
| Point 2 | 415,867 | 380,689 | 382,236 | 379,770 | |
| 0.75 | Point 1 | 19,780 | 21,609 | 39,571 | 39,811 |
| Point 2 | 299,392 | 280,574 | 260,470 | 279,728 | |
| 0.8 | Point 1 | 19,881 | 20,344 | 39,937 | 40,125 |
| Point 2 | 239,635 | 220,459 | 220,815 | 219,644 |
Publisher’s Note: MDPI stays neutral with regard to jurisdictional claims in published maps and institutional affiliations. |
© 2022 by the authors. Licensee MDPI, Basel, Switzerland. This article is an open access article distributed under the terms and conditions of the Creative Commons Attribution (CC BY) license (https://creativecommons.org/licenses/by/4.0/).
Share and Cite
MDPI and ACS Style
Ding, G.; Yan, X.; Gao, X.; Xiao, J. Experimental and Numerical Studies on Fatigue Characteristics of CFRP Shaft Tube. Appl. Sci. 2022, 12, 8933. https://doi.org/10.3390/app12188933
AMA Style
Ding G, Yan X, Gao X, Xiao J. Experimental and Numerical Studies on Fatigue Characteristics of CFRP Shaft Tube. Applied Sciences. 2022; 12(18):8933. https://doi.org/10.3390/app12188933
Chicago/Turabian StyleDing, Guoping, Xiaoyu Yan, Xiaoling Gao, and Jieliang Xiao. 2022. "Experimental and Numerical Studies on Fatigue Characteristics of CFRP Shaft Tube" Applied Sciences 12, no. 18: 8933. https://doi.org/10.3390/app12188933
Note that from the first issue of 2016, this journal uses article numbers instead of page numbers. See further details here.