Article

Minimizing Maximum Feature Space Deviation for Visible-Infrared Person Re-Identification

1
Department of Computer Science and Technology, Tsinghua University, Beijing 100084, China
2
College of Engineering, Huaqiao University, Quanzhou 362021, China
*
Author to whom correspondence should be addressed.
Appl. Sci. 2022, 12(17), 8792; https://doi.org/10.3390/app12178792
Submission received: 25 May 2022 / Revised: 17 August 2022 / Accepted: 19 August 2022 / Published: 1 September 2022
(This article belongs to the Special Issue Recent Applications of Computer Vision for Automation and Robotics)

Abstract

:
Visible-infrared person re-identification (VIPR) has great potential for intelligent video surveillance systems at night, but it is challenging due to the huge modal gap between visible and infrared modalities. For that, this paper proposes a minimizing maximum feature space deviation (MMFSD) method for VIPR. First, this paper calculates visible and infrared feature centers of each identity. Second, this paper defines feature space deviations based on these feature centers to measure the modal gap between visible and infrared modalities. Third, this paper minimizes the maximum feature space deviation to significantly reduce the modal gap between visible and infrared modalities. Experimental results show the superiority of the proposed method, e.g., on the RegDB dataset, the rank-1 accuracy reaches 92.19%.

1. Introduction

Given a visible (or infrared) query image of a specified person, the goal of Visible-infrared person re-identification [1,2,3,4,5,6] is to retrieve infrared (or visible) images of the same person from a gallery set, as shown in Figure 1. VIPR has received more and more attention due to its importance to intelligent surveillance systems and intelligent transportation systems in light-less environments. In these application scenarios, visible images are captured by color cameras and infrared images usually are captured by near-infrared [7] or thermal [8] cameras. Just as with the traditional single-modal (i.e., visible) re-identification task [9,10,11], VIPR meets the great challenges of pose variation, viewpoint variation, and occlusions. Furthermore, VIPR suffers from a huge modal gap between visible and infrared modalities. Therefore, VIPR is a meaningful but challenging topic that is worthy of intensive study.
Existing VIPR works can be roughly divided into three types: (1) metric learning-based methods [3,12,13,14], (2) feature extraction-based methods [2,15,16,17,18,19,20,21], and (3) generation-based methods [22,23,24,25]. Many metric learning-based methods usually design specific triplet loss functions to optimize cross-modal samples. However, metric learning-based methods focus on identity-level discrimination, underestimating threats of outliers raised by the gap between visible and infrared modalities. Feature extraction-based methods are often dedicated to designing additional special feature learning architectures (e.g., visual attention modules) to enhance general deep networks (e.g., residual networks [26]) to map different modal features into a common feature space. However, extra computations caused by additional special feature learning architectures are required.
Generation-based methods use generation adversarial networks (GAN) for modal conversion to eliminate modal gaps. For example, in addition to using ResNet-50 [26], Zhong et al. [22] designed a GAN to produce synthetic color images from infrared and gray images. The GAN contains a generator of five convolutional layers and five convolution-transpose layers, and each layer is followed by a batch normalization layer, a leaky rectified linear unit, and a residual connection. The discriminator is a fully convolutional network, mainly consisting of a series of 3 × 3 convolutional layers, where each convolutional layer is followed by a max-pooling layer, and the number of channels doubles after each max-pooling layer. The generator is applied to generate synthetic color images, while the discriminator is used to discriminate an image is synthetic or real. Through the antagonism between generator and discriminator, the generator could generate realistic synthetic color images to reduce modal gaps. GANs of generators and discriminators are commonly used, such as [24,25,27,28]. In [24,25,27], multiple GANs are applied to realize more delicate adversarial learning. Leaving aside GAN’s architecture complexities, in practice, GAN’s training process is complex and involves many hyper-parameters that require stage-wise training or alternate training. Therefore, GAN-based methods require a lot of skill to avoid model collapses.
In this paper, we propose a minimizing maximum feature space deviation (MMFSD) method for VIPR. For modeling the modal gap between visible and infrared modalities, we define feature space deviations (FSD) based on each identity’s visible and infrared feature centers. Their centers are calculated by averaging multiple samples on the same modality of the same identity. Furthermore, for reducing the modal gap between visible and infrared modalities, we design a minimizing maximum FSD loss function, which optimizes deviations from the most severe feature dimensions.
The main contributions of this paper can be summarized as follows. (1) A novel feature space deviation measurement is designed to measure the modal gap between visible and infrared modalities. (2) A minimizing maximum feature space deviation loss function is designed to significantly reduce modal gap between visible and infrared modalities. (3) Experimental results on SYSU-MM01 [7] and RegDB [8] datasets demonstrate that our method outperforms many state-of-the-art approaches.
The rest of this paper is organized as follows. Section 2 reviews related work. Section 3 describes the proposed method in detail. Section 4 presents experimental results to analyze our method’s superiority. Section 5 concludes this paper.

2. Related Work

2.1. Metric Learning-Based Method

Some works [1,14,16,23,25] directly use the traditional triplet loss function [12,29], which suffers from the huge cross-modal gap in VIPR. Furthermore, many methods [5,13,30] are dedicated to designing new triplet loss functions that optimize cross-modal positive and negative pairs for VIPR. For example, Liu et al. [5] designed a hero-center triplet loss function to pull close positive feature centers from different modalities and push away negative feature centers from different and same modalities.

2.2. Feature Extraction-Based Method

Deep learning feature extraction architectures have been widely used in many computer vision tasks, such as image super-resolution [31], image detection [32], and live searching [33]. For VIPR, the common feature extraction method is to modify general deep learning feature extraction architectures into two-stream networks [1,2,14,16,34,35] whose shallow layers are independent to learn features from different modalities, and whose deep layers are shared to align cross-modal features. For example, Ye et al. [2] first introduced the two-stream network for deep cross-modal shareable feature learning, which contains a visible image stream and infrared image stream. Still, there are some methods [1,34] that introduced an attention mechanism to the two-stream network, which learned intra-modal discrepancy and inter-modal correlation to achieve better feature alignment. Furthermore, Zhang et al. [18] used an attention module to aggregate part features to global features to enhance discrimination ability of feature learning. Such a part-level feature learning method is also applied in [14,16,17]. Nevertheless, these methods improve feature learning architecture via extra modules (e.g., attention [1,18,34,36] and transformer [35]) that usually consume additional computations.

2.3. Generation-Based Method

The main idea of the generation-based method [6,22,24,25,27,28] is to use generation adversarial network (GAN) for modal conversion, i.e., generating related modality or unified modal information. For example, Hu et al. [24] generated cross-modal paired-images for effective feature alignment. Wang et al. [27] translated the visible and infrared images to their infrared and visible counterpart, respectively, and then combined the original images and generated images to form multi-spectral images for feature learning. Wang et al. [28] directly obtained fake infrared images from visible images by GAN, which alleviated the modality discrepancy. The GAN-based method achieves style transfer for reducing modal variations. However, methods with GAN usually converge slowly and make re-identification module complex.

3. Proposed Method

In this section, we describe our minimizing maximum feature space deviation (MMFSD) method in detail, including: (1) feature space deviation modeling; (2) feature learning architecture; (3) total loss function design.

3.1. Feature Space Deviation Modeling

Let { x k , i | x k , i R d × 1 , k 1 , 2 , , K , i = 1 , 2 , , N } and { y k , i | y k , i R d × 1 , k 1 , 2 , , K , i = 1 , 2 , , N } denote features extracted from visible and infrared images, respectively, where K is the number of classes in the mini-batch, and N is the number of images in each class, and d represents the number of feature dimensions. The feature space deviation modeling progress is described as follows.
(1) Calculating visible and infrared centers of each class to construct the visible feature space X and the infrared feature space Y as follows.
X = [ x ¯ 1 , x ¯ 2 , , x ¯ k , , x ¯ K ] T R K × d ,
Y = [ y ¯ 1 , y ¯ 2 , , y ¯ k , , y ¯ K ] T R K × d ,
where
x ¯ k = 1 N i = 1 N x k , i R 1 × d ,
y ¯ k = 1 N i = 1 N y k , i R 1 × d .
(2) Calculating distances of visible and infrared feature spaces on each single dimension as deviations. Let us re-symbolize the visible feature space X and the infrared feature space Y as follows.
X = [ p 1 , p 2 , , p j , , p d ] R K × d ,
Y = [ q 1 , q 2 , , q j , , q d ] R K × d ,
where p j R K × 1 and q j R K × 1 represent the column vectors of X and Y , respectively. Then, the distance of visible and infrared feature spaces on each single dimension defined as a feature space deviation as follows.
d j = p ^ j q ^ j 2 = k = 1 K ( p ^ j , k q ^ j , k ) 2 ,
(3) Designing a minimizing maximum feature space deviation (MMFSD) loss function. The MMFSD loss function is calculated as follows:
L M M F S D = max k [ 1 , 2 , , d ] p ^ j q ^ j 2 ,
where p ^ j = p ^ j k = 1 K p ^ j , k 2 and q ^ j = q ^ j k = 1 K q ^ j , k 2 are L2 normalized features of p j and q j , respectively. Based on the MMFSD loss function, distance of the corresponding column vectors in the cross-modal feature spaces is narrowed, so that the maximum feature space deviation is optimized.

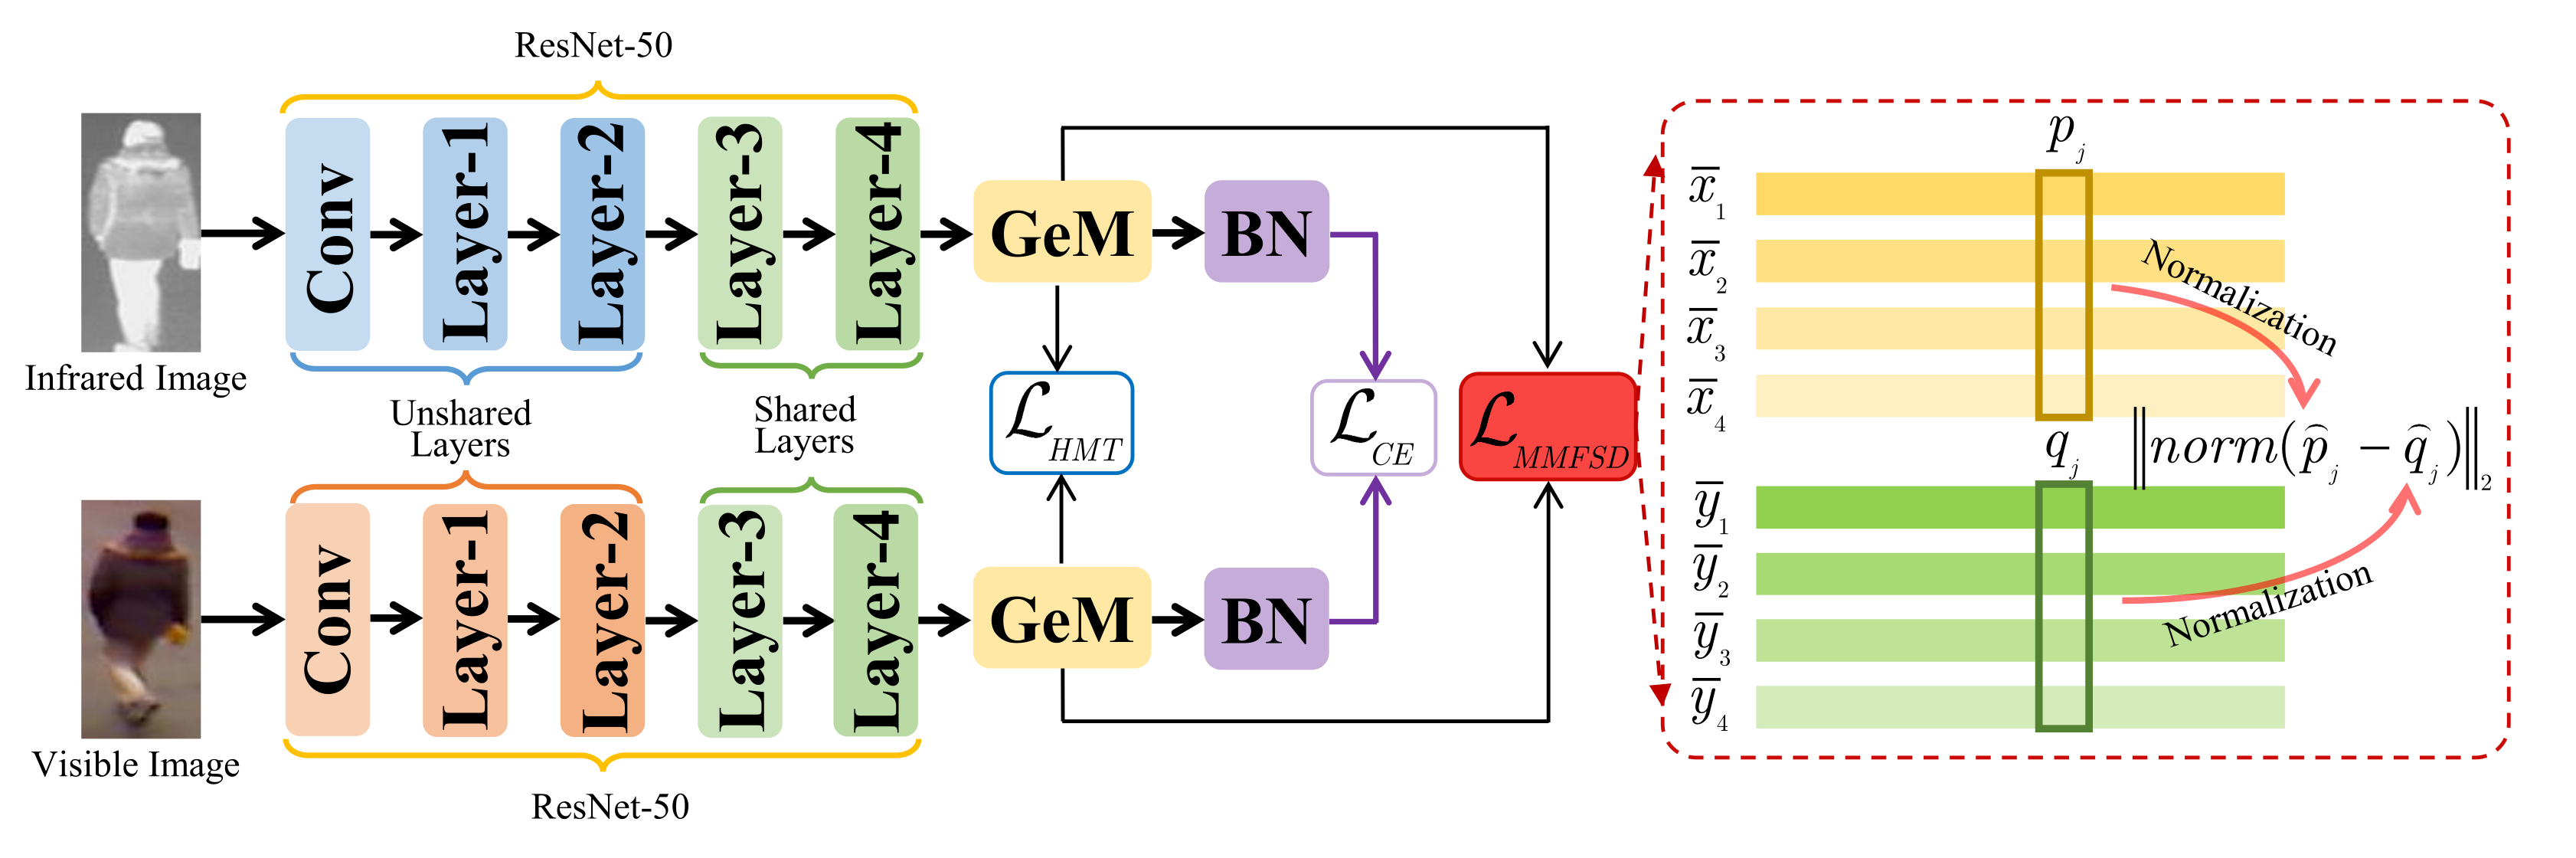
3.2. Feature Learning Architecture

Figure 2 shows the overall framework of VIPR. The two-branch network is used as the feature learning network, which adopts ResNet-50 [26] as a backbone, as performed in many existing works [1,5,37]. As shown in Figure 2, shallow layers of each branch, i.e., the first convolutional layer (Conv), the first residual group (Layer-1), and the second residual group (Layer-2), are un-shared to learning modal-specific features, which means that shallow layers of each modal feature have the same structure but independent parameters. There deep layers, i.e., the third residual group (Layer-3), the forth residual group (Layer-4), the generalized-mean pooling (GeM) layer, and the batch normalization (BN) layer are shared to exploit the modal-shared features. In the inference phase, L2 normalized features from GeM and BN layers are added to be final features for VIPR.

3.3. Total Loss Function Design

In this paper, we combine the proposed MMFSD loss function with two commonly used loss functions, i.e., the hard-mining triplet (HMT) loss function [38] and the cross-entropy (CE) loss function [39], to supervise the training process. The total loss function is formulated as follows:
L T o t a l = λ L M M F S D + L H M T + L C E ,
where λ > 0 is a hyper-parameter used to control the contribution of MMFSD loss function; L H M T and L C E denotes HMT and CE loss functions, which are formulated as follows:
L H M T = 1 M m = 1 M l o g [ 1 + e x p ( max f i F m + f m f i 2 min f j F m f m f j 2 ) ] ,
L C E = 1 M m = 1 M k = 1 K ϵ m , k l o g ( p m , k ) ,
where M = 2 × N × K represents the total number of samples in a mini-batch; K denotes the number of classes; N denotes the number of visible (or infrared) samples of each class; f m represents the feature of m-th sample; F m + and F m denotes the positive set and the negative set of the m-th sample f m ; p m , k represents the posterior probability of the m-th sample belongs to the k-th class (i.e., C l a s s k ), which is calculated with the Softmax function; ϵ m , k is the indicator function of smoothed class labels, which is formulated as follows.
ϵ m , k = { 1 ( K 1 ) ζ K , x m C l a s s k , ζ K , x m C l a s s k ,
where ζ is the regularized parameter for label smoothing, and it is set to 0.1 as a common setting. Furthermore, as shown in Figure 2, the MMFSD loss function and the HMT loss function are assigned to the GeM layer, while the CE loss function is arranged on the BN layer, which is so-called batch normalization neck (BNNeck) [29].

4. Experiments and Analysis

In this paper, we evaluate our method on two popular datasets, i.e., SYSU-MM01 [7] and RegDB [8] datasets. Following existing works [5,12,34], mean average precision (mAP), mean inverse negative penalty (mINP), and cumulative match characteristic (CMC) curve are applied as the VIPR’s performance metrics. Rank1 represents the rank-1 accuracy in a CMC curve.

4.1. Datasets

The SYSU-MM01 dataset [7] contains 491 pedestrian subjects captured by four visible cameras and two infrared cameras. The training set includes 22,258 visible images and 11,909 infrared images of 395 subjects. In the testing processing, there are two test modes, i.e., all-search mode and indoor search mode. In the all-search mode, the query set contains 3803 infrared images of 96 subjects to search from a gallery subset containing 301 visible images of the same subjects. In the indoor-search mode, the query set contains 3803 infrared images of 96 subjects which is same as all-search mode, while the gallery set includes 112 visible images of the same subjects. Following [7], the single-shot evaluation protocol is used, and the final results are based on an average of 10 tests with randomly selected gallery images.
The RegDB dataset [8] includes 412 pedestrian classes, and each class contains ten visible images and ten infrared images captured by the overlapping visible and infrared cameras. Following [1,12,17], this dataset is randomly split into ten trials. In each trial, the training set contains 206 classes, while the testing set includes the non-overlapping 206 classes. The final results are based on an average of 10 tests with 10 trials. Both visible-to-infrared and infrared-to-visible retrieval are evaluated.

4.2. Implementation Details

We employ one GeForce RTX 3090 GPU and the Pytorch [40] deep learning tool to implement our VIPR method. The batch size is set 40, which contains four subjects and each subject has five visible images and five infrared images. All images are resized to 144 × 288 pixels in the training and testing process. The ImageNet [41] pre-trained ResNet-50 is applied as a backbone. We used the mini-batch stochastic gradient descent (SGD) optimizer [42] with the weight decays set to 0.0005 and the momentum set to 0.9 for training. There are 90 epochs in the training process. The initial learning rate is set 0.001. In the first 10 epochs, the learning rate is linearly warmed up to 0.01. After warming up, the learning rate is maintained at 0.01 from the 11st to 30th epochs. The learning rate is decayed to 10% every 20 epochs.

4.3. Comparison with State-of-the-Arts Methods

In this section, we make a comparison with several state-of-the-arts methods to validate the superiority of the proposed method. The comparison results are shown in Table 1 and Table 2.

4.3.1. Comparison on SYSU-MM01

As shown in Table 1, we can see the experimental results on SYSU-MM01 dataset show that the proposed FSMD method obtains the great results in both all-search and indoor-search mode. Specifically, the proposed FSMD method obtains 60.64% Rank1 and 57.54% mAP in all-search mode, while obtains 62.93% Rank1 and 69.27% mAP in indoor-search mode. Compared with the feature extracting method DFLN-ViT [35], the proposed method obtains 0.80% higher Rank1 in both all-search and indoor-search mode. Compared with GAN-based method GECNet [22], the proposed method defeats GECNet [22] by 7.27% in terms of Rank1 and 5.71% in terms of mAP in all-search mode. The improvement demonstrates the superiority of the proposed FSMD method.

4.3.2. Comparison on RegDB

The experimental results on the RegDB dataset in Table 2 demonstrate the proposed FSMD method achieves competitive performance in both visible-to-infrared and infrared-to-visible retrieval. In visible-to-infrared retrieval, the proposed FSMD method obtains 92.19% Rank1 and 85.95% mAP, defeating attention-based method DTRM [34] by 13.10% Rank1 and 15.68% mAP. In infrared-to-visible retrieval, the proposed FSMD method obtains 90.65% Rank1 and 84.38% mAP, defeating id-level loss function HC-triplet [5] by 1.35% Rank1 and 2.74% mAP. These comparative results validate the effectiveness of the proposed FSMD method.

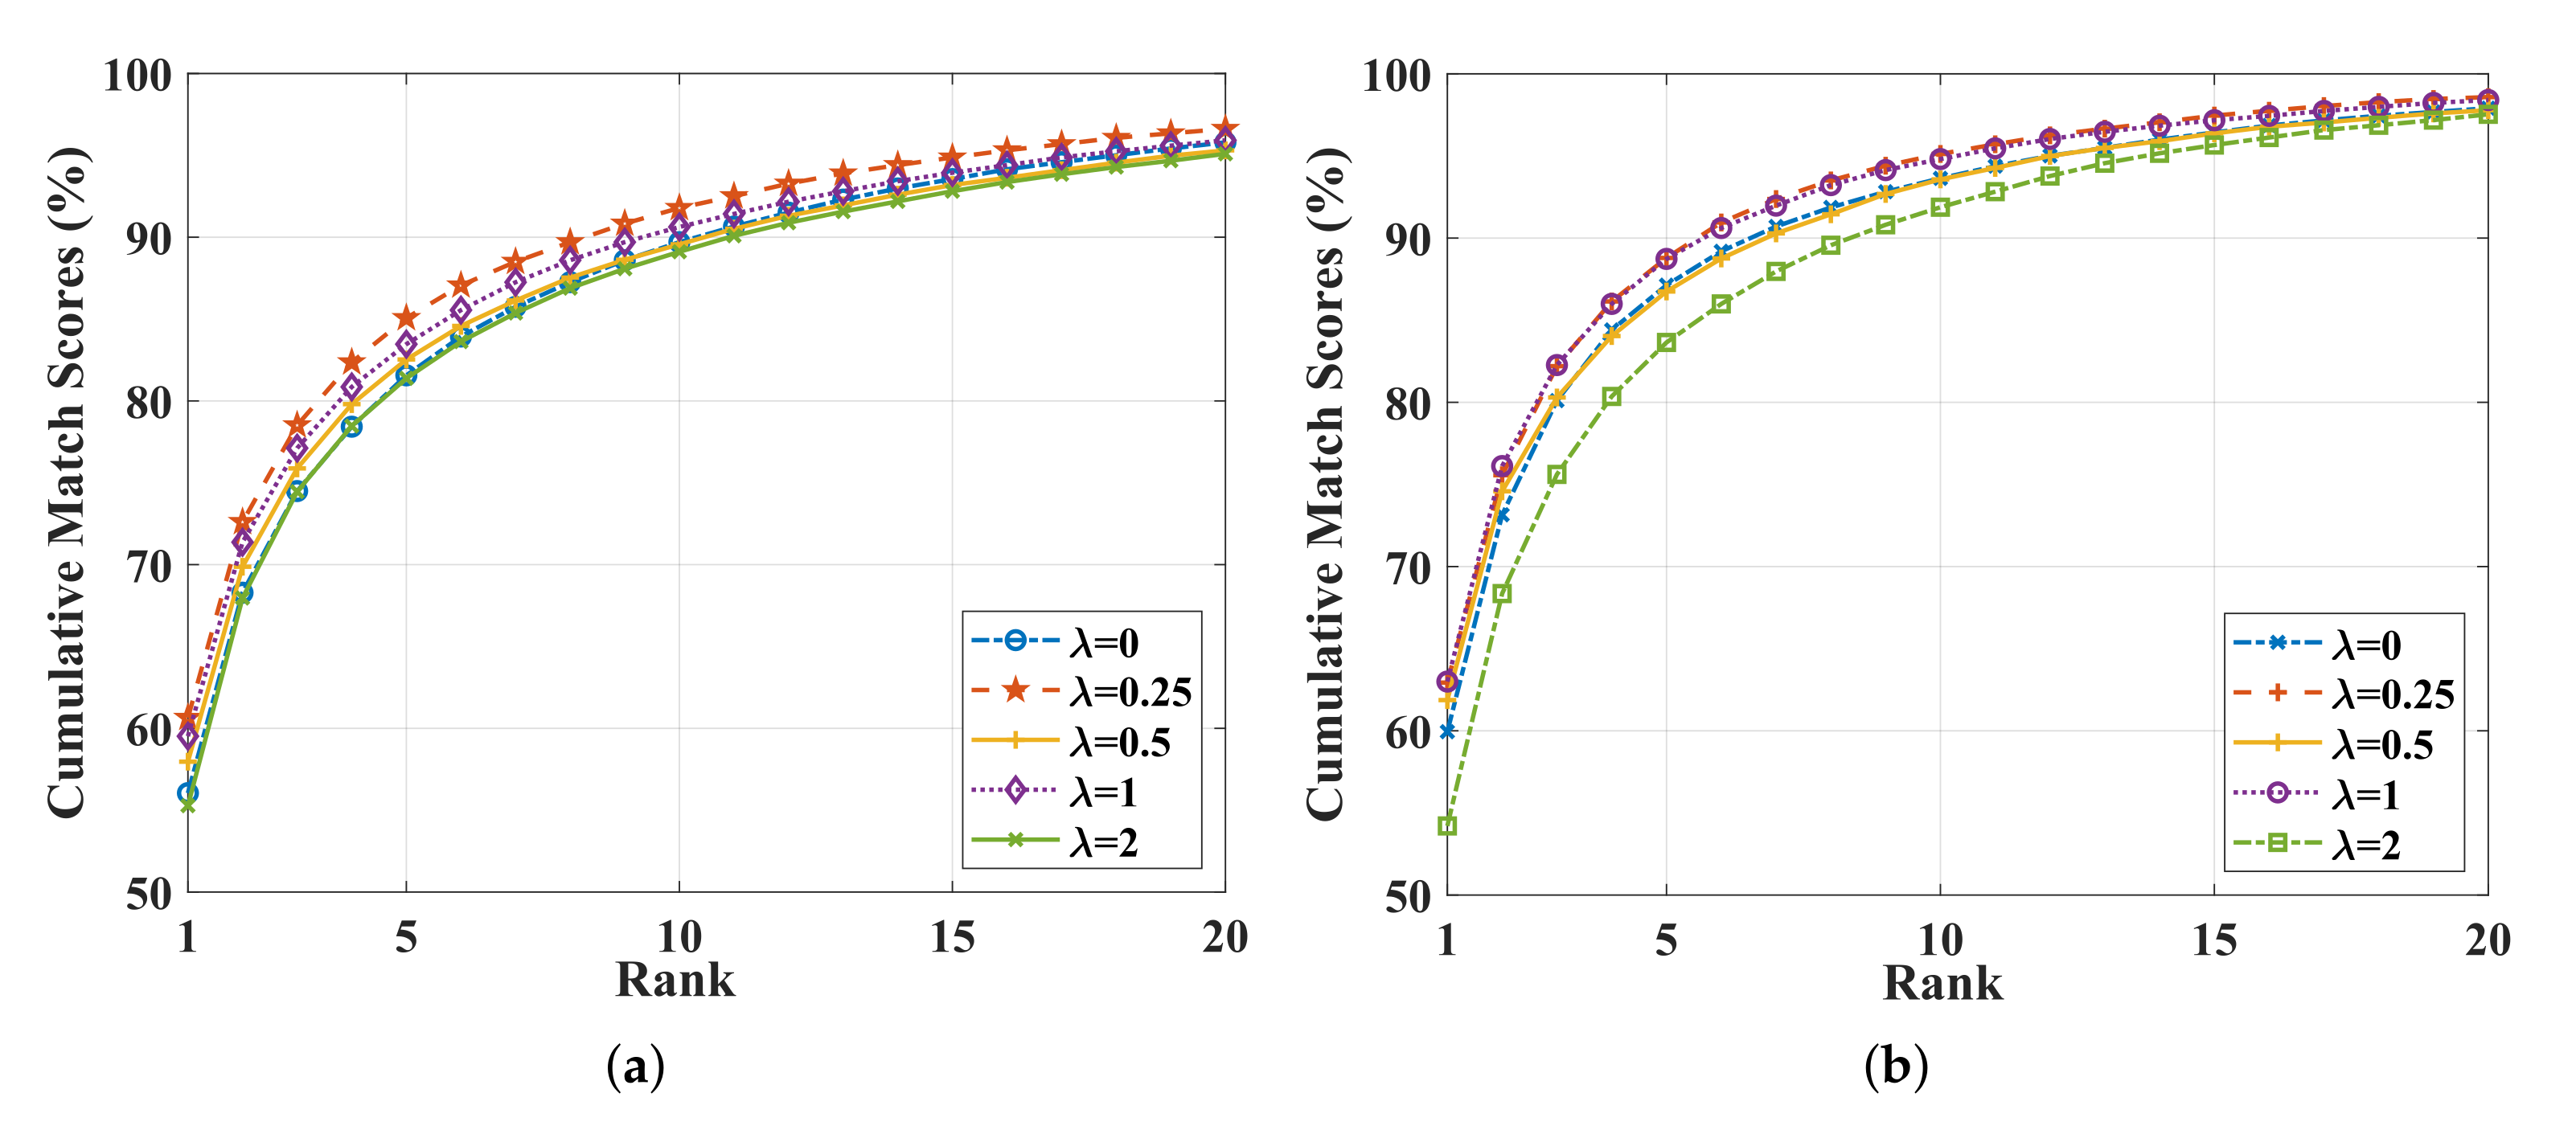
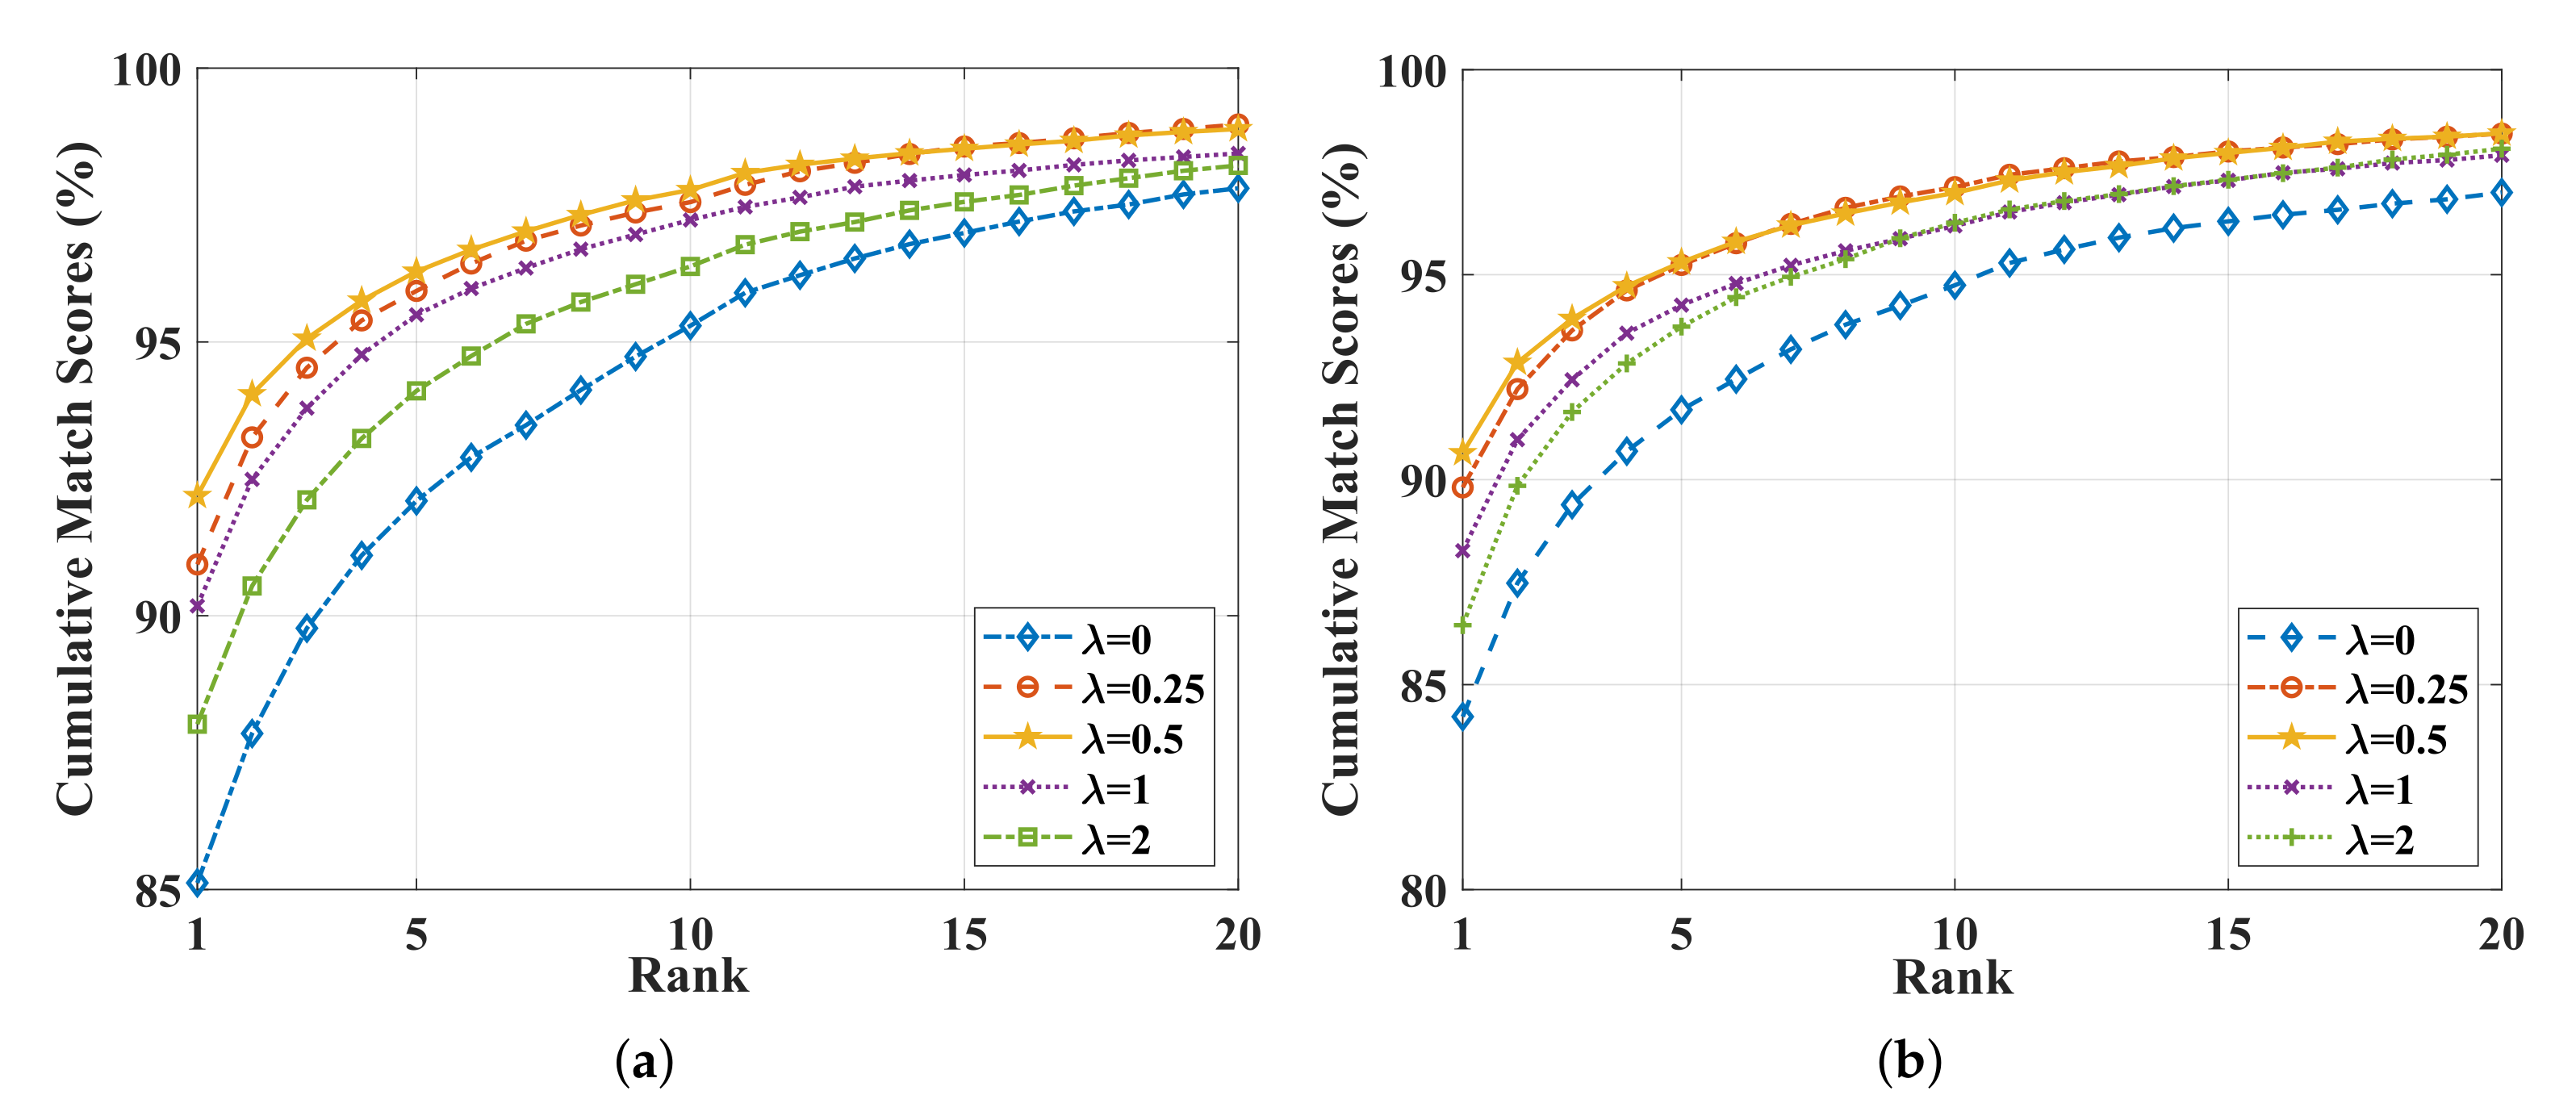
4.4. Role of Minimizing Feature Space Maximum Deviation Loss Function

We adjust the λ in Equation (9) to evaluate the role of the MFSMD loss function. Table 3 and Figure 3 show the performance on SYSU-MM01 dataset, and Table 4 and Figure 4 show the performance on RegDB dataset.
On the SYSU-MM01 dataset, from Table 3 and Figure 3, it can be found that the proposed FSMD loss function achieves great performance. For example, compared with the case without FSMD loss function (i.e., λ = 0 ), the Rank1, mAP and mINP obtain better results when λ = 0.25 on all-search mode (i.e., 60.64% Rank1, 57.54% mAP, and 43.31% mINP). It demonstrates the effectiveness of the FSMD loss function.
On the RegDB dataset, Table 4 and Figure 4 also show the effectiveness of the FSMD loss function. Specifically, when adjusting λ from 0.25 to 2, the Rank1, mAP, and mINP are higher than those as λ = 0 on both visible-to-infrared retrieval and infrared-to-visible retrieval. Among them, when λ = 0.5 , it obtains the best performance, i.e., 92.19% Rank1, 85.95% mAP and 72.86% mINP on visible-to-infrared retrieval, and 90.65% Rank1, 84.38% mAP and 70.73% mINP on infrared-to-visible retrieval.
By comparing with the results on the SYSU-MM01 and RegDB datasets, one can see that the best λ value of RegDB is bigger than that of SYSU-MM01. Furthermore, comparing with Figure 3 and Figure 4, we can find that the CMC curves’ variation on RegDB dataset is larger than that on SYSU-MM01 dataset with adjusting the λ . This is because, compared with SYSU-MM01 dataset which suffer from multiple intra-class variation (e.g., pose variation, view variation and modal variation), the modal discrepancy on RegDB dataset is the most significant problem. Therefore, it further demonstrates the FSMD’s outstanding performance on deal with modal discrepancy.

5. Conclusions

In this paper, we design a novel feature space deviation measurement for modeling the huge modal gap between visible and infrared images. Furthermore, a minimizing maximum feature space deviation loss function is designed to reduce modal gap between visible and infrared modalities. Experiments on the SYSU-MM01 and RegDB datasets demonstrate that the proposed MMFSD loss function is helpful to improve VIPR performance, outperforming many state-of-the-arts methods.
In the future work, we will study how to deal with partially occluded person images caused by over-saturating infrared sensors in high temperature environments, e.g., we will try to design an automatic data augmentation method to eliminate the adverse effects of high temperatures on infrared sensor imaging. Moreover, we will explore the application of feature space deviation measurements, e.g., extracting modal-common features from infrared and visible images via suppressing feature space deviations and then decoding modal-common features back to image spaces for infrared-visible image fusion to enhance imaging effect.

Author Contributions

Conceptualization, Z.W. and T.W. Writing—original draft preparation, Z.W. Writing—review and editing, T.W. All authors have read and agreed to the published version of the manuscript.

Funding

This research was found by Natural Science Foundation of Fujian under that Grant 2020J01086.

Institutional Review Board Statement

Not applicable.

Informed Consent Statement

Not applicable.

Data Availability Statement

Not applicable.

Conflicts of Interest

The authors declare no conflict of interest.

Abbreviations

The following abbreviations are used in this manuscript:
VIPRVisible-infrared person re-identification
FSDFeature space deviation
MMFSDMinimizing maximum feature space deviation
GANGenaration adversarial network
ConvConvolutional layer
GeMGeneralized-mean pooling
BNBatch normalization
HMTHard-mining triplet
CECross-entropy
BNNeckBatch normalization neck
mAPMean average precision
CMCCumulative match characteristic
Rank1rank-1 accuracy
SGDStochastic gradient descent

References

  1. Ye, M.; Shen, J.; Crandall, D.; Shao, L.; Luo, J. Dynamic Dual-Attentive Aggregation Learning for Visible-Infrared Person Re-identification. In European Conference on Computer Vision; Springer: Cham, Switzerland, 2020; pp. 229–247. [Google Scholar]
  2. Ye, M.; Lan, X.; Li, J.; Yuen, P. Hierarchical Discriminative Learning for Visible Thermal Person Re-Identification. In Proceedings of the AAAI Conference on Artificial Intelligence, Honolulu, HI, USA, 27 January–1 February 2019; pp. 7501–7508. [Google Scholar]
  3. Ye, M.; Wang, Z.; Lan, X.; Yuen, P.C. Visible Thermal Person Re-Identification via Dual-Constrained Top-Ranking. In Proceedings of the International Joint Conference on Artificial Intelligence, Stockholm, Sweden, 13–19 July 2018; pp. 1092–1099. [Google Scholar]
  4. Dai, H.; Xie, Q.; Ma, Y.; Liu, Y.; Xiong, S. RGB-Infrared Person Re-identification via Image Modality Conversion. In Proceedings of the International Conference on Pattern Recognition, Milan, Italy, 10–15 January 2021; pp. 592–598. [Google Scholar]
  5. Liu, H.; Tan, X.; Zhou, X. Parameter Sharing Exploration and Hetero-center Triplet Loss for Visible-Thermal Person Re-Identification. IEEE Trans. Multimed. 2021, 23, 4414–4425. [Google Scholar]
  6. Dai, P.; Ji, R.; Wang, H.; Wu, Q.; Huang, Y. Cross-Modality Person Re-Identification with Genertive Adversarial Training. In Proceedings of the International Joint Conference on Artificial Intelligence, Stockholm, Sweden, 13–19 July 2018; pp. 677–683. [Google Scholar]
  7. Wu, A.; Zheng, W.S.; Yu, H.X.; Gong, S.; Lai, J. RGB-Infrared Cross-Modality Person Re-identification. In Proceedings of the IEEE International Conference on Computer Vision, Venice, Italy, 22–29 October 2017; pp. 5390–5399. [Google Scholar]
  8. Nguyen, D.T.; Hong, H.G.; Kim, K.W.; Park, K.R. Person Recognition System Based on a Combination of Body Images from Visible Light and Thermal Cameras. Sensors 2017, 17, 605. [Google Scholar] [CrossRef] [PubMed]
  9. Zhu, J.; Liu, L.; Zhu, X.; Zeng, H. A spatial structural similarity triplet loss for auxiliary vehicle re-identification. Sciece China Inf. Sci. 2021, 64, 179104. [Google Scholar] [CrossRef]
  10. Zhu, J.; Huang, J.; Zeng, H.; Ye, X.; Li, B.; Lei, Z.; Zheng, L. Object reidentification via joint quadruple decorrelation directional deep networks in smart transportation. IEEE Internet Things J. 2020, 7, 2944–2954. [Google Scholar] [CrossRef]
  11. Zhu, J.; Zeng, H.; Huang, J.; Zhu, X.; Lei, Z.; Cai, C.; Zheng, L. Body symmetry and part-locality-guided direct nonparametric deep feature enhancement for person reidentification. IEEE Internet Things J. 2019, 7, 2053–2065. [Google Scholar]
  12. Ye, M.; Shen, J.; Lin, G.; Xiang, T.; Shao, L.; Hoi, S.C. Deep Learning for Person Re-identification: A Survey and Outlook. IEEE Trans. Pattern Anal. Mach. Intell. 2021, 44, 2872–2893. [Google Scholar]
  13. Liu, H.; Tan, X.; Zhou, X. Bi-Directional Center-Constrained Top-Ranking for Visible Thermal Person Re-Identification. IEEE Trans. Inf. Forensics Secur. 2020, 15, 407–419. [Google Scholar]
  14. Liu, S.; Zhang, J. Local Alignment Deep Network for Infrared-Visible Cross-Modal Person Re-identification in 6G-Enabled Internet of Things. IEEE Internet Things J. 2021, 8, 15259–15266. [Google Scholar]
  15. Lu, Y.; Wu, Y.; Liu, B.; Zhang, T.; Li, B.; Chu, Q.; Yu, N. Cross-Modality Person Re-Identification With Shared-Specific Feature Transfer. In Proceedings of the IEEE Conference on Computer Vision and Pattern Recognition, Seattle, WA, USA, 13–19 June 2020; pp. 13376–13386. [Google Scholar]
  16. Zhang, L.; Du, G.; Liu, F.; Tu, H.; Shu, X. Global-Local Multiple Granularity Learning for Cross-Modality Visible-Infrared Person Reidentification. IEEE Trans. Neural Netw. Learn. Syst. 2021, 1–11. [Google Scholar] [CrossRef]
  17. Wei, Z.; Yang, X.; Wang, N.; Gao, X. Flexible Body Partition-Based Adversarial Learning for Visible Infrared Person Re-Identification. IEEE Trans. Neural Netw. Learn. Syst. 2021, 1–12. [Google Scholar] [CrossRef]
  18. Can, Z.; Hong, L.; Wei, G.; Mang, Y. Multi-Scale Cascading Network with Compact Feature Learning for RGB-Infrared Person Re-Identification. In Proceedings of the International Conference on Pattern Recognition, Milan, Italy, 10–15 January 2021; pp. 8679–8686. [Google Scholar]
  19. Liu, H.; Ma, S.; Xia, D.; Li, S. SFANet: A Spectrum-Aware Feature Augmentation Network for Visible-Infrared Person Reidentificatione. IEEE Trans. Neural Netw. Learn. Syst. 2021, 1–14. [Google Scholar] [CrossRef]
  20. Li, D.; Wei, X.; Hong, X.; Gong, Y. Infrared-Visible Cross-Modal Person Re-Identification with an X Modality. In Proceedings of the AAAI Conference on Artificial Intelligence, New York, NY, USA, 7–12 February 2020; pp. 4610–4617. [Google Scholar]
  21. Miao, Z.; Liu, H.; Shi, W.; Xu, W.; Ye, H. Modality-aware Style Adaptation for RGB-Infrared Person Re-Identification. In Proceedings of the International Joint Conference on Artificial Intelligence, Montreal, QC, Canada, 19–27 August 2021; pp. 916–922. [Google Scholar]
  22. Zhong, X.; Lu, T.; Huang, W.; Ye, M.; Jia, X.; Lin, C.W. Grayscale Enhancement Colorization Network for Visible-infrared Person Re-identification. IEEE Trans. Circuits Syst. Video Technol. 2022, 32, 1418–1430. [Google Scholar]
  23. Wang, G.A.; Zhang, T.; Yang, Y.; Cheng, J.; Chang, J.; Liang, X.; Hou, Z. Cross-Modality Paired-Images Generation for RGB-Infrared Person Re-Identification. In Proceedings of the AAAI Conference on Artificial Intelligence, New York, NY, USA, 7–12 February 2020; pp. 12144–12151. [Google Scholar]
  24. Hu, B.; Liu, J.; Zha, Z.j. Adversarial Disentanglement and Correlation Network for Rgb-Infrared Person Re-Identification. In Proceedings of the IEEE International Conference on Multimedia and Expo, Shenzhen, China, 5–9 July 2021; pp. 1–6. [Google Scholar]
  25. Seokeon, C.; Lee, S.; Kim, Y.; Kim, C. Hi-CMD:Hiererchical Cross-Modality Disentanglement for Visible-Infrared Person Re-Identification. In Proceedings of the IEEE Conference on Computer Vision and Pattern Recognition, Seattle, WA, USA, 13–19 June 2020; pp. 10254–10263. [Google Scholar]
  26. He, K.; Zhang, X.; Ren, S.; Sun, J. Deep residual learning for image recognition. In Proceedings of the IEEE Conference on Computer Vision and Pattern Recognition, Las Vegas, NV, USA, 27–30 June 2016; pp. 770–778. [Google Scholar]
  27. Wang, Z.; Wang, Z.; Zheng, Y.; Chuang, Y.Y.; Satoh, S. Learning to Reduce Dual-Level Discrepancy for Infrared-Visible Person Re-Identification. In Proceedings of the IEEE Conference on Computer Vision and Pattern Recognition, Long Beach, CA, USA, 16–17 June 2019; pp. 618–626. [Google Scholar]
  28. Wang, G.A.; Zhang, T.; Cheng, J.; Liu, S.; Yang, Y.; Hou, Z. RGB-Infrared Cross-Modality Person Re-Identification via Joint Pixel and Feature Alignment. In Proceedings of the IEEE International Conference on Computer Vision, Seoul, Korea, 27–28 October 2019; pp. 3622–3631. [Google Scholar]
  29. Luo, H.; Gu, Y.; Liao, X.; Lai, S.; Jiang, W. Bag of Tricks and a Strong Baseline for Deep Person Re-Identification. In Proceedings of the IEEE International Conference on Computer Vision and Pattern Recognition, Long Beach, CA, USA, 16–17 June 2019; pp. 1487–1495. [Google Scholar]
  30. Feng, Y.; Xu, J.; Ji, Y.m.; Wu, F. LLM: Learning Cross-Modality Person Re-Identification via Low-Rank Local Matching. IEEE Signal Process. Lett. 2021, 28, 1789–1793. [Google Scholar]
  31. Zhu, X.; Li, Z.; Lou, J.; Shen, Q. Video Super-Resolution Based on a Spatio-Temporal Matching Network. Pattern Recognit. 2020, 110, 107619. [Google Scholar]
  32. Zhu, X.; Li, Z.; Li, X.; Li, S.; Dai, F. Attention-aware Perceptual Enhancement Nets for Low-Resolution Image Classification. Inf. Sci. 2020, 515, 233–247. [Google Scholar]
  33. Bianco, V.; Mazzeo, P.L.; Paturzo, M.; Distante, C.; Ferraro, P. Deep learning assisted portable IR active imaging sensor spots and identifies live humans through fire. Opt. Lasers Eng. 2020, 124, 105818. [Google Scholar]
  34. Ye, M.; Chen, C.; Shen, J.; Shao, L. Dynamic Tri-Level Relation Mining with Attentive Graph for Visible Infrared Re-Identification. IEEE Trans. Inf. Forensics Secur. 2022, 17, 386–398. [Google Scholar]
  35. Zhao, J.; Wang, H.; Zhou, Y.; Yao, R.; Chen, S.; El Saddik, A. Spatial-Channel Enhanced Transformer for Visible-Infrared Person Re-Identification. IEEE Trans. Multimed. 2022, 1. [Google Scholar] [CrossRef]
  36. Hou, J.B.; Zhu, X.; Liu, C.; Yang, C.; Yin, X.C. Detecting Text in Scene and Traffic Guide Panels with Attention Anchor Mechanism. IEEE Trans. Intell. Transp. Syst. 2021, 22, 6890–6899. [Google Scholar]
  37. Ye, M.; Lan, X.; Leng, Q.; Shen, J. Cross-Modality Person Re-Identification via Modality-Aware Collaborative Ensemble Learning. IEEE Trans. Image Process. 2020, 29, 9387–9399. [Google Scholar]
  38. Hermans, A.; Beyer, L.; Leibe, B. In Defense of the Triplet Loss for Person Re-Identification. arXiv 2017, arXiv:1703.07737. [Google Scholar]
  39. Zheng, Z.; Zheng, L.; Yang, Y. Unlabeled Samples Generated by GAN Improve the Person Re-identification Baseline in Vitro. In Proceedings of the IEEE International Conference on Computer Vision, Venice, Italy, 22–29 October 2017; pp. 3774–3782. [Google Scholar]
  40. Paszke, A.; Gross, S.; Massa, F.; Lerer, A.; Bradbury, J.; Chanan, G. Pytorch: An imperative style, high-performance deep learning library. In Proceedings of the Annual Conference on Neural Information Processing Systems, Vancouver, BC, Canada, 8–14 December 2019; pp. 8024–8035. [Google Scholar]
  41. Russakovsky, O.; Deng, J.; Su, H.; Krause, J.; Satheesh, S.; Ma, S.; Huang, Z.; Karpathy, A.; Khosla, A.; Bernstein, M. ImageNet Large Scale Visual Recognition Challenge. Int. J. Comput. Vis. 2015, 115, 211–252. [Google Scholar]
  42. Krizhevsky, A.; Sutskever, I.; Hinton, G.E. Imagenet classification with deep convolutional neural networks. In Proceedings of the Annual Conference on Neural Information Processing Systems, South Lake Tahoe, NV, USA, 3–6 December 2012; pp. 1097–1105. [Google Scholar]
  43. Hao, Y.; Wang, N.; Li, J.; Gao, X. HSME: Hypersphere Manifold Embedding for Visible Thermal Person Re-Identification. In Proceedings of the AAAI Conference on Artificial Intelligence, Honolulu, HI, USA, 27 January–1 February 2019; pp. 8385–8392. [Google Scholar]
  44. Feng, Z.; Lai, J.; Xie, X. Learning Modality-Specific Representations for Visible-Infrared Person Re-Identification. IEEE Trans. Image Process. 2020, 29, 579–590. [Google Scholar]
  45. Hu, W.; Liu, B.; Zeng, H.; Hu, H. Adversarial Decoupling and Modality-invariant Representation Learning for Visible-Infrared Person Re-identification. IEEE Trans. Circuits Syst. Video Technol. 2022, 32, 5095–5109. [Google Scholar] [CrossRef]
  46. Qiong, W.; Pingyang, D.; Jie, C.; Chia-Wei, L.; Yongjian, W.; Feiyue, H.; Bineng, Z.; Rongrong, J. Discover Cross-Modality Nuances for Visible-Infrared Person Re-Identification. In Proceedings of the IEEE Conference on Computer Vision and Pattern Recognition, Nashville, TN, USA, 20–25 June 2021; pp. 4328–4337. [Google Scholar]
Figure 1. The schematic diagram of visible-infrared person re-identification.
Applsci 12 08792 g001
Figure 2. The overall framework of visible-infrared person re-identification.
Applsci 12 08792 g002
Figure 3. The CMC curves in different MMFSD’s weights (i.e., λ in Equation (9)) on SYSU-MM01 dataset of (a) all-search mode and (b) indoor-search mode.
Applsci 12 08792 g003
Figure 4. The CMC curves in different MMFSD’s weights (i.e., λ in Equation (9)) on RegDB dataset of (a) visible-to-infrared retrieval and (b) infrared-to-visible retrieval.
Applsci 12 08792 g004
Table 1. The performance comparison on the SYSU-MM01 dataset.
MethodAll-Search ModeIndoor-Search ModeReference
Rank1 (%)mAP (%)Rank1 (%)mAP (%)
BDTR [3]17.0119.66N/AN/AIJCAI 2018
cmGAN [6]26.9727.8031.6342.19IJCAI 2018
D-HSME [43]20.6823.12N/AN/AAAAI 2019
D 2 RL [27]28.929.2N/AN/ACVPR 2019
AlignGAN [28]42.440.745.954.3ICCV 2019
eBDTR [13]27.8228.42N/AN/ATIFS 2020
CE 2 L [4]29.5228.4N/AN/AICPR 2020
Hi-CMD [25]34.935.9N/AN/ACVPR 2020
DGD+MSR [44]37.3538.1139.6450.88TIP 2020
JSIA-ReID [23]38.136.943.852.9AAAI 2020
MSPAC-MeCen [18]46.6247.2651.6361.54ICPR 2020
X modality [20]49.9250.73N/AN/AAAAI 2020
MACE [37]51.6450.1157.3564.79TIP 2020
LAND [14]53.652.057.063.2IOT 2020
DDAG [1]54.7553.0261.0268.0ECCV 2020
FBP-AL [17]43.7842.91N/AN/ATNNLS 2021
AGW [12]47.5047.6554.1762.97TPAMI 2021
LLM [30]55.2552.9659.6565.46SPL 2021
ADCNet [24]55.959.658.865.6ICME 2021
DMiR [45]50.5449.2953.9262.49TCSVT 2022
GECNet [22]53.3751.8360.6062.89TCSVT 2022
DFLN-ViT [35]59.8457.7062.1369.03TMM 2022
MMFSD60.6457.5462.9369.27Ours
Table 2. The performance comparison on RegDB dataset.
MethodVisible-to-Infrared RetrievalInfrared-to-Visible RetrievalReference
Rank1 (%)mAP (%)Rank1 (%)mAP (%)
BDTR [3]33.4731.83N/AN/AIJCAI 2018
D 2 RL [27]43.344.1N/AN/ACVPR 2019
D-HSME [43]50.8547.0050.1546.16AAAI 2019
AlignGAN [28]57.953.656.353.4ICCV 2019
eBDTR [13]31.8333.18N/AN/ATIFS 2020
CE 2 L [4]47.5044.21N/AN/AICPR 2020
DGD+MSR [44]48.4348.67N/AN/ATIP 2020
JSIA-ReID [23]48.549.348.148.9AAAI 2020
MSPAC-MeCen [18]49.6153.64N/AN/AICPR 2020
X modality [20]62.2160.18N/AN/AAAAI 2020
DDAG [1]69.3463.4668.0661.80ECCV 2020
Hi-CMD [25]70.9366.04N/AN/ACVPR 2020
cm-SSFT [15]72.372.971.071.7CVPR 2020
MACE [37]72.3769.0972.1268.57TIP 2020
LADN [14]75.772.975.373.0IoT 2020
AGW [12]70.0566.37N/AN/ATPAMI 2021
ADCNet [24]72.966.572.465.3ICME 2021
FBP-AL [17]73.9868.2470.0566.61TNNLS 2021
LLM [30]74.8571.32N/AN/ASPL 2021
SFANet [19]76.3168.0070.1563.77TNNLS 2021
GECNet [22]82.3378.4578.9375.58TCSVT 2021
MPANet [46]83.780.982.880.7CVPR 2021
MSA [21]84.8682.16N/AN/AIJCAI 2021
HC-Triplet [5]91.0583.2889.3081.46TMM 2021
GLMC [16]91.8481.4291.1281.06TNNLS 2021
DMiR [45]75.7969.9773.9368.22TCSVT 2022
DTRM [34]79.0970.0978.0269.56TIFS 2022
DFLN-ViT [35]92.1082.1191.2181.62TMM 2022
MMFSD92.1985.9590.6584.38Ours
Table 3. The performance comparison of using different weights of MMFSD loss function (i.e., λ in Equation (9)) on the SYSU-MM01 dataset.
λ All SearchIndoor Search
Rank1 (%)mAP (%)mINP (%)Rank1 (%)mAP (%)mINP (%)
056.0454.7141.9659.9567.2363.35
0.2560.6457.5443.3162.9369.2764.89
0.557.9654.6440.1561.8767.6662.82
159.5255.9741.3163.0069.0864.32
255.2751.4235.6654.2161.9257.09
Table 4. The performance comparison of using different weights of MMFSD loss function (i.e., λ in Equation (9)) on the RegDB dataset.
λ Visible to InfraredInfrared to Visible
Rank1 (%)mAP (%)mINP (%)Rank1 (%)mAP (%)mINP (%)
085.1280.4468.6784.2279.1665.75
0.2590.9485.2573.2689.8183.7269.58
0.592.1985.9573.8690.6584.3870.73
190.1881.4965.4688.2779.2361.65
288.0279.7163.9786.4578.4861.48
Publisher’s Note: MDPI stays neutral with regard to jurisdictional claims in published maps and institutional affiliations.

