Article

Contamination Assessment and Chemical Speciation of Lead in Soils and Sediments: A Case Study in Aguascalientes, México

by
Roberto Macías
1,
Magdalena Samanta Ramos
1,
Alma Lilian Guerrero
1,
María Guadalupe Farfán
1,
Kerry Mitchell
2 and
Francisco Javier Avelar
1,*
1
Centro de Ciencias Básicas, Universidad Autónoma de Aguascalientes, Avenida Universidad #940, Aguascalientes 20100, Mexico
2
Department of Public Health and Preventive Medicine, St. George’s University, True Blue, St. George’s P.O. Box 7, Grenada
*
Author to whom correspondence should be addressed.
Appl. Sci. 2022, 12(17), 8592; https://doi.org/10.3390/app12178592
Submission received: 1 August 2022 / Revised: 21 August 2022 / Accepted: 24 August 2022 / Published: 27 August 2022
(This article belongs to the Special Issue Heavy Metal Toxicity: Environmental and Human Health Risk Assessment)

Abstract

:
Lead (Pb) contamination was evaluated in 24 contaminated soils and sediments samples, representative of areas affected by mining, agricultural, commercial and residential activity, during the rainy and dry season. Pseudo-total concentration in soils (15.7–527.2 mg kg−1) and sediments (16.3–4273.3 mg kg−1) was determined and protocols were developed to analyze its chemical form, potential mobility and bioavailability. Five geochemical phases (exchangeable fraction, carbonate fraction, Fe/Mn oxide fraction, organic fraction and residual fraction) were obtained for the determination of Pb speciation and mobility using a modified Tessier sequential extraction procedure. The predominant fraction was the Fe/Mn oxide bound (both for soils and for sediments). However, their calculated mobility factors were 26% and 28%, respectively, representing significant risk to the environment. Geo accumulation values ranged from −0.7 to 4.4 (“Unpolluted”–“Highly to extremely polluted”) for soils and from −0.6 to 7.4 (“Unpolluted”–“Extremely polluted”) for sediments, suggesting the influence of human activity on the environment, mainly at sites located in the vicinity of the mine. Enrichment Factor values ranged from 2.1 to 87.8 for soils and from 2.5 to 698.7 for sediments (“Moderated enrichment”–“Extremely high enrichment”); values above 1.5 suggesting anthropogenic origin, thus representing a risk for biological organisms present in freshwater. In summary, these environmental indicators demonstrated than even in sites with low Pb concentration, contamination was observed, thus highlighting the need for continued monitoring due to the potential for significant public health risks.

1. Introduction

Heavy metals are considered serious inorganic pollutants due to their toxic effects and ability to accumulate in the environment [1]. Metals are non degradable and, therefore, remain indefinitely in aquatic and terrestrial environments. They can leach through soils eventually affecting groundwater or taken up by plants, including agricultural crops [2]. Lead (Pb), one of the most toxic and hazardous elements to human health [3], is ranked second on the 2017 Agency for Toxic Substances and Disease Registry (ATSDR) Substances Priority List [4]. Pb has deleterious effects on the nervous and cardiovascular systems, with its target organs being the brain and kidneys. Lead has been shown to restrict intelligent quotient (IQ) development [5], and is listed as a group 2A carcinogen by the International Agency for Research on Cancer (IARC) [6].
The impact produced by human activities result in the alteration of the natural balance of the system [7]. Mining is one of the most significant contributors of pollution in the environment by metals and metalloids [8]. Numerous studies have demonstrated that in many countries, areas surrounding mines are marked by significant soil and sediment pollution. For example, Makombe & Gwisai, found that mining soils in Zimbabwe had high concentrations of Pb (170.3 mg kg−1) [9]; Tong et al. found that due to an average concentration value of 596.13 mg kg−1, Pb should be controlled preferentially over Arsenic and Mercury in China’s mining areas [10]. Similarly, in the Republic of Kosovo, the average concentration of Pb in the surface soils in mining and smelting areas was 450 mg kg–1 [11]. In Aguascalientes, Mexico, Guzmán et al. analyzed sediments from the San Pedro River and found a mean of 20.8 mg kg−1 [12]. However, Mitchell et al. analyzed soils and sediments from the mining areas around the Piedras Negras River, our study area, and found mean concentrations of 434.7 and 2200.8 mg kg−1 respectively [13].
The mobility and bioavailability of heavy metals in the environment depends not only on their total concentration, but also on their association with the solid phase to which they are bound [14].
Speciation, a word borrowed from the biological sciences, has become a concept in analytical chemistry, expressing the idea that the specific chemical forms of an element should be considered individually [15]. When elemental speciation is not feasible, the term fractionation is in use, being defined as follows: process of classification of an analyte or a group of analytes from a certain sample according to physical (e.g., size, solubility) or chemical (e.g., bonding, reactivity) properties [15]. Sequential extraction methods are frequently used to assess operationally defined pools of trace elements, characterizing their lability on the basis of the dissolution behavior of the target binding phases in soils and sediments [16], show the potential risk of mobilization of metals in particulate phases [17]. According to the literature, the procedure by Tessier et al. [18] can be used on a broad array of soil types provided the metals tested are Cd, Co, Cu, Ni, Pb, Zn, Fe, and Mn. This is probably why the Tessier procedure is the most used method to date [19]. Moreover, the overall extraction efficiency of the Tessier scheme is much higher for Pb compared to the Community Bureau of Reference (BCR) scheme [20]. However, there are some disadvantages of Tessier method. Notably, it does not discriminate between metals associated with amorphous Fe and Mn oxides and those associated with crystalline oxides of Fe [21] and the lack of reference material hinders the comparison and validation of the procedure [21,22]. However, the Tessier scheme is generally accepted as the most commonly used protocol followed closely by BCR [19]. On the other hand, many studies of soils and sediments try to relate the results of sequential fractionation procedures to bioavailability measurements [23].
Thus, the aim of the present study is to determine (1) the concentration and the geochemical distribution of Pb; (2) variations in accumulation between the dry and rainy season; and (3) the impact of anthropogenic activities on the concentration of Pb in soils and sediments. These results, along with others previously reported, will be used to create baseline parameters for continuous monitoring in the region.

2. Materials and Methods

2.1. Study Area

The study area started in the northeast, at the Piedras Negras River (22°14′ N, 102°06′ W) municipality of Asientos; continued along the Zarco, Chicalote y San Pedro Rivers (the latter being the main water tributary of the State) and ended in the south, at the Niagara Reservoir (21°47′ N, 102°22′ W) in the municipality of Aguascalientes in the State of Aguascalientes, Mexico (Figure 1). These sample points were selected because there are a history of studies carried out in this area [12,13].
The State of Aguascalientes has a semi-arid climate with a mean annual temperature of 17.4 °C and a mean annual precipitation of 526 mm [24]. The study started in the municipality of Asientos, location of the state’s only mining district, “Tepezalá—Asientos”. Since 1548, mining in this area has focused on the extraction of gold, silver, lead, copper and zinc. There are two active mines on the site: “Santa Francisca” and “El Porvenir”, the mineral extraction is conducted through flotation and leaching processes respectively. Residues from the mineral processing plants are accumulated at a tailings dam near the mining operation [24].

2.2. Soil and Sediment Sampling

Twenty-four sites were sampled during April–May (dry season) and October (rainy season) during 2015 and 2016, where 1 kg of composite soils and surface stream sediments was obtained after quartering and homogenization of four cross sectional sub-samples (at a depth of 10 cm), following the guidelines established in USEPA sampling protocols and Mexican Regulation NMX-AA-132-SCFI-2006 [25,26]. Samples were stored in labelled polypropylene bags and refrigerated at 4 °C. Before physicochemical analysis, samples were first homogenized, dried (60 °C), sieved (<0.5 mm).
After the analysis of pseudo-total concentration of Pb, the eight sites with the highest concentration of Pb were selected for further analysis (Table 1). The longitudes and latitudes of sampling sites were measured by using Magellan Systems GPS apparatus (S/N 0038549).

2.3. Physicochemical Parameters

Physical and chemical properties of soils and sediments samples were determined using standard methods, including pH, electrical conductivity (EC), redox potential (Eh), organic matter (OM), cation exchange capacity (CEC), and carbonates (CO32− and HCO31−).
A liquid extract obtained after shaking samples in distilled water for 48 h at 60 rpm in a soil/solution ratio of 1:10 w/v [29,30,31,32] was used in the potentiometric determination of electrical conductivity, redox potential and pH, according to the Mexican Standard NOM-021-SEMARNAT-2000. Organic matter (Walkley–Black method), carbonate and bicarbonate (titrimetric method), and cation exchange capacity (sodium acetate method) were also determined [33,34].

2.4. Sample Preparation and Analysis of Metal

2.4.1. Pseudo-Total Concentration

For the determination of the pseudo-total concentration of lead in soils and sediments, the aqua regia extraction method ISO–11466 [35] was used; where approximately 0.5 g of substrate was accurately weighed and placed in a 250 mL Erlenmeyer flask, then pre-digested at room temperature for 24 h in 15 mL of aqua regia solution. The suspension was then digested on a conventional hot plate with occasional stirring for 2.5 h at 90 ± 5 °C without boiling. The obtained suspension was cooled until room temperature, filtered (2 μm) and diluted then measured.

2.4.2. Speciation Analysis

Metal speciation was determined using the Tessier et al. [18] modified Sequential Extraction Procedure (SEP) (Table 2), to operationally quantify the partitioning of metals in different geochemical fractions [36]. Approximately 1 g representative dry sample was weighed; and between each successive extraction the supernatant was separated by centrifugation (Hettich, Model 320) for 15 min at 5000 rpm, to minimize loss of solid material.

2.4.3. Leaching Test

Finally, the protocol from the Standards, Measuring and Testing (SMT) program [37] was followed for the 0.01 mol L−1 CaCl2 leaching test.

2.4.4. Metal Quantification

Quantification of Pb was performed using flame atomic absorption spectrophotometry (FAAS) (Perkin Elmer Mod. PinAAcle 900H) according to the USEPA method 7000B [38]. Quantification of Pb was based on aqueous standard calibration curves, within the range 1–10 mg L−1. The Limit of Detection (LOD) was defined as three times the standard deviation of three measurements of the blank, divided by the slope of the calibration curve. The LOD for a solution and substrate sample were 0.005 mg L−1 (5.2 µg L−1) and 0.23 mg kg−1, respectively.

2.5. Quality Control

For internal quality assurance, standard reference material (SRM) “Montana Soil 2710″, “San Joaquin Soil 2709″ and “Buffalo River Sediment 8704″ of National Institute of Standards & Technology (NIST) were processed and analyzed under the same conditions used for samples. The data of the analysis of SRM as listed in Table 3.
Pseudo-total concentration of Pb was conducted using the quality controls established by the Standard Methods (3020B) of APHA-AWWA-WPCF [39], including blank, fortified and duplicates. The samples used for the determination of metal concentration in the geochemical fraction extracts was determined by triplicate.
Descriptive statistical tests, including average, standard deviation and relative standard deviation (RSD) were applied to obtained data. The chosen significance level was α = 0.05 (equivalent to 5%). All analyses were performed with the statistical package MINITAB v.15.

2.6. Environmental Indicators

2.6.1. Mobility Factor

The mobility factor describes the potential movement of the metal out of the contaminating medium [40]. It is assessed on the basis of absolute and relative contents of the fractions weakly bound to substrates components [41].
MF = F 1 +   F 2   F 1 +   F 2 +   F 3 +   F 4 +   F 5   × 100

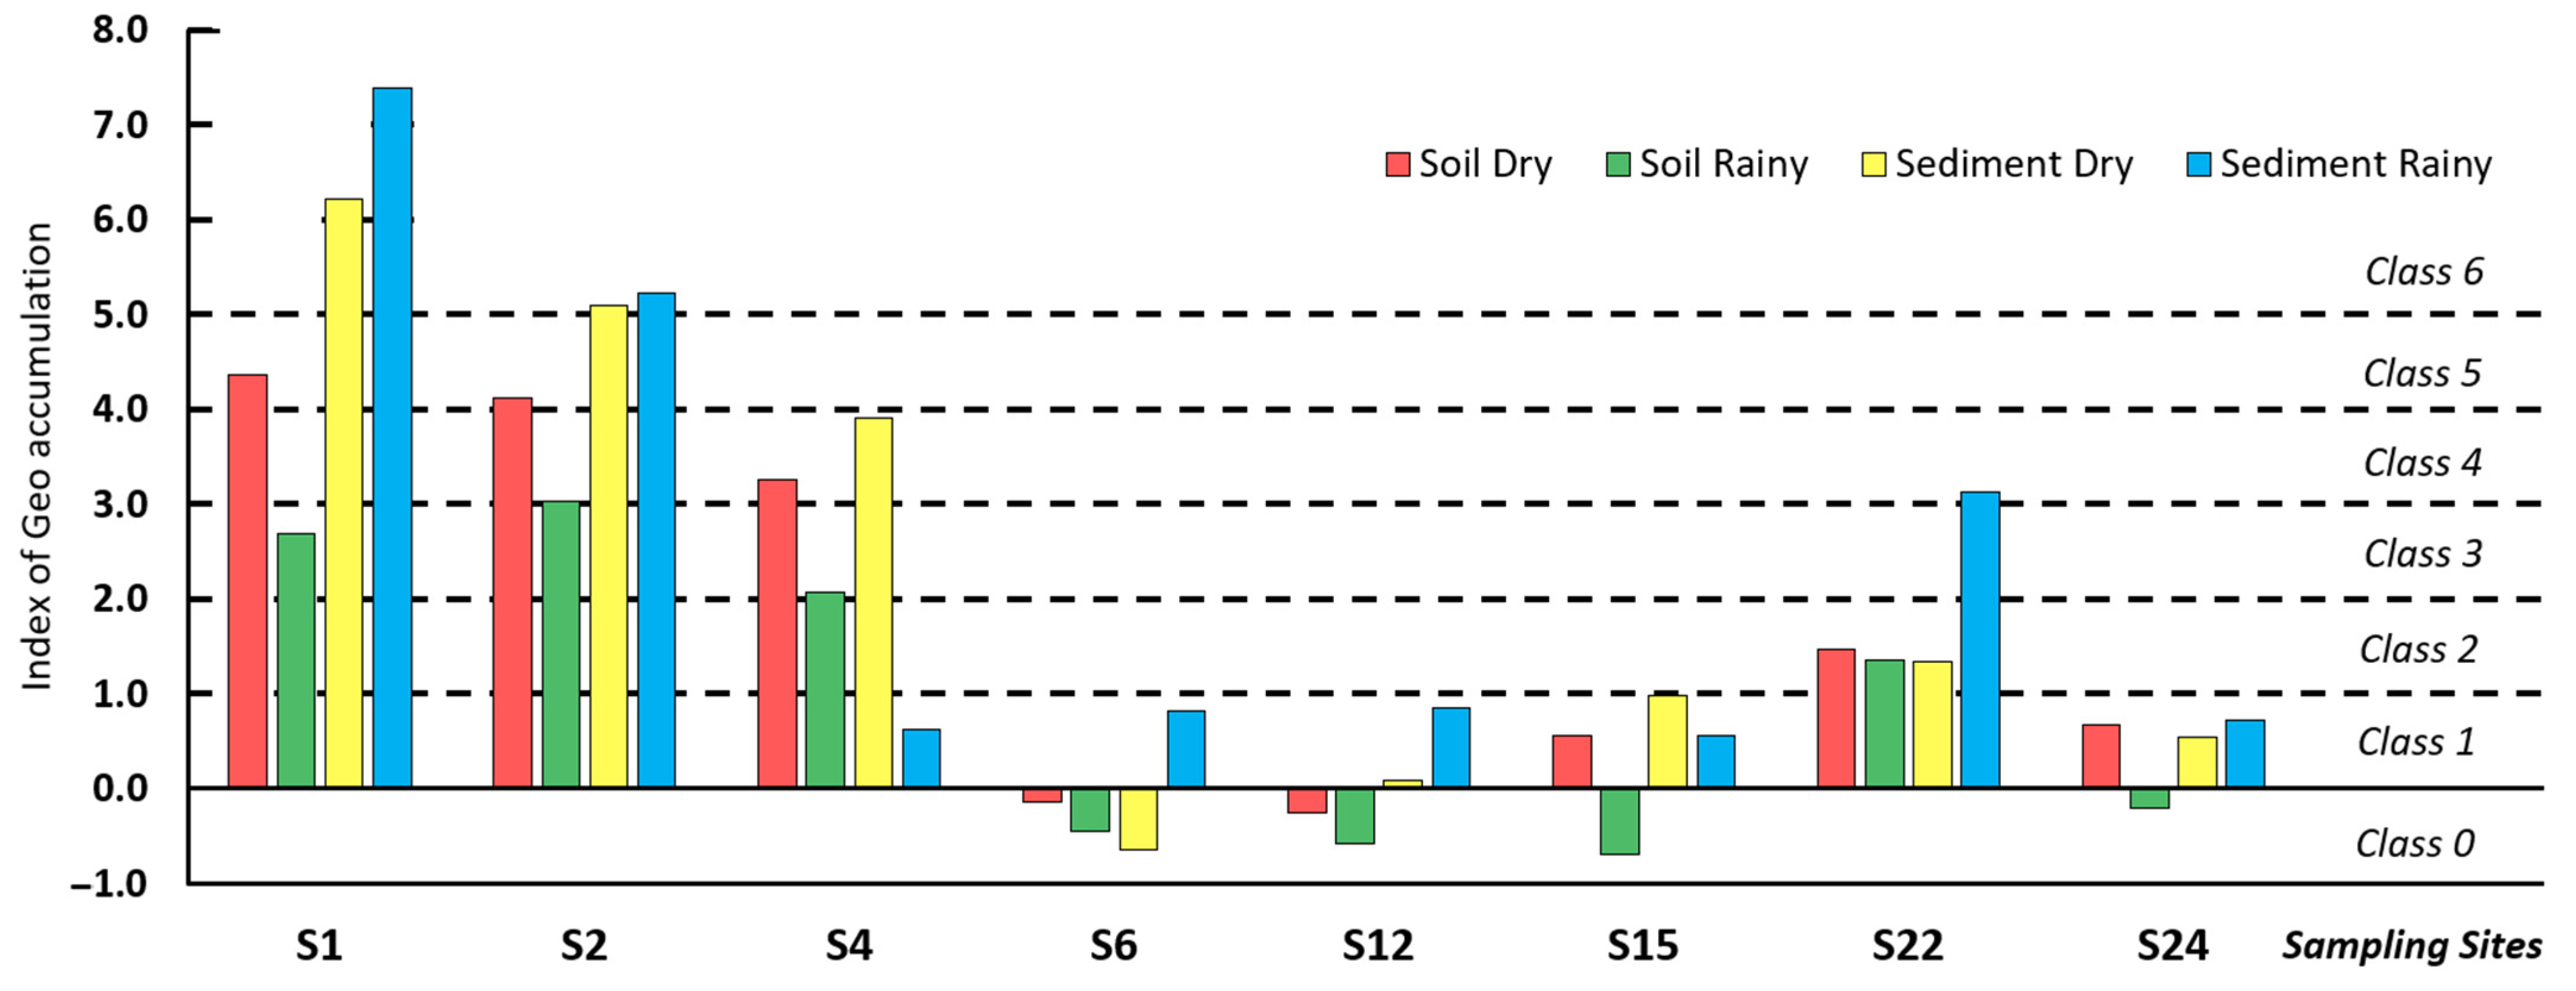
2.6.2. Geo Accumulation Index

Additionally, to determine natural and anthropogenic contribution to the studied soils and sediments, the Geo accumulation Index (Igeo) described by Müller [42] was calculated with the equation:
I geo =   log 2 ( C n 1.5   B n )
where C n is the concentration of the metal in sample, B n is the geochemical background value of metal, Upper Continental Crust values were considered [43], the constant 1.5 compensates for fluctuations of natural and minor anthropogenic origin. The calculated result is compared to the seven classes (Table 4) proposed by Müller [42].

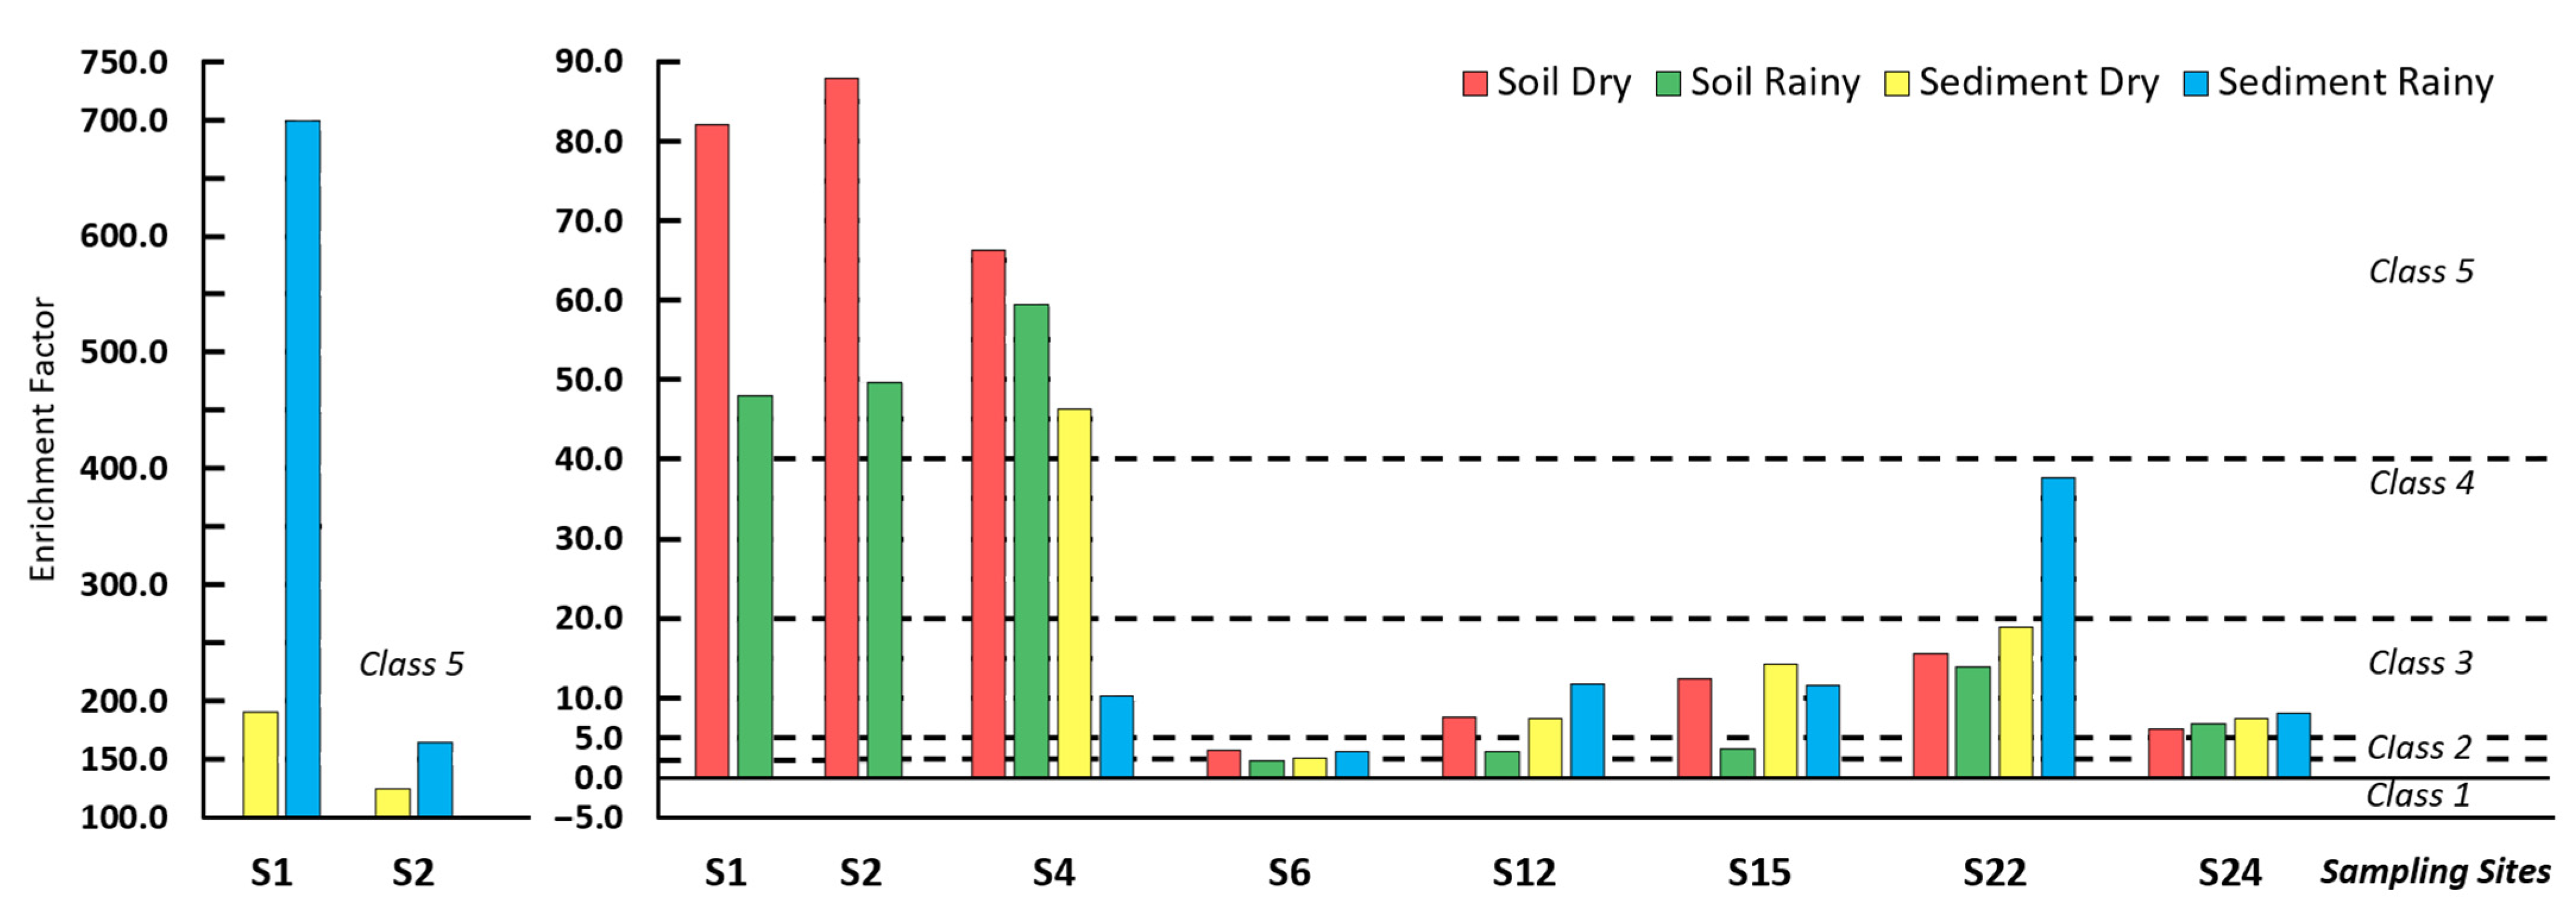
2.6.3. Enrichment Factor

In the same way, the Enrichment Factor (EF) was calculated to determine the contribution of anthropogenic sources of chemical elements using the following generalized equation [44]:
EF = ( Pb Sample / Al Sample ) / ( Pb Crust / Al Crust )
where the subscripts “sample” or “crust” indicate which medium concentration refers to. Upper Continental Crust values were considered [43], concentration of lead and aluminum was indicated as mg kg−1. Aluminum, the most common reference value used to calculate the EF, was selected to be the normalizing element [45,46]. Based on EF, five categories were recognized (Table 5) [44].

3. Results and Discussion

3.1. Physicochemical Characteristics

Physicochemical characteristics related to the mobility of lead in the sampled agricultural, industrial and urban soils and sediments are shown in Table 6. A range of pH from 5.38 to 8.47 with a mean of 7.21; and from 6.73 to 8.22 with a mean of 7.39 was observed in soils and sediments, respectively. According to the Mexican Standard NOM-021, this indicates that the soils were weakly acid or weakly alkaline and sediments were neutral or weakly alkaline. A mean EC of 426.7 µS cm−1 was measured in soils, with no single sample exceeding 1000 µS cm−1, thus suggesting negligible effects of salinity. The mean of EC measured in sediment was 716.5 µS cm−1. It is noteworthy that sample S15 slightly exceeded the 1000 µS cm−1 in both seasons, probably due to industrial discharges into the river, thus classifying it as slightly saline. Sample S1 exceeded 2000 µS cm−1 in rainy season, probably due to mining waste runoff, thus classifying it as moderately saline. Eh varied between 106.5 and 484.5 mV, suggesting the prevalence of oxidizing conditions (aerobic zone). Organic matter content ranged from 0.13 to 18.72%, according to the scale used in the NOM-021. This categorized soils as having medium organic matter content (between 1.6 and 3.5%), and the sediments, high organic matter content (between 3.6 and 6.0%). The CEC ranged from 16.69 to 389.78 cmolc kg−1 with a mean of 155.78 for soils and ranged from 11.09 to 492.96 with a mean of 131.73 cmolc kg–1 for sediments, indicating a wide heterogeneity of the sites. Ranges of 489.2–1585.5 and 670.7–1625.3 mg kg−1 of CO32− content were observed in the soils and sediments respectively; with bicarbonate being the only chemical specie detected.
The values for pH, EC, Eh, OM, and CO32− showed no statistically significant differences (p < 0.05) between dry season and rainy season; only CEC showed statistically significant differences between seasons, probably due to the effect of rainwater on the solubility of chemical compounds present in soils and sediments; the p-values are shown in Table 6.

3.2. Metal Analysis

Pseudo-total metal concentrations (Table 7) of Pb showed no statistically significant differences (p < 0.05) between dry season and rainy season, both for soil and for sediment. However, a decrease in total Pb concentration in soils during the dry season compared to rainy season was observed. Additionally, there were variations in the pseudo-total concentration of Pb in sediments, with an increase in Pb concentration in sample S1 during the rainy season, probably due to the effect of runoff from mining activity; Mitchell et al. observed a similar phenomenon in sediments from the area nearest to the mine [13]. Decreased Pb concentration were observed in sample S4 during the rainy season, attributable in part, to the dilution effect of the reservoir. Sample S22 also showed an increase in lead concentration during the rainy season, triple that of the concentration in dry season, it is important to note that this point is within the City of Aguascalientes; thus, the increase is possibly due to surface runoff that includes urban waste generated in the city. However, the Niagara reservoir (S24) showed little variation in concentration between seasons, explained in part by the negligible fluctuation in the volume of water between seasons. The Table 8 shows the pseudo-total concentration order of metal by substrate/season.
The values obtained in this study were compared with guidelines adopted by Canada [47,48] due to the absence of local reference values. We compared our results with Soil Quality Guidelines (Agricultural = 70 mg kg−1, Residential = 140 mg kg−1, Commercial = 260 mg kg−1 and Industrial = 600 mg kg−1) and found that the values of S1 and S4 were up to seven times higher than the Quality Guidelines (QG) for agricultural zone; S2 was three times greater than QG for residential zone; the rest of the sites are below the QG. Similarly, we used the Sediment Quality Guidelines, Threshold Effect Level (TEL) and Probable Effect Level (PEL) in Freshwater Sediment to obtain preliminary data on metal concentration in surface sediments. TEL values represent the concentration of a chemical below which adverse effects are expected to occur rarely and PEL values represent the concentration of a chemical, above which adverse biological effects are expected to occur frequently [49]. The results showed that Pb concentration of surface sediments in all of sites were above the TEL value of 35.0 mg kg−1, except in two cases (S6 and S12, both in dry season). When compared to the PEL value of 91.3 mg kg−1, the S1 and S2 sites were found 46 and 10 times higher than QG, respectively; the site S4 in dry season and S22 in rainy season also showed higher values than the reference.
Leaching tests, fast preliminary screenings to evaluate a potential toxicity of metal [50,51], showed that sediment samples from S1, S2 in rainy season and S4 in dry season leached the highest concentrations (20.24, 15.18 and 17.12 mg kg−1, respectively). Taking into account the weak ionic strength of CaCl2 0.01M, these results suggest a significant amount of potentially mobile Pb, and an increased risk for the environment. Statistical analysis did not demonstrate a correlation between this mobility and any physiochemical variable (p < 0.05), indicating the significant geochemical complexity of the sample and the need to further investigate the chemical composition of the sample [52].
Sequential extraction was conducted in order to assess the metal fractionation and the relative lability of metal in the soil and sediment samples. As shown by the partition scheme according to site and season in Table 7, the highest percentage of Pb in soils was found bound to the Fe/Mn oxide fraction (mean 28.0%) followed by residual > organic matter > exchangeable > carbonate; Ogurindiran and Osibanjo found that the Fe/Mn oxide fraction was the highest also in soils impacted by hazardous waste [40]. For sediments, the order of average percentage was bound to the Fe/Mn oxide (25.4%) > residual > organic matter > carbonate > exchangeable fraction. However, an association of Pb to this and the organic matter bound fractions may potentially remobilized during changes in the physicochemical conditions of the substrates [41]. No significant relationships were found between seasons. Several researchers have found that Pb was highly associated with the Fe/Mn oxide fraction in mining areas. For example, Prathumratan et al. found that seven mining soils in Europe were associated with Fe/Mn oxide fraction (37.75–71.61%) [53]; Moore et al. found that 61.99% of soil is on the Fe/Mn oxide fraction [54] and Martínez et al. observed that the Fe/Mn oxide fraction was also the highest percentage in sediment [17]. In the area evaluated in this study, Mitchell et al. found that the residual fraction showed the highest percentage (30.2%) followed by Fe/Mn fraction (22.4%) in soil, and the carbonate fraction showed the highest percentage (34.1%) followed by Fe/Mn fraction (30.0%) in sediments [13].
The percentage of Pb in the exchangeable fraction (F1), for the majority of soils and sediments, was relatively high for S6, S12, S15, S22, and S24 (Table 7). This apparent low adsorption suggests greater anthropogenic contamination. Notably, during the rainy season, 53.7% of the Pb in sediment sample S1 was principally associated with the carbonate fraction (F2), this has a particular interest due to present at this site like a potential hazard to human health, environment and living organisms. These fractions (F1 and F2) are presumably the most mobile and bioavailable fractions [55], representing the greatest risk to human health, living organisms and the environment. However, it is important to note that the potential environmental impact is highly dependent on the pseudo-total concentration of the metal; comparing S1 with S15 (both for sediment samples obtained during the dry season), samples with similar percentages associated with these mobile fractions (20.90% and 22.78%, respectively), very distinct concentrations are observed. S1 with a concentration of 395.6 mg kg−1, suggesting fresh discharge, is 35 times higher than the concentration at S15 (see latter column in Table 7), and, thus, likely to have a higher impact and represent an increased environmental risk for the ecosystem [56].

3.3. Environmental Indicators

The Mobility Factor (MF), Geo accumulation Index (Igeo) and Enrichment Factor (EF) were used to assess and quantify pollution levels on the substrates of the study area. The mobility factors are presented at the end of Table 7, varying from 8.74 to 46.13% with a mean of 26.67%, and from 14.01 to 55.75% with a mean of 28.48% for soils and sediments, respectively. Sites S1 and S2 had the lowest mobility factors observed in the dry period, whereas site S12 presented the highest values for both rainy and dry season for soil. In sediment samples, the lowest value was obtained in sample S22 and the highest value in S1, both obtained during the rainy season. The MF high value of S1 is consistent with the high value of the carbonates bound fraction. Overall, the mobility factors for Pb exceeded 20% (62.5% for soil and 93.7% for sediment), thus representing significant bioavailability for living organisms and a potential threat to the environment [40,41].
The Igeo has been widely employed to assess environmental contamination by comparing differences between current and preindustrial concentration in soils and sediments samples [57,58]; Figure 2 shows the Igeo values of Pb at each sampling site vary in a wide range, with at least one sample in each class, from “unpolluted” (class 0) to “extremely polluted” (class 6). However, a reduction in the content of Pb can be observed with increasing distance from the mine, with a subsequent increase at point S22 (City of Aguascalientes) that was classified as “moderately polluted” to “highly polluted”. S4 showed similar indices from “unpolluted to moderately polluted” to “highly polluted”; S1 and S2 (sites nearest to mining activity) with significantly higher indices than in other sites, from “moderately polluted to highly polluted” (class 3) to “extremely polluted” (class 6). Sediment samples at these sites were classified as “extremely polluted” (class 6) making the influence of mining activity on the environment evident. The highest-class level (class 6) reflects an enrichment of almost 100-fold when compared with the background level [59].
The EF values of Pb in soil and sediment samples are shown in Figure 3. Aluminum, the most common reference value used to calculate the EF, was selected to be the normalizing element [45,46], with the values for the samples provided in Table A1 (Appendix A). EF has been widely used to quantify the degree of metal enrichment or contamination in soils and sediments samples due to human activity [60,61,62]. As was the case in the Igeo analysis, sites S1 and S2 were categorized as having “extremely high enrichment”, for both soils and sediments. With the exception of sediment samples obtained during the rainy season, site S4 also represented “extremely high enrichment”; the low value for S4 to sediment in rainy season is due to the increase in the volume of the reservoir, confirming with the pseudo-total concentration of Pb for that sample (see Table 7). S6 for soil and sediment during all seasons and as S12 and S15 for soil during the rainy season showed the lowest EF values, classed as “moderated enrichment”. The rest of the samples were categorized as having “significant enrichment” (Class 3) or higher. It’s important to note that values above 1.5 suggest anthropogenic origin [60,61,62].

4. Conclusions

A variety of assessment tools, methods, and indices were used to evaluate lead contamination in soils and sediments in Aguascalientes, México. The results of this study indicate that soils and sediments are contaminated with Pb. Soils and sediments nearest to mining activity presented the highest geo accumulation index and metal enrichment factors. Tessier’s sequential extraction scheme confirmed high potential Pb mobility, exceeding 26% for soil and 28% for sediment, suggesting an anthropogenic origin and representing a significant risk to the ecosystem. The predominant fraction was Fe/Mn oxide bound, both for soil and for sediment samples. The Tessier method was useful in determining that the possible bioavailability of Pb is related to its chemical forms rather than its pseudo-total concentration. The results (concentrations and environmental indicators) suggested that the study zone should be given priority for effective waste management purposes to sustain the ecological integrity.
The information generated in this study is useful for establishing Pb reference levels for soil and sediment in the state of Aguascalientes, México. The obtained information will help the regional and federal authorities cope with the current environmental regulations and may be useful in planning remediation activities.
Future studies are needed to assess the pollution at the affected sites fully. These studies should include an increased number of sample points, multivariate analyses, and spatial distribution mapping for a more comprehensive contamination assessment. Additional chemical analyses should include the discrimination of metals associated with amorphous and crystalline Fe and Mn oxides to provide a clearer picture of the metal-substrate stability.

Author Contributions

Conceptualization, R.M., M.S.R. and M.G.F.; Formal analysis, R.M.; Funding acquisition, F.J.A.; Investigation, R.M.; Methodology, R.M. and M.S.R.; Project administration, R.M. and F.J.A.; Resources, M.S.R. and F.J.A.; Supervision, M.S.R., A.L.G. and F.J.A.; Validation, R.M. and M.G.F.; Visualization, R.M., M.G.F., K.M. and F.J.A.; Writing—Original Draft, R.M. and M.G.F.; Writing—Review and Editing, A.L.G., K.M. and F.J.A. All authors have read and agreed to the published version of the manuscript.

Funding

This research received no external funding and was conducted on the financial means of the doctoral program of Universidad Autónoma de Aguascalientes.

Institutional Review Board Statement

Not applicable.

Informed Consent Statement

Not applicable.

Data Availability Statement

The data presented in this study are available on request from the corresponding author.

Acknowledgments

We gratefully acknowledge the support of the National Council of Science and Technology (Consejo Nacional de Ciencia y Tecnología), México by means of the research scholarship # 651043 used for this study. The authors thank Laura Yamamoto from the Universidad Autónoma de Aguascalientes for technical assistance and Roberto Rico for his suggestions that led to an improved manuscript.

Conflicts of Interest

The authors declare no conflict of interest.

Appendix A

Table A1. Pseudo-total Concentration of Al (%).
SiteSoilSediment
DryRainyDryRainy
S13.01.64.72.9
S22.42.03.32.8
S41.70.93.91.8
S63.24.33.16.5
S121.32.51.71.9
S151.42.11.71.5
S222.12.21.62.8
S243.21.52.42.5
Al crust = 8.04% [43].

References

  1. Naji, A.; Ismail, A.; Ismail, A.R. Chemical speciation and contamination assessment of Zn and Cd by sequential extraction in surface sediment of Klang River, Malaysia. Microchem. J. 2010, 95, 285–292. [Google Scholar] [CrossRef]
  2. Boularbah, A.; Schwartz, C.; Bitton, G.; Aboudrar, W.; Ouhammou, A.; Morel, J.L. Heavy metal contamination from mining sites in South Morocco: 2. Assessment of metal accumulation and toxicity in plants. Chemosphere 2006, 63, 811–817. [Google Scholar] [CrossRef] [PubMed]
  3. Sohrabi, M.R.; Matbouie, Z.; Asgharinezhad, A.A.; Dehghani, A. Solid phase extraction of Cd(II) and Pb(II) using a magnetic metal-organic framework, and their determination by FAAS. Microchim. Acta 2013, 180, 589–597. [Google Scholar] [CrossRef]
  4. ATSDR (Agency for Toxic Substances and Disease Registry). Substances Priority List. Atlanta: Division of Toxicology and Human Health Sciences. 2017. Available online: https://www.atsdr.cdc.gov/spl/ (accessed on 4 September 2017).
  5. Ahmed Abd El Razek, A. The mobility and speciation of lead and cadmium in Bahr El Baqar region. Egypt. J. Environ. Chem. Eng. 2014, 2, 685–691. [Google Scholar] [CrossRef]
  6. IARC (International Agency for Research on Cancer). IARC Monographs on the Evaluation of Carcinogenic Risks to Humans; Inorganic and Organic Lead Compounds; World Health Organization: Geneva, Switzerland; International Agency for Research on Cancer: Lyon, France, 2006; Volume 87. [Google Scholar]
  7. Rendina, A.; De Cabo, L.; Arreghini, S.; Bargiela, M.; De Iorio, A.F. Geochemical distribution and mobility factors of Zn and Cu in sediments of the Reconquista River, Argentina. Rev. Int. Contam. Ambie. 2001, 17, 187–192. [Google Scholar]
  8. Pourret, O.; Lange, B.; Bonhoure, J.; Colinet, G.; Decrée, S.; Mahy, G.; Faucon, M.P. Assessment of soil metal distribution and environmental impact of mining in Katanga (Democratic Republic of Congo). Appl. Geochem. 2016, 64, 43–55. [Google Scholar] [CrossRef]
  9. Makombe, N.; Gwisai, R.D. Soil Remediation Practices for Hydrocarbon and Heavy Metal Reclamation in Mining Polluted Soils. Sci. World J. 2018, 2018, 1–7. [Google Scholar] [CrossRef]
  10. Tong, R.; Jia, Q.; Ma, X.; Fang, Y.; Wang, W. Comprehensive comparison of probabilistic health risks of soil heavy metals in China’s mining areas. Hum. Ecol. Risk Assess. 2020, 26, 2059–2077. [Google Scholar] [CrossRef]
  11. Aliu, M.; Šajn, R.; Stafilov, T. Spatial distribution of lead in soils of Pb-Zn mining and smelting area of the Mitrovica Region, Republic of Kosovo. J. Environ. Sci. Health A 2016, 51, 588–595. [Google Scholar] [CrossRef]
  12. Guzmán, G.; Ramírez, E.M.; Thalasso, F.; Rodríguez, S.; Guerrero, A.L.; Avelar, F.J. Evaluación de Contaminantes en Agua y Sedimentos del Río San Pedro en el Estado de Aguascalientes. Univ. Cienc. 2011, 27, 17–32. [Google Scholar]
  13. Mitchell, K.N.; Ramos, M.S.; Guerrero, A.L.; Yamamoto, L.; Flores, J.A.; Avelar, F.J. Evaluation of Environmental Risk of Metal Contaminated Soils and Sediments Near Mining Sites in Aguascalientes, Mexico. B Environ. Contam. Tox. 2016, 97, 216–224. [Google Scholar] [CrossRef] [PubMed]
  14. Acosta, J.A.; Jansen, B.; Kalbitz, K.; Faz, A.; Martínez-Martínez, S. Salinity increases mobility of heavy metals in soils. Chemosphere 2011, 85, 1318–1324. [Google Scholar] [CrossRef] [PubMed]
  15. Cornelis, R.; Crews, H.; Caruso, J.; Heumann, K. Handbook of Elemental Speciation: Techniques and Methodology; John Wiley & Sons: London, UK, 2003; pp. 1–2. [Google Scholar]
  16. Huang, J.H.; Kretzschmar, R. Sequential extraction method for speciation of arsenate and arsenite in mineral soils. Anal. Chem. 2010, 82, 5534–5540. [Google Scholar] [CrossRef] [PubMed]
  17. Martínez, T.; Tejeda, S.; Estañol, B.; Zúñiga, M.Á.; Zarazúa, G. Chemical and sequential analysis of some metals in sediments from the North Coast of the Gulf of Mexico. J. Radioanal. Nucl. Ch. 2016, 309, 343–350. [Google Scholar] [CrossRef]
  18. Tessier, A.; Campell, P.G.C.; Bisson, M. Sequential Extraction Procedure for the Speciation of Particulate Trace Metals. Anal. Chem. 1979, 51, 844–851. [Google Scholar] [CrossRef]
  19. Zimmerman, A.J.; Weindorf, D.C. Heavy Metal and Trace Metal Analysis in Soil by Sequential Extraction: A Review of Procedures. Int. J. Anal. Chem. 2010, 2010, 1–7. [Google Scholar] [CrossRef]
  20. Filgueiras, A.V.; Lavilla, I.; Bendicho, C. Chemical sequential extraction for metal partitioning in environmental solid samples. J. Environ. Monit. 2002, 4, 823–857. [Google Scholar] [CrossRef] [PubMed]
  21. Alvarez, M.B.; Malla, M.E.; Batistoni, D.A. Comparative assessment of two sequential chemical extraction schemes for the fractionation of cadmium, chromium, lead and zinc in surface coastal sediments. Fresen. J. Anal. Chem. 2001, 369, 81–90. [Google Scholar] [CrossRef]
  22. Oyeyiola, A.O.; Olayinka, K.O.; Alo, B.I. Comparison of three sequential extraction protocols for the fractionation of potentially toxic metals in coastal sediments. Environ. Monit. Assess. 2011, 172, 319–327. [Google Scholar] [CrossRef]
  23. Sauvé, S.; McBride, M.B.; Hendershot, W.H. Speciation of lead in contaminated soils. Environ. Pollut. 1997, 98, 149–155. [Google Scholar] [CrossRef]
  24. SGM (Servicio Geológico Mexicano). Panorama Minero del Estado de Aguascalientes; Secretaria de Economía: Mexico City, México, 2006. [Google Scholar]
  25. USEPA (U.S. Environmental Protection Agency). Preparation of Soil Sampling Protocols: Sampling Techniques and Strategies; USEPA: Washington, DC, USA, 1992.
  26. Secretaría de Economía. Norma Mexicana NMX-AA-132-SCFI-2006: Muestreo de Suelos para la Identificación y la Cuantificación de Metales y Metaloides, y Manejo de la Muestra; Secretaria de Medio Ambiente y Recursos Naturales: Mexico City, México, 2006. [Google Scholar]
  27. IUSS Working Group WRB. World Reference Base for Soil Resources, International Soil Classification System for Naming Soils and Creating Legends for Soil Maps, 2015th ed.; World Soil Resources: Rome, Italy, 2015. [Google Scholar]
  28. INEGI (Instituto Nacional de Estadística y Geografía). Edafología. Información geoespacial. Conjunto de datos de perfiles de suelos escala 1:250,000 serie II. Available online: https://www.inegi.org.mx/temas/edafologia/ (accessed on 20 August 2022).
  29. Nagib, S.; Inoue, K. Recovery of lead and zinc from fly ash generated from municipal incineration plants by means of acid and/or alkaline leaching. Hydrometallurgy 2000, 56, 269–292. [Google Scholar] [CrossRef]
  30. CEN/TS 14997. Characterization of waste-leaching behavior tests-influence of pH on leaching with continuous pH-control; CEN: Brussels, Belgium, 2006. [Google Scholar]
  31. Radojević, M.; Bashkin, V.N. Practical Environmental Analysis, 2nd ed.; Royal Society of Chemistry: London, UK, 2006; p. 300. [Google Scholar]
  32. Carter, M.R.; Gregorich, E.G. Soil Sampling and Methods of Analysis, 2nd ed.; Taylor & Francis: New York, NY, USA, 2008; p. 174. [Google Scholar]
  33. USEPA (U.S. Environmental Protection Agency). Cation—Exchange Capacity of Soil (Sodium Acetate) (Method 9081); USEPA: Washington, DC, USA, 1986.
  34. SEMARNAT (Secretaria de Medio Ambiente y Recursos Naturales). Norma Oficial Mexicana NOM-021-SEMARNAT-2000: Que Establece las Especificaciones de Fertilidad, Salinidad y Clasificación de Suelos, Estudio, Muestreo y Análisis; SEMARNAT: Mexico City, México, 2002. [Google Scholar]
  35. ISO–11466; Soil quality—Extraction of Trace Elements Soluble in Aqua Regia. International Organization for Standardization: Berlin, Germany, 1995.
  36. Fan, W.; Wang, W.X. Extraction of spiked metals from contaminated coastal sediments: Acomparison of different methods. Environ. Toxicol. Chem. 2003, 22, 2659–2666. [Google Scholar] [CrossRef] [PubMed]
  37. Quevauviller, P. Operationally defined extraction procedures for soil and sediment analysis I. Standardization. TrAC-Trend Anal. Chem. 1998, 17, 289–298. [Google Scholar] [CrossRef]
  38. USEPA (U.S. Environmental Protection Agency). Flame Atomic Absorption Spectrophotometry (Method 7000B); USEPA: Washington, DC, USA, 2007.
  39. APHA-AWWA-WPCF (American Public Health Association, American Water Works Association and Water Pollution Control Federation). Standard Methods for the Examination of Water and Wastewater (Method 3020B). Available online: https://www.standardmethods.org/ (accessed on 16 March 2016).
  40. Ogundiran, M.B.; Osibanjo, O. Mobility and speciation of heavy metals in soils impacted by hazardous waste. Chem. Spec. Bioavailab. 2009, 21, 59–69. [Google Scholar] [CrossRef]
  41. Iwegbue, C.M.A. Chemical Fractionation and Mobility of Heavy Metals in Soils in the Vicinity of Asphalt Plants in Delta State, Nigeria. Environ. Forensics 2013, 14, 248–259. [Google Scholar] [CrossRef]
  42. Müller, G. Index of geoaccumulation in sediments of the Rhine River. Geojournal 1969, 2, 108–118. [Google Scholar]
  43. McLennan, S.M. Relationships between the trace element composition of sedimentary rocks and upper continental crust. Geochem. Geophy. Geosy. 2001, 2. [Google Scholar] [CrossRef]
  44. Khalil, A.; Hanich, L.; Bannari, A.; Zouhri, L.; Pourret, O.; Hakkou, R. Assessment of soil contamination around an abandoned mine in a semi-arid environment using geochemistry and geostatistics: Pre-work of geochemical process modeling with numerical models. J. Geochem. Explor. 2013, 125, 117–129. [Google Scholar] [CrossRef]
  45. Bourennane, H.; Douay, F.; Sterckeman, T.; Villanneau, E.; Ciesielski, H.; King, D.; Baize, D. Mapping of anthropogenic trace elements inputs in agricultural topsoil from Northern France using enrichment factors. Geoderma 2010, 157, 165–174. [Google Scholar] [CrossRef]
  46. Liénard, A.; Brostaux, Y.; Colinet, G. Soil contamination near a former Zn-Pb ore-treatment plant: Evaluation of deterministic factors and spatial structures at the landscape scale. J. Geochem. Explor. 2014, 147, 107–116. [Google Scholar] [CrossRef]
  47. CCME (Canadian Council of Ministers of the Environment). Canadian Soil Quality Guidelines for the Protection of Environment and Human Health. Available online: http://www.ccme.ca/en/results/124/ch/4 (accessed on 19 August 2016).
  48. CCME (Canadian Council of Ministers of the Environment). Canadian Sediment. Quality Guidelines for the Protection of Aquatic Life. Available online: http://www.ccme.ca/en/results/124/ch/3 (accessed on 19 August 2016).
  49. CCME (Canadian Council of Ministers of the Environment). Glossary. Available online: http://ceqg-rcqe.ccme.ca/download/en/94 (accessed on 22 November 2018).
  50. Ure, A.M. Single extraction schemes for soil analysis and related applications. Sci. Total Environ. 1996, 178, 3–10. [Google Scholar]
  51. Cappuyns, V. Barium (Ba) leaching from soils and certified reference materials. Appl. Geochem. 2018, 88, 68–84. [Google Scholar]
  52. Cappuyns, V.; Swennen, R. The use of leaching tests to study the potential mobilization of heavy metals from soils and sediments: A comparison. Water Air Soil Poll. 2008, 191, 95–111. [Google Scholar]
  53. Prathumratana, L.; Kim, K.W.; Kim, J. Lead (Pb) Contamination of a Historical Mining and Smelting site in Europe: Fractionation and human bioavailability. Geosystem. Eng. 2010, 13, 21–24. [Google Scholar] [CrossRef]
  54. Moore, F.; Dehghani, S.; Keshavarzi, B. Characterization of Soil Contamination in Miduk Mining District, SW Iran. Soil Sediment. Contam. 2014, 23, 614–627. [Google Scholar] [CrossRef]
  55. Iwegbue, C.M.A. Metal fractionation in soil profiles at automobile mechanic waste dumps. Waste Manag. Res. 2007, 25, 585–593. [Google Scholar] [CrossRef]
  56. Olu-Owolabi, B.I.; Agunbiade, F.O.; Adebowale, K.O. Metal speciation in sediments from crude oil prospecting in the coastal area of Ondo State, Nigeria. Earth Sci. Res. J. 2013, 17, 41–51. [Google Scholar]
  57. Li, Z.; Ma, Z.; van der Kuijp, T.J.; Yuan, Z.; Huang, L. A review of soil heavy metal pollution from mines in China: Pollution and health risk assessment. Sci. Total Environ. 2014, 468–469, 843–853. [Google Scholar] [CrossRef]
  58. Zahra, A.; Hashmi, M.Z.; Malik, R.N.; Ahmed, Z. Enrichment and geo-accumulation of heavy metals and risk assessment of sediments of the Kurang Nallah-Feeding tributary of the Rawal Lake Reservoir, Pakistan. Sci. Total Environ. 2014, 470–471, 925–933. [Google Scholar] [CrossRef]
  59. Favas, P.J.C.; Sarkar, S.K.; Rakshit, D. Geochemical fractionation of trace elements in stream sediments contaminated by mining activity. Clean-Soil Air Water 2015, 43, 446–455. [Google Scholar] [CrossRef]
  60. Varol, M. Assessment of heavy metal contamination in sediments of the Tigris River (Turkey) using pollution indices and multivariate statistical techniques. J. Hazard. Mater. 2011, 195, 355–364. [Google Scholar] [PubMed]
  61. Fernández, D.; Pateiro, M.; Nóvoa, J.C.; Garrido, B.; Arias, M. Zinc distribution and acid-base mobilisation in vineyard soils and sediments. Sci. Total Environ. 2012, 414, 470–479. [Google Scholar]
  62. Mahlangeni, N.T.; Moodley, R.; Jonnalagadda, S.B. Heavy metal distribution in Laportea peduncularis and growth soil from the eastern parts of KwaZulu-Natal, South Africa. Environ. Monit. Assess. 2016, 188, 1–14. [Google Scholar]
Figure 1. Study area and geographical location of sites.
Applsci 12 08592 g001
Figure 2. Index of Geo Accumulation for soils and sediments during dry and rainy seasons. Class: 0 (Unpolluted), 1 (Unpolluted to moderately polluted), 2 (Moderately polluted), 3 (Moderately to highly polluted), 4 (Highly polluted), 5 (Highly to extremely polluted), 6 (Extremely polluted).
Applsci 12 08592 g002
Figure 3. Enrichment Factor for soils and sediments during dry and rainy seasons. Class: 1 (Deficiency to minimal enrichment), 2 (Moderate enrichment), 3 (Significant enrichment), 4 (Very high enrichment), 5 (Extremely high enrichment).
Applsci 12 08592 g003
Table 1. Coordinates of the sampling sites.
SiteLocationLatitude (N)Longitude (W)RSG [a,b]Observations
S1Asientos (Mine Out)22°13′48.33″102°6′10.68″LeptosolAgricultural
S2Asientos (Downtown)22°14′22.11″102°5′26.94″LeptosolResidential/Commercial
S4Santa Elena Reservoir22°12′16.15″102°1′9.70″DurisolAgricultural
S6El Llavero (Ranch)22°3′40.00″102°5′57.00″PhaeozemAgricultural
S12Gomez Portugal (Town)21°59′42.00″102°16′51.00″DurisolAgricultural
S15Industrial Park (PIVA)21°58′48.50″102°17′33.30″ PhaeozemIndustrial
S22Curtidores (City)21°53′20.40″102°19′19.96″PhaeozemResidential/Commercial
S24El Niagara Reservoir21°46′46.98″102°22′13.81″PhaeozemAgricultural
[a] Reference Soil Group according to International Union of Soil Sciences [27]. [b] Source: Instituto Nacional de Estadística y Geografía (INEGI) [28].
Table 2. Sequence of extracting agent and operationally defined fractions in the SEP [a].
FractionExtracting AgentExtraction Conditions
F1Exchangeable8 mL MgCl2 1.0 M (pH 7.0)Continuous agitation for 1 h at room temperature
F2Bound to Carbonate8 mL CH3COONa 1.0 M (pH 5.0)Continuous agitation for 5 h at room temperature
F3Bound to Fe/Mn oxides20 mL NH2OH·HCl 0.04 M in 25% (v/v) acetic acidOccasional agitation for 6 h at 96 °C
F4Bound to Organic Carbon3 mL HNO3 0.02 M + 5 mL H2O2 30% (w/v) (pH 2.0)
3 mL H2O2 30% (w/v) (pH 2.0)
5 mL NH4OAc 3.2 M
Occasional agitation for 2 h at 85 °C
Occasional agitation for 3 h at 85 °C
Continuous agitation for 30 min at room temperature
F5Residual25 mL aqua regiaISO–11466:1995 protocol
[a] 1 g substrate sample.
Table 3. Result of quality-control of NIST Reference Material (Mean ± standard deviation; n = 3).
SRMMeasured Value (mg kg−1)Certified Value (mg kg−1)Percentage of Recovery (%)
Montana Soil 2710
(Highly Elevated Trace Element Concentration)
5799.8 ± 213.355532 ± 80104.8
San Joaquin Soil 2709
(Baseline Trace Element Concentration)
19.2 ± 2.2118.9 ± 0.5101.5
Buffalo River Sediment 8704156.5 ± 3.97150 ± 17104.3
Table 4. Igeo and classification of heavy metal pollution.
ClassIgeo ValuePollution Degree
0<0Unpolluted
10–1 Unpolluted to moderately polluted
21–2Moderately polluted
32–3Moderately to highly polluted
43–4Highly polluted
54–5Highly to extremely polluted
6>5Extremely polluted
Table 5. EF classes with respect to quality.
ClassValueEnrichment Degree
1<2Deficiency to minimal enrichment
22–5Moderate enrichment
35–20Significant enrichment
420–40Very high enrichment
5>40Extremely high enrichment
Table 6. Physicochemical characteristics of samples during dry and rainy seasons.
SitepHEC
(µS cm−1)
Eh
(mV)
OM
(%)
CEC
(cmolc kg−1)
CO32− [a]
(mg kg−1)
a. Soil Dry
S17.63430.3320.81.29189.14978.0
S27.81501.3316.42.59133.621038.6
S47.76754.7306.52.59205.921585.5
S68.47248.9305.40.89183.63975.8
S127.54271.2106.52.07244.94669.5
S155.38412.7173.33.12255.72489.2
S227.05954.3432.66.78216.32732.1
S246.48123.2437.95.14278.22975.6
b. Soil Rainy
S17.80589.7338.211.4816.69856.1
S27.81363.7335.22.8716.711098.1
S47.76440.7328.37.1822.301484.8
S67.54161.0309.21.3644.56855.6
S126.17122.6484.50.78389.78790.1
S157.52379.7435.82.85105.711161.0
S227.02598.0414.45.7277.94852.5
S245.66475.0423.83.94111.23730.9
p-value [b]
(Bilateral)
0.8170.5500.0910.3230.0360.747
c. Sediment Dry
S17.96598.3316.71.9427.90794.0
S27.84792.7237.43.89116.341221.0
S47.91361.0281.32.32360.451037.9
S68.09206.6188.40.13111.35975.8
S127.17455.3380.95.01492.961160.2
S157.001045.3185.48.35206.24996.2
S227.11887.7248.15.54306.33916.0
S246.74842.3168.85.2655.69853.6
d. Sediment Rainy
S17.362115.0301.04.9027.741220.0
S27.77416.3303.11.8111.09975.9
S48.22271.6282.72.9494.241625.3
S67.19125.0371.52.4316.731221.1
S127.24977.0310.611.9127.90975.5
S156.971025.7140.95.5511.10732.0
S226.73589.7303.16.9463.15670.7
S247.00754.7215.118.72178.401222.0
p-value [b]
(Bilateral)
0.5160.5870.4530.2310.0320.487
The values represented as means (n = 3): RSD < 2.2% (pH), RSD < 4.9% (EC), RSD < 8.2% (Eh), RSD < 14.9% (OM), RSD < 22.1% (CEC), RSD < 19.8% (CO32−). [a] Bicarbonates were the chemical specie detected. [b] Statistically significant differences between dry season and rainy season.
Table 7. Metal analyses of samples during dry and rainy seasons and mobility factor.
SiteSubstrateSeasonPbTotal
[mg kg 1]
Leaching TestSEP Tessier (%)MF
0.01 M CaCl2 Applsci 12 08592 i001 F1 Applsci 12 08592 i002 F2 Applsci 12 08592 i003 F3 Applsci 12 08592 i004 F4 Applsci 12 08592 i005 F5(%)[mg kg−1]
[mg kg −1](%)
Applsci 12 08592 i006
S1SoilDry527.23.870.73 Applsci 12 08592 i0078.7446.1
Rainy164.80.440.27 Applsci 12 08592 i00819.5232.2
SedimentDry1892.85.550.29 Applsci 12 08592 i00920.90395.6
Rainy4273.320.240.46 Applsci 12 08592 i01055.752382.4
S2SoilDry441.61.240.28 Applsci 12 08592 i0119.8943.7
Rainy207.40.490.24 Applsci 12 08592 i01215.2831.7
SedimentDry876.11.800.21 Applsci 12 08592 i01322.11193.7
Rainy958.015.181.58 Applsci 12 08592 i01421.24203.5
S4SoilDry244.91.180.48 Applsci 12 08592 i01519.5147.8
Rainy106.90.620.58 Applsci 12 08592 i01633.2835.6
SedimentDry381.517.124.49 Applsci 12 08592 i01729.00110.6
Rainy39.30.070.18 Applsci 12 08592 i01827.6310.9
S6SoilDry23.00.462.00 Applsci 12 08592 i01940.779.4
Rainy18.70.502.67 Applsci 12 08592 i02037.717.1
SedimentDry16.30.603.69 Applsci 12 08592 i02139.216.4
Rainy45.10.070.15 Applsci 12 08592 i02225.4411.5
S12SoilDry21.40.924.31 Applsci 12 08592 i02346.139.9
Rainy16.90.834.90 Applsci 12 08592 i02441.987.1
SedimentDry26.90.802.98 Applsci 12 08592 i02537.8210.2
Rainy45.80.210.46 Applsci 12 08592 i02624.5211.2
S15SoilDry37.42.185.82 Applsci 12 08592 i02723.548.8
Rainy15.70.442.80 Applsci 12 08592 i02836.085.7
SedimentDry50.50.290.58 Applsci 12 08592 i02922.7811.5
Rainy37.70.100.27 Applsci 12 08592 i03024.249.1
S22SoilDry70.20.951.35 Applsci 12 08592 i03117.6112.4
Rainy65.40.731.12 Applsci 12 08592 i03222.7214.9
SedimentDry64.60.480.74 Applsci 12 08592 i03322.0814.3
Rainy221.61.050.47 Applsci 12 08592 i03414.0131.0
S24SoilDry40.51.674.13 Applsci 12 08592 i03524.469.9
Rainy22.10.281.26 Applsci 12 08592 i03629.516.5
SedimentDry37.10.787.81 Applsci 12 08592 i03740.5615.0
Rainy42.20.140.33 Applsci 12 08592 i03828.3212.0
Fractions: F1, Exchangeable; F2, Carbonate bound; F3, Fe/Mn oxide bound; F4, Organic matter bound; F5, Residual. MF = Mobility Factor. The values represented as means (n = 2): RSD < 10.9% (Pb total); RSD < 15.8% (Leaching Test); means (n = 3): RSD < 7.7% (F1), RSD < 18.7% (F2), RSD < 14.5% (F3), RSD < 19.4% (F4), RSD < 21.1% (F5). Soil Quality Guidelines: Agricultural = 70 mg kg−1; Residential = 140 mg kg−1; Commercial = 260 mg kg−1; Industrial = 600 mg kg−1 [47]. Sediment Quality Guidelines: TEL-FW (Threshold effect level in Freshwater) = 35.0 mg kg−1; PEL-FW (Probable effect level in Freshwater) = 91.3 mg kg−1 [48]. Pb crust = 17 mg kg1 [43].
Table 8. Total concentration order of lead analyzed by substrate/season.
Soil Dry
S1 > S2 > S4 > S22 > S24 > S15 > S6 > S12
Soil Rainy
S2 > S1 > S4 > S22 > S24 > S6 > S12 > S15
Sediment Dry
S1 > S2 > S4 > S22 > S15 > S24 > S12 > S6
Sediment Rainy
S1 > S2 > S22 > S12 > S6 > S24 > S4 > S15
Publisher’s Note: MDPI stays neutral with regard to jurisdictional claims in published maps and institutional affiliations.

