
Comparisons of GC-Measured Carboxylic Acids and AMS m/z 44 Signals: Contributions of Organic Acids to m/z 44 Signals in Remote Aerosols from Okinawa Island

 ,
, 
Abstract
:Highlights
- LMW dicarboxylic acids determined by GC explain ca. 50% of AMS-derived m/z 44 signals
- The remaining half may be contributed by LMW monocarboxylic acids in the aerosol phase.
- Organic aerosols from the western North Pacific Rim are photochemically more aged.
Abstract
1. Introduction
2. Samples and Analytical Procedure
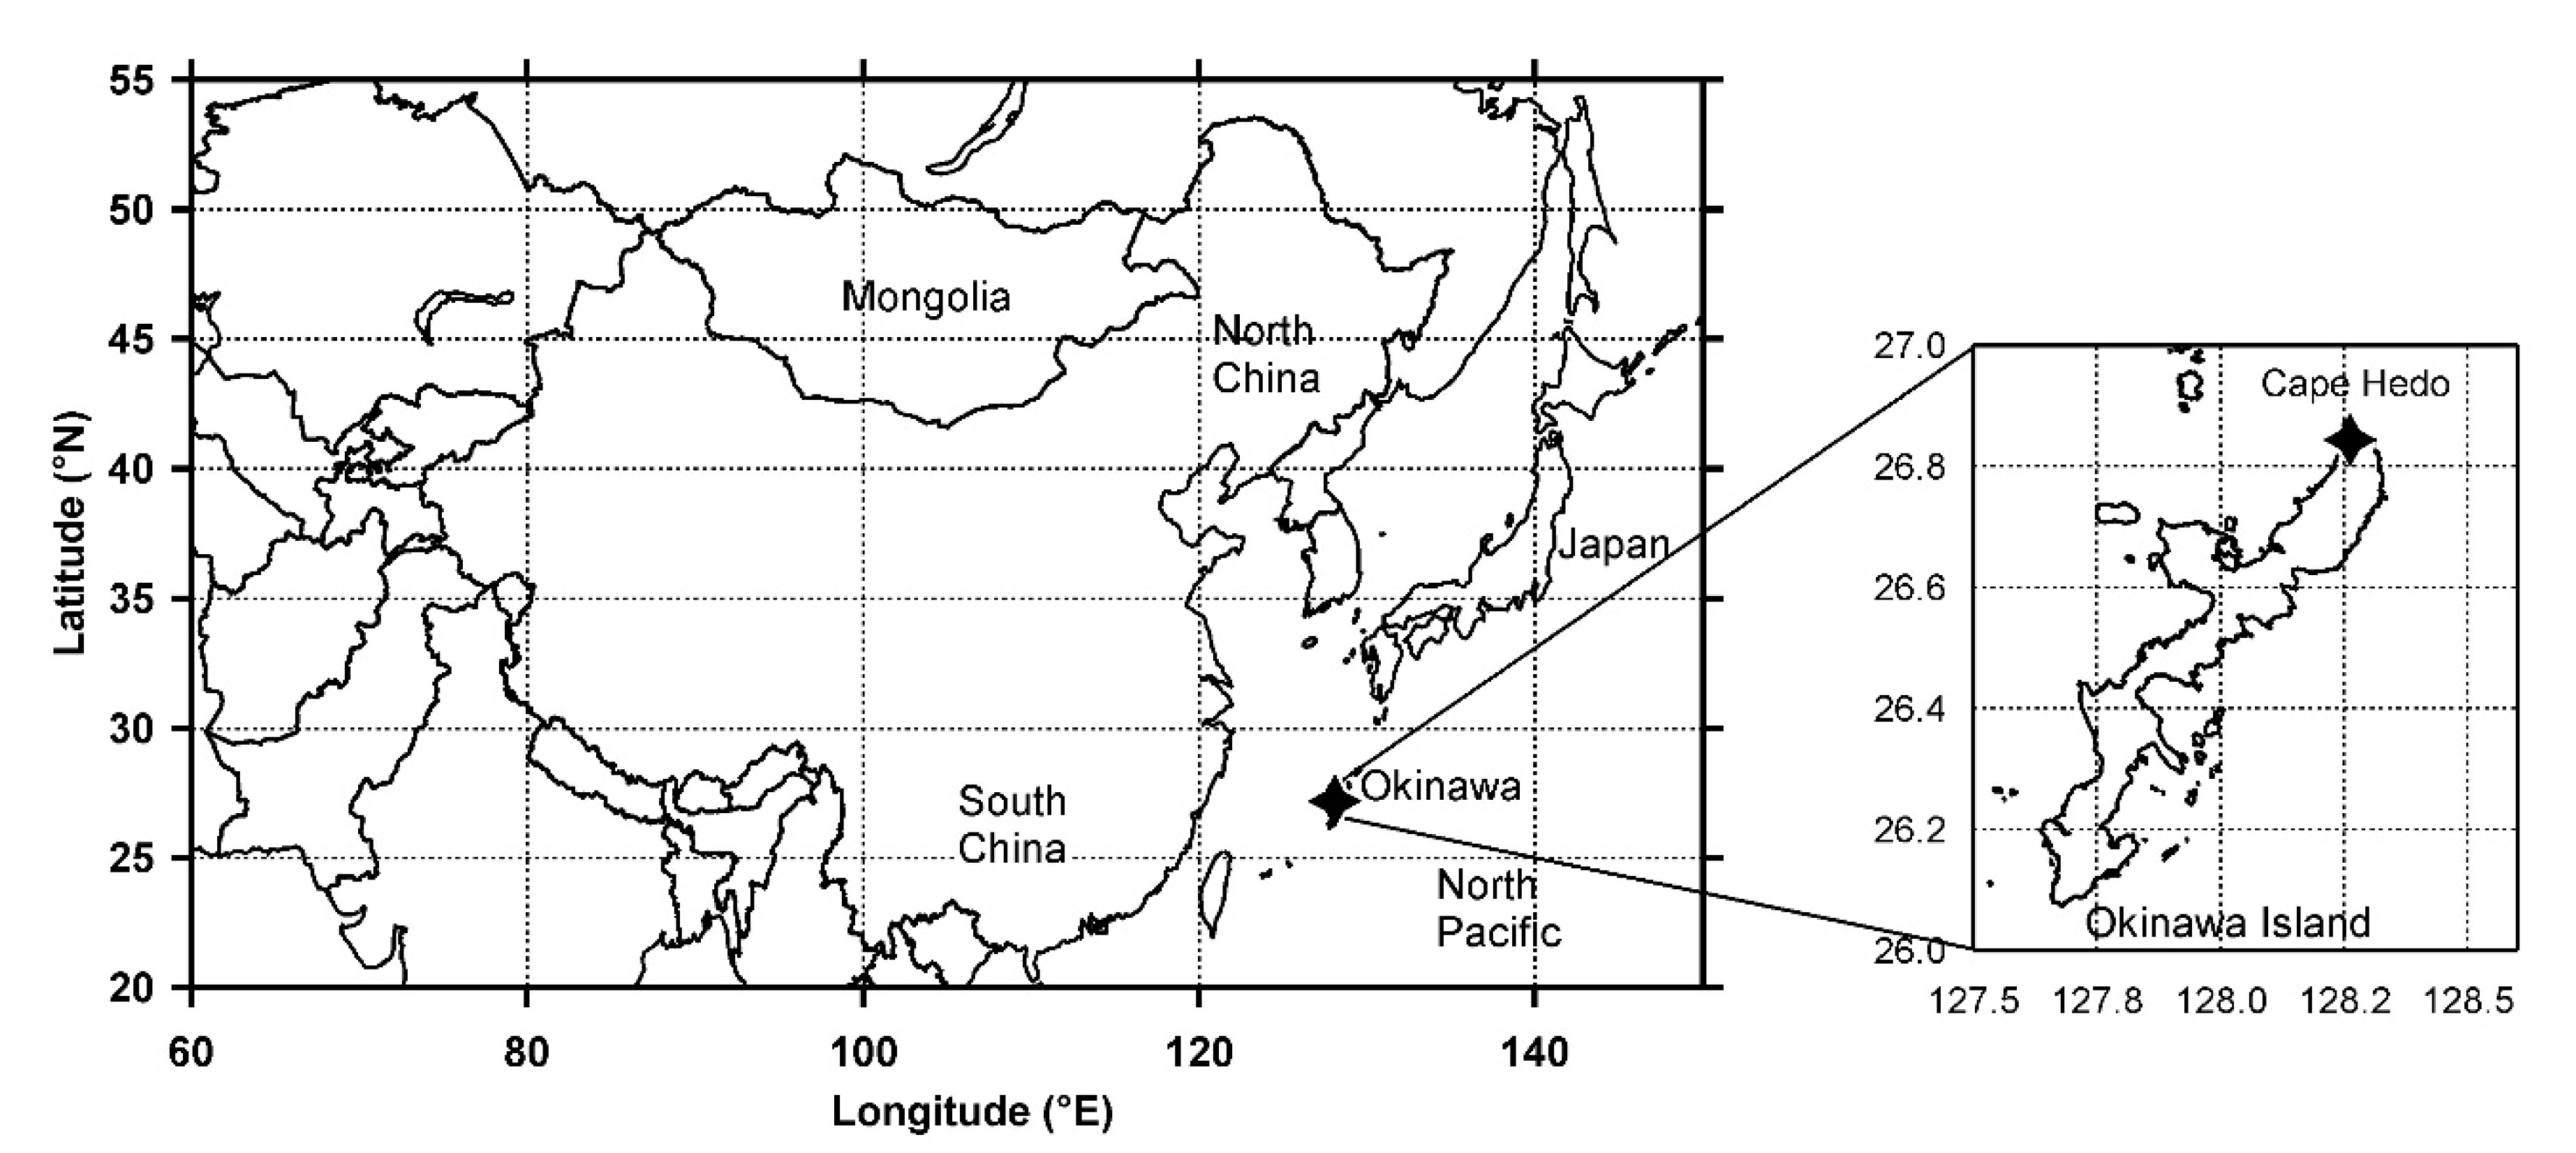
2.1. Site Description and Aerosol Sampling
2.2. Chemical Analysis
2.3. Aerodyne AMS Measurements
3. Results and Discussions
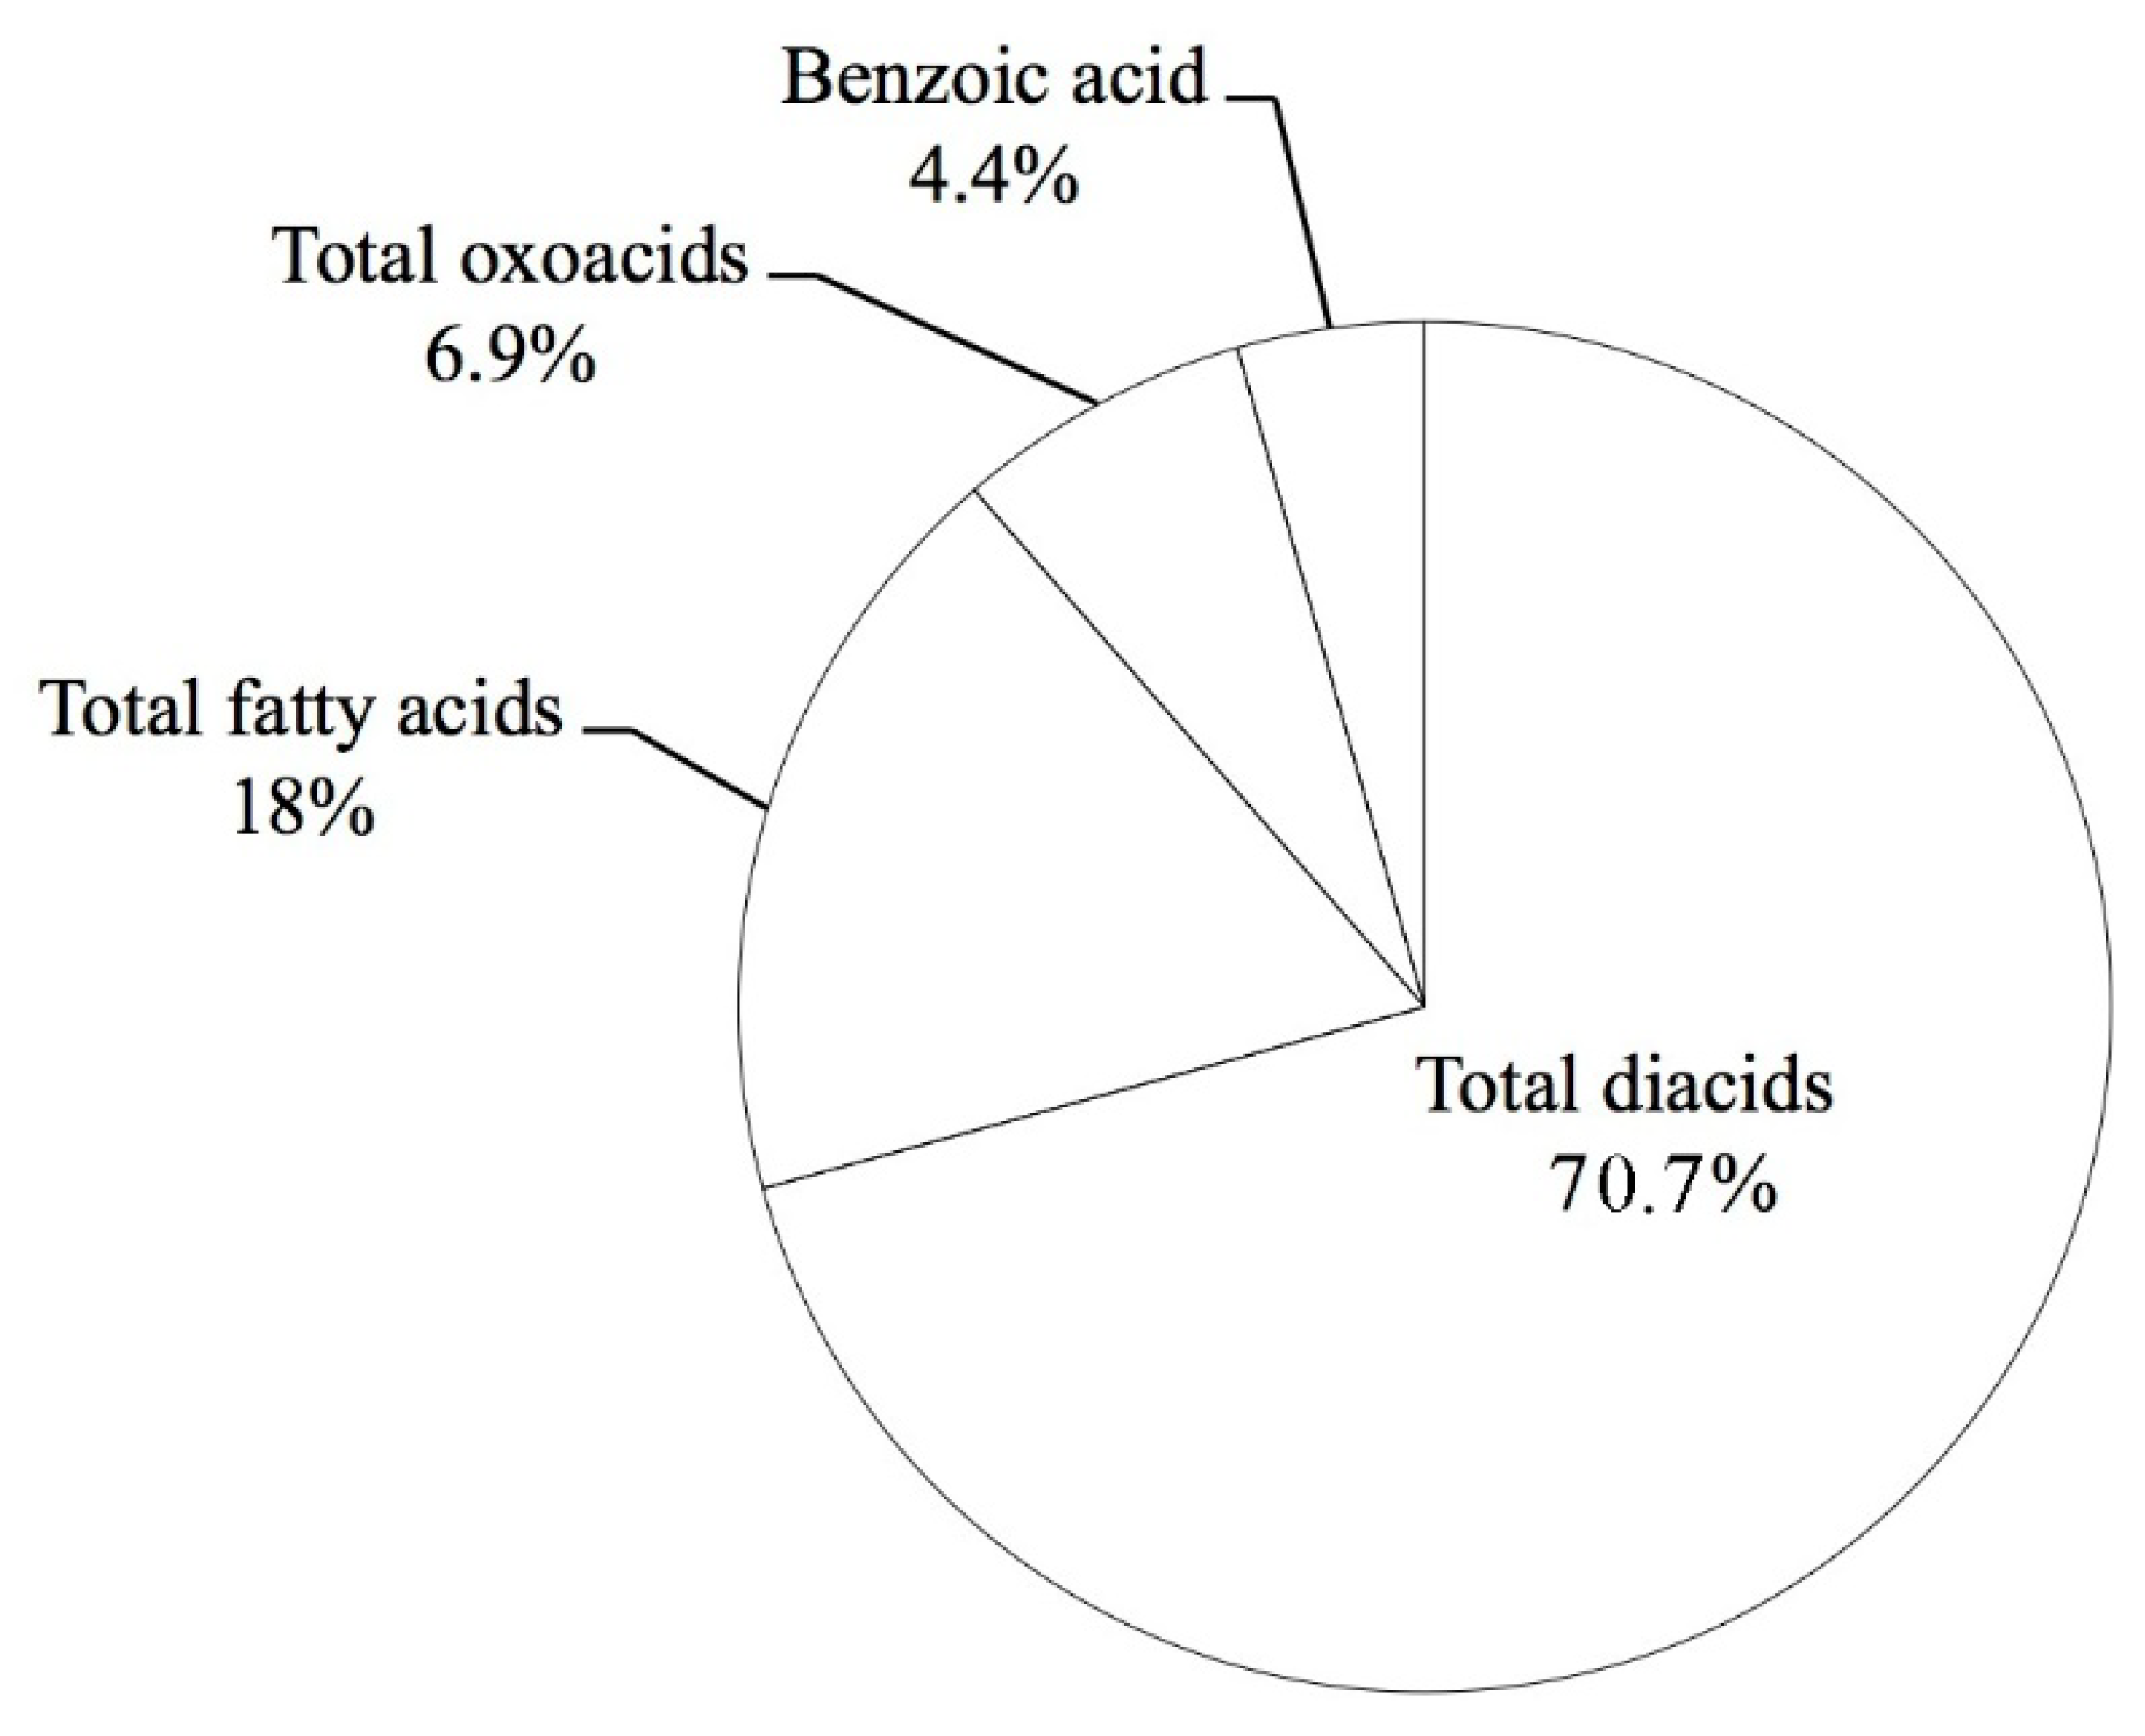
3.1. Molecular Distributions and Temporal Variation in Dicarboxylic Acids, Oxoacids, Benzoic Acid, and Fatty Acids
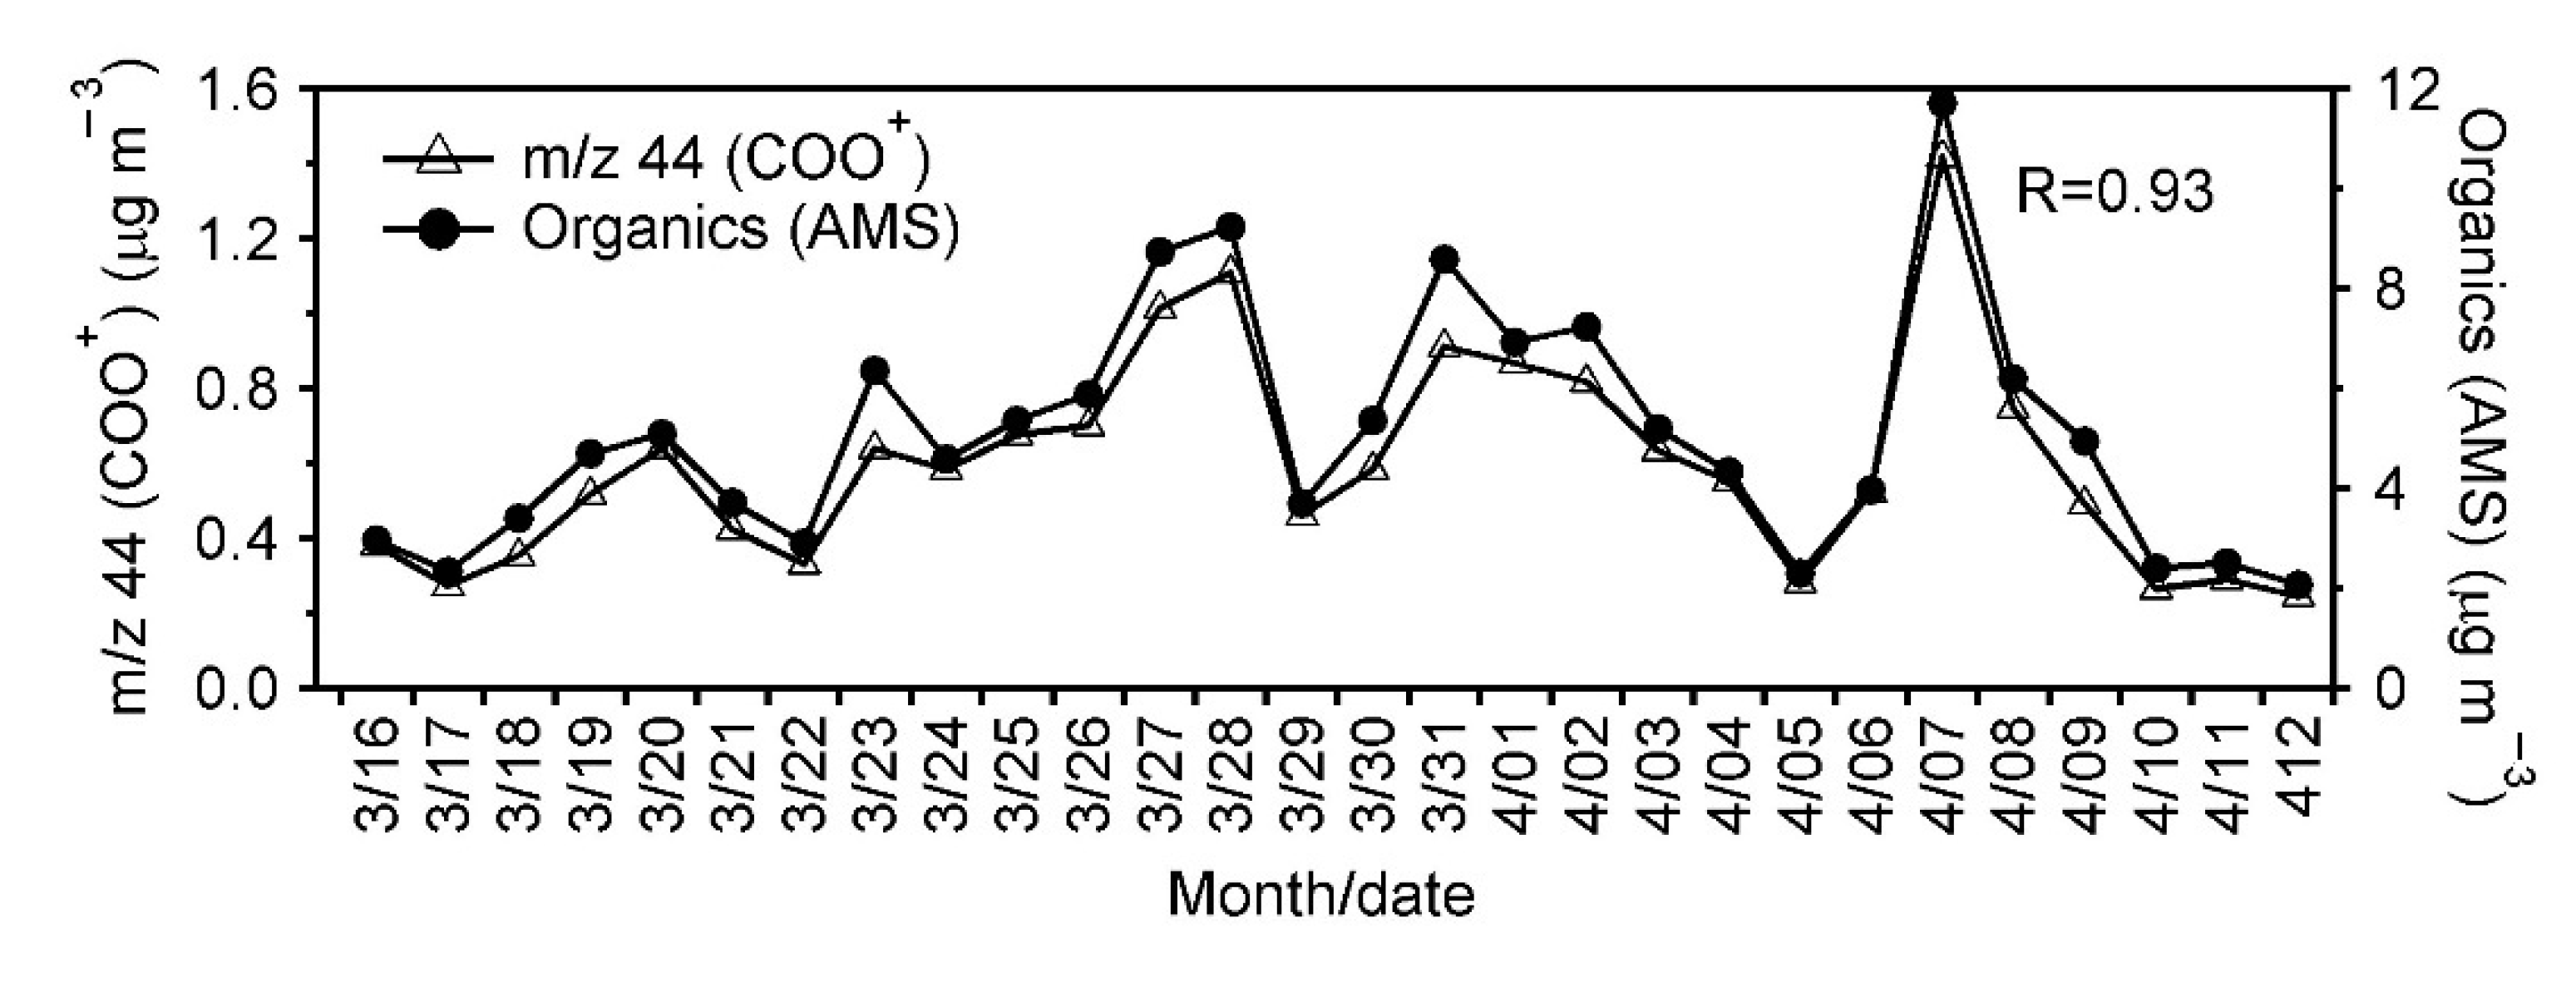
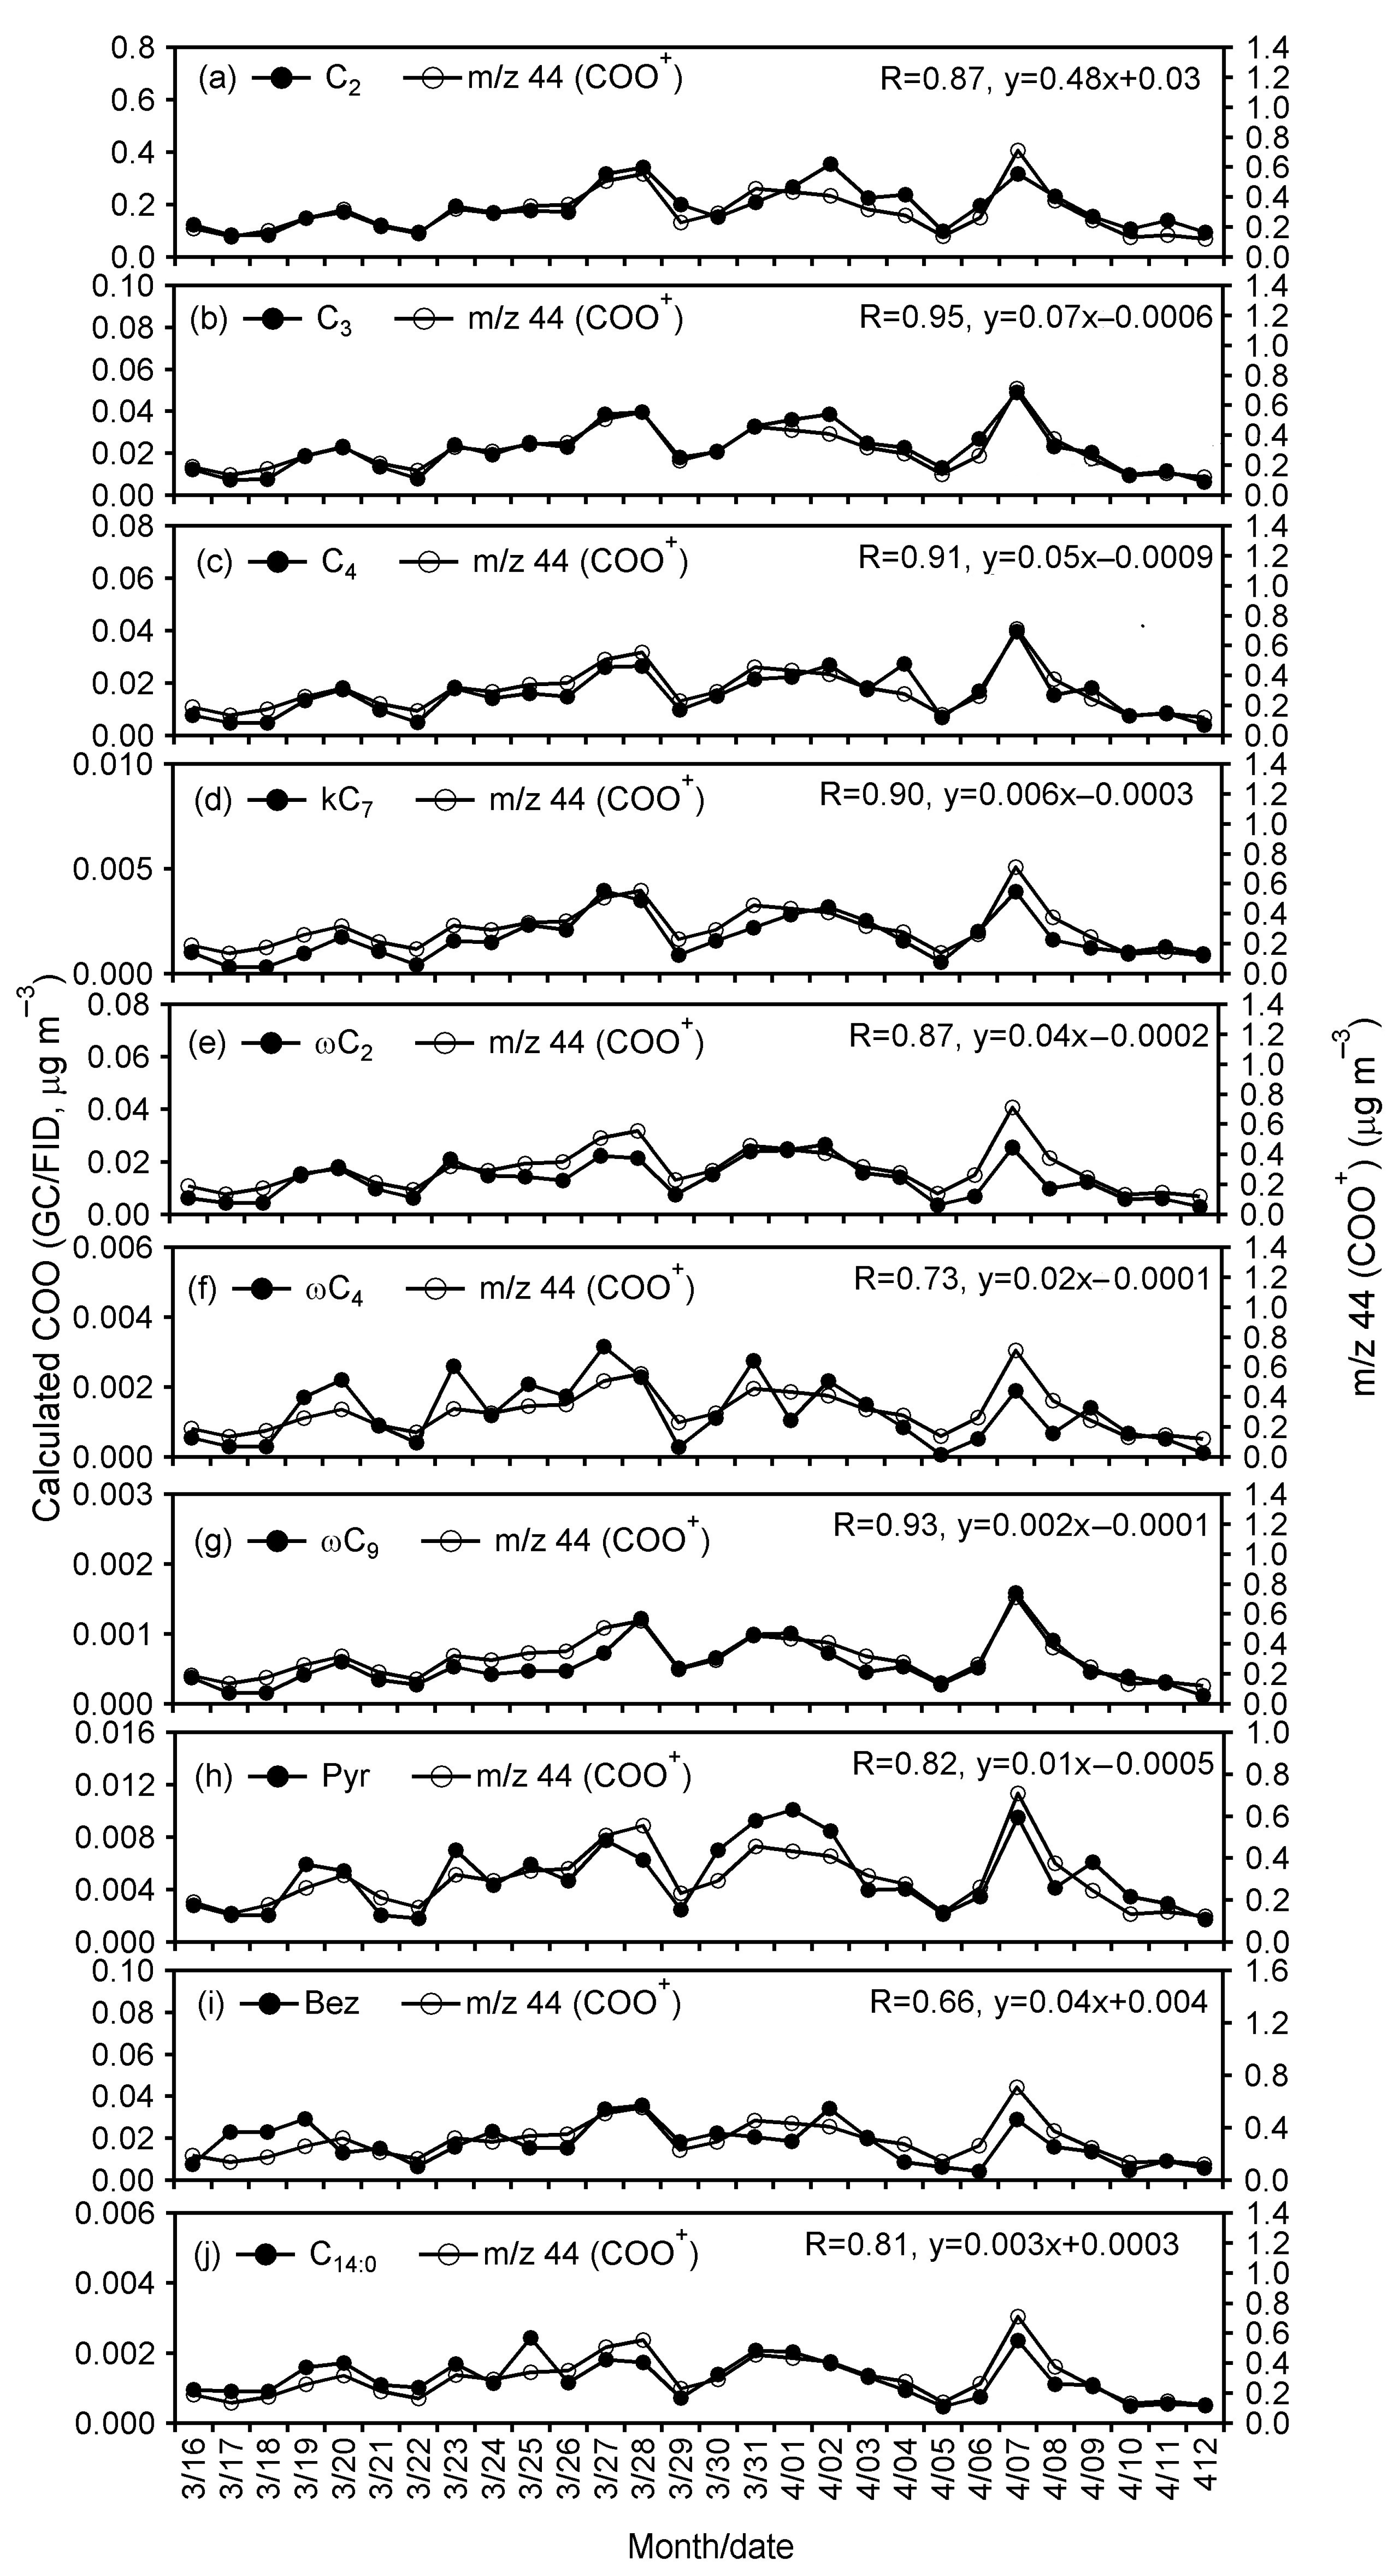
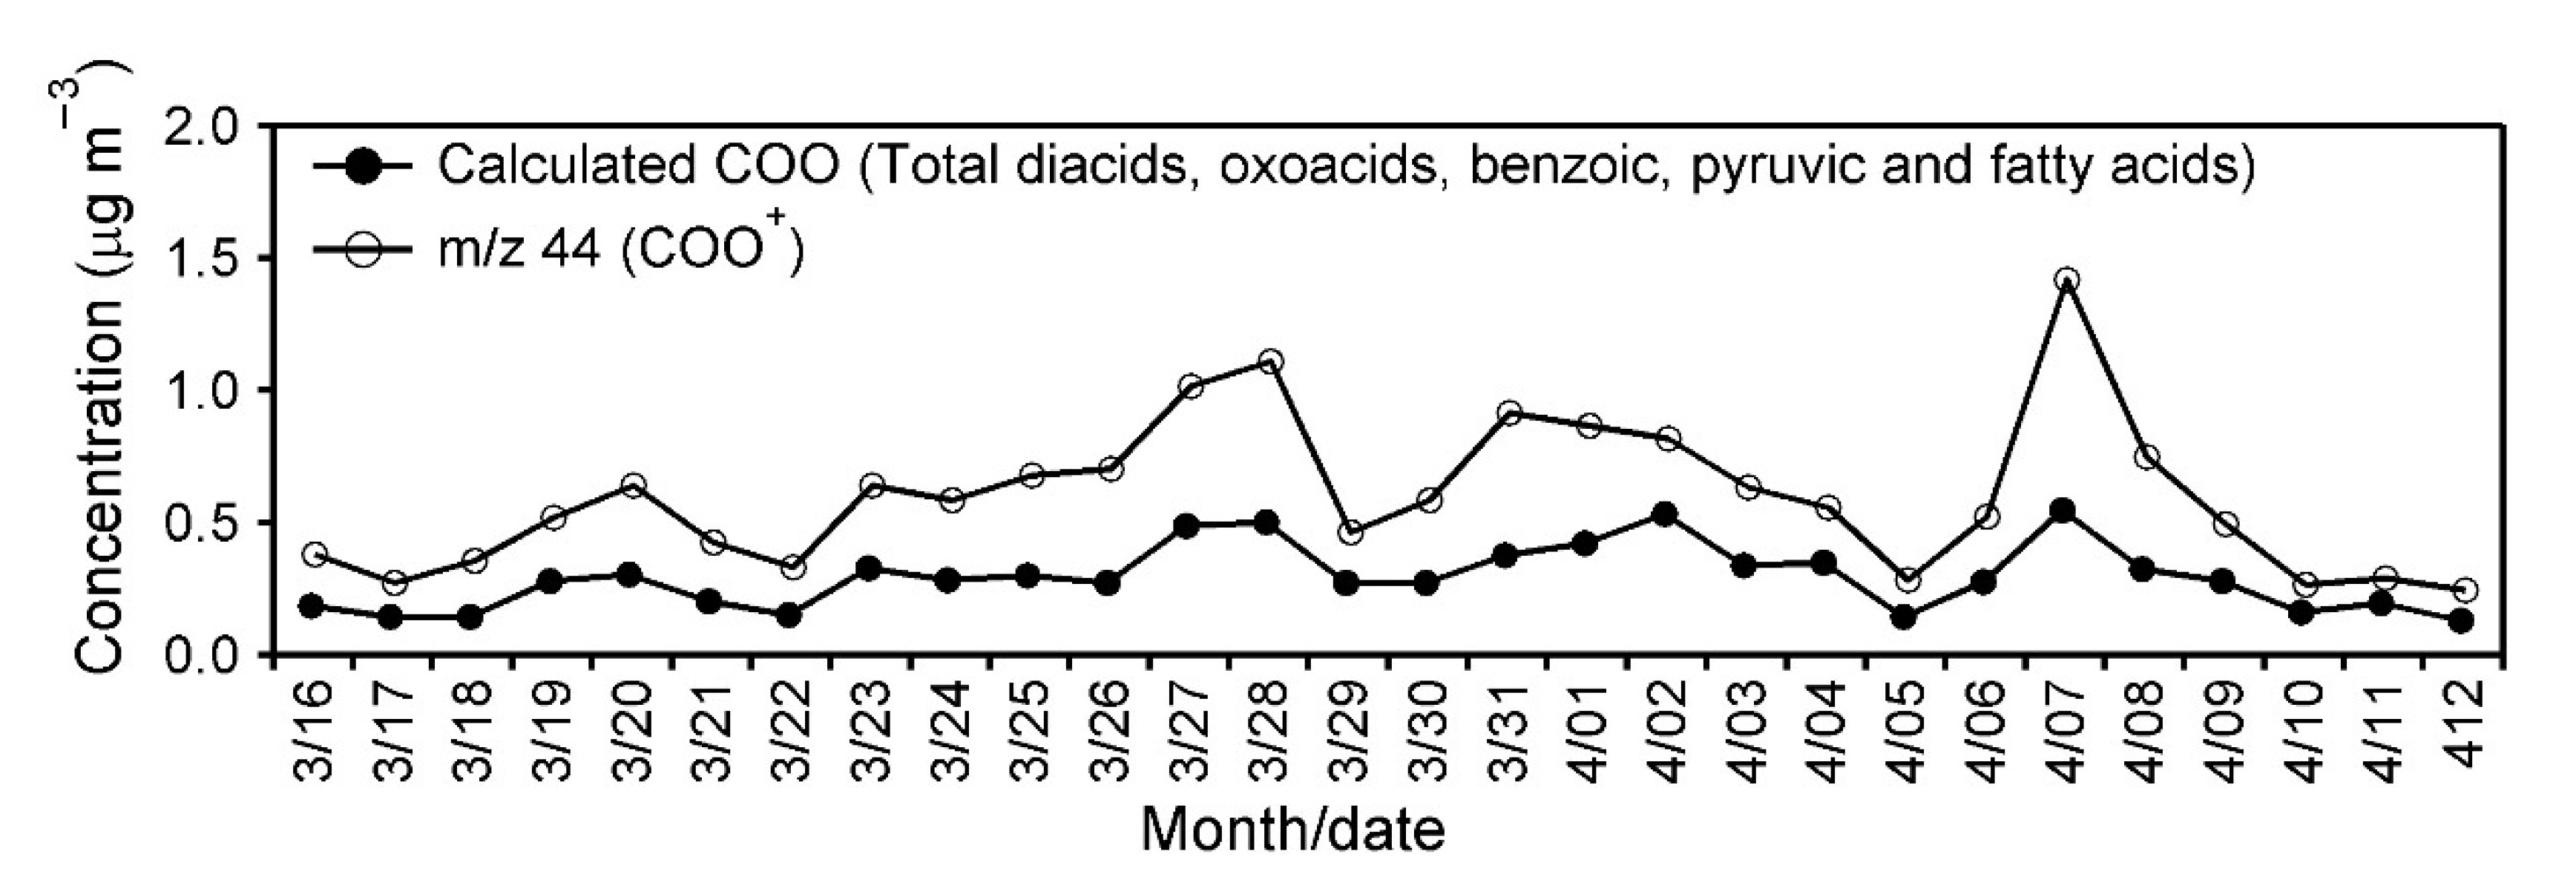
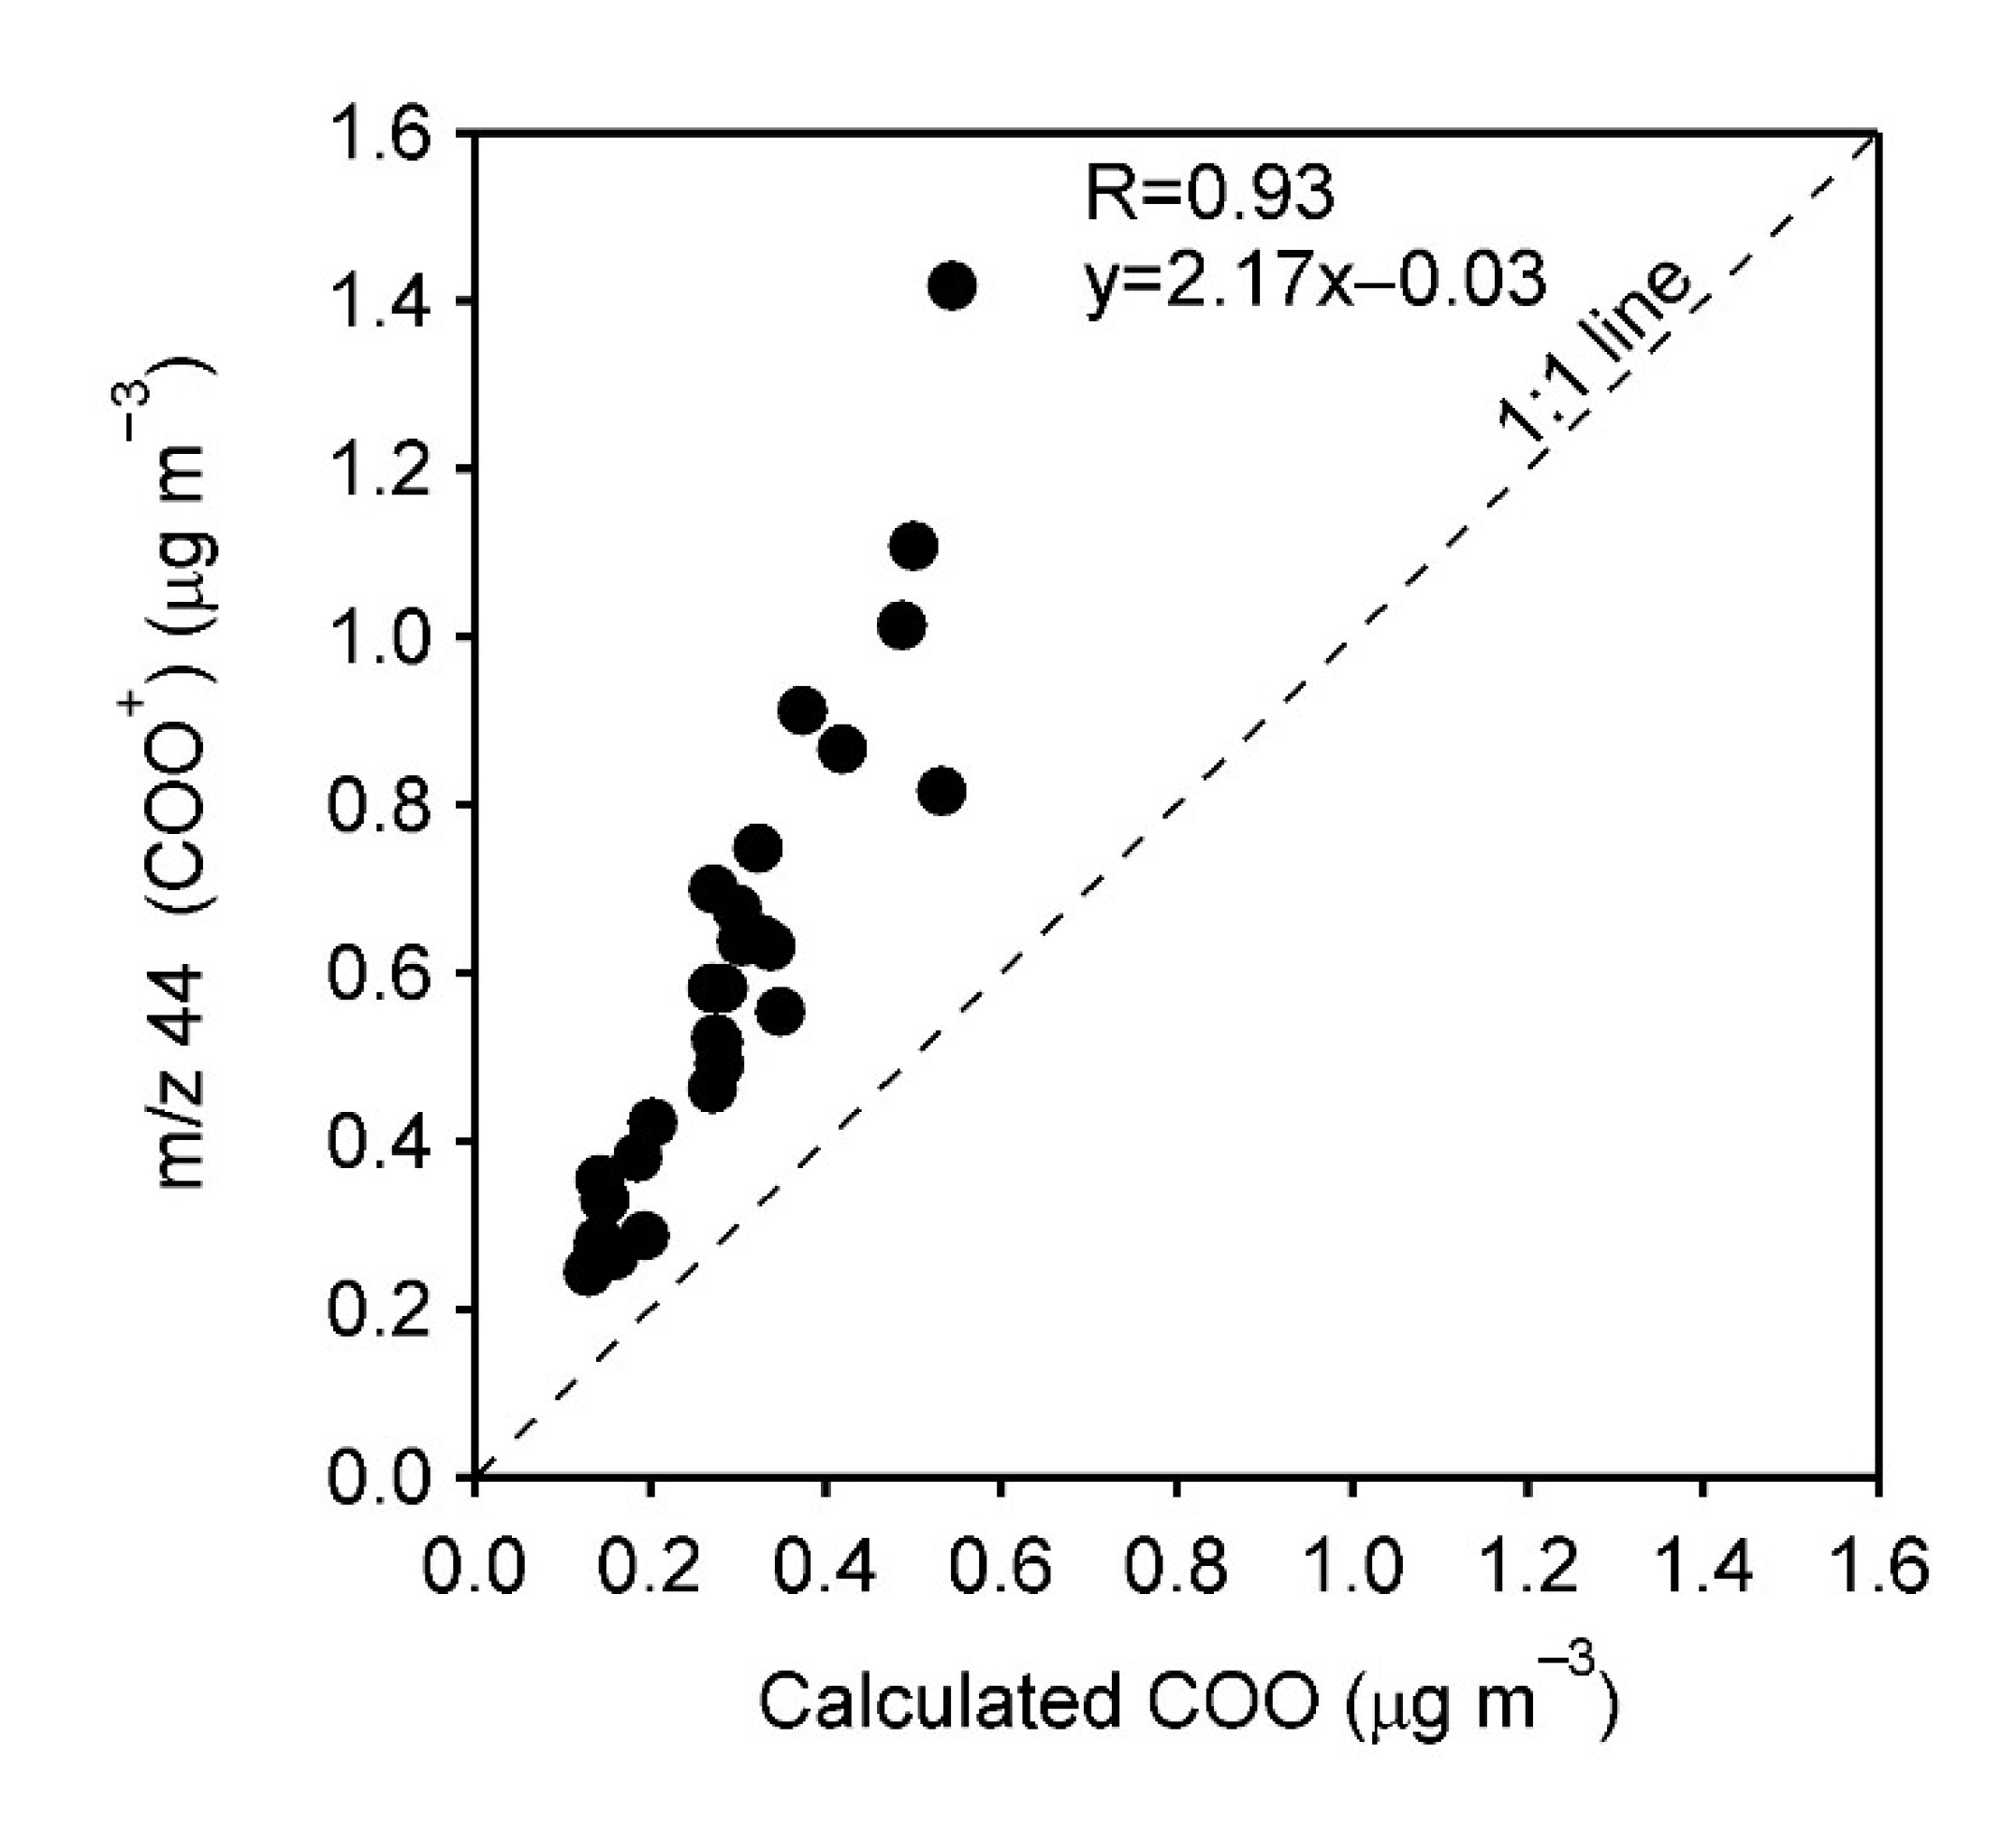
3.2. Temporal Variations and Comparison of m/z 44 Signal with COO of Total Carboxylic Acids
3.3. Diacids-Derived COO vs. OMAMS Ratios: Implication for Photochemical Processing during Long-Range Transport to Okinawa
4. Conclusions
Supplementary Materials
Author Contributions
Funding
Data Availability Statement
Acknowledgments
Conflicts of Interest
References
- Jacobson, M.C.; Hansson, H.C.; Noone, K.J.; Charlson, R.J. Organic atmospheric aerosols: Review and state of the science. Rev. Geophys. 2000, 38, 267–294. [Google Scholar] [CrossRef] [Green Version]
- Kanakidou, M.; Seinfeld, J.H.; Pandis, S.N.; Barnes, I.; Dentener, F.J.; Facchini, M.C.; Dingenen, R.V.; Ervens, B.; Nenes, A.; Nielsen, C.J.; et al. Organic aerosol and global climate modelling: A review. Atmos. Chem. Phys. 2005, 5, 1053–1123. [Google Scholar] [CrossRef] [Green Version]
- Saxena, P.; Hildemann, L.M. Water-soluble organics in atmospheric particles: A critical review of the literature and application of thermodynamics to identify candidate compounds. J. Atmos. Chem. 1996, 24, 57–109. [Google Scholar] [CrossRef]
- Seinfeld, J.H.; Pankow, J.F. Organic atmospheric particulate material. Ann. Rev. Phys. Chem. 2003, 54, 121–140. [Google Scholar] [CrossRef] [PubMed] [Green Version]
- Simoneit, B.R.T.; Radzibin, M.A.; Cass, G.R.; Rogge, W.F.; Mazurek, M.A.; Standley, L.J.; Hildemann, L.M. Natural organic compounds as tracer for biomass combustion in aerosols. In Biomass Burning and Global Change; MIT Press: Cambridge, UK, 1996; Volume 1, pp. 504–518. [Google Scholar]
- Pöschl, U. Atmospheric aerosols: Composition, transformation, climate and health effects. Angew. Chem. Int. Ed. 2005, 44, 7520–7540. [Google Scholar] [CrossRef] [PubMed]
- Kawamura, K. Secondary formation of water-soluble organic acids and α-dicarbonyls and their contribution to total carbon and water-soluble organic carbon: Photochemical ageing of organic aerosols in the Arctic spring. J. Geophys. Res. 2010, 115, D21306. [Google Scholar] [CrossRef] [Green Version]
- Brett, B.P.; Campuzano-Jost, P.; Day, D.A.; Ortega, A.M.; Fry, J.L.; Brown, S.S.; Zarzana, K.J.; Dube, W.; Wagner, N.L.; Draper, D.C.; et al. Secondary organic aerosol formation from in situ OH, O3, and NO3 oxidation of ambient forest air in an oxidation flow reactor. Atmos. Chem. Phys. 2017, 17, 5331–5354. [Google Scholar]
- Liu, J.; Chu, B.; Chen, T.; Liu, C.; Wang, L.; Bao, X.; He, H. Secondary Organic Aerosol Formation from Ambient Air at an Urban Site in Beijing: Effects of OH Exposure and Precursor Concentrations. Environ. Sci. Technol. 2018, 52, 6834–6841. [Google Scholar] [CrossRef]
- Sbai, S.E.; Li, C.; Boreave, A.; Charbonnel, N.; Perrier, S.; Vernoux, P.; Bentayeb, F.; George, C.; Gil, S. Atmospheric photochemistry and secondary aerosol formation of urban air in Lyon, France. J. Environ. Sci. 2021, 99, 311–323. [Google Scholar] [CrossRef]
- Kawamura, K.; Sakaguchi, F. Molecular distributions of water soluble dicarboxylic acids in marine aerosols over the Pacific Ocean including tropic. J. Geophys. Res. 1999, 104, 3501–3509. [Google Scholar] [CrossRef]
- Pavuluri, C.M.; Kawamura, K.; Swaminathan, T. Water-soluble organic carbon, dicarboxylic acids, ketoacids, and α-dicarbonyls in the tropical Indian aerosols. J. Geophys. Res. 2010, 115, D11302. [Google Scholar] [CrossRef] [Green Version]
- Kawamura, K.; Bikkina, S. A review of dicarboxylic acids and related compounds in atmospheric aerosols: Molecular distributions, sources and transformation. Atmos. Res. 2016, 170, 140–160. [Google Scholar] [CrossRef]
- Kawamura, K.; Ikushima, K. Seasonal changes in the distribution of dicarboxylic acids in the urban atmosphere. Environ. Sci. Technol. 1993, 27, 2227–2235. [Google Scholar] [CrossRef]
- Kawamura, K.; Kobayashi, M.; Tsubonuma, N.; Mochida, M.; Watanabe, T.; Lee, M. Organic and inorganic compositions of marine aerosols from East Asia: Seasonal variations of water soluble dicarboxylic acids, major ions, total carbon and nitrogen, and stable C and N isotopic composition. In Geochemical Investigation in Earth and Space Science; Elsevier: Amsterdam, The Netherlands, 2004; Volume 9, pp. 243–265. [Google Scholar]
- Kawamura, K.; Tachibana, E.; Okuzawa, K.; Aggarwal, S.G.; Kanaya, Y.; Wang, Z.F. High abundances of water-soluble dicarboxylic acids, ketocarboxylic acids and α-dicarbonyls in the mountaintop aerosols over the North China Plain during wheat burning season. Atmos. Chem. Phys. 2013, 13, 8285–8302. [Google Scholar] [CrossRef] [Green Version]
- Kawamura, K.; Yasui, O. Diurnal changes in the distribution of dicarboxylic acids, ketocarboxylic acids and dicarbonyls in the urban Tokyo atmosphere. Atmos. Environ. 2005, 39, 1945–1960. [Google Scholar] [CrossRef]
- Miyazaki, Y.; Aggarwal, S.G.; Singh, K.; Gupta, P.K.; Kawamura, K. Dicarboxylic acids and water-soluble organic carbon in aerosols in New Delhi, India in winter: Characteristics and formation processes. J. Geophys. Res. 2009, 114, D19206. [Google Scholar] [CrossRef] [Green Version]
- Cheng, C.; Wang, G.; Zhou, B.; Meng, J.; Li, J.; Cao, J.; Xiao, S. Comparison of dicarboxylic acids and related compounds in aerosol samples collected in Xi’an, China during haze and clean periods. Atmos. Environ. 2013, 81, 443–449. [Google Scholar] [CrossRef]
- Sempéré, R.; Kawamura, K. Trans-hemispheric contribution of C2-C10 α, ω-dicarboxylic acids, and related polar compounds to water-soluble organic carbon in the western Pacific aerosols in relation to photochemical oxidation reactions. Global Biogeochem. Cycles 2003, 17, 1069. [Google Scholar] [CrossRef] [Green Version]
- Fu, P.; Kawamura, K.; Usukura, K.; Miura, K. Dicarboxylic acids and related polar compounds in the marine aerosols collected during a round-the-world cruise. Mar. Chem. 2013, 148, 22–32. [Google Scholar] [CrossRef] [Green Version]
- Yang, J.; Zhao, W.; Wei, L.; Zhang, Q.; Zhao, Y.; Hu, W.; Wu, L.; Li, X.; Pavuluri, C.M.; Pan, X.; et al. Molecular and spatial distributions of dicarboxylic acids, oxocarboxylic acids, and α-dicarbonyls in marine aerosols from the South China Sea to the eastern Indian Ocean. Atmos. Chem. Phys. 2020, 20, 6841–6860. [Google Scholar] [CrossRef]
- Cooke, W.F.; Liousse, C.; Cachier, H.; Feichter, J. Construction of a 1° × 1° fossil fuel emission data set for carbonaceous aerosol and implementation and radiative impact in the ECHAM4 model. J. Geophys. Res. 1999, 104, 22137–22162. [Google Scholar] [CrossRef]
- Boreddy, S.K.R.; Kawamura, K.; Haque, M.M. Long-term (2001–2012) observation of the modeled hygroscopic growth factor of remote marine TSP aerosols over the western North Pacific: Impact of long-range transport of pollutants and their mixing states. Phys. Chem. Chem. Phys. 2015, 17, 29344–29353. [Google Scholar] [CrossRef] [PubMed] [Green Version]
- Ren, Y.; Zhou, B.; Tao, J.; Cao, J.; Zhang, Z.; Wu, C.; Wang, J.; Li, J.; Zhang, L.; Han, Y.; et al. Composition and size distribution of airborne particulate PAHs and oxygenated PAHs in two Chinese megacities. Atmos. Res. 2017, 183, 322–330. [Google Scholar] [CrossRef]
- Li, K.; Jacob, D.J.; Shen, L.; Lu, X.; de Smedt, I.; Liao, H. Increases in surface ozone pollution in China from 2013 to 2019: Anthropogenic and meteorological influences. Atmos. Chem. Phys. 2020, 20, 11423–11433. [Google Scholar] [CrossRef]
- Boreddy, S.K.R.; Kawamura, K.; Tachibana, E. Long-term (2001–2013) observations of water-soluble dicarboxylic acids and related compounds over the western North Pacific: Trends, seasonality and source apportionment. Sci. Rep. 2017, 7, 8518. [Google Scholar] [CrossRef]
- Kunwar, B.; Kawamura, K. One-year observations of carbonaceous and nitrogenous components and major ions in the aerosols from subtropical Okinawa Island, an outflow region of Asian dusts. Atmos. Chem. Phys. 2014, 14, 1819–1836. [Google Scholar] [CrossRef] [Green Version]
- Irei, S.; Takami, A.; Hayashi, M.; Sadanaga, Y.; Hara, K.; Kaneyasu, N.; Sato, K.; Arakaki, T.; Hatakeyama, S.; Bandow, H.; et al. Transboundary secondary organic aerosol in western Japan indicated by the δ13C of water-soluble organic carbon and the m/z 44 signal in organic aerosol mass spectra. Environ. Sci. Technol. 2014, 48, 6273–6281. [Google Scholar] [CrossRef]
- Bahreini, R.; Keywood, M.D.; Ng, N.L.; Varutbangkul, V.; Gao, S.; Flagan, R.C.; Seinfeld, J.H.; Worsnop, D.R.; Jimenez, J.L. Measurements of secondary organic aerosol from oxidation of cycloalkenes, terpenes, and m-xylene using an Aerodyne aerosol mass spectrometer. Environ. Sci. Technol. 2005, 39, 5674–5688. [Google Scholar] [CrossRef] [Green Version]
- Topping, D.; Coe, H.; McFiggans, G.; Burgess, R.; Allan, J.; Alfarra, M.R.; Bower, K.; Choularton, T.W.; Decesari, S.; Facchini, M.C. Aerosol Chemical Characteristics from Sampling Conducted on the Island of Jeju, Korea during ACE-Asia. Atmos. Environ. 2014, 38, 2111–2123. [Google Scholar] [CrossRef] [Green Version]
- Huang, X.-F.; He, L.-Y.; Hu, M.; Canagaratna, M.R.; Sun, Y.; Zhang, Q.; Zhu, T.; Xue, L.; Zeng, L.-W.; Liu, X.-G.; et al. Highly time-resolved chemical characterization of atmospheric submicron particles during 2008 Beijing Olympic Games using an Aerodyne High-Resolution Aerosol Mass Spectrometer. Atmos. Chem. Phys. 2010, 10, 8933–8945. [Google Scholar] [CrossRef] [Green Version]
- Xu, J.; Zhang, Q.; Li, X.; Ge, X.; Xiao, C.; Ren, J.; Qin, D. Dissolved Organic Matter and Inorganic Ions in a Central Himalayan Glacier—Insights into Chemical Composition and Atmospheric Sources. Environ. Sci. Technol. 2013, 47, 6181–6188. [Google Scholar] [CrossRef]
- Nordin, E.Z.; Eriksson, A.C.; Roldin, P.; Nilsson, P.T.; Carlsson, J.E.; Kajos, M.K.; Hellen, H.; Wittbom, C.; Rissler, J.; Londahl, J.; et al. Secondary Organic Aerosol Formation from Idling Gasoline Passenger Vehicle Emissions Investigated in a Smog Chamber. Atmos. Chem. Phys. 2013, 13, 6101–6116. [Google Scholar] [CrossRef] [Green Version]
- Haddad, I.E.; Marchand, N.; D’Anna, B.; Jaffrezo, J.L.; Wortham, H. Functional Group Composition of Organic Aerosol from Combustion Emissions and Secondary Processes at Two Contrasted Urban Environments. Atmos. Environ. 2013, 75, 308–320. [Google Scholar] [CrossRef] [Green Version]
- Sun, Y.; Jiang, Q.; Wang, Z.; Fu, P.; Li, J.; Yang, T.; Yin, Y. Investigation of the sources and evolution processes of severe haze pollution in Beijing in January 2013. J. Geophys. Res. Atmos. 2014, 119, 4380–4398. [Google Scholar] [CrossRef]
- Paatero, P. Least Squares Formulation of Robust Non-negative Factor Analysis. Chemom. Intell. Lab. Syst. 1997, 37, 23–35. [Google Scholar] [CrossRef]
- Canagaratna, M.R.; Jayne, J.T.; Ghertner, D.A.; Herndon, S.; Shi, Q.; Jimenez, J.L.; Silva, P.J.; Williams, P.; Lanni, T.; Drewnick, F.; et al. Chase studies of particulate emissions from in-use New York city vehicles. Aerosol Sci. Technol. 2004, 38, 555–573. [Google Scholar] [CrossRef]
- Canagaratna, M.R.; Jayne, J.T.; Jimenez, J.L.; Allan, J.D.; Alfarra, M.R.; Zhang, Q.; Onasch, T.B.; Drewnick, F.; Cae, H.; Middlebrook, A.; et al. Chemical and microphysical characterization of ambient aerosols with the aerodyne aerosol mass spectrometer. Mass Spectrom. Rev. 2007, 26, 185–222. [Google Scholar] [CrossRef] [PubMed]
- Takegawa, N.; Miyakawa, T.; Kawamura, K.; Kondo, Y. Contribution of selected dicarboxylic and ω-oxocarboxylic acids in ambient aerosol to the m/z 44 signal of an Aerodyne aerosol mass spectrometer. Aerosol Sci. Technol. 2007, 41, 418–437. [Google Scholar] [CrossRef] [Green Version]
- Yatavelli, R.L.N.; Stark, H.; Day, D.A.; Thompson, S.L.; Campuzano-Jost, P.; Palm, B.B.; Vogel, A.L.; Hoffmann, T.; Äijälä, M.; Ng, N.L.; et al. Estimating the contribution of organic acids to northern hemispheric continental organic aerosol. Geophys. Res. Lett. 2015, 42, 6084–6090. [Google Scholar] [CrossRef]
- Zhang, Q.; Worsnop, D.R.; Canagaratna, M.R.; Jimenez, J.L. Hydrocarbon-like and Oxygenated Organic Aerosols in Pittsburgh: Insights into Sources and Processes of Organic Aerosols. Atmos. Chem. Phys. 2005, 5, 3289–3311. [Google Scholar] [CrossRef] [Green Version]
- Kondo, Y.; Miyazaki, Y.; Takegawa, N.; Miyakawa, T.; Weber, R.J.; Jimenez, J.L.; Zhang, Q.; Worsnop, D.R. Oxygenated and water-soluble organic aerosols in Tokyo. J. Geophys. Res. 2007, 112, D01203. [Google Scholar] [CrossRef]
- Russell, L.M.; Bahadur, R.; Hawkins, L.N.; Allan, J.; Baumgardner, D.; Quinn, P.K.; Bates, T.S. the Organic aerosol characterization by complementary measurements of chemical bonds and molecular fragments. Atmos. Environ. 2009, 43, 6100–6105. [Google Scholar] [CrossRef]
- Duplissy, J.; DeCarlo, P.F.; Dommen, J.; Alfarra, M.R.; Metzger, A.; Barmpadimos, I.; Prévôt, A.S.H.; Weingartner, E.; Tritscher, T.; Gysel, M.; et al. Relating hygroscopicity and composition of organic aerosol particulate matter. Atmos. Chem. Phys. 2011, 11, 1155–1165. [Google Scholar] [CrossRef] [Green Version]
- Yatavelli, R.L.N.; Stark, H.; Thompson, S.L.; Kimmel, J.R.; Cubison, M.J.; Day, D.A.; Campuzano-Jost, P.; Palm, B.B.; Hodzic, A.; Thornton, J.A.; et al. Semicontinuous measurements of gas–particle partitioning of organic acids in a ponderosa pine forest using a MOVI-HRToF-CIMS. Atmos. Chem. Phys. 2014, 14, 1527–1546. [Google Scholar] [CrossRef] [Green Version]
- Faber, P.; Drewnick, F.; Bierl, R.; Borrmann, S. Complementary online and offline the F.T. Aerosol Mass Spectrometry-I.R. spectroscopy measurements: Prospects and challenges for the analysis of anthropogenic aerosol particle emissions. Atmos. Environ. 2017, 166, 92–98. [Google Scholar] [CrossRef]
- Takami, A.; Miyoshi, T.; Shimono, A.; Kaneyasu, N.; Kato, S.; Kajii, Y.; Hatakeyama, S. Transport of anthropogenic aerosols from Asia and subsequent chemical transformation. J. Geophys. Res. 2007, 112, D22S31. [Google Scholar] [CrossRef]
- Kunwar, B.; Kawamura, K. Seasonal distributions and sources of low molecular weight dicarboxylic acids, ω-oxocarboxylic acids, pyruvic acid, α-dicarbonyls and fatty acids in ambient aerosols from subtropical Okinawa in the western Pacific rim. Environ. Chem. 2014, 11, 673–689. [Google Scholar] [CrossRef]
- Mochida, M.; Kawamura, K.; Umemoto, N.; Kobayashi, M.; Matsunaga, S.; Lim, H.; Turpin, B.J.; Bates, T.S.; Simoneit, B.R.T. Spatial distribution of oxygenated organic compounds (dicarboxylic acids, fatty acids and levoglucosan) in marine aerosols over the western Pacific and off coasts of East Asia: Asian outflow of organic aerosols during the ACE-Asia campaign. J. Geophys. Res. 2003, 108, 8638. [Google Scholar] [CrossRef]
- Jimenez, J.L.; Jayne, J.T.; Shi, Q.; Kolb, C.E.; Worsnop, D.R.; Yourshaw, I.; Seinfeld, J.H.; Flagan, R.C.; Zhang, X.; Smith, K.A.; et al. Ambient aerosol sampling using the Aerodyne aerosol mass spectrometer. J. Geophys. Res. 2003, 108, 8425. [Google Scholar] [CrossRef] [Green Version]
- Takami, A.; Miyoshi, T.; Shimono, A.; Hatakeyama, S. Chemical composition of fine aerosol measured by AMS at Fukue Island, Japan, during APEX period. Atmos. Environ. 2005, 39, 4913–4924. [Google Scholar] [CrossRef]
- Jayne, J.T.; Leard, D.C.; Zhang, X.; Davidovits, P.; Smith, K.A.; Kolb, C.E.; Worsnop, D.R. Development of an aerosol mass spectrometer for size and composition analysis of submicron particles. Aerosol Sci. Technol. 2000, 33, 49–70. [Google Scholar] [CrossRef] [Green Version]
- Allan, J.D.; Jimenez, J.L.; Williams, P.I.; Alfarra, M.R.; Bower, K.N.; Jayne, J.T.; Coe, H.; Worsnop, D.R. Quantitative Sampling using an Aerodyne Aerosol Mass Spectrometer, 1, Techniques of Data Interpretation and Error Analysis. J. Geophys. Res. 2003, 108, 4090. [Google Scholar]
- Allan, J.D.; Alfarra, M.R.; Bower, K.N.; Williams, P.I.; Gallagher, M.W.; Jimenez, J.L.; McDonald, A.G.; Nemitz, E.; Canagaratna, M.R.; Jayne, J.T.; et al. Quantitative Sampling using an Aerodyne Aerosol Mass Spectrometer, 2, Measurements of Fine Particulate Chemical Composition in Two U.K. Cities. J. Geophys. Res. 2003, 108, 4091. [Google Scholar]
- Takegawa, N.; Miyazaki, Y.; Kondo, Y.; Komazaki, Y.; Miyakawa, T.; Jimenez, J.L.; Jayne, J.T.; Worsnop, D.R.; Allan, J.D.; Weber, R.J. Characterization of an Aerodyne Aerosol Mass Spectrometer (AMS): Intercomparison with Other Aerosol Instruments. Aerosol Sci. Technol. 2005, 39, 760–770. [Google Scholar] [CrossRef]
- Sorooshian, A.; Murphy, M.S.; Herrsey, S.; Bahreini, R.; Jonsson, H.; Flagan, C.R.; Seinfeld, J.H. Constraining the contribution of organic acids and AMS. m/z 44 to the organic aerosol budget: On the importance of meteorology, aerosol hygroscopicity, and region. J. Geophys. Res. Lett. 2010, 37, L21807. [Google Scholar] [CrossRef] [Green Version]
- Canagaratna, M.R.; Jimenez, J.L.; Kroll, J.; Chen, Q.; Kessler, S.; Massoli, P.; Ruiz, L.H.; Fortner, E.; Williams, L.; Wilson, K.; et al. Elemental ratio measurements of organic compounds using Aerosol mass spectrometry: Characterization, improved calibration, and implications. Atmos. Chem. Phys. 2015, 15, 253–272. [Google Scholar] [CrossRef] [Green Version]
- Alfarra, M.R. Insights into Atmospheric Organic Aerosols Using an AEROSOL Mass Spectrometer. PhD Thesis, Department of Chemical Engineering, UMIST, Manchester, UK, 2004. [Google Scholar]
- Zhang, Q.; Canagaratna, M.R.; Jayne, J.T.; Worsnop, D.R.; Jimenez, J.L. Time and Size-Resolved Chemical Composition of Submicron Particles in Pittsburgh. Implications for Aerosol Sources and Processes. J. Geophys. Res. 2005, 110, D07S09. [Google Scholar] [CrossRef] [Green Version]
- Weber, R.J.; Orsini, D.; Daun, Y.; Lee, Y.N.; Klotz, P.J.; Brechtel, F. A Particle-Into-Liquid Collector for rapid measurements of aerosol bulk chemical composition. Aerosol Sci. Technol. 2001, 35, 718–727. [Google Scholar] [CrossRef] [Green Version]
- Quinn, P.K.; Bates, T.S.; Coffman, D.; Onasch, T.B.; Worsnop, D.; Baynard, T.; de Gouw, J.A.; Goldan, P.D.; Kuster, W.C.; Williams, E.; et al. Impacts of Sources and Aging on Submicrometer Aerosol Properties in the Marine Boundary Layer Across the Gulf of Maine. J. Geophys. Res.-Atmos. 2006, 111, D23S36. [Google Scholar] [CrossRef]
- Drewnick, F.; Schwab, J.J.; Jayne, J.T.; Canagaratna, M.; Worsnop, D.R.; Demerjian, K.L. Measurement of Ambient Aerosol Composition During the PMTACS-NY 2001 Using an Aerosol Mass Spectrometer. Part I: Mass Concentrations. Aerosol Sci. Technol. 2004, 38 (Suppl. S1), 92–103. [Google Scholar] [CrossRef]
- Allan, J.D.; Delia, A.E.; Coe, H.; Bower, K.N.; Alfarra, M.R.; Jimenez, J.L.; Middlebrook, A.M.; Drewnick, F.; Onasch, T.B.; Canagaratna, M.R.; et al. A generalised method for the extraction of chemically resolved mass spectra from Aerodyne aerosol mass spectrometer data (Technical Note). J. Aerosol Sci. 2004, 35, 909–922. [Google Scholar] [CrossRef]
- Drewnick, F.; Hings, S.S.; Alfarra, M.R.; Prevot, A.S.H.; Borrmann, S. Aerosol quantification with the aerodyne aerosol mass spectrometer: Detection limits and ionizer background effects. Atmos. Meas. Tech. 2009, 2, 33–46. [Google Scholar] [CrossRef] [Green Version]
- Hogrefe, O.; Drewnick, F.; Lala, G.G.; Schwab, J.J.; Demerjian, K.L. Development, operation and applications of an aerosol generation, calibration and research facility. Aerosol Sci. Technol. 2004, 38, 196–214. [Google Scholar] [CrossRef] [Green Version]
- Weimer, S.; Drewnick, F.; Hogrefe, O.; Schwab, J.J.; Rhodes, K.; Orsini, D.; Canagaratna, M.; Worsnop, D.R.; Demerjian, K.L. Size-Selective Nonrefractory Ambient Aerosol Measurements during the Particulate Matter Technology Assessment and Characterization Study-New York 2004 Winter Intensive in New York City. J. Geophys. Res. Atmos. 2006, 111, D18305. [Google Scholar] [CrossRef] [Green Version]
- Crosier, J.; Jimenez, J.L.; Allan, J.D.; Bower, K.N.; Williams, P.I.; Alfarra, M.R.; Canagaratna, M.R.; Jayne, J.T.; Worsnop, D.R.; Coe, H. Technical Note: Description and Use of the New Jump Mass Spectrum Mode of Operation for the Aerodyne Quadrupole Aerosol Mass Spectrometers (Q-AMS). Aerosol Sci. Technol. 2007, 41, 865–872. [Google Scholar] [CrossRef]
- Slowik, J.G.; Stainken, K.; Davidovits, P.; Williams, L.R.; Jayne, J.T.; Kolb, C.E.; Worsnop, D.R.; Rudich, Y.; DeCarlo, P.F.; Jimenez, J.L. Particle Morphology and Density Characterization by Combined Mobility and Aerodynamic Diameter Measurements. Part 2: Application to Combustion Generated Soot Particles as a Function of Fuel Equivalence Ratio. Aerosol Sci. Technol. 2004, 38, 1206–1222. [Google Scholar] [CrossRef]
- Roberts, J.D.; Caserio, M.C. Basic Principles of Organic Chemistry; Benjamin: New York, NY, USA, 1964. [Google Scholar]
- Aiken, A.C.; DeCarlo, P.F.; Jimenez, J.L. Elemental Analysis of Organic Species with Electron Ionization High-Resolution Mass Spectrometry. Anal. Chem. 2007, 79, 8350–8358. [Google Scholar] [CrossRef]
- Ervens, B.; Feingold, G.; Frost, G.J.; Kreidenweis, S.M. A modelling study of aqueous production of dicarboxylic acids: 1. Chemical pathways and speciated organic mass production. J. Geophys. Res. 2004, 109, D15205. [Google Scholar] [CrossRef]
- Legrand, M.; Preunkert, S.; Oliveira, T.; Pio, C.A.; Hammer, S.; Gelencsér, A.; Kasper-Giebl, A.; Laj, P. Origin of C2-C5 dicarboxylic acids in the European atmosphere inferred from year-around aerosol study conducted at a west-east transect. J. Geophys. Res. 2007, 112, D23S07. [Google Scholar] [CrossRef]
- Kunwar, B.; Torii, K.; Zhu, C.; Fu, P.; Kawamura, K. Springtime variations of organic and inorganic constituents in submicron aerosols (PM1.0) from Cape Hedo, Okinawa. Atmos. Environ. 2016, 130, 84–94. [Google Scholar] [CrossRef]
- Kunwar, B.; Kawamura, K.; Zhu, C. Stable carbon and nitrogen isotopic compositions of ambient aerosols collected from Okinawa Island in the western North Pacific Rim, an outflow region of Asian dusts and pollutants. Atmos. Environ. 2016, 131, 243–253. [Google Scholar] [CrossRef] [Green Version]
- Kunwar, B.; Torii, K.; Zhu, C.; Kawamura, K. Springtime influences of Asian outflow and photochemistry on the distributions of diacids, oxoacids and α-dicarbonyls in the aerosols from the western North Pacific rim. Tellus B 2017, 69, 1369341. [Google Scholar] [CrossRef] [Green Version]
- Bikkina, S.; Kawamura, K.; Sakamoto, Y.; Hirokawa, J. Low molecular weight dicarboxylic acids, oxocarboxylic acids and α-dicarbonyls as ozonolysis products of isoprene: Implication for the gaseous-phase formation of secondary organic aerosols. Sci. Total Environ. 2021, 769, 144472. [Google Scholar] [CrossRef] [PubMed]
- Kawamura, K.; Gagosian, R.B. Implications of ω-oxocarboxylic acids in the remote marine atmosphere for photo-oxidation of unsaturated fatty acids. Nature 1987, 325, 330–332. [Google Scholar] [CrossRef]
- Kawamura, K.; Ng, L.L.; Kaplan, I.R. Determination of organic-acids (C1-C10) in the atmosphere, motor exhausts, and engine oils. Environ. Sci. Technol. 1985, 19, 1082–1086. [Google Scholar] [CrossRef]
- Mochizuki, T.; Kawamura, K.; Nakamura, S.; Kanaya, Y.; Wang, Z. Enhanced levels of atmospheric low-molecular weight monocarboxylic acids in gas and particulates over Mt. Tai in the North China Plain during field burning of agricultural wastes. Atmos. Environ. 2017, 171, 237–247. [Google Scholar] [CrossRef]
- Chen, Y.; Guo, H.; Nah, T.; Tanner, D.J.; Sullivan, A.P.; Takeuchi, M.; Gao, Z.; Vasilakos, P.; Russell, A.G.; Baumann, K.; et al. Low-Molecular-Weight Carboxylic Acids in the Southeastern U.S.: Formation, Partitioning, and Implications for Organic Aerosol Aging. Environ. Sci. Technol. 2021, 55, 6688–6699. [Google Scholar] [CrossRef]
- Deshmukh, D.K.; Kawamura, K.; Lazaar, M.; Kunwar, B.; Boreddy, S.K.R. Dicarboxylic acids, oxoacids, benzoic acid, α-dicarbonyls, WSOC, OC, and ions in spring aerosols from Okinawa Island in the western North Pacific Rim: Size distributions and formation processes. Atmos. Chem. Phys. 2016, 16, 5263–5282. [Google Scholar] [CrossRef] [Green Version]
- Gowda, D.; Kawamura, K.; Tachibana, E. Identification of hydroxy- and keto-dicarboxylic acids in remote marine aerosols using gas chromatography/quadruple and time-of-flight mass spectrometry, Rapid Commun. Mass Spectrom. 2016, 30, 992–1000. [Google Scholar]
- Gowda, D.; Kawamura, K. Seasonal variations of low molecular weight hydroxy-dicarboxylic acids and oxaloacetic acid in remote marine aerosols from Chichijima Island in the western North Pacific (December 2010–November 2011). Atmos. Res. 2018, 204, 128–135. [Google Scholar] [CrossRef]
- Kawamura, K.; Gagosian, R.B. Identification of isomeric hydroxy fatty acids in aerosol samples by capillary gas chromatography-mass spectrometry. J. Chromatogr. 1988, 438, 309–317. [Google Scholar] [CrossRef]
- Kawamura, K.; Gagosian, R.B. Identification of aliphatic ketocarboxylic acids in marine aerosols using capillary gas chromatography-mass spectrometry. J. Chromatogr. 1988, 438, 299–307. [Google Scholar] [CrossRef]
- Kawamura, K.; Gagosian, R.B. Mid-chain ketocarboxylic acids in the remote marine atmosphere: Distribution patterns and possible formation mechanisms. J. Atmos. Chem. 1990, 11, 107–122. [Google Scholar] [CrossRef]
- Mochizuki, T.; Kawamura, K.; Miyazaki, Y.; Kunwar, B.; Boreddy, S.K.R. Distributions and sources of low-molecular-weight monocarboxylic acids in gas and particles from a deciduous broadleaf forest in northern Japan. Atmos. Chem. Phys. 2019, 19, 2421–2432. [Google Scholar] [CrossRef] [Green Version]
- Kawamura, K.; Imai, Y.; Barrie, L.A. Photochemical production and loss of organic acids in high Arctic aerosols during long range transport and polar sunrise ozone depletion events. Atmos. Environ. 2005, 39, 599–614. [Google Scholar] [CrossRef] [Green Version]
- Zhang, Q.; Stanier, C.O.; Canagaratna, M.R.; Jayne, J.T.; Worsnop, D.R.; Pandis, S.N.; Jimenez, J.L. Insights into the chemistry of new particle formation and growth events in Pittsburgh based on aerosol mass spectrometry. Environ. Sci. Technol. 2004, 38, 4797–4809. [Google Scholar] [CrossRef] [PubMed]
- Kawamura, K.; Kasukabe, H.; Barrie, L.A. Source and reaction pathways of dicarboxylic acids, ketoacids and dicarbonyls in arctic aerosols: One year of observations. Atmos. Environ. 1996, 30, 1709–1722. [Google Scholar] [CrossRef]
- Jung, J.; Tsatsral, B.; Kim, Y.J.; Kawamura, K. Organic and inorganic aerosol compositions in Ulaanbaatar, Mongolia during the cold winter of 2007 to 2008: Dicarboxylic acids, ketocarboxylic acids, α-dicarbonyls, OC, EC, water-soluble OC, and inorganic ions. J. Geophys. Res. 2010, 150, D22203. [Google Scholar] [CrossRef] [Green Version]
- Kundu, S.; Kawamura, K.; Lee, M. Seasonal variation of the concentrations of nitrogenous species and their nitrogen isotopic ratios in aerosols at Gosan, Jeju Island: Implications for atmospheric processing and source changes of aerosols. J. Geophys. Res. 2010, 115, D20305. [Google Scholar] [CrossRef]
- Pavuluri, C.M.; Kawamura, K.; Kikuta, M.; Tachibana, E.; Aggarwal, S.G. Time-resolved variations in the distributions of inorganic ions, carbonaceous components, dicarboxylic acids and related compounds in atmospheric aerosols from Sapporo, northern Japan during summertime. Atmos. Environ. 2012, 62, 622–630. [Google Scholar] [CrossRef] [Green Version]
- Kunwar, B.; Kawamura, K.; Fujiwara, S.; Fu, P.; Miyazaki, Y.; Pokhrel, A. Dicarboxylic acids, oxocarboxylic acids and α-dicarbonyls in atmospheric aerosols from Mt. Fuji, Japan: Implication for primary emission versus secondary formation. Atmos. Res. 2019, 221, 58–79. [Google Scholar] [CrossRef]
- Aggarwal, S.G.; Kawamura, K. Molecular distributions and stable carbon isotopic compositions of dicarboxylic acids and related compounds in the aerosols from Sapporo, Japan: Implications for the photochemical aging during long-range atmospheric transport. J. Geophys. Res. 2008, 113, D14301. [Google Scholar] [CrossRef] [Green Version]
- Chang, J.H.; Root, B. On the Relationship between Mean Monthly Global Radiation and Air Temperature. Arch. Met. Geoph. Biokl. Ser. B 1975, 23, 13–30. [Google Scholar] [CrossRef]
- Turpin, B.J.; Lim, H.J. Species contributions to PM2.5 mass concentrations: Revisiting common assumptions for estimating organic mass. Aerosol Sci. Technol. 2001, 35, 602–610. [Google Scholar] [CrossRef]
- Cui, H.; Mao, P.; Zhao, Y.; Nielsen, C.P.; Zhang, J. Patterns in Atmospheric Carbonaceous Aerosols in China: Emission Estimates and Observed Concentrations. Atmos. Chem. Phys. 2015, 15, 8657–8678. [Google Scholar] [CrossRef] [Green Version]
- Turpin, B.J.; Huntzicker, J.J. Identification of secondary organic aerosol episodes and quantification of primary and secondary organic aerosol concentrations during SCAQS. Atmos. Environ. 1995, 29, 3527–3544. [Google Scholar] [CrossRef]
- Cao, J.J.; Lee, S.C.; Ho, K.F.; Zhang, X.Y.; Zou, S.C.; Fung, K.K.; Chow, J.C.; Watson, J.G. Characteristics of carbonaceous aerosol in Pearl River Delta region, China during 2001 winter period. Atmos. Environ. 2003, 37, 1451–1460. [Google Scholar] [CrossRef]
- Jimenez, J.L.; Canagaratna, M.R.; Donahue, N.M.; Prevot, A.S.; Zhang, Q.; Kroll, J.H.; DeCarlo, P.F.; Allan, J.D.; Coe, H.; Ng, N.L.; et al. Evolution of organic aerosols in the atmosphere. Science 2009, 326, 1525–1529. [Google Scholar] [CrossRef]
- Zhang, Q.; Jimenez-Palacios, J.; Canagaratna, M.R.; Allan, J.D.; Coe, H.; Ulbrich, I.; Alfarra, M.R.; Takami, A.; Middlebrook, A.M.; Sun, Y.L.; et al. Ubiquity and dominance of oxygenated species in organic aerosols in anthropogenically-influenced Northern Hemisphere midlatitudes. Geophys. Res. Lett. 2007, 34, L13801. [Google Scholar] [CrossRef] [Green Version]
- Millet, D.B.; Donahue, N.M.; Pandis, S.N.; Polidori, A.; Stanier, C.O.; Turpin, B.J.; Goldstein, A.H. Atmospheric volatile organic compound measurements during the Pittsburgh Air Quality Study: Results, interpretation and quantification of primary and secondary contributions. J. Geophys. Res. 2005, 110, D07S07. [Google Scholar] [CrossRef]
- Williams, B.J.; Goldstein, A.H.; Millet, D.B.; Holzinger, R.; Kreisberg, N.M.; Hering, S.V.; White, A.B.; Worsnop, D.R.; Allan, J.D.; Jimenez, J.L. Chemical speciation of organic aerosol during the International Consortium for Atmospheric Research on Transport and Transformation 2004: Results from in situ measurements. J. Geophys. Res. 2007, 112, D10S26. [Google Scholar] [CrossRef] [Green Version]
- Holzinger, R.; Millet, D.B.; Williams, B.; Lee, A.; Kreisberg, N.; Hering, S.V.; Jimenez, J.; Allan, J.D.; Worsnop, D.R.; Goldstein, A.H. Emission, oxidation, and secondary organic aerosol formation of volatile organic compounds as observed at Chebogue Point, Nova Scotia. J. Geophys. Res. Atmos. 2007, 112, D10S24. [Google Scholar] [CrossRef]
- de Gouw, J.A.; Middlebrook, A.M.; Warneke, C.; Goldan, P.D.; Kuster, W.C.; Roberts, J.M.; Fehsenfeld, F.C.; Worsnop, D.R.; Canagaratna, M.R.; Pszenny, A.A.P.; et al. The budget of organic carbon in a polluted atmosphere: Results from the New England air quality study in 2002. J. Geophys. Res.-Atmos. 2005, 110, D16305. [Google Scholar] [CrossRef]
- Aiken, A.C.; DeCarlo, P.F.; Kroll, J.H.; Worsnop, D.R.; Huffman, J.A.; Docherty, K.; Ulbrich, I.M.; Mohr, C.; Kimmel, J.R.; Sueper, D.; et al. O/C and OM/OC ratios of primary, secondary, and ambient organic aerosols with high resolution time-of-flight aerosol mass spectrometry. Environ. Sci. Technol. 2008, 42, 4478–4485. [Google Scholar] [CrossRef]
- Kleinman, L.I.; Springston, S.R.; Daum, P.H.; Lee, Y.N.; Nunnermacker, L.J.; Senum, G.I.; Wang, J.; Weinstein-Lloyd, J.; Alexander, M.L.; Hubbe, J.; et al. The time evolution of aerosol composition over the Mexico City plateau. Atmos. Chem. Phys. 2008, 8, 1559–1575. [Google Scholar] [CrossRef] [Green Version]
- Ng, N.L.; Canagaratna, M.R.; Zhang, Q.; Jimenez, J.L.; Tian, J.; Ulbrich, I.M.; Kroll, J.H.; Docherty, K.S.; Chhabra, P.S.; Bahreini, R.; et al. Organic aerosol components observed in northern hemispheric datasets measured with aerosol mass spectrometry. Atmos. Chem. Phys. 2010, 10, 4625–4641. [Google Scholar] [CrossRef] [Green Version]
- Sato, K.; Takami, A.; Isozaki, T.; Hikida, T.; Shimono, A.; Imamura, T. Mass spectrometric study of secondary organic aerosol formed from the photo-oxidation of aromatic hydrocarbons. Atmos. Environ. 2010, 44, 1080–1087. [Google Scholar] [CrossRef]
- Docherty, K.S.; Corse, E.W.; Jaoui, M.; Offenberg, J.H.; Kleindienst, T.E.; Krug, J.D.; Riedel, T.P.; Lewandowski, M. Trends in the oxidation and relative volatility of chamber-generated secondary organic aerosol. Aerosol Sci. Technol. 2018, 52, 992–1004. [Google Scholar] [CrossRef]
- Jang, M.; Kamens, R.M. Characterization of secondary aerosol from the photooxidation of toluene in the presence of NOx and 1-propene. Environ. Sci. Tehcnol. 2001, 35, 3626–3639. [Google Scholar] [CrossRef]
- Hamilton, J.F.; Webb, P.J.; Lewis, A.C.; Reviejo, M.M. Quantifying small molecules in secondary organic aerosol formed during the photo-oxidation of toluene with hydroxyl radicals. Atmos. Environ. 2005, 39, 7263–7275. [Google Scholar] [CrossRef]
- Sato, K.; Hatakeyama, S.; Imamura, T. Secondary organic aerosol formation during the photooxidation of toluene: NOx dependence of chemical composition. J. Phys. Chem. A 2007, 111, 9796–9808. [Google Scholar] [CrossRef] [PubMed]


Publisher’s Note: MDPI stays neutral with regard to jurisdictional claims in published maps and institutional affiliations. |
© 2022 by the authors. Licensee MDPI, Basel, Switzerland. This article is an open access article distributed under the terms and conditions of the Creative Commons Attribution (CC BY) license (https://creativecommons.org/licenses/by/4.0/).
Share and Cite
Kunwar, B.; Torii, K.; Aggarwal, S.G.; Takami, A.; Kawamura, K. Comparisons of GC-Measured Carboxylic Acids and AMS m/z 44 Signals: Contributions of Organic Acids to m/z 44 Signals in Remote Aerosols from Okinawa Island. Appl. Sci. 2022, 12, 8017. https://doi.org/10.3390/app12168017
Kunwar B, Torii K, Aggarwal SG, Takami A, Kawamura K. Comparisons of GC-Measured Carboxylic Acids and AMS m/z 44 Signals: Contributions of Organic Acids to m/z 44 Signals in Remote Aerosols from Okinawa Island. Applied Sciences. 2022; 12(16):8017. https://doi.org/10.3390/app12168017
Chicago/Turabian StyleKunwar, Bhagawati, Kazuhiro Torii, Shankar G. Aggarwal, Akinori Takami, and Kimitaka Kawamura. 2022. "Comparisons of GC-Measured Carboxylic Acids and AMS m/z 44 Signals: Contributions of Organic Acids to m/z 44 Signals in Remote Aerosols from Okinawa Island" Applied Sciences 12, no. 16: 8017. https://doi.org/10.3390/app12168017