
Improved YOLOv5: Efficient Object Detection Using Drone Images under Various Conditions

Abstract
:1. Introduction
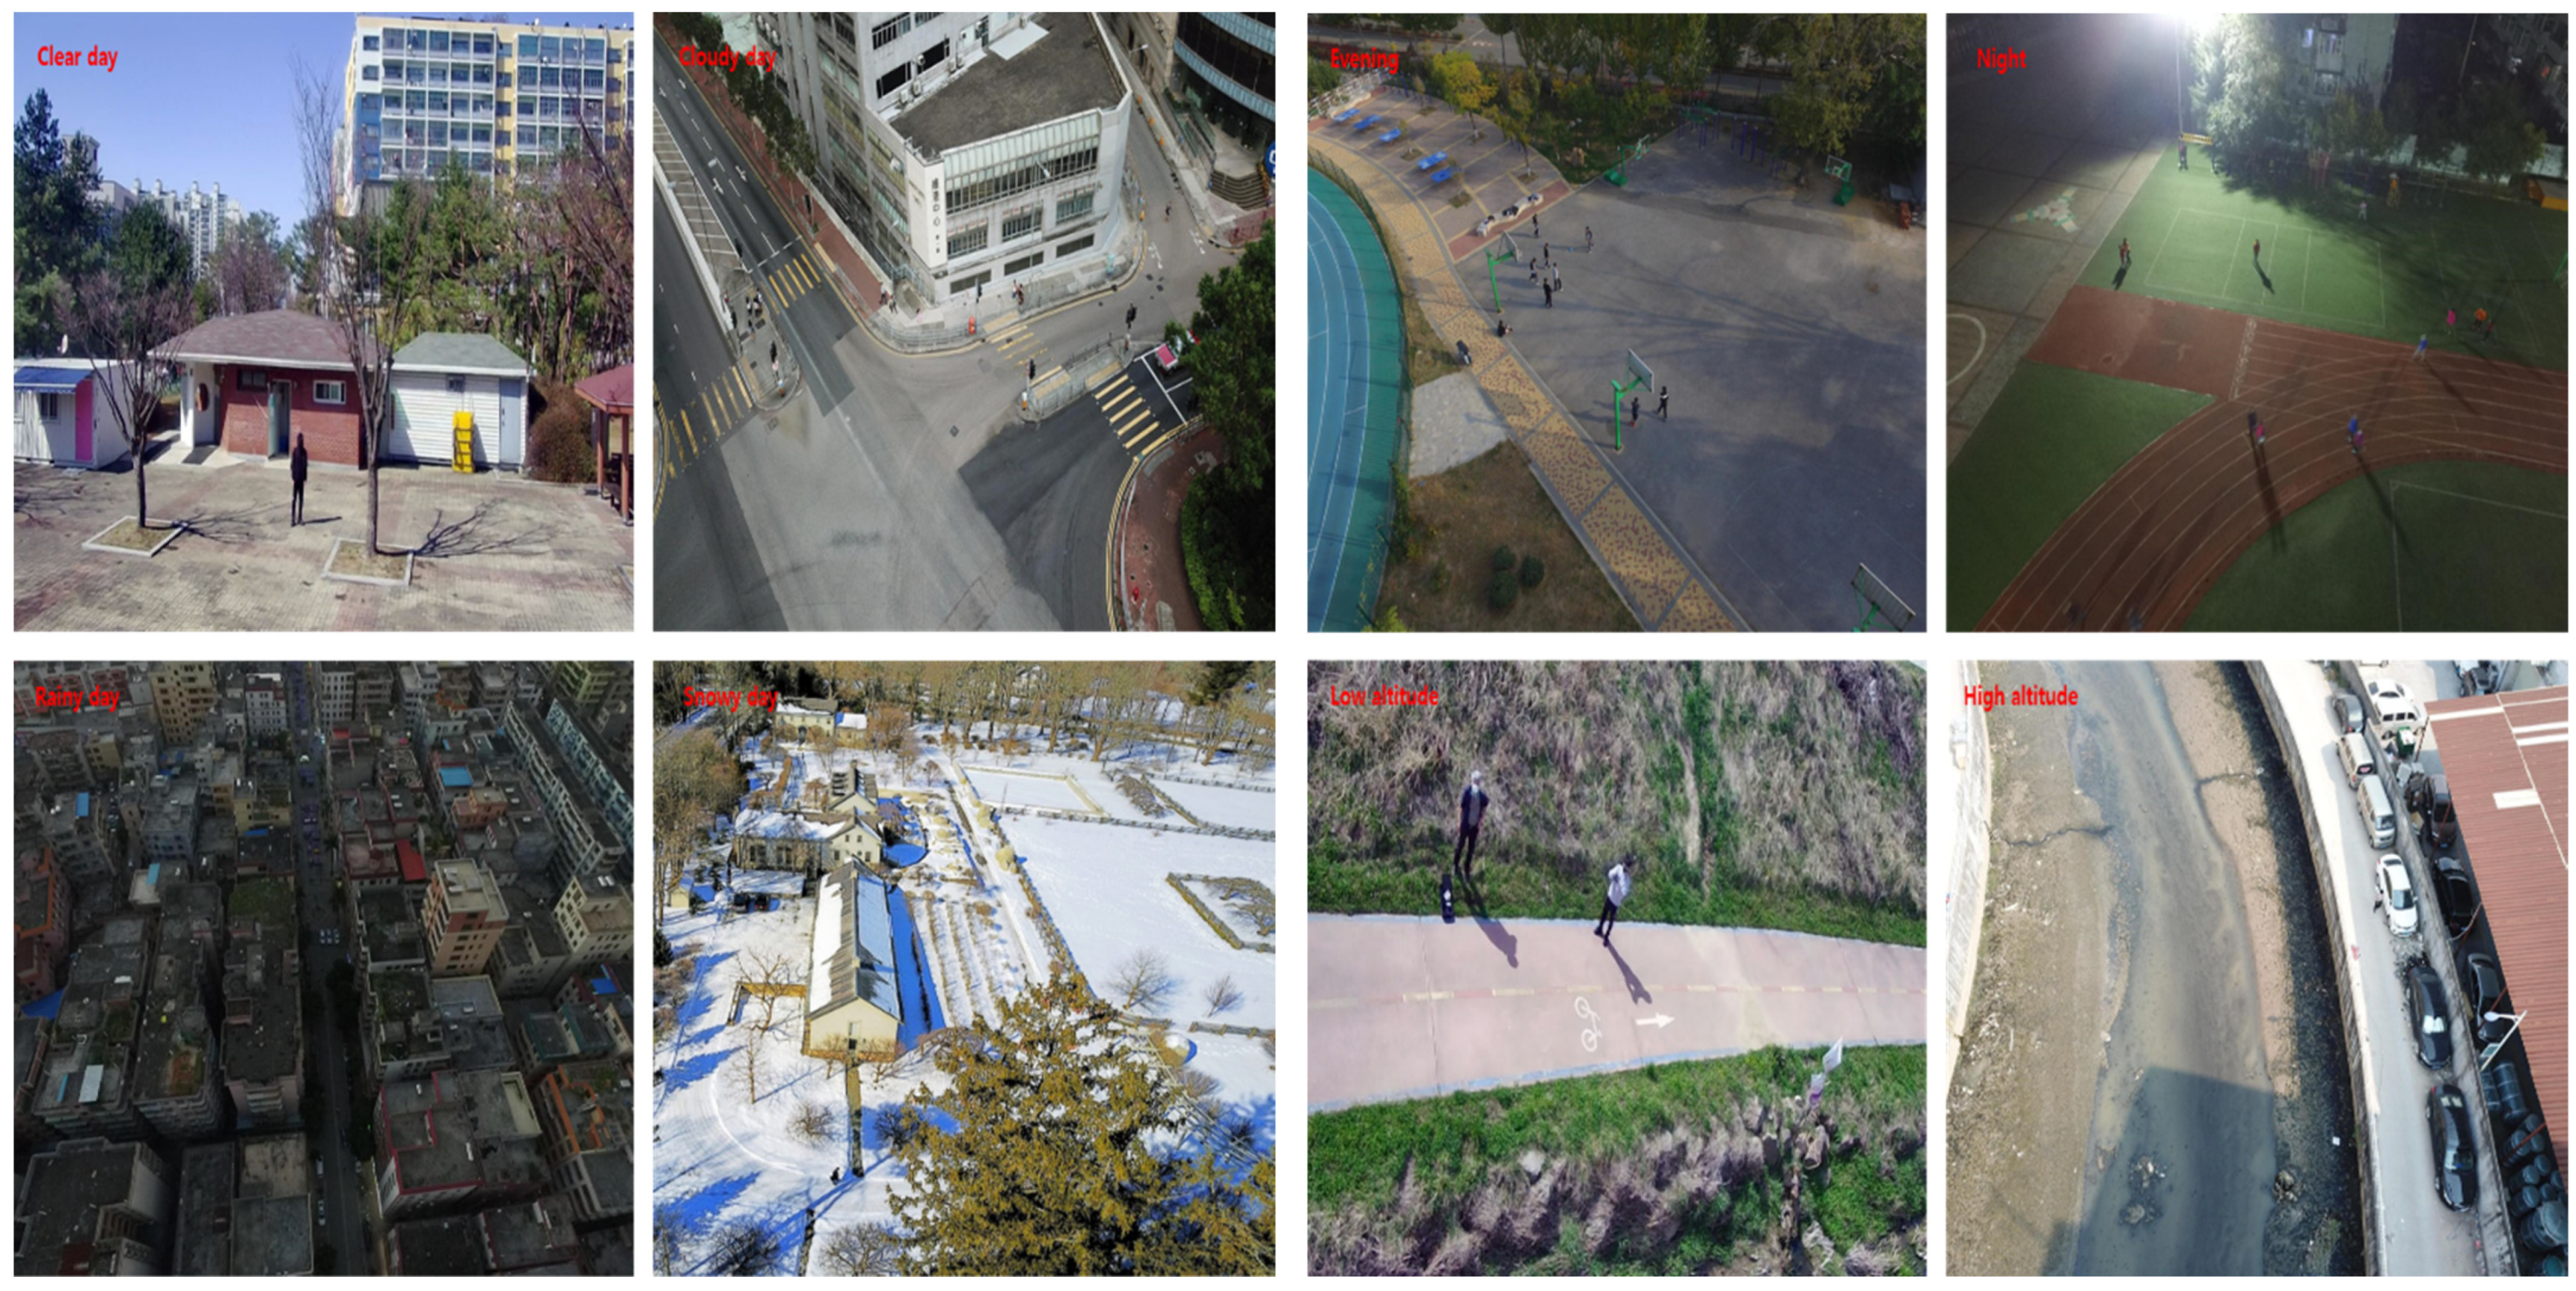
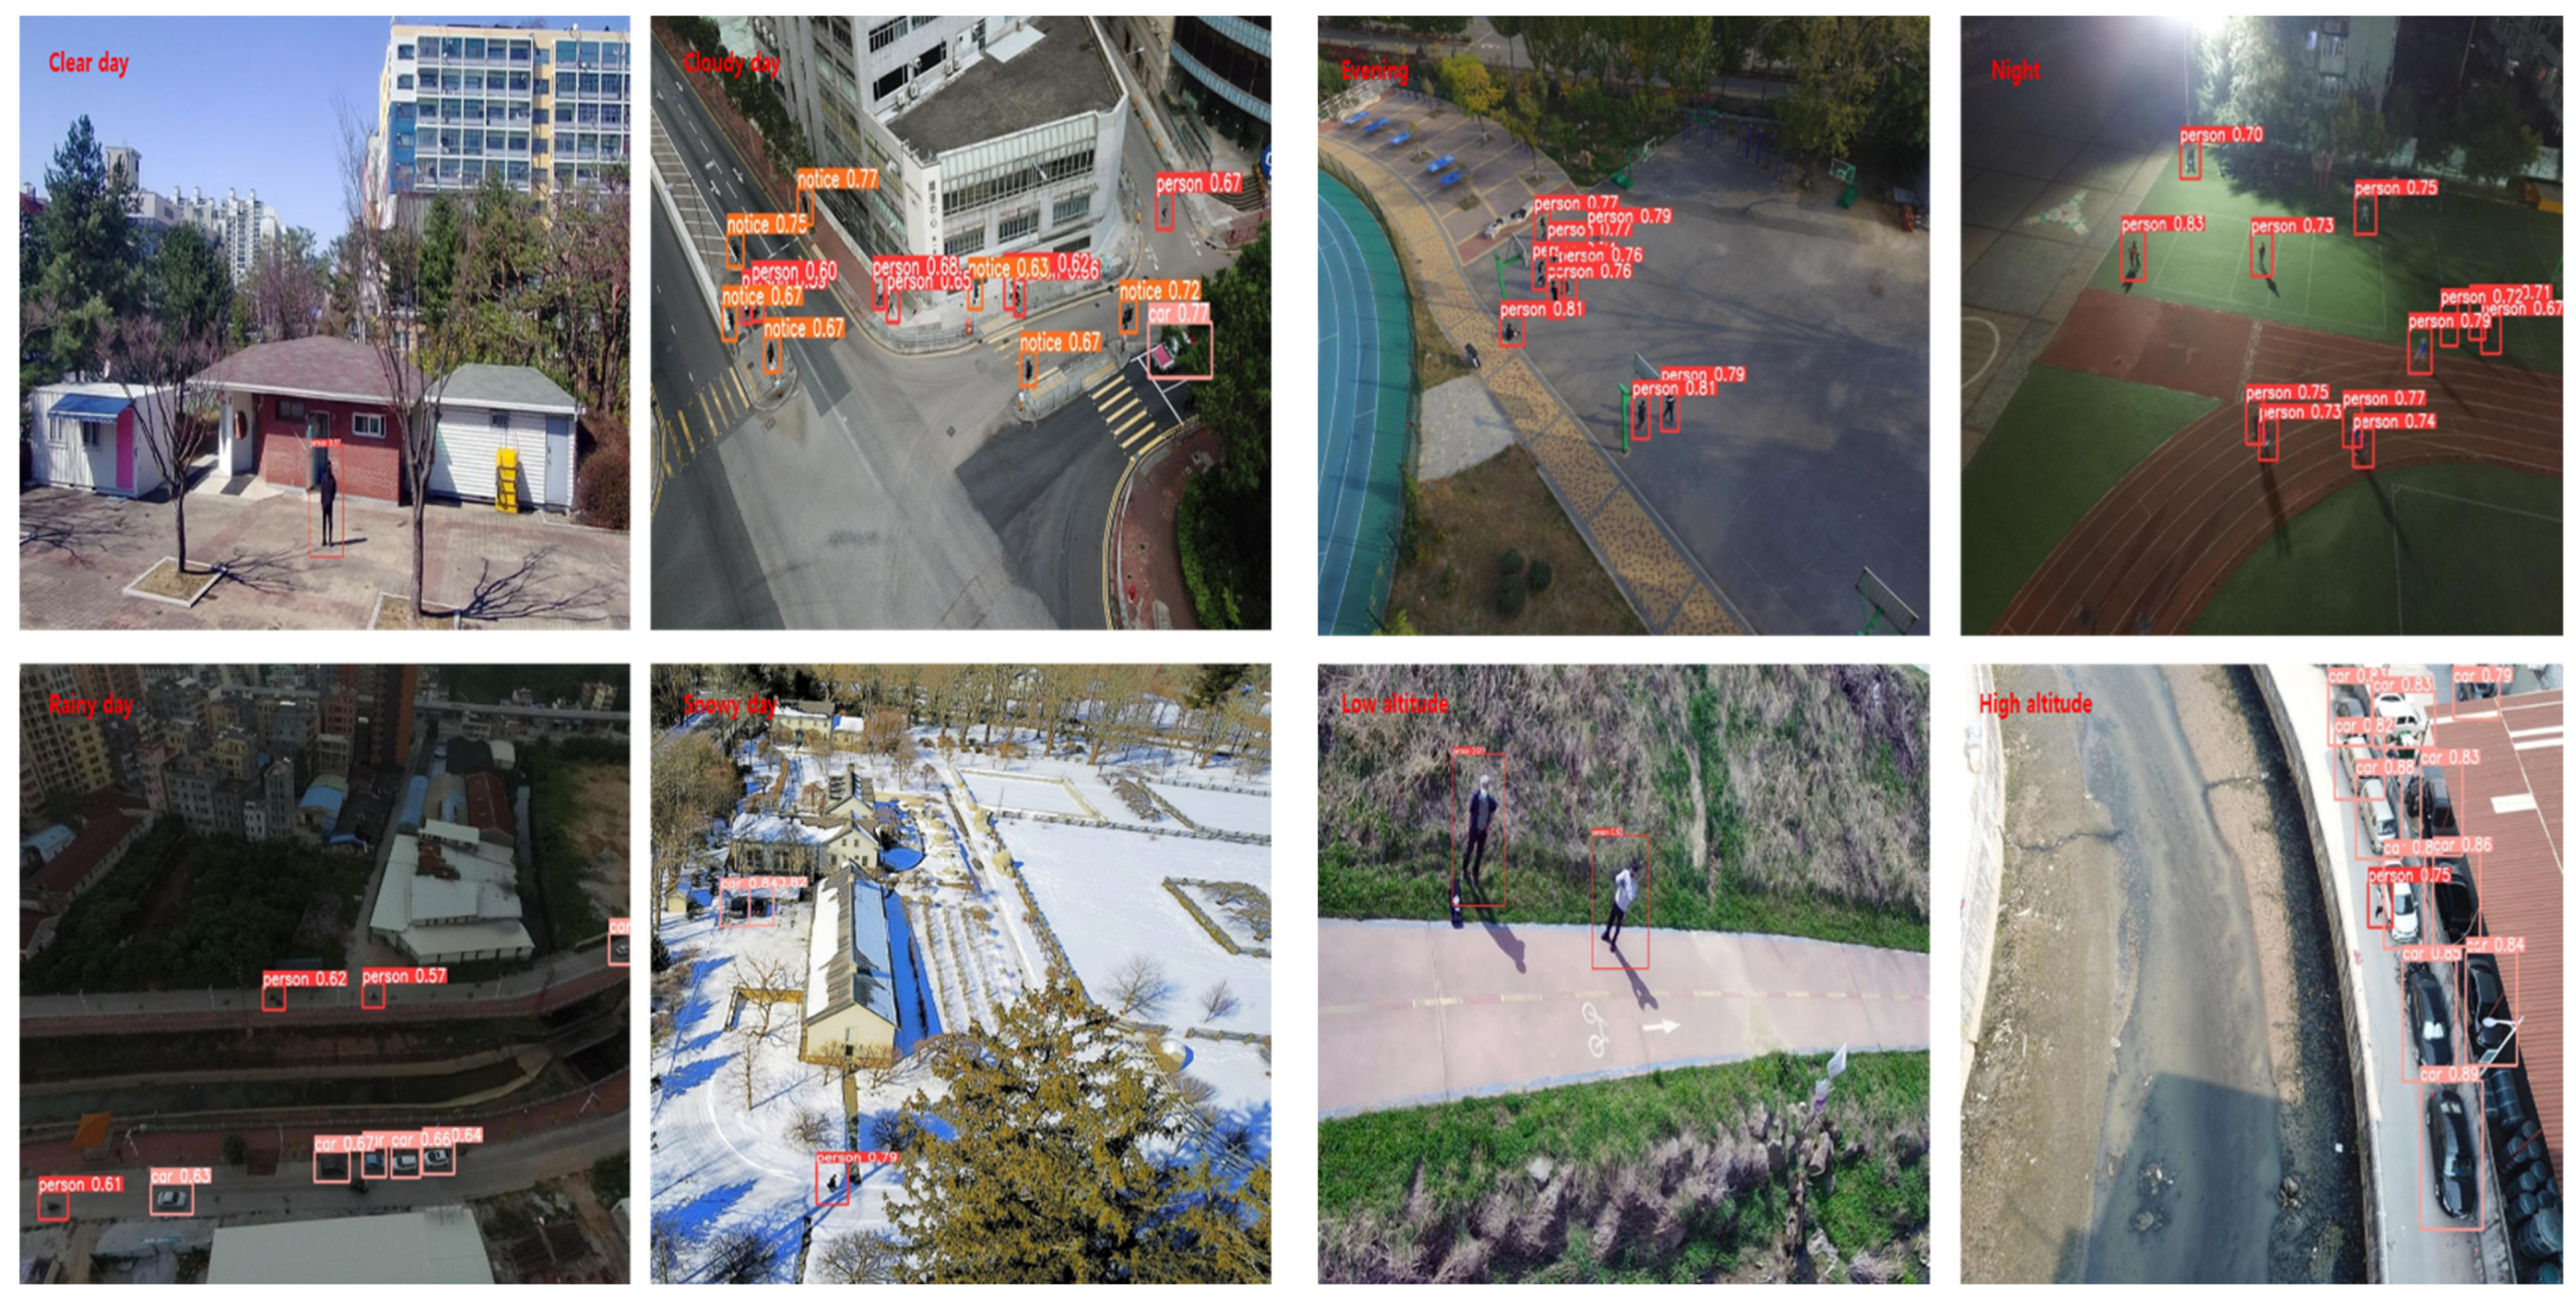
- Firstly, we improved the performance of model that can detect object under various environmental and weather conditions, such as Clear, Cloudy, Rainy, Snowy day, Evening, Night, Low altitude, and High altitude.
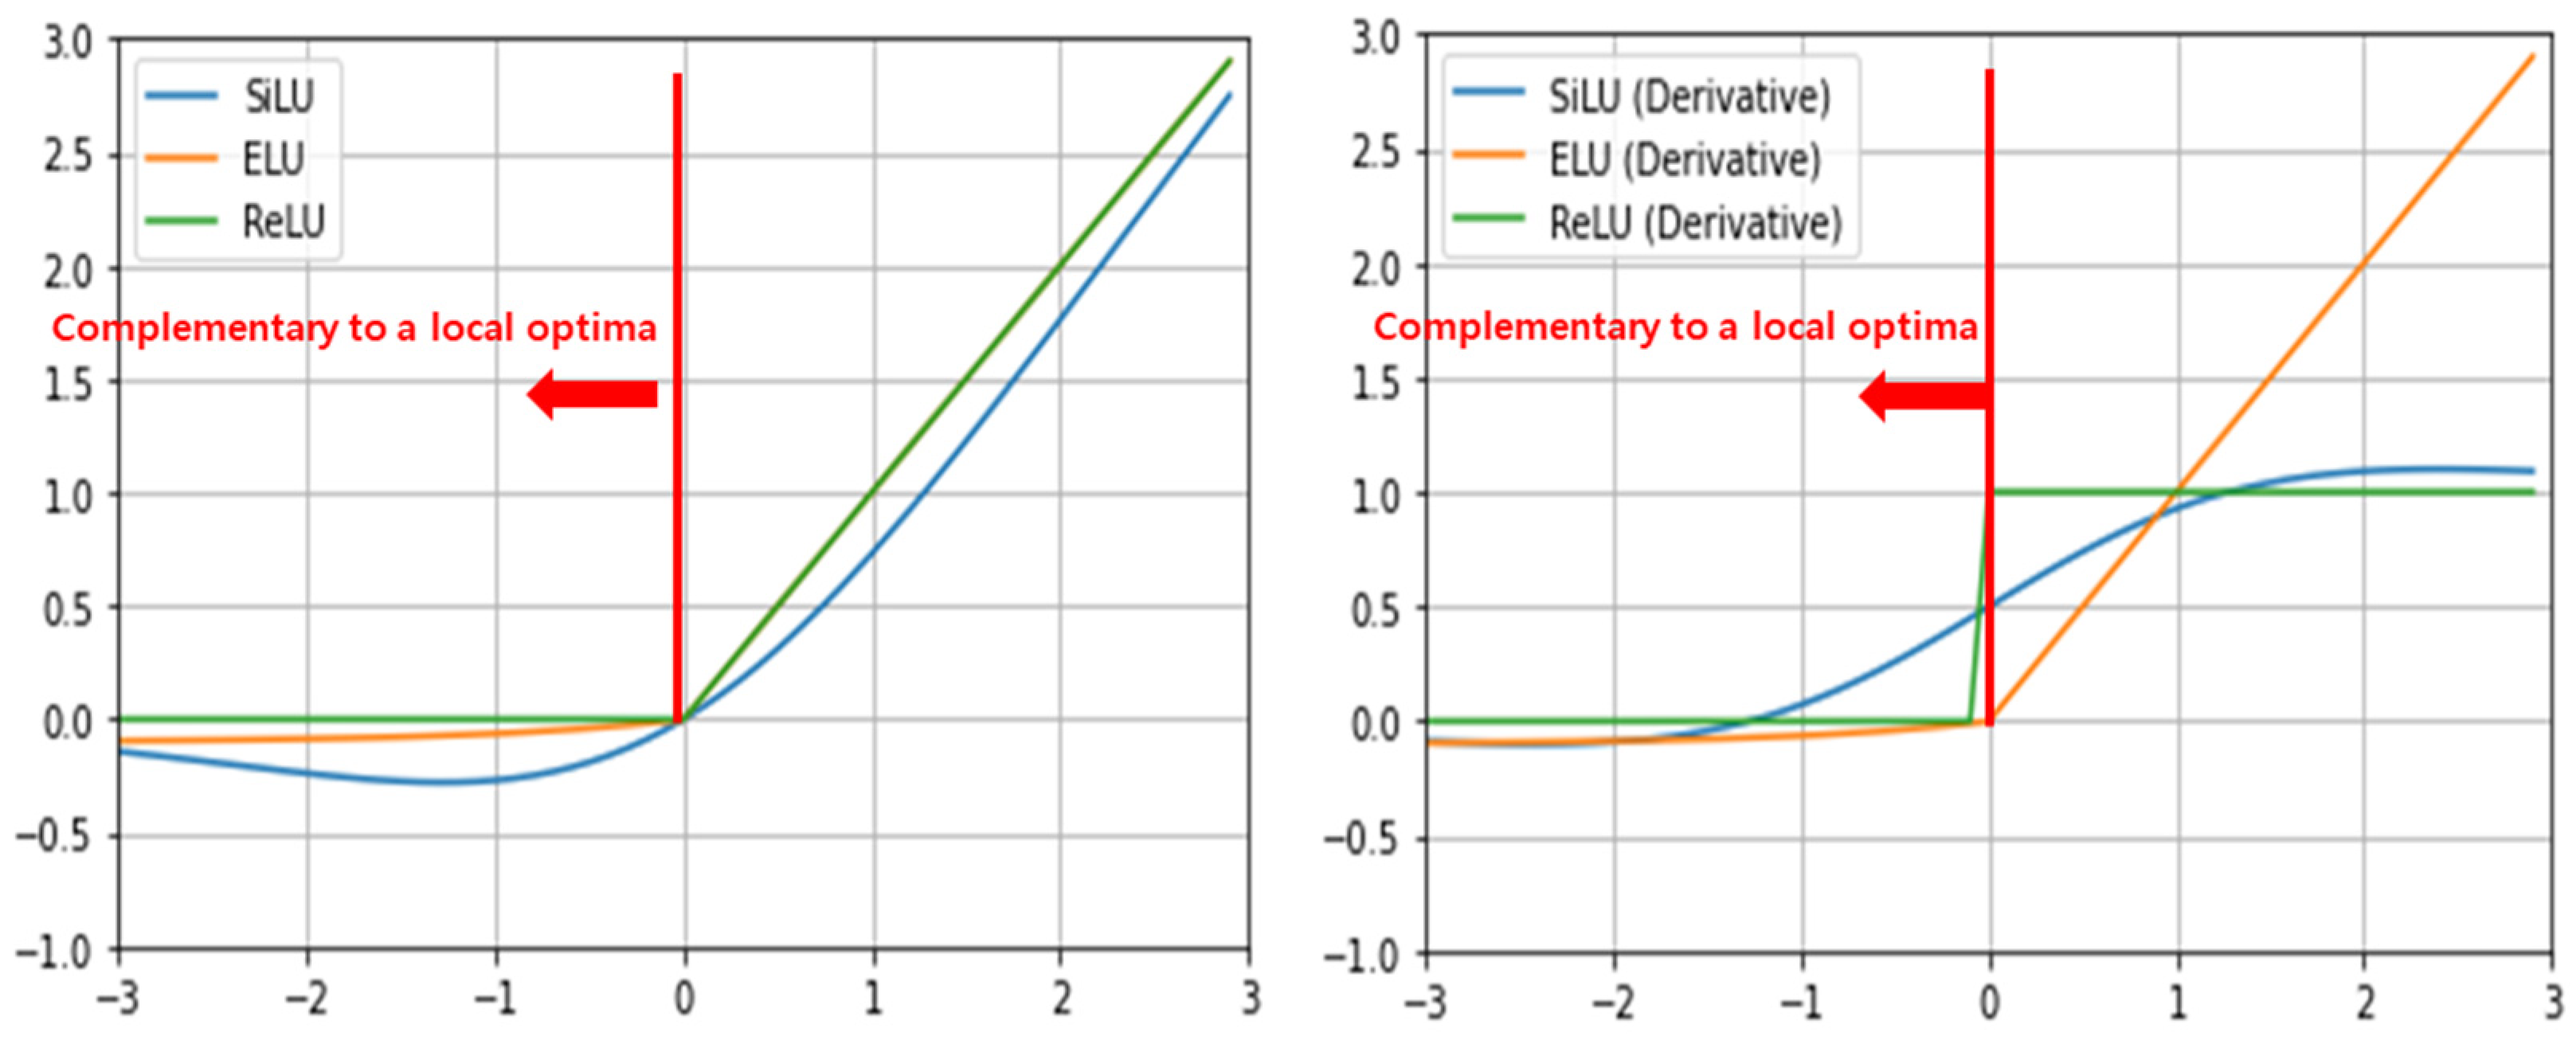
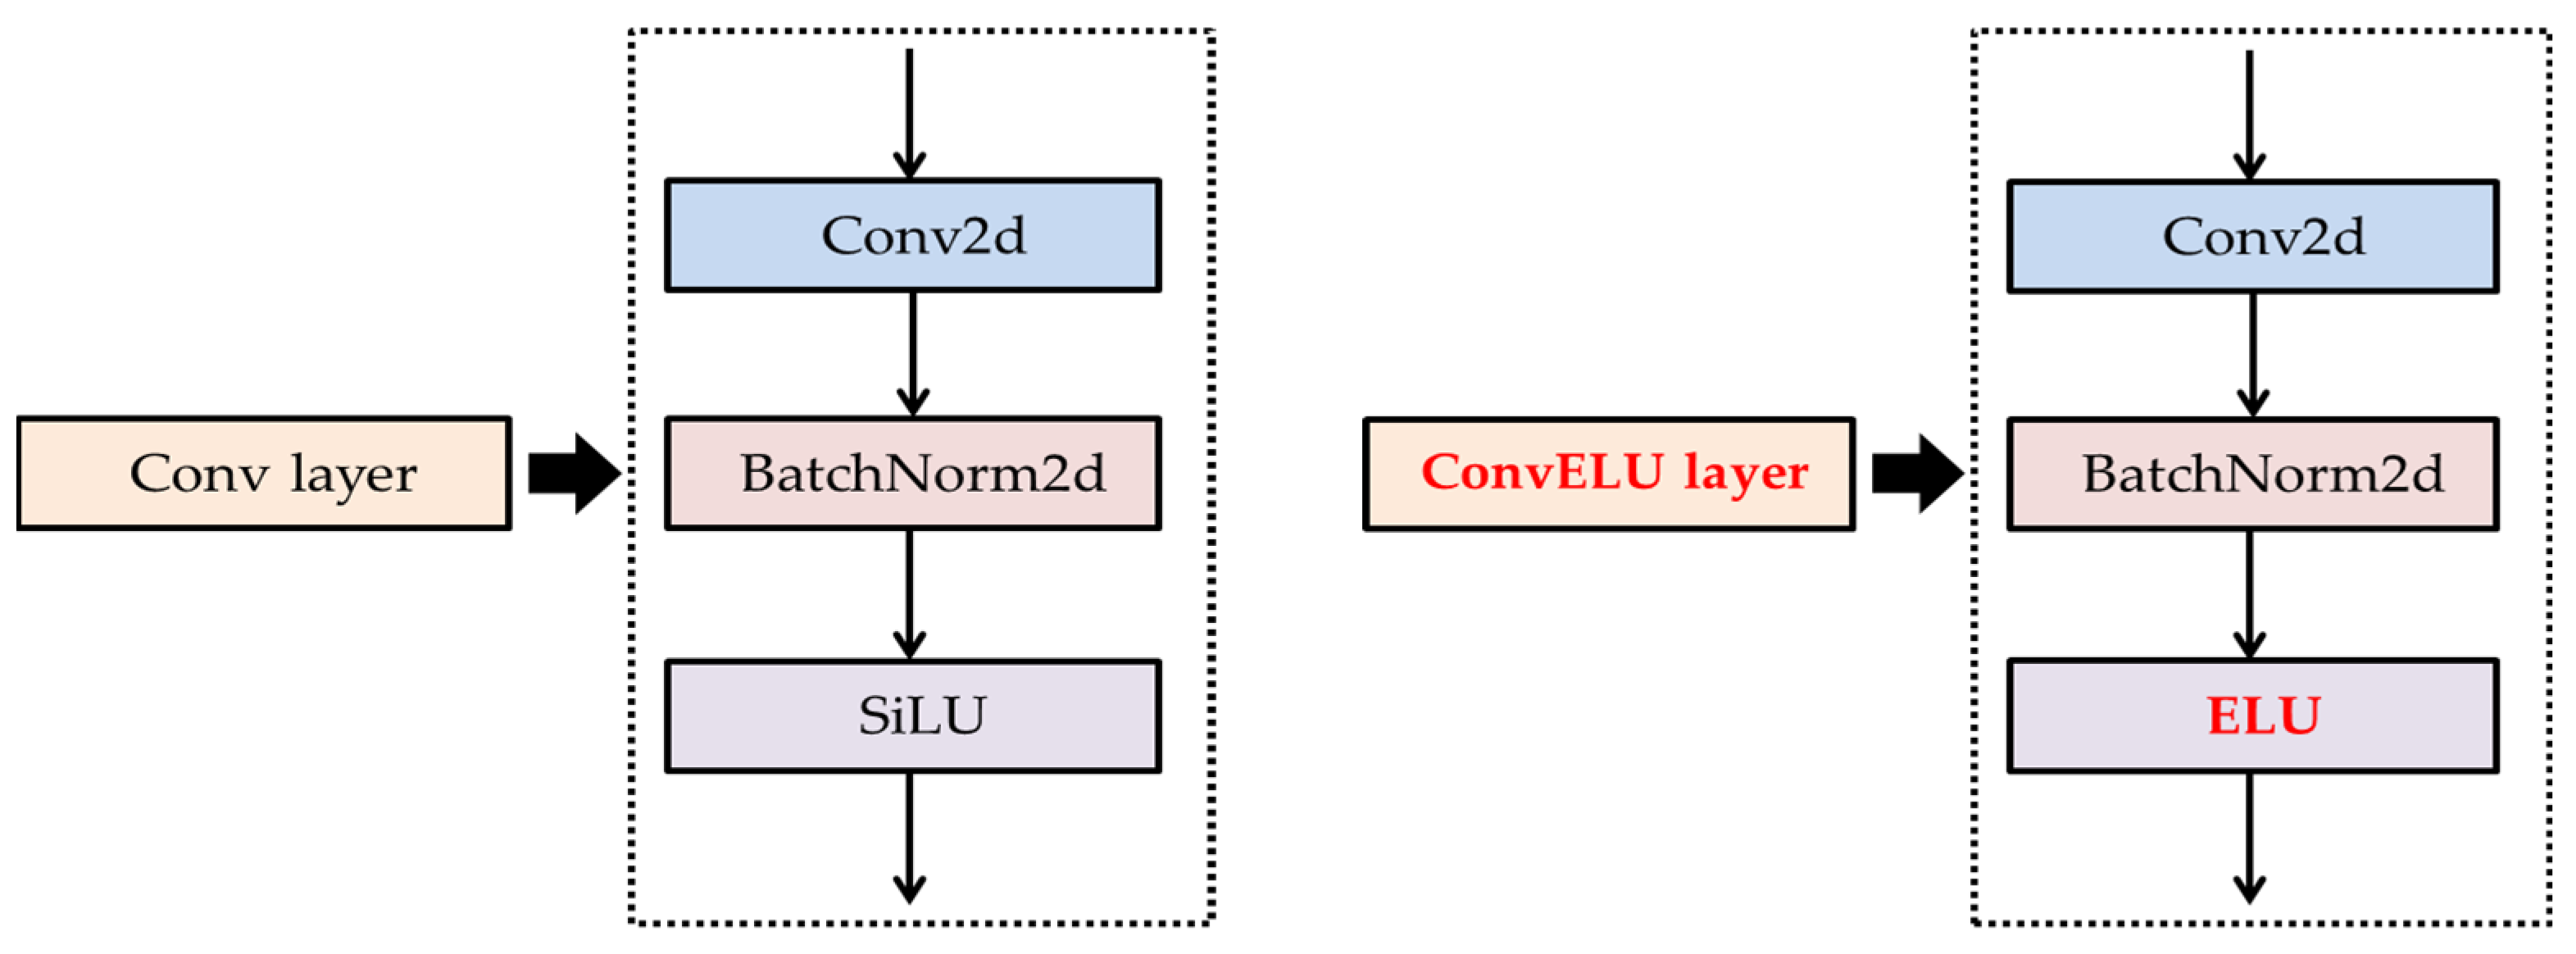
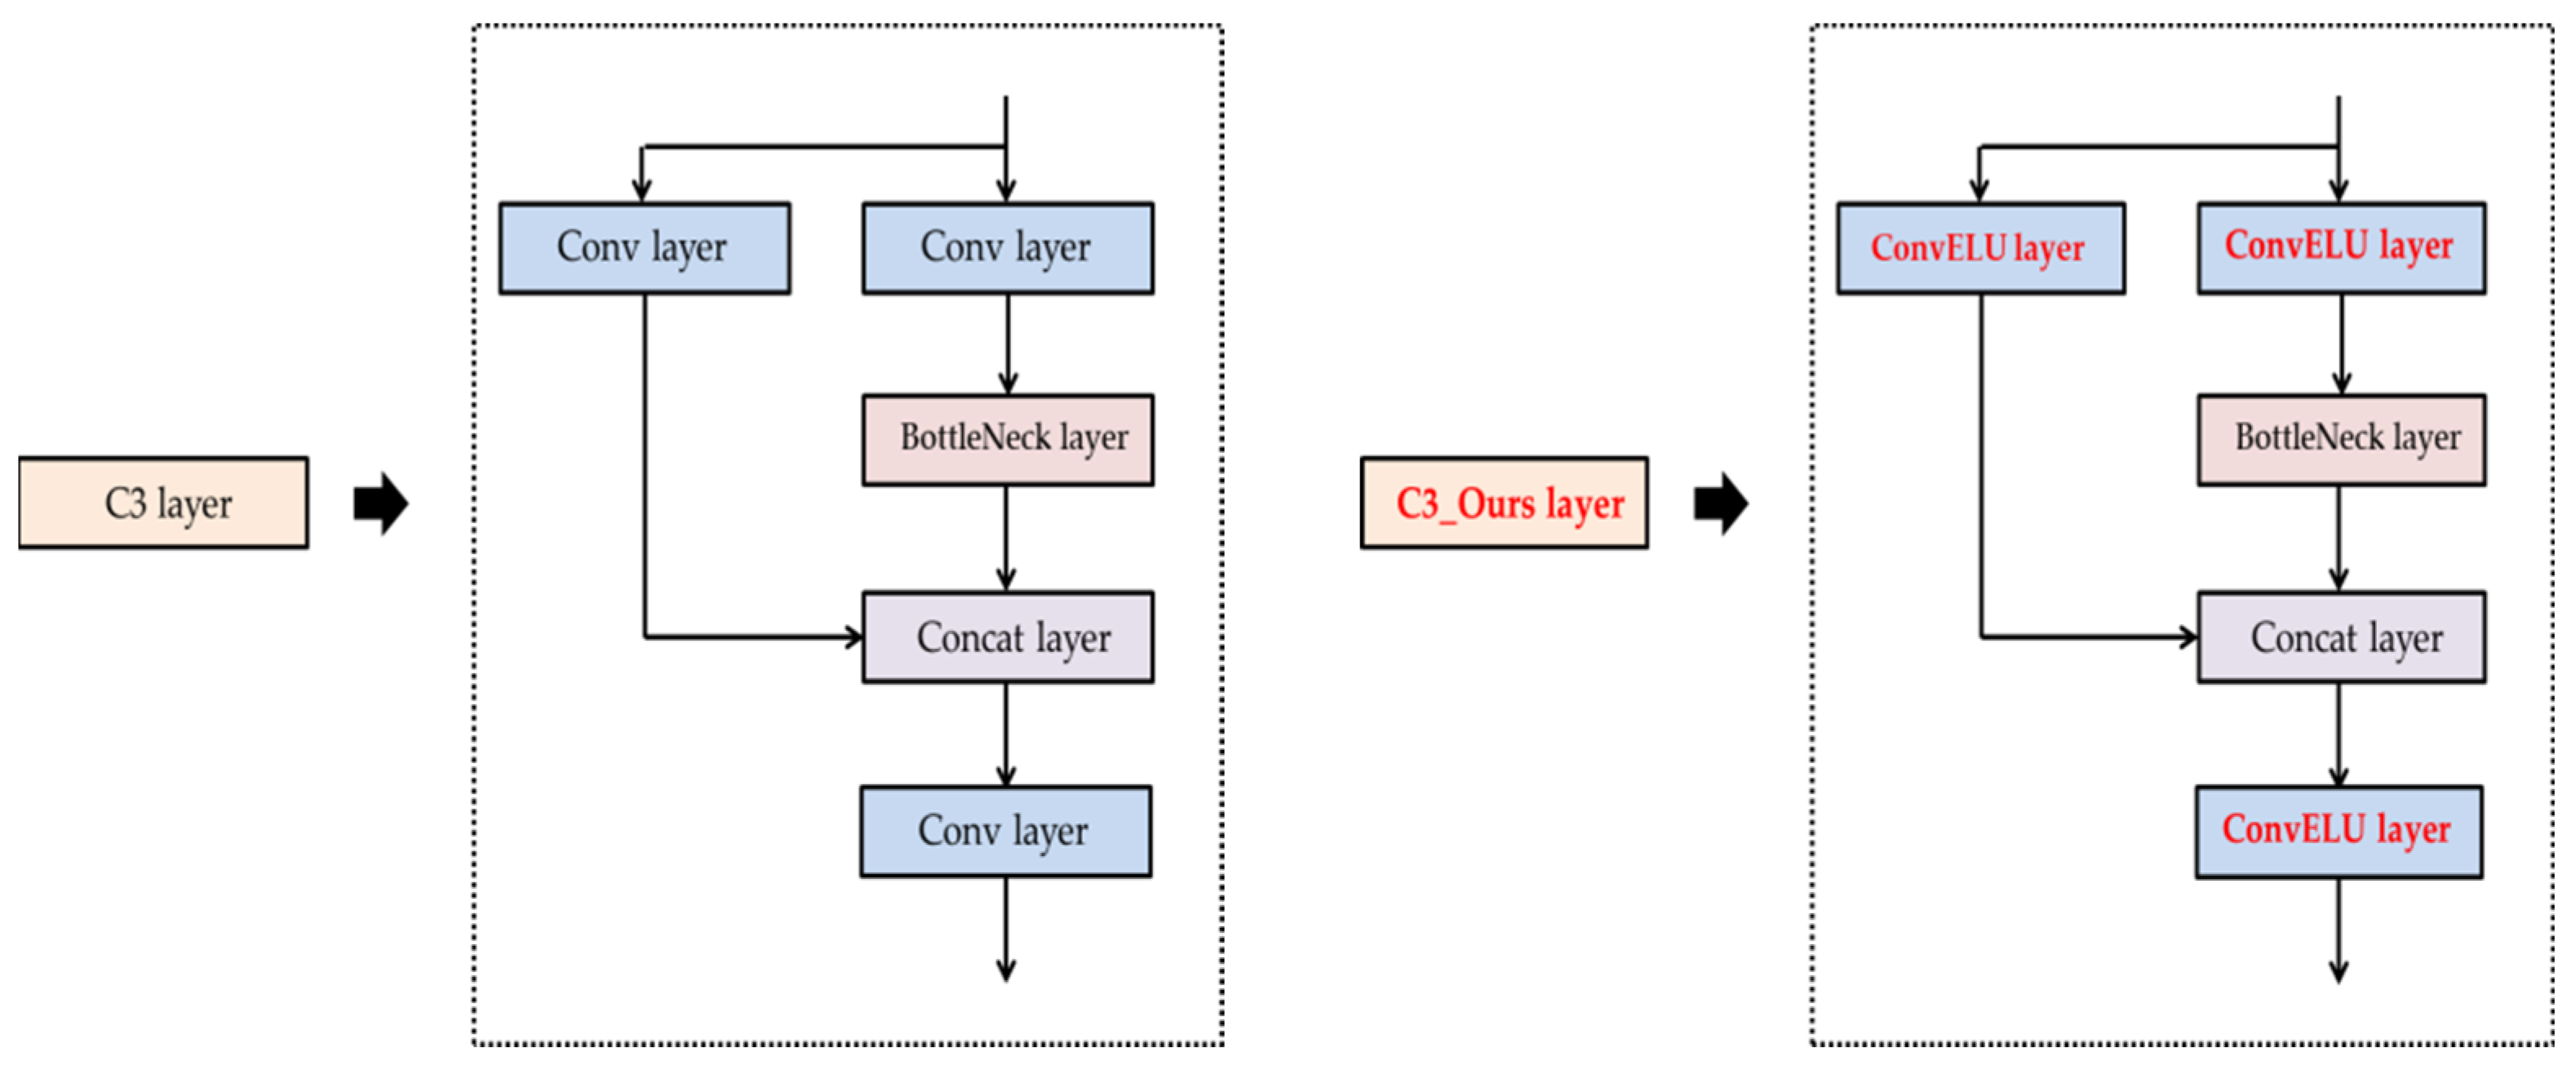
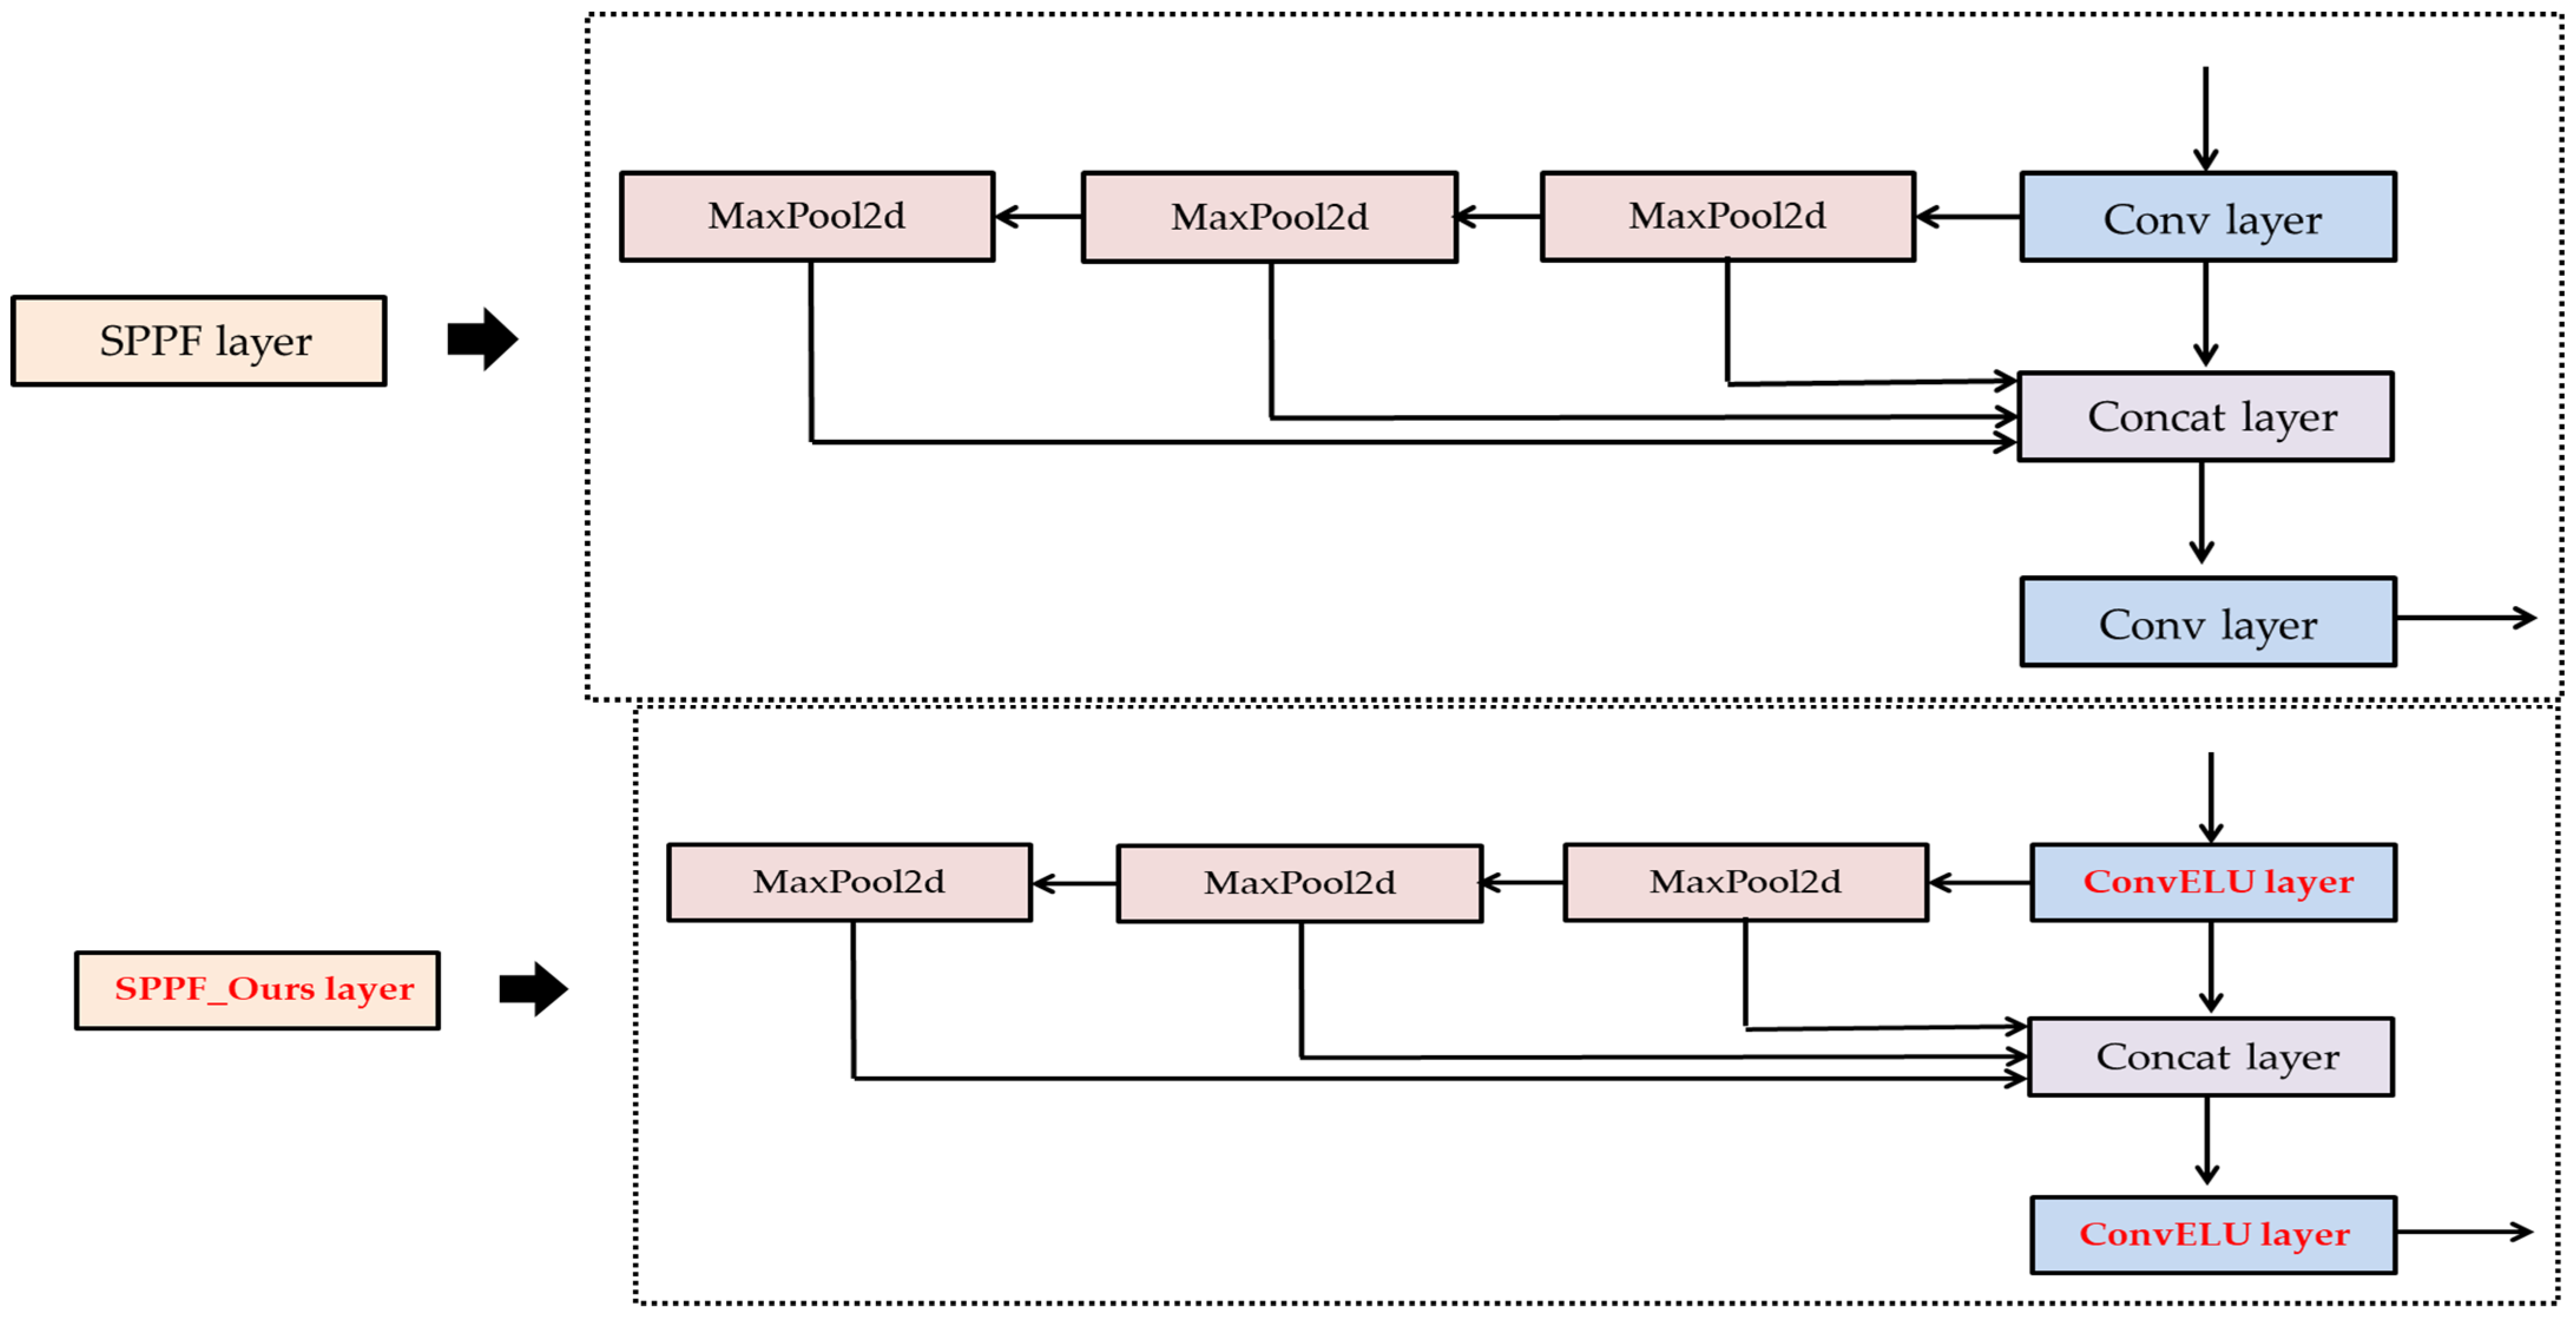
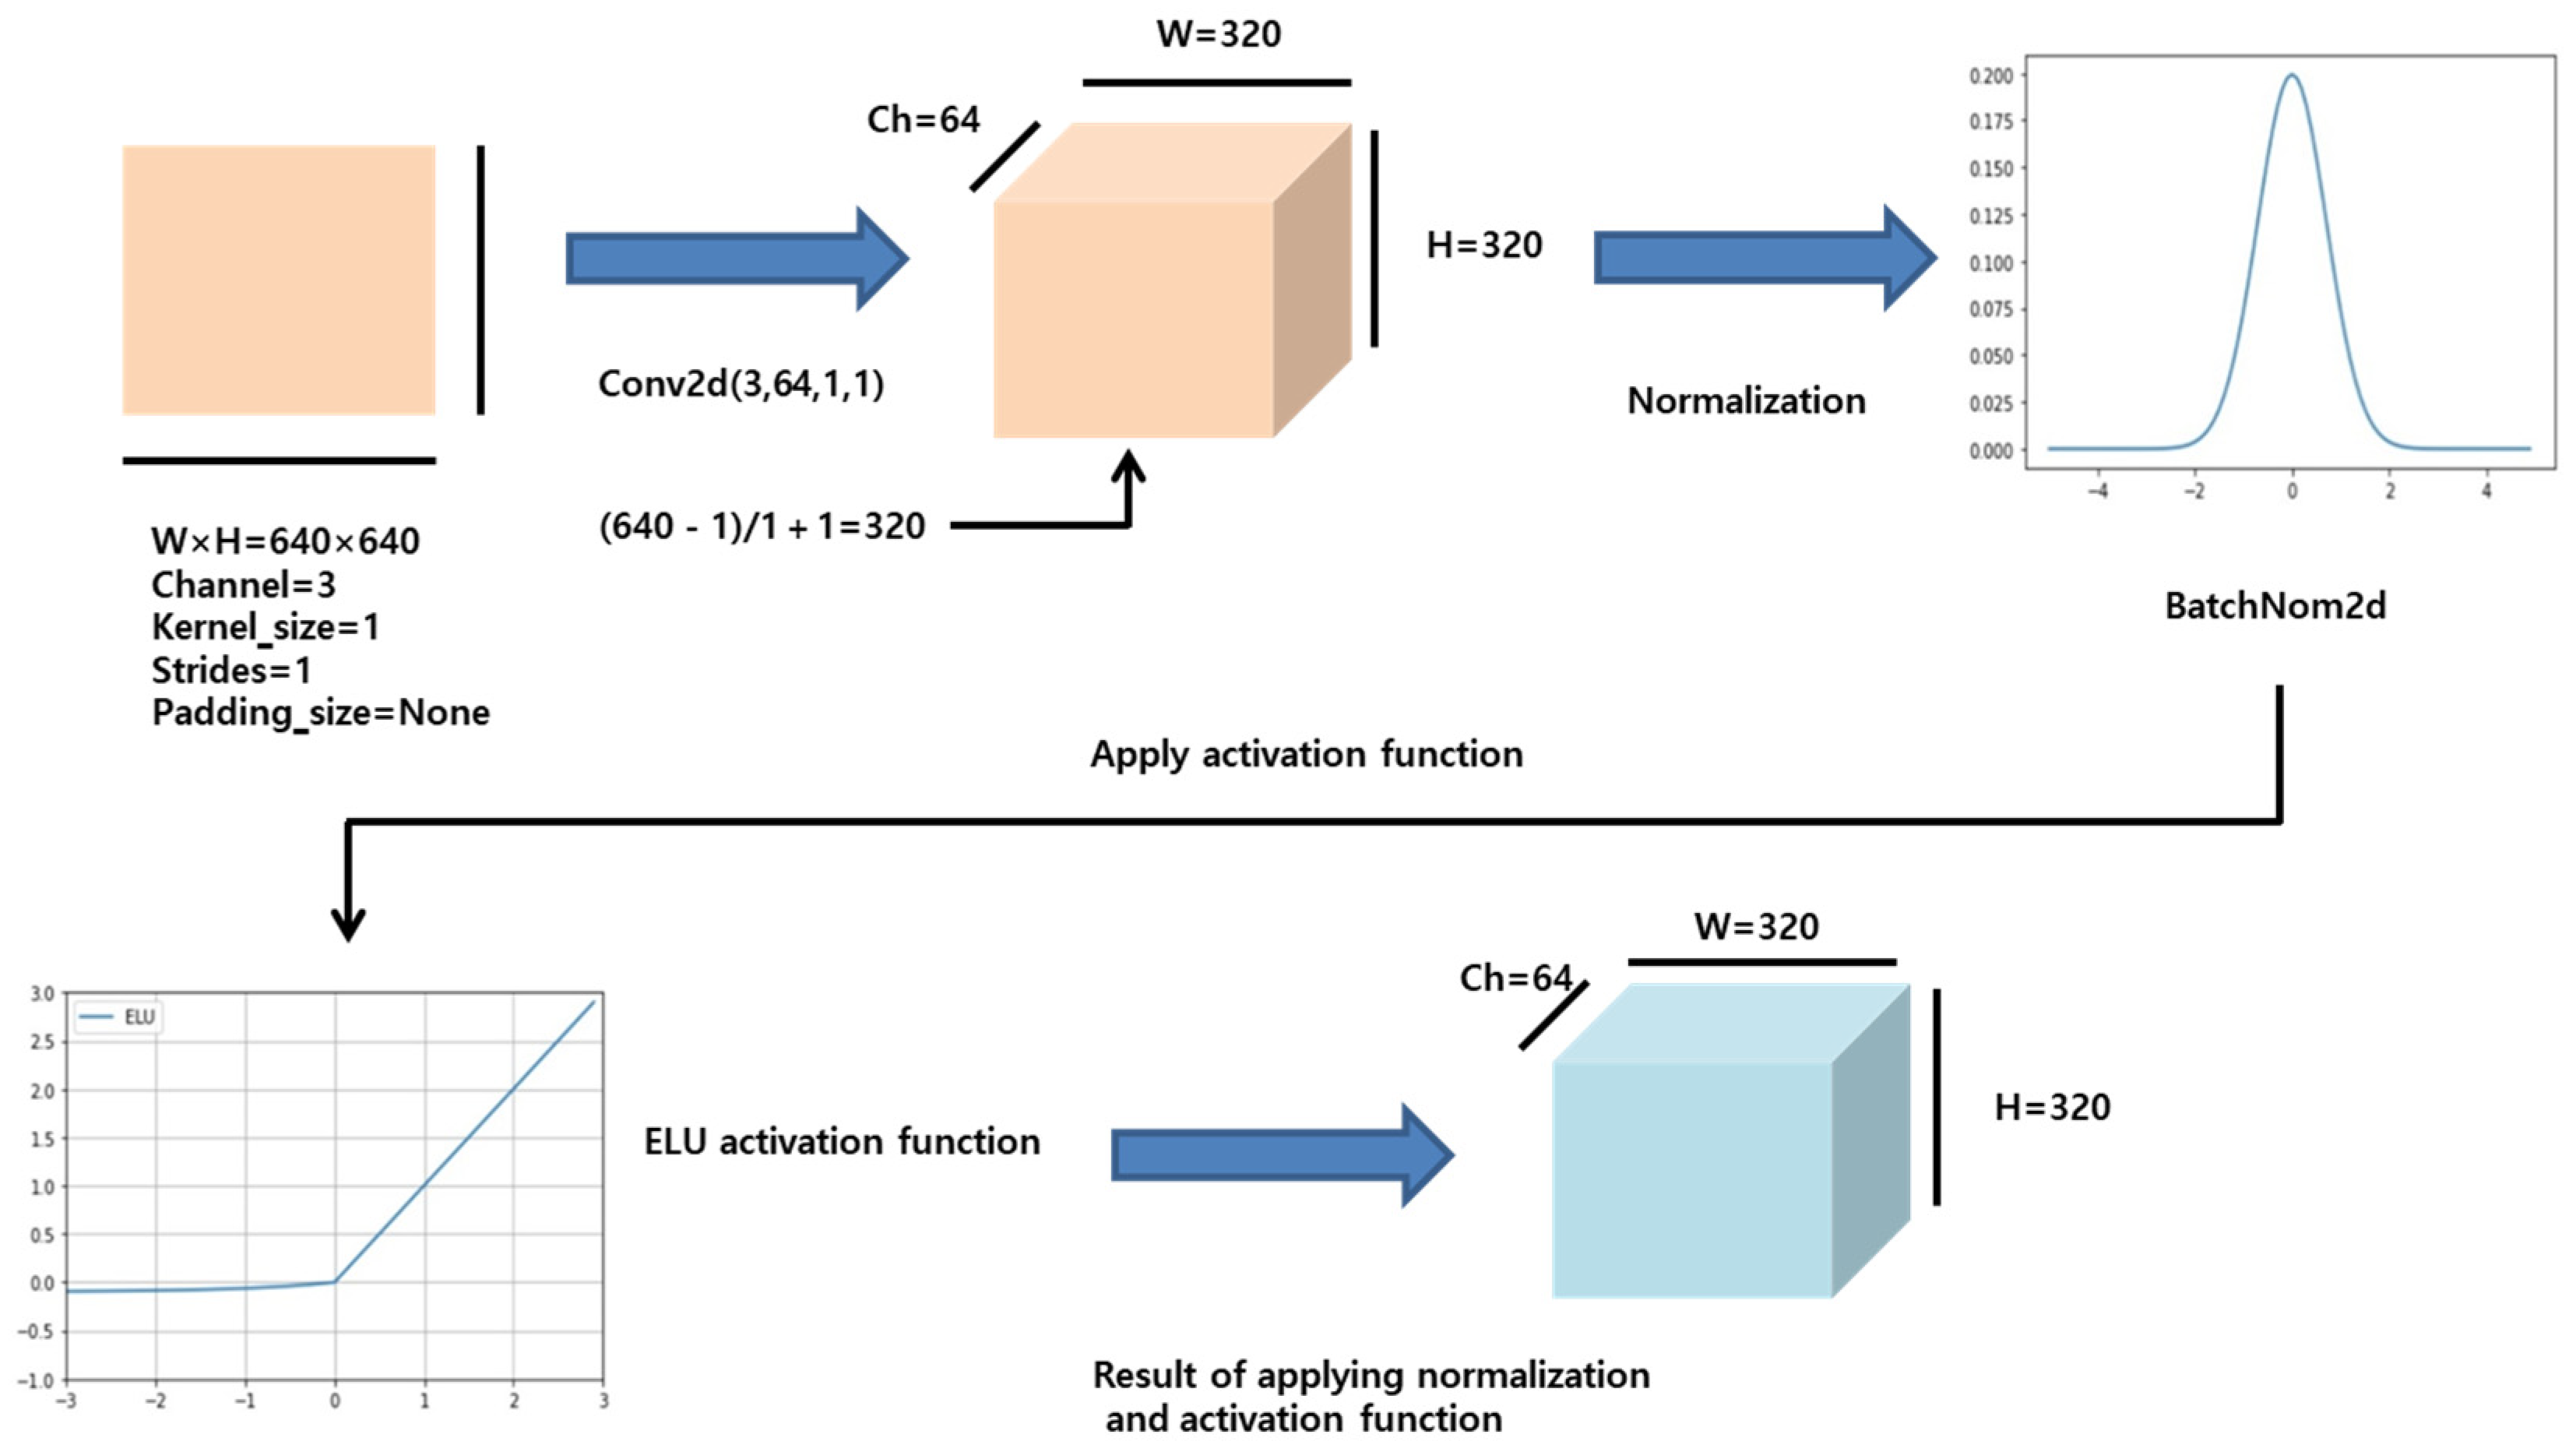
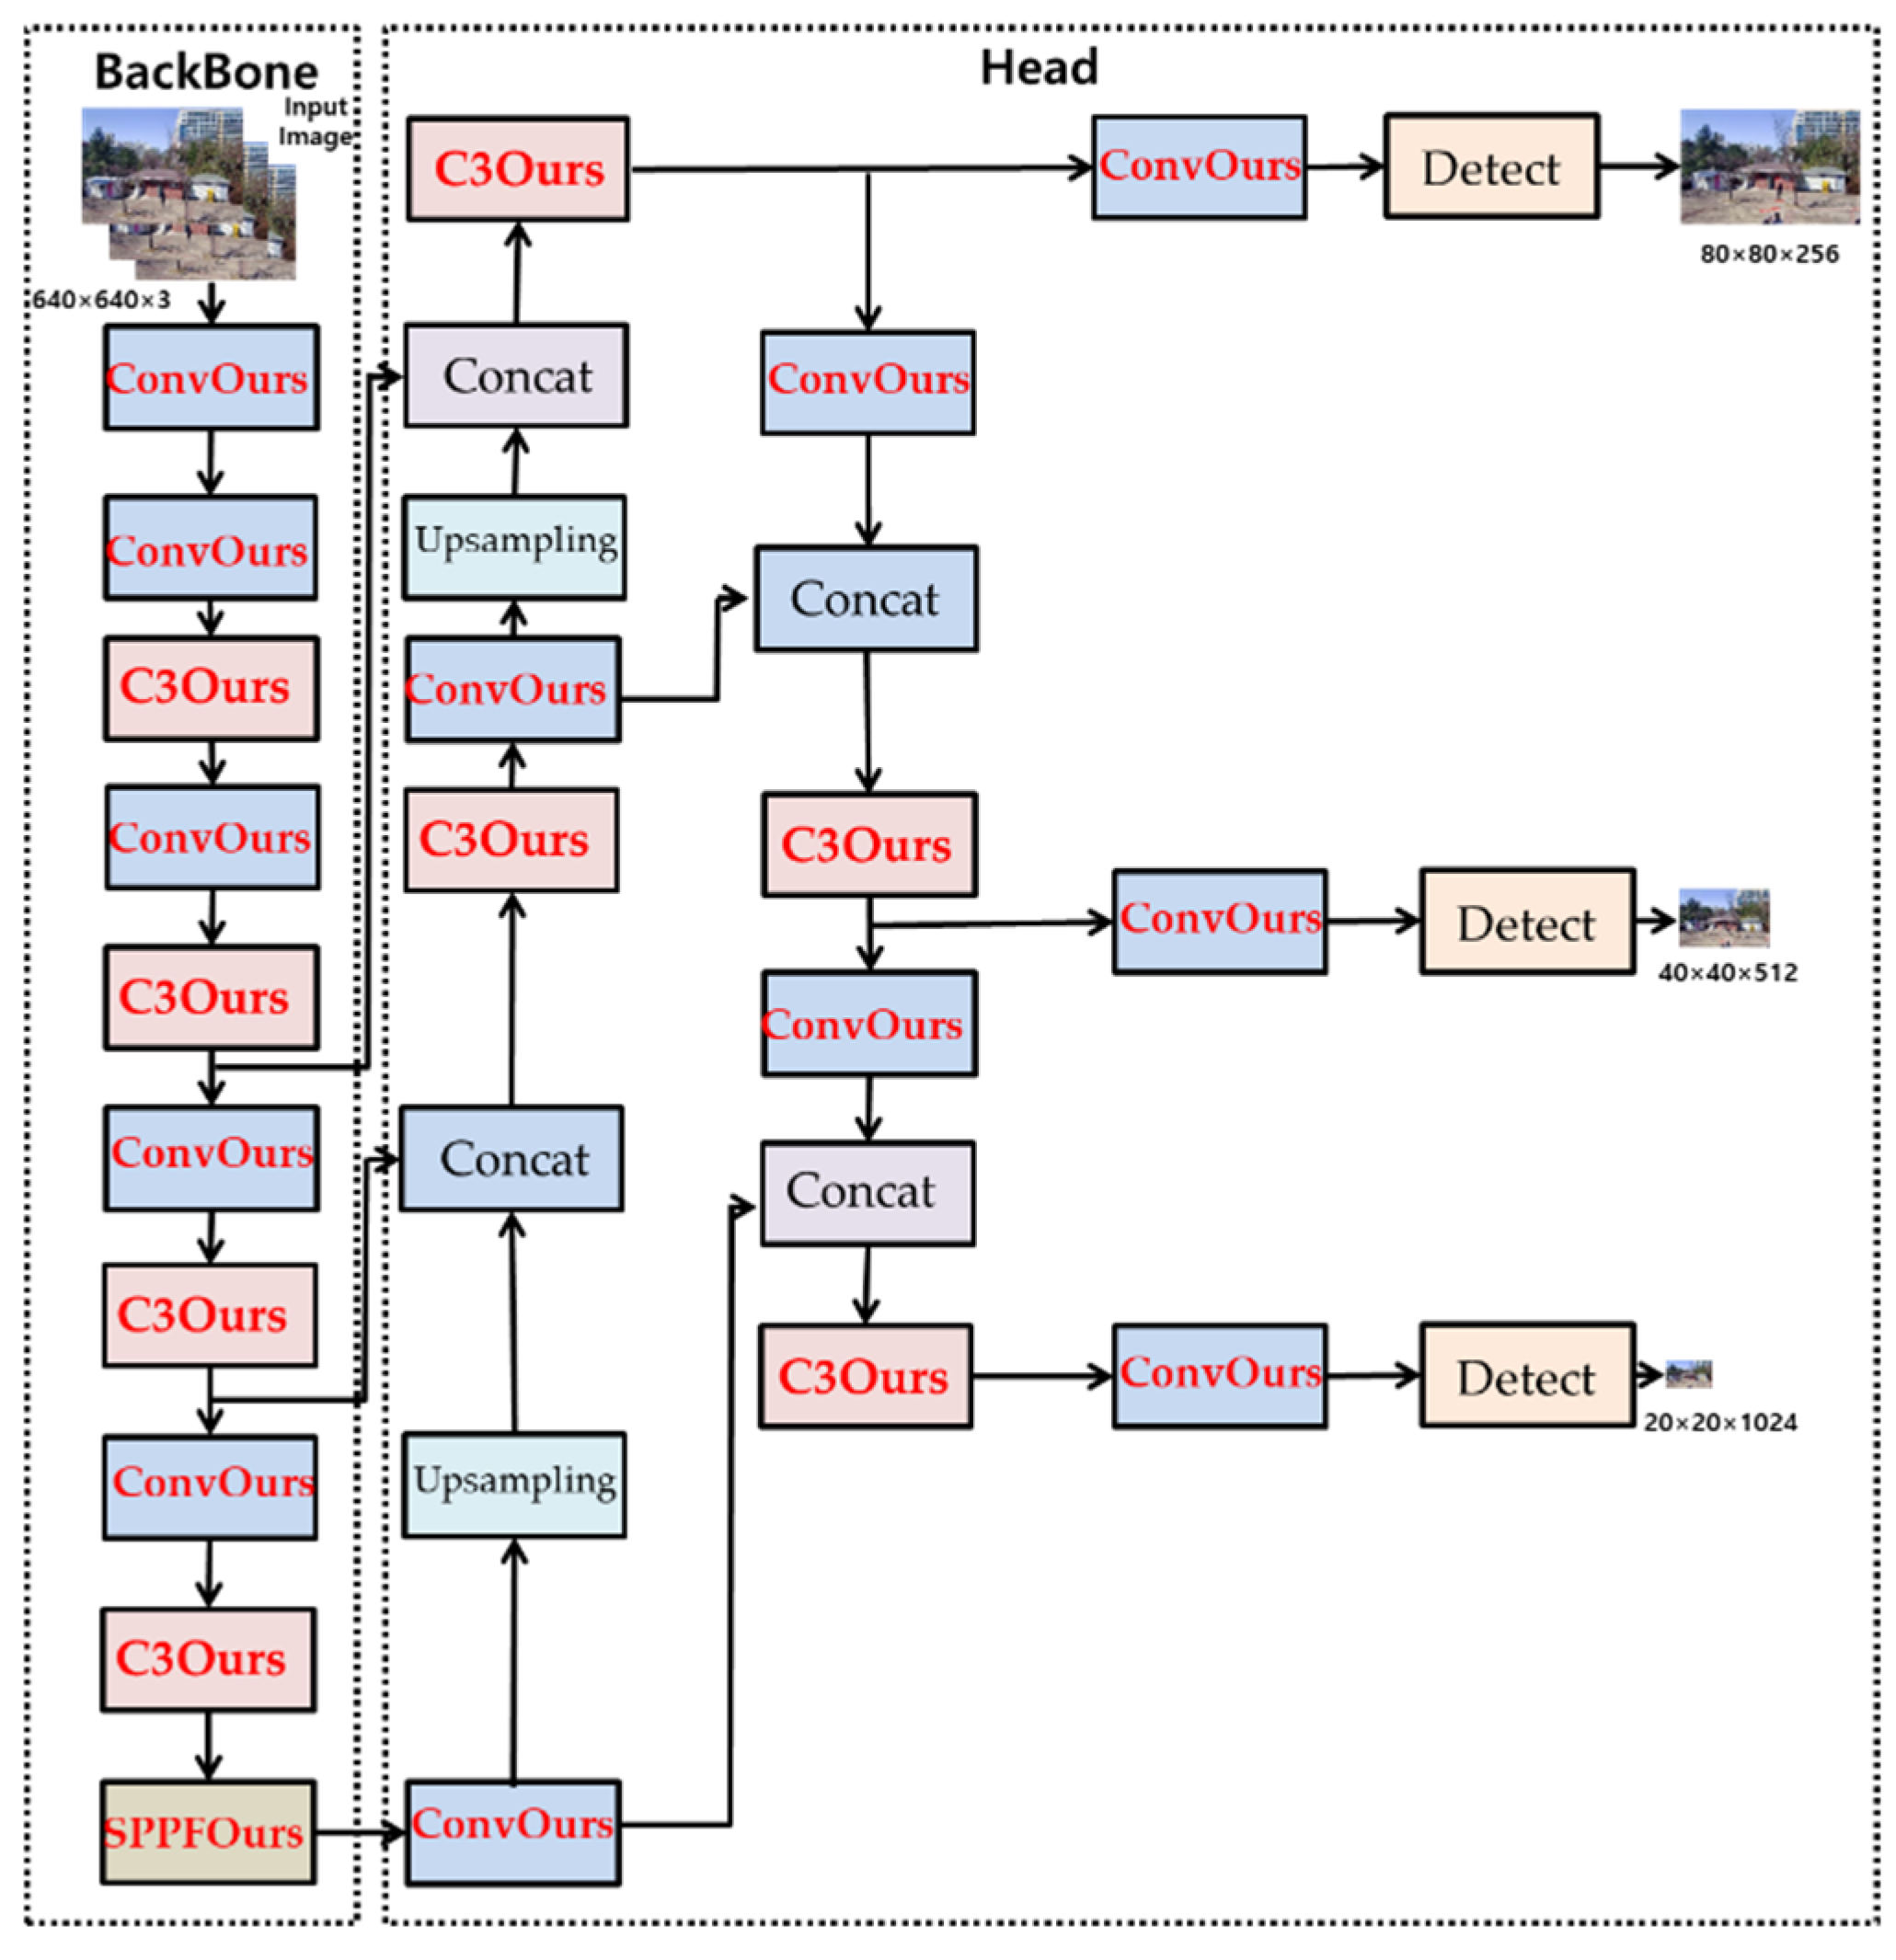
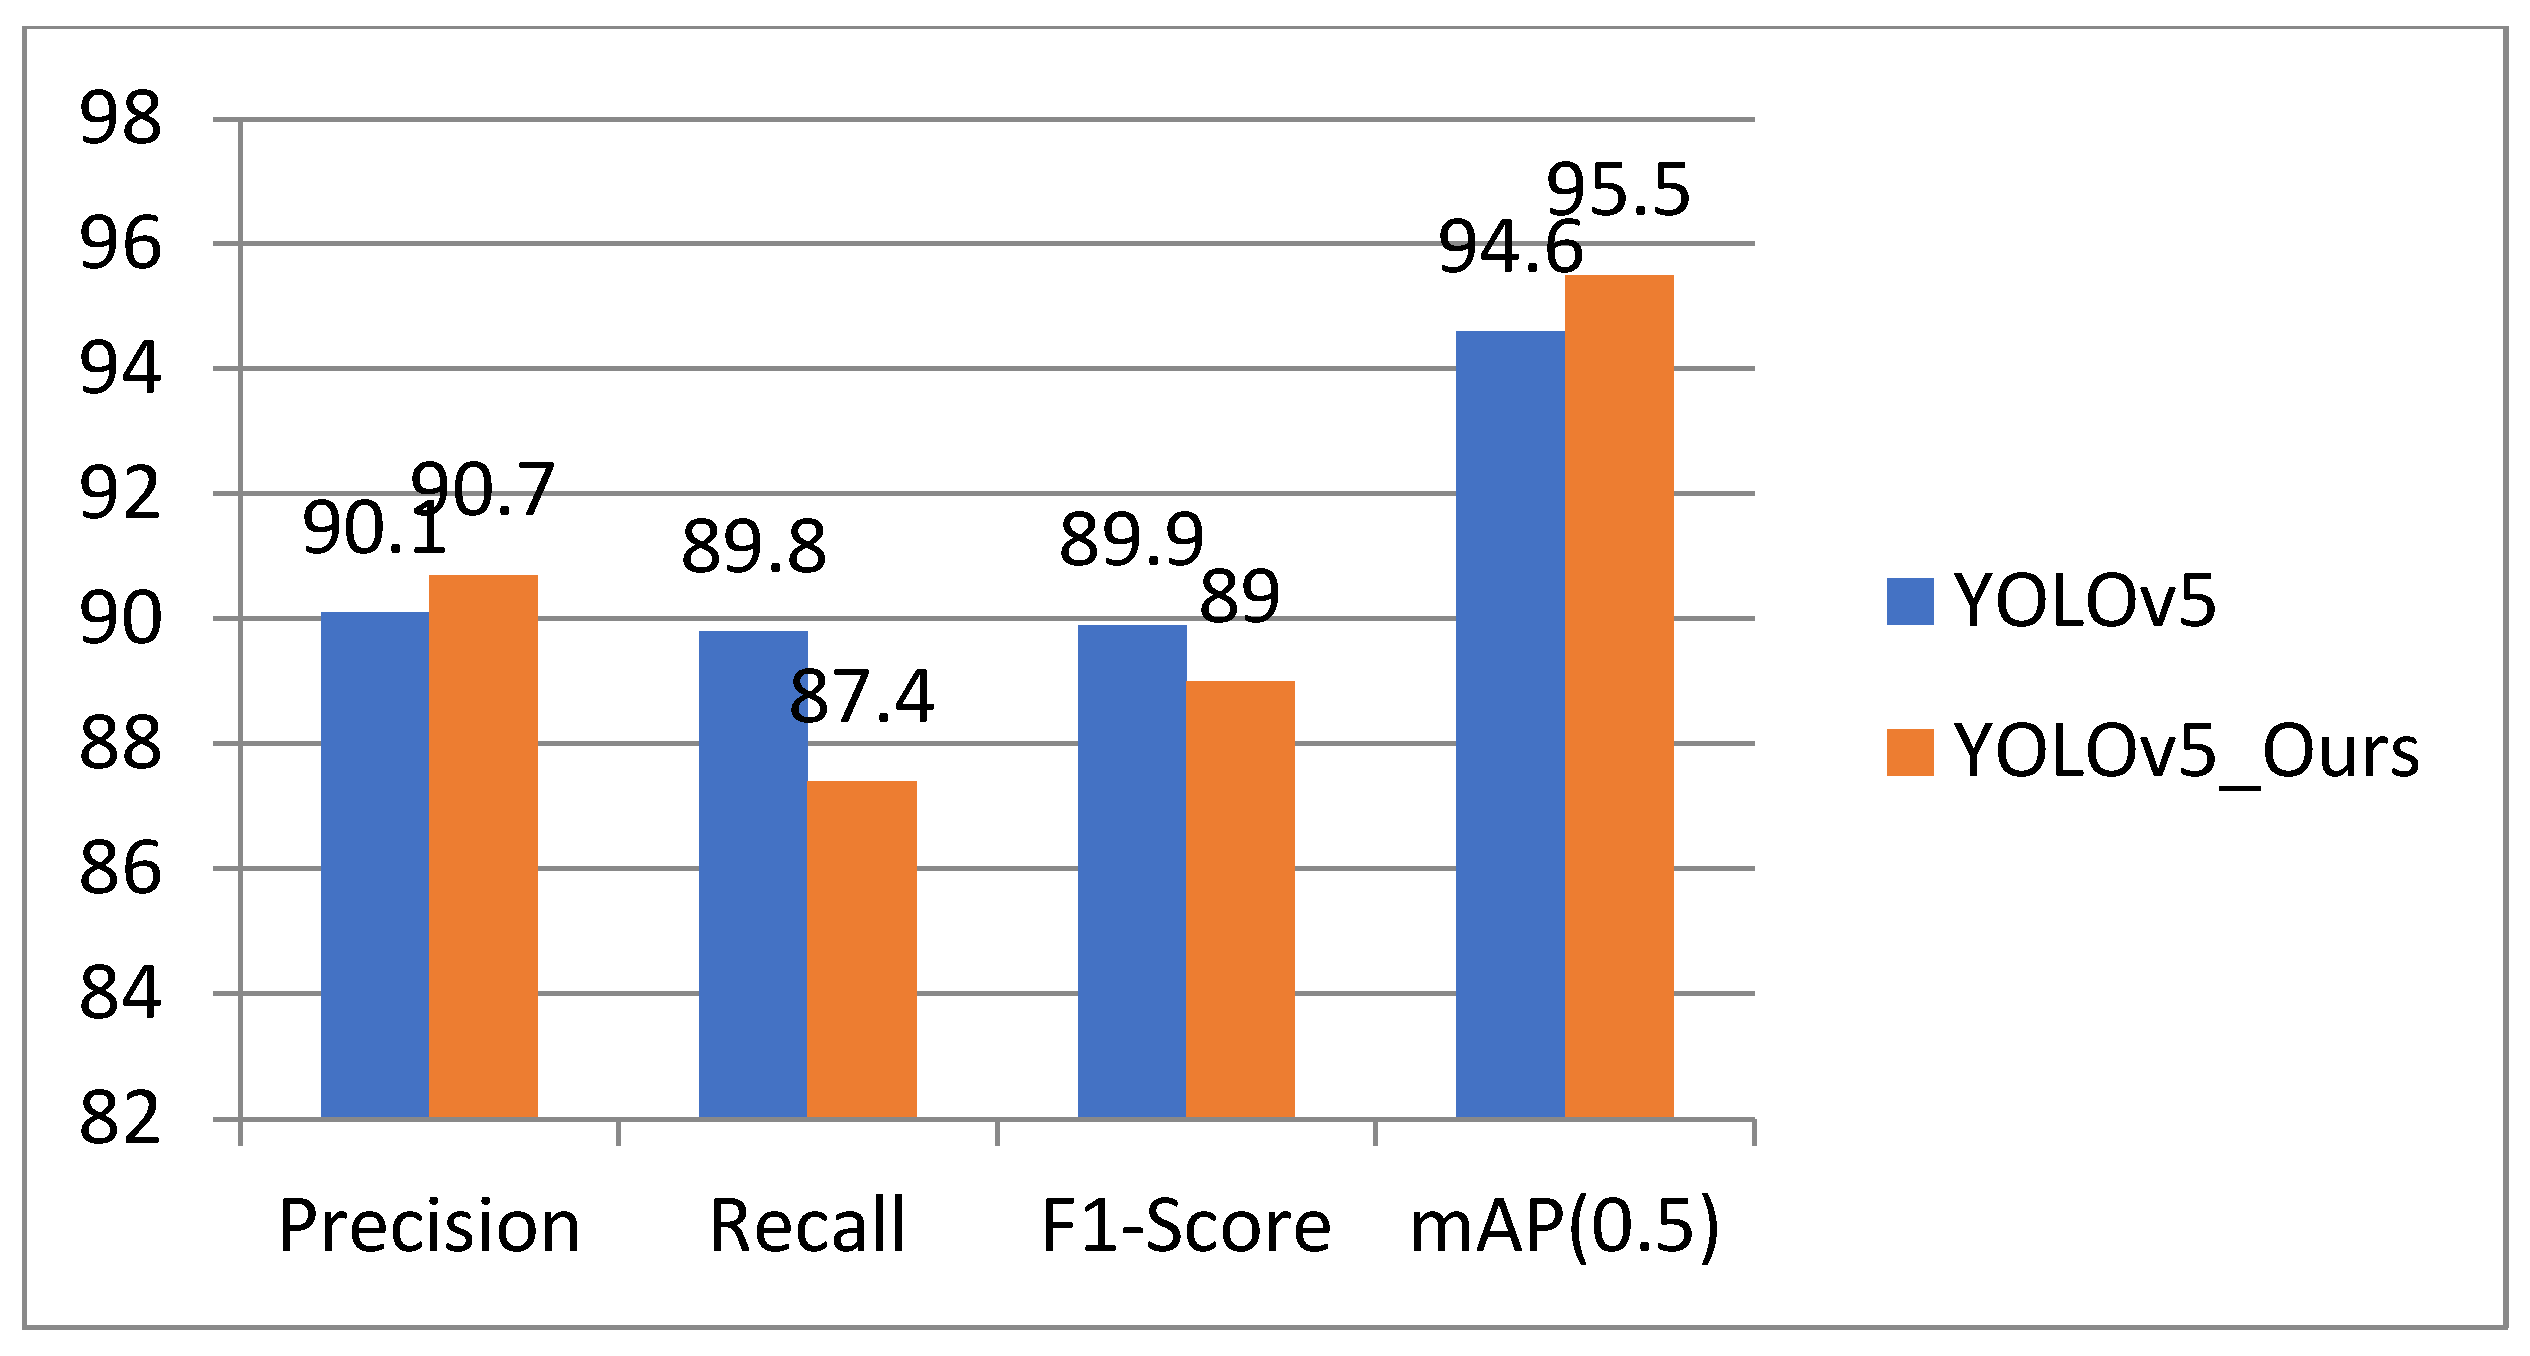
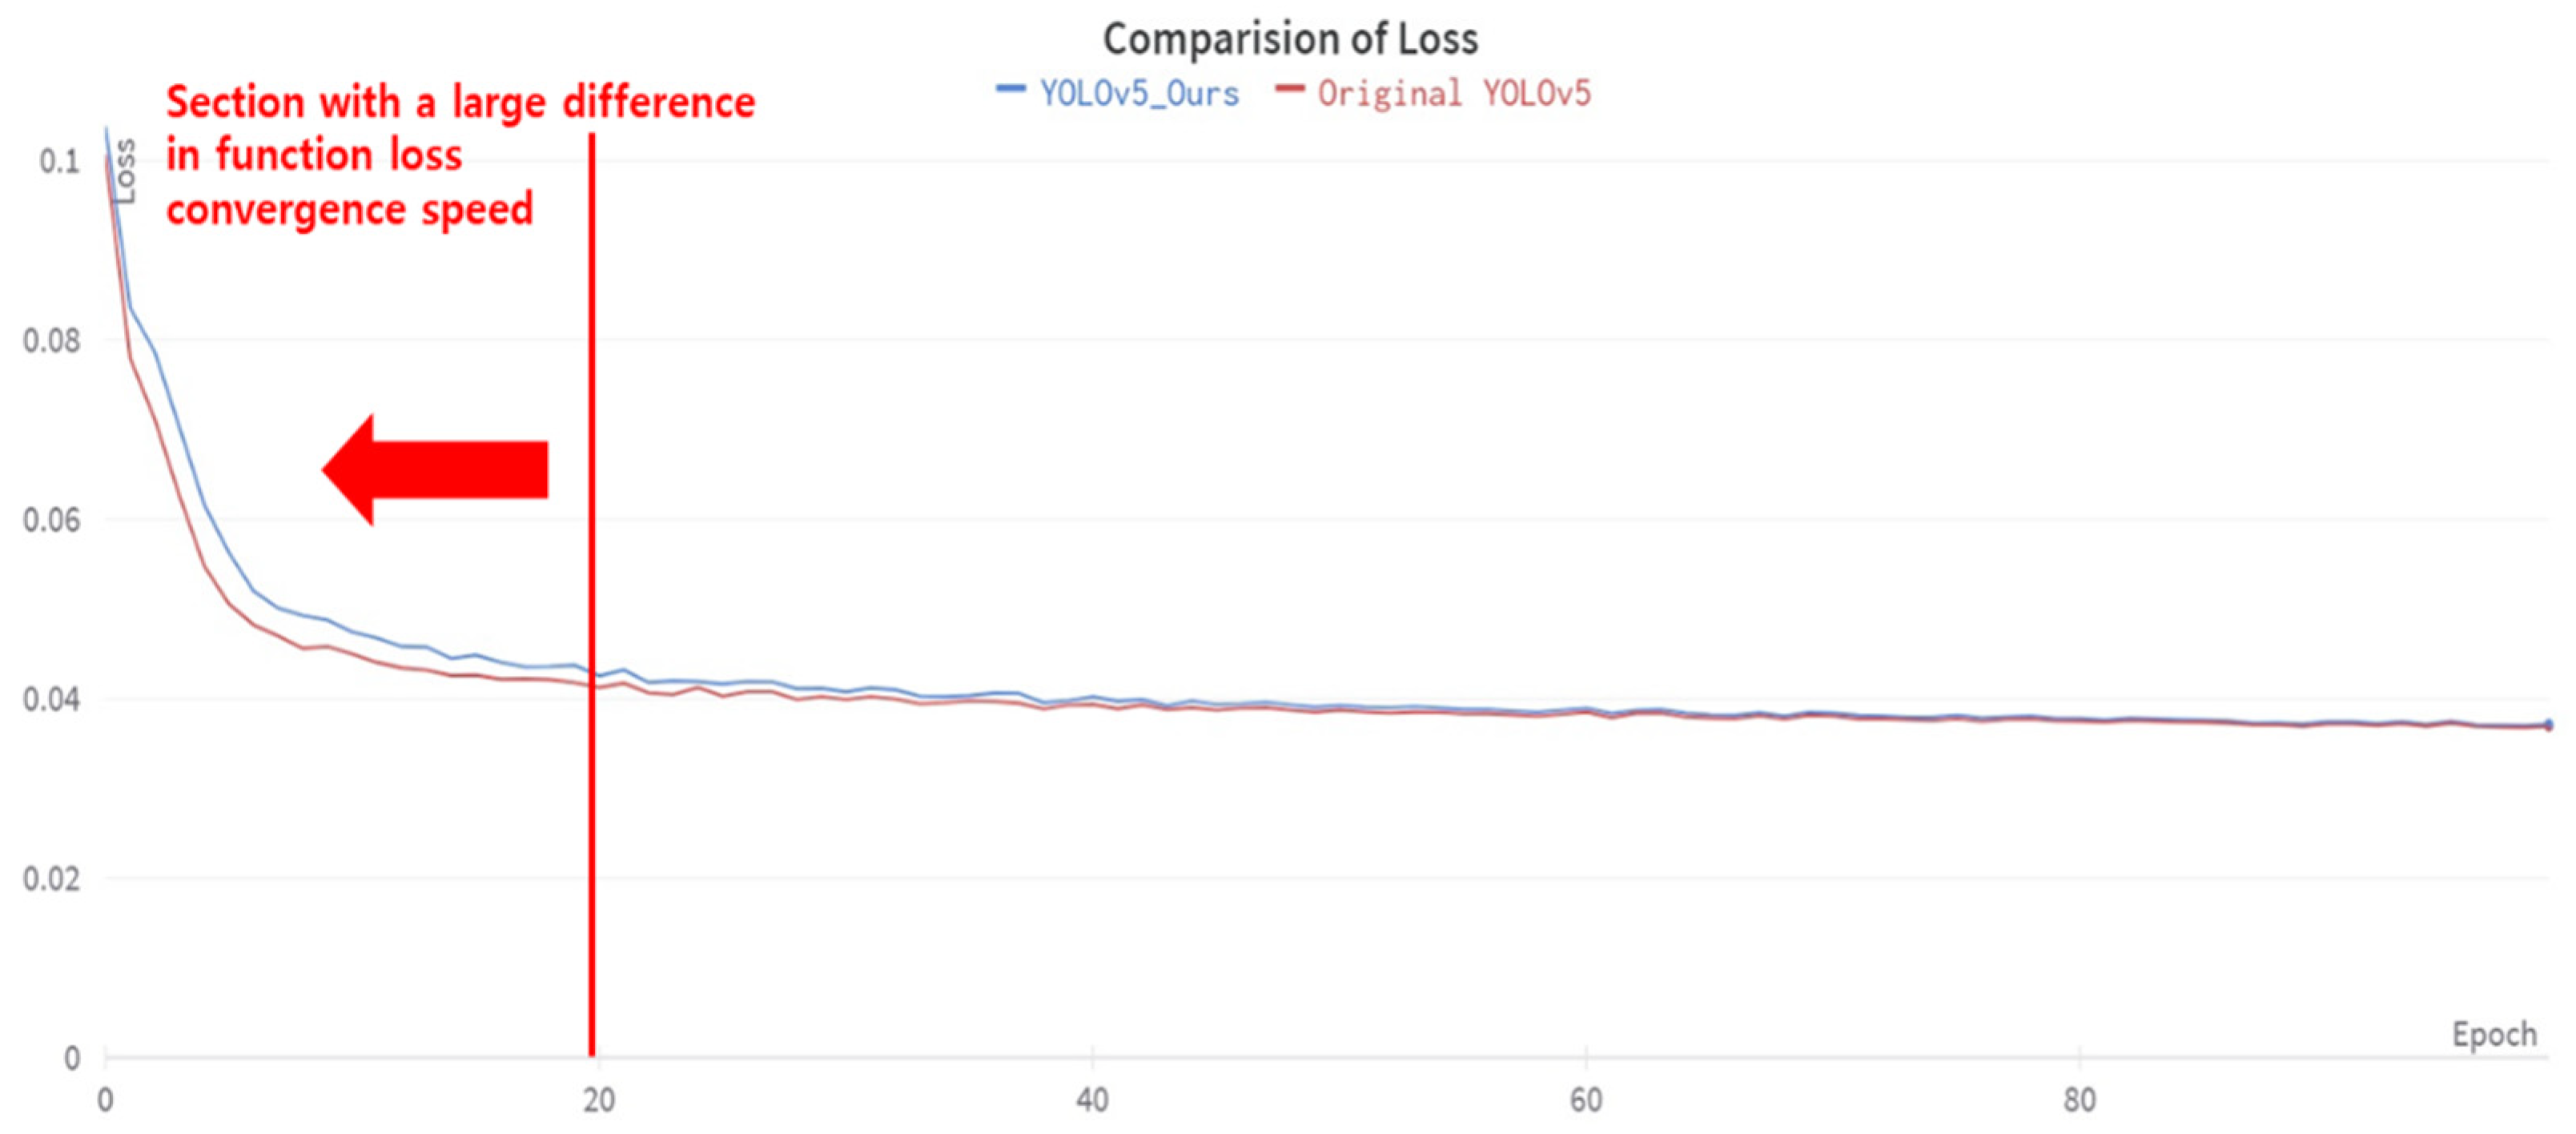
- Secondly, the Precision and mAP (0.5) were increased by modifying the Conv layer, the main layer of the Original YOLOv5 model. We replaced the SiLU activation function of the Conv layer with the ELU activation function. We applied the replaced ConvELU layer to the original C3, SPPF, and Conv layer of the Backbone and head part, and we used CIoU in two models: Original YOLOv5 and YOLOv5_Ours to find association with ELU activation function. As a result, we were able to reduce the convergence speed of loss function at the training process.
2. Materials and Methods
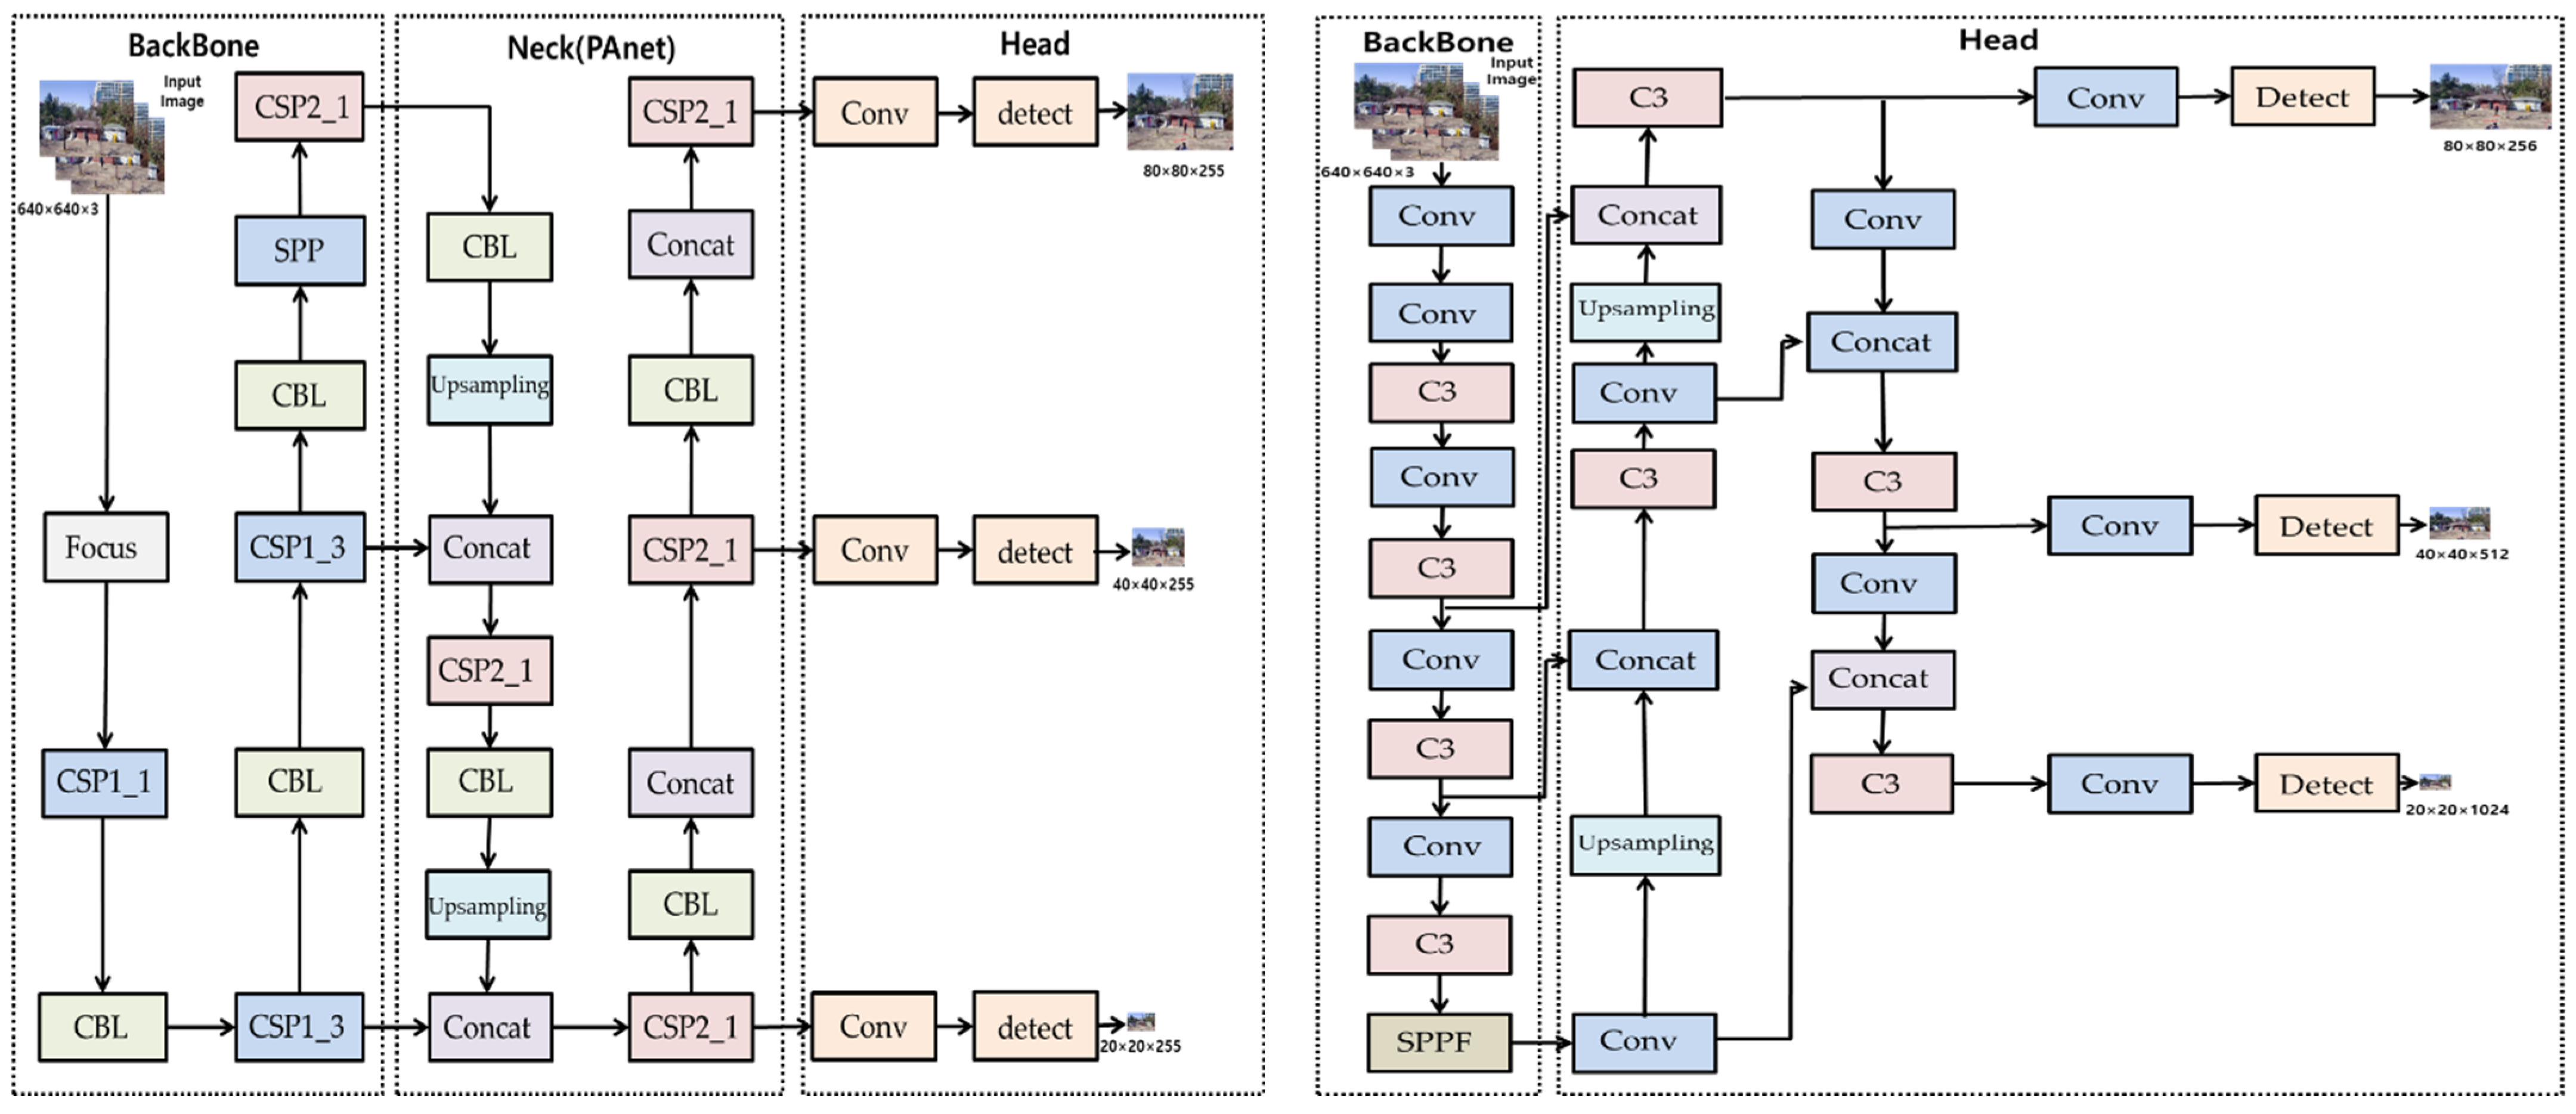
2.1. YOLOv5_Ours Network
- Output size of Conv2d:
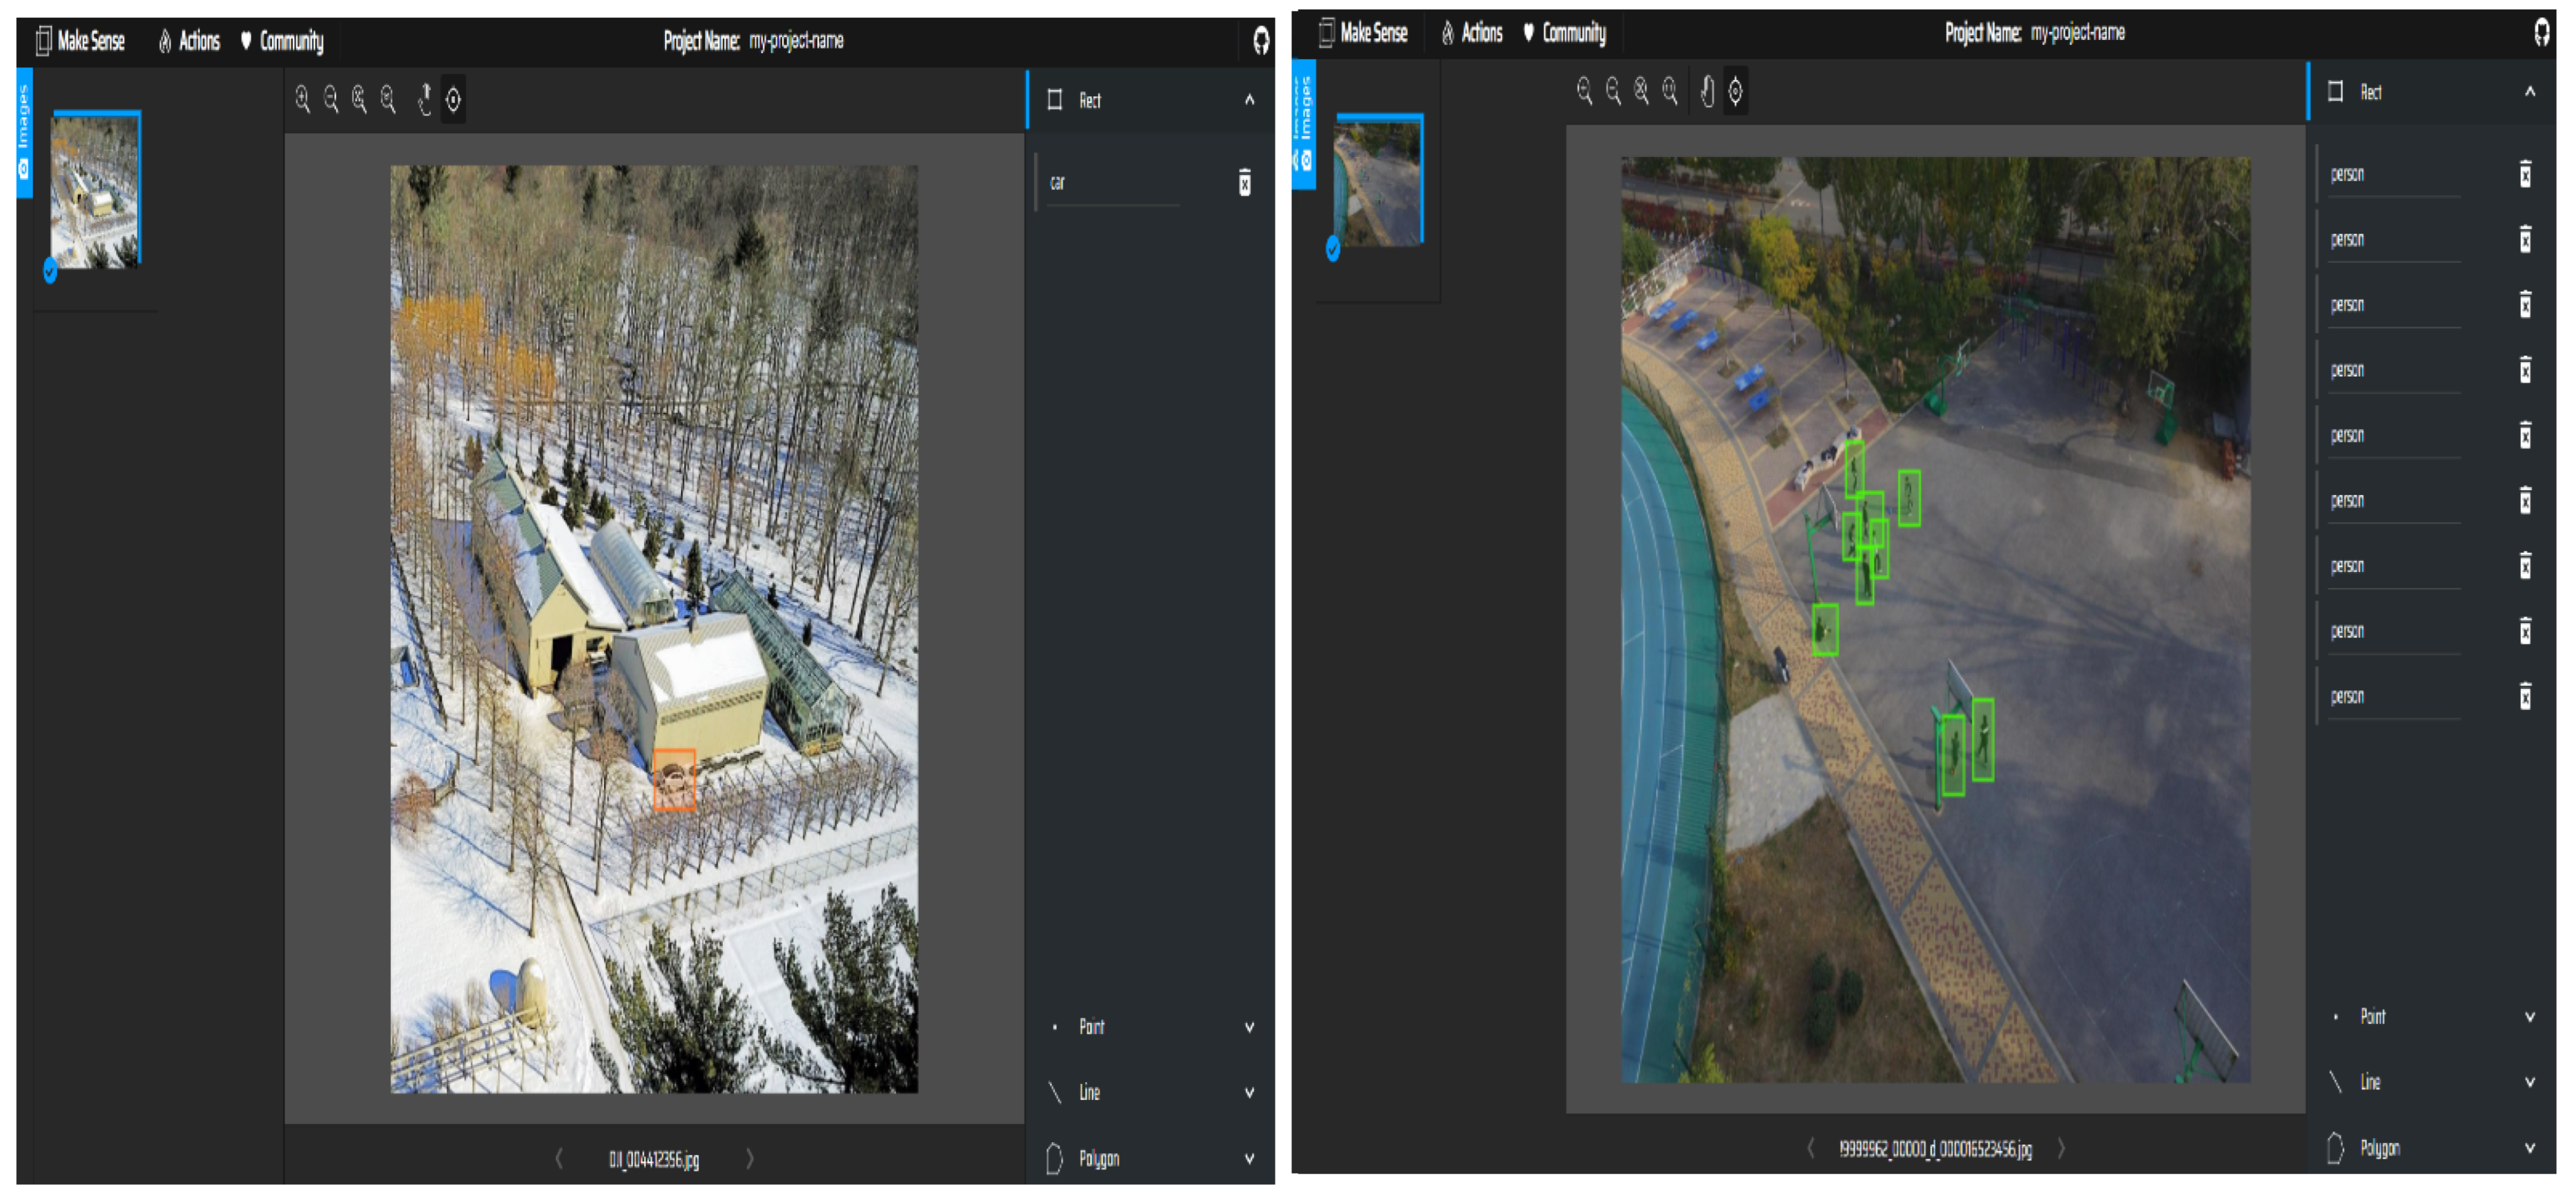
2.2. Data Preparation and Processing
3. Experiment and Results
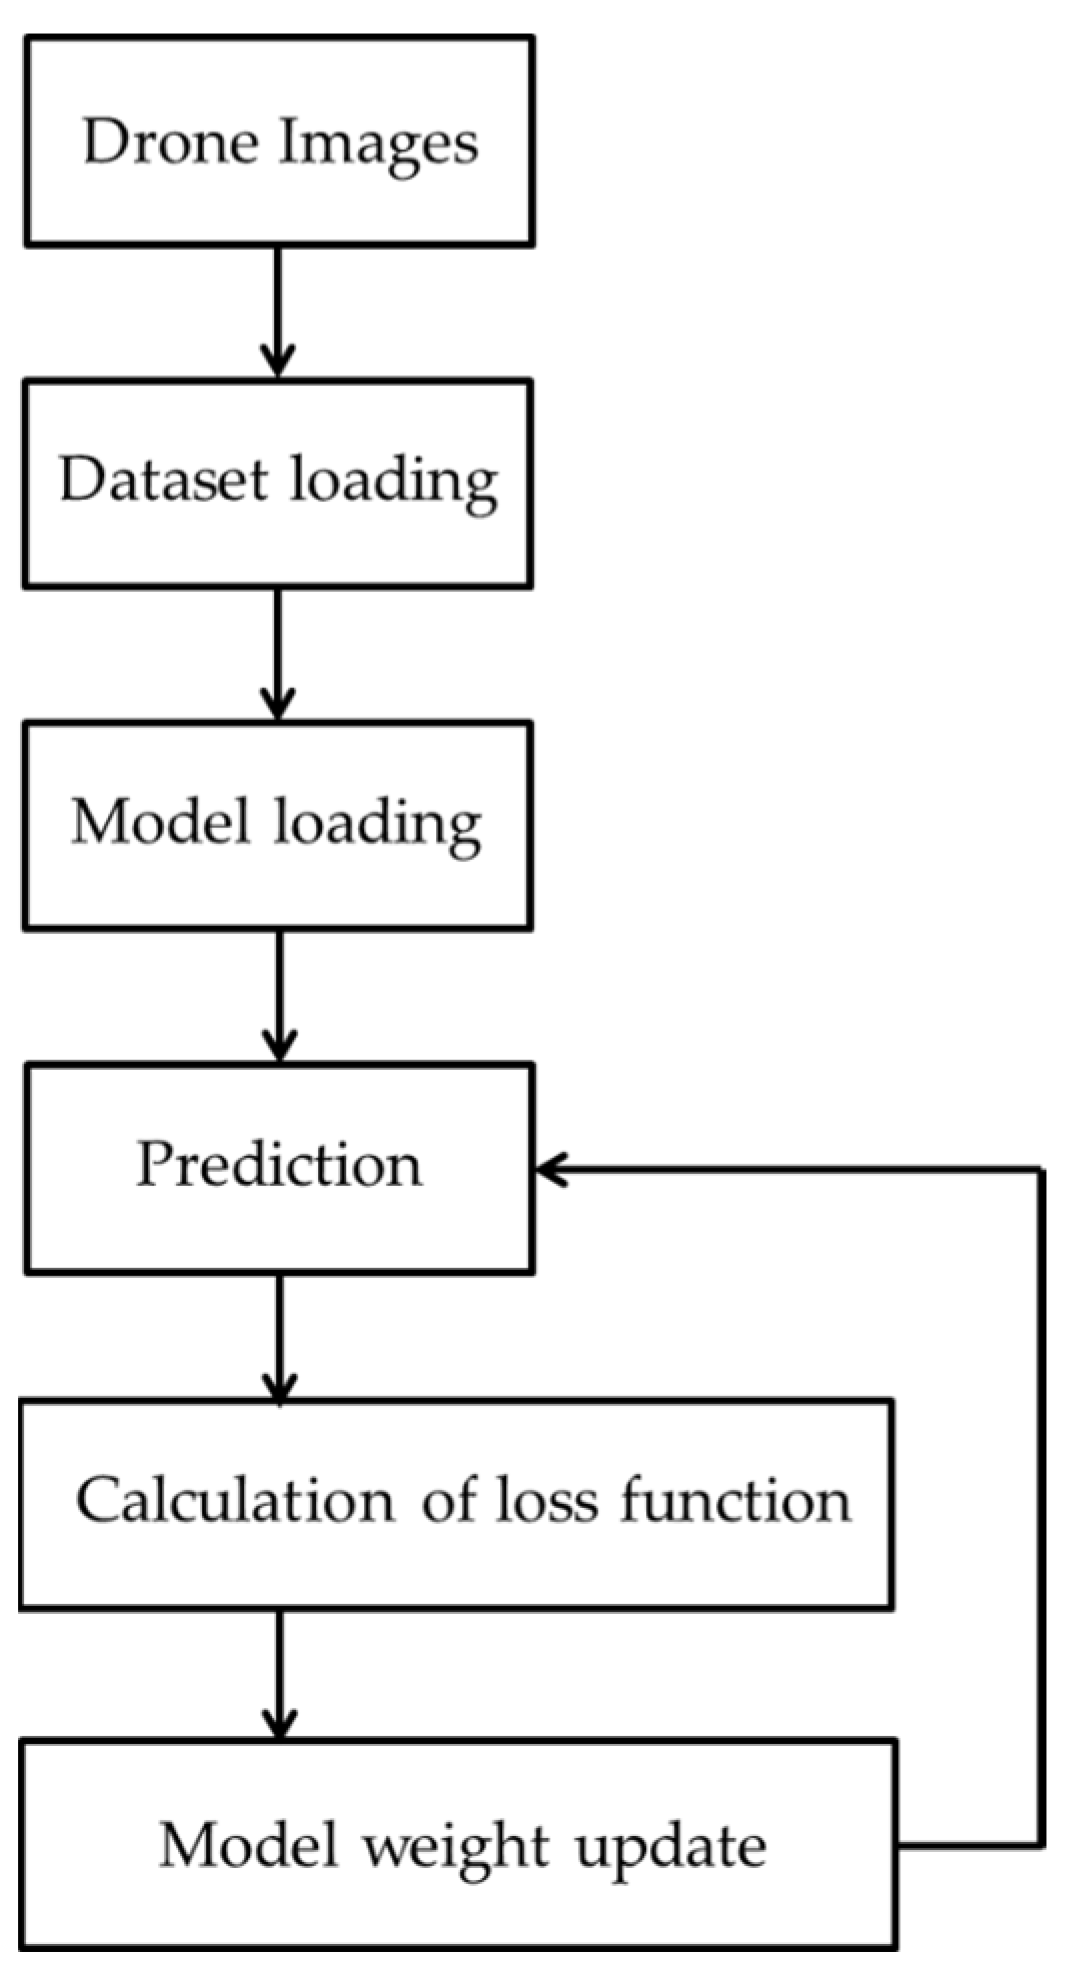
3.1. Experimental Setup and Flowchart
3.2. Experimental Key Indicators
- Precision:
- Recall:
- F1-score:
- AP:
- mAP:
3.3. Experimental Loss Function
- IoU:
- GIoU:
- :
- :
- :
- :
3.4. Results
3.5. Comparison with Previous YOLO Models
4. Conclusions
Author Contributions
Funding
Institutional Review Board Statement
Informed Consent Statement
Data Availability Statement
Acknowledgments
Conflicts of Interest
References
- Marco, W.; Dennis, E.; Andreas, R. Potentials of Low-Budget Microdrones: Processing 3D Point Clouds and Images for Representing Post-Industrial Landmarks in Immersive Virtual Environments. Front. Robot. AI 2022, 9, 886240. [Google Scholar]
- Apostolos, P.; Dimitris, K.; Yannis, K.; Michail, C.; Vasilis, K.; Konstantinos, T.; Michail, V. Mapping Cultural Heritage in Coastal Areas with UAS: The Case Study of Lesvos Island. Heritage 2019, 2, 1404–1422. [Google Scholar]
- Chosun News. Available online: https://chosun.com/international/us/2021/12/12/2A4EGF613NC7RM3S5XI4OA6LW4/ (accessed on 12 December 2021).
- Hung, G.-L.; Sahimi, M.-S.-B.; Samma, H.; Almohamad, T.-A.; Lahasan, B. Faster R-CNN Deep Learning Model for Pedestrian Detection from Drone Images. SN Comput. Sci. 2020, 10, 1007. [Google Scholar] [CrossRef]
- Laroca, R.; Severo, E.; Zanlorensi, L.-A.; Oliveira, L.-S. A Robust Real-Time Automatic License Plate Recognition Based on the YOLO Detector. arXiv 2018, arXiv:1802.09567v6. [Google Scholar]
- Chaschatzis, C.; Karaiskou, C.; Mouratidis, E.-G.; Karagiannis, E.; Sarigiannidis, P.-G. Detection and Characterization of Stressed Sweet Cherry Tissues Using Machine Learning. Drones 2022, 6, 3. [Google Scholar] [CrossRef]
- Kim, J.-k.; Cho, H.-k.; Hwangbo, M.; Choi, J.-H. Deep Traffic Light Detection for Self-driving Cars from a Large-scale Dataset. In Proceedings of the 21st International Conference on Intelligent Transportation Systems, Maui, HI, USA, 4–7 November 2018; pp. 280–285. [Google Scholar]
- Jensen, M.-B.; Philipsen, M.-P.; Møgelmose, A.; Moeslund, T.-B.; Trivedi, M.-M. Vision for Looking at Traffic Lights: Issues, Survey, and Perspectives. IEEE Trans. Intell. Transp. Syst. 2016, 17, 1800–1815. [Google Scholar] [CrossRef] [Green Version]
- Singh, A.; Patil, D.; Omkar, S. Eye in the Sky: Real-time Drone Surveillance System (DSS) for Violent Individuals Identification using ScatterNet Hybrid Deep Learning Network. In Proceedings of the IEEE Conference on Computer Vision and Pattern Recognition Workshop, Salt Lake City, UT, USA, 18–22 June 2018; pp. 1629–1637. [Google Scholar]
- Yang, R.; Pan, Z.; Jia, X.; Zhang, L.; Deng, Y. A Novel CNN-Based Detector for Ship Detection Based on Rotatable Bounding Box in SAR Images. IEEE J. Sel. Top. Appl. Earth Obs. Remote Sens. 2021, 14, 1938–1958. [Google Scholar] [CrossRef]
- Jayalath, K.; Munasinghe, S.-R. Drone-based Autonomous Human Identification for Search and Rescue Missions in Real-time. In Proceedings of the 2021 10th International Conference on Information and Automation for sustainability, Negambo, Sri Lanka, 11–13 August 2021; pp. 518–523. [Google Scholar]
- Rizk, M.; Slim, F.; Charara, J. Toward AI-Assisted UAV for Human Detection in Search and Rescue Missions. In Proceedings of the 2021 International Conference on Decision Aid Sciences and Application, Sakheer, Bahrain, 7–8 December 2021; pp. 781–786. [Google Scholar]
- Tariq, R.; Rahim, M.; Aslam, N.; Bawany, N.; Faseeha, U. Dronaid: A smart human detection drone for rescue. In Proceedings of the 15th International Conference on Smart Cities: Improving Quality of Life Using ICT & IoT, Islamabad, Pakistan, 8–10 October 2018; pp. 33–37. [Google Scholar]
- Sharma, T.; Debaque, B.; Duclos, N.; Chehri, A.; Kinder, B.; Fortier, P. Deep Learning-Based Object Detection and Scene Perception under Bad Weather Conditions. Electronics 2022, 11, 563. [Google Scholar] [CrossRef]
- Zhu, P.; Wen, L.; Bian, X.; Ling, H.; Hu, Q. Vision Meets Drones: A Challenge. arXiv 2018, arXiv:1804.07437v2. [Google Scholar]
- Ren, S.; He, K.; Girshick, R.; Sun, J. Faster R-CNN: Towards Real-Time Object Detection with Region Proposal Networks. Neural 2015, 91–99. [Google Scholar] [CrossRef] [Green Version]
- He, K.; Gkioxari, G.; Dollár, P.; Girshick, R. Mask R-CNN. In Proceedings of the IEEE International Conference on Computer Vision, Venice, Italy, 22–29 October 2017; pp. 2961–2969. [Google Scholar]
- Redmon, J.; Divvala, S.; Girshick, R.; Farhadi, A. You Only Look Once: Unified, Real-Time Object Detection. CVF 2016, 779–788. [Google Scholar]
- Zhu, X.; Lyu, S.; Wang, X.; Zhao, Q. TPH-YOLOv5: Improved YOLOv5 Based on Transformer Prediction Head for Object Detection on Drone-captured Scenarios. CVF 2021, 2108, 11539. [Google Scholar]
- Liu, W.; Anguelov, D.; Erhan, D.; Szegedy, C.; Reed, S.; Fu, C.-Y.; Berg, A.-C. SSD: Single Shot MultiBox Detector. In European Conference on Computer Vision; Springer: Cham, Switzerland, 2016; pp. 21–37. [Google Scholar]
- Rahmaniar, W.; Hernawan, A. Real-Time Human Detection Using Deep Learning on Embedded Platforms: A Review. J. Robot. Control 2021, 2, 462–468. [Google Scholar]
- Lin, T.-Y.; Goyal, P.; Girshick, R.; He, K.; Dollár, P. Focal Loss for Dense Object Detection. In Proceedings of the IEEE International Conference on Computer Vision, Venice, Italy, 22–29 October 2017; pp. 2980–2988. [Google Scholar]
- Zhang, S.; Wen, L.; Bian, X.; Lei, Z.; Li, S. Single-Shot Refinement Neural Network for Object Detection. In Proceedings of the IEEE Conference on Computer Vision and Pattern Recognition, Salt Lake City, UT, USA, 18–23 June 2018; pp. 4203–4212. [Google Scholar]
- Cheng, D.; Gong, Y.; Zhou, S.; Wang, J.; Zheng, N. Person Re-Identification by Multi-Channel Parts-Based CNN with Improved Triplet Loss Function. CVF 2016, 1335–1344. [Google Scholar]
- Jiang, P.; Ergu, D.; Liu, F.; Cai, Y.; Ma, B. A Review of Yolo Algorithm Developments. Procedia Comput. Sci. 2022, 199, 1066–1073. [Google Scholar] [CrossRef]
- Lee, Y.-H.; Kim, Y.-S. Comparison of CNN and YOLO for Object Detection. J. Semicond. Disp. Technol. 2020, 19, 1. [Google Scholar]
- Zhang, L.; Lin, L.; Liang, X.; He, K. Is Faster R-CNN Doing Well for Pedestrian Detection? ECCV 2016, 10, 1007. [Google Scholar]
- Ultralytics/yolov5. Available online: https://github.com/ultralytics/yolov5 (accessed on 25 June 2020).
- Jia, W.; Xu, S.; Liang, Z.; Zhao, Y.; Min, H.; Li, S.; Yu, Y. Real-time automatic helmet detection of motorcyclists in urban traffic using improved YOLOv5 detector. IET Image Process. 2021, 10, 1049. [Google Scholar] [CrossRef]
- Wang, C.-Y.; Mark Liao, H.-Y.; Wu, Y.-H.; Chen, P.-Y.; Hsieh, J.-W.; Yeh, I.-H. CSPNet: A New Backbone that can Enhance Learning Capability of CNN. CVF 2020, 14–19. [Google Scholar]
- Redmon, J.; Farhadi, A. YOLOv3: An Incremental Improvement. arXiv 2018, arXiv:1804.02767. [Google Scholar]
- Glenn-Jocher. Available online: https://github.com/ultralytics/yolov5/discussions/3181m1 (accessed on 16 May 2021).
- Li, S.; Li, Y.; Li, Y.; Li, M.; Xu, X. YOLO-FIRI: Improved YOLOv5 for Infrared Image Object Detection. IEEE Access 2021, 2021, 3120870. [Google Scholar] [CrossRef]
- Bochkovskiy, A.; Wang, C.-Y.; Mark Liao, H.-Y. YOLOv4: Optimal Speed and Accuracy of Object Detection. arXiv 2020, arXiv:2004.10934. [Google Scholar]
- Wang, H.; Zhang, S.; Zhao, S.; Wang, Q.; Li, D.; Zhao, R. Real-time detection and Tracking of fish abnormal behavior based on improved YOLOV5 and SiamRPN++. Comput. Electron. Agric. 2022, 192, 106512. [Google Scholar] [CrossRef]
- Li, Z.; Lu, K.; Zhang, Y.; Li, Z.; Liu, J.-B. Research on Energy Efficiency Management of Forklift Based on Improved YOLOv5 Algorithm. J. Math. 2021, 2021, 5808221. [Google Scholar] [CrossRef]
- Glenn-Jocher. Available online: https://github.com/ultralytics/yolov5/issues/4825 (accessed on 16 September 2021).
- VisDrone. Available online: http://aiskyeye.com (accessed on 5 June 2021).
- Yaru, C.; Zhijian, H.; Lujia, W. VisDrone-DET2021: The Vision Meets Drone Object detection Challenge Results. In Proceedings of the IEEE/CVF International Conference on Computer Vision, Montreal, QC, Canada, 10–17 October 2021; pp. 2847–2854. [Google Scholar]
- Piotr Skalski. Available online: https://makesense.ai (accessed on 14 July 2019).
- Zhang, H.; Tian, M.; Shao, G.; Cheng, J.; Liu, J. Target Detection of Forward-Looking Sonar Image Based on Improved YOLOv5. IEEE Access 2022, 2022, 3150339. [Google Scholar] [CrossRef]
- Borui, J.; Ruixuan, L.; Jiayuan, M.; Tete, X.; Yuning, J. Acquisition of Localization Confidence for Accurate Object Detection. In Proceedings of the European Conference on Computer Vision (ECCV), Munich, Germany, 8–14 September 2018; pp. 784–799. [Google Scholar]
- Yang, H.; Chen, L.; Chen, M.; Ma, Z.; Deng, F.; Li, M.; Li, X. Detection of coal and gangue based on improved YOLOv5.1 which embedded scSE module. Measurement 2021, 10, 1016. [Google Scholar]
- Glenn-Jocher. Available online: https://github.com/ultralytics/yolov5/issues/2180 (accessed on 12 February 2021).
- Kasper-Eulaers, M.; Hahn, N.; Berger, S.; Sebulonsen, T.; Myrland, Q.; Kummervold, P.-E. Short Communication: Detecting Heavy Goods Vehicles in Rest Areas in Winter Conditions Using YOLOv5. Algorithms 2021, 14, 114. [Google Scholar] [CrossRef]
- Changrui, C.; Yu, Z.; Qingxuan, L.; Shuo, W.; Xiaorui, W.; Xin, S.; Junyu, D. RRNet: A Hybrid Detector for Object Detection in Drone-captured Images. In Proceedings of the IEEE/CVF International Conference on Computer Vision Workshops, Seoul, Korea, 27–28 October 2019. [Google Scholar]
- Ali, R.; Mohammed, R.; Sung-Ho, K. Convolutional Neural Network-Based Real-Time Object Detection and Tracking for Parrot AR Drone 2. IEEE Access 2019, 7, 69575–69584. [Google Scholar]


| Dataset | Experimental Conditions | Number of Images |
|---|---|---|
| Training | Clear day | 260 |
| Cloudy day | 260 | |
| Rainy day | 260 | |
| Snowy day | 260 | |
| Evening | 260 | |
| Night | 260 | |
| Low altitude | 260 | |
| High altitude | 260 | |
| Validation | Clear day | 120 |
| Cloudy day | 120 | |
| Rainy day | 120 | |
| Snowy day | 120 | |
| Evening | 120 | |
| Night | 120 | |
| Low altitude | 120 | |
| High altitude | 120 | |
| Testing | Clear day | 40 |
| Cloudy day | 40 | |
| Rainy day | 40 | |
| Snowy day | 40 | |
| Evening | 40 | |
| Night | 40 | |
| Low altitude | 40 | |
| High altitude | 40 |
| Model | Backbone | Precision | Recall | F-1 Score | mAP (0.5) |
|---|---|---|---|---|---|
| YOLOv5 | CSPdarknet | 90.1 | 89.8 | 89.9 | 94.6 |
| YOLOv5_Ours | CSPdarknet | 90.7 | 87.4 | 89.0 | 95.5 |
| Parameter | Person | Car | Notice | Total |
|---|---|---|---|---|
| Precision/% | 97.1 | 87.4 | 87.7 | 90.7 |
| Recall/% | 84.3 | 94.6 | 83.1 | 87.4 |
| F1-Score/% | 90.2 | 90.9 | 85.3 | 88.8 |
| mAP (0.5)/% | 97.3 | 96.2 | 93.0 | 95.5 |
| Model | Backbone | mAP (0.5) |
|---|---|---|
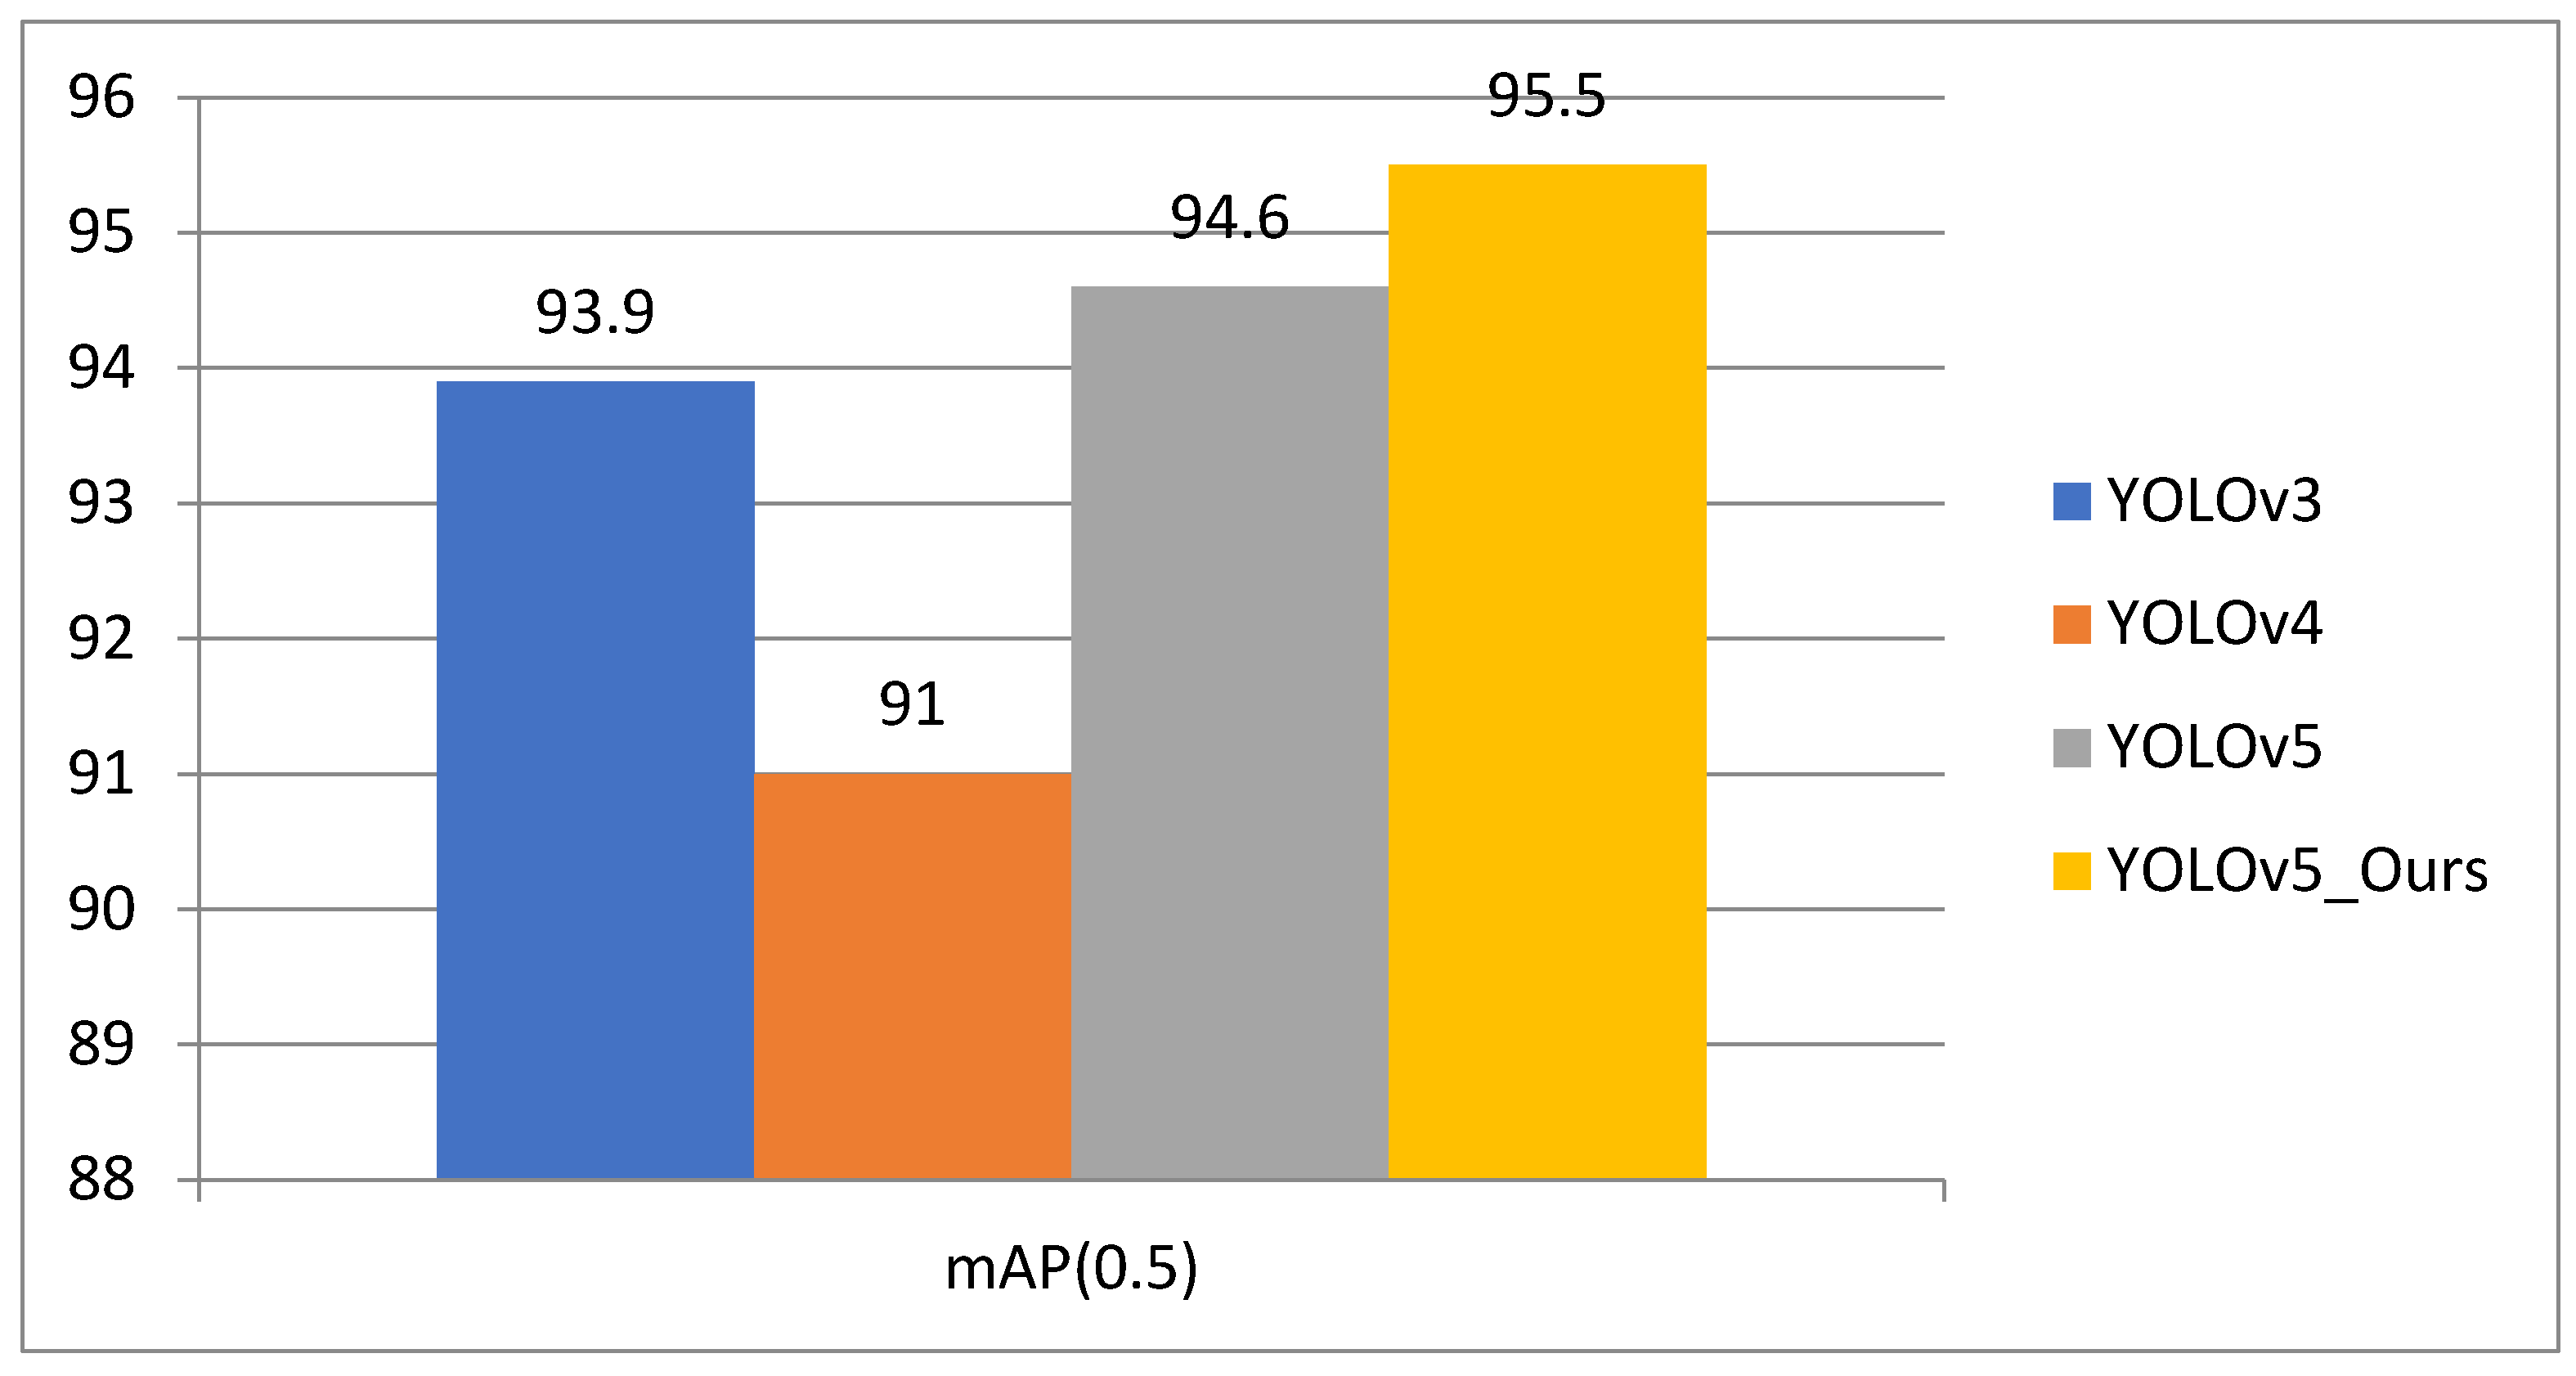
| YOLOv3 | Darknet53 | 93.9 |
| YOLOv4 | CSPdarknet | 91.0 |
| YOLOv5 | CSPdarknet | 94.6 |
| YOLOv5_Ours | CSPdarknet | 95.5 |
Publisher’s Note: MDPI stays neutral with regard to jurisdictional claims in published maps and institutional affiliations. |
© 2022 by the authors. Licensee MDPI, Basel, Switzerland. This article is an open access article distributed under the terms and conditions of the Creative Commons Attribution (CC BY) license (https://creativecommons.org/licenses/by/4.0/).
Share and Cite
Jung, H.-K.; Choi, G.-S. Improved YOLOv5: Efficient Object Detection Using Drone Images under Various Conditions. Appl. Sci. 2022, 12, 7255. https://doi.org/10.3390/app12147255
Jung H-K, Choi G-S. Improved YOLOv5: Efficient Object Detection Using Drone Images under Various Conditions. Applied Sciences. 2022; 12(14):7255. https://doi.org/10.3390/app12147255
Chicago/Turabian StyleJung, Hyun-Ki, and Gi-Sang Choi. 2022. "Improved YOLOv5: Efficient Object Detection Using Drone Images under Various Conditions" Applied Sciences 12, no. 14: 7255. https://doi.org/10.3390/app12147255