
Impact of Virtual Reality-Based Design Review System on User’s Performance and Cognitive Behavior for Building Design Review Tasks


Abstract
:1. Introduction
2. Literature Review
2.1. Virtual Reality in the Design and Construction
2.2. Impact of Virtual Reality on the Cognitive Load, Task Performance, and Situational Awareness
3. Research Methodology
3.1. Participants
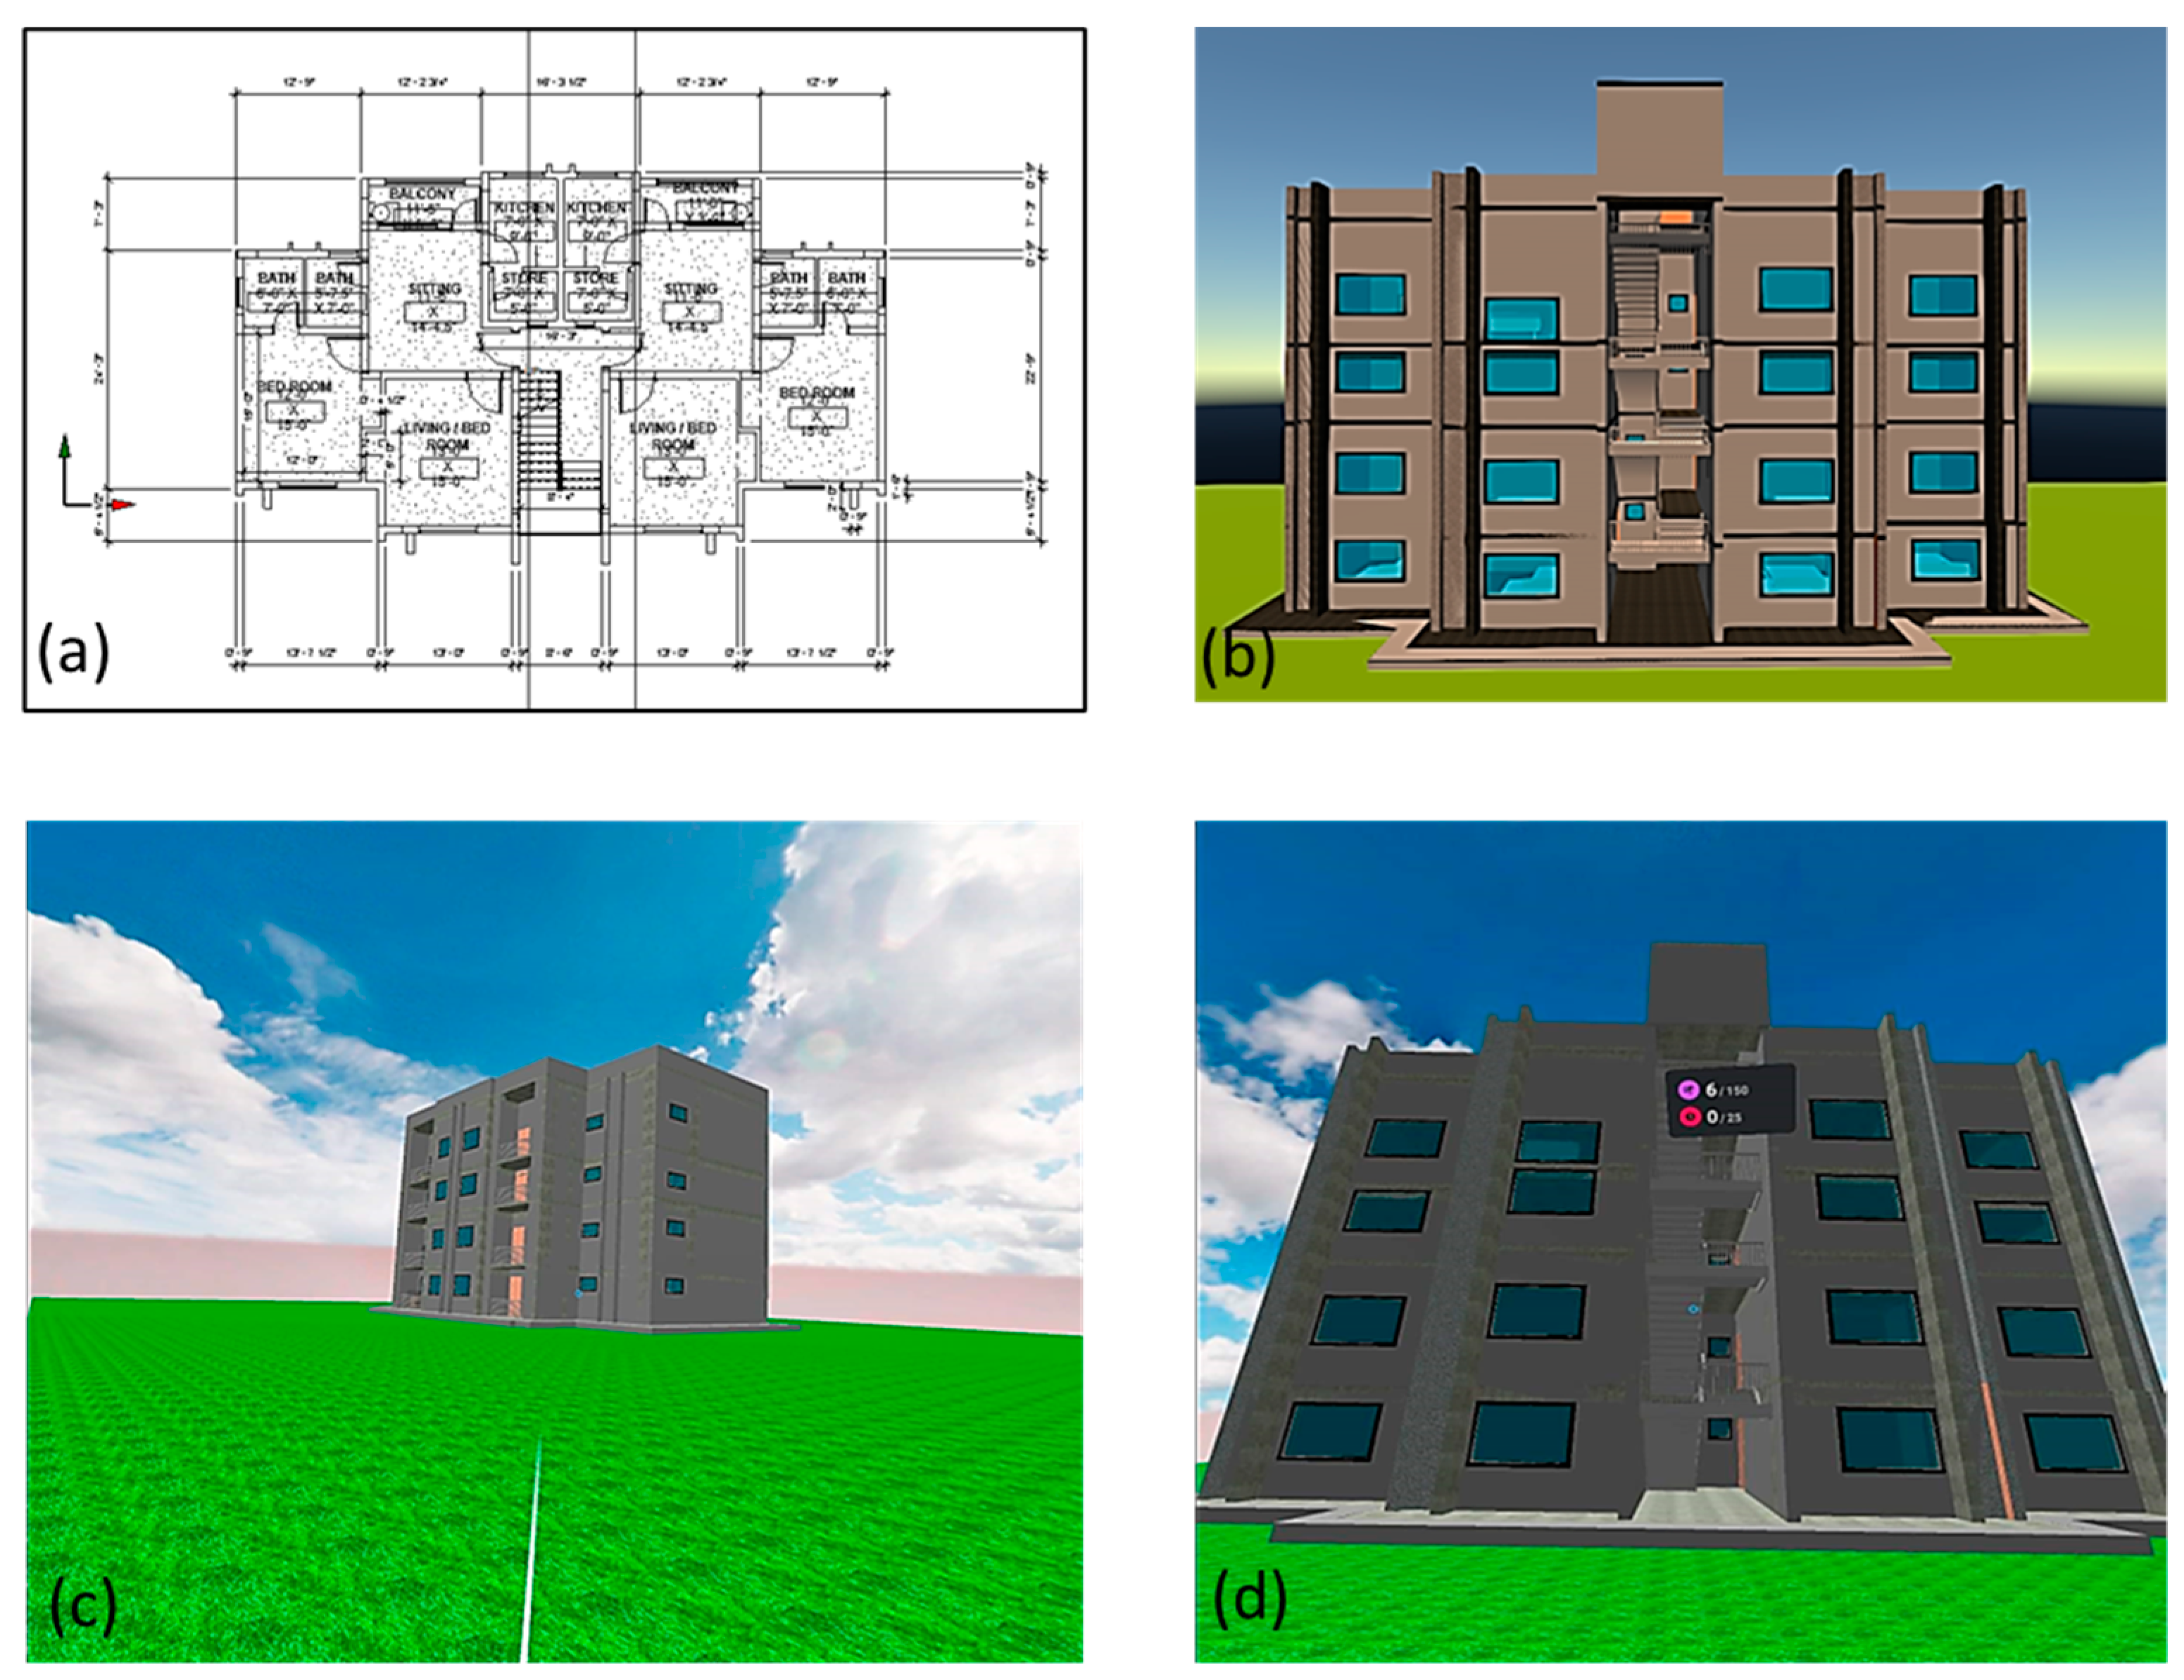
3.2. Task Overview
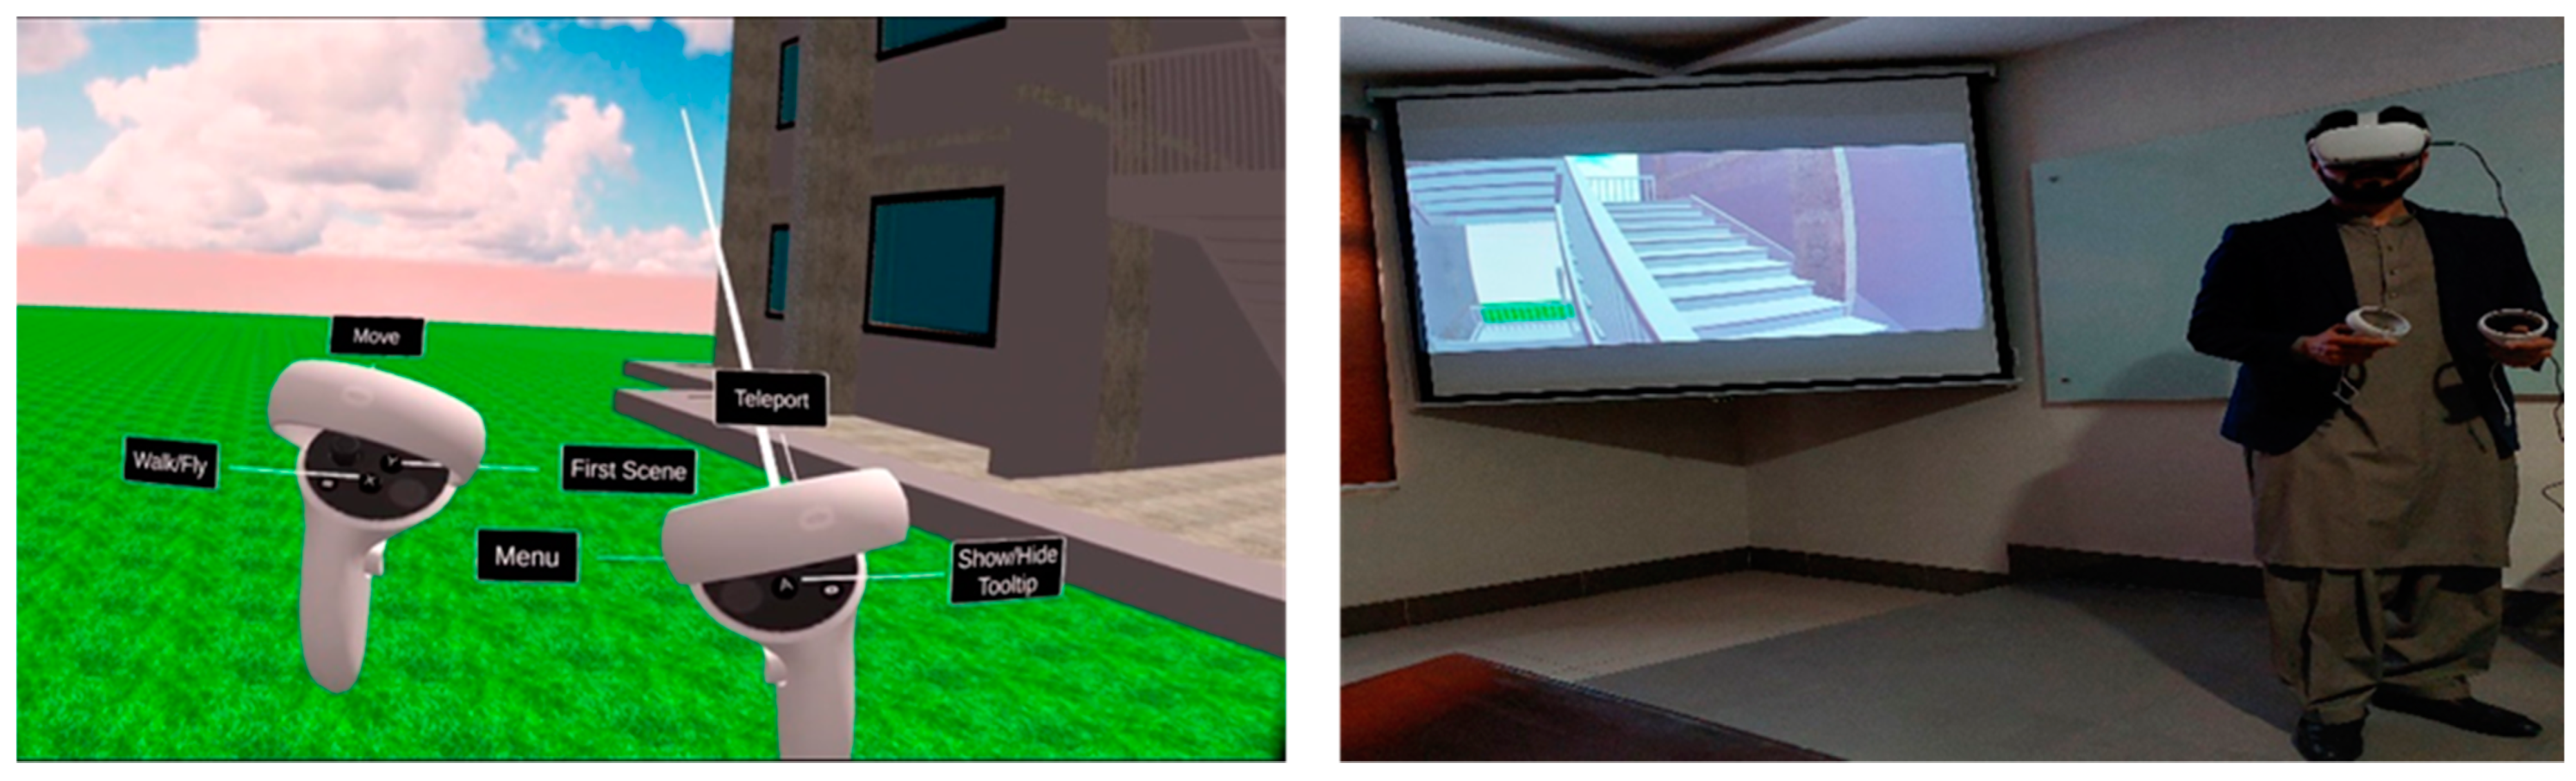
3.3. Experimental Procedure
3.4. Measurements
3.5. Data Analysis Techniques
4. Results and Discussion
4.1. Data Analysis
4.2. Experiment
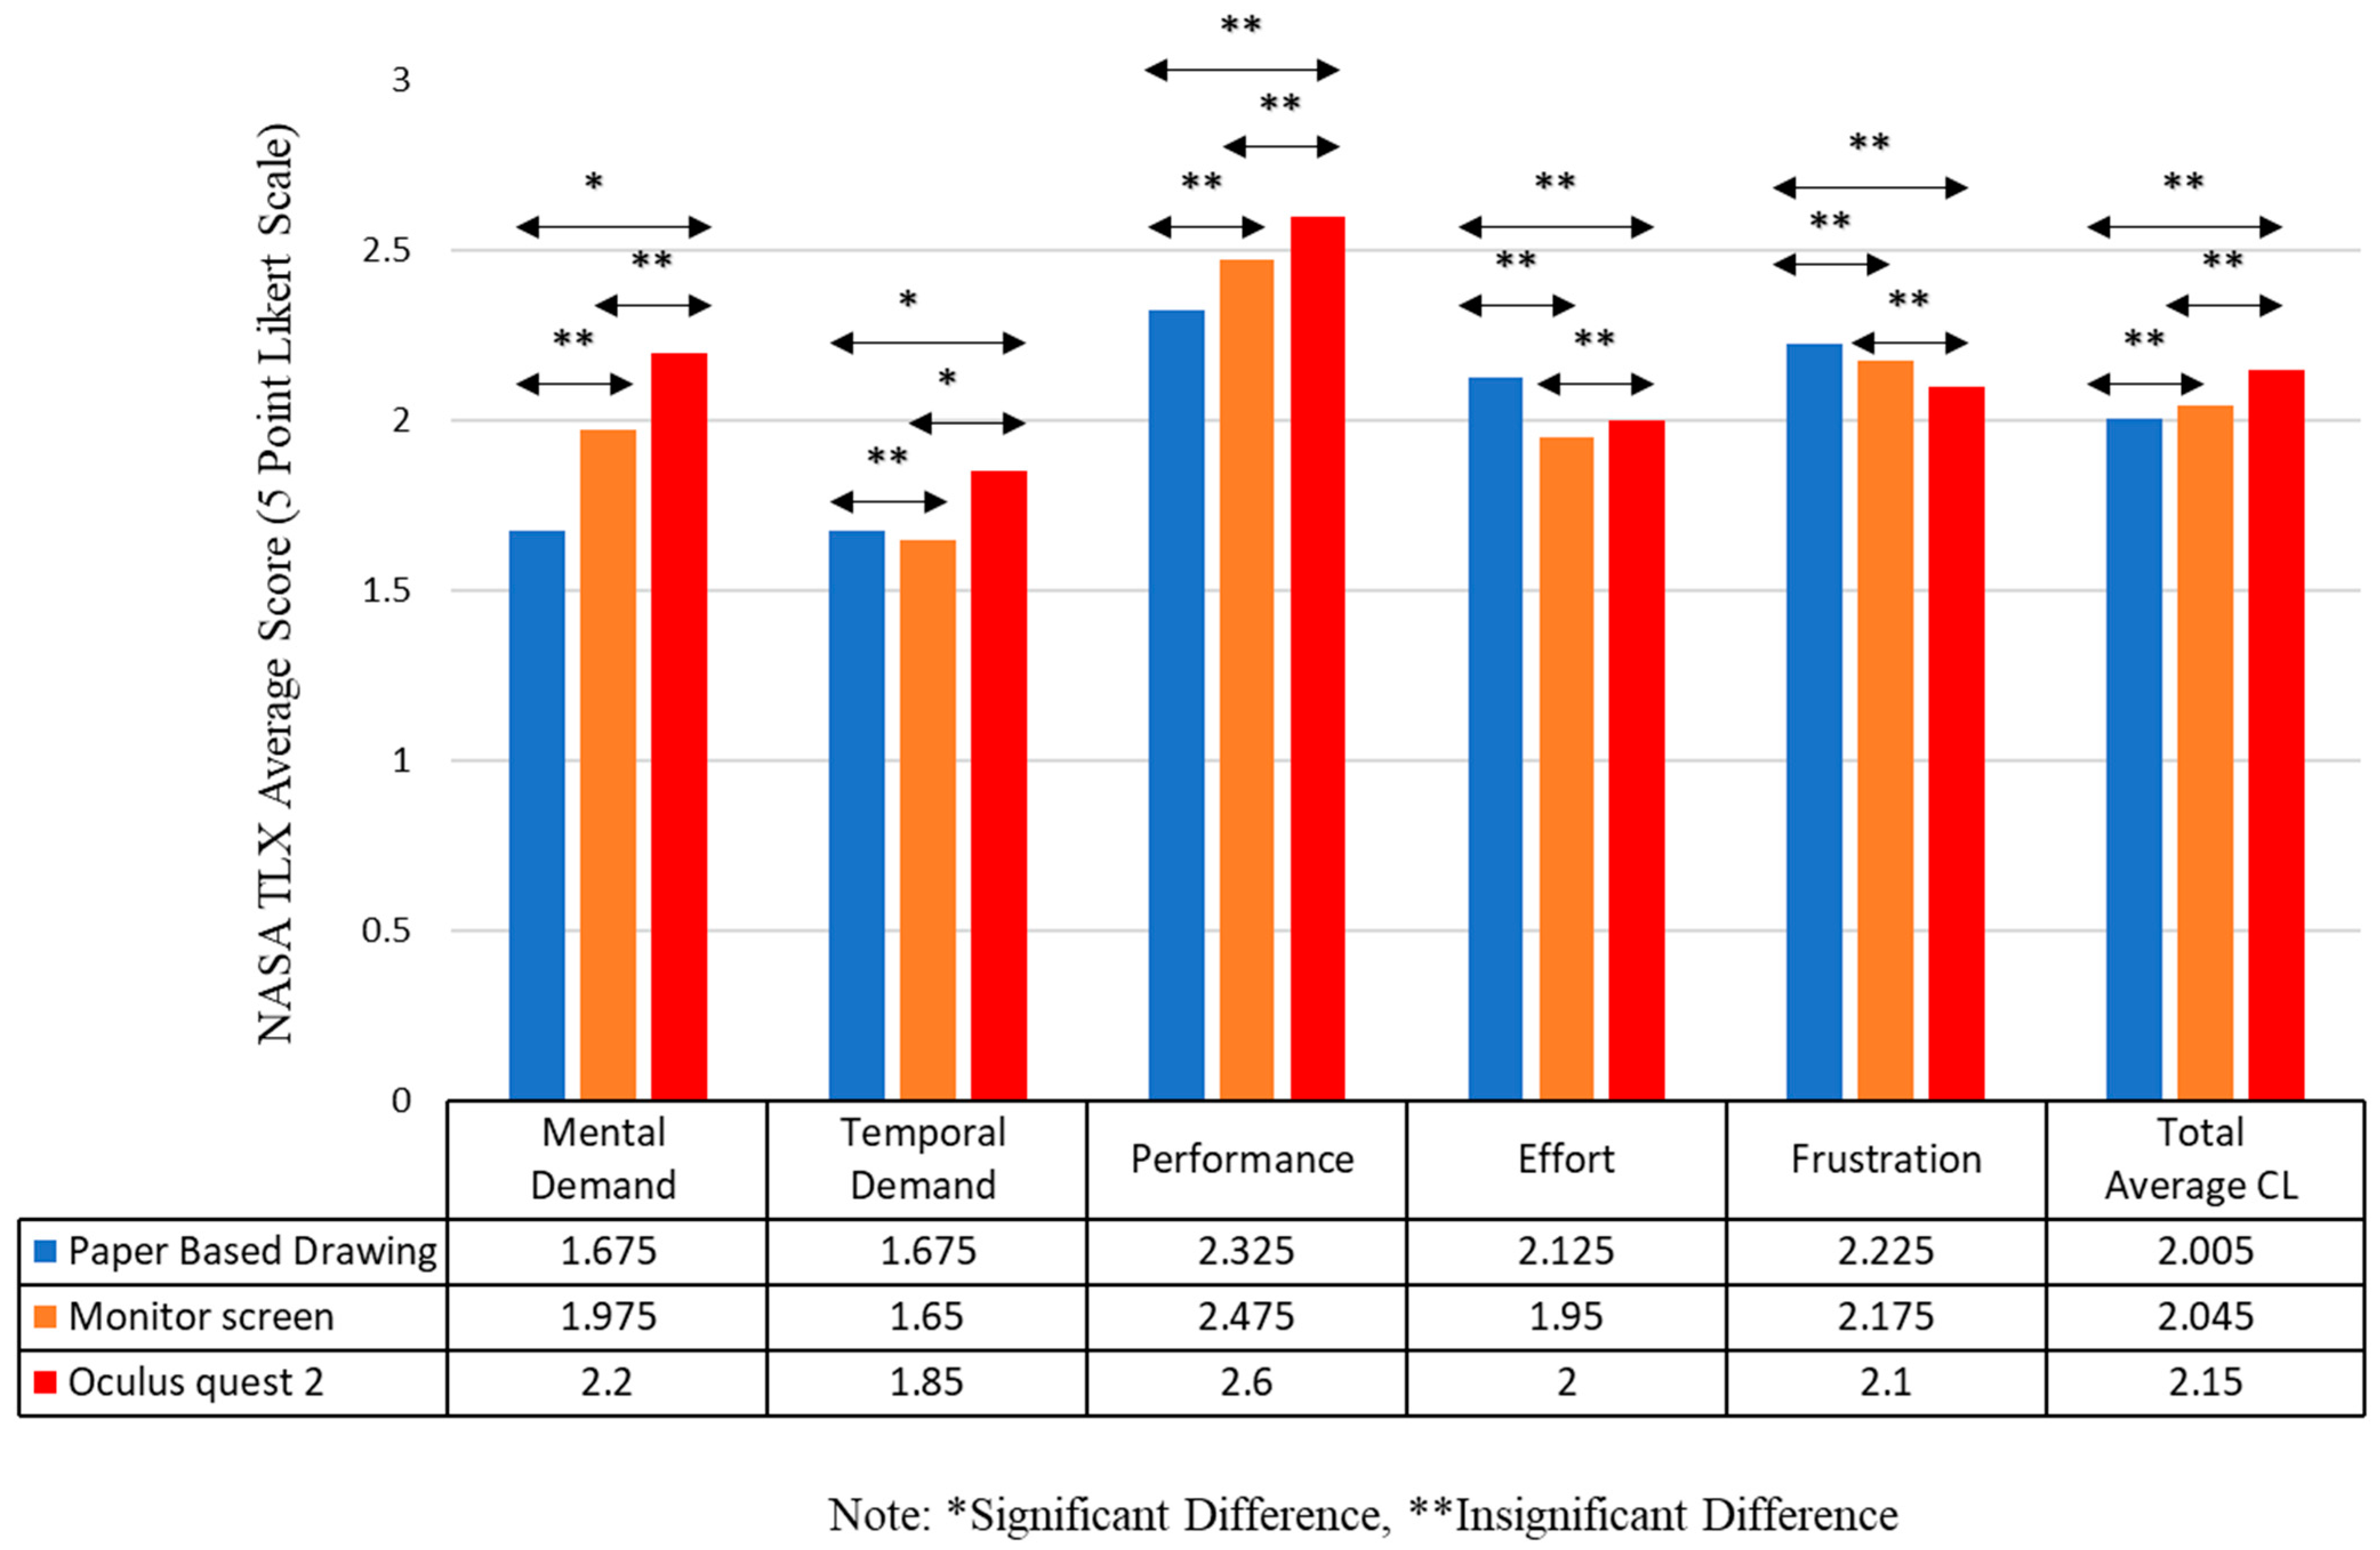
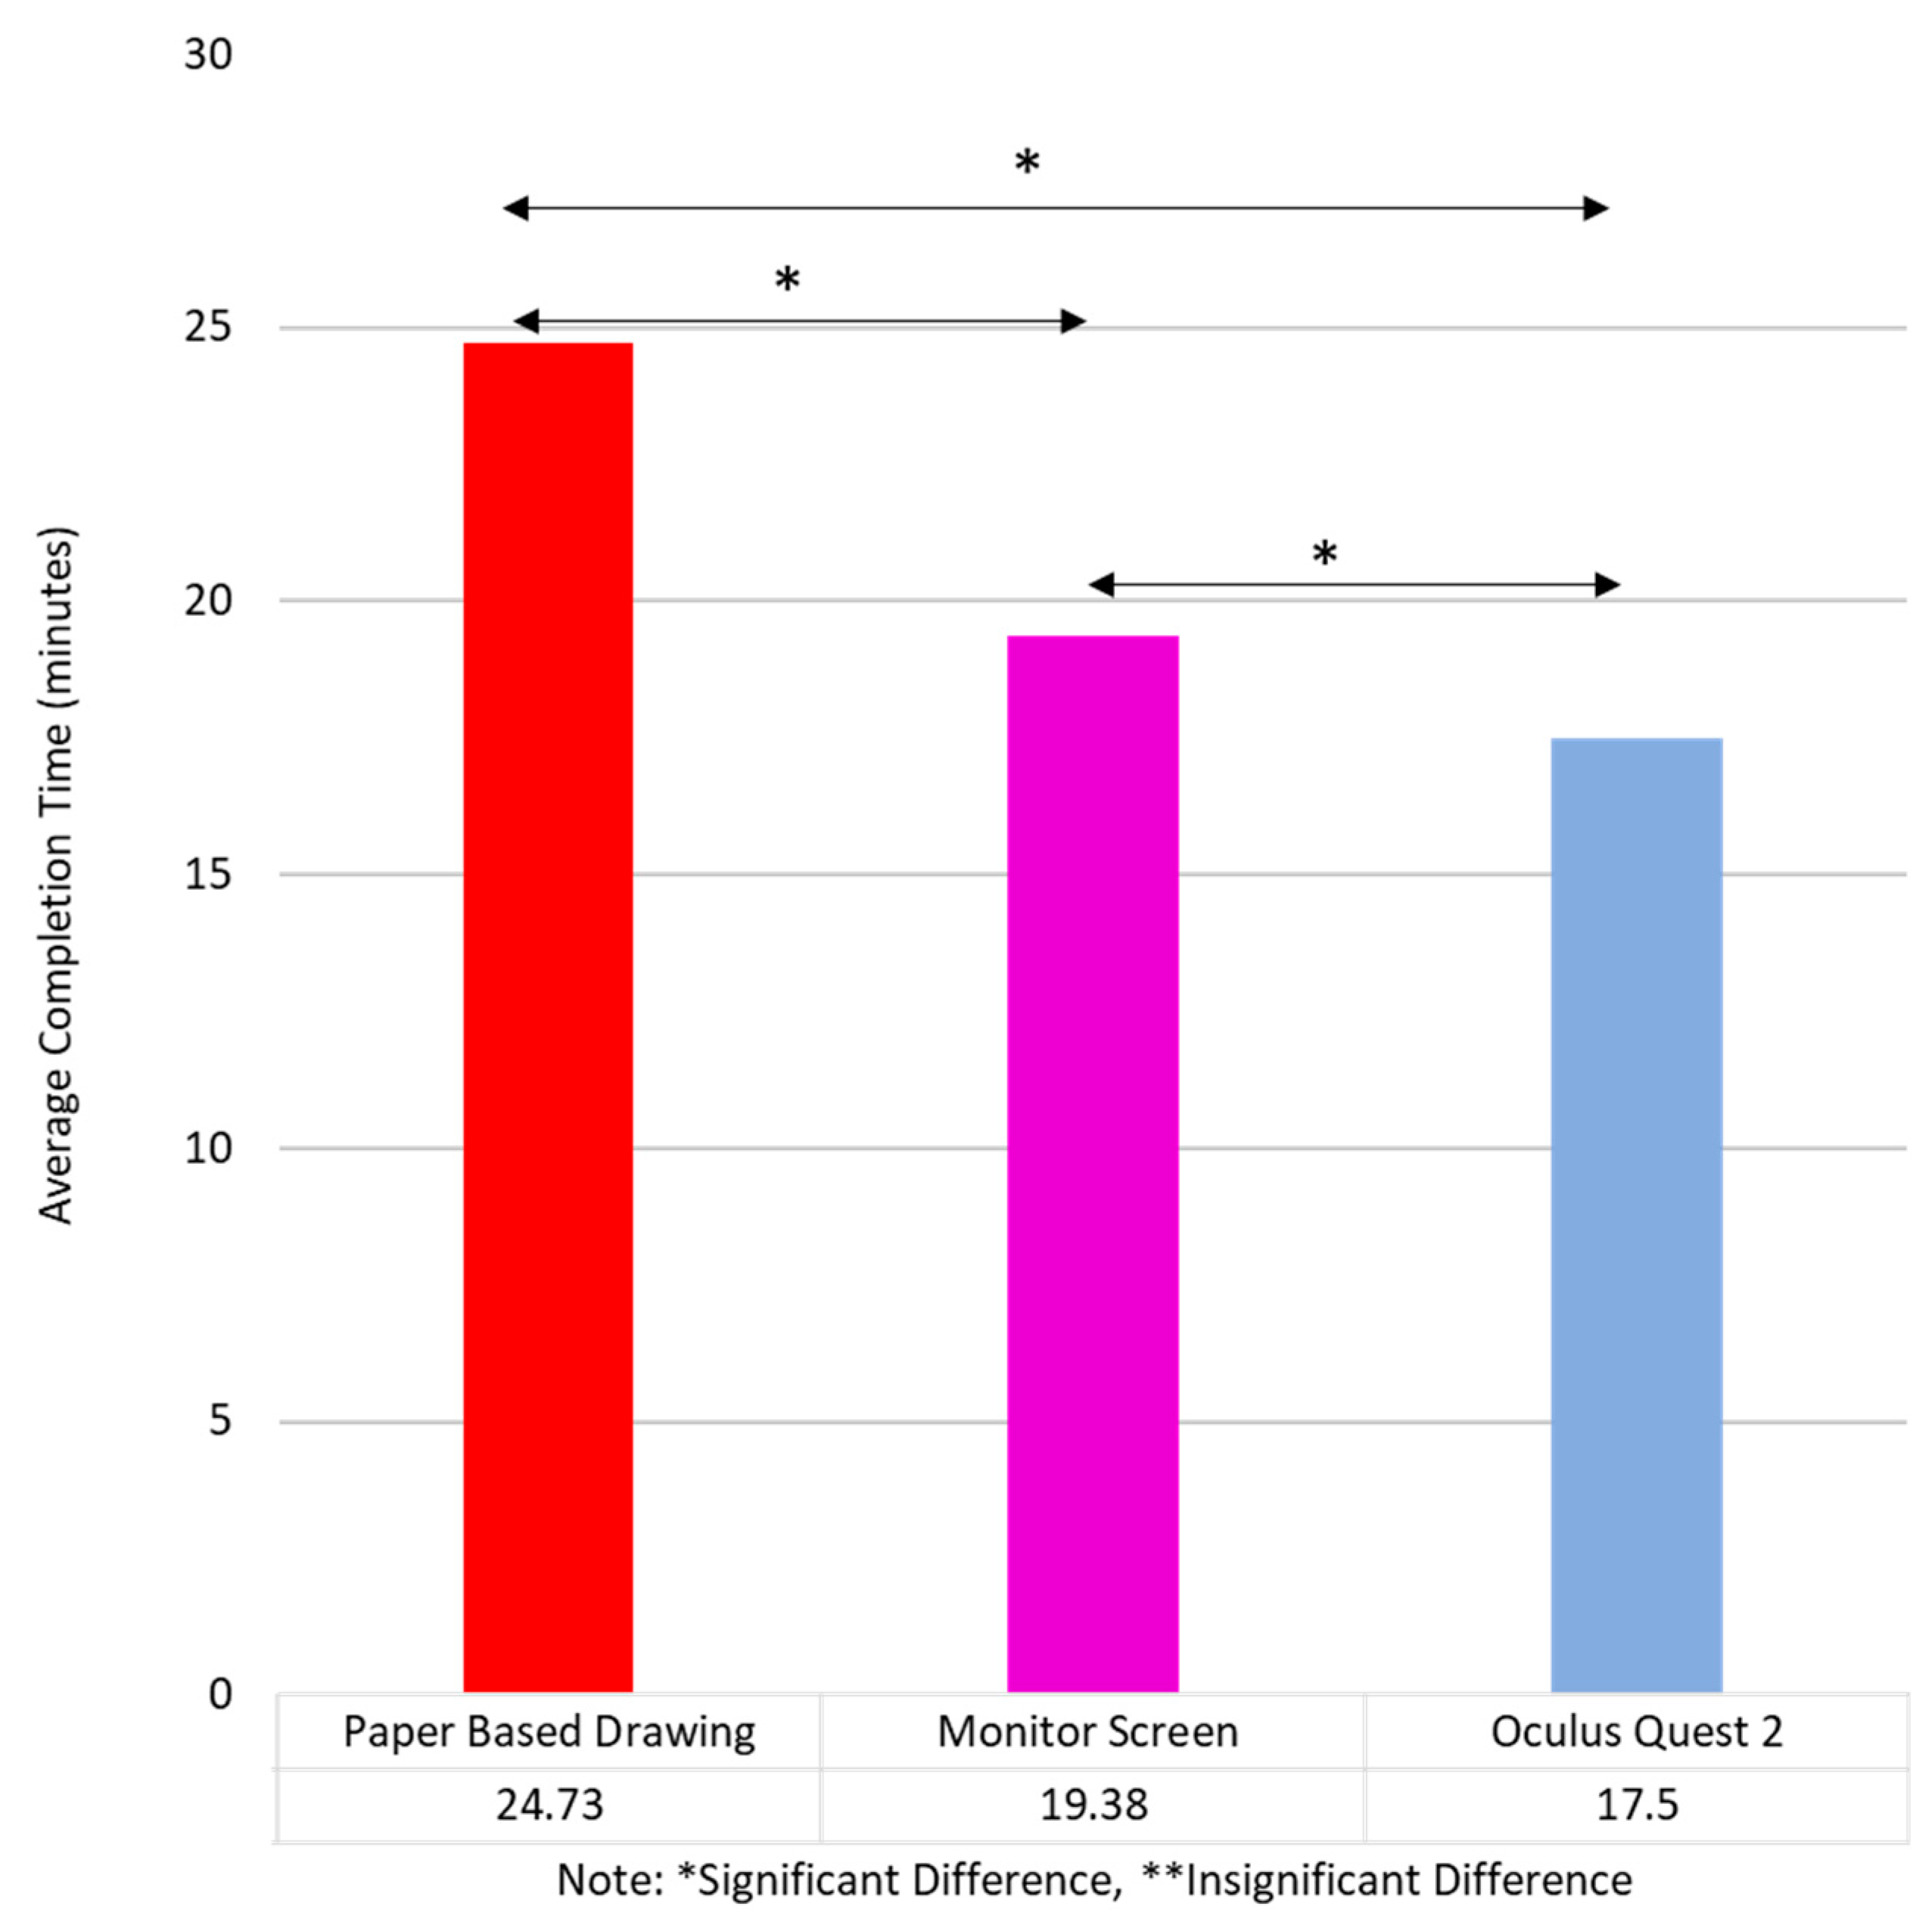
4.3. Cognitive Load and Task Performance
4.4. Situational Awareness
4.5. Limitations
5. Conclusions
Author Contributions
Funding
Institutional Review Board Statement
Informed Consent Statement
Data Availability Statement
Acknowledgments
Conflicts of Interest
References
- Ahmed, S. A Review on Using Opportunities of Augmented Reality and Virtual Reality in Construction Project Management. Organ. Technol. Manag. Constr. Int. J. 2019, 11, 1839–1852. [Google Scholar] [CrossRef] [Green Version]
- Mehrbod, S.; Staub-French, S.; Mahyar, N.; Tory, M. Characterizing interactions with BIM tools and artifacts in building design coordination meetings. Autom. Constr. 2019, 98, 195–213. [Google Scholar] [CrossRef]
- Hartmann, T.; Fischer, M.; Haymaker, J. Implementing information systems with project teams using ethnographic–action research. Adv. Eng. Inform. 2009, 23, 57–67. [Google Scholar] [CrossRef]
- Khan, M.S.; Kim, J.; Park, S.; Seo, J. BIM-Based Augmented Reality (AR) Framework for Visualization and Monitoring of Underground Utilities. In Proceedings of the Korean Society of Civil Engineers Conference, Gwangju, Korea, 20–22 October 2021; pp. 13–14. [Google Scholar]
- Leite, F.; Cho, Y.; Behzadan, A.H.; Lee, S.; Choe, S.; Fang, Y.; Akhavian, R.; Hwang, S. Visualization, Information Modeling, and Simulation: Grand Challenges in the Construction Industry. J. Comput. Civ. Eng. 2016, 30, 04016035. [Google Scholar] [CrossRef] [Green Version]
- Davidson, J.; Fowler, J.; Pantazis, C.; Sannino, M.; Walker, J.; Sheikhkhoshkar, M.; Pour Rahimian, F. Integration of VR with BIM to facilitate real-time creation of bill of quantities during the design phase: A proof of concept study. Front. Eng. Manag. 2020, 7, 396–403. [Google Scholar] [CrossRef] [Green Version]
- Herr, C.M.; Fischer, T. BIM adoption across the Chinese AEC industries: An extended BIM adoption model. J. Comput. Des. Eng. 2019, 6, 173–178. [Google Scholar] [CrossRef]
- Shin, J.; Rajabifard, A.; Kalantari, M.; Atazadeh, B. Applying BIM to support dispute avoidance in managing multi-owned buildings. J. Comput. Des. Eng. 2020, 7, 788–802. [Google Scholar] [CrossRef]
- Kim, J.I.; Li, S.; Chen, X.; Keung, C.; Suh, M.; Kim, T.W. Evaluation framework for BIM-based VR applications in design phase. J. Comput. Des. Eng. 2021, 8, 910–922. [Google Scholar] [CrossRef]
- Abbas, A.; Choi, M.; Seo, J.; Cha, S.H.; Li, H. Effectiveness of Immersive Virtual Reality-based Communication for Construction Projects. KSCE J. Civ. Eng. 2019, 23, 4972–4983. [Google Scholar] [CrossRef]
- Khan, M.; Park, J.; Seo, J. Geotechnical Property Modeling and Construction Safety Zoning Based on GIS and BIM Integration. Appl. Sci. 2021, 11, 4004. [Google Scholar] [CrossRef]
- Sampaio, A.Z. Enhancing BIM Methodology with VR Technology. In State of the Art Virtual Reality and Augmented Reality Knowhow; InTech: London, UK, 2018. [Google Scholar]
- Dunston, P.S.; Arns, L.L.; Mcglothlin, J.D.; Lasker, G.C.; Kushner, A.G. An Immersive Virtual Reality Mock-Up for Design Review of Hospital Patient Rooms. In Collaborative Design in Virtual Environments; Springer: Dordrecht, The Netherlands, 2011; pp. 167–176. [Google Scholar] [CrossRef]
- Florio, W. Análise do processo de projeto sob a teoria cognitiva: Sete difi culdades no atelier. Arquitetura Rev. 2011, 7, 161–171. [Google Scholar] [CrossRef] [Green Version]
- Hou, L.; Wang, X.; Bernold, L.; Love, P.E.D. Using Animated Augmented Reality to Cognitively Guide Assembly. J. Comput. Civ. Eng. 2013, 27, 439–451. [Google Scholar] [CrossRef]
- Zhou, Y.; Luo, H.; Yang, Y. Implementation of augmented reality for segment displacement inspection during tunneling construction. Autom. Constr. 2017, 82, 112–121. [Google Scholar] [CrossRef]
- Jensen, L.; Konradsen, F. A review of the use of virtual reality head-mounted displays in education and training. Educ. Inf. Technol. 2017, 23, 1515–1529. [Google Scholar] [CrossRef] [Green Version]
- Feng, Y. Facilitator or Inhibitor? The Use of 360-Degree Videos for Immersive Brand Storytelling. J. Interact. Advert. 2018, 18, 28–42. [Google Scholar] [CrossRef]
- Abbas, A.; Seo, J.; Kim, M. Impact of Mobile Augmented Reality System on Cognitive Behavior and Performance during Rebar Inspection Tasks. J. Comput. Civ. Eng. 2020, 34, 04020050. [Google Scholar] [CrossRef]
- Zhong, D.; Chen, L.; Feng, Y.; Song, R.; Huang, L.; Liu, J.; Zhang, L. Effects of virtual reality cognitive training in individuals with mild cognitive impairment: A systematic review and meta-analysis. Int. J. Geriatr. Psychiatry 2021, 36, 1829–1847. [Google Scholar] [CrossRef]
- Sweller, J.; van Merriënboer, J.J.G.; Paas, F. Cognitive Architecture and Instructional Design: 20 Years Later. Educ. Psychol. Rev. 2019, 31, 261–292. [Google Scholar] [CrossRef] [Green Version]
- Hart, S.G.; Staveland, L.E. Development of NASA-TLX (Task Load Index): Results of empirical and theoretical research. In Advances in Psychology; North-Holland: Amsterdam, The Netherlands, 1988; Volume 52, pp. 139–183. [Google Scholar] [CrossRef]
- Taylor, R. Situational Awareness Rating Technique (Sart): The Development of a Tool for Aircrew Systems Design. In Situational Awareness; Routledge: London, UK, 2017; pp. 111–128. [Google Scholar]
- Oberhauser, M.; Dreyer, D. A virtual reality flight simulator for human factors engineering. Cogn. Technol. Work 2017, 19, 263–277. [Google Scholar] [CrossRef]
- Wade, N.J. Charles Wheatstone (1802–1875). Perception 2002, 31, 265–272. [Google Scholar] [CrossRef] [Green Version]
- Regrebsubla, N. Determinants of Diffusion of Virtual Reality; GRIN: Munich, Germany, 2015; Volume 5. [Google Scholar]
- Cruz-Neira, C.; Fernández, M.; Portalés, C. Virtual Reality and Games. Multimodal Technol. Interact. 2018, 2, 8. [Google Scholar] [CrossRef] [Green Version]
- Steuer, J. Defining Virtual Reality: Dimensions Determining Telepresence. J. Commun. 1992, 42, 73–93. [Google Scholar] [CrossRef]
- Harley, D. Palmer Luckey and the rise of contemporary virtual reality. Converg. Int. J. Res. Into New Media Technol. 2020, 26, 1144–1158. [Google Scholar] [CrossRef]
- Hautamäki, J. Interfacing Extended Reality and Robotic Operating System 2. Ph.D. Thesis, Tampere University, Tampere, Finland, 2021. [Google Scholar]
- Angelov, V.; Petkov, E.; Shipkovenski, G.; Kalushkov, T. Modern virtual reality headsets. In Proceedings of the 2020 International Congress on Human-Computer Interaction, Optimization and Robotic Applications (HORA), Ankara, Turkey, 26–28 June 2020; pp. 1–5. [Google Scholar]
- Kelly, J.W.; Doty, T.A.; Ambourn, M.; Cherep, L.A. Distance Perception in the Oculus Quest and Oculus Quest 2. Front. Virtual Real. 2022, 3, 1–7. [Google Scholar] [CrossRef]
- Moesl, B.; Schaffernak, H.; Vorraber, W.; Holy, M.; Herrele, T.; Braunstingl, R.; Koglbauer, I.V. Towards a More Socially Sustainable Advanced Pilot Training by Integrating Wearable Augmented Reality Devices. Sustainability 2022, 14, 2220. [Google Scholar] [CrossRef]
- Liu, Y.; Messner, J.I.; Leicht, R.M. A process model for usability and maintainability design reviews. Arch. Eng. Des. Manag. 2018, 14, 457–469. [Google Scholar] [CrossRef]
- Henry, D.; Furness, T. Spatial perception in virtual environments: Evaluating an architectural application. In Proceedings of the IEEE Virtual Reality Annual International Symposium, Seattle, WA, USA, 18–22 September 1993; pp. 33–40. [Google Scholar] [CrossRef]
- Arayici, Y.; Aouad, G. Computer integrated construction: An approach to requirements engineering. Eng. Constr. Arch. Manag. 2005, 12, 194–215. [Google Scholar] [CrossRef]
- Tanoli, W.A.; Seo, J.W.; Sharafat, A.; Lee, S.S. 3D Design Modeling Application in Machine Guidance System for Earthwork Operations. KSCE J. Civ. Eng. 2018, 22, 4779–4790. [Google Scholar] [CrossRef]
- Sharafat, A.; Khan, M.S.; Latif, K.; Seo, J. BIM-Based Tunnel Information Modeling Framework for Visualization, Management, and Simulation of Drill-and-Blast Tunneling Projects. J. Comput. Civ. Eng. 2021, 35, 04020068. [Google Scholar] [CrossRef]
- Liu, Y.; Castronovo, F.; Messner, J.; Leicht, R. Evaluating the Impact of Virtual Reality on Design Review Meetings. J. Comput. Civ. Eng. 2020, 34, 04019045. [Google Scholar] [CrossRef]
- Liu, Y.; Lather, J.; Messner, J. Virtual Reality to Support the Integrated Design Process: A Retrofit Case Study. In Proceedings of the 2014 International Conference Computer Civil Building Engineering, Orlando, FL, USA, 23–25 June 2014; pp. 801–808. [Google Scholar] [CrossRef] [Green Version]
- Lee, H.; Cha, W.C. Virtual Reality-Based Ergonomic Modeling and Evaluation Framework for Nuclear Power Plant Operation and Control. Sustainability 2019, 11, 2630. [Google Scholar] [CrossRef] [Green Version]
- Heydarian, A.; Carneiro, J.P.; Gerber, D.; Becerik-Gerber, B.; Hayes, T.; Wood, W. Immersive virtual environments versus physical built environments: A benchmarking study for building design and user-built environment explorations. Autom. Constr. 2015, 54, 116–126. [Google Scholar] [CrossRef]
- Alizadehsalehi, S.; Hadavi, A.; Huang, J.C. Virtual Reality for Design and Construction Education Environment. In AEI 2019; American Society of Civil Engineers: Reston, VA, USA, 2019; pp. 193–203. [Google Scholar] [CrossRef]
- Getuli, V.; Capone, P.; Bruttini, A.; Isaac, S. BIM-based immersive Virtual Reality for construction workspace planning: A safety-oriented approach. Autom. Constr. 2020, 114, 103160. [Google Scholar] [CrossRef]
- Paes, D.; Arantes, E.; Irizarry, J. Immersive environment for improving the understanding of architectural 3D models: Comparing user spatial perception between immersive and traditional virtual reality systems. Autom. Constr. 2017, 84, 292–303. [Google Scholar] [CrossRef]
- Wang, X. BIM Handbook: A Guide to Building Information Modeling for Owners, Managers, Designers, Engineers and Contractors; John Wiley & Sons: New York, NY, USA, 2012; Volume 12. [Google Scholar] [CrossRef] [Green Version]
- Sharafat, A.; Khan, M.; Latif, K.; Tanoli, W.; Park, W.; Seo, J. BIM-GIS-Based Integrated Framework for Underground Utility Management System for Earthwork Operations. Appl. Sci. 2021, 11, 5721. [Google Scholar] [CrossRef]
- Tanoli, W.A.; Sharafat, A.; Park, J.; Seo, J.W. Damage Prevention for underground utilities using machine guidance. Autom. Constr. 2019, 107, 102893. [Google Scholar] [CrossRef]
- Paes, D.; Irizarry, J. Virtual Reality Technology Applied in the Building Design Process: Considerations on Human Factors and Cognitive Processes. Adv. Intell. Syst. Comput. 2016, 485, 3–15. [Google Scholar] [CrossRef]
- Damon, S. Educating the Reflective Practitioner. Towards a New Design for Teaching and Learning in the Professions; Jossey-Bass: San Francisco, CA, USA, 1992; Volume 1. [Google Scholar] [CrossRef] [Green Version]
- Lee, B.C.; Chung, K.; Kim, S.-H. Interruption Cost Evaluation by Cognitive Workload and Task Performance in Interruption Coordination Modes for Human–Computer Interaction Tasks. Appl. Sci. 2018, 8, 1780. [Google Scholar] [CrossRef] [Green Version]
- Longo, L. Experienced mental workload, perception of usability, their interaction and impact on task performance. PLoS ONE 2018, 13, e0199661. [Google Scholar] [CrossRef] [Green Version]
- Nikolaev, V.B.; Olimpiev, D.N. Complex analysis and evaluation of the condition of reinforced-concrete components in power-generating structures. Power Technol. Eng. 2009, 43, 280–286. [Google Scholar] [CrossRef]
- Dadi, G.B.; Goodrum, P.M.; Taylor, T.R.B.; Carswell, C.M. Cognitive Workload Demands Using 2D and 3D Spatial Engineering Information Formats. J. Constr. Eng. Manag. 2014, 140, 4014001. [Google Scholar] [CrossRef]
- Bhandary, S.; Lipps, J.; Winfield, S.R.; Abdel-Rasoul, M.; Stoicea, N.; Pappada, S.M.; Papadimos, T.J. NASA Task Load Index Scale to Evaluate the Cognitive Workload during Cardiac Anesthesia Based Simulation Scenarios. Int. J. Anesthesiol. Res. 2016, 4, 300–304. [Google Scholar] [CrossRef]
- Salmon, P.; Stanton, N.; Walker, G.; Jenkins, D.; Ladva, D.; Rafferty, L.; Young, M. Measuring Situation Awareness in complex systems: Comparison of measures study. Int. J. Ind. Ergon. 2009, 39, 490–500. [Google Scholar] [CrossRef]
- Salmon, P.; Stanton, N.; Walker, G.; Green, D. Situation awareness measurement: A review of applicability for C4i environments. Appl. Ergon. 2006, 37, 225–238. [Google Scholar] [CrossRef] [PubMed] [Green Version]
- Paas, F.; Renkl, A.; Sweller, J. Cognitive Load Theory and Instructional Design: Recent Developments. Educ. Psychol. 2003, 38, 1–4. [Google Scholar] [CrossRef]
- Gevins, A.; Smith, M.E.; Leong, H.; McEvoy, L.; Whitfield, S.; Du, R.; Rush, G. Monitoring Working Memory Load during Computer-Based Tasks with EEG Pattern Recognition Methods. Hum. Factors J. Hum. Factors Ergon. Soc. 1998, 40, 79–91. [Google Scholar] [CrossRef]
- Ke, Y.; Qi, H.; He, F.; Liu, S.; Zhao, X.; Zhou, P.; Zhang, L.; Ming, D. An EEG-based mental workload estimator trained on working memory task can work well under simulated multi-attribute task. Front. Hum. Neurosci. 2014, 8, 703. [Google Scholar] [CrossRef] [Green Version]
- Shi, Y.; Ruiz, N.; Taib, R.; Choi, E.; Chen, F. Galvanic skin response (GSR) as an index of cognitive load. In Proceedings of the CHI’07 Extended Abstracts on Human Factors in Computing Systems, San Jose, CA, USA, 28 April–3 May 2007; pp. 2651–2656. [Google Scholar] [CrossRef]
- Matthews, M.D.; Martinez, S.G.; Eid, J.; Johnsen, B.H.; Boe, O.C. A Comparison of Observer and Incumbent Ratings of Situation Awareness. Proc. Hum. Factors Ergon. Soc. Annu. Meet. 2005, 49, 548–551. [Google Scholar] [CrossRef]
- Endsley, M.R.; Garland, D.J. Situation Awareness Analysis and Measurement; CRC Press: Boca Raton, FL, USA, 2000. [Google Scholar] [CrossRef]
- Stanton, N.A.; Salmon, P.M.; Rafferty, L.A.; Walker, G.H.; Baber, C.; Jenkins, D.P. Human Factors Methods: A Practical Guide for Engineering and Design, 2nd ed.; CRC Press: Boca Raton, FL, USA, 2013. [Google Scholar] [CrossRef]
- Peansupap, V.; Ly, R. Evaluating the Impact Level of Design Errors in Structural and Other Building Components in Building Construction Projects in Cambodia. Procedia Eng. 2015, 123, 370–378. [Google Scholar] [CrossRef] [Green Version]
- Hanusz, Z.; Tarasińska, J. Normalization of the Kolmogorov–Smirnov and Shapiro–Wilk tests of normality. Biom. Lett. 2015, 52, 85–93. [Google Scholar] [CrossRef] [Green Version]
- Ahad, N.A.; Yin, T.S.; Othman, A.R.; Yaacob, C.R. Sensitivity of normality tests to non-normal data. Sains Malays. 2011, 40, 637–641. [Google Scholar]
- Wah, Y.B.; Razali, N.M. Power comparisons of Shapiro-Wilk, Kolmogorov-Smirnov, Lilliefors and Anderson-Darling tests. J. Stat. Model. Anal. 2011, 2, 21–33. [Google Scholar]
- Althouse, L.A.; Ware, W.B.; Ferron, J.M. Detecting Departures from Normality: A Monte Carlo Simulation of a New Omnibus Test Based on Moments. 1998. Available online: https://eric.ed.gov/?id=ED422385 (accessed on 10 June 2022).
- Ostertagová, E.; Ostertag, O.; Kováč, J. Methodology and Application of the Kruskal-Wallis Test. Appl. Mech. Mater. 2014, 611, 115–120. [Google Scholar] [CrossRef]
- Josephsen, J. Cognitive Load Theory and Nursing Simulation: An Integrative Review. Clin. Simul. Nurs. 2015, 11, 259–267. [Google Scholar] [CrossRef]
- Rutkowski, A.-F.; Saunders, C.; Vogel, D.; Van Genuchten, M. “Is It Already 4 a.m. in Your Time Zone?”: Focus immersion and temporal dissociation in virtual teams. Small Group Res. 2007, 38, 98–129. [Google Scholar] [CrossRef]


| Dimensions | Questions |
|---|---|
| Mental demanding | Was the task mentally demanding? |
| Temporal demanding | Was the task temporally demanding (time pressure for completing the task)? |
| Performance | How successful were you in completing the task? |
| Effort | How much has hard work been performed to achieve the task? |
| Frustration | How much were you insecure, discouraged, irritated, or stressed during the task? |
| Domain | Elements | Question |
|---|---|---|
| Attentional Demand (D) | Instability of situation | How much was the situation in the surroundings changing during the experimental session? |
| Complexity of situation | How complex was the surrounding situation? | |
| Variability of situation | Were several different factors in the surrounding environment changing? | |
| Attentional Supply (S) | Arousal | How alert were you to observe the surrounding situation? |
| Concertation | How much did you concentrate on the surrounding? | |
| Division of attention | What proportion of attention was devoted to surroundings instead of the design review task? | |
| Spare Mental Capacity | How much mental capacity must be spared for the surroundings? | |
| Understanding (U) | Information Quantity | How much information about the surrounding did you take in? |
| Information Quality | How well did you understand/comprehend the information about the surroundings that you took in? | |
| Familiarity | How familiar were you with the surroundings during the task? |
| CL Dimension | Medium | Kolmogorov–Smirnov * | Shapiro–Wilk | ||||
|---|---|---|---|---|---|---|---|
| Statistic | df | Sig. | Statistic | df | Sig. | ||
| Mental Demand | Paper | 0.229 | 32 | 0.000 | 0.864 | 32 | 0.001 |
| Monitor | 0.220 | 32 | 0.000 | 0.883 | 32 | 0.002 | |
| Oculus Quest 2 | 0.205 | 32 | 0.001 | 0.912 | 32 | 0.013 | |
| Temporal Demand | Paper | 0.273 | 32 | 0.000 | 0.803 | 32 | 0.000 |
| Monitor | 0.275 | 32 | 0.000 | 0.783 | 32 | 0.000 | |
| Oculus Quest 2 | 0.224 | 32 | 0.000 | 0.900 | 32 | 0.006 | |
| Performance | Paper | 0.169 | 32 | 0.021 | 0.891 | 32 | 0.004 |
| Monitor | 0.157 | 32 | 0.044 | 0.922 | 32 | 0.023 | |
| Oculus Quest 2 | 0.252 | 32 | 0.000 | 0.892 | 32 | 0.004 | |
| Frustration | Paper | 0.249 | 32 | 0.000 | 0.826 | 32 | 0.000 |
| Monitor | 0.182 | 32 | 0.008 | 0.902 | 32 | 0.007 | |
| Oculus Quest 2 | 0.244 | 32 | 0.000 | 0.888 | 32 | 0.003 | |
| Effort | Paper | 0.299 | 32 | 0.000 | 0.805 | 32 | 0.000 |
| Monitor | 0.178 | 32 | 0.011 | 0.849 | 32 | 0.000 | |
| Oculus Quest 2 | 0.222 | 32 | 0.000 | 0.878 | 32 | 0.002 | |
| Design Errors | Media | No of Errors Placed | Mean (SD) | Kruskal-H Test | Significance (p) |
|---|---|---|---|---|---|
| Stair not connected to upper floor | Paper Monitor Oculus Quest 2 | 2 | 0.73 (0.45) 0.88 (0.65) 0.97 (0.64) | 3.48 | 0.176 ** |
| Slab and door/window | Paper Monitor Oculus Quest 2 | 1 | 0.61 (0.5) 0.82 (0.39) 0.78 (0.44) | 3.977 | 0.137 ** |
| Column and door/window | Paper Monitor Oculus Quest 2 | 2 | 0.76 (0.56) 1 (0.79) 0.91 (0.58) | 2.838 | 0.242 ** |
| Stair and beam | Paper Monitor Oculus Quest 2 | 1 | 0.52 (0.51) 0.82 (0.39) 0.81 (.39) | 8.261 | 0.016 * |
| Stair and slab | Paper Monitor Oculus Quest 2 | 1 | 0.67 (0.48) 0.64 (0.49) 0.72 (0.45) | 0.864 | 0.650 ** |
| Stair and column | Paper Monitor Oculus Quest 2 | 1 | 0.55 (0.51) 0.7 (0.47) 0.81 (0.39) | 6.045 | 0.051 ** |
| Sill height error | Paper Monitor Oculus Quest 2 | 4 | 1.73 (1.26) 2.09 (0.72) 1.94 (1.20) | 2.471 | 0.291 ** |
| Sill height of bathroom windows/ exhaust fan | Paper Monitor Oculus Quest 2 | 2 | 1.21 (0.60) 1.27 (0.52) 1.06 (0.66) | 2.16 | 0.34 ** |
| Beam size changed | Paper Monitor Oculus Quest 2 | 2 | 1.03 (0.53) 0.97 (0.53) 1.06 (0.68) | 0.45 | 0.79 ** |
| Column size changed | Paper Monitor Oculus Quest 2 | 2 | 0.58 (0.66) 0.94 (0.70) 0.97 (0.66) | 6.04 | 0.049 * |
| Floor level changed | Paper Monitor Oculus Quest 2 | 1 | 0.67 (0.48) 0.64 (0.49) 0.66 (0.49) | .089 | 0.95 ** |
| Extra beam | Paper Monitor Oculus Quest 2 | 3 | 1.18 (0.58) 1.36 (1.06) 1.53 (0.80) | 1.741 | 0.419 ** |
| Total number of errors | Paper Monitor Oculus Quest 2 | 22 22 22 | 10.28 (7.11) 12.13 (7.2) 12.28 (7.28) | 5.898 | 0.052 ** |
| Sr No. | SART (Elements) | Medium | Kruskal–Wallis Test H | Significance (p) | ||
|---|---|---|---|---|---|---|
| Paper Mean (SD) | Monitor Mean (SD) | Oculus Quest 2 Mean (SD) | ||||
| 1 | Instability of Situation | 2.94 (0.76) | 3.03 (0.93) | 2.94 (0.88) | 0.106 | 0.949 ** |
| 2 | Complexity of Situation | 3.66 (0.9) | 2.81 (0.82) | 2.91 (0.73) | 15.330 | 0.000 * |
| 3 | Variability of situation | 2.66 (0.9) | 3.03 (0.93) | 2.63 (0.79) | 3.132 | 0.209 ** |
| 4 | Arousal | 2.59 (0.76) | 2.94 (0.80) | 2.69 (0.82) | 14.460 | 0.002 * |
| 5 | Concentration | 2.66 (0.75) | 2.88 (0.79) | 2.41 (0.71) | 7.042 | 0.030 * |
| 6 | Division of Attention | 2.72 (0.58) | 2.41 (0.67) | 2.41 (0.71) | 4.932 | 0.085 ** |
| 7 | Spare Mental Capacity | 3.16 (0.85) | 2.66 (0.75) | 2.63 (0.75) | 8.733 | 0.013 ** |
| 8 | Information Quantity | 2.81 (1.03) | 3.19 (0.78) | 3.41 (0.87) | 0.802 | 0.670 ** |
| 9 | Information Quality | 2.72 (0.73) | 3.56 (1.16) | 3.75 (0.98) | 12.337 | 0.002 ** |
| 10 | Familiarity | 2.59 (0.98) | 3.25 (0.76) | 3.53 (1.05) | 4.522 | 0.104 ** |
| 11 | Attentional Demand (D) | 9.25(1.79) | 8.88(1.77) | 8.46(1.74) | 3.724 | 0.155 ** |
| 12 | Attentional Supply (S) | 11.12(1.60) | 10.88(1.54) | 10.12(1.58) | 7.473 | 0.024 * |
| 13 | Understanding (U) | 8.12(1.95) | 10.0(1.85) | 10.69(1.97) | 9.812 | 0.007 * |
| 14 | SA = U − [D − S] | 10.0(2.6) | 12.0(2.27) | 12.34(2.67) | 7.676 | 0.022 * |
Publisher’s Note: MDPI stays neutral with regard to jurisdictional claims in published maps and institutional affiliations. |
© 2022 by the authors. Licensee MDPI, Basel, Switzerland. This article is an open access article distributed under the terms and conditions of the Creative Commons Attribution (CC BY) license (https://creativecommons.org/licenses/by/4.0/).
Share and Cite
Umair, M.; Sharafat, A.; Lee, D.-E.; Seo, J. Impact of Virtual Reality-Based Design Review System on User’s Performance and Cognitive Behavior for Building Design Review Tasks. Appl. Sci. 2022, 12, 7249. https://doi.org/10.3390/app12147249
Umair M, Sharafat A, Lee D-E, Seo J. Impact of Virtual Reality-Based Design Review System on User’s Performance and Cognitive Behavior for Building Design Review Tasks. Applied Sciences. 2022; 12(14):7249. https://doi.org/10.3390/app12147249
Chicago/Turabian StyleUmair, Muhammad, Abubakar Sharafat, Dong-Eun Lee, and Jongwon Seo. 2022. "Impact of Virtual Reality-Based Design Review System on User’s Performance and Cognitive Behavior for Building Design Review Tasks" Applied Sciences 12, no. 14: 7249. https://doi.org/10.3390/app12147249