Article

Dose–Response Effect of Nitrogen on Microbial Community during Hydrocarbon Biodegradation in Simplified Model System

by
Justyna Staninska-Pięta
1,*,
Jakub Czarny
2,
Wojciech Juzwa
3,
Łukasz Wolko
4,
Paweł Cyplik
3,* and
Agnieszka Piotrowska-Cyplik
1,*
1
Department of Food Technology of Plant Origin, Poznan University of Life Sciences, Wojska Polskiego 31, 60-624 Poznan, Poland
2
Institute of Forensic Genetics, Al. Mickiewicza 3/4, 85-071 Bydgoszcz, Poland
3
Department Biotechnology and Food Microbiology, Poznan University of Life Sciences, Wojska Polskiego 48, 60-627 Poznan, Poland
4
Department of Biochemistry and Biotechnology, Poznan University of Life Sciences, Dojazd 11, 60-632 Poznan, Poland
*
Authors to whom correspondence should be addressed.
Appl. Sci. 2022, 12(12), 6012; https://doi.org/10.3390/app12126012
Submission received: 18 May 2022 / Revised: 9 June 2022 / Accepted: 10 June 2022 / Published: 13 June 2022

Abstract

:
Knowledge about the influence of C:N ratio on the biodegradation process of hydrocarbon compounds is of significant importance in the development of biostimulation techniques. The purpose of this study was to assess the impact of nitrogen compounds on the environmental consortium during the process of biological decomposition of hydrocarbons. The experimental variants represented low, moderate, and excessive biostimulation with nitrogen compounds. The metabolic activity of the consortium was tested using the flow cytometry technique. The efficiency of the biodegradation of hydrocarbons of the consortium, based on the gas chromatography method, and metapopulation changes, based on the analysis of V4 16srRNA sequencing data, were assessed. The results of the research confirm the positive effect of properly optimized biostimulation with nitrogen compounds on the biological decomposition of polycyclic aromatic hydrocarbons. The negative impact of excessive biostimulation on the biodegradation efficiency and metabolic activity of microorganisms is also proven. Low resistance to changes in the supply of nitrogen compounds is demonstrated among the orders Xanthomonadales, Burkholderiales, Sphingomonadales, Flavobacteriales, and Sphingobacteriales. It is proven that quantitative analysis of the order of Rhizobiales, characterized by a high-predicted potential for the decomposition of polycyclic aromatic hydrocarbons, may be helpful during biostimulation optimization processes in areas with a high nitrogen deficiency.

1. Introduction

Intensive exploitation of liquid fossil fuels, and the migration of hydrocarbon compounds to the natural environment, have a highly negative influence on terrestrial and aquatic ecosystems. Due to the high resistance to biodegradation, and the potential for biomagnification, this pollution is considered to be one of the most serious environmental threats [1,2,3]. Due to the complexity of the chemical structure, and the diversity of physical and chemical properties, individual groups of hydrocarbons differ in bioavailability, toxicity, and the potential for biological decomposition [3,4].
Many biotic and abiotic factors affect the biological decomposition rate of hydrocarbon compounds [3,4,5,6,7,8]. The abiotic factor, i.e., the supply of microelements such as nitrogen, phosphorus, sulfur, calcium, magnesium, and potassium, is crucial in the functioning of the cellular metabolism of microorganisms that perform biodegradation processes [9]. In contaminated areas, deficiencies in biogenic elements and inhibition of bioremediation processes may occur very quickly, as a result of an excessive supply of carbon compounds, and the activity of microorganisms [10]. Research suggests that the share of nutrients, including the C:N ratio, should be at a level similar to that in live cells. The optimal values for the C:N ratio are in the range from 100:5 to 100:15 [9,11]. The wide range of the optimal ratio of these elements may result from the different rates of decomposition of individual hydrocarbon groups, and the limited bioavailability of biogenic elements, depending on abiotic and biotic environmental factors [9].
One of the most popular bioremediation technologies, based on the knowledge of the influence of nutrient supply, is the biostimulation technique. Targeted compensation of deficiencies in the environmental niche results in metabolic activation of indigenous microflora, and the improvement of the biodegradation efficiency of xenobiotics. This compensation may consist of the application of deficient nutrients and electron acceptors, in the form of both organic and inorganic compounds [12,13]. Many studies prove that biostimulation is beneficial for effective hydrocarbon degradation [14,15,16]. A popular strategy is also to combine bioaugmentation and biostimulation techniques, in order to maximize remediation effects [12,17,18].
Despite the many advantages of bioremediation technologies, and their widespread social acceptability, they have a number of limitations. These include the differentiation of the metabolic potential of microorganisms living in different environments, problems related to the optimization of the scale of necessary implementations, and the difficulties in extrapolating the results of tests carried out on a laboratory scale [19,20]. It is emphasized that, in the case of biostimulation with nitrogen compounds, the excessive supply of nutrient may negatively affect the efficiency of biological decomposition [21,22,23].
An innovative context in the improvement and understanding of the mechanisms of bioremediation processes is the approach to the issues within the field of synthetic microbiology, assuming a multitude of biotic and abiotic interactions in the microbial community. According to the assumptions of the synthetic approach, simple interactions between genotypically different microorganisms may contribute to the creation of properties that are difficult to predict at the consortium level [20,24,25]. Therefore, there is a need to acquire and analyze data on the molecular mechanisms of the microbial transformation of hydrocarbon compounds, and the influence of environmental factors and degradation processes. The aim of this study was to comprehensively assess the effect of nitrogen compounds on an environmental consortium with high hydrocarbon degradation potential. Both the enzymatic efficiency and metabolic activity, as well as the overall genetic potential of individual members of the metapopulation, were taken into account. This type of analysis allows for the improvement of planning an effective and predictable ecosystem remediation process.

2. Materials and Methods

2.1. Microbial Consortium Isolation

The environmental consortium with a high potential for biodegradation of hydrocarbons was isolated from soil matrix. The soil sample was taken from the area of railway sleepers impregnation plant in Solec Kujawski (Poland): 53°04′40.7″ N 18°14′23.6″ E. A detailed description of the soil sampling site is presented in previous publications [8,26].
The isolation protocol was based on our prior experience [8]. A 10 g sample of the soil was added into 90 mL of sterile saline, and shaken for 4 h (150 rpm). After the soil particles sedimented, the obtained supernatant was added to a non-selective nutrient broth, containing enriched broth (BTL, Łódź, Poland) and a 2% of glucose (Sigma-Aldrich, Darmstadt, Germany). Bacteria were incubated for 7 days at 25 °C in aerobic conditions provided by continuous shaking (150 rpm). Finally, the biomass was centrifuged (10 min, 4000 rpm), washed twice, and suspended in saline solution. The microorganism suspension was normalized to OD600 = 0.7 (Helios Delta Vis, ThermoFisher Scientific, Waltham, MA, USA), and used as inoculum for the biodegradation experiments.

2.2. Experimental Design

The biodegradation experiment was performed in flasks equipped with septum and vent caps with a semi-permeable DURAN® membrane, in order to ensure the best oxygenation of the culture medium. Each experimental flask included 50 mL of mineral medium described in our previous studies [8], 2 g of diesel oil (PKN Orlen, Płock, Poland), and 250 µL of optimized microbiological inoculum. Casein peptone (Merck, Darmstadt, Germany) was used as the nitrogen source (Table 1). According to the manufacturer’s declarations, the total amount of nitrogen was 14%, of which 4% was the amine nitrogen fraction. Based on the literature data, the nitrogen content in diesel fuel was assumed to be 0.13% [27], and the carbon to nitrogen ratio was assumed to be as 10:1 [11]. Biodegradation was carried out for 168 h at 25 °C. The aerobic conditions were provided by continuous shaking (150 rpm). The experiment was performed in three replicates.

2.3. Hydrocarbon Biodegradation Analysis

The assessment of the loss of individual groups of hydrocarbons was performed after 24, 72, and 168 h of biodegradation, and expressed as a share of the concentration of hydrocarbons directly after inoculation. Gas chromatography, coupled with mass spectrometry (GC–MS), was used for the measurements. The detailed method of extracts preparation and analysis conditions are described in a previous publication [8].

2.4. Metabolic Activity Analysis

In order to evaluate the metabolic population during the biodegradation process, expressed as the redox potential of microbial cells, the method of flow cytometry was used. The bacteria samples were taken after 24 h and 168 h of biodegradation, and stained using BacLight™ RedoxSensor™ Green Vitality Kit (Thermo Fisher Scientific, MA, USA). The negative control sample consisted of metabolically inactive, thermally inactivated dead bacteria cells. The analysis protocol was based on the manufacturer instructions, and described in detail in our previous publication [26]. The percentage of the population with high and low metabolic activity was calculated by gating the dot plots of the median fluorescein isothiocyanate fluorescence intensity signals (FITC-A) versus the median signals of the side scatter parameter (SSC-A). The following groups were set: metabolically inactive cells (Q1), metabolically active cells (Q2), and artifacts (Q3 and Q4).

2.5. Genetic Analysis of Microbial Population

2.5.1. DNA Isolation

The isolation of genomic DNA was performed using the Genomic Mini AX Bacteria Spin kit (A&A Biotechnology, Gdańsk, Poland). All isolation steps were conducted according to the protocol provided by the manufacturer. The samples were taken after 168 h of the biodegradation process. The isolation efficiency was controlled by the fluorimetric method on the Qbit 3.0 device, using the Qubit™ dsDNA HS Assay Kit (ThermoFisher Scientific, Waltham, MA, USA). For each sample, three DNA extractions were carried out. Lastly, samples were mixed together, after a positive quantification.

2.5.2. NGS Sequencing

For microbial population taxonomy analysis, the V4 region of the 16SrRNA was amplified, based on the 515F-806R primers designed by Caporaso et al. (2012) [28]. The PCR details were optimized, and described in a previous publication [8].
Sequencing of the obtained amplicons was performed on the MiSeq platform (Illumina, CA, USA). The construction of amplicons and libraries normalization protocol is described in a previous work [26].

2.5.3. Bioinformatic Analysis

The output sequencing data were analyzed using the CLC Genomics Workbench 8.5, with the CLC Microbial Genomics Module 1.2 software (Qiagen, Hilden, Germany). Readings were trimmed, demultiplexed, and paired ends were joined. Then, the chimeric readings were identified and removed. The data were clustered independently against two reference databases at 97% similarity of operational taxonomic units (OTU). The SILVA v119 database [29] was used for taxonomy annotation and biodiversity analysis, and the GreenGenes 13.5 database [30] was used for PICRUSt analysis. Selected biodiversity indices were determined: OTU number, Simpson’s index, and phylogenetic diversity. Raw sequence data were deposited in the Sequence Read Archive (SRA) as project no. PRJNA831882.
In order to better characterize the analyzed microbiome, a linear discriminant analysis (LDA) effect size (LEfSe) [31] was performed. It allowed for the identification and selection of the most differentially abundant taxa. The microbial biomarkers that best describe the differences between the groups differing in the level of supplementation with nitrogen compounds were assessed. The following groups were determined: deficiency of nitrogen compounds: variants NP0 and NP1; and no deficiency (sufficient level: variants NP2 and NP3). LDA was coupled with effect size measurements: a non-parametric Kruskal–Wallis rank-sum test (p < 0.05), and the Wilcoxon rank-sum test (p < 0.05). A threshold of 3.5 for the logarithmic LDA score for discriminative attributes was established as the cut-off value.

2.5.4. PICRUSt Analysis

In order to evaluate the bacterial functional composition in the analyzed samples, the bioinformatic tool PICRUSt v. 1.1.1 was used. This algorithm is widely used in environmental studies to analyze functional assessment of bacteria communities in different environments (soil, sediments, wastewater etc.) [32,33,34,35,36,37,38]. The predictions of functional composition of metagenomes were performed on the basis of sequencing data clustered against GreenGenes 13.5, and reference bacterial genomes deposited in the IMG database. The detailed algorithm’s mode of action is described in a publication of its authors [39]. Based on the analysis, data on the predicted prevalence of 6009 KEGG Orthology IDs (KO IDs) participating in the degradation of polycyclic, aromatic hydrocarbons were obtained. It was assessed which OTU contributed to particular functions. Quality control of the PICRUSt prediction was performed according to the algorithm authors advices. The genome coverage was calculated for all samples using a weighted-Nearest Sequenced Taxon Index (NSTI) score [39].

2.6. Statistical Analysis

Statistical analysis of the results were accomplished using Statistica v 13.0 software (StatSoft, Kraków, Poland). The processed results were presented in the graphical form as the mean value and the standard deviation. To achieve the objective of verification the hypothesis, the non-parametric tests were applied: Kruskal–Wallis test (α = 0.05), and Mann–Whitney test (α = 0.05).

3. Results

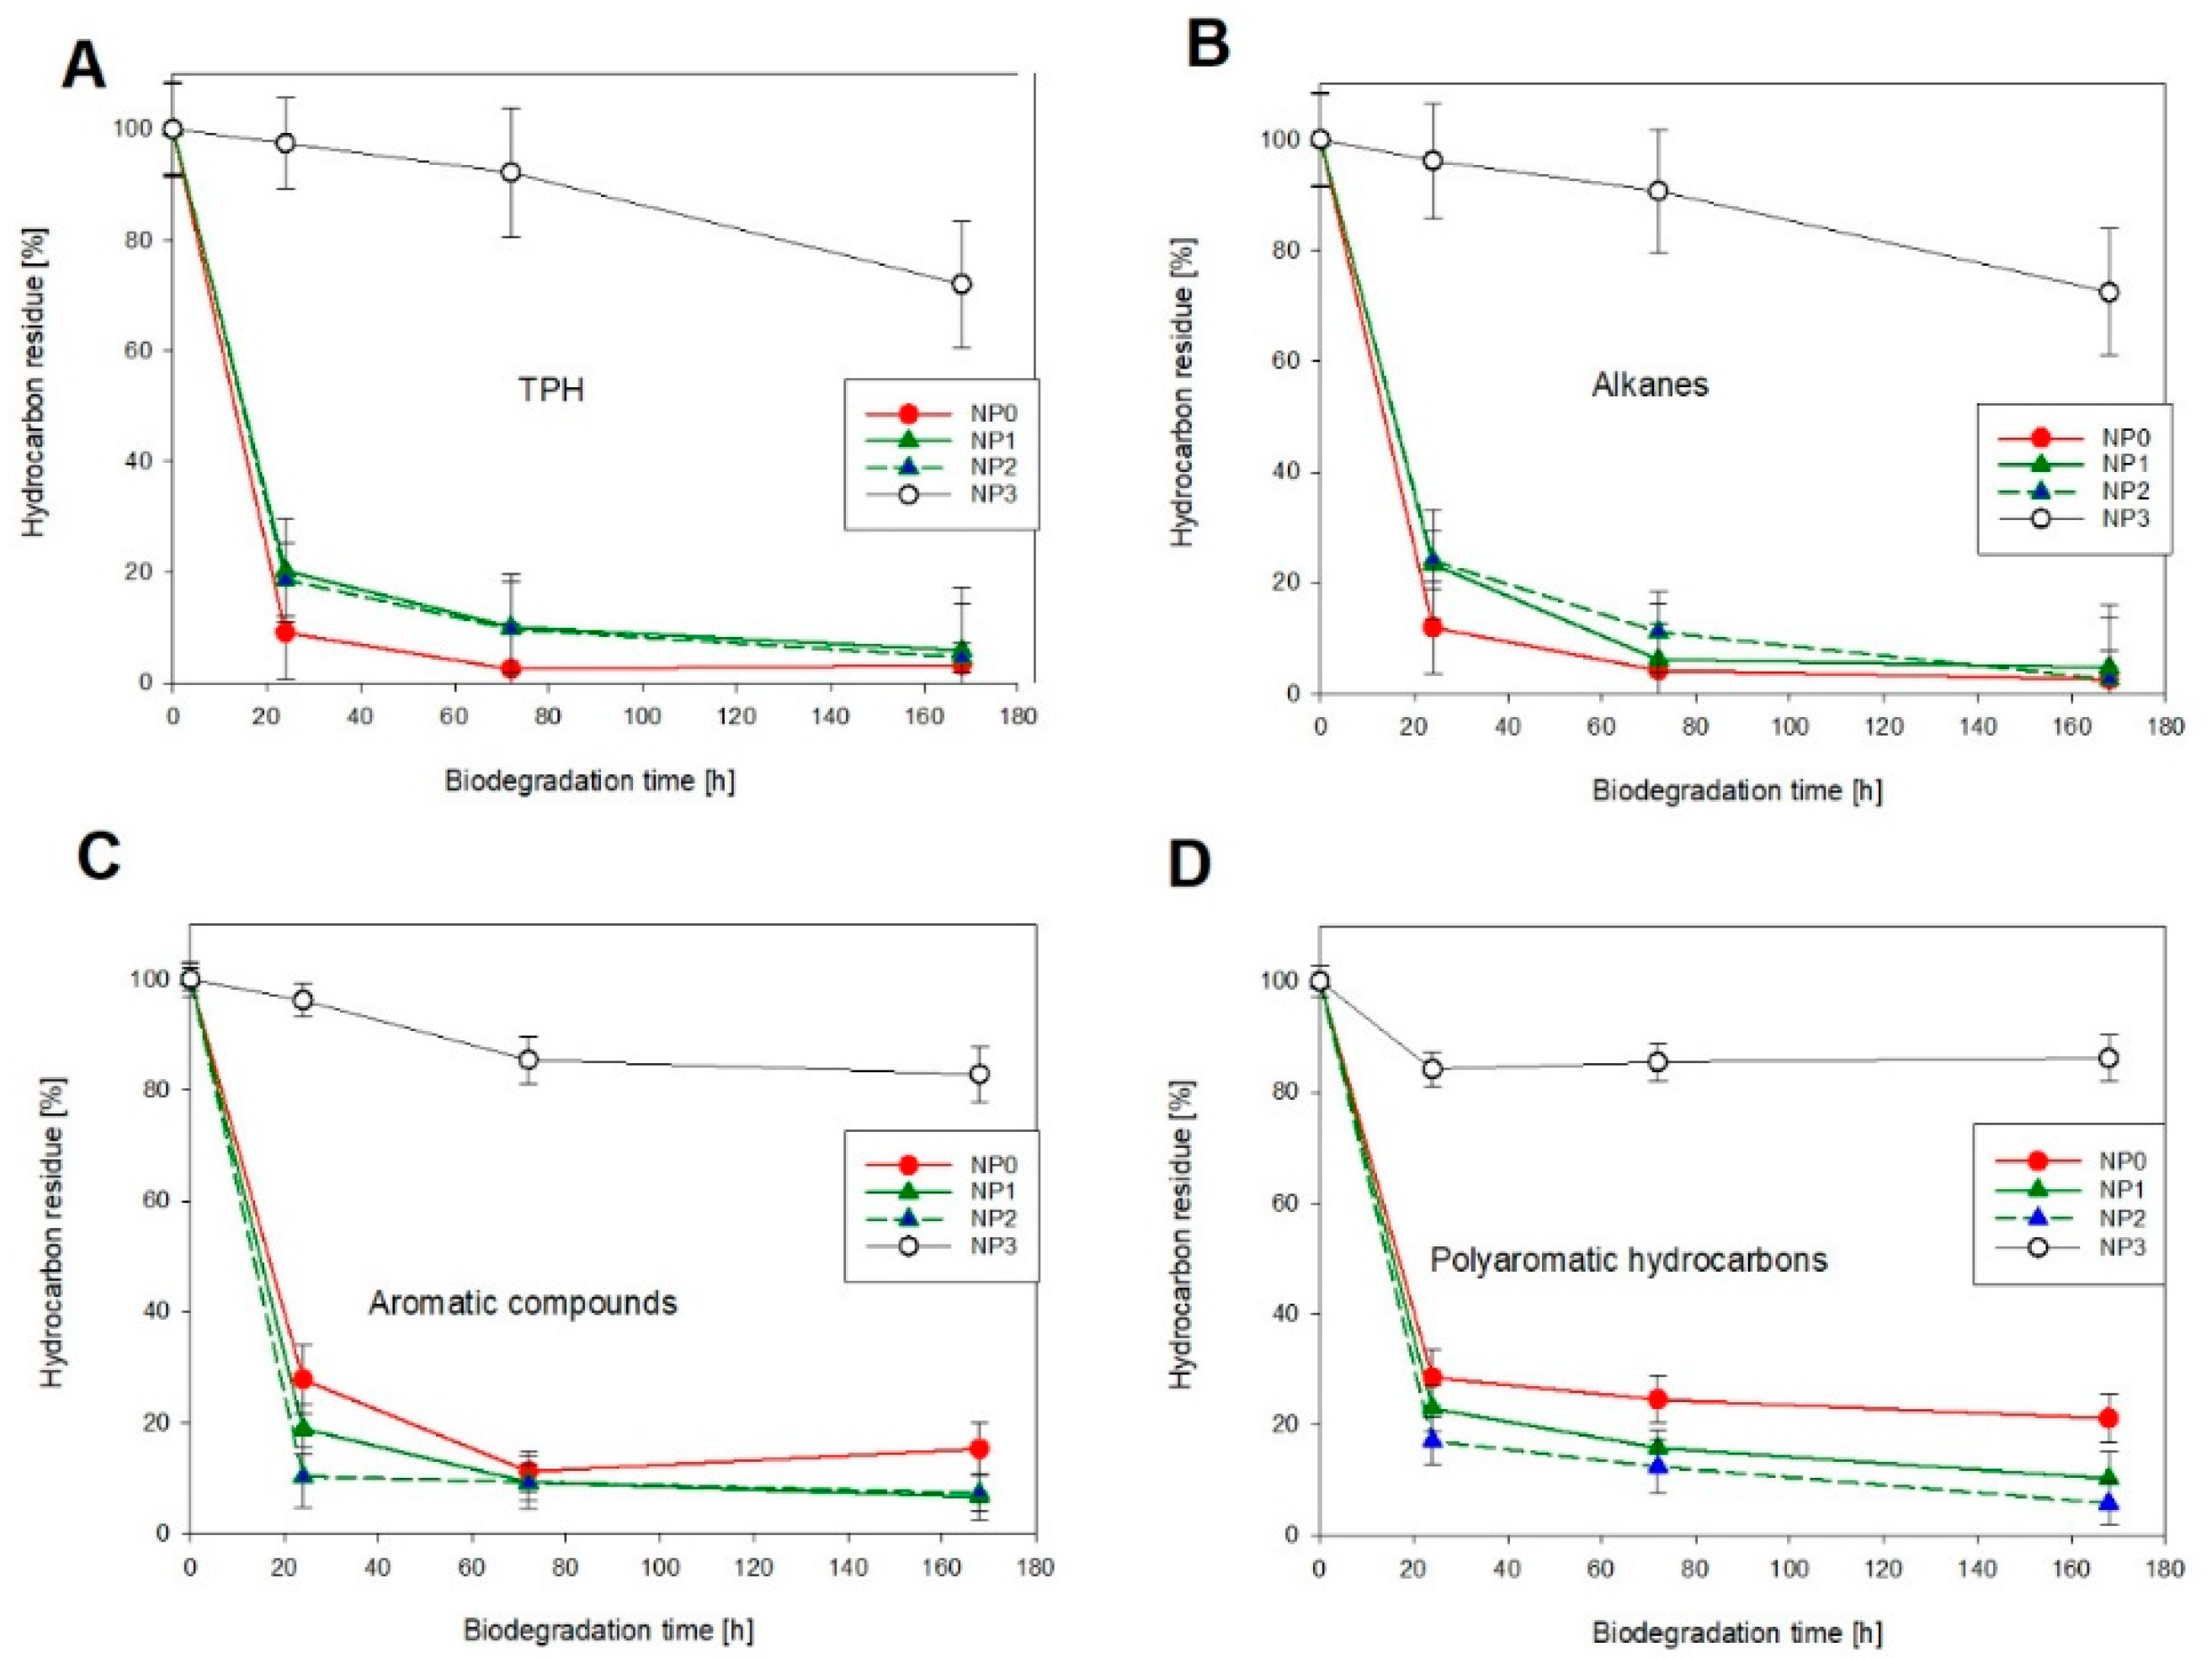
3.1. Hydrocarbon Biodegradation

The analysis of the biodegradation kinetics shows no significant influence of low and moderate levels of biostimulation (NP1 and NP2) on the distribution of most hydrocarbon fractions: total petroleum hydrocarbons (TPH), alkanes, aromatic, and polyaromatic hydrocarbon compounds (Figure 1). The exception is the fraction of polycyclic aromatic hydrocarbons (PAH), where a statistically significant improvement in the effectiveness of biological decomposition is found in the variants with low and moderate levels of nitrogen supplementation (by 10.8% in the NP1 variant, and 15.2% in the NP2 variant, respectively) (Figure 1D). Among all the analyzed groups of hydrocarbon compounds, the inhibitory effect of excessive supplementation with nitrogen compounds is noted. The strongest biodegradation inhibition is noted in the case of PAH, with only 13.9% of this fraction of hydrocarbon compounds degraded after 7 days.

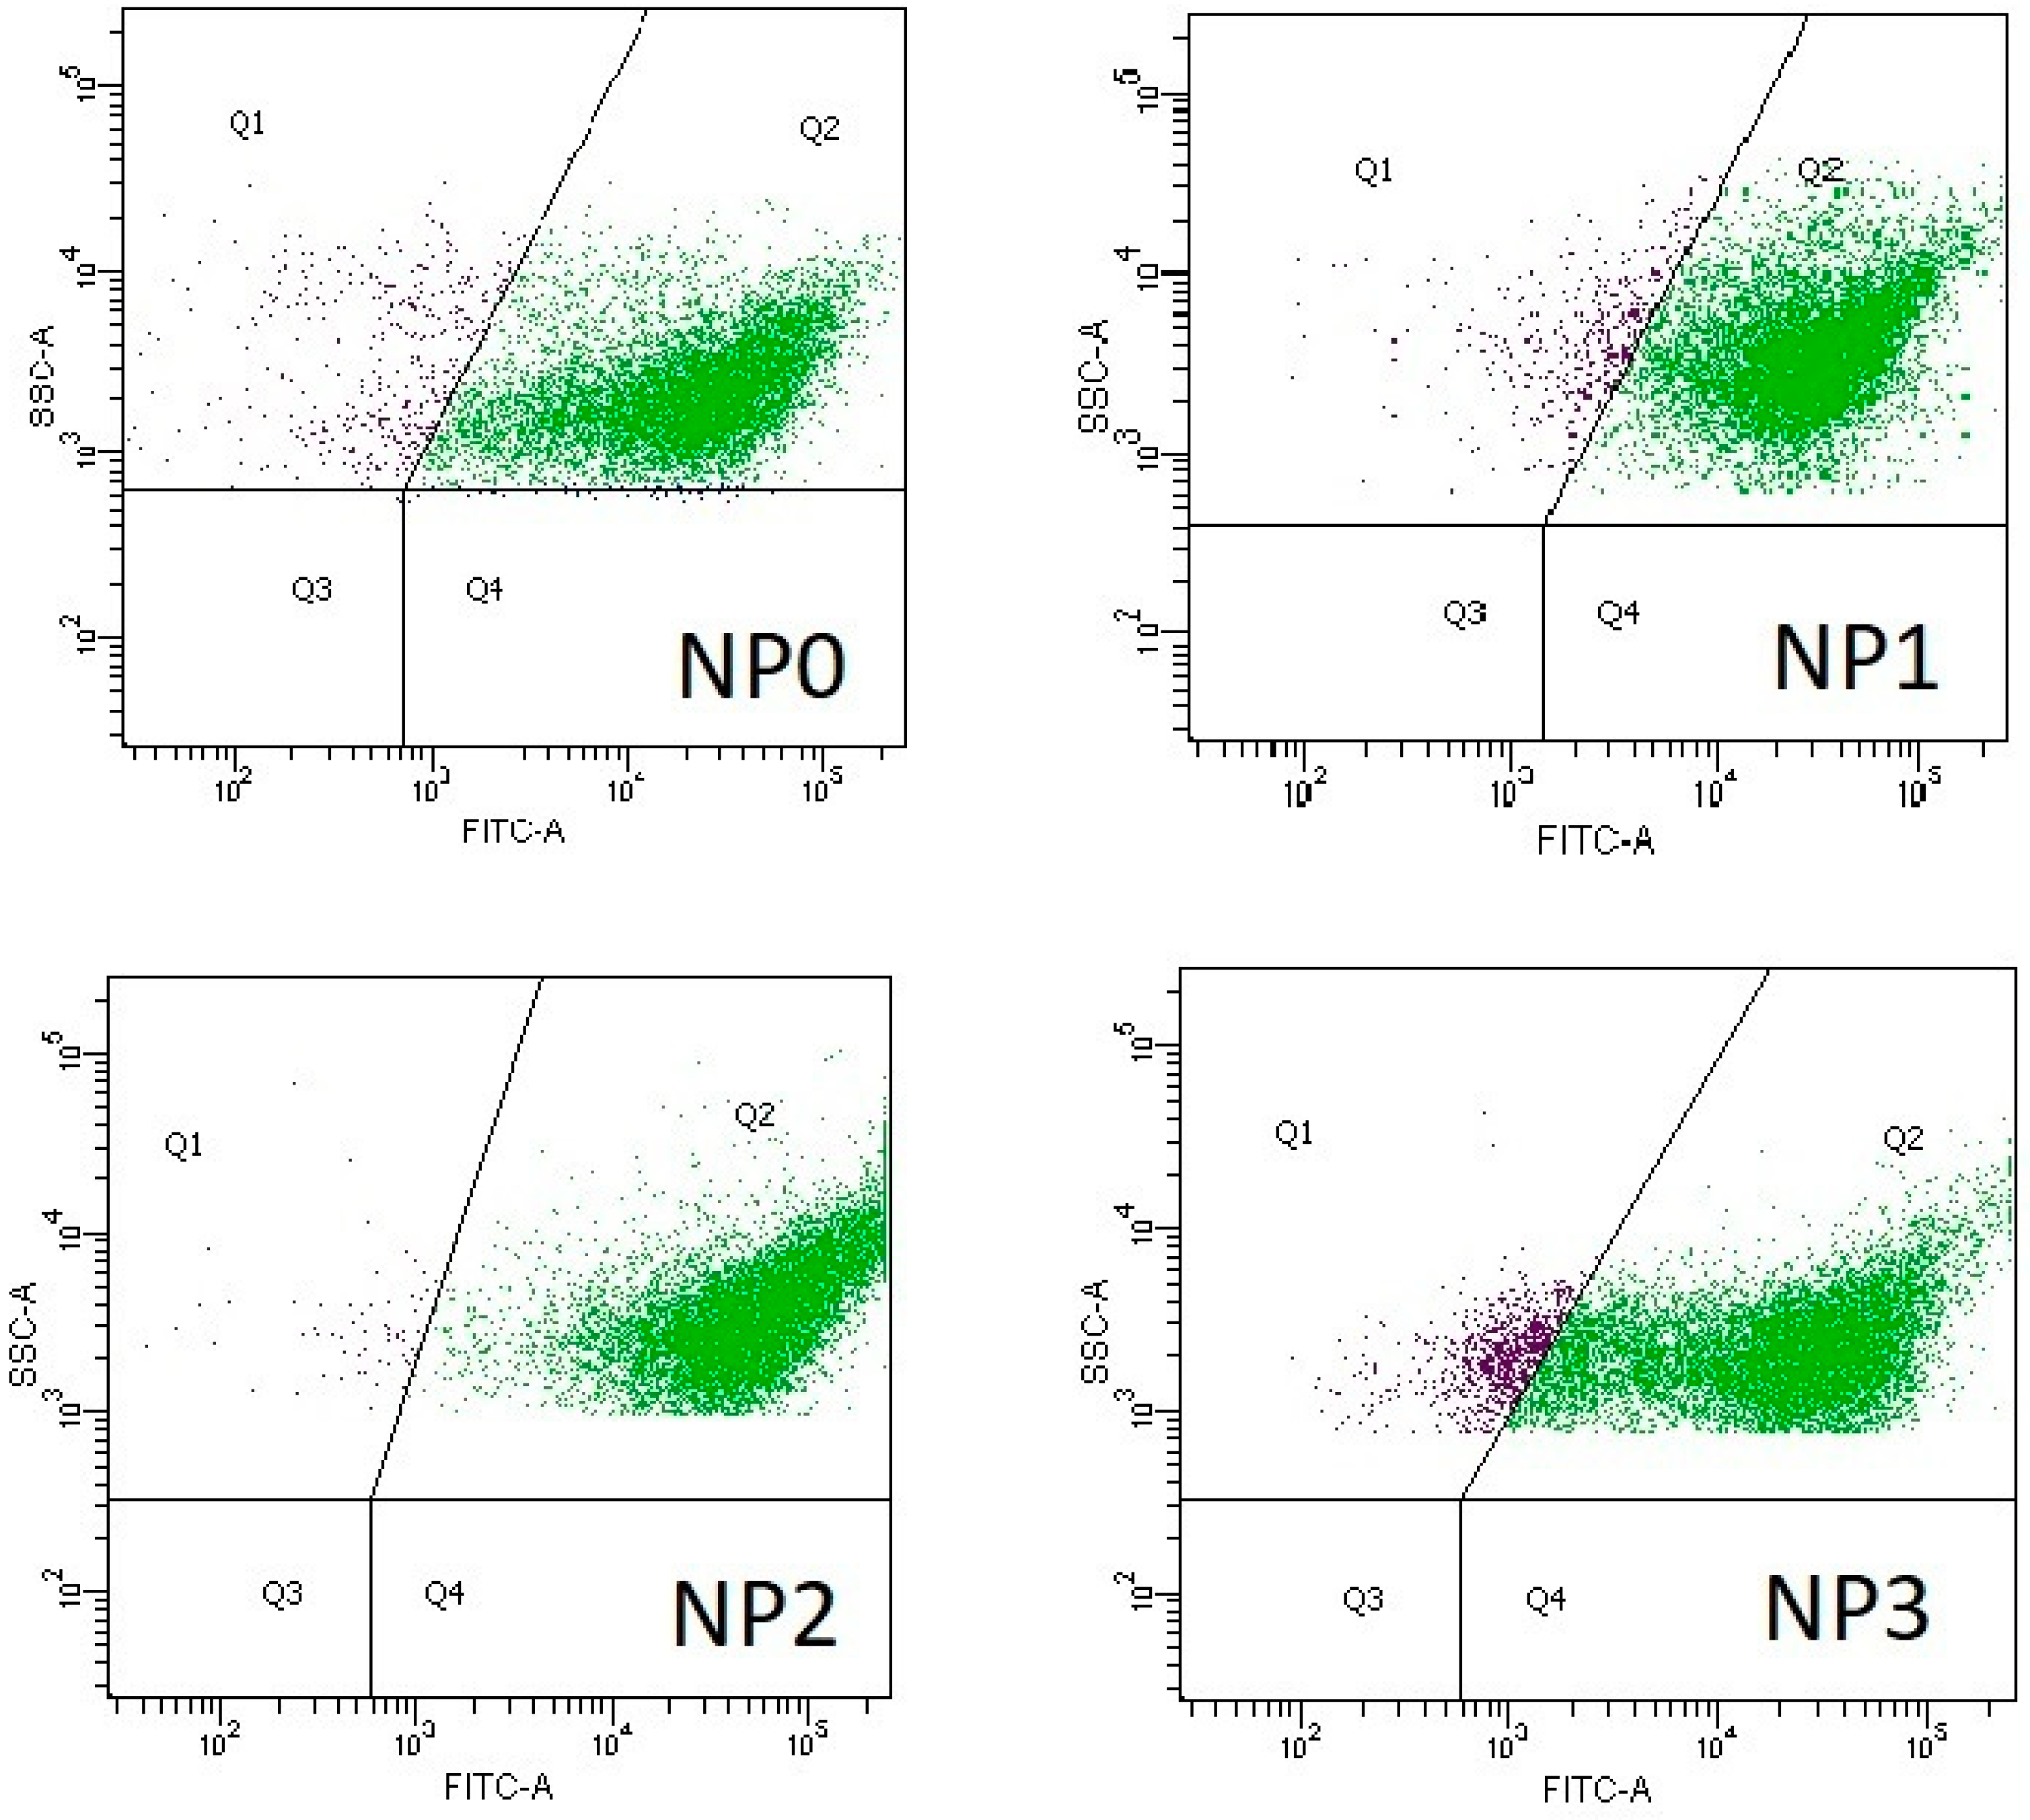
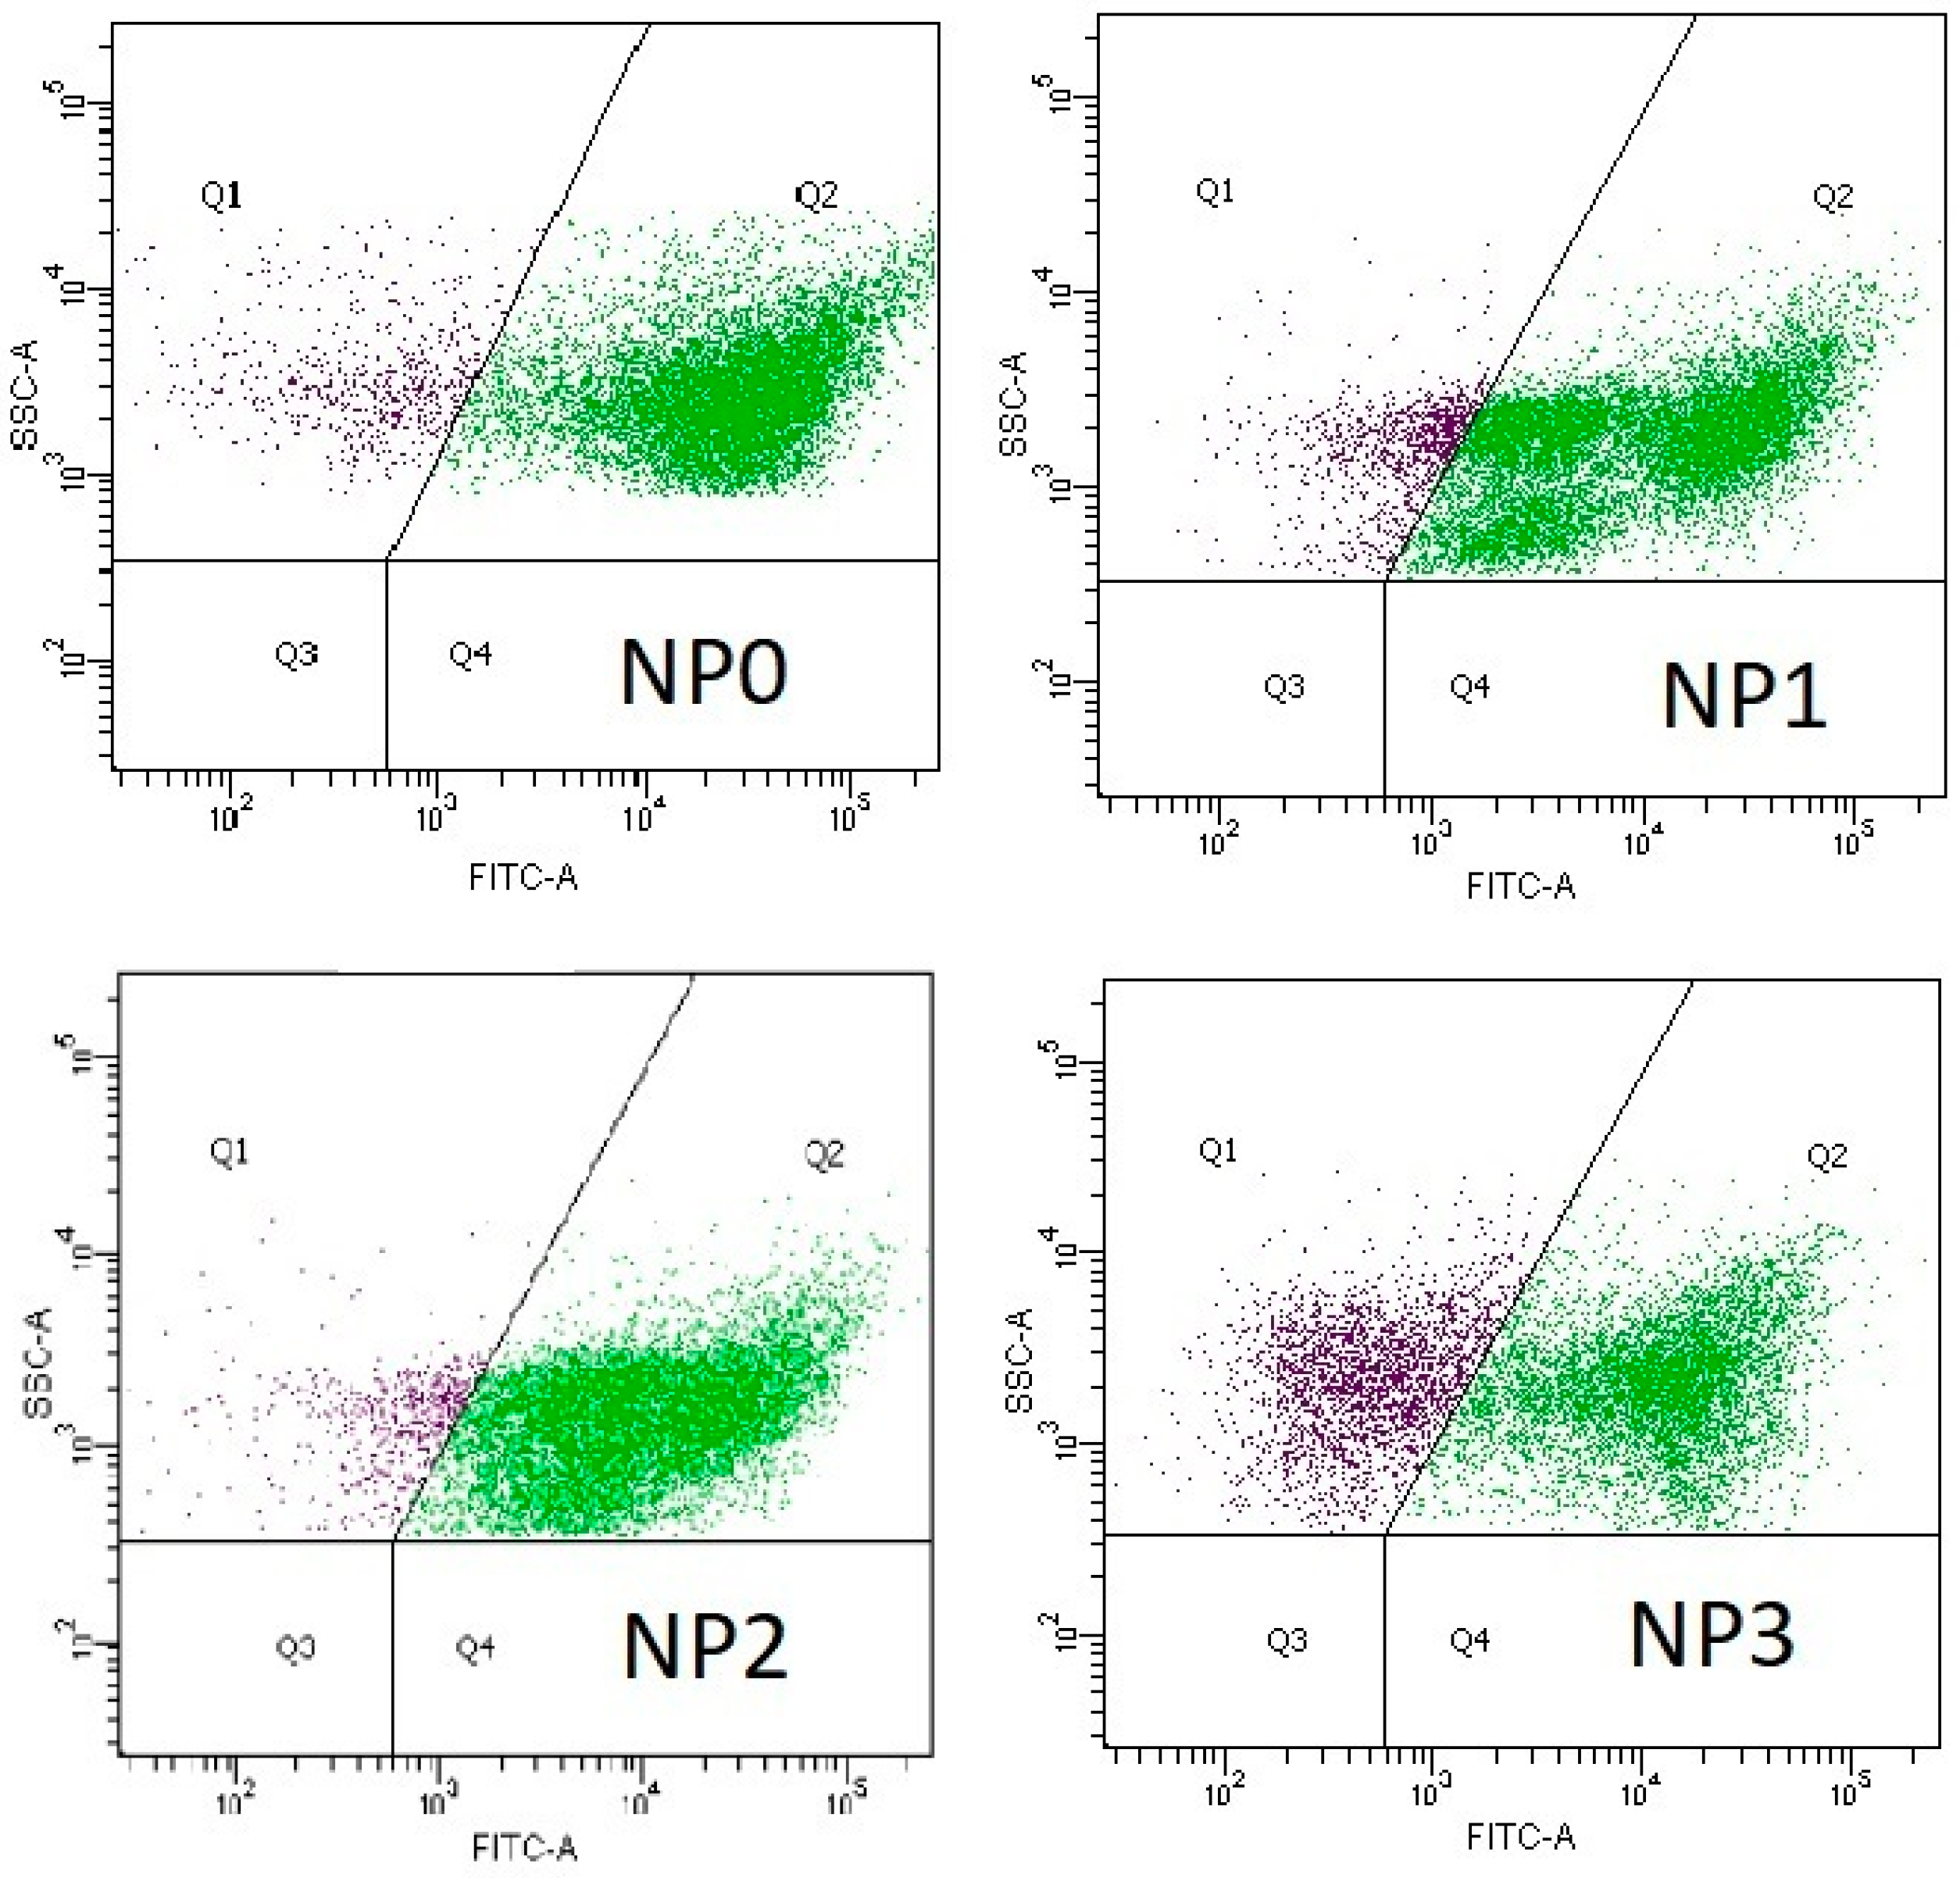
3.2. Microbial Activity

Cytometric analysis shows no significant effect of low and moderate doses of nitrogen on the metabolic activity of microbial cells after 24 h of the biodegradation process. In the variant NP3 (excessive biostimulation), a 5.6% decrease in metabolic activity is noted (Figure 2).
The second assessment of metabolic activity, carried out after 168 h of the experiment, shows significant, but slight, changes in the variants NP2 and NP3 (Figure 3). The moderate level of biostimulation (NP2) has a positive effect on the activity of microorganisms (3.2% increase, compared to the control sample). Moreover, excessive biostimulation (NP3) causes a significant decrease in microbial activity (by 17.6%, compared to the control sample) (Figure 3).

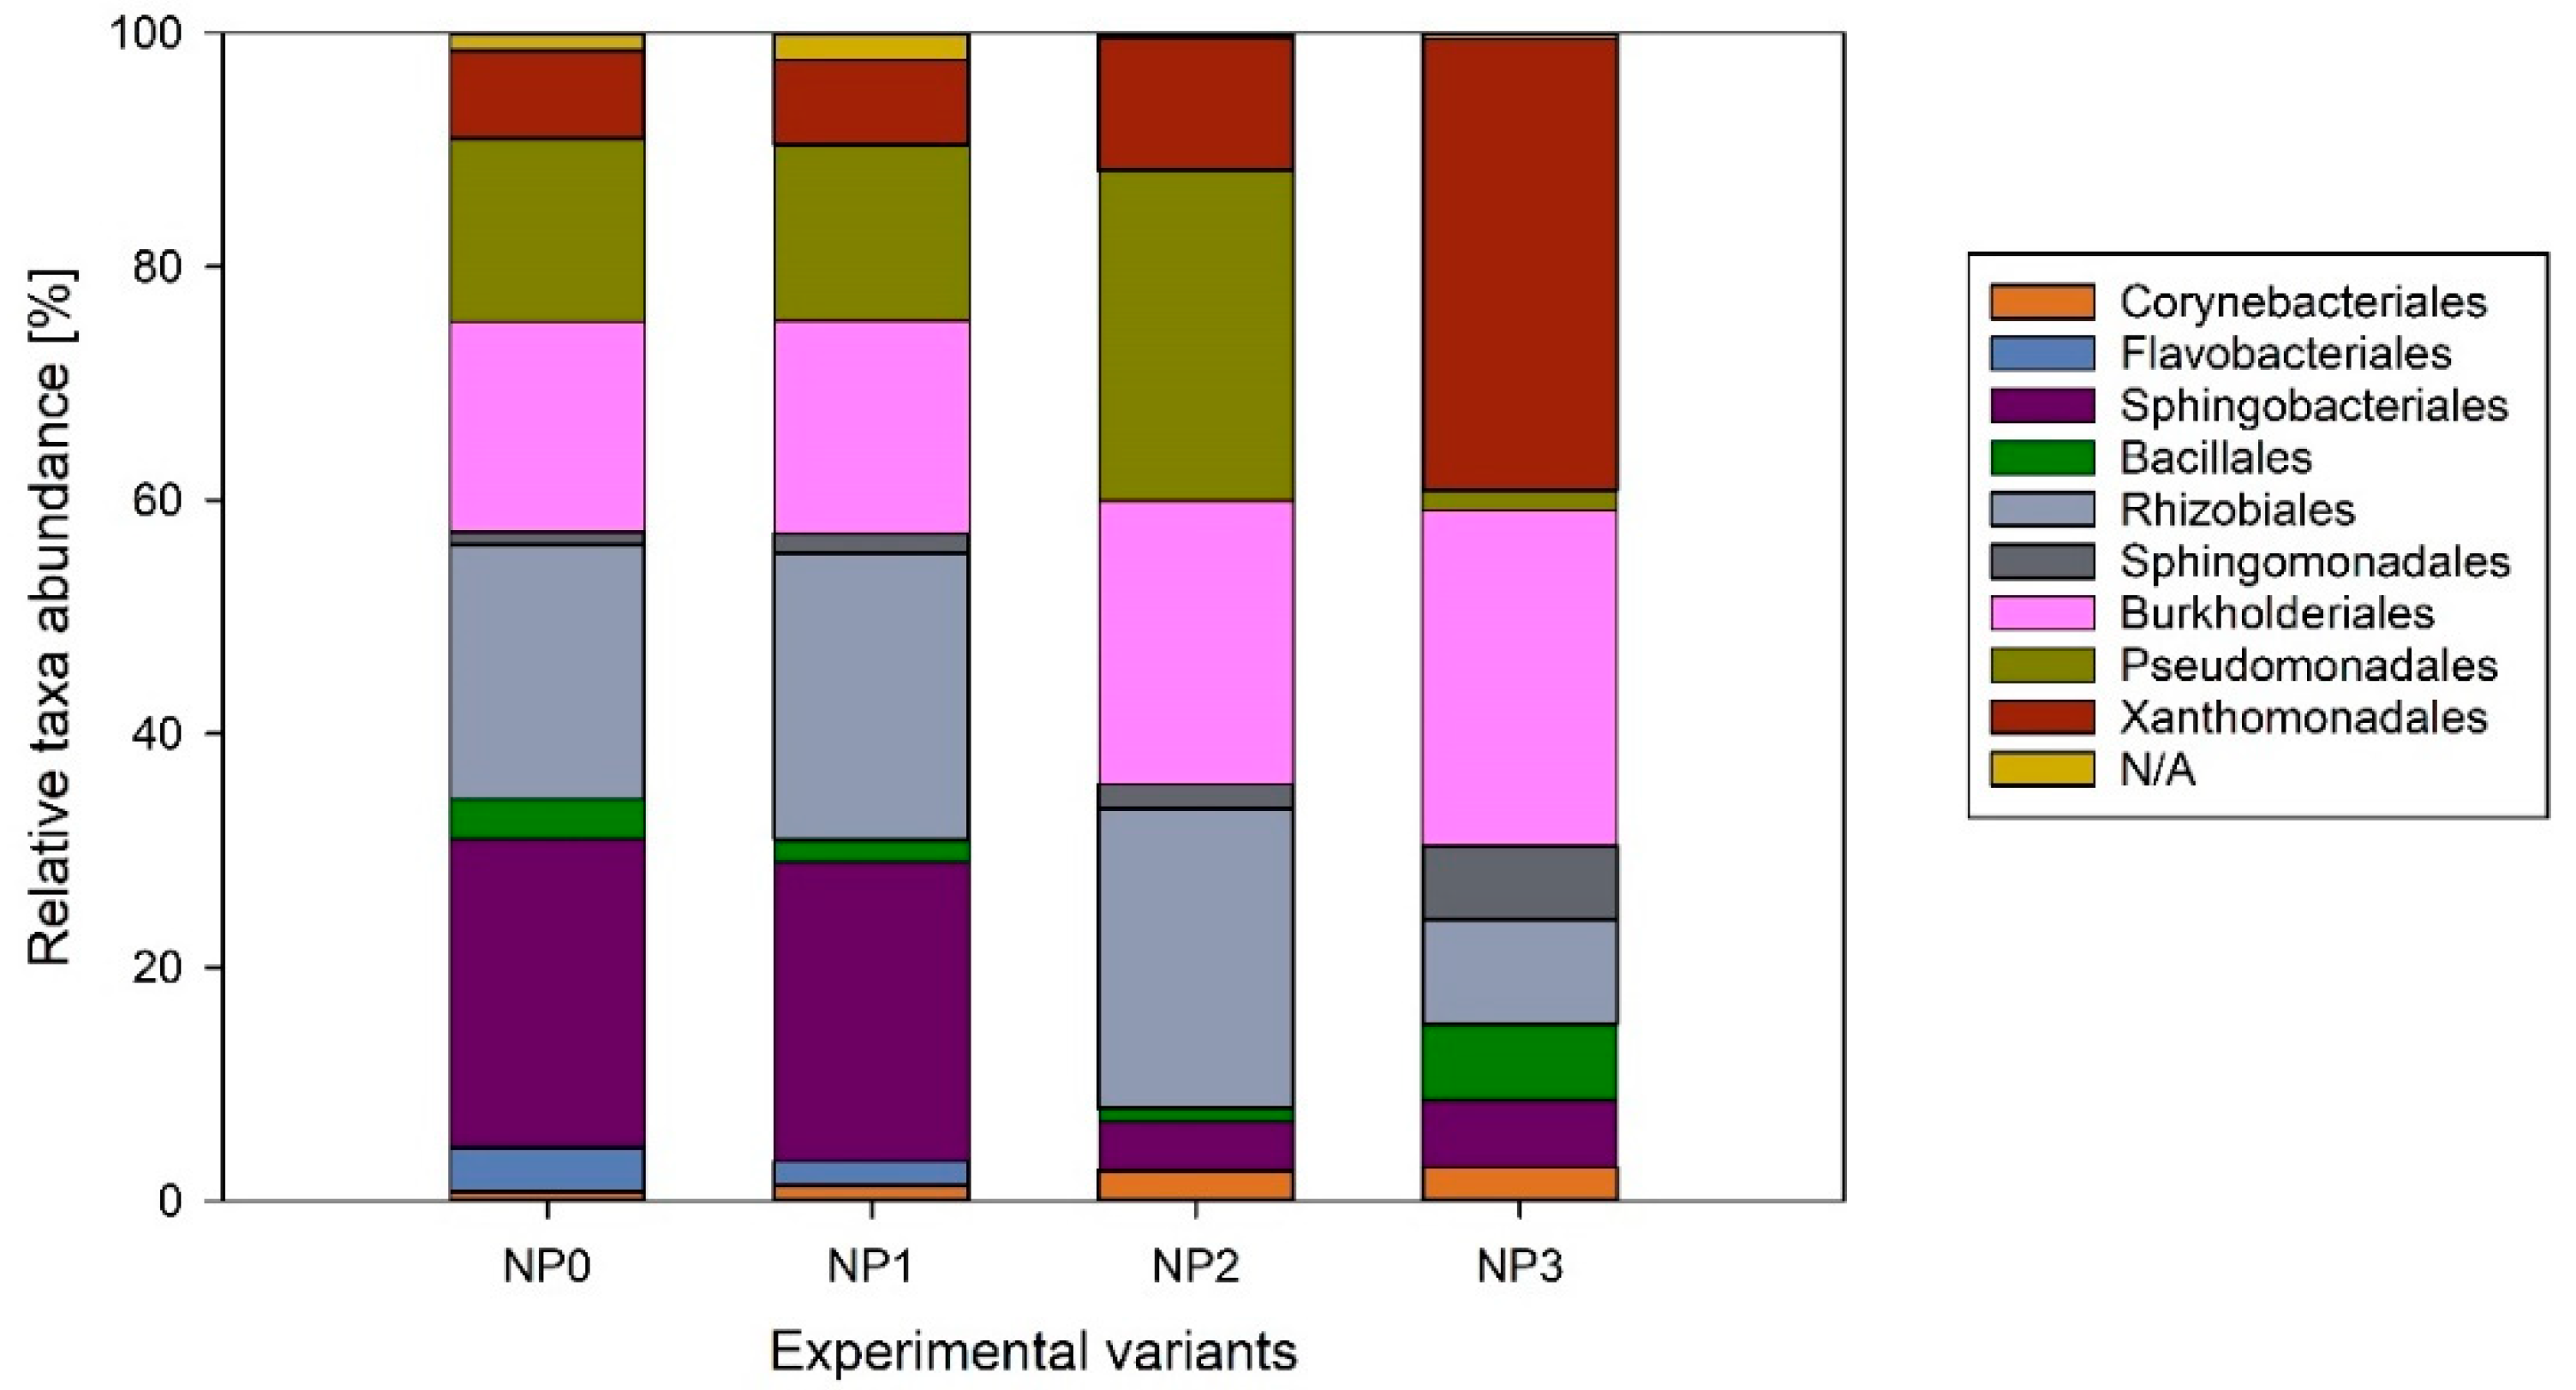
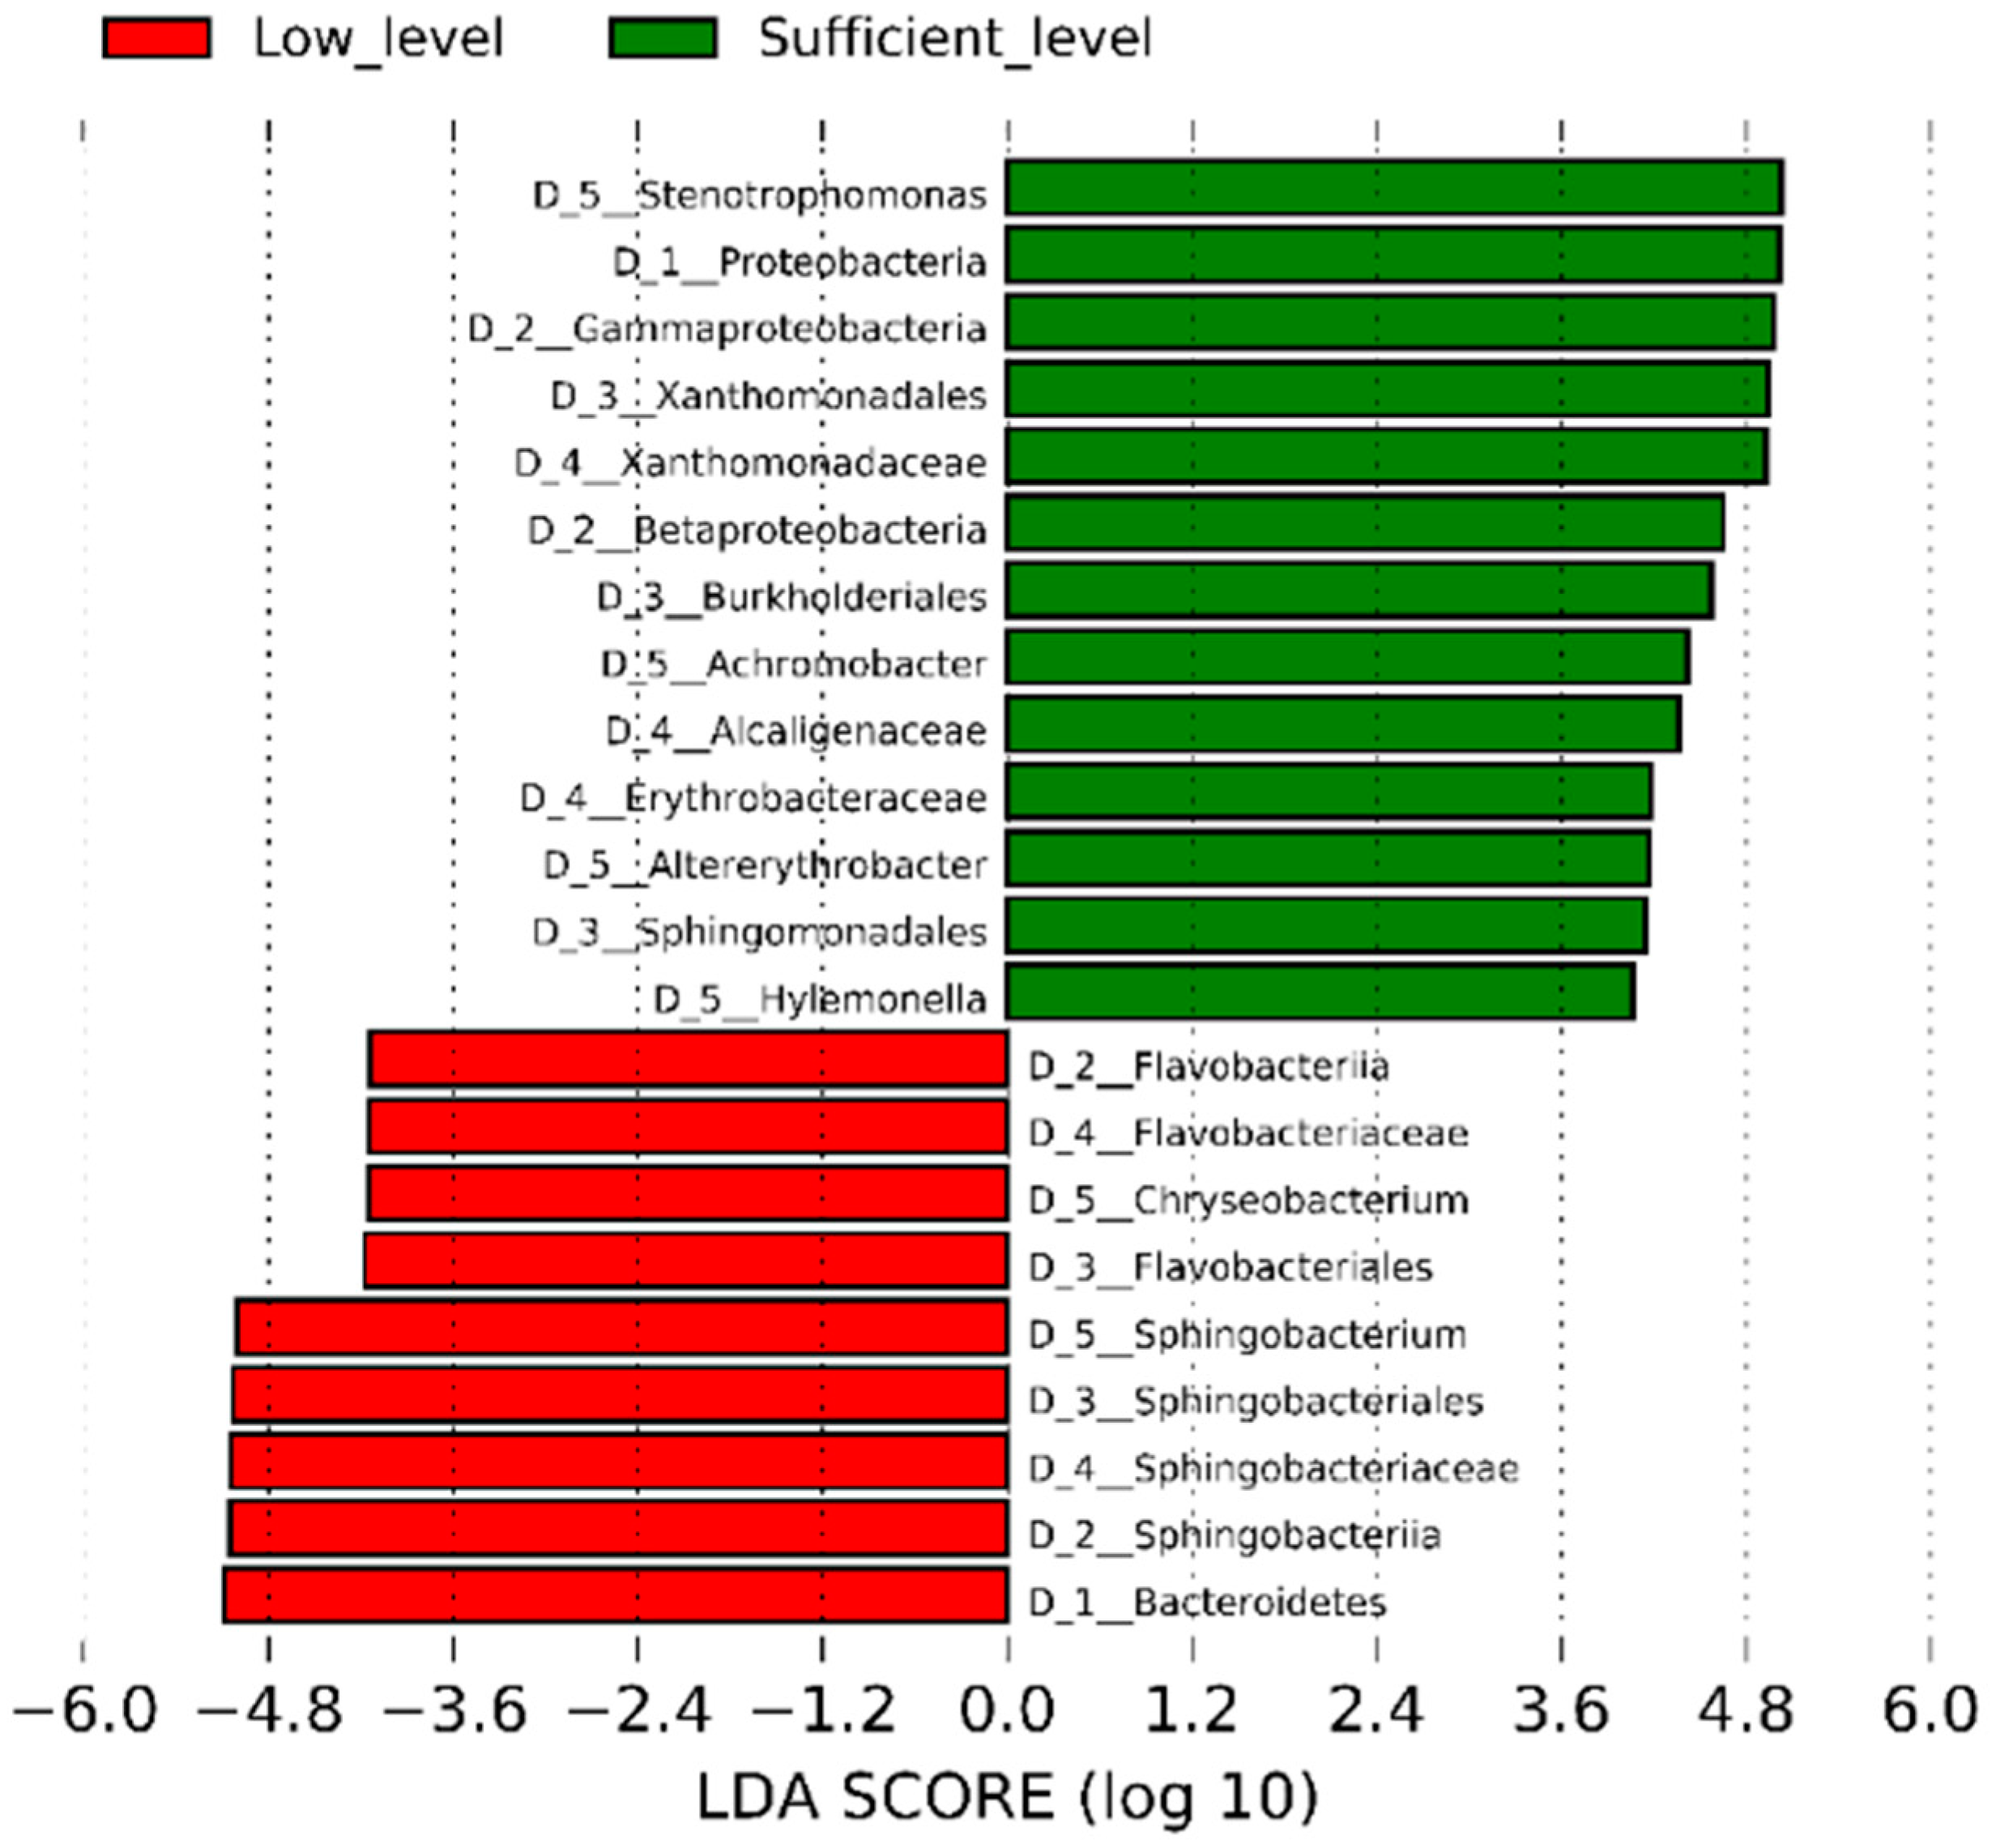
3.3. Biodiversity Analysis

The results of the selected biodiversity coefficients analysis are presented in Table 2. Excessive levels of biostimulation (NP3) contribute to a significant decrease in biodiversity (OTU number, Simpson’s index, and phylogenetic diversity). In other experimental variants, no significant differences are noted.
The analysis of the taxonomic structure of bacterial populations shows significant differences between the variants characterized by a low level of nitrogen compounds (NP0 and NP1), and the variants in which the amount of these compounds is at the optimal, and over-optimal, level (NP2 and NP3). In the samples with the levels of nitrogen compounds below the optimal concentration, the domination of the Sphingobacteria (26% for NP0 and 25% for NP1) and Alphaproteobacteria (24% for NP0 and 27% for NP1) is noted. The variants with a lower ratio of carbon to nitrogen show a much higher abundance of the Gammaproteobacteria (39% for NP2 and 41% for NP3) and Betaproteobacteria (24% for NP2 and 28% for NP3). A detailed taxonomic analysis is presented in Figure 4. It should be mentioned that the share of the orders Sphingobacteriales and Xanthomonadales decreases significantly in variants with optimal and excessive levels of nitrogen compounds. The Burkholderiales order shows the opposite trend. Moreover, excessive biostimulation contributes to a large decrease in the share of the Pseudomonadales and Rhizobiales orders, compared to the trials with optimal, or suboptimal, supplementation.
The linear discriminant analysis effect size (LEfSe) allows for the selection of the most differentially abundant taxa between a deficient nitrogen level and a sufficient nitrogen level in experimental variants. (Figure 5). The taxa particularly responsive to changes in the supply of nitrogen compounds include Gammaproteobacteria and Betaproteobacteria, as well as the orders Xanthomonadales, Burkholderiales, Sphingomonadales, Flavobacteriales, and Sphingobacteriales.

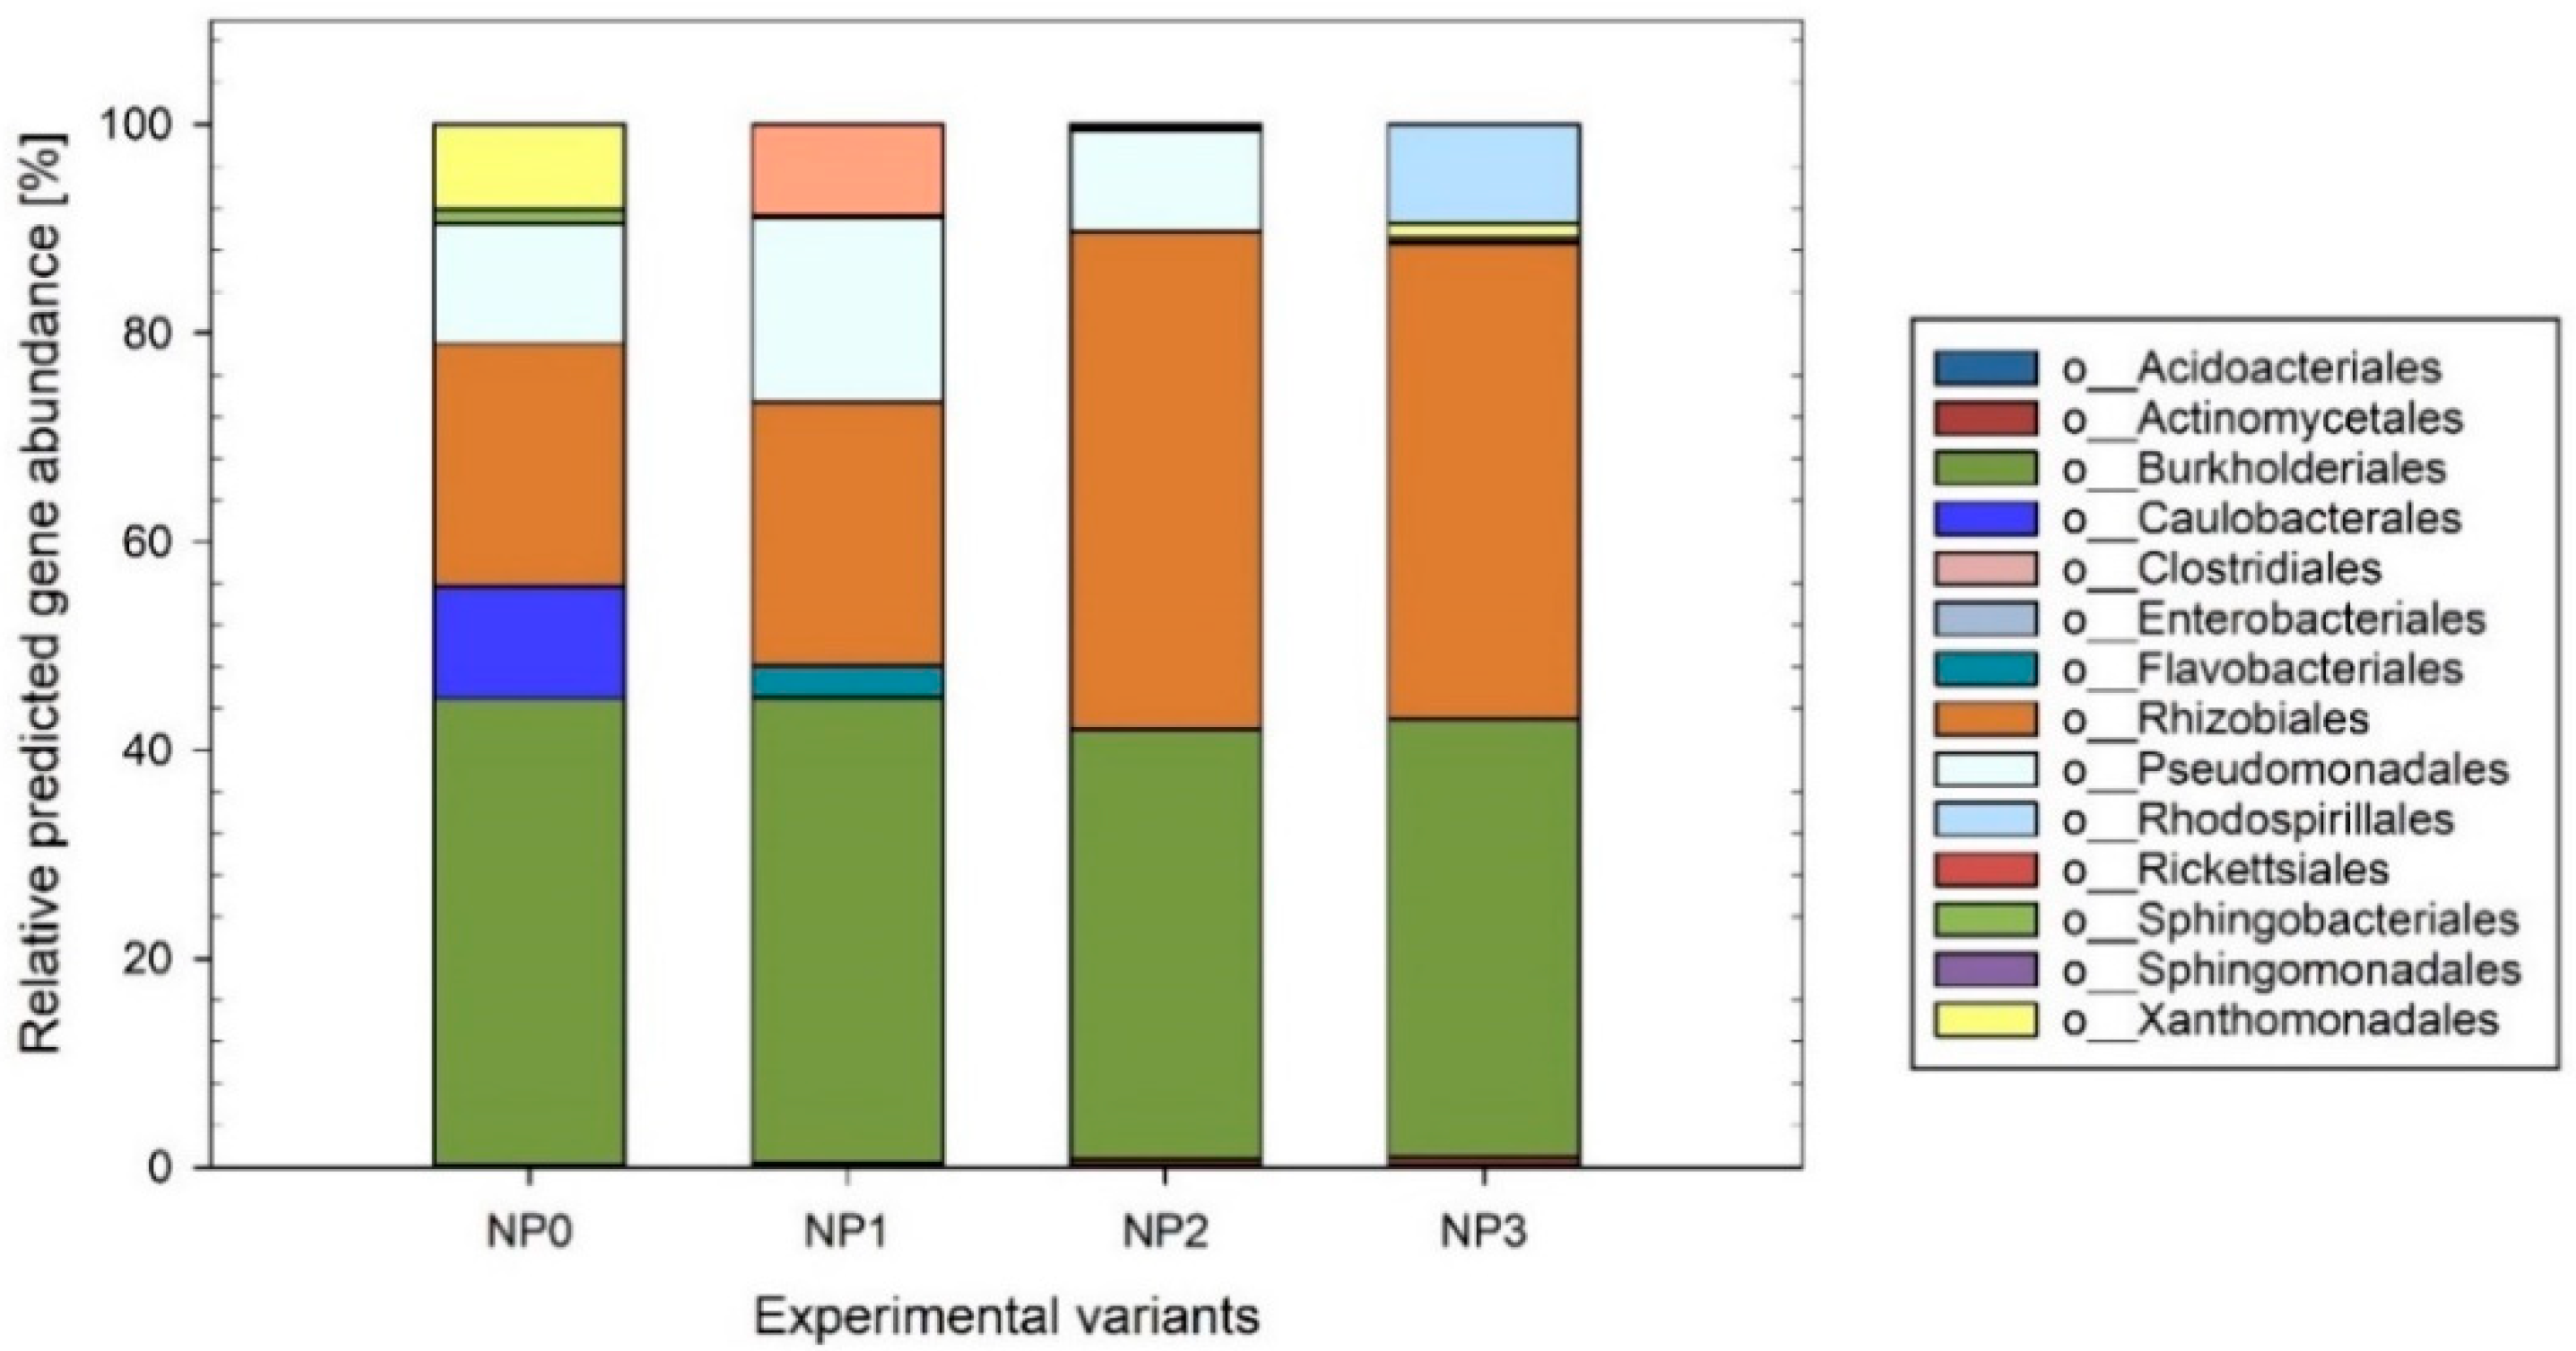
3.4. Prediction of Metabolic Properties

The analysis of the predicted metabolic potential for the degradation of PAH compounds in individual bacterial taxa is presented in Figure 6. In all experimental variants, the orders of Sphingobacteriales and Rhizobiales are characterized by a high-predicted representation of genes encoding enzymes involved in PAH biodegradation.

4. Discussion

Biostimulation is considered a promising method of supporting hydrocarbon biodegradation processes, by eliminating element deficiencies, mainly nitrogen and phosphorus [12,14,15,16]. Biostimulation can be combined with bioaugmentation techniques, which use microorganisms characterized by a high biodegradation potential, in both single strain and consortia. These microorganisms are often isolated from permanently contaminated environments, and they are well described in the literature [12,17,18]. Methods using the enzymatic potential of microbes are considered effective for the degradation of most hydrocarbon fractions. However, there are some limitations in the effective decomposition of aromatic compounds, which belong to the fraction that is extremely resistant to biological degradation [40,41,42]. Similar conclusions are noted in our research, where the aromatic and polyaromatic fractions are the group of compounds most difficult to decompose. The conducted experiment confirms the increase in the efficiency of biological decomposition of the most problematic fraction, PAH, under the influence of low and optimal supplementation with nitrogen compounds (NP1 and NP2 variants). Interestingly, excessive biostimulation contributes to the inhibition of biological decomposition of all analyzed fractions of hydrocarbon compounds. Similar trends are mentioned in other studies [43,44]. Uncontrolled biostimulation can be counterproductive in the context of hydrocarbon remediation.
The decrease in biodegradation efficiency due to the excessive supply of nitrogen compounds is associated with a decrease in metabolic activity, which is noted both after 24 h (by 3.2%) and after 168 h (by 17.6%) of the experiment. The toxic effect of excessive concentrations of nitrogen compounds on the population of microorganisms could be related to the progressive accumulation of their metabolism products, such as ammonia and ammonium ions, or its oxidation products—nitrates. The phenomenon of the toxicity of ammonia and ammonium ions is very well characterized in the context of the impact on higher organisms, while, in the field of microbiology, this topic still requires detailed research [45]. Moreover, the research by Leejeerajumnean et al. (2000) shows that microorganisms can differ significantly in the level of tolerance to the action of ammonia compounds [46]. This fact may be related to the decrease in alpha-biodiversity observed in the NP3 variant, which suggests the presence of an important selection factor. It is believed that microbial populations have a relatively high metabolic flexibility and functional redundancy; however, they react relatively quickly, with a change in taxonomic structure, to the action of variable, selective environmental factors [47]. This phenomenon is confirmed in the conducted genetic analyzes. Changes in the dominant bacterial classes in variants with a moderate and high supply of nitrogen compounds (NP2 and NP3) are observed. There is a dominance of the Gammaproteobacteria and Betaproteobacteria classes, as well as the Xanthomonadales and Burkholderiales orders, which suggests that these classes and orders are particularly important during the population response to changes in the supply of nitrogen compounds. Similar trends are observed in an earlier study [48]. The researchers find an increase in the share of Gammaproteobacteria and Xanthomonadales in soils subjected to a long-term fertilization process with nitrogen compounds. Therefore, it can be assumed that these changes are not accidental.
It can be also postulated that those dominant taxa, which are also the most differentially abundant between deficient and sufficient nitrogen variants, such as Xanthomonadales and Burkholderiales, are more competitive than the other bacteria groups in the use of nitrogen compounds. In an earlier study, Sun et al. (2021) emphasize that long-term exposure to nitrogen compounds results in the dominance of microbial groups associated with ureolysis, and the nitrification and denitrification processes. It is found that the microbial groups that harbor the same or similar functional genes involved in nitrogen use can coexist together. This functional redundancy is well described in the literature, and it is believed that it may increase the stability of microbial metapopulations in the long term [49].
The LEfSe analysis identifies the most significant taxonomic differences between two classes of nitrogen supply (deficient and sufficient). The Xanthomonadales, Burkholderiales, and Sphingomonadales orders may be of key importance in the biological degradation of hydrocarbon fractions in environments with a periodically variable supply of nitrogen compounds, as well as in intensive biostimulation technologies. However, due to their high sensitivity to the variability of environmental parameters, this groups of microorganisms should not play a bioindicative role.
PICRUSt analysis reveals that the Sphingobacteriales and Rhizobiales orders have a high genetic potential for biodegradation of the PAH fraction. The nitrogen-fixing Rhizobiales order seems to be particularly important. The decrease in its share in the NP3 variant, found after 168 h of biodegradation, can be related to the reduced degradation efficiency of PAH. The biodegradation potential of PAH by microorganisms belonging to the Rhizobiales order is described in the literature. It is believed that Rhizobiales effectively support the process of PAH bioremediation in environments with a deficiency of nitrogen compounds, due to the activity of genes responsible for nitrogen binding [50]. It can be suggested that the quantitative analysis of the Rhizobiales order is helpful in estimating the effectiveness of PAH natural attenuation in areas with a deficiency of nitrogen compounds, and the validity of bioremediation techniques supported by biostimulation. However, it should be mentioned that the process of biological decomposition of polycyclic aromatic hydrocarbons is a complex process. Many studies indicate the importance of cometabolism and metapopulation interactions in the degradation of this group of xenobiotics [51,52,53]. Therefore, it is not possible to indicate only one group of microorganisms that clearly determines the effectiveness of biological decomposition of PAH.
Based on the current knowledge, it is difficult to make any hypotheses regarding the mechanisms that drive the observed population changes of microorganisms and modifications of the genetic pool in the context of the biological decomposition of hydrocarbon compounds, including PAH. However, it should be emphasized that properly optimized supplementation with nitrogen compounds has a positive effect on the processes of hydrocarbon remediation, if the dose of the biostimulator is optimally selected. Careless application of nitrogenous substances above optimal levels may contribute to the inhibition of biodegradation processes.

5. Conclusions

A properly optimized technology of biostimulation with nitrogen compounds may show a beneficial effect on the biological degradation of one of the most difficult to decompose fractions—PAH. However, excessive supplementation with nutrients may reduce the efficiency of the process, due to decreased metabolic activity of microorganisms and lower biodiversity. Changes in the C:N ratio result in a disturbance of the taxonomic structure of the bacteria population. It also affects the genetic potential of the metapopulation for the PAH degradation. Microorganisms belonging to the Xanthomonadales, Burkholderiales, Sphingomonadales, Flavobacteriales, and Sphingobacteriales orders have a high predicted potential for PAH biodegradation, and show a high quantitative fluctuation under the influence of nitrogen compounds. It can be suggested that the design of a molecular diagnostic test allowing the assessment of the genetic potential of environment by biostimulation, or bioaugmentation supported by biostimulation, should be based on a comprehensive analysis of many groups of microorganisms. Moreover, this analysis should take into account the observed possibility of fluctuations in the shares of the taxa mentioned above.

Author Contributions

Conceptualization, J.S.-P., P.C. and A.P.-C.; methodology, J.S.-P., J.C., W.J. and Ł.W.; validation, J.S.-P., J.C. and W.J.; formal analysis, J.S.-P. and A.P.-C.; investigation, J.S.-P., J.C., W.J., Ł.W., P.C. and A.P.-C.; data curation J.S.-P., J.C., W.J. and Ł.W.; writing—original draft preparation, J.S.-P.; writing—review and editing P.C. and A.P.-C.; visualization, J.S.-P.; supervision, P.C. and A.P.-C.; project administration, A.P.-C. All authors have read and agreed to the published version of the manuscript.

Funding

This research was funded by National Science Centre in Poland in the years 2014–2018, with the research project Opus no. 2013/11/B/NZ9/01908. Publication was financed within the framework of the Polish Ministry of Science and Higher Education’s program: “Regional Excellence Initiative” in the years 2019–2022 (No. 005/RID/2018/19), financing amount 1,200,000,000 PLN.

Institutional Review Board Statement

Not applicable.

Informed Consent Statement

Not applicable.

Data Availability Statement

Raw sequence data were deposited in Sequence Read Archive (SRA), as project no PRJNA831882.

Conflicts of Interest

The authors declare no conflict of interest.

References

  1. Das, N.; Chandran, P. Microbial degradation of petroleum hydrocarbon contaminants: An overview. Biotechnol. Res. Int. 2011, 2011, 941810. [Google Scholar] [CrossRef] [Green Version]
  2. Chandra, S.; Sharma, R.; Sharma, A. Application of bioremediation technology in the environment contaminated with petroleum hydrocarbon. Ann. Microbiol. 2013, 63, 417–431. [Google Scholar] [CrossRef]
  3. Truskewycz, A.; Gundry, T.D.; Khudur, L.S.; Kolobaric, A.; Taha, M.; Aburto-Medina, A.; Ball, A.S.; Shahsavari, E. Petroleum Hydrocarbon Contamination in Terrestrial Ecosystems-Fate and Microbial Responses. Molecules 2019, 24, 3400. [Google Scholar] [CrossRef] [Green Version]
  4. Abha, S.; Singh, C.S. Hydrocarbon pollution: Effects on living organisms, remediation of contaminated environments, and effects of heavy metals co-contamination on bioremediation. In Introduction to Enhanced Oil Recovery (EOR) Processes and Bioremediation of Oil-Contaminated Sites; Romero-Zerón, L., Ed.; InTech Open: Rijeka, Croatia, 2012. [Google Scholar]
  5. Szczepaniak, Z.; Cyplik, P.; Juzwa, W.; Czarny, J.; Staninska, J.; Piotrowska-Cyplik, A. Antibacterial effect of the Trichoderma viride fungi on soil microbiome during PAH’s biodegradation. Int. Biodeterior. Biodegrad. 2015, 104, 170–177. [Google Scholar] [CrossRef]
  6. Szczepaniak, Z.; Czarny, J.; Staninska-Pięta, J.; Lisiecki, P.; Zgoła-Grześkowiak, A.; Cyplik, P.; Chrzanowski, Ł.; Wolko, Ł.; Marecik, R.; Juzwa, W.; et al. Influence of soil contamination with PAH on microbial community dynamics and expression level of genes responsible for biodegradation of PAH and production of rhamnolipids. Environ. Sci. Pollut. Res. 2016, 23, 23043–23056. [Google Scholar] [CrossRef] [Green Version]
  7. Al-Hawash, A.B.; Dragh, M.A.; Li, S.; Alhujaily, A.; Abbood, H.A.; Zhang, X.; Ma, F. Principles of microbial degradation of petroleum hydrocarbons in the environment. Egypt. J. Aquat. Res. 2018, 44, 71–76. [Google Scholar] [CrossRef]
  8. Staninska-Pięta, J.; Piotrowska-Cyplik, A.; Juzwa, W.; Zgoła-Grześkowiak, A.; Wolko, Ł.; Sydow, Z.; Kaczorowski, Ł.; Powierska-Czarny, J.; Cyplik, P. The impact of natural and synthetic surfactants on bacterial community during hydrocarbon biodegradation. Int. Biodeterior. Biodegrad. 2019, 142, 191–199. [Google Scholar] [CrossRef]
  9. Steliga, T. Ocena efektywności biodegradacji węglowodorów ropopochodnych w zastarzałym odpadzie z dołu urobkowego Graby-59 w warunkach przemysłowych metodą in-situ. Nafta-Gaz 2014, 70, 351–364. [Google Scholar]
  10. Sihag, S.; Pathak, H.; Jaroli, D.P. Factors affecting biodegradation of polyaromatic hydrocarbons. Int. J. Pure Appl. 2014, 2, 185–202. [Google Scholar]
  11. Ouriache, H.; Moumed, I.; Arrar, J.; Abdelkader, N.; Lounici, H. Influence of C/N/P ratio evolution on biodegradation of petroleum hydrocarbons-contaminated soil. ALJEST 2020, 6, 1604–1611. [Google Scholar]
  12. Tyagi, M.; da Fonseca, M.R.; de Carvalho, C.C.C.R. Bioaugmentation and biostimulation strategies to improve the effectiveness of bioremediation processes. Biodegradation 2011, 22, 231–241. [Google Scholar] [CrossRef]
  13. Adams, G.O.; Fufeyin, P.T.; Okoro, S.E.; Ehinomen, I. Bioremediation, biostimulation and bioaugmentation: A review. Int. J. Environ. Bioremediat. Biodegrad. 2015, 3, 28–39. [Google Scholar] [CrossRef]
  14. Agarry, S.E.; Owabor, C.N. Anaerobic bioremediation of marine sediment artificially contaminated with anthracene and naphthalene. Environ. Technol. 2011, 32, 1375–1381. [Google Scholar] [CrossRef]
  15. Silva-Castro, G.A.; Rodelas, B.; Perucha, C.; Laguna, J.; González-López, J.; Calvo, C. Bioremediation of diesel-polluted soil using biostimulation as post-treatment after oxidation with Fenton-like reagents: Assays in a pilot plant. Sci. Total Environ. 2013, 15, 347–355. [Google Scholar] [CrossRef]
  16. Wu, M.; Dick, W.A.; Li, W.; Wang, X.; Yang, Q.; Wang, T.; Xu, L.; Zhang, M.; Chen, L. Bioaugmentation and biostimulation of hydrocarbon degradation and the microbial community in a petroleum-contaminated soil. Int. Biodeterior. Biodegrad. 2016, 107, 158–164. [Google Scholar] [CrossRef]
  17. Suja, F.; Rahim, F.; Taha, M.R.; Hambali, N.; Razali, M.R.; Khalid, A.; Hamzah, A. Effects of local microbial bioaugmentation and biostimulation on the bioremediation of total petroleum hydrocarbons (TPH) in crude oil contaminated soil based on laboratory and field observations. Int. Biodeterior. Biodegrad. 2014, 90, 115–122. [Google Scholar] [CrossRef]
  18. Hamoudi-Belarbi, L.; Demdoum, S.; Medjras, S.; Hamoudi, S. Combination of bioaugmentation and biostimulation as an oil-drilling mud contaminated soil bioremediation treatment. Appl. Ecol. Environ. Res. 2019, 17, 15463–15475. [Google Scholar] [CrossRef]
  19. Vidali, M. Bioremediation. An overview. Pure Appl. Chem. 2001, 73, 1163–1172. [Google Scholar] [CrossRef]
  20. Kumavath, R.N.; Deverapalli, P. Scientific swift in bioremediation: An overview. In Bioremediation; Patil, Y., Ed.; InTech Open: Rijeka, Croatia, 2013. [Google Scholar]
  21. Walworth, J.; Pond, A.; Snape, I.; Rayner, J.; Ferguson, S.; Harvey, P. Nitrogen Requirements for Maximizing Petroleum Bioremediation in a Sub-Antarctic Soil. Cold Reg. Sci. Technol. 2007, 48, 84–91. [Google Scholar] [CrossRef]
  22. Ruberto, L.; Vazquez, S.C.; Mac Cormack, W.P. Effectiveness of the natural bacterial flora, biostimulation and bioaugmentation on the bioremediation of a hydrocarbon contaminated Antarctic soil. Int. Biodeterior. Biodegrad. 2003, 52, 115–125. [Google Scholar] [CrossRef]
  23. Liu, P.W.; Chang, T.C.; Whang, L.M.; Kao, C.H.; Pan, P.T.; Cheng, S.S. Bioremediation of petroleum hydrocarbon contaminated soil: Effects of strategies and microbial community shift. Int. Biodeterior. Biodegrad. 2011, 65, 1119–1127. [Google Scholar] [CrossRef]
  24. Dolinšek, J.; Goldschmidt, F.; Johnson, D.R. Synthetic microbial ecology and the dynamic interplay between microbial genotypes. FEMS Microbiol. Rev. 2016, 40, 961–979. [Google Scholar] [CrossRef] [Green Version]
  25. Said, S.B.; Or, D. Synthetic microbial ecology: Engineering habitats for modular consortia. Front. Microbiol. 2017, 8, 1125. [Google Scholar] [CrossRef] [Green Version]
  26. Czarny, J.; Staninska-Pięta, J.; Piotrowska-Cyplik, A.; Juzwa, W.; Wolniewicz, A.; Marecik, R.; Ławniczak, Ł.; Chrzanowski, Ł. Acinetobacter sp. as the key player in diesel oil degrading community exposed to PAHs and heavy metals. J. Hazard. Mater. 2020, 383, 121168. [Google Scholar] [CrossRef]
  27. Cheng, X.; Zhao, T.; Fu, X.; Hu, Z. Identification of nitrogen compounds in RFCC diesel oil by mass spectrometry. Fuel Process. Technol. 2004, 85, 1463–1472. [Google Scholar] [CrossRef]
  28. Caporaso, J.G.; Lauber, C.L.; Walters, W.A.; Brg-Lyons, D.; Huntley, J.; Fierer, N.; Owens, S.M.; Betly, J.; Fraser, L.; Bauer, M.; et al. Ultra-high-throughput microbial community analysis on the Illumina HiSeq and MiSeq platforms. ISME J. 2012, 6, 1621–1624. [Google Scholar] [CrossRef] [PubMed] [Green Version]
  29. Quast, C.; Pruesse, E.; Yilmaz, P.; Gerken, J.; Schweer, T.; Yarza, P.; Peplies, J.; Glöckner, F.O. The SILVA ribosomal RNA gene database project: Improved data processing and web-based tools. Nucleic Acids Res. 2013, 41, D590–D596. [Google Scholar] [CrossRef]
  30. DeSantis, T.Z.; Hugenholtz, P.; Larsen, N.; Rojas, M.; Brodie, E.L.; Keller, K.; Huber, T.; Dalevi, D.; Hu, P.; Andersen, G.L. Greengenes, a chimera-checked 16S rRNA gene database and workbench compatible with ARB. Appl. Environ. Microbiol. 2006, 72, 5069–5072. [Google Scholar] [CrossRef] [Green Version]
  31. Segata, N.; Izard, J.; Waldron, L.; Gevers, D.; Miropolsky, L.; Garret, W.S.; Huttenhower, C. Metagenomic biomarker discovery and explanation. Genome Biol. 2011, 12, R60. [Google Scholar] [CrossRef] [Green Version]
  32. Staley, C.; Gould, T.J.; Wang, P.; Phillips, J.; Cotner, J.B.; Sadowsky, M.J. Core functional traits of bacterial communities in the Upper Mississippi River show limited variation in response to land cover. Front. Microbiol. 2014, 5, 414. [Google Scholar] [CrossRef]
  33. Czarny, J.; Staninska-Pięta, J.; Piotrowska-Cyplik, A.; Wolko, Ł.; Staninski, K.; Hornik, B.; Cyplik, P. Assessment of soil potential to natural attenuation and autochthonous bioaugmentation using microarray and functional predictions from metagenome profiling. Ann. Microbiol. 2019, 9, 945–955. [Google Scholar] [CrossRef]
  34. Staninska-Pięta, J.; Czarny, J.; Piotrowska-Cyplik, A.; Juzwa, W.; Wolko, Ł.; Nowak, J.; Cyplik, P. Heavy Metals as a Factor Increasing the Functional Genetic Potential of Bacterial Community for Polycyclic Aromatic Hydrocarbon Biodegradation. Molecules 2020, 25, 319. [Google Scholar] [CrossRef] [Green Version]
  35. Ahmad, T.; Gupta, G.; Sharma, A.; Kaur, B.; El-Sheikh, M.A.; Alyemeni, M.N. Metagenomic analysis exploring taxonomic and functional diversity of bacterial communities of a Himalayan urban fresh water lake. PLoS ONE 2021, 16, e0248116. [Google Scholar] [CrossRef]
  36. Hornik, B.; Czarny, J.; Staninska-Pięta, J.; Wolko, Ł.; Cyplik, P.; Piotrowska-Cyplik, A. The Raw Milk Microbiota from Semi-Subsistence Farms Characteristics by NGS Analysis Method. Molecules 2021, 26, 5029. [Google Scholar] [CrossRef]
  37. Ijoma, G.N.; Nkuna, R.; Mutungwazi, A.; Rashama, C.; Matambo, T.S. Applying PICRUSt and 16S rRNA functional characterisation to predicting co-digestion strategies of various animal manures for biogas production. Sci. Rep. 2021, 11, 19913. [Google Scholar] [CrossRef]
  38. Li, J.; Huang, B.; Long, J. Effects of different antimony contamination levels on paddy soil bacterial diversity and community structure. Ecotoxicol. Environ. Saf. 2021, 220, 112339. [Google Scholar] [CrossRef]
  39. Langille, M.G.; Zaneveld, J.; Caporaso, J.G.; McDonald, D.; Knights, D.; Reyes, J.A.; Clemente, J.C.; Burkepile, D.E.; Thurber, R.L.V.; Knight, R.; et al. Predictive functional profiling of microbial communities using 16S rRNA marker gene sequences. Nat. Biotechnol. 2013, 31, 814–821. [Google Scholar] [CrossRef]
  40. Seo, J.S.; Keum, Y.S.; Li, Q.X. Bacterial degradation of aromatic compounds. Int. J. Environ. Res. 2009, 6, 278–309. [Google Scholar] [CrossRef]
  41. Staninska, J.; Szczepaniak, Z.; Staninski, K.; Czarny, J.; Piotrowska-Cyplik, A.; Nowak, J.; Marecik, R.; Chrzanowski, Ł.; Cyplik, P. High Voltage Electrochemiluminescence (ECL) as a New Method for Detection of PAH During Screening for PAH-Degrading Microbial Consortia. Water Air Soil Pollut. 2015, 226, 270. [Google Scholar] [CrossRef] [Green Version]
  42. Czarny, J.; Staninska-Pięta, J.; Powierska-Czarny, J.; Nowak, J.; Wolko, Ł.; Piotrowska-Cyplik, A. Metagenomic analysis of soil bacterial community and level of genes responsible for biodegradation of aromatic hydrocarbons. Pol. J. Microbiol. 2017, 66, 345–352. [Google Scholar] [CrossRef] [Green Version]
  43. Carmichael, L.M.; Pfaender, F.K. The effect of inorganic and organic supplements on the microbial degradation of phenanthrene and pyrene in soils. Biodegradation 1997, 8, 1–13. [Google Scholar] [CrossRef]
  44. Chaîneau, C.H.; Rougeux, G.; Yéprémian, C.; Oudot, J. Effects of nutrient concentration on the biodegradation of crude oil and associated microbial populations in the soil. Soil Biol. Biochem. 2005, 37, 1490–1497. [Google Scholar] [CrossRef]
  45. Müller, T.; Walter, B.; Wirtz, A.; Burkovski, A. Ammonium toxicity in bacteria. Curr. Microbiol. 2006, 52, 400–406. [Google Scholar] [CrossRef] [Green Version]
  46. Leejeerajumnean, A.; Ames, J.M.; Owens, J.D. Effect of ammonia on the growth of Bacillus species and some other bacteria. Lett. Appl. Microbiol. 2000, 30, 385–389. [Google Scholar] [CrossRef]
  47. Avila-Jimenez, M.-L.; Burns, G.; He, Z.; Zhou, J.; Hodson, A.; Avila-Jimenez, J.M.-L.; Pearce, D. Functional Associations and Resilience in Microbial Communities. Microorganisms 2020, 8, 951. [Google Scholar] [CrossRef]
  48. Li, C.; Yan, K.; Tang, L.; Jia, Z.; Li, Y. Change in deep soil microbial communities due to long-term fertilization. Soil Biol. Biochem. 2014, 75, 264–272. [Google Scholar] [CrossRef]
  49. Sun, R.; Wang, F.; Hu, C.; Liu, B. Metagenomics reveals taxon-specific responses of the nitrogen-cycling microbial community to long-term nitrogen fertilization. Soil Biol. Biochem. 2021, 156, 108214. [Google Scholar] [CrossRef]
  50. Shin, B.; Bociu, I.; Kolton, M.; Huettel, M.; Kostka, J.E. Succession of microbial populations and nitrogen-fixation associated with the biodegradation of sediment-oil-agglomerates buried in a Florida sandy beach. Sci. Rep. 2019, 9, 19401. [Google Scholar] [CrossRef] [Green Version]
  51. Ghosal, D.; Ghosh, S.; Dutta, T.K.; Ahn, Y. Current State of Knowledge in Microbial Degradation of Polycyclic Aromatic Hydrocarbons (PAHs): A Review. Front. Microbiol. 2016, 7, 1369. [Google Scholar] [CrossRef] [Green Version]
  52. Gupta, G.; Kumar, V.; Pal, A.K. Microbial Degradation of High Molecular Weight Polycyclic Aromatic Hydrocarbons with Emphasis on Pyrene. Polycycl. Aromat. Compd. 2019, 39, 124–138. [Google Scholar] [CrossRef]
  53. Zhang, S.; Hu, Z.; Wang, H. Metagenomic analysis exhibited the co-metabolism of polycyclic aromatic hydrocarbons by bacterial community from estuarine sediment. Environ. Int. 2019, 129, 308–319. [Google Scholar] [CrossRef] [PubMed]
Figure 1. Biodegradation kinetics of selected hydrocarbon fractions: TPH (A), alkanes (B), aromatic compounds (C), and PAH (D) in the experimental variants.
Applsci 12 06012 g001
Figure 2. Cytometric analysis of microbial metabolic activity in experimental variants after 24 h of biodegradation. The metabolically active population (Q2) is marked in green, the metabolically inactive population (Q1) is marked in purple.
Applsci 12 06012 g002
Figure 3. Cytometric analysis of microbial metabolic activity in experimental variants after 168 h of biodegradation. The metabolically active population (Q2) is marked in green, the metabolically inactive population (Q1) is marked in purple.
Applsci 12 06012 g003
Figure 4. The relative abundance of the bacterial orders in the experimental variants after 168 h of the biodegradation process. Taxa with relative abundance below 1% are excluded from the analysis.
Applsci 12 06012 g004
Figure 5. The linear discriminant analysis effect size (LEfSe) analysis of predicted microbial taxa in deficient-nitrogen-level (red) and sufficient-nitrogen-level (green) samples.
Applsci 12 06012 g005
Figure 6. The relative predicted abundance of genes participating in PAH degradation in microbial orders in analyzed experimental variants.
Applsci 12 06012 g006
Table 1. Characteristics of the experimental variants.
DesignationEstimated C:N RatioExperimental Variant Description
NP0No nitrogen supplementation (control sample)
NP11:1Low nitrogen supplementation
NP210:1Moderate nitrogen supplementation
NP330:1Excessive nitrogen supplementation
Table 2. Microbial biodiversity coefficients in the analyzed variants after 168 h of the biodegradation process.
Diversity IndexNP0NP1NP2NP3
OTU number96 ± 4101 ± 5100 ± 285 ± 4
Simpson’s index0.85 ± 0.020.84 ± 0.020.84 ± 0.010.79 ± 0.02
Phylogenetic diversity4.41 ± 0.074.57 ± 0.114.43 ± 0.084.26 ± 0.07
Publisher’s Note: MDPI stays neutral with regard to jurisdictional claims in published maps and institutional affiliations.

