
Residual Strength Analysis of C/SiC Ceramic Matrix Composite Panels Subjected to Combined Thermal-Acoustic Loadings


Department of Astronautic Science and Mechanics, Harbin Institute of Technology, Harbin 150001, China
*
Author to whom correspondence should be addressed.
Appl. Sci. 2022, 12(12), 5996; https://doi.org/10.3390/app12125996
Submission received: 3 May 2022
/
Revised: 10 June 2022
/
Accepted: 11 June 2022
/
Published: 13 June 2022
(This article belongs to the Topic Composites in Aerospace and Mechanical Engineering)
Abstract
:A study was undertaken to develop a methodology for assessing the residual strength of C/SiC ceramic matrix composite panels subjected to combined thermal-acoustic loadings. A 2D plain-woven C/SiC ceramic matrix composite panel subjected to spatially uniform thermal loading and band-limited Gaussian white noise is chosen as the computational test article, with its geometric nonlinear response determined via numerical simulation. As the input, the material properties (static strength, residual strength, and fatigue life) of this material are fully characterized under tensile and compression loads, for fiber direction at elevated temperature in static and fatigue loading conditions. Based on the methodology, a computer code is developed that simulates the cycle-by-cycle behavior of composite panels under fatigue loadings. The methodology is validated with the residual strength test of 2D plain-woven C/SiC composite panel subjected to combined thermal-acoustic loadings. It has been shown that the results of residual strength predicted by the methodology are well correlated with the experimental results.
1. Introduction
Hypersonic vehicles suffer increasingly severe operating environments of a combination of aerodynamic, mechanical, acoustic, and thermal loads during cruise and re-entry flights, which present a significant challenge for the structural integrity and durability. Several experimental studies have shown that thermal-acoustic loading conditions could cause thermal protection systems (TPS) to exhibit snap-through response, which can significantly reduce the mechanical properties and bearing capacity of the structure. The random motion of plates under acoustic loadings at elevated temperatures were investigated on metallic structures [1,2] and on composite structures [3]; acoustic fatigue tests were performed to demonstrate the bearing capability of structures at elevated temperatures [4,5]. Acoustic or sonic fatigue and the deterioration of material and structural strength from combined thermal-acoustic loadings have been of significant concern in the structural design and safety of TPS of hypersonic vehicles. Continuous-fiber reinforced ceramic matrix composites such as C/C and C/SiC composites have shown themselves to be promising as potential high temperature materials because of their excellent strength-to-weight and stiffness-to-weight ratios, and high toughness and wear resistance at both room and elevated temperatures [4]. However, the limited amount of reliable experimental data related to their performance in the presence of severe operating environments has to date impeded the development of the evaluation of mechanical properties technology. Thus, analytical techniques for predicting the residual strength of TPS subjected to combined thermal-acoustic loadings are urgently needed.
In earlier studies of thin-walled structures under thermal and acoustic loadings, much research was focused on developing models and methods of nonlinear dynamic response, but now more attention is paid to modeling the dynamic behaviors of the system accurately by the reduced order method. Hollkamp [6] predicted the dynamic response of plates subjected to thermal-acoustic loading by the reduced order model. The reduced order methods were investigated on metal beams [7], curved metal panels [8], and composite plates [9,10] by Przekop. The influence of boundary condition on the choice of basis for composite panels under thermal-acoustic loadings was studied by Liu [11,12]. The non-white Gaussian random excitations were studied by Dhainaut [13].
The prediction of the life of composites and structures under variable amplitude fatigue loading has been recognized as an important problem for more than three decades [14,15]. A number of distinguishing characteristics of this problem make it different from the fatigue modeling and life prediction of their isotropic counterparts: their anisotropic and inhomogeneous nature leads to various damage mechanisms and models during the entire fatigue life stage. In addition to the material, the loading characteristics, such as the amplitude, the ratio of cyclic stress, and the load sequence, have an effect on damage mechanisms and models [15,16]. This complexity is the cause of no methodology being consistent in robustly and accurately predicting life of various material systems.
For methodologies based on phenomenological modeling to predict the fatigue life and the deterioration of structural strength under variable amplitude loads, the most widely used damage metric that does not always lead to accurate results is the simple empirical linear Palmgren–Miner rule, which cannot take into account the effect of load sequence [15]. Alternatively, the advantages of residual strength or static strength degradation as a damage metric make it promising in a scheme of fatigue life and deterioration of structural strength [17,18]. The reduction in static strength of the material as a parameter during cycling is used to measure the damage, which is related to cyclic stress peak, cyclic stress ratio and number of cycles. The degradation caused by each cycle of the loading spectrum is computed and accumulated one after another. The degradation takes into account the current cycle loading characteristics as well as previous loading history. Considerable efforts have been spent to develop the models to study the fatigue behavior of glass-fiber- and carbon-fiber-reinforced plastic composites under constant amplitude loads. Experts and scholars have made great efforts in the study of the fatigue behavior of glass-fiber-reinforced materials under variable amplitude fatigue loading for more than three decades now. Based on the standardized fatigue spectra such as WISPER (Wind turbIne reference SPEctRum), FALSTAFF (Fighter Aircraft Loading STAndard For Fatigue evaluation), experiments and theoretical predictions have been reported by several researchers [19].
Thermal analyses of composite structures, which have been utilized in high-temperature environments due to the high temperature resistance, are essential. In order to ensure the structural design and safety of such materials, especially during service condition, a sophisticated understanding of the heat transfer mechanisms is becoming more and more important. Much effort has been made to solve various problems of heat transfer and fluid flow using numerical methods and analytical methods [20,21]. Analytical methods have the advantages of being more accurate [22], more efficient, stable for multi-dimensional heat conduction, and providing deep insights into the fundamentals. Numerical methods have the advantage of a wider range of use. Owing to the designability of thermal conductivity of functionally graded material (FGM), FGM as an important composite material has been widely used as a high temperature material in aerospace. Studies [23,24] of the heat conduction of FGM have been performed to understand the fundamentals and select the optimum material.
This paper develops a methodology for determining the residual strength of C/SiC ceramic matrix composite panels subjected to combined thermal-acoustic loadings. The influence of the thermal-acoustic loadings on the evolution of the residual strength of the thin-walled structures is divided into two parts in this paper. The thermal environment has an important effect on the dynamical properties of the panel structures (elastic constant, thermal stress, thermal buckling and geometric nonlinearity) and the material mechanical properties (static strength, fatigue life and residual strength). Large mean stresses caused by thermal stresses and high alternating stresses make it different from the fatigue of panels subjected to acoustic loading alone. the static strength, residual strength and fatigue life of the material for fiber direction, which are determined under tensile and compression at elevated temperature, are the input of the methodology. Following this, the residual strength of panels under combined thermal-acoustic loadings can be predicted. The methodology is validated with the residual strength test of 2D plain-woven C/SiC composite panel subjected to combined thermal-acoustic loadings.
2. Random Fatigue Analysis
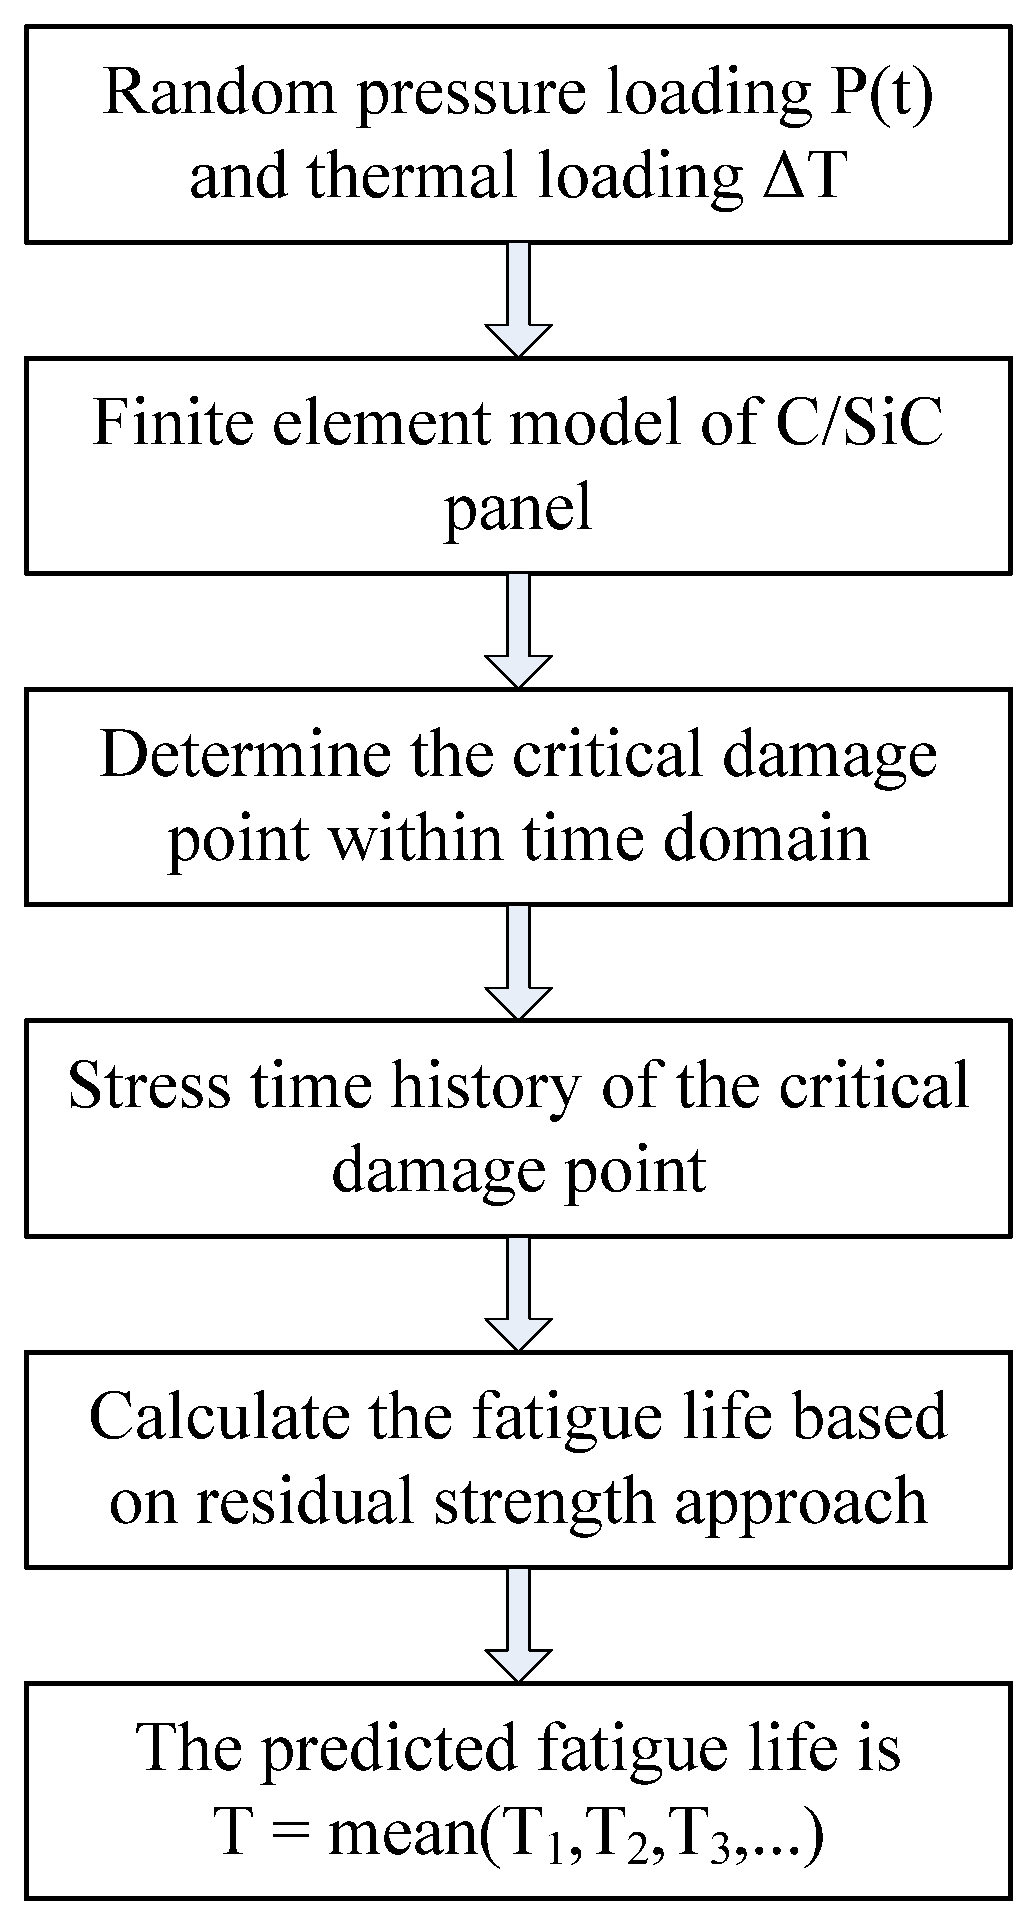
Figure 1 illustrates the procedure of the algorithm, which accounts for the fatigue damage induced by the complex stresses under variable amplitude fatigue loading in a simple but efficient way. The algorithm consists of five main modules: (1) stress analysis, (2) cycle counting of the spectrum, (3) calculation of the fatigue life of each cyclic, (4) residual strength degradation rules, and (5) failure criterion.
2.1. Stress Analysis
The assumption of linear elasticity is quite accurate for the stress–strain constitutive equations of the fiber direction. For an engineering-oriented application, this assumption of the in-plane shear of 2D plain-woven C/SiC gives a reasonable and satisfactory result. At the same time, the stresses through the thickness and out of the plane are not considered.
2.2. Cycle Counting Methods
Different cycle counting methods have been established for random fatigue analysis. The simple counting methods mainly include the peak, level crossing, and simple range-mean counting algorithms, while the sophisticated methods comprise Rainflow counting algorithms. The rainflow counting method rearranges the spectrum by taking into account stress–strain events to generate cycles; full cycles are made up of peaks and troughs, which may be far apart. This fact neglects the significant sequence effect of the loading spectrum on the deterioration of composites’ structural strength. In this paper the simple range-mean counting method is implemented to take into consideration the sequence effect on fatigue life prediction of 2D plain-woven C/SiC.
2.3. Constant Life Diagrams
Constant life diagrams take into account the effect of mean stress as well as material anisotropy on the fatigue life of composites. Thus, constant life diagrams are widely used to calculate the spectrum fatigue life of the composite material. In a previous study [25], it has been demonstrated that more detailed test data about S-N curves of composite materials would probably lead to better life predictions under spectrum loadings. In this paper, linear interpolation is used to obtain the unknown S-N curves, implemented as discussed in [25].
2.4. Residual Strength Degradation
Residual strength degradation under axial loading is used to measure the damage. In comparison with the linear degradation [16] model, a nonlinear model results in better predictions for high cycle fatigue. Different nonlinear models have been established for residual strength degradation; the interaction model [17] (INT) is implemented in this work. This model can contain different shapes depending on the parameters. Thus, sudden-death and gradual wear-out types can be accommodated by this model. The study considers the residual tensile strengths and residual compressive strengths depending on the cyclic stress parameters. It is based on the following degradation equation:
where Su and Sr stand for the initial static strength and residual strength, respectively, σp is the maximum applied cyclic stress, n is the applied number of cycles, and N is the corresponding fatigue life. Adam et al. describe several curve-fitting approaches to derive the parameters of α and β [17]. After determining α and β, the residual strength can be calculated as
For the continuous function of cycles, the extension of the model to spectrum loading is obvious:
2.5. Failure Criterion
Experimental and theoretical research into composite materials under complex stress states has been developed since the 1970s. Most of the fatigue failure criteria are the extension of static failure criteria, taking into account parameters such as stress ratio and fatigue life. In order to establish the failure criteria and evaluate their accuracy, uniaxial as well as multiaxial fatigue experiments have been performed by many researchers. For a recent review [26] on such studies refer to the work of Quaresimin et al. As we all know, no one existing theory can always lead to an accurate design for different material systems under any complex cyclic stress states of constant amplitude. In the current work, a modified version of Tsai-Wu’s failure criterion is implemented because of its simplicity and wide application.
3. Thermal-Acoustic Nonlinear Response Analysis
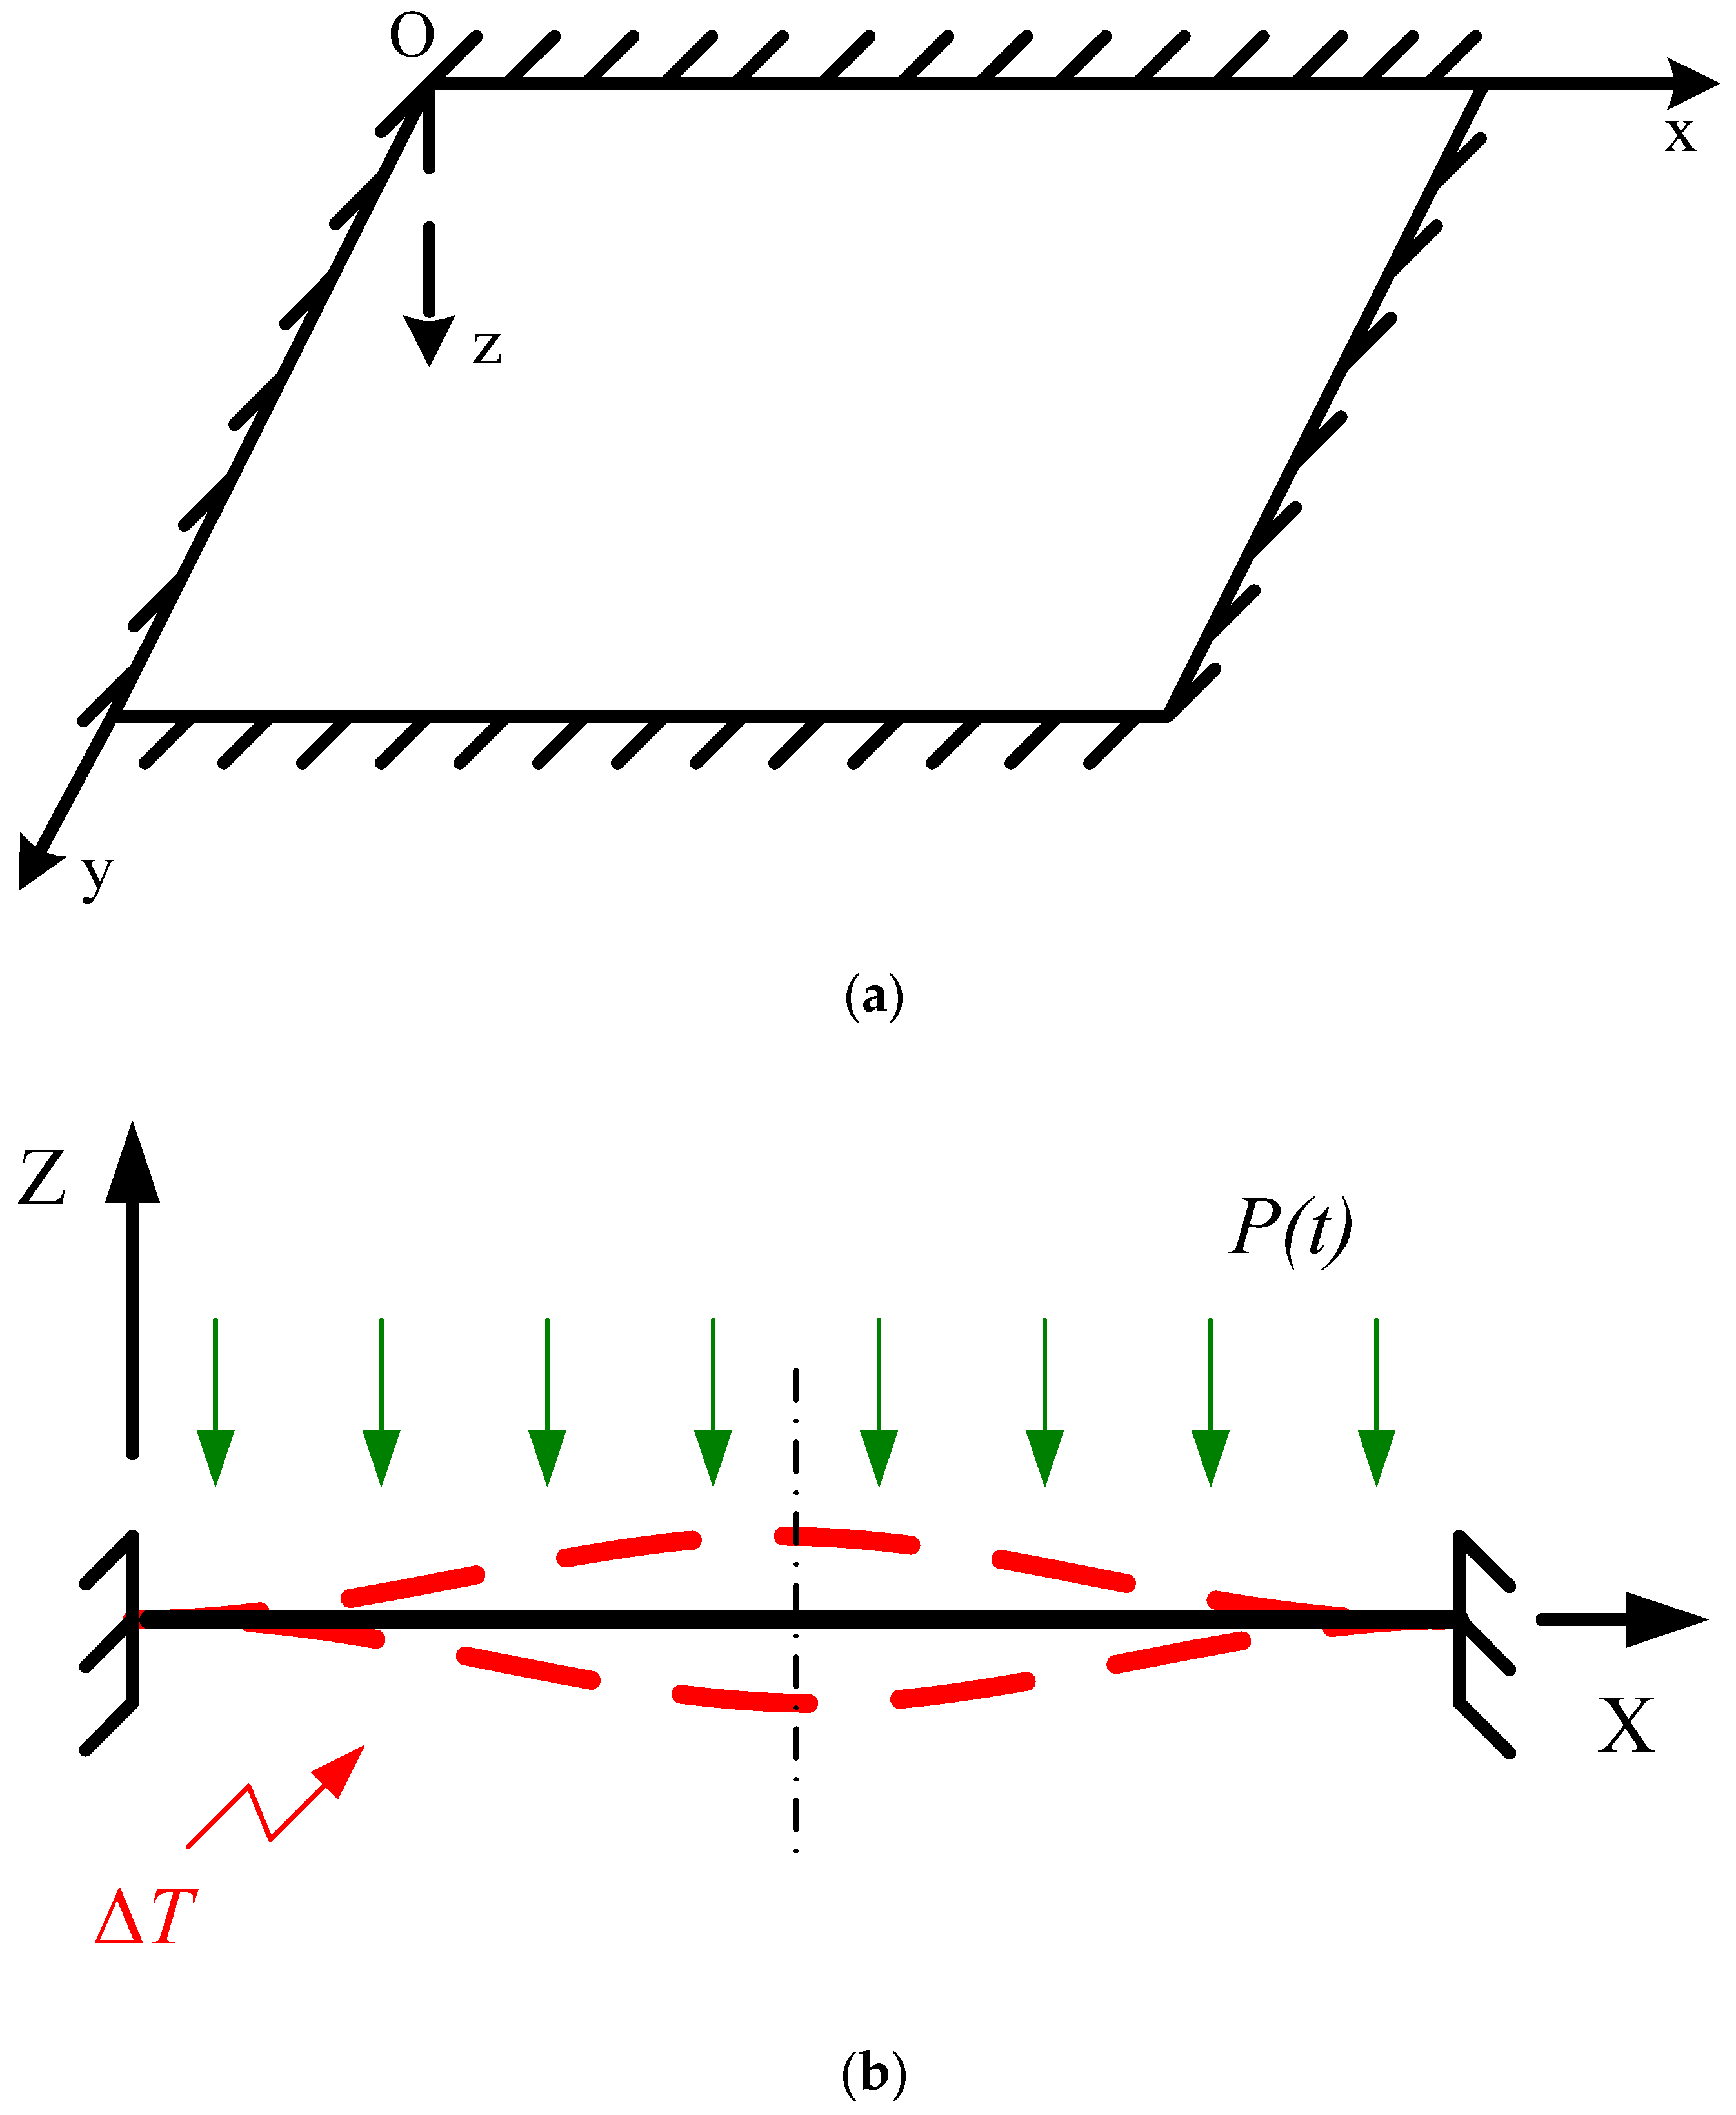
A 2D plain-woven C/SiC ceramic matrix composite panel is used in this work. The panel measures 350 mm × 230 mm × 1.5 mm with all ends clamped; see Figure 2. The material properties are shown in Table 1. Owing to the wide range of temperatures considered in this paper, the effect of temperature on the material properties is taken into account. The panel is modeled by 400 S4R shell elements. The ABAQUS/Explicit solution is used to analyze the nonlinear response to obtain the displacement and stress time histories for all loading conditions.
3.1. Loading
Sounds of 150 dB, 155 dB, and 165 dB are used to study the effect of sound pressure level on the response. The band-limited white noise is simulated by an inverse Fourier transform at a frequency resolution of 0.5 Hz in the frequency range 0–512 Hz. Studies of effects of finite element mesh sizes and the integration time steps on the accuracy and convergence of nonlinear responses are conducted. The length of the random pressure time history, which cannot be chose arbitrarily, depends on the fundamental frequency of the structure. The previous studies [12,13] have shown that the time history of a stationary response, containing more than 100 natural periods of the structure, yields reasonable statistical properties. The length of the simulated process can then be determined from
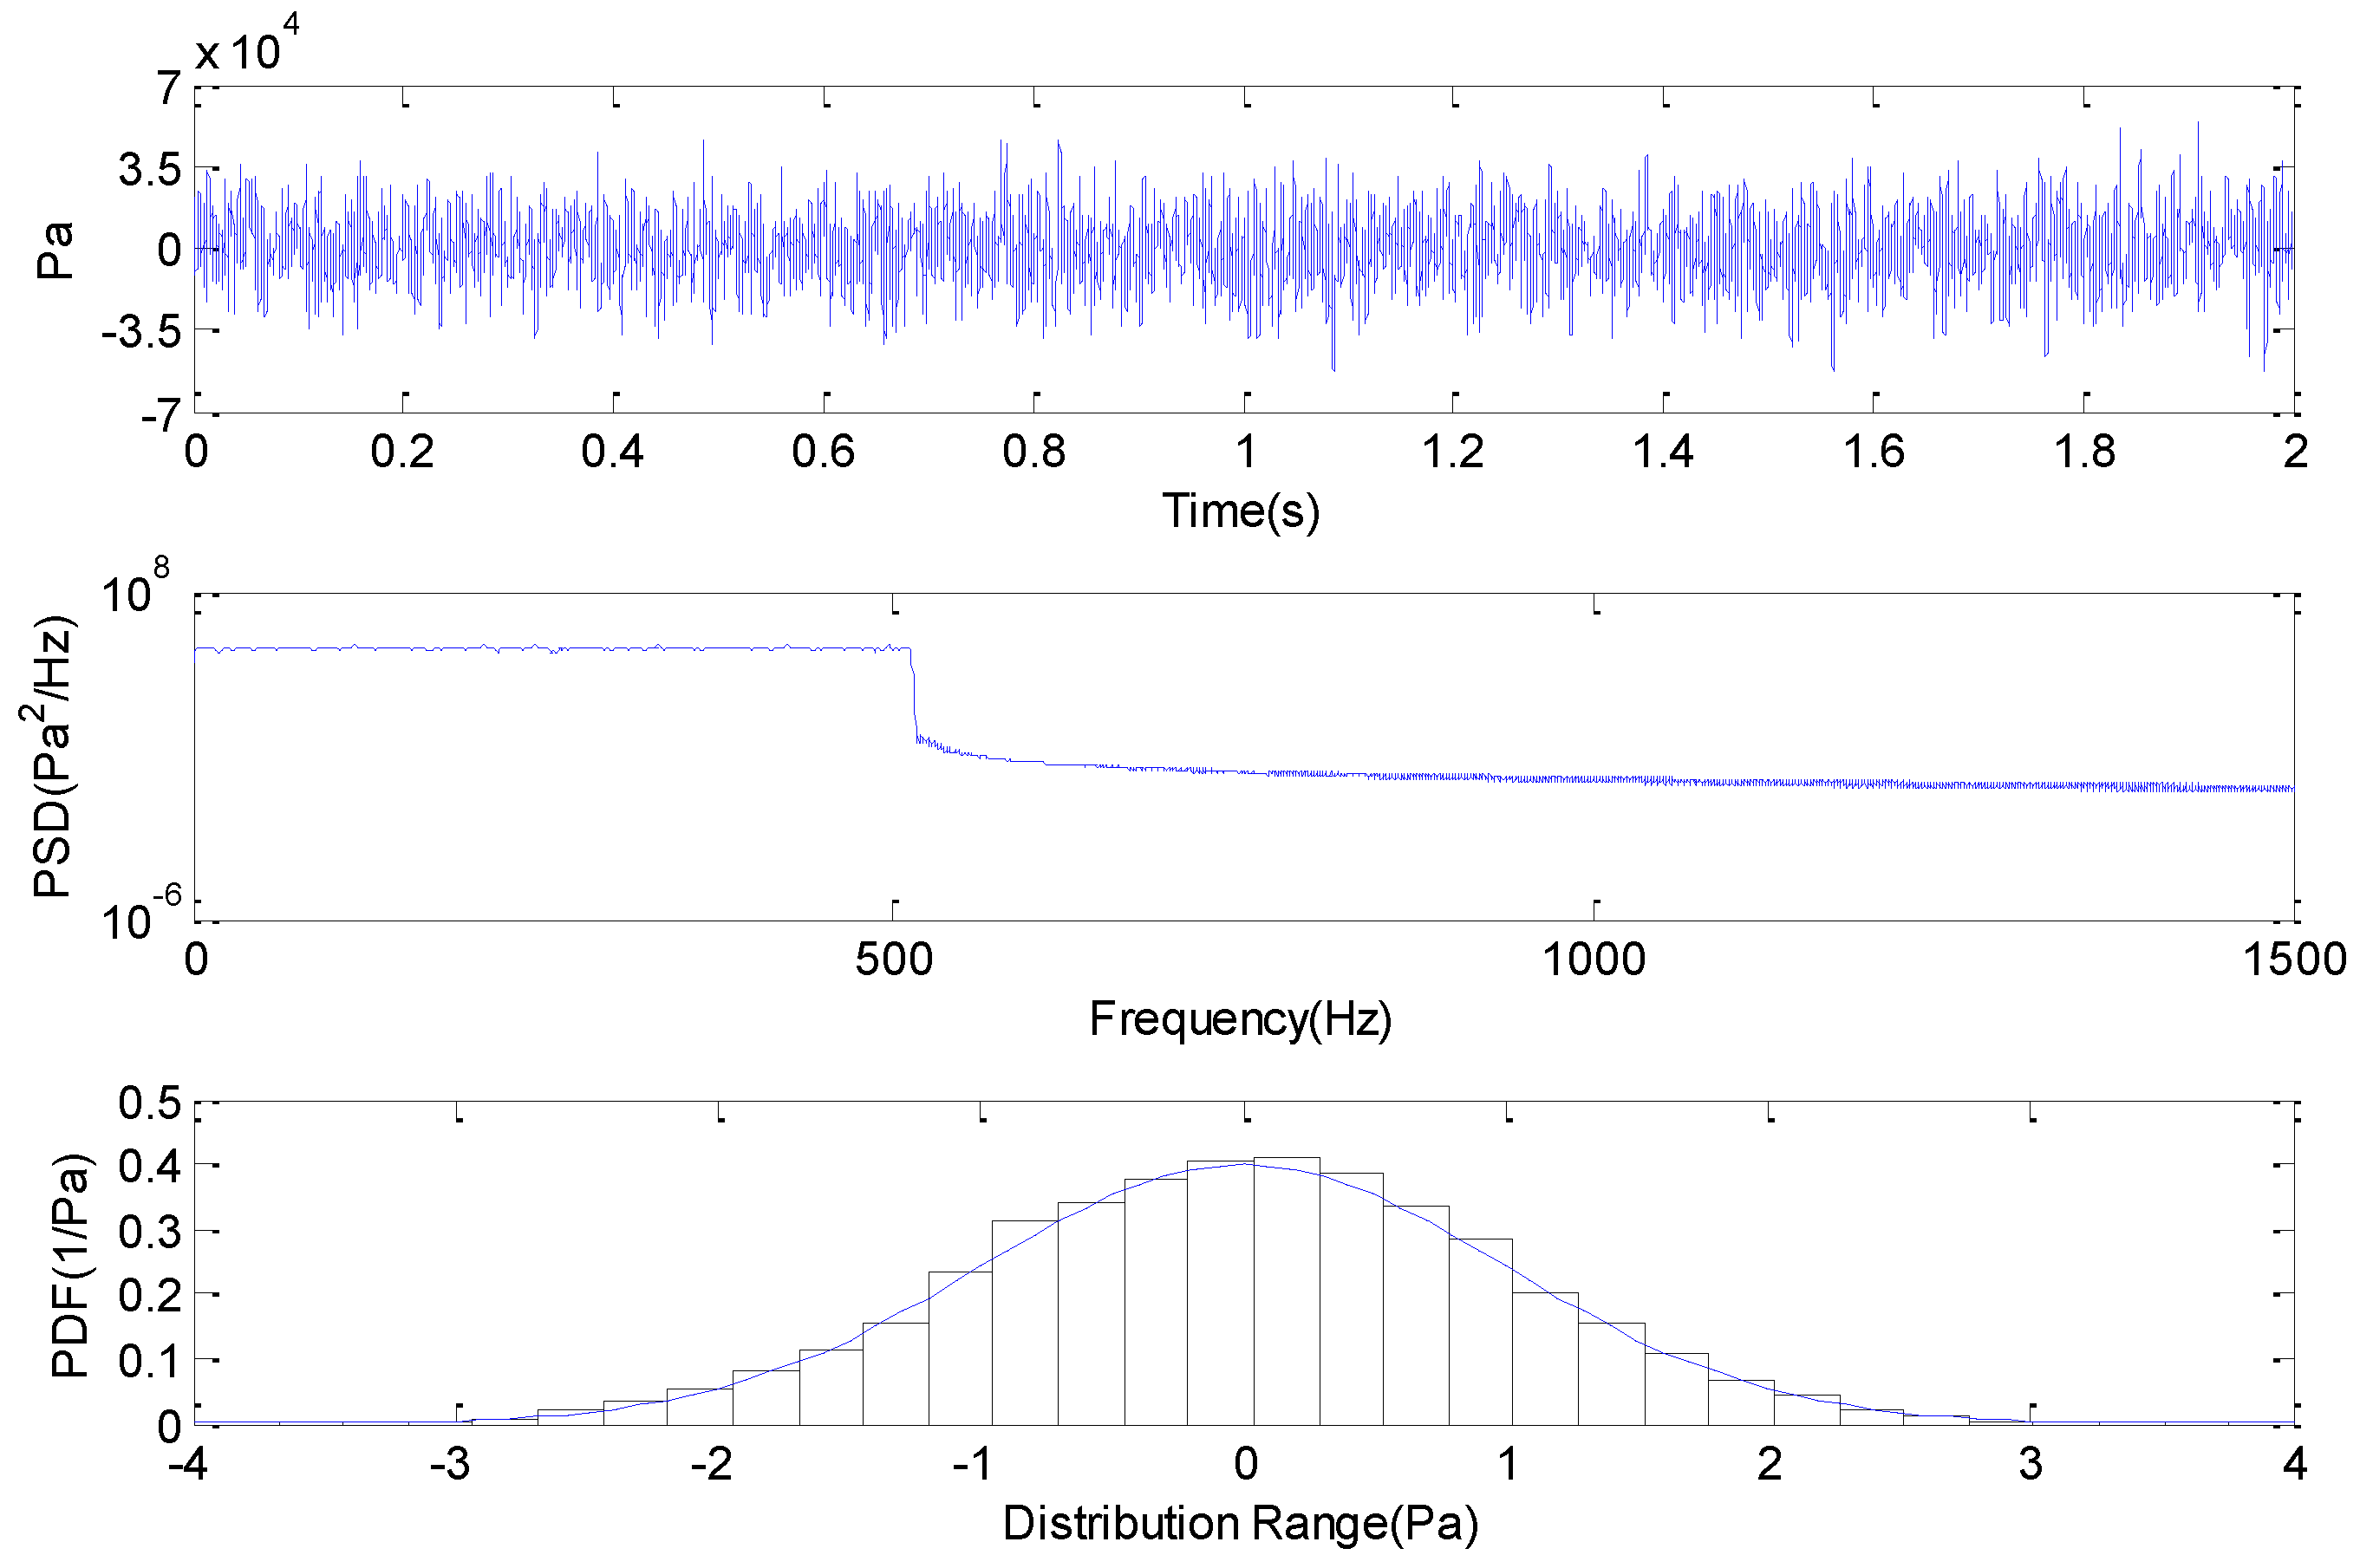
where NPT is the number of simulated points, Δt is the time step, and f1 is the fundamental frequency. The panel for different temperature conditions studied in this work is strictly fulfilled by the condition of Equation (5). A typical simulated random pressure loading is shown in Figure 3.
Three thermal loadings are considered to research the snap-through response. An ambient temperature (T = 27 °C, ΔT = 0 °C) is considered as a baseline, and the critical buckling temperature increment of the panel is ΔTC = 110 °C (T = 137 °C). Meanwhile the thermally pre-buckled response is studied under ΔT = 103 °C (T = 130 °C). For ambient temperature and thermally pre-buckled conditions, the panel is observed vibrating around the single neutral equilibrium position. A temperature increment, ΔT = 573 °C (T = 600 °C), is used to investigate the thermally post-buckled response. As the sound pressure level increases, the response varies from small deflection vibration about the thermally buckled equilibrium positions to intermittent snap-through and finally to large nonlinear random vibration between the two thermally buckled equilibrium positions. A response matrix of the panel under different thermal-acoustic loading conditions is shown in Table 2, where N designates no snap-through motions, I designates intermittent snap-through motion, and P designates persistent snap-through motion.
3.2. Thermal-Acoustic Response Results
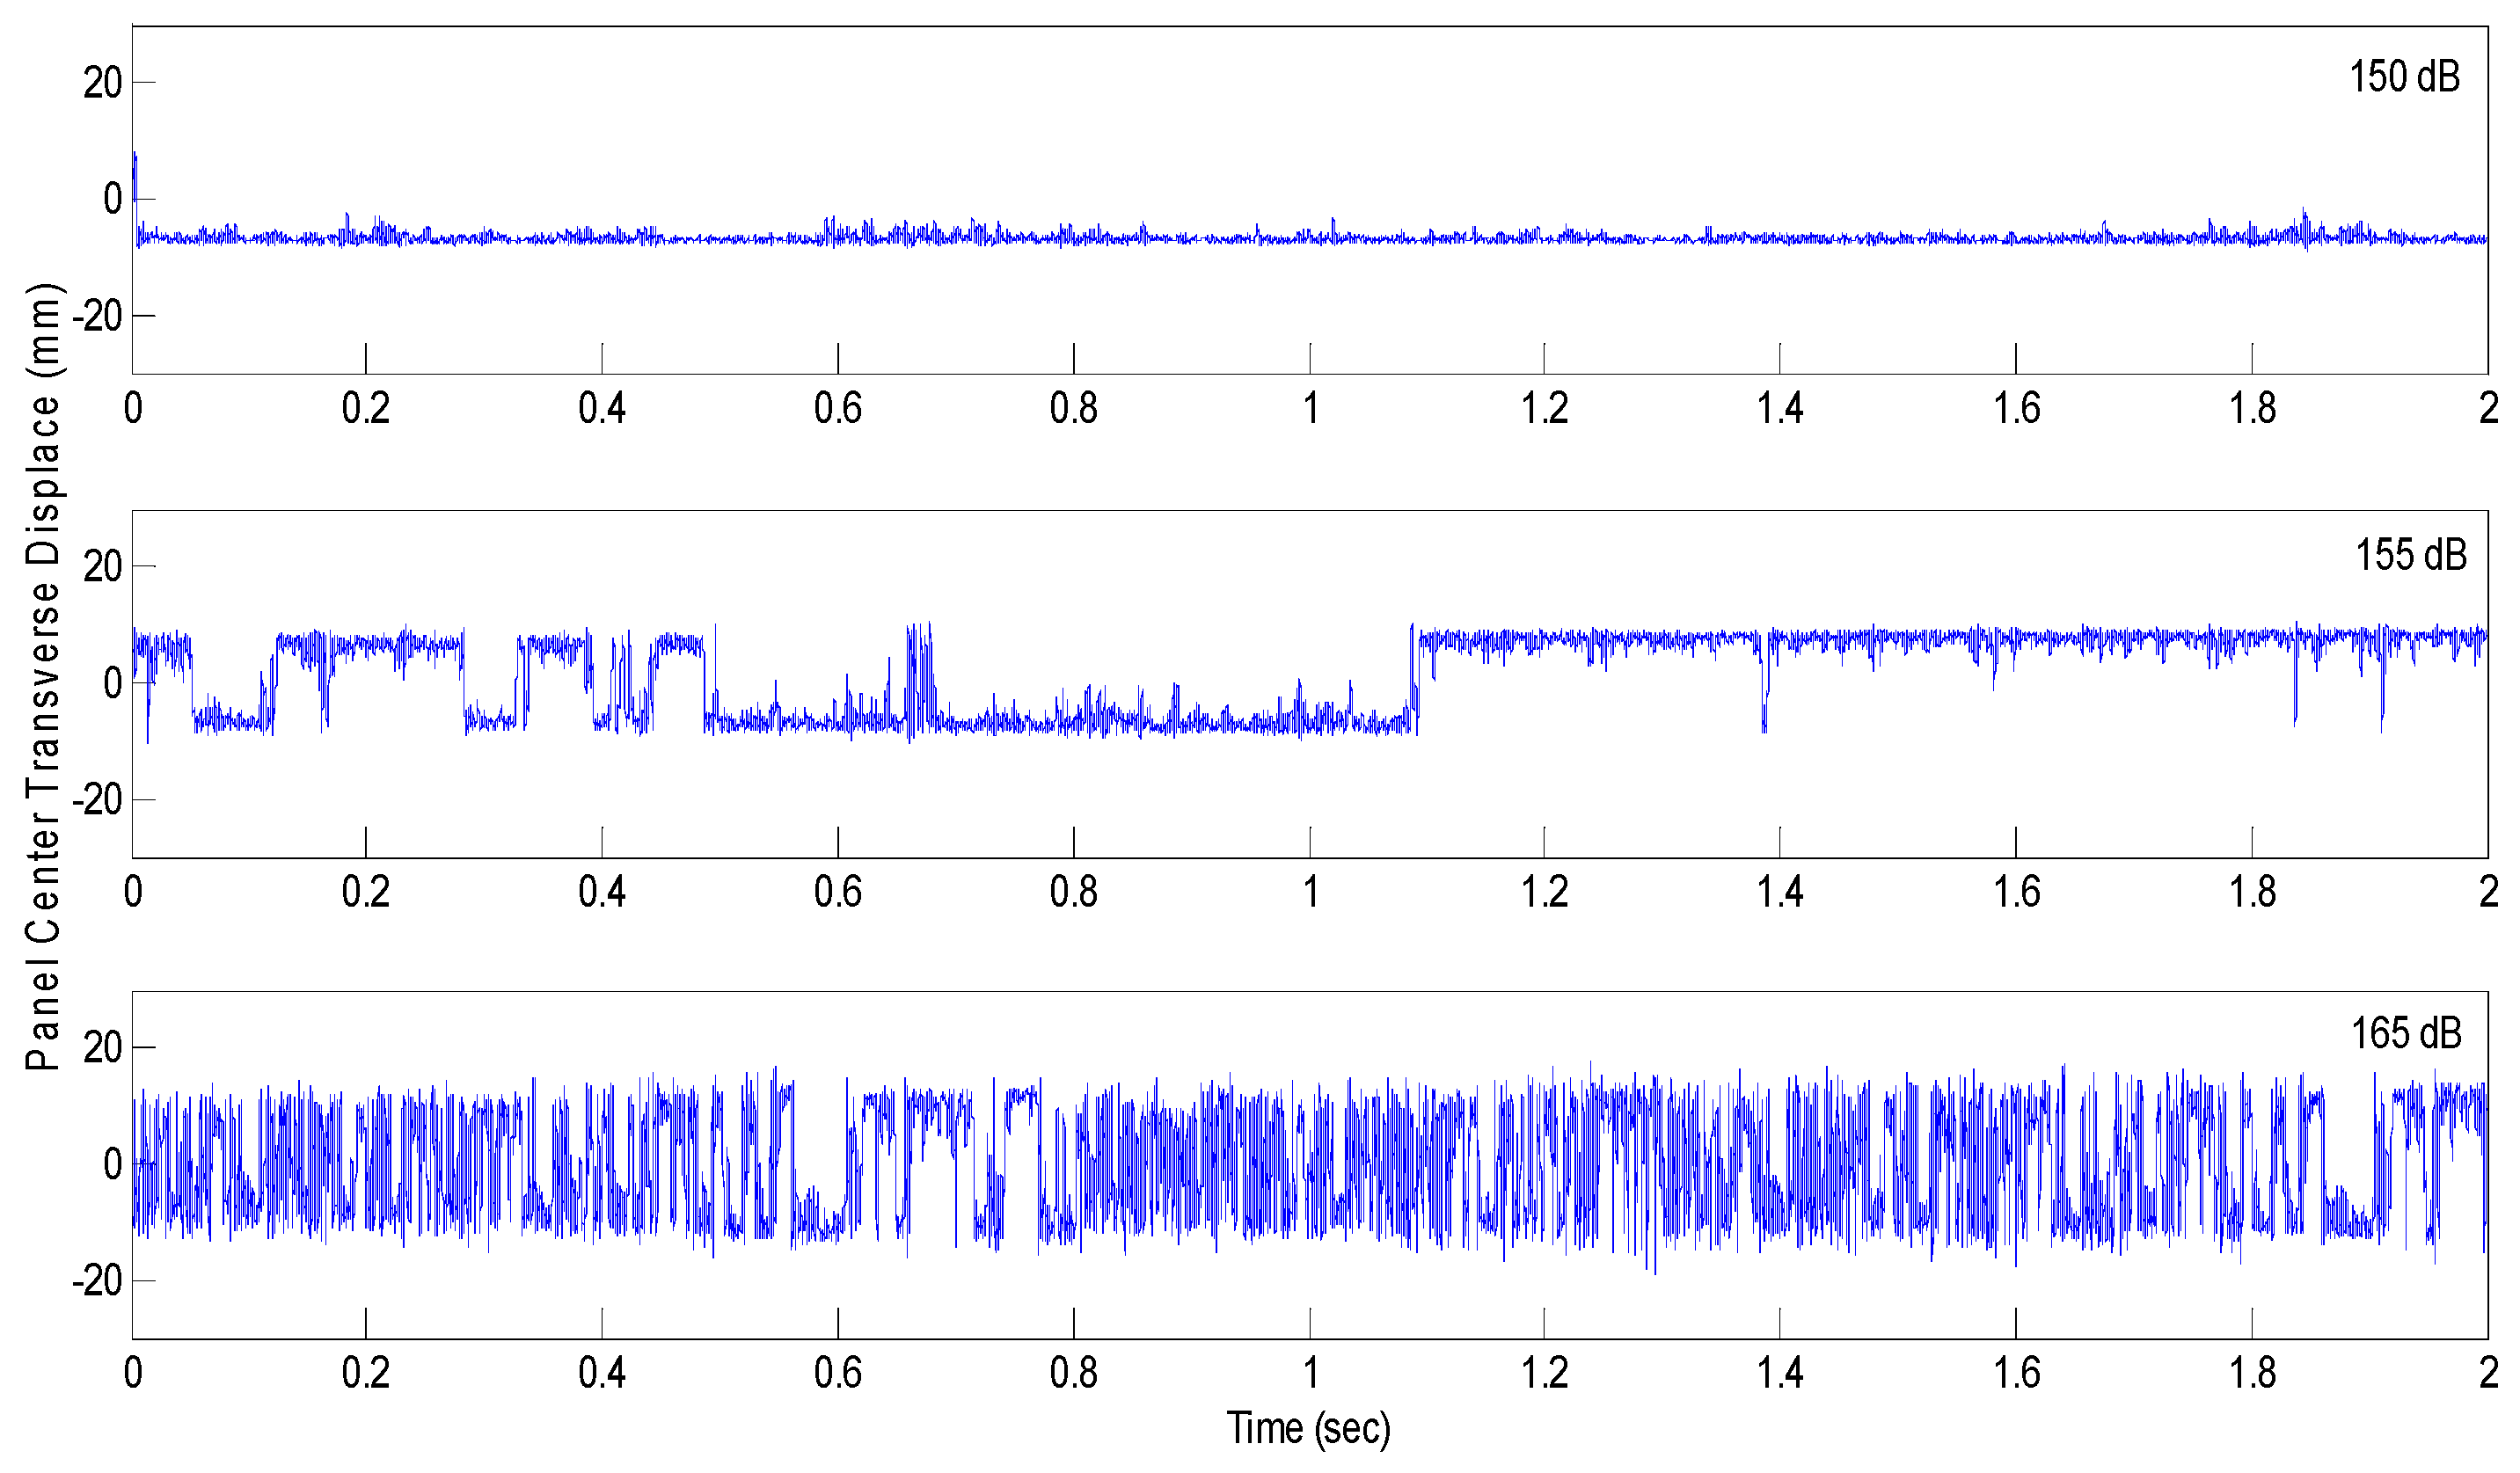
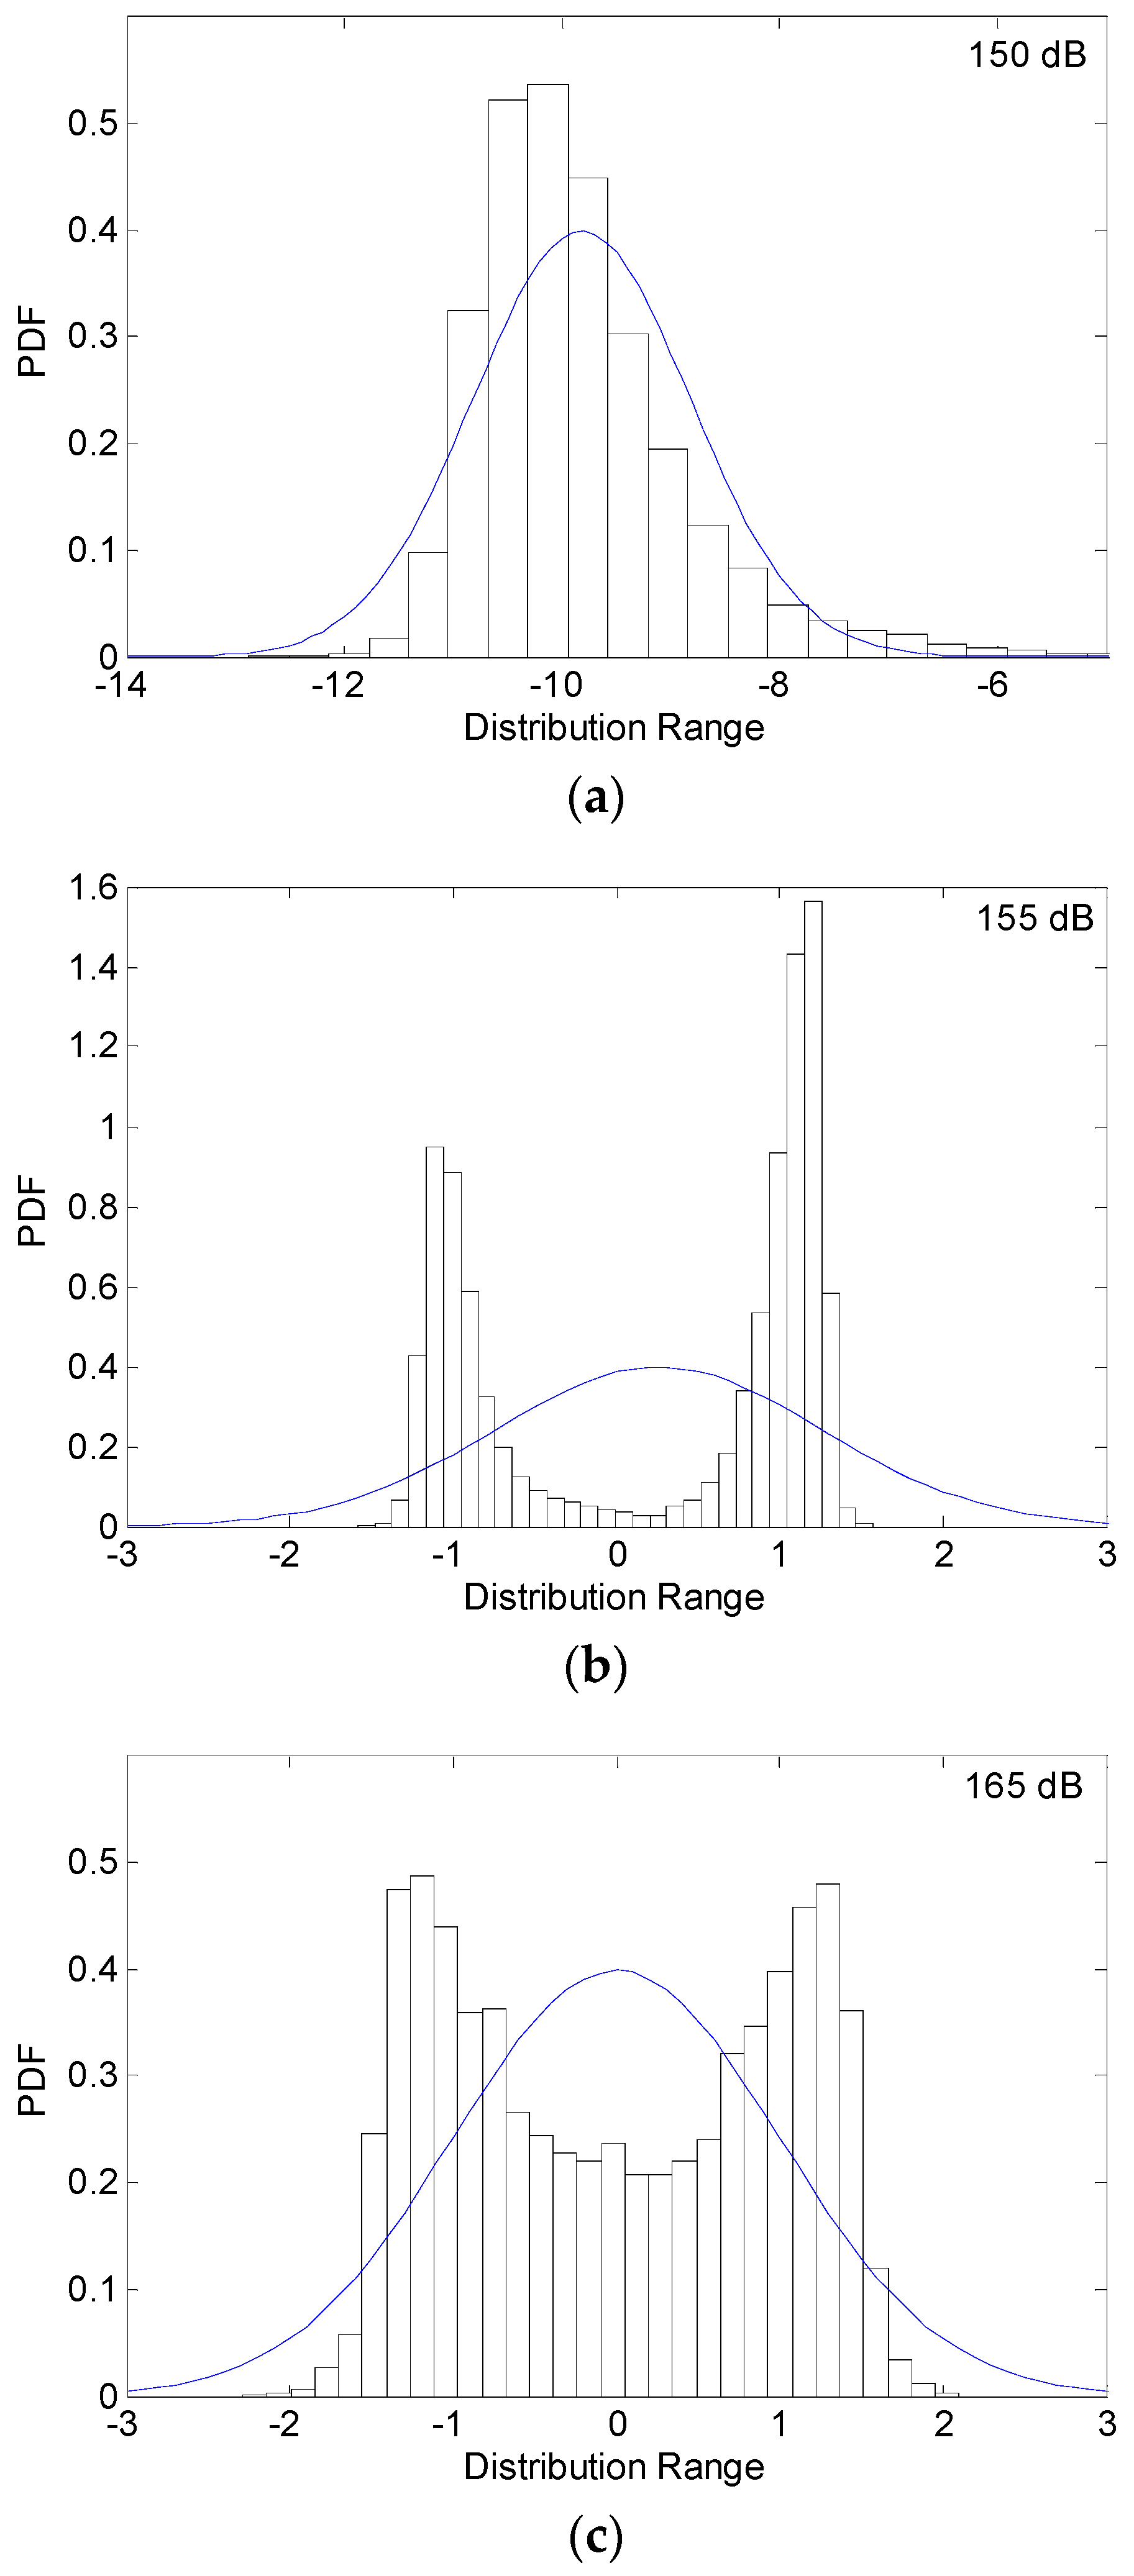
In order to show the evolution of the different states, the thermally post-buckled transverse displacement at the panel center for ΔT = 573 °C (T = 600 °C) is shown in Figure 4. The probability density function (PDF) of the response at the panel center is shown in Figure 5. As the figures show, the panel buckles under 150 dB level and vibrates randomly in a small deflection around the buckled equilibrium positions, and the probability distribution of response is close to Gaussian. At the 155 dB level, the time history clearly shows the intermittent snap-through, and the PDF plot indicates a large deviation from the Gaussian. Finally, the type of panel behavior is a persistent snap-through response as the sound press level increases to 165 dB.
4. Experimental Procedure
4.1. Material and Specimen
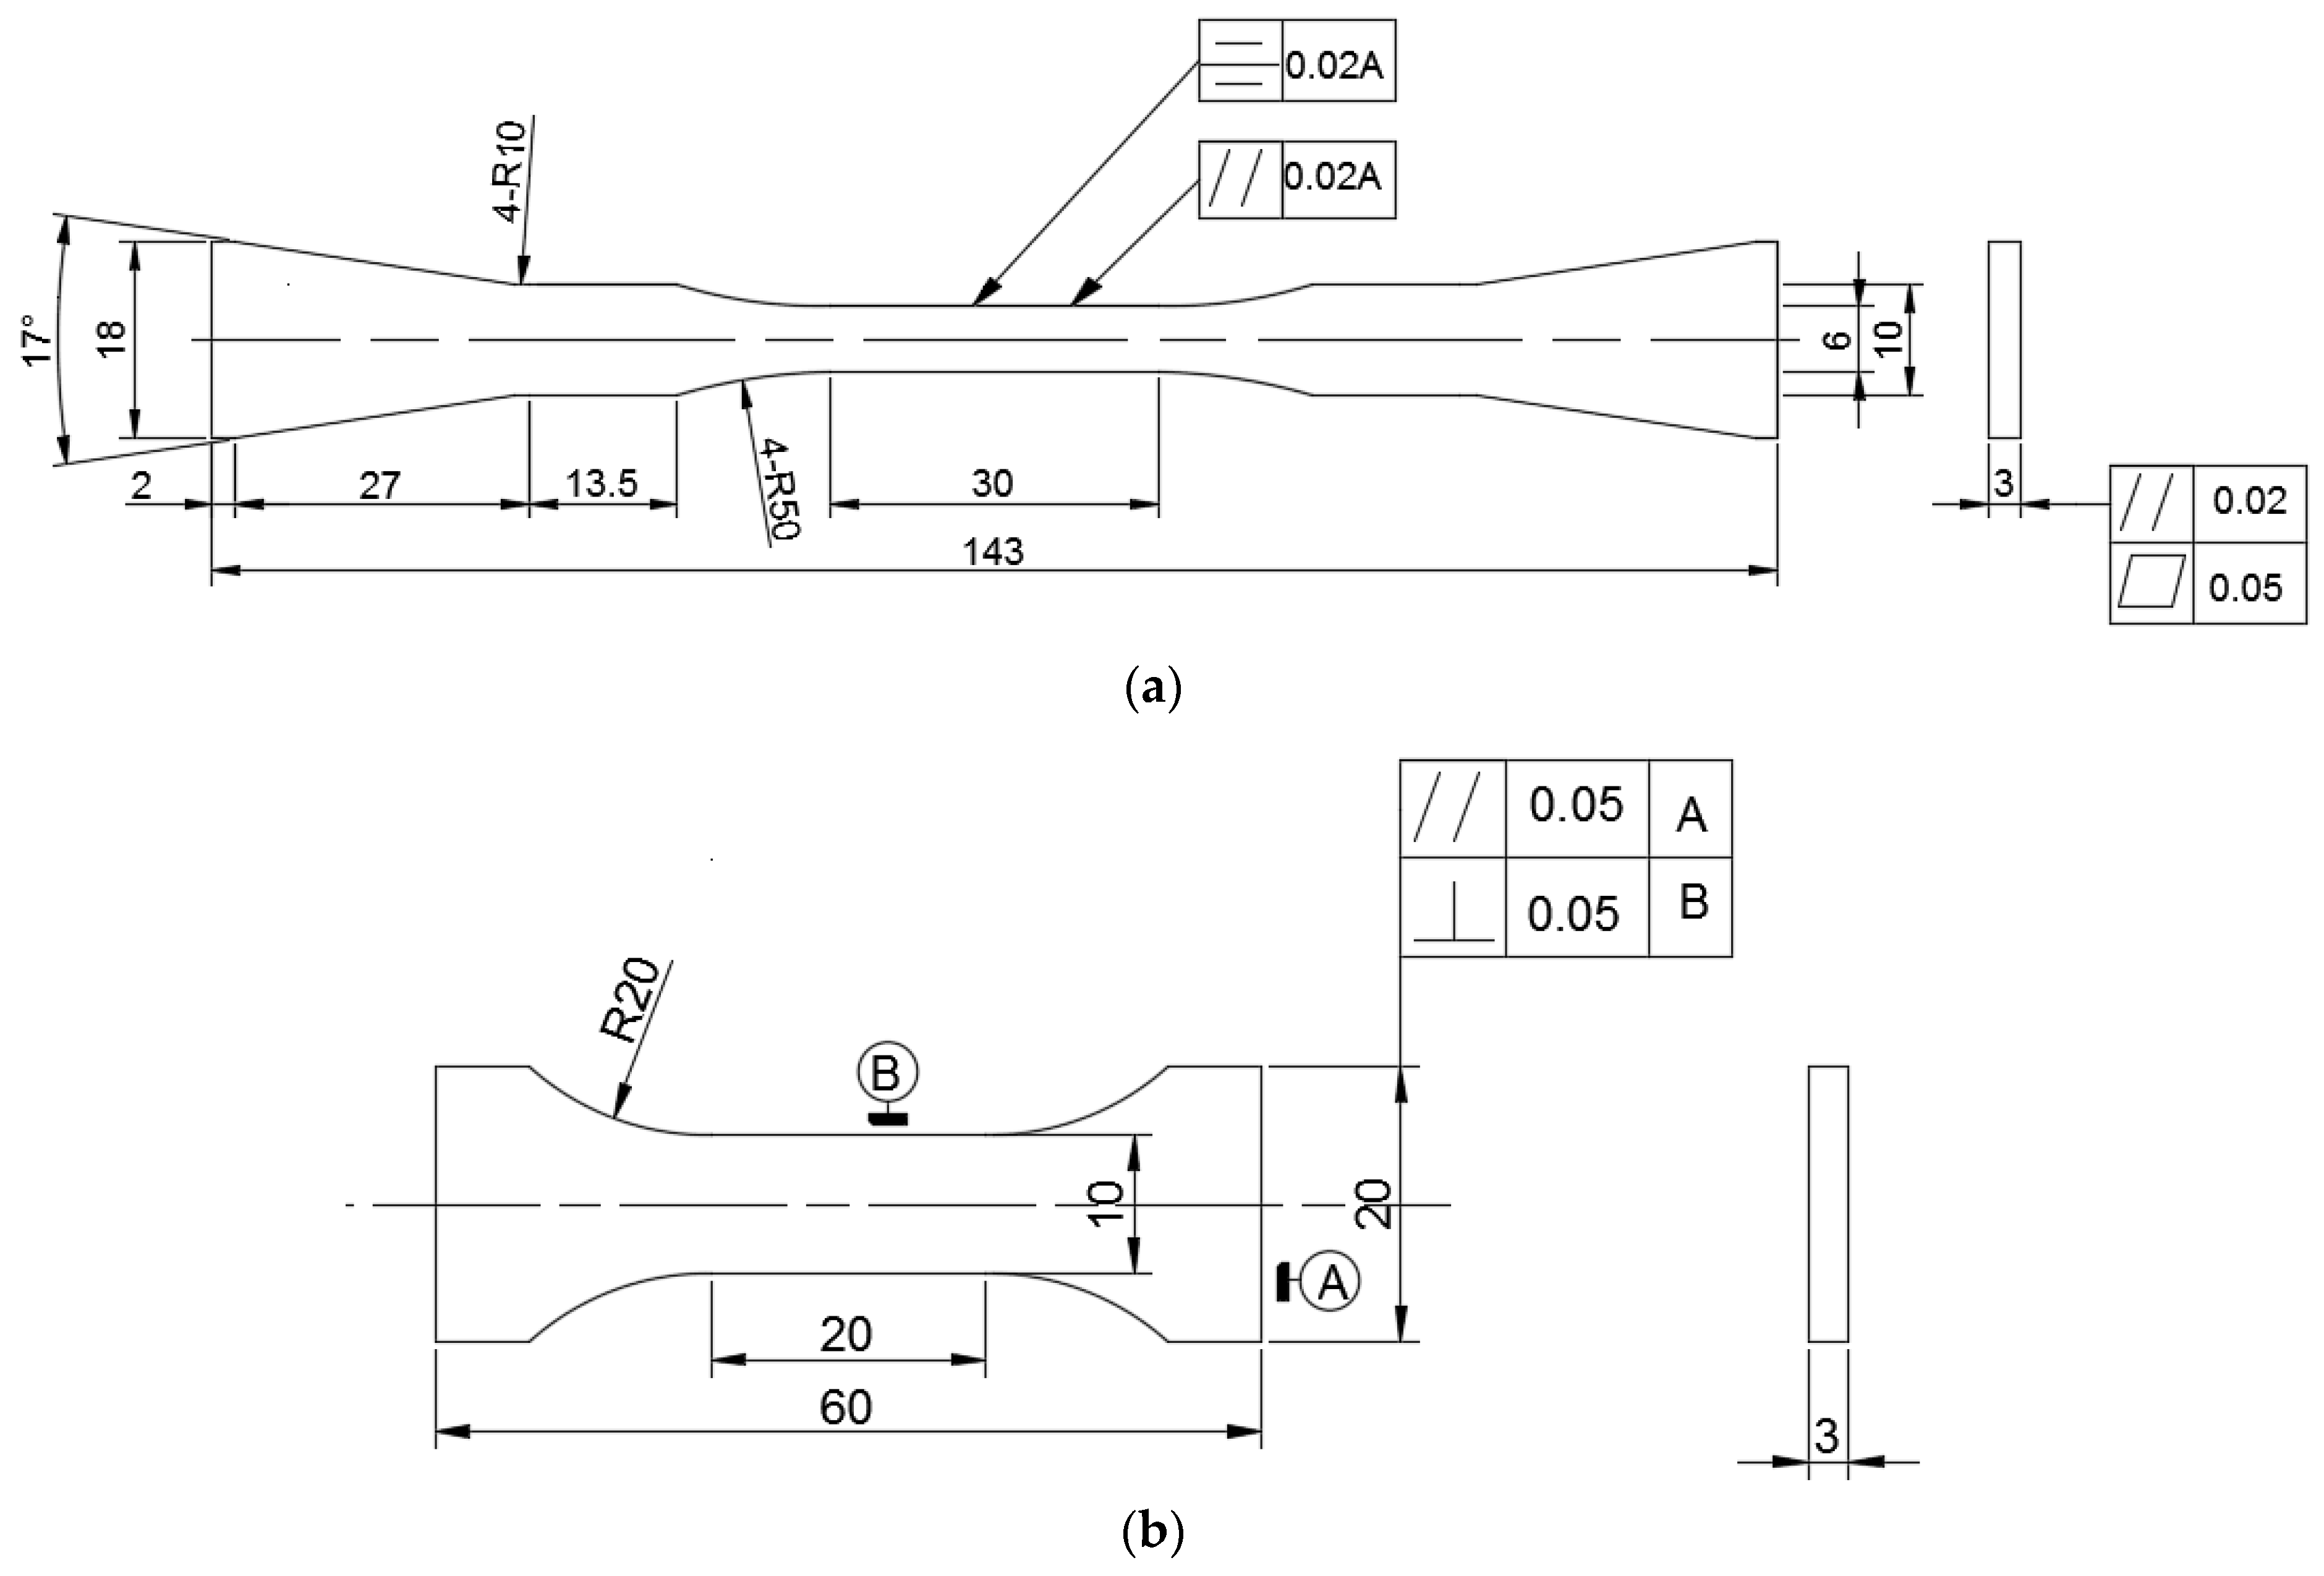
The material investigated in this paper is the two-dimensional plain-woven carbon-fiber-reinforced silicon carbide composite, which is reinforced by a stack of T300 polyacrylonitrile carbon fiber cloth, fabricated by chemical vapor infiltration technique. In each fabric ply, the fiber count ratio of the longitudinal direction to the transverse direction is 1:1. The processing procedure results in the material having a density of approximately 2.1 g/cm3, a fiber volume fraction close to 40%, and a residual porosity in the range 10–15%. The configuration and dimensions of the specimen are shown in Figure 6.
An extensive experimental effort was spent on the 2D-C/SiC in order to characterize the static strength, fatigue life, and residual strength of such material in air and at a temperature of 600 °C, performed in principal direction of the material. All experiments were carried out on a servo-hydraulic test machine MTS 809 with a compact resistance-heated oven and hydraulic water-cooled wedge grips. All tests at a temperature of 600 °C were conducted with an elevated rate of 20 °C/min, followed by a soaking time of 30 min in order to yield a uniform temperature distribution.
Tensile and compressive tests were performed in air and at a temperature of 600 °C with the constant displacement rate 0.06 mm/min, and five coupons of each kind of test were conducted. For the fatigue behavior, tensile (R = 0.1) and compressive (R = 10) fatigue tests were studied in air and at a temperature of 600 °C, with a frequency of 5 Hz of sine waveform. The range of fatigue life covers 104–106, and four coupons are performed at each stress level. Fatigue run-out is defined as 106. For residual strength tests, first fatigue loading is subjected to the coupons for a fraction of the nominal fatigue lifetimes, and then the coupons are loaded to failure. A total of 20%, 50%, and 80% of the nominal fatigue life were selected for this purpose at the stress level of 70% of the tensile strength and 90% of the compressive strength, which are the same one used for the S-N curve determination. Four coupons were performed for each specific life fraction.
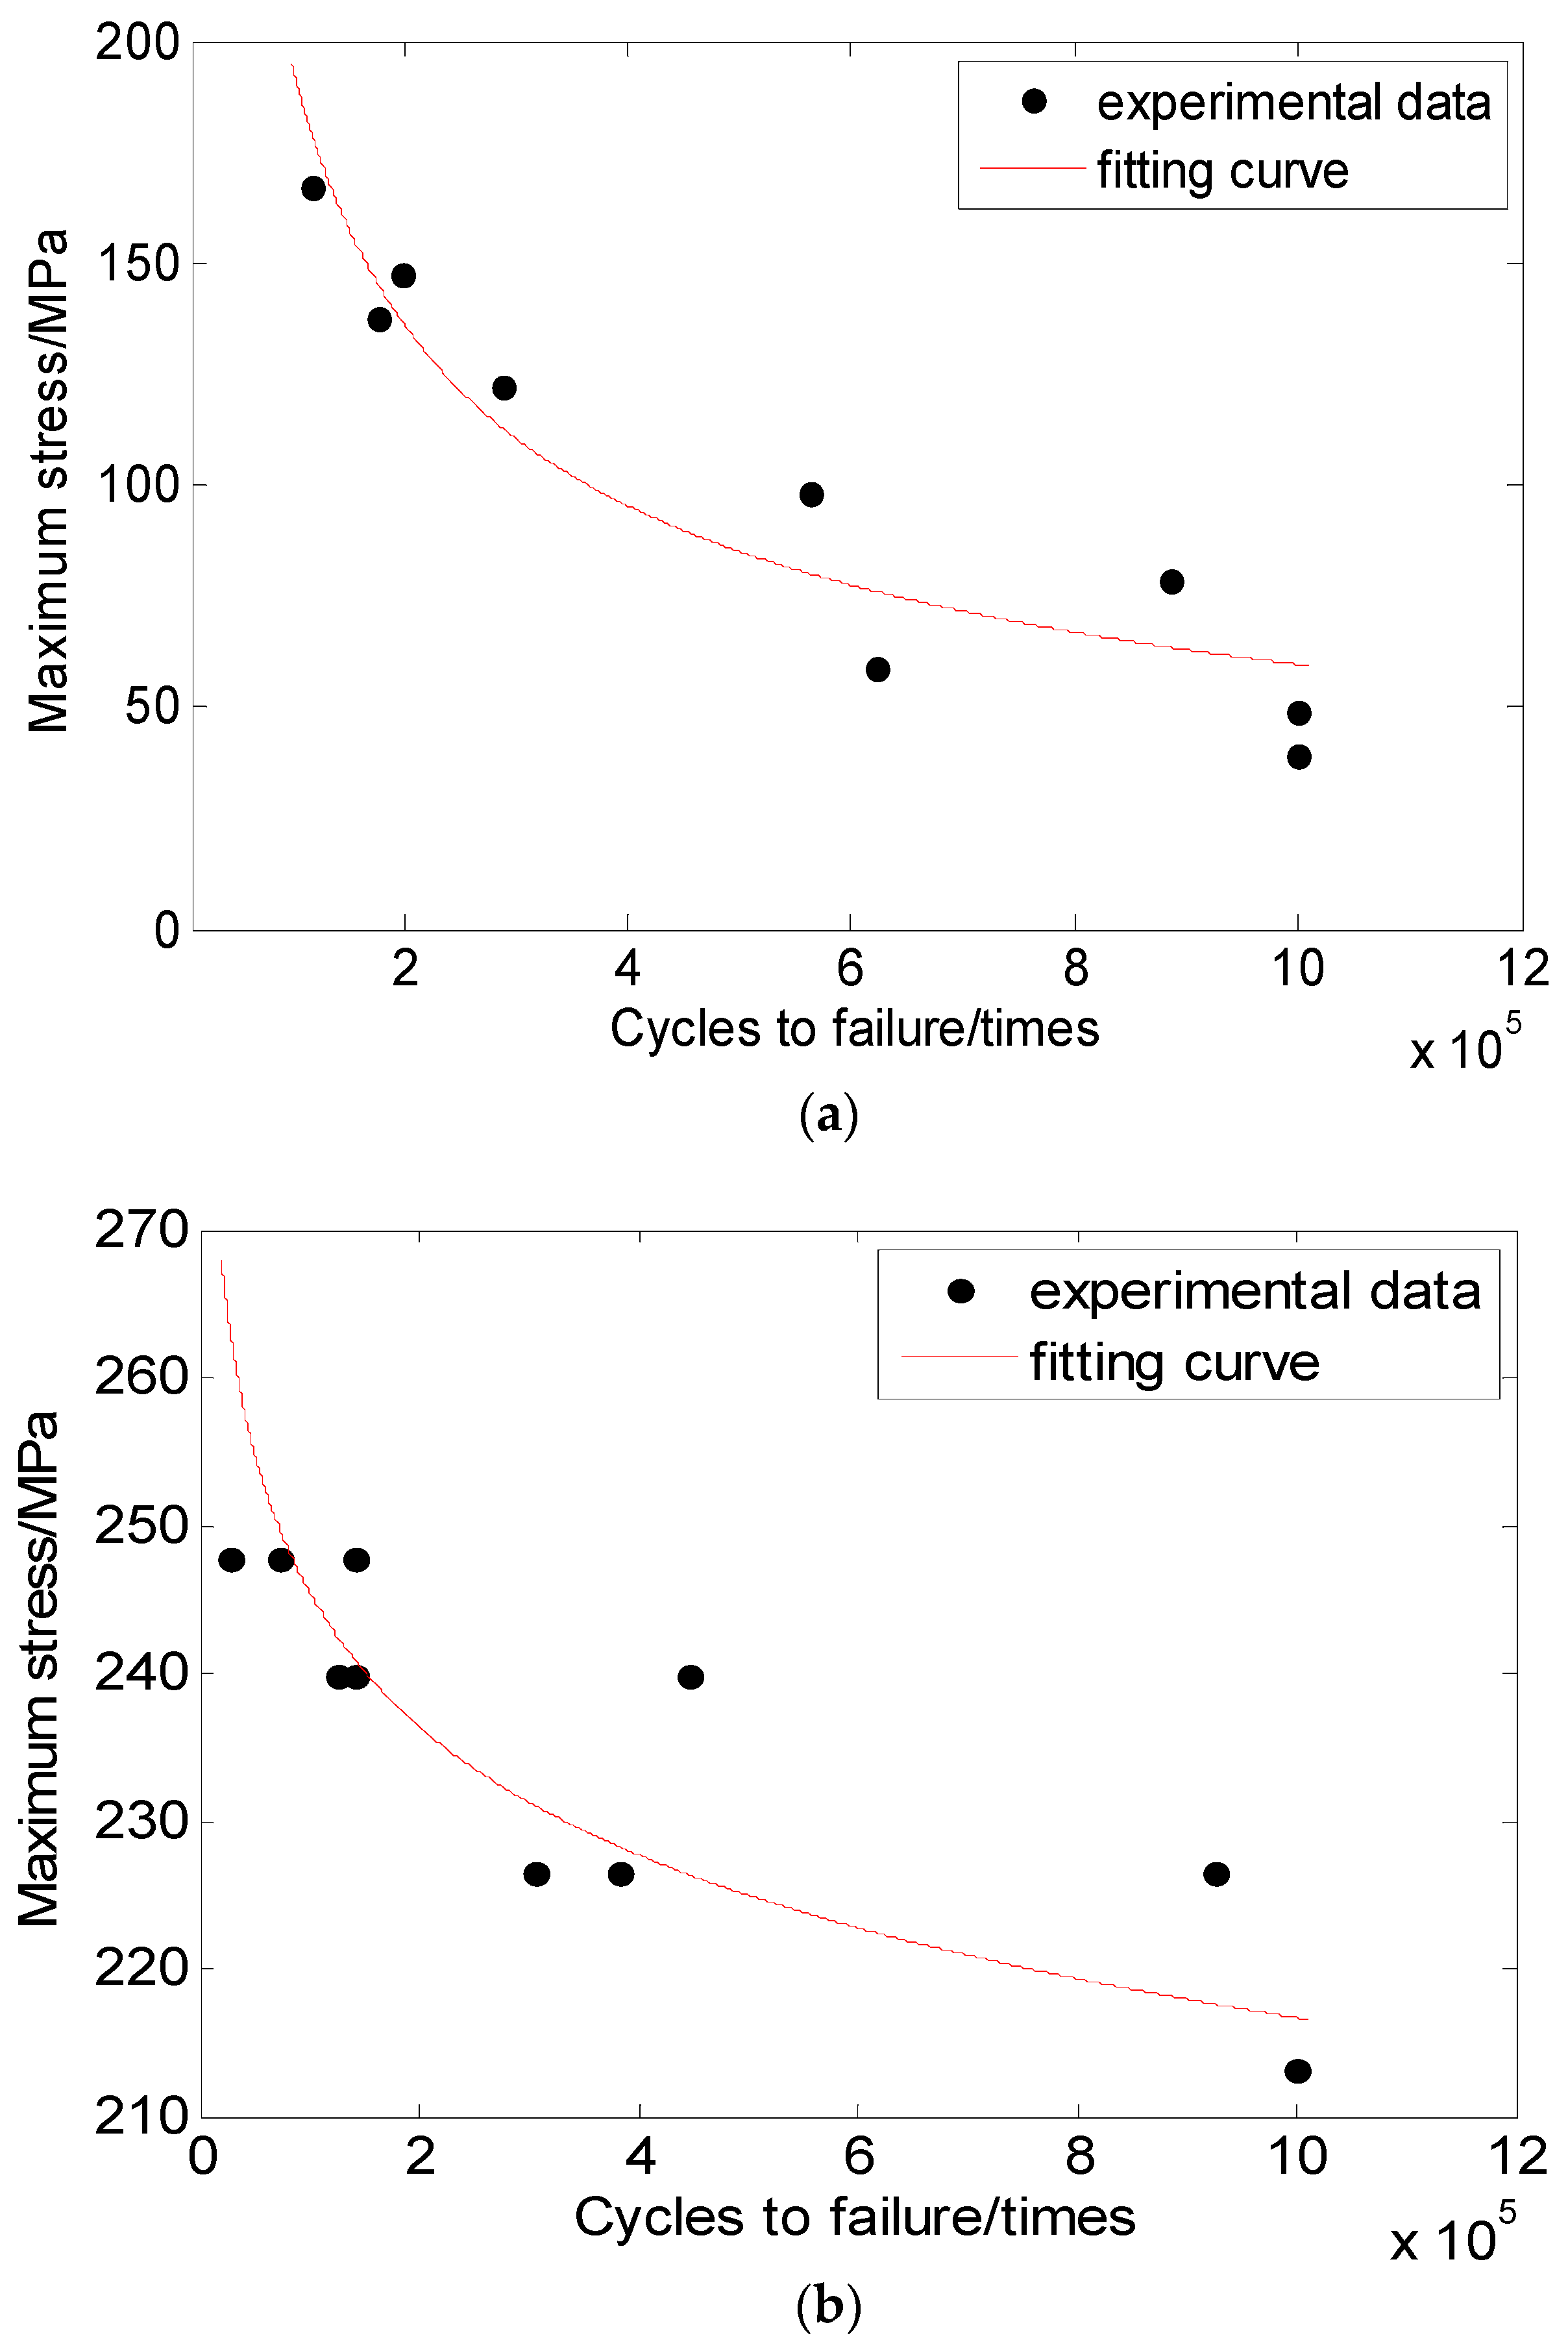
The experimental data are used to estimate the S-N curves at 50% reliability level according to the following fatigue function:
where B and a are the fitting parameters. On the log-log plot of stress vs. cycles the power law modal can been written as
where a is the slop and b = logB is the intercept. Because of experiments measuring the corresponding fatigue life in stress control, the arrangement is more reasonable. In the present work, the parameters are determined using least squares regression analysis. The fitted S-N curves and the experimental data in the principal direction are shown in Figure 7.
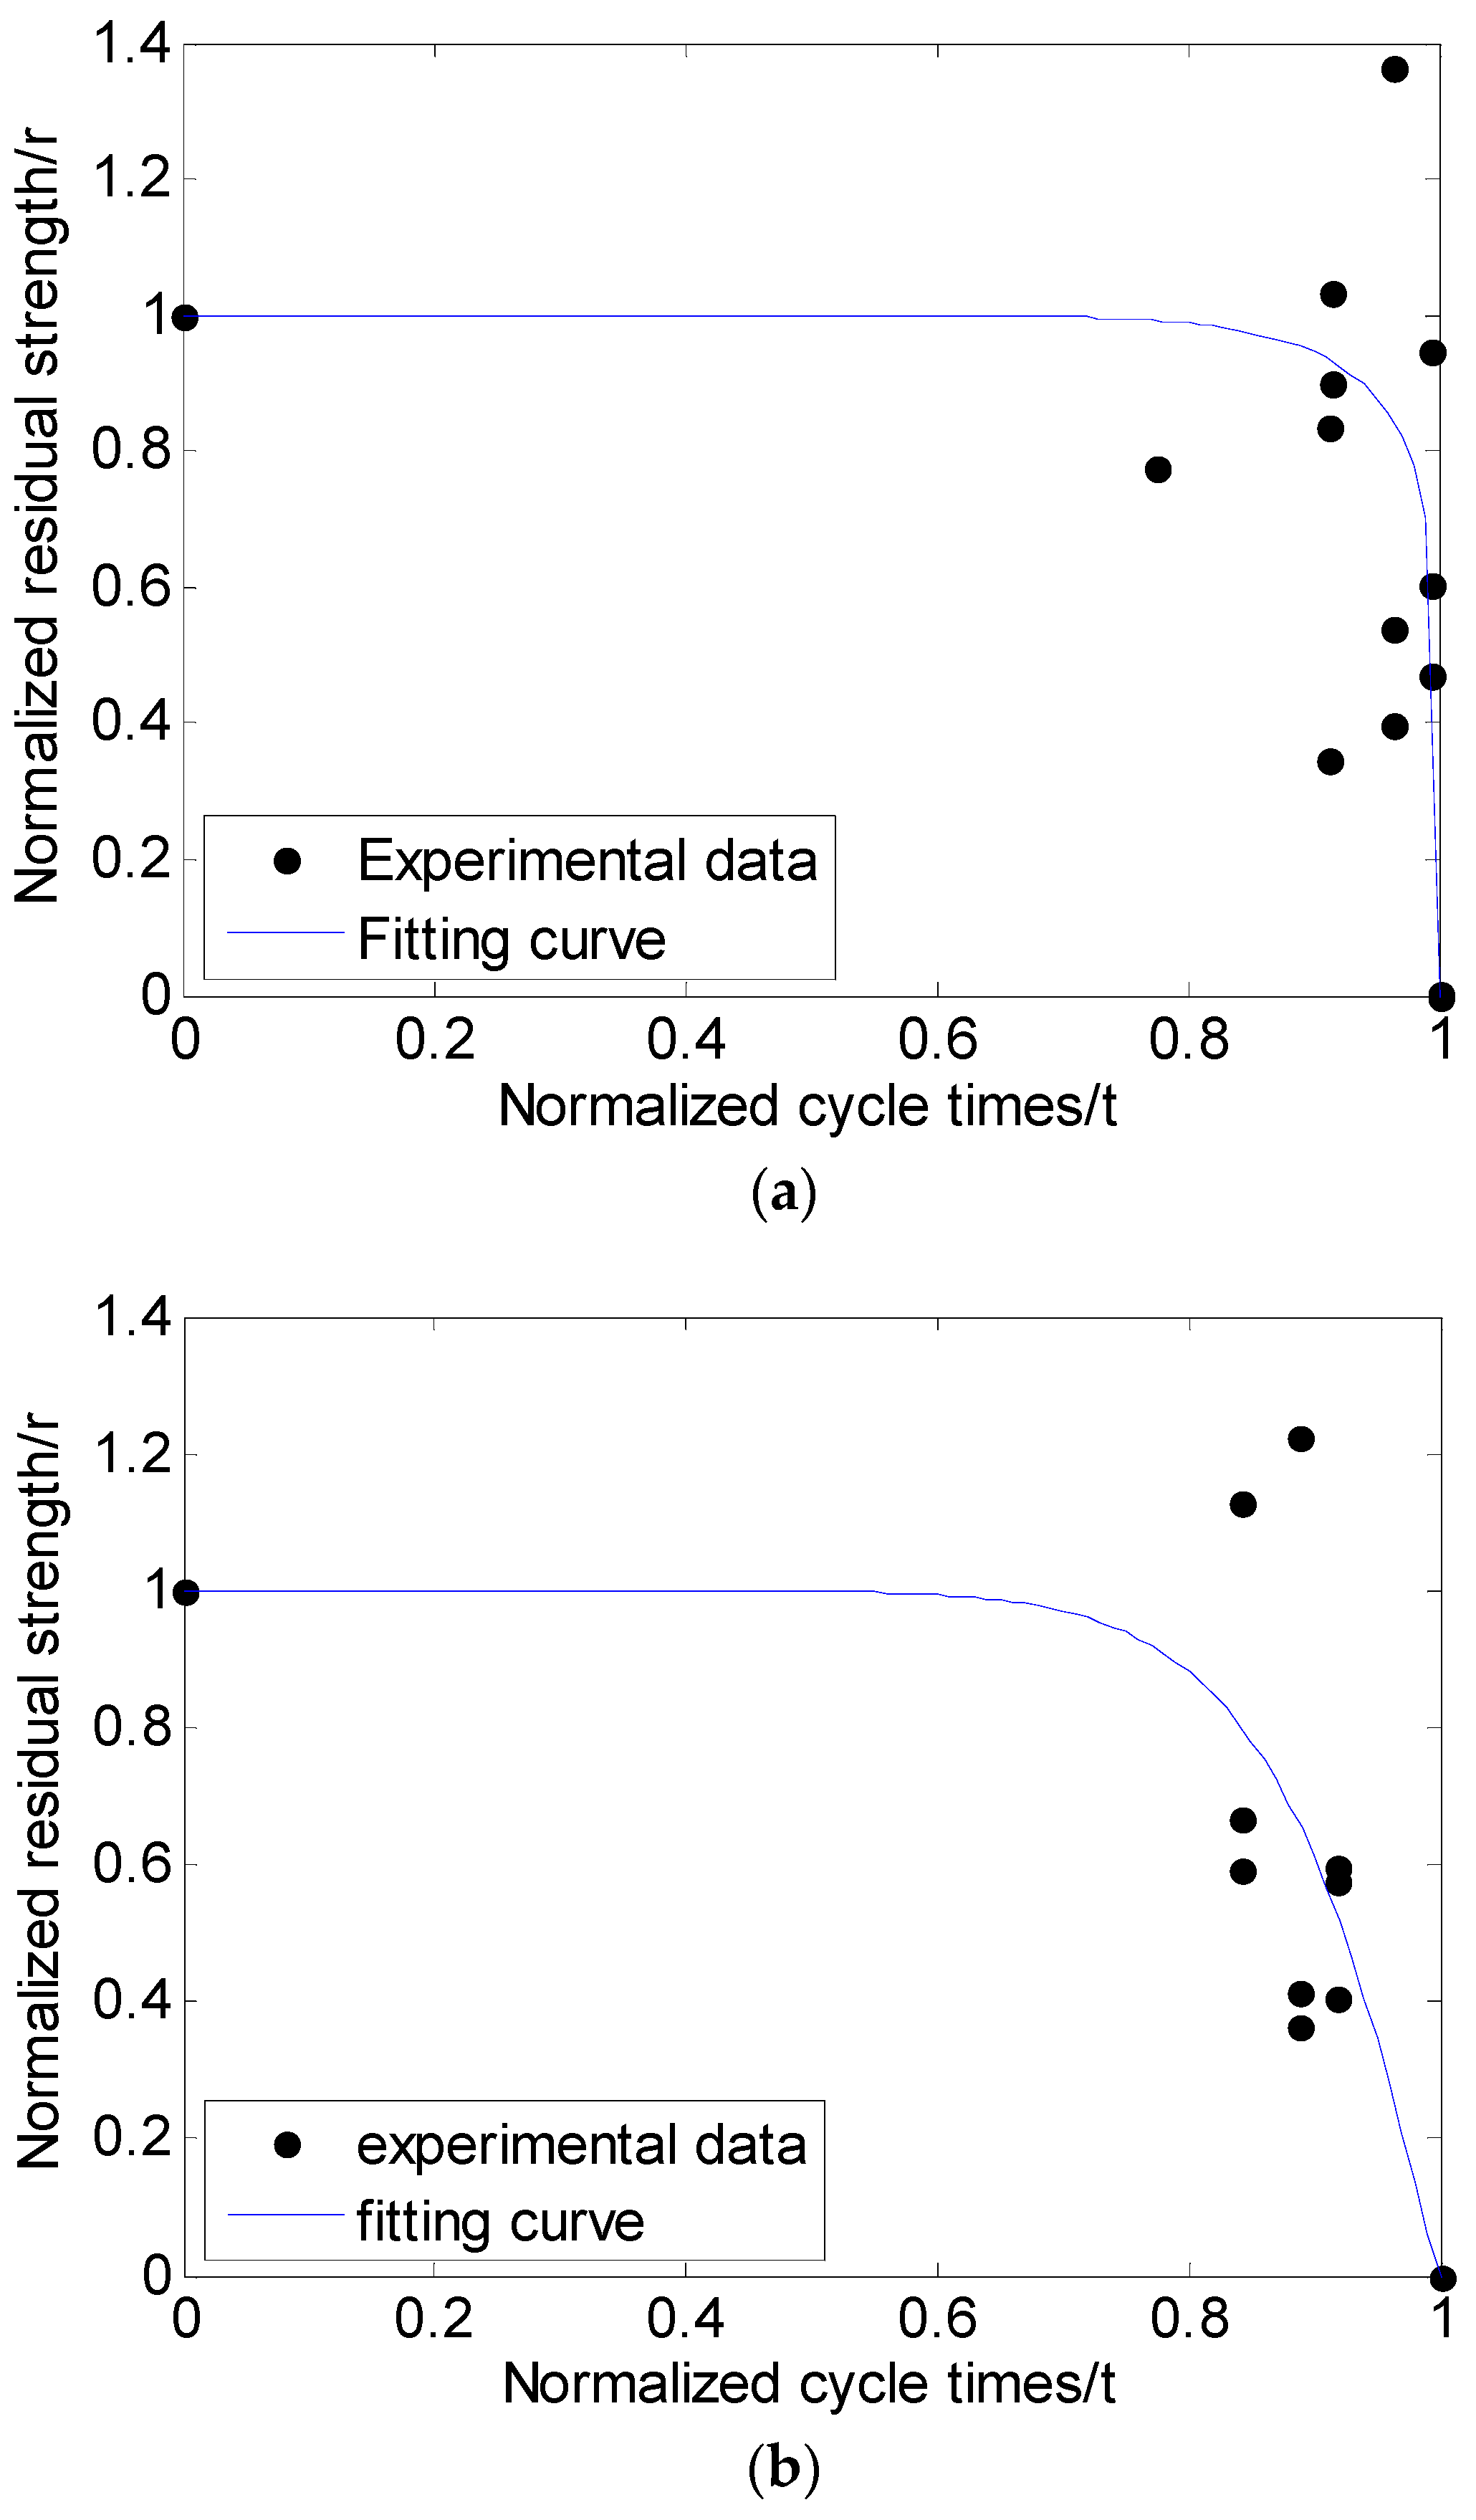
For the INT model, the shape of the curve depends on the parameters of α and β, which are fitted to residual strength data. In the present study, the curve-fitting approach [18] is used; the parameters of α and β are fitted by utilizing the mean residual strength values. The residual strength curves and the experimental data in the principal direction are shown in Figure 8. In addition to the respective static strength values, the parameter values of the fatigue function and INT model are summarized in Table 3.
4.2. Structure Experiments
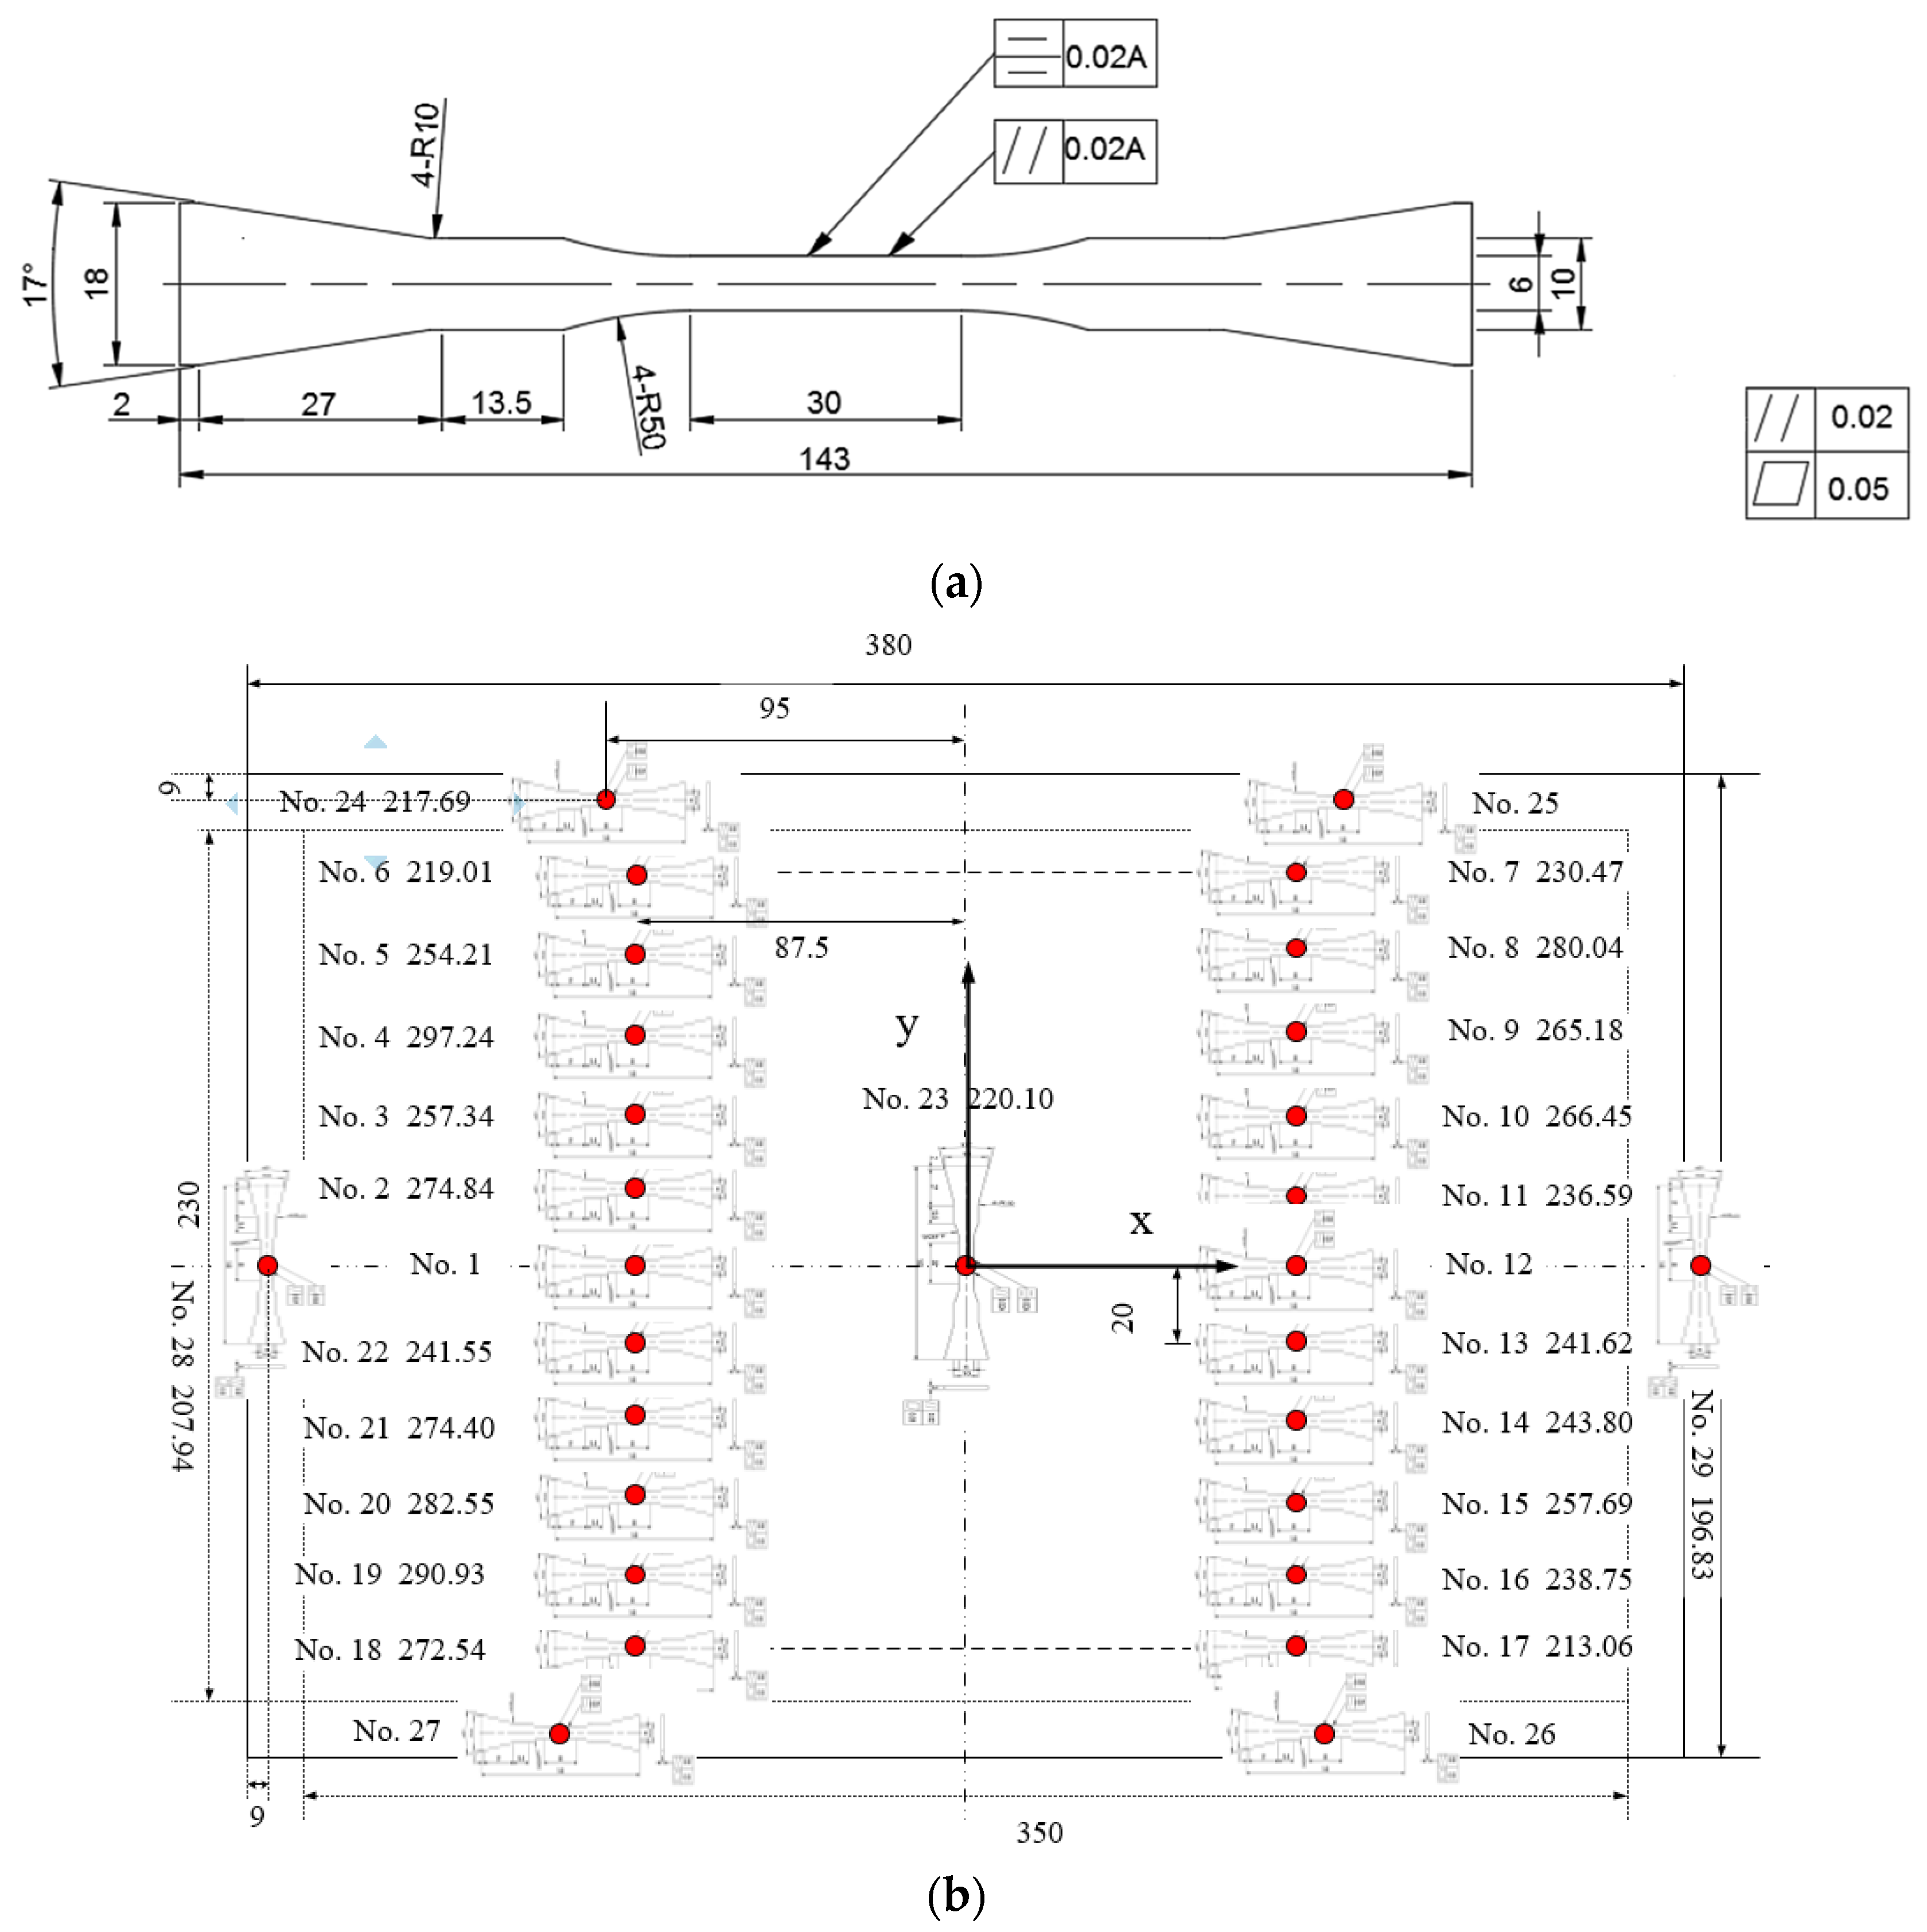
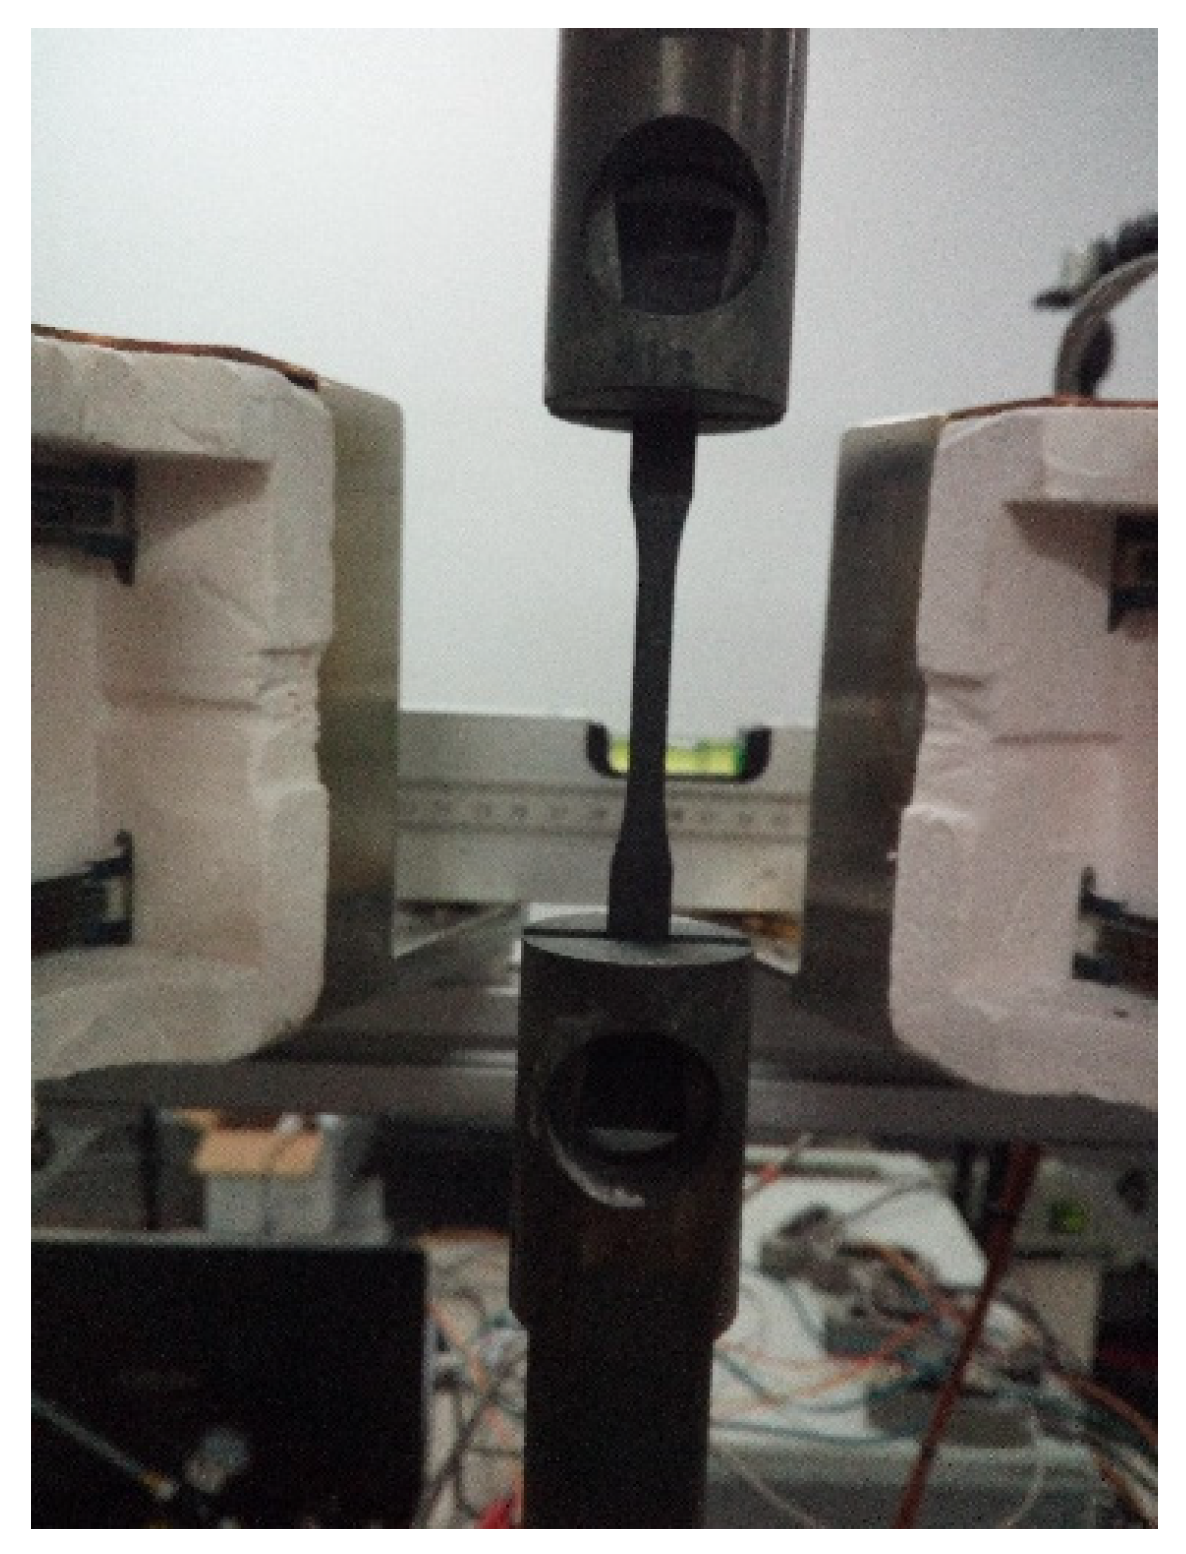
The Beijing Institute of Structure and Environment Engineering has developed a thermal acoustic fatigue apparatus (TAFA). A detailed description of the TAFA facility is provided in [27]. The TAFA facility is a progressive wave tube facility mainly including a sound source system, test section, acoustic control system, acquisition system, and field monitoring system. Thermal loads are provided by a bank of 12 quartz lamps. The test panel can be mounted to one wall of the progressive wave tube test section by means of a picture frame clamping-bar arrangement, which clamps 15 mm of the panel along each edge. Flexible insulating blankets are wrapped over the clamping bars around the panel edges to isolate the test panel from the clamping frame with the purpose of reducing local stress concentrations and minimizing heat transfer from the test panel to the clamping frame. In addition, a water-cooled channel is designed to provide continuous cooling. A 2D plain-woven C/SiC composite panel with the size of 380 mm × 260 mm × 1.5 mm is tested, and the area exposed to thermal-acoustic loadings is 350 mm × 230 mm. The test is conducted by exposing the panel to a band-limited (30–512 Hz) white noise at level of 162 dB for 480 s while the panel temperature is maintained at 600 °C. The temperature field is approximately uniform. After that the panel is cut into pieces of a certain size in order to obtain more data on the residual strength of the representative locations on the panel. The configuration and dimensions of the tensile residual strength specimen for validation experimentation, as shown in Figure 9a, are the same as that of the tensile specimen in Figure 6a except for the thickness. The precise locations of the residual strength specimen on the panel and the series number are shown in Figure 9b. Residual strength specimens 1–22 are equidistant with an interval of 20 mm in the direction of the width of the panel. The locations of the residual strength specimen are axial symmetry.
Tensile tests of the residual strength specimen are performed on a servo-hydraulic test machine MTS 809 in air and at a temperature of 600 °C with the constant displacement rate 0.06 mm/min. The experimental system and the installation of the specimen are shown in Figure 10. Residual strength specimens 1, 12, 25, 26, and 27 were deprecated because of the visible damage caused by cutting. Figure 9b shows the residual strength values of the specimen measured by experiments.
5. Result and Discussion
Based on the methodology, a computer code was developed using the standard programming language MATLAB to simulate the cycle-by-cycle behavior of composite materials under variable amplitude fatigue loading. In this paper, the stress time histories were processed by using the range-mean counting method, and then the aforementioned residual strength model was employed to predict the residual strength. Ten ensembles of stress response were generated to predict the residual strength for each loading condition. The initial 0.2 s transient response of each response record was discarded to ensure a stable statistical property, resulting in a 1.8 s duration of fully developed response. For each simulation, the response time history contained 14,746 points, stored at every 1.2207 × 10⁻⁴ s.
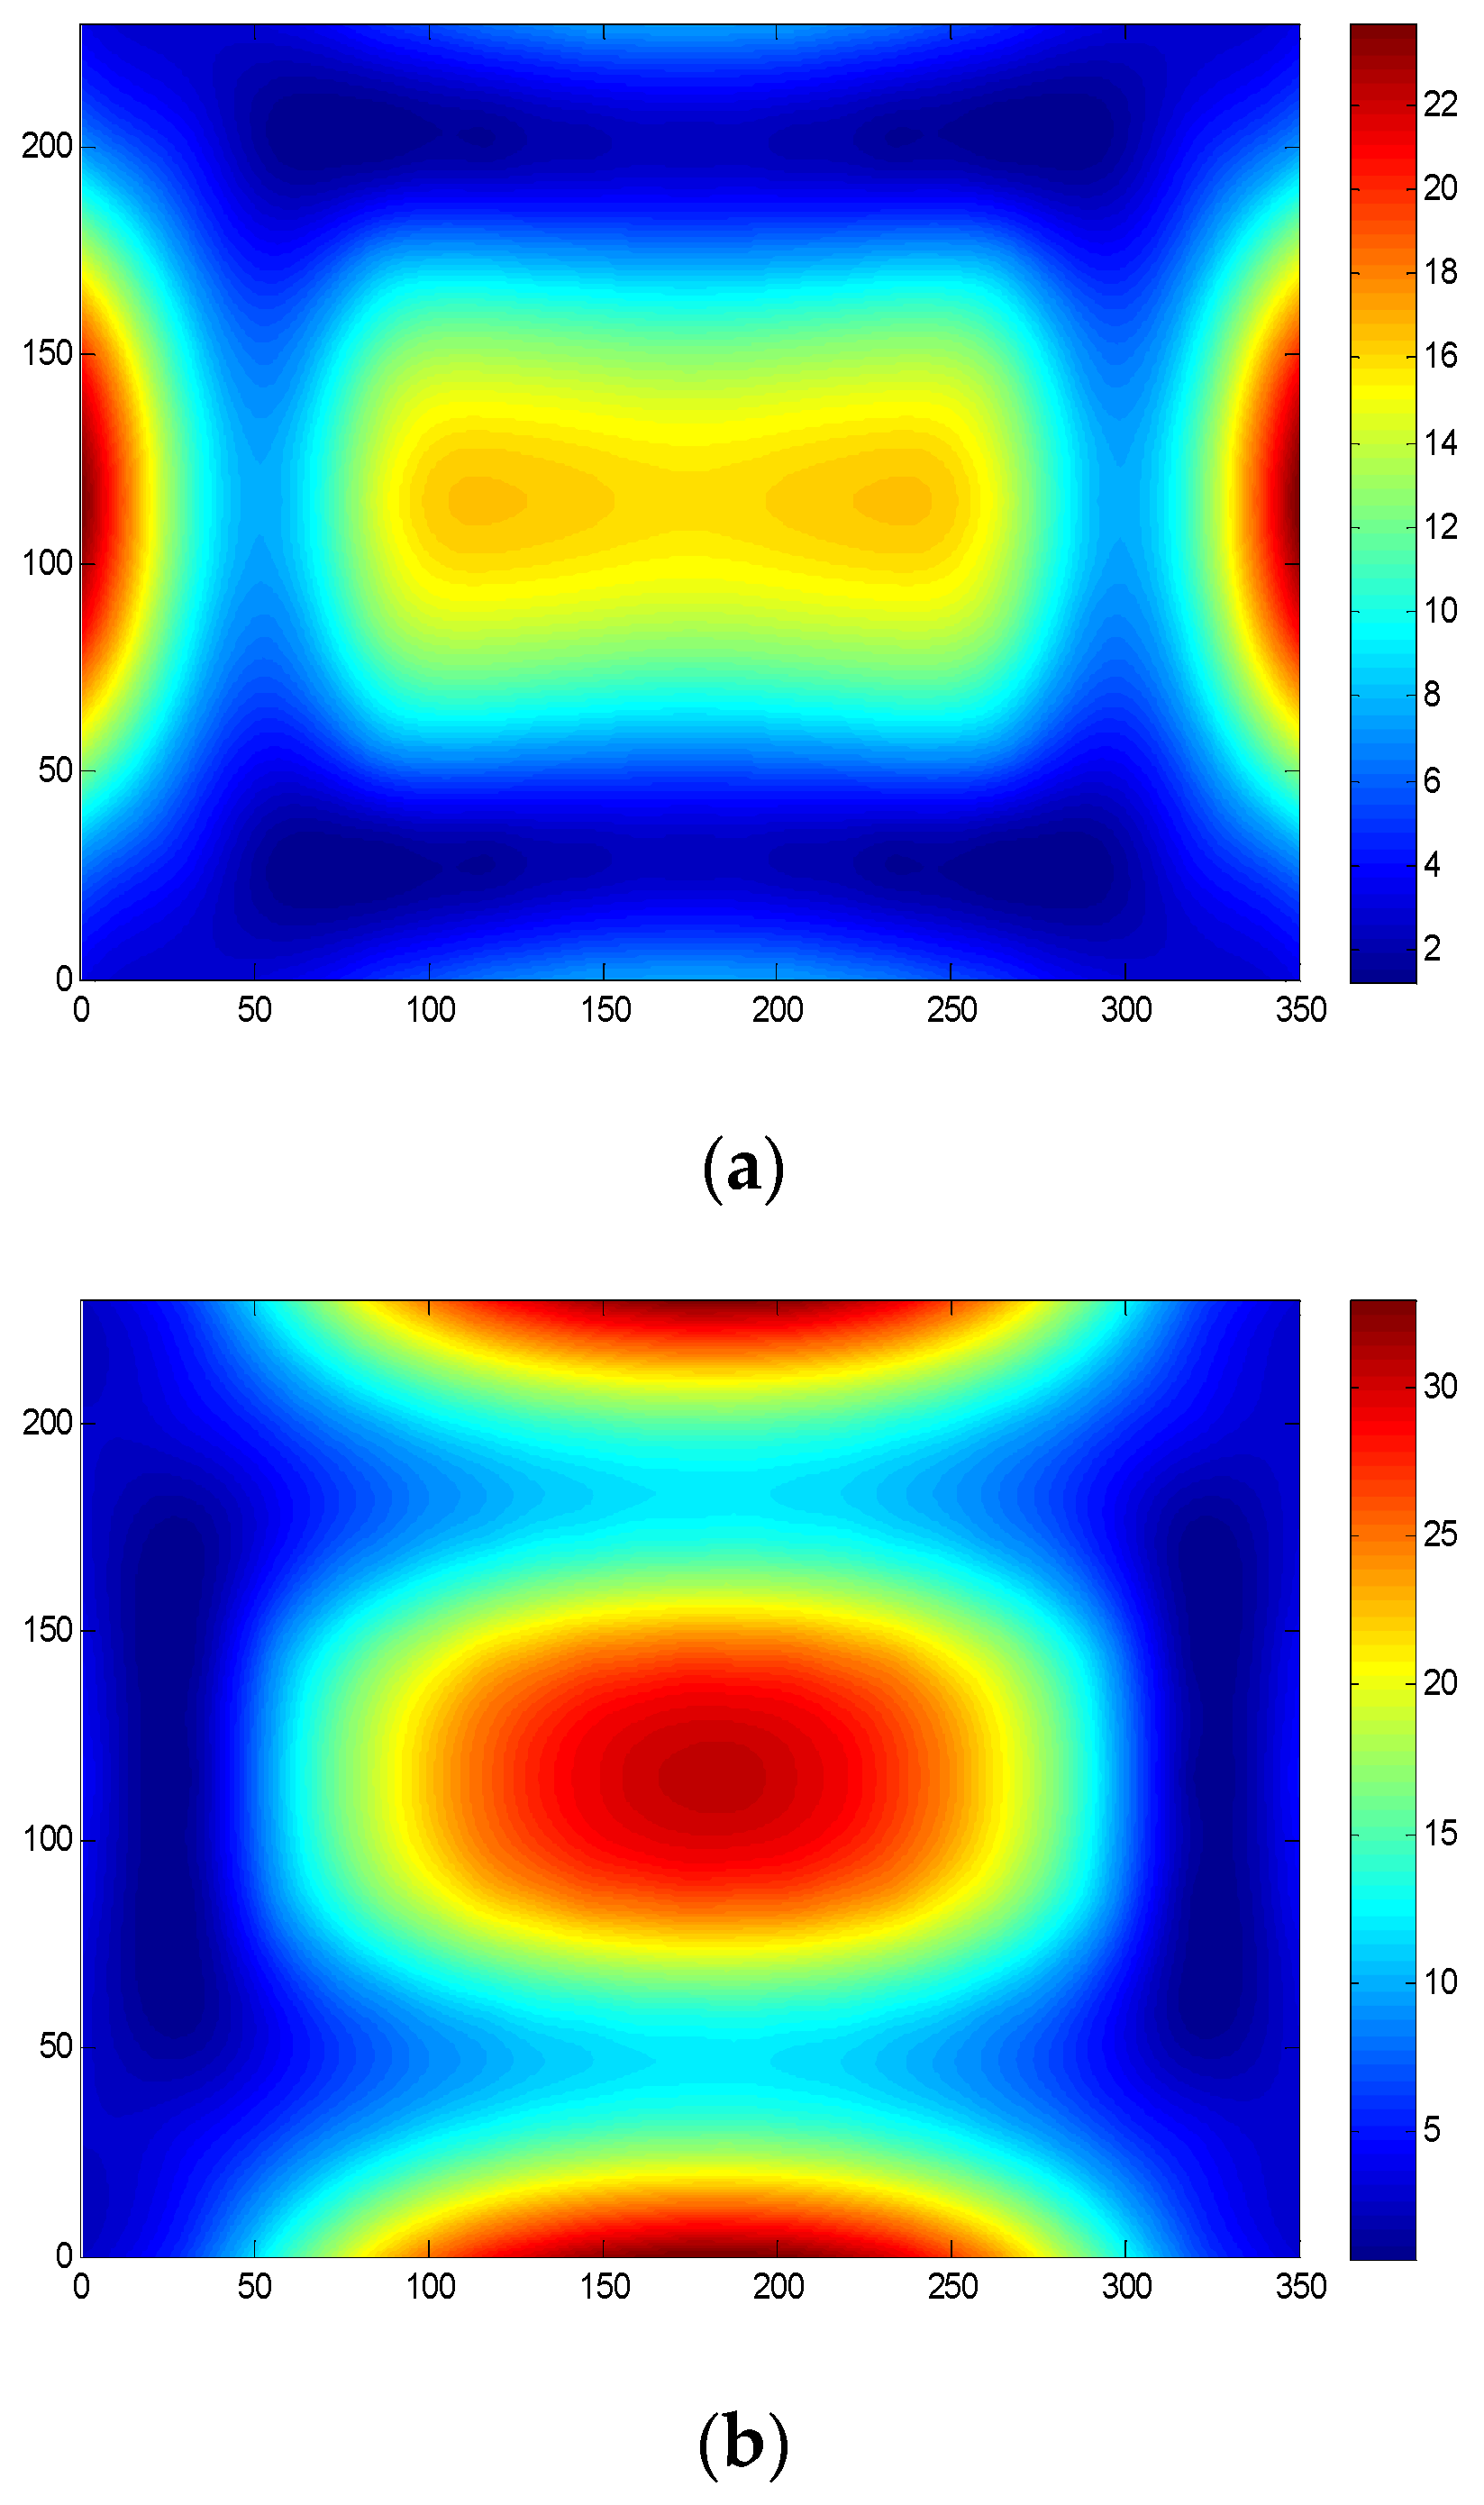
The root mean square values (RMS) of the dynamic stress response of the C/SiC ceramic matrix composite panel at 162 dB and 600 °C are shown in Figure 11. As shown in Figure 11, in the direction of the length of the panel the maximum value of the RMS is at the center of the short edge and the minimum value is about at the quarter of the long edge; in the direction of the width of the panel the maximum value of the RMS is at the center of the long edge and the minimum value is about at the quarter of the short edge.
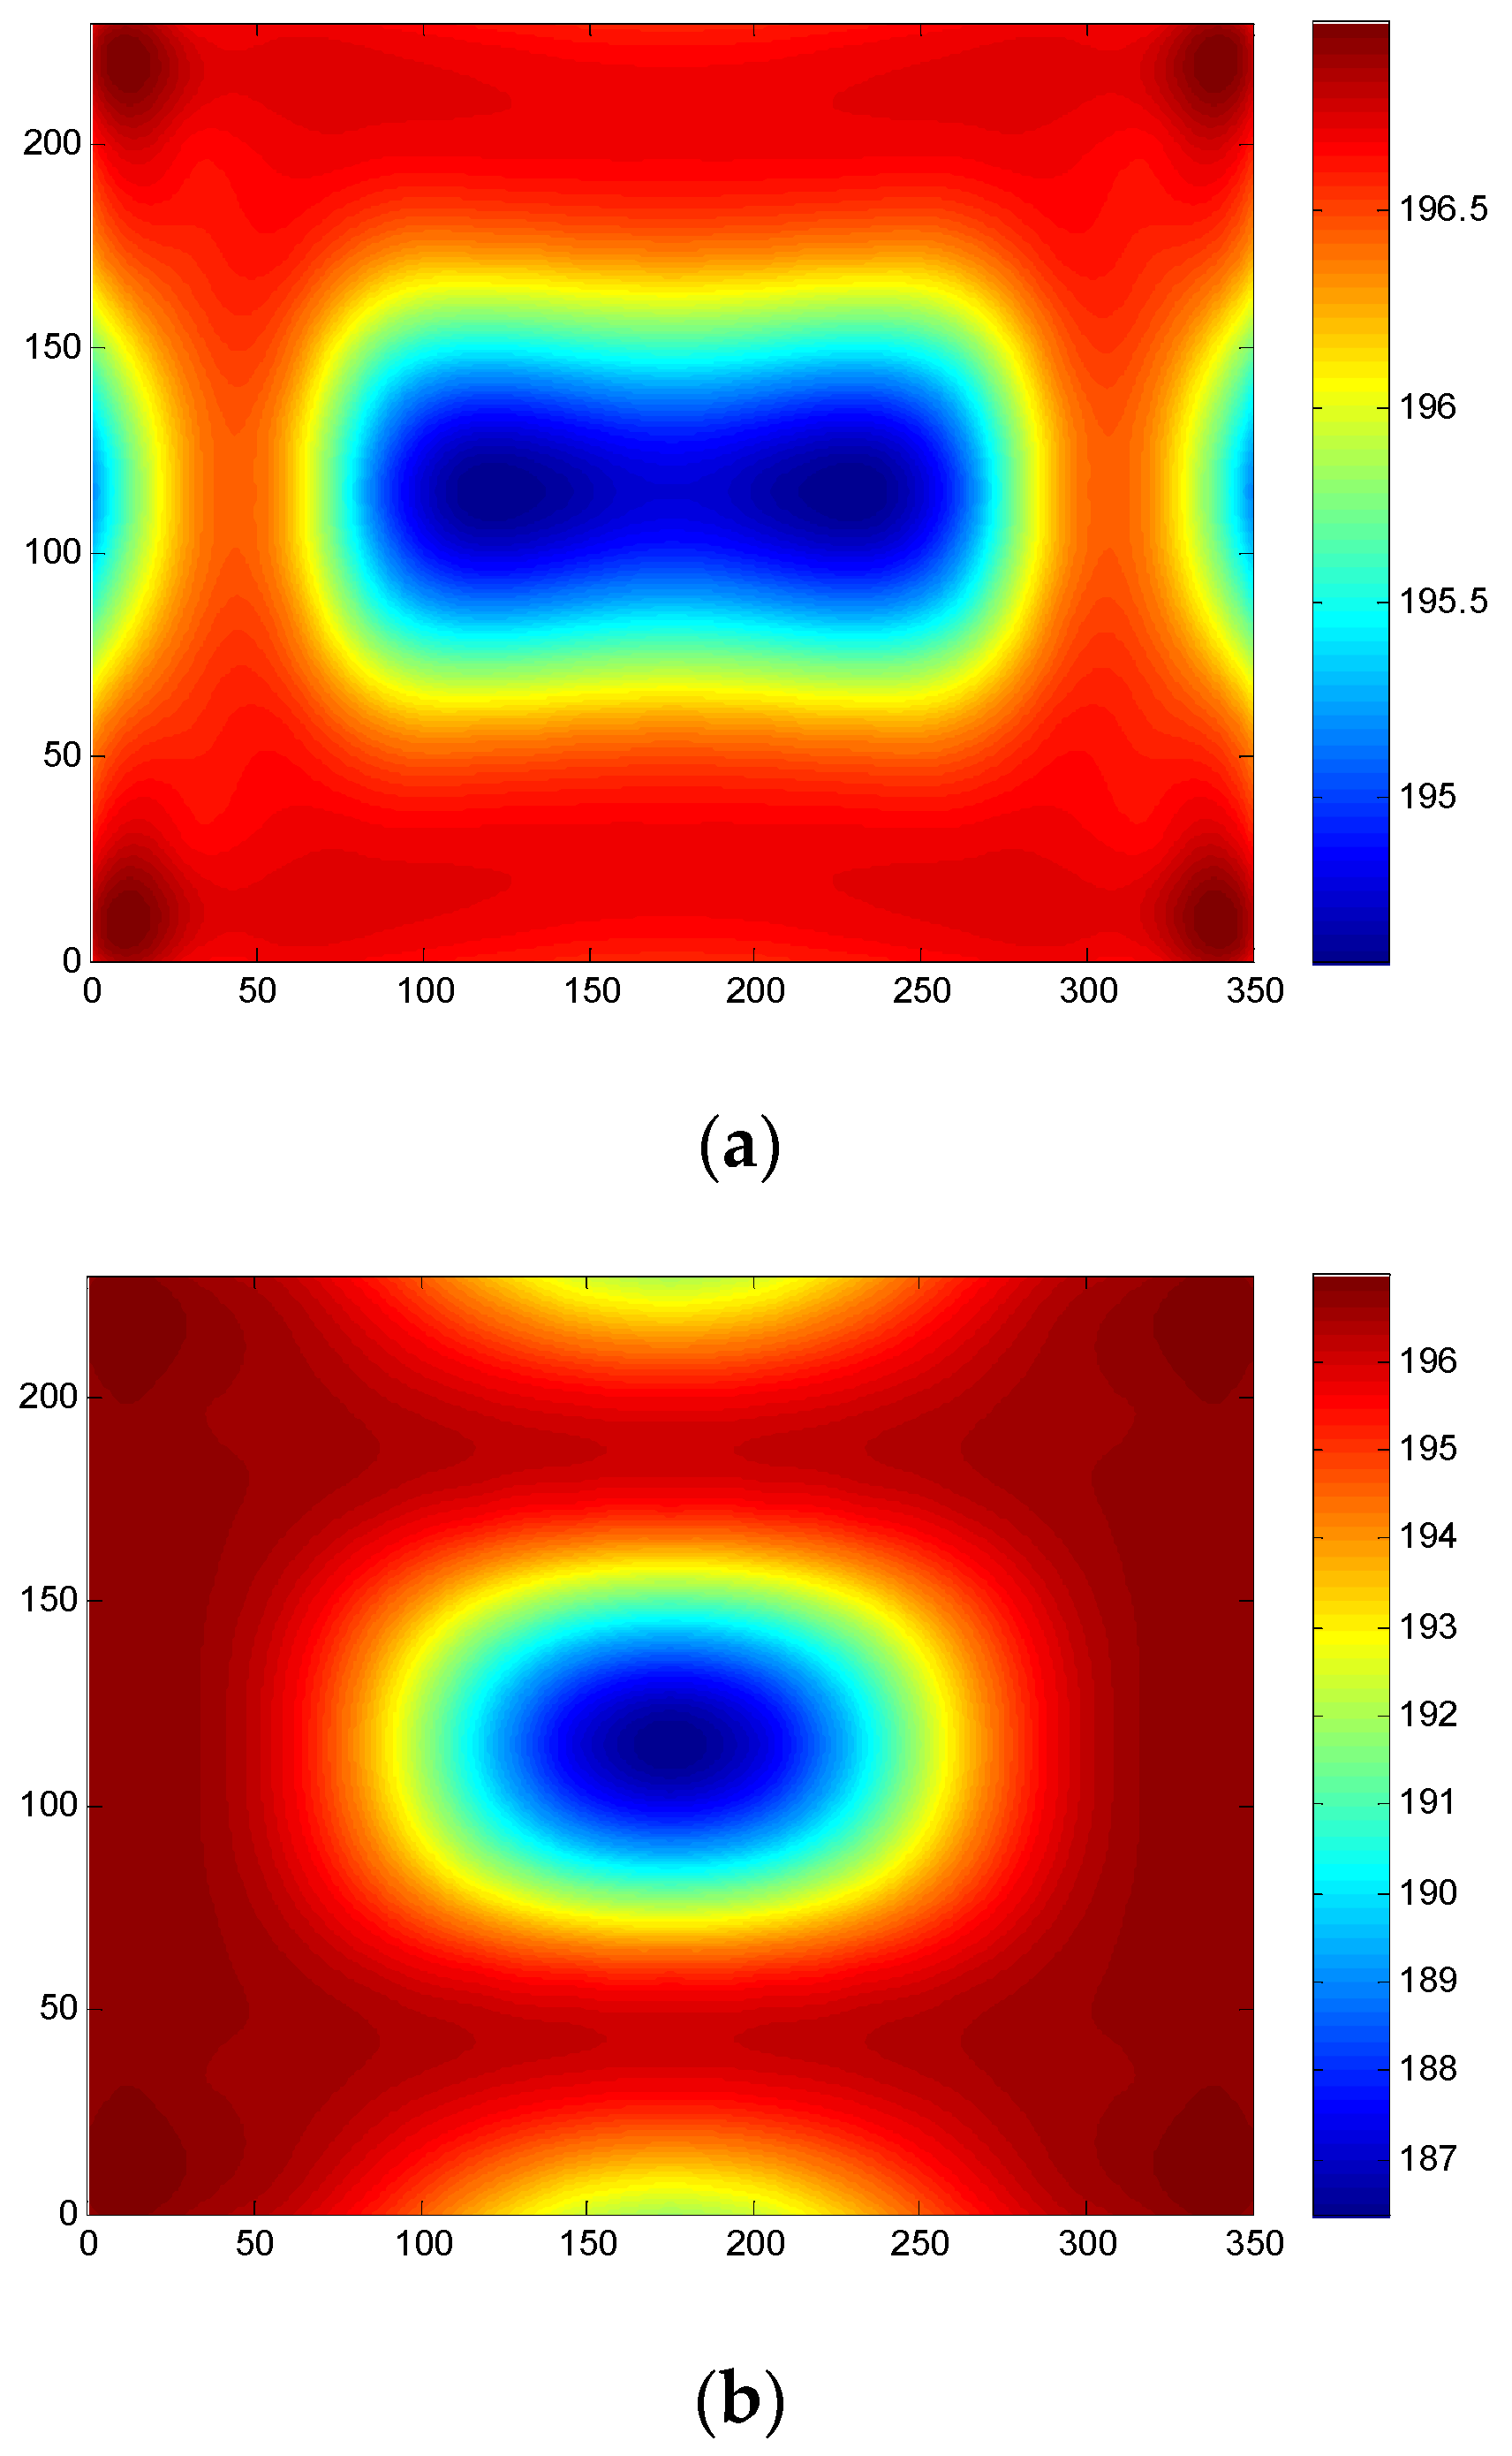
Figure 12 shows the tensile residual strength prediction of the C/SiC ceramic matrix composite panel under 162 dB and a temperature of 600 °C for 480 s. It shows that the tensile residual strength of the panel decreases rapidly with the increase in time at 162 dB and a temperature of 600 °C. The decrease in tensile residual strength of structures results from large mean stresses and very high alternating stresses introduced by snap-through motion between the two thermally buckled equilibrium positions.
Table 4 indicates that the maximum error in the direction of length between the experimental data and the simulation results is 8.92%, the minimum error in the direction of length is 6.39%, and the error of specimen 23 in the center of the panel along the width is 4.17%. It can been seen that the residual strength simulation results are conservative compared to experimental data. By comparing experimental data with simulation results, the simulation results are consistent with the experimental data.
6. Conclusions
A methodology was developed to determine the fatigue life or residual strength of composite panels subjected to combined thermal-acoustic loadings. Two features of this problem, large mean stresses and high alternating stresses, make it more complex than the fatigue of structures subjected to acoustic loading alone. The effects of the thermal environment on the dynamical properties of panels and the material properties of this material are taken into account. The static strength, residual strength, and fatigue life of the material are the input of the methodology. The methodology is validated with the residual strength test of 2D plain-woven C/SiC composite panel subjected to combined thermal-acoustic loadings. It has been shown that the results of residual strength predicted by the methodology are well correlated with the experimental results, and are conservative compared to experimental results.
Author Contributions
Conceptualization, Y.S.; Resources, Y.L.; Writing—review & editing, Y.Z. All authors have read and agreed to the published version of the manuscript.
Funding
This study is supported by the National Natural Science Foundation of China (No. 11602073).
Institutional Review Board Statement
Not applicable.
Informed Consent Statement
Informed consent was obtained from all subjects involved in the study.
Data Availability Statement
The data presented in this study are available on request from the corresponding author. The data are not publicly available due to the contract requirements.
Acknowledgments
This study is supported by the National Natural Science Foundation of China (No. 11602073). The valuable comments by the anonymous reviewers are also deeply appreciated.
Conflicts of Interest
The authors declare no conflict of interest.
Nomenclature
| TPS | thermal protection system |
| INT | interaction model |
| TAFA | thermal acoustic fatigue apparatus |
| probability density function | |
| RMS | root mean square |
| Su | initial static strength |
| Sr | residual strength |
| σp | maximum applied cyclic stress |
| n | applied number of cycles |
| N | corresponding fatigue life |
| α and β | parameters of the interaction model |
| σp,i | maximum applied stress of ith cycle |
| ni | applied number of cycles of ith cycle |
| N | corresponding fatigue life of ith cycle |
| Sr(i) | residual strength after ith cycle |
| neqv,i−1 | number of equivalent cycle |
| NPT | number of simulated points |
| Δt | time step |
| f1 | fundamental frequency |
| T | temperature |
| ΔT | temperature increment |
| ΔTC | critical bucking temperature increment |
| B and a | parameter of power law modal |
| b | b = logB |
| R | stress ratio |
References
- Ng, C.F.; Clevenson, S.A. High-intensity acoustic tests of a thermally stressed plate. J. Aircr. 1991, 28, 275–281. [Google Scholar] [CrossRef]
- Murphy, K.D.; Virgin, L.N.; Rizzi, S.A. Experimental snap-through boundaries for acoustically excited, thermally buckled plates. Exp. Mech. 1996, 36, 312–317. [Google Scholar] [CrossRef]
- Leatherwood, J.D.; Clevenson, S.A.; Powell, C.A. Acoustic testing of high-temperature panels. J. Aircr. 1992, 29, 1130–1136. [Google Scholar] [CrossRef]
- Soovere, J. The effect of acoustic/thermal environments on advanced composite fuselage panels. J. Aircr. 1985, 22, 257–263. [Google Scholar] [CrossRef]
- Jacobson, M.J. Sonic fatigue of advanced composite panels in thermal environments. J. Aircr. 1983, 20, 282–288. [Google Scholar] [CrossRef]
- Hollkamp, J.J.; Gordon, R.W.; Spottswood, S.M. Nonlinear modal models for sonic fatigue response prediction: A comparison of methods. J. Sound Vib. 2005, 284, 1145–1163. [Google Scholar] [CrossRef]
- Przekop, A.; Rizzi, S.A.; Sweitzer, K.A. An investigation of high-cycle fatigue models for metallic structures exhibiting snap-through response. Int. J. Fatigue 2008, 30, 1579–1598. [Google Scholar] [CrossRef] [Green Version]
- Przekop, A. Nonlinear Response and Fatigue Estimation of Aerospace Curved Surface Panels to Acoustic and Thermal Loads. Ph.D. Thesis, Old Dominion University, Norfolk, VA, USA, 2003. [Google Scholar]
- Przekop, A.; Rizzi, S.A. A reduced order method for predicting high cycle fatigue of nonlinear structures. Comput. Struct. 2006, 84, 1606–1618. [Google Scholar] [CrossRef]
- Przekop, A.; Rizzi, S.A. Dynamic snap-through of thin-walled structures by a reduced-order method. AIAA J. 2007, 45, 2510–2519. [Google Scholar] [CrossRef] [Green Version]
- Liu, L.; Ren, J.; He, T.R. Nonlinear dynamic response of acoustically excited and thermally loaded composite plates resting on elastic foundations. Int. J. Solids Struct. 2018, 148–149, 44–66. [Google Scholar] [CrossRef]
- Liu, L.; Guo, Q.; He, T. Thermal-acoustic fatigue of a multilayer thermal protection system in combined extreme environments. Adv. Mech. Eng. 2014, 6, 176891. [Google Scholar] [CrossRef]
- Dhainaut, J.M. Nonlinear Response and Fatigue Estimation of Surface Panels to White and Non-White Gaussian Random Excitations. Ph.D. Thesis, Old Dominion University, Norfolk, VA, USA, 2001. [Google Scholar]
- Post, N.L.; Case, S.W.; Lesko, J.J. Modeling the variable amplitude fatigue of composite materials: A review and evaluation of the state of the art for spectrum loading. Int. J. Fatigue 2008, 30, 2064–2086. [Google Scholar] [CrossRef]
- Nijssen, R.P.L. Fatigue Life Prediction and Strength Degradation of Wind Turbine Rotor Blade Composites. Ph.D. Thesis, Delft University of Technology, Delft, The Netherlands, 2006. [Google Scholar]
- Hashin, Z. Cumulative damage theory for composite materials: Residual life and residual strength methods. Compos. Sci. Technol. 1985, 23, 1–19. [Google Scholar] [CrossRef]
- Adam, T.; Dickson, R.F.; Jones, C.J. A power law fatigue damage model for fibre-reinforced plastic laminates. Pro. Inst. Mech. Eng. 1986, 200, 155–166. [Google Scholar] [CrossRef]
- Yao, W.X.; Himmel, N. A new cumulative fatigue damage model for fibre-reinforced plastics. Compos. Sci. Technol. 2000, 60, 59–64. [Google Scholar] [CrossRef]
- Passipoularidis, V.A.; Philippidis, T.P.; Brondsted, P. Fatigue life prediction in composites using progressive damage modelling under block and spectrum loading. Int. J. Fatigue 2011, 33, 132–144. [Google Scholar] [CrossRef]
- Qasim, M.; Ali, Z.; Wakif, A. Numerical simulation of MHD peristaltic flow with variable electrical conductivity and Joule dissipation using generalized differential quadrature method. Commun. Theor. Phys. 2019, 71, 509. [Google Scholar] [CrossRef]
- Wakif, A.; Qasim, M.; Afridi, M.I. Numerical examination of the entropic energy harvesting in a magnetohydrodynamic dissipative flow of Stokes’ second problem: Utilization of the gear-generalized differential quadrature method. J. Non-Equilib. Thermodyn. 2019, 44, 385–403. [Google Scholar] [CrossRef]
- Gu, Y.; O’neal, D.L. An analytical solution to transient heat conduction in a composite region with a cylindrical heat source. J. Sol. Energy Eng. 1995, 117, 242–248. [Google Scholar] [CrossRef]
- Delouei, A.A.; Emamian, A.; Karimnejad, S. On 2D asymmetric heat conduction in functionally graded cylindrical segments: A general exact solution. Int. J. Heat Mass Transf. 2019, 143, 118515. [Google Scholar] [CrossRef]
- Delouei, A.A.; Emamian, A.; Karimnejad, S. A closed-form solution for axisymmetric conduction in a finite functionally graded cylinder. Int. Commun. Heat Mass Transf. 2019, 108, 104280. [Google Scholar] [CrossRef]
- Vassilopoulos, A.P.; Manshadi, B.D.; Keller, T. Influence of the constant life diagram formulation on the fatigue life prediction of composite materials. Int. J. Fatigue 2010, 32, 659–669. [Google Scholar] [CrossRef]
- Monte, M.D.; Moosbrugger, E.; Jaschek, K. Multiaxial fatigue of a short glass fibre reinforced polyamide 6.6-Fatigue and fracture behaviour. Int. J. Fatigue 2010, 32, 17–28. [Google Scholar] [CrossRef]
- Wu, Z.Q.; Zhang, Z.P.; Li, H.B. Experimental investigation on C/SiC plate dynamic response in a thermal and acoustic combined environment. J. Exp. Mech. 2015, 30, 741–748. [Google Scholar]
Figure 1.
Procedure of the algorithm of fatigue life assessment.

Figure 2.
Panel subjected to thermal-acoustic loadings with full clamped boundary conditions. (a) Panel with full clamped boundary conditions; (b) Panel subjected to thermal-acoustic loadings.
Figure 2.
Panel subjected to thermal-acoustic loadings with full clamped boundary conditions. (a) Panel with full clamped boundary conditions; (b) Panel subjected to thermal-acoustic loadings.

Figure 3.
Random noise loading of generation (150 dB).

Figure 4.
Transverse displacement response at the center of the thermally post-bucked panel at 600 °C.
Figure 4.
Transverse displacement response at the center of the thermally post-bucked panel at 600 °C.

Figure 5.
PDF of the transverse displacement response at the center of the thermally post-bucked panel at 600 °C. (a) 150 dB; (b) 155 dB; (c) 165 dB.
Figure 5.
PDF of the transverse displacement response at the center of the thermally post-bucked panel at 600 °C. (a) 150 dB; (b) 155 dB; (c) 165 dB.

Figure 6.
The configuration and dimensions of the specimen. (a) Tensile specimen; (b) Compressive specimen.
Figure 6.
The configuration and dimensions of the specimen. (a) Tensile specimen; (b) Compressive specimen.

Figure 7.
S-N curve in the principal direction at 600 °C. (a) S-N curve of tensile-tensile R = 0.1 constant amplitude fatigue loading; (b) S-N curve of compressive-compressive R = 10 constant amplitude fatigue loading.
Figure 7.
S-N curve in the principal direction at 600 °C. (a) S-N curve of tensile-tensile R = 0.1 constant amplitude fatigue loading; (b) S-N curve of compressive-compressive R = 10 constant amplitude fatigue loading.

Figure 8.
Residual strength curves and the experimental data in the principal direction at 600 °C. (a) Tensile-tensile residual strength curve; (b) Compressive-compressive residual strength curve.
Figure 8.
Residual strength curves and the experimental data in the principal direction at 600 °C. (a) Tensile-tensile residual strength curve; (b) Compressive-compressive residual strength curve.

Figure 9.
The configuration, dimensions, locations, series number and experimental results of the residual strength specimen. (a) The configuration and dimensions of the tensile residual strength specimen. (b) The locations and series number of the residual strength specimen.
Figure 9.
The configuration, dimensions, locations, series number and experimental results of the residual strength specimen. (a) The configuration and dimensions of the tensile residual strength specimen. (b) The locations and series number of the residual strength specimen.

Figure 10.
The experimental system and the installation of the specimen.

Figure 11.
The RMS of the panel at 162 dB and 600 °C. (a) The RMS in the direction of the length of the panel; (b) The RMS in the direction of the width of the panel.
Figure 11.
The RMS of the panel at 162 dB and 600 °C. (a) The RMS in the direction of the length of the panel; (b) The RMS in the direction of the width of the panel.

Figure 12.
The values of tensile residual strength prediction. (a) The tensile residual in the direction of the length of the panel; (b) The tensile residual in the direction of the width of the panel.
Figure 12.
The values of tensile residual strength prediction. (a) The tensile residual in the direction of the length of the panel; (b) The tensile residual in the direction of the width of the panel.


Table 1.
Material property of 2D plain-woven C/SiC ceramic matrix composite.
| Material Property | T/°C | |
|---|---|---|
| 27 | 600 | |
| E11/GPa | 120 | 94.008 |
| E22/GPa | 120 | 94.008 |
| E33/GPa | 60 | 47.004 |
| G12/GPa | 44.4 | 34.817 |
| G13/GPa | 24 | 18.815 |
| G23/GPa | 24 | 18.815 |
| α11/(10−6/°C) | 0 | 3.72 |
| α22/(10−6/°C) | 0 | 3.72 |
| α33/(10−6/°C) | 0 | 4.84 |
Table 2.
Response characteristics of panel under different thermal-acoustic loadings.
| ΔT (°C) | Sound Press Level (dB) | ||
|---|---|---|---|
| 150 | 155 | 165 | |
| 0 | N | N | N |
| 103 | N | N | N |
| 573 | N | I | P |
Table 3.
Static strength and parameter values of the fatigue function and INT model.
| Suts/MPa | Sucs/MPa | R | a | b | α | β |
|---|---|---|---|---|---|---|
| 283.74 | 361.80 | 0.1 | −2.60 | 8.88 | 11.72 | 6.20 |
| 10 | −18.45 | 49.10 | 2.79 | 1.20 |
Table 4.
Comparison between simulation and experimental results.
| Tensile Residual/MPa | |||||
|---|---|---|---|---|---|
| Series Number | Experimental Result | Mean Value | Standard Deviation | Simulation Result | Error/% |
| E02 | 274.84 | 248.65 | 17.62 | 231.74 | 6.80 |
| E11 | 236.59 | ||||
| E13 | 241.62 | ||||
| E22 | 241.55 | ||||
| E03 | 257.34 | 260.50 | 13.13 | 243.85 | 6.39 |
| E10 | 266.45 | ||||
| E14 | 243.80 | ||||
| E21 | 274.40 | ||||
| E04 | 297.24 | 275.67 | 17.76 | 251.09 | 8.92 |
| E09 | 265.18 | ||||
| E15 | 257.69 | ||||
| E20 | 282.55 | ||||
| E05 | 254.21 | 265.98 | 23.81 | 243.08 | 8.61 |
| E08 | 280.04 | ||||
| E16 | 238.75 | ||||
| E19 | 290.93 | ||||
| E06 | 219.01 | 233.77 | 26.84 | 217.64 | 6.90 |
| E07 | 230.47 | ||||
| E17 | 213.06 | ||||
| E18 | 272.54 | ||||
| E23 | 220.10 | 220.10 | 210.93 | 4.17 | |
Publisher’s Note: MDPI stays neutral with regard to jurisdictional claims in published maps and institutional affiliations. |
© 2022 by the authors. Licensee MDPI, Basel, Switzerland. This article is an open access article distributed under the terms and conditions of the Creative Commons Attribution (CC BY) license (https://creativecommons.org/licenses/by/4.0/).
Share and Cite
MDPI and ACS Style
Zhang, Y.; Sun, Y.; Liu, Y. Residual Strength Analysis of C/SiC Ceramic Matrix Composite Panels Subjected to Combined Thermal-Acoustic Loadings. Appl. Sci. 2022, 12, 5996. https://doi.org/10.3390/app12125996
AMA Style
Zhang Y, Sun Y, Liu Y. Residual Strength Analysis of C/SiC Ceramic Matrix Composite Panels Subjected to Combined Thermal-Acoustic Loadings. Applied Sciences. 2022; 12(12):5996. https://doi.org/10.3390/app12125996
Chicago/Turabian StyleZhang, Yuli, Yi Sun, and Yizhi Liu. 2022. "Residual Strength Analysis of C/SiC Ceramic Matrix Composite Panels Subjected to Combined Thermal-Acoustic Loadings" Applied Sciences 12, no. 12: 5996. https://doi.org/10.3390/app12125996
Note that from the first issue of 2016, this journal uses article numbers instead of page numbers. See further details here.