
Classification and Regression of Muscle Neural Signals on Human Lower Extremities via BP_AdaBoost


1
School of Aeronautics and Astronautics, University of Electronic Science and Technology of China (UESTC), Chengdu 611731, China
2
Aircraft Swarm Intelligent Sensing and Cooperative Control Key Laboratory of Sichuan Province, Chengdu 611731, China
*
Author to whom correspondence should be addressed.
Appl. Sci. 2022, 12(12), 5830; https://doi.org/10.3390/app12125830
Submission received: 8 May 2022
/
Revised: 6 June 2022
/
Accepted: 6 June 2022
/
Published: 8 June 2022
(This article belongs to the Topic Human Movement Analysis)
Abstract
:Electromyography (EMG) signals are widely applied in the classification of human motion and intention recognition as having the characteristic of earlier than actual limb motion. In this article, to improve its accuracy of classification and prediction, we firstly analyze the relationship between muscle length and joint movement and select rectus femoris and biceps femoris as the experimental muscles to collect neural signals by means of musculoskeletal analysis software. EMG sensors are used to measure those muscles’ EMG signals of five kinds of knee movements, including thigh-raising, calf-raising, squatting, knee bending on chair, and walking. We designed a BP_AdaBoost algorithm with the BP neural network as a weak classifier and weak regressor, and a muscle neural activation is used as the input for recognition. It is a negative correlation between the length of the rectus femoris and the biceps femoris during gait. Their muscle neural signals are used as the input of the recognition algorithm. The experiment results show that the proposed algorithm improves the rate of BP neural network from 78.82% to 93.52%. The thigh EMG signal successfully maps the knee joint angle by utilizing BP_AdaBoost; its error in identifying five kinds of motion modes is lowest compared with other regression algorithms.
1. Introduction
Human motion recognition technology has made a great breakthrough in the research field of wearable power assisted devices (including prosthetics for the disabled and power assisted exoskeletons for the healthy) with the improvement of Artificial Intelligence (AI) and Internet of Things (IoT) technology [1]. Nowadays, the signal sources of human motion intention recognition methods mainly include human mechanical signals, computer vision signals, and neural signals [2,3,4]. Nerve signals, also known as bioelectric signals, including EEG, EMG, and ECG signals, are a kind of electrical signals whose conduction speed is very speedy. After receiving the central nerve signal, muscle fiber will show potential changes and produce a weak electrical signal on the surface [4]. This is the comprehensive effect of superficial muscle and nerve electrical activities on the skin surface, which is called surface electromyography (EMG) signal [5]. The EMG signal is transmitted to the skin surface 30–150 milliseconds earlier than the angle signal of the lower limb, which can reflect human motion more truly [6]. EMG signals have broad application prospects in the fields of power assisted exoskeleton and flexible power assisted clothing technology because the earlier signal input can save more time for the classification system [7,8]. The typical application is Hybrid Assistive Limb (HAL) produced by Cyberdyne company in Japan, which is the active exoskeleton system based on EMG signal actuation [9]. However, the commonly used recognition algorithms cannot effectively identify the human motion intention due to the weakness and low signal-to-noise ratio of the EMG signal [10]. The research of human motion recognition based on the EMG signal is still in the primary stage, which also makes researchers work on designing different classifiers to improve the recognition efficiency [11,12]. Kundu B takes the EMG signal as input and motion classification, noise tolerance, and computational complexity as criteria to recognize movements through genetic algorithm. He proved the possibility of recognizing human motion by the EMG signal [13]. Ullah K et al. used the BP neural network to establish a nonlinear regression model between the EMG characteristics and the joint motion angle. Their experimental results show that the extracted signal feature information is better than the traditional principal component analysis method [14]. The existing research on gait recognition technology indicate that the stronger the stability of knee motion, the more reliable the gait features obtained from knee joint, and the higher the gait recognition rate relying on knee motion [13,14], which provides a theoretical basis for the study of knee joint movement and lower extremity EMG signals.
Based on this, this article focuses on the knee movement and muscle neural signals. Firstly, according to the anatomical principle, this article analyzes the thigh muscles related to the knee movement by OpenSim (a musculoskeletal analysis software) and selects the rectus femoris muscle in the front of the thigh and the biceps femoris muscle in the back of the thigh as the research object through SPSS (Statistical Product Service Solutions) correlation analysis. Then, the EMG signals of the two muscles are obtained by experiment. The muscle activity is calculated as the characteristic value of the EMG signal after filtering and noise reduction. Finally, this article seeks to solve the problem that the classification performance of the BP neural network would be affected by the separability of samples and to explore the recognition and prediction of knee motion with the thigh EMG signal. This article designs a BP_AdaBoost by BP as the weak classifier and predictor to recognize the typical motion of human lower limbs and predict the angle of the knee joint. The results show that the BP_AdaBoost strong classifier can improve the recognition of different motion patterns. Compared with the simple BP weak classifier algorithm, the BP_AdaBoost algorithm improves the rate of the BP neural network from 78.82% to 93.52%, which is 14.7%. Simultaneously, the BP_AdaBoost strong regressor can well predict the knee angle when the EMG signal is used as the input. The thigh EMG signal can map the knee joint angle by utilizing BP_AdaBoost, whose error of identifying five actions among many regression algorithms is lowest, which is only 6.384%. The research results are helpful to identify and predict the motion state of the human body. It is of great significance to promote the development of intelligent wearable devices with the myoelectric signal as the identification input.
The contributions of this article are as follows:
- (1)
- The correlation between rectus femoris and biceps femoris is obtained by OpenSim and SPSS, which provides a theoretical basis for the EMG signal acquisition of the lower limbs.
- (2)
- Muscle neural activation is shown to be used to identify human movement. Taking the BP neural network as the weak classifier, the BP_AdaBoost strong classifier can be used to identify different knee movements and improve the recognition rate of the BP neural network. BP_AdaBoost can also be used as a regressor, which has a good effect when the thigh EMG signal maps knee angle.
2. Materials and Methods
2.1. Muscle Selection of Lower Extremity
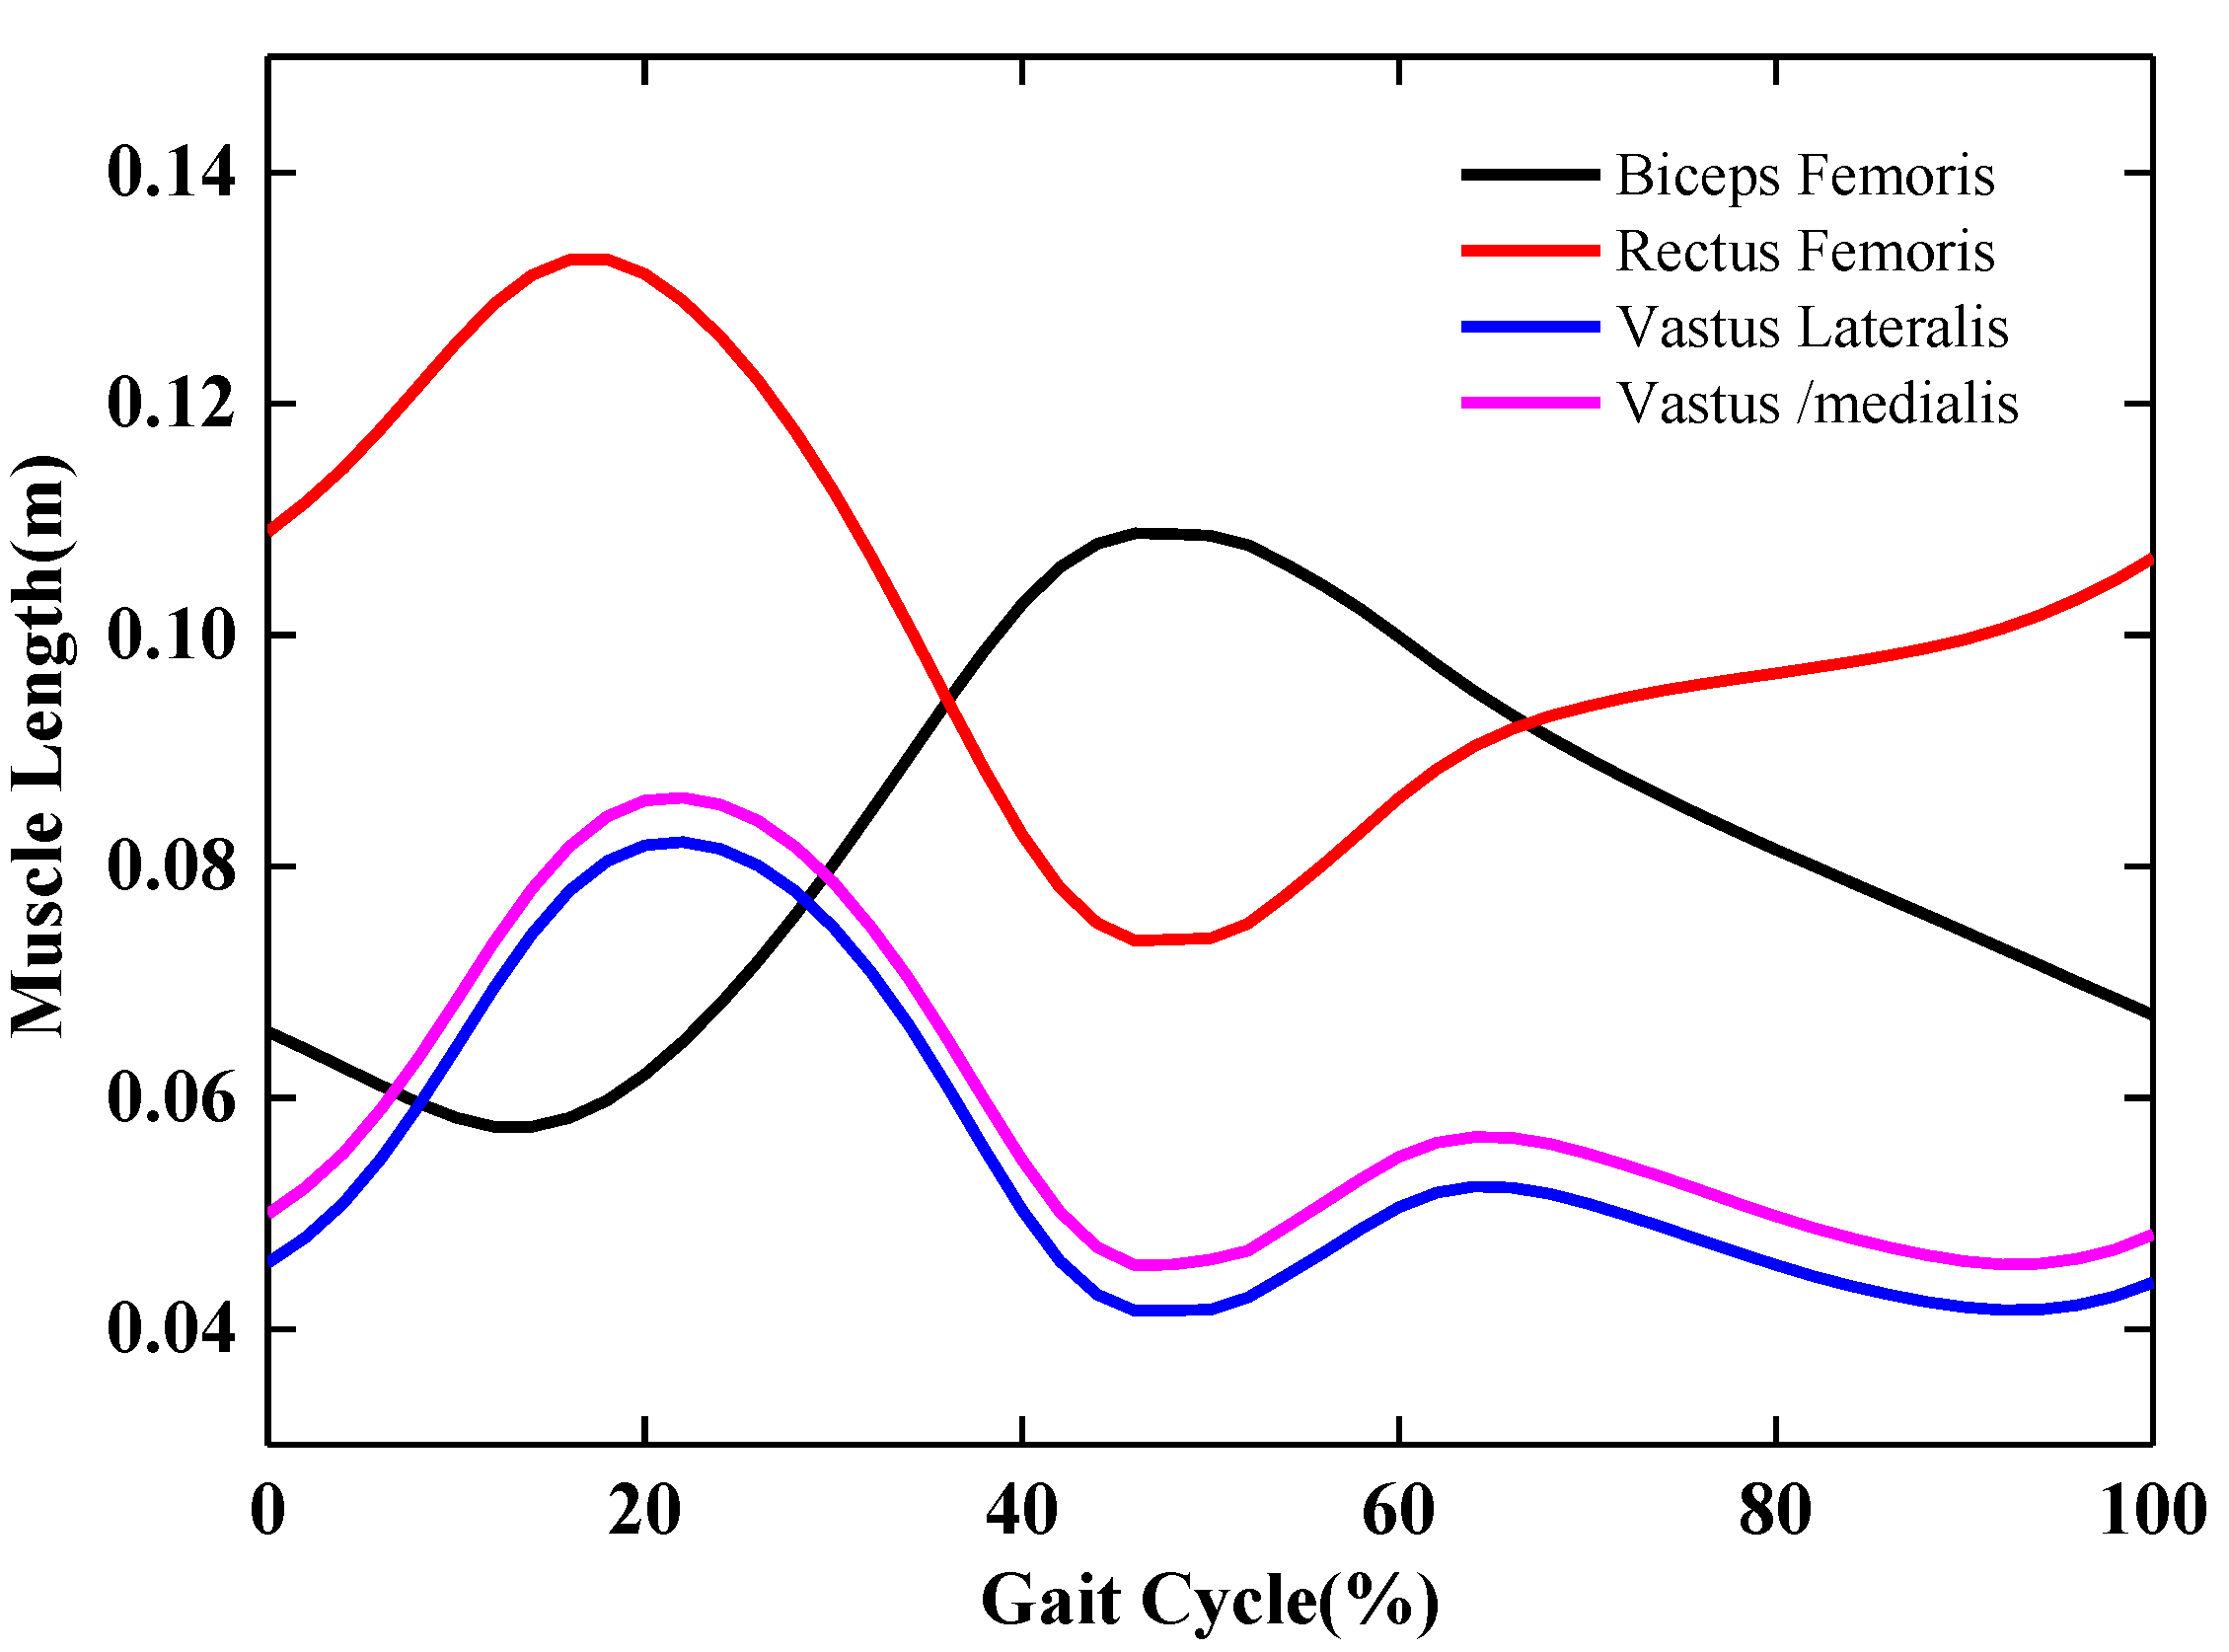
Knee joint is the main joint involved in human walking. As the main load-bearing structure of human movement, it is an important source of gait characteristics [15]. The movement of joints depends on the traction of muscles, and the process of walking is the angle change of hip and knee joints in the sagittal plane. According to the principles of human anatomy and the laws of human kinematics, the muscles related to the angle changes of the hip and knee joint include quadriceps femoris and biceps femoris (gastrocnemius and other auxiliary muscles are not included) [16,17]. Therefore, this article uses OpenSim (a musculoskeletal analysis software) to simulate the changes of muscle fiber length of quadriceps femoris and biceps femoris during a gait cycle. The selected human model gait 2392_Simbody.osim contains 19 bones and 92 muscles of lower limb and trunk models. The results are shown in Figure 1, which simulates the work of 4 muscles in a gait cycle, with an increase in length indicating muscle relaxation and a decrease in length indicating muscle contraction. This indicates that the changes of muscle length of vastus lateralis, rectus femoris, vastus medialis, and vastus intermedius, which make up the quadriceps femoris, are consistent during walking, and they all increase first to reach the first peak and then decrease (the increase in muscle length indicates that the muscle is in a relaxed state, whereas the change of muscle length indicates that the muscle is in a contracted state). Then, another peak appeared at 63% of the gait cycle, but the peak was small. The length change of rectus femoris (red curve) is basically the same as that of the other three muscles of quadriceps femoris before 60% of the gait cycle, but the muscle is in a state of continuous relaxation at 60%–100%. The biceps femoris is located at the back of the thigh and participates in contraction when bending the knee, which is basically opposite to the role of the quadriceps femoris. Therefore, the length change of the biceps femoris (black curve) is also opposite to that of the quadriceps femoris.
Now, this article further quantitatively analyzes the correlation of the above 5 muscles. This study uses the correlation analysis module of statistical analysis in software SPSS. Pearson parameter in SPSS program was selected as correlation coefficient, and two tailed NOSIG was used for significance test. The results are shown in Table 1, in which p value shows significance index, and p > 0.05 indicates that the two variables are uncorrelated and not significant; 0.01 < p < 0.05 was significant, whereas p < 0.01 was extremely significant. R is the correlation coefficient, negative R value indicates negative correlation, and positive R value indicates positive correlation. It illustrates that the significant P values of the 5 muscles are less than 0.01, indicating that there is a very significant change in muscle length. The R value between biceps femoris and quadriceps femoris is negative, the R value between biceps femoris and rectus femoris is the largest, which is −0.932, whereas the R value between lateral, medial, and rectus femoris of quadriceps femoris is 1. This shows that the changes of muscle length are consistent. According to the relevant knowledge of human lower limb medicine, joint movement depends on muscle contraction, and muscle contraction depends on muscle EMG signal feedback [17]. Therefore, studying the correlation between muscle and joint angle can determine the muscles related to knee movement. However, multi-dimensional EMG signals will lead to information redundancy and increase the burden of classifiers based on the relevant literature of pattern recognition [18]. Simultaneously, its surface EMG signal cannot be measured effectively because the femoral intermediate muscle belongs to deep muscle [17]. Therefore, the rectus femoris muscle in the front and the biceps femoris muscle in the back of the thigh are selected as the research objects to collect muscle EMG signals in this article.
2.2. EMG Signal Acquisition and Noise Reduction
We selected 10 healthy students (5 males and 5 females) in this experiment, which had no motor dysfunction or congenital diseases. Before the test, let experimenters have enough rest for 48 h, remove their hair on the test muscle surface, wipe the muscle surface with an alcohol cotton ball, stick the positive and negative electrode patches of the EMG sensor firmly along the long axis of the biceps femoris and rectus femoris, and place the reference electrode in the tensor fascia lata bundle. The EMG signal acquisition equipment is IWorx-BIO8, which is 8 channel EMG signal collector. The upper computer adopts LabScribe integrated software, which can be output directly in .csv format file for classification algorithm recognition. According to the motion pattern of human walking, a timer is used to ensure that 5 actions are completed within 2 s to ensure the synchronization of data sampling. Each movement was collected for 10 cycles independently. In order to let the experimenter’s muscles rest fully, the experimenter rested for 10 min between the test groups each time.
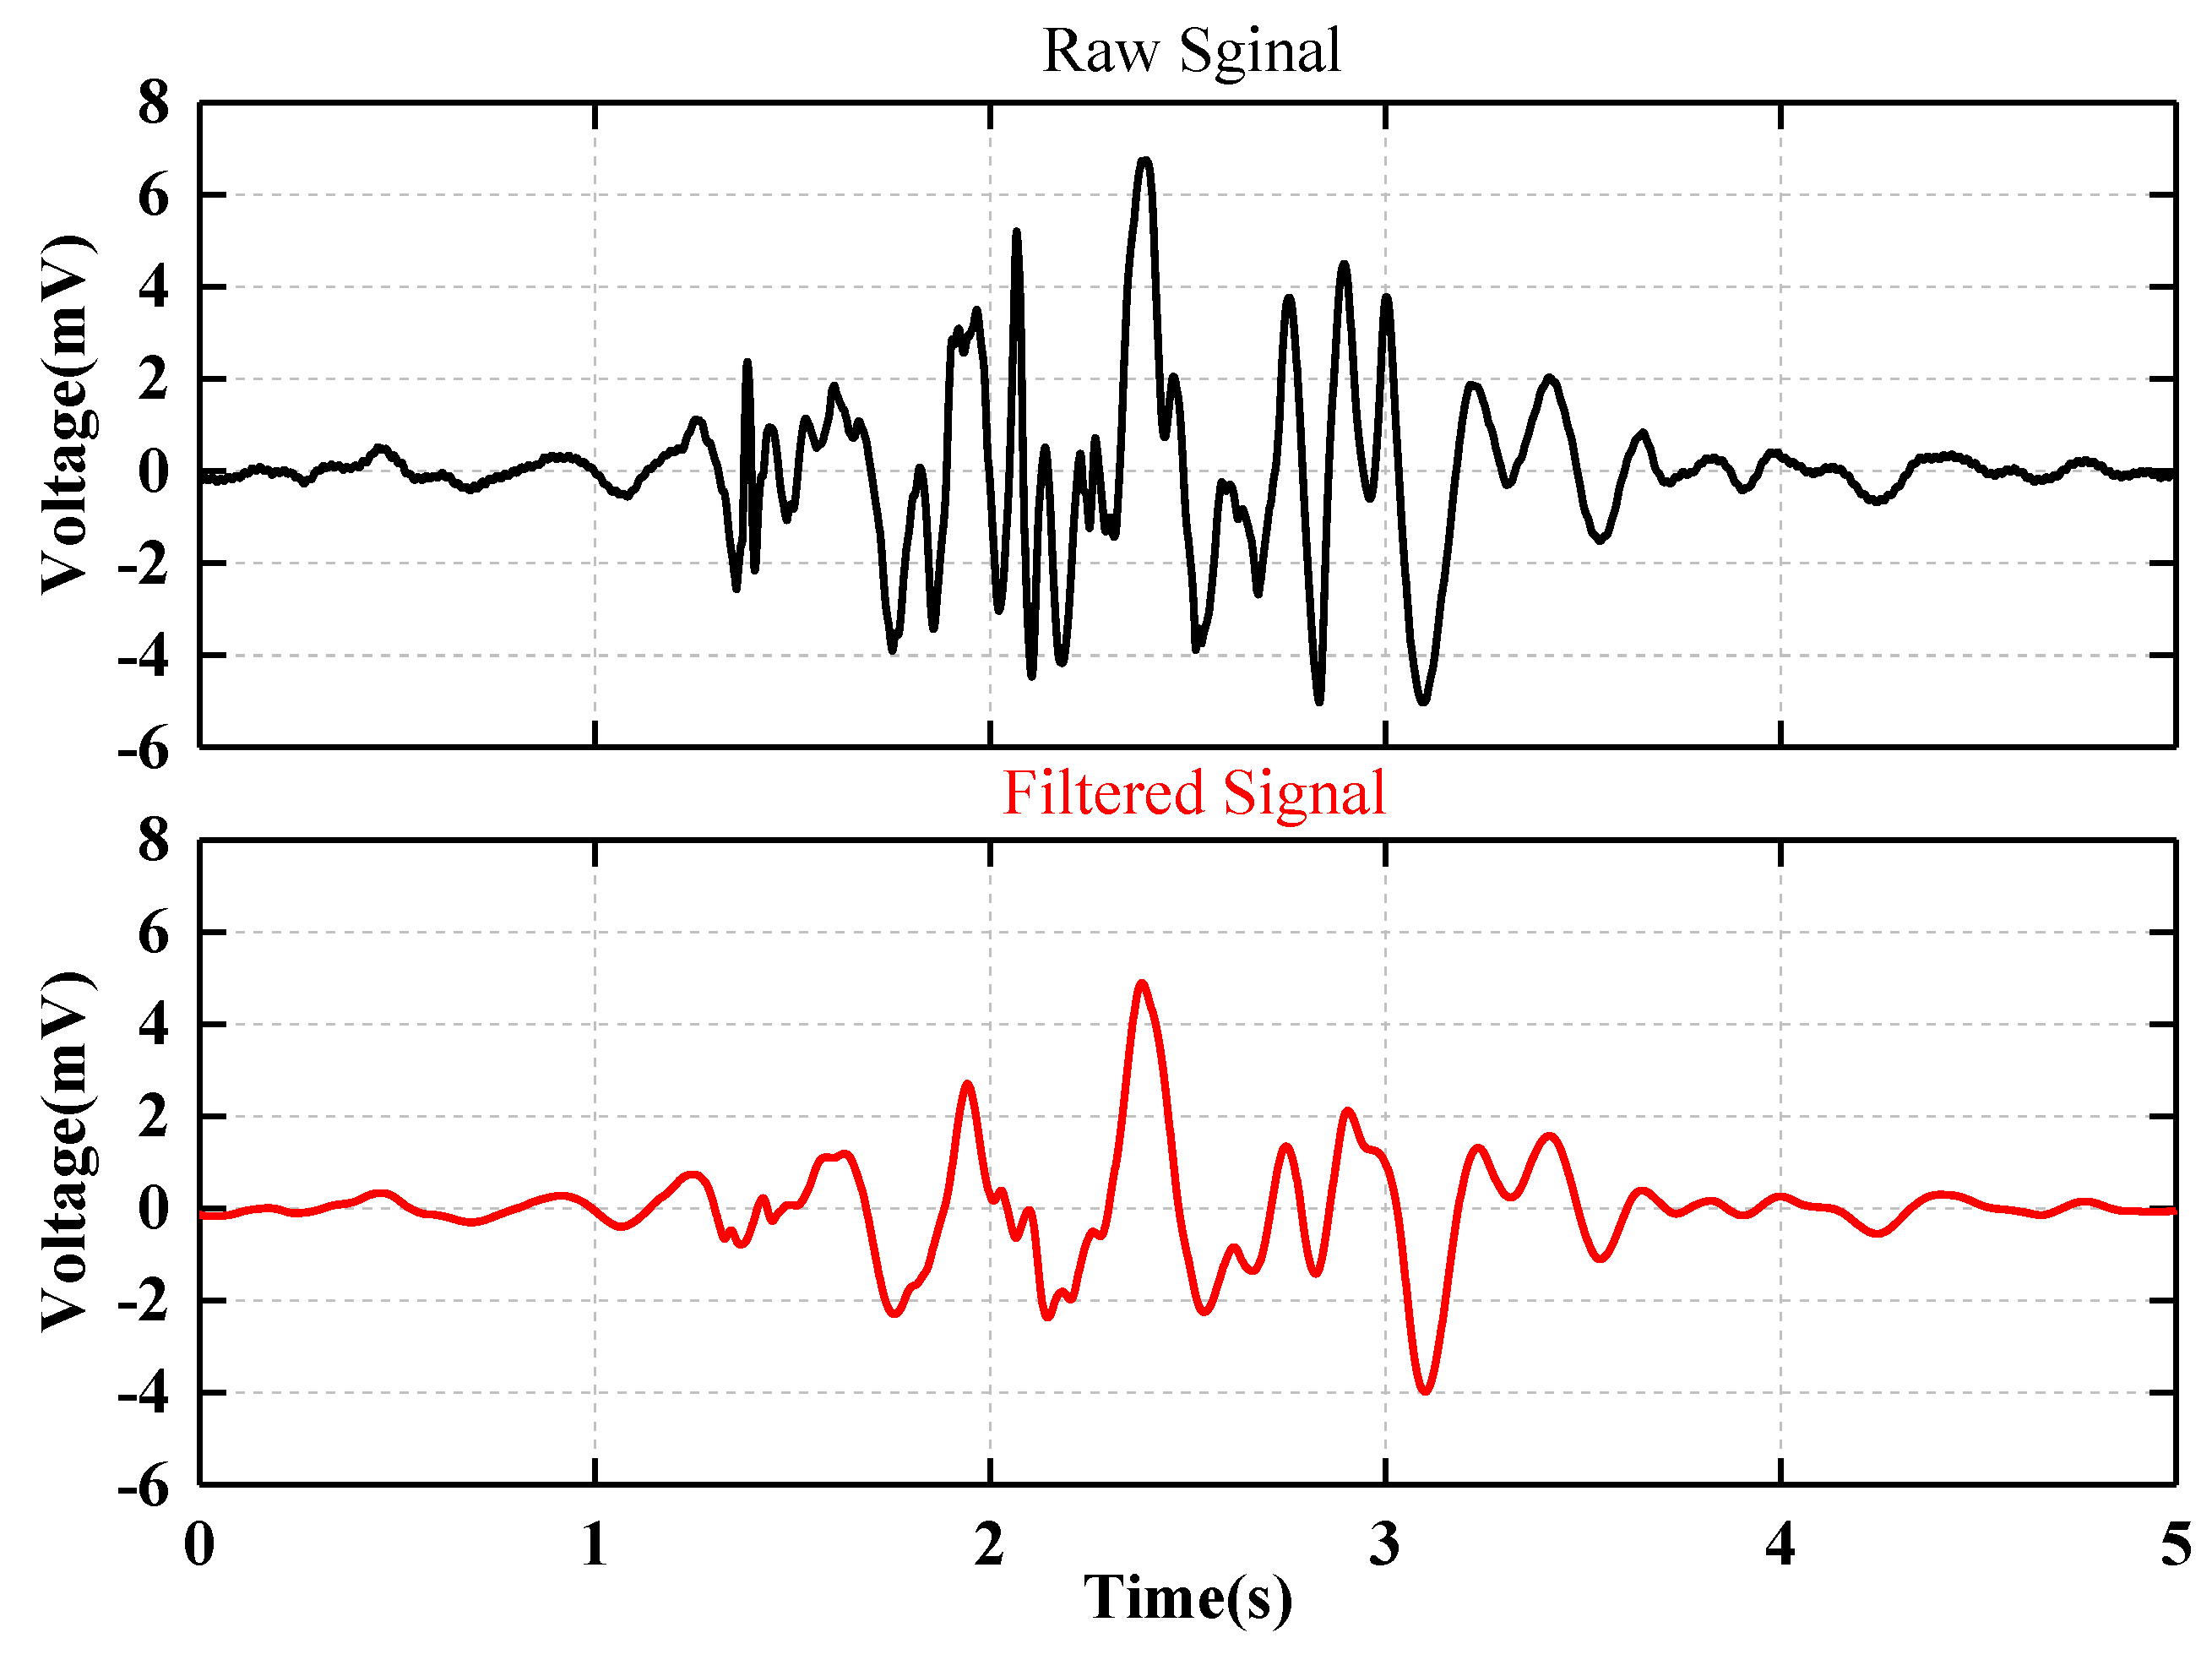
Primitive EMG signal is a weak neural signal, which can characterize the movement of limbs to a certain extent [17]. In the process of limb movement, it is a non-stationary signal in shape and doped with a variety of noise (white noise, baseline offset, and power frequency interference) [17]. According to the characteristics of EMG signal and noise, Butterworth band-pass filter is used in this article to filter signals other than 20–500 Hz, and the passband cut-off frequency is set to 500 Hz and the stopband cut-off frequency is set to 600 Hz; Butterworth notch filter is used to filter 50 Hz frequency to eliminate power frequency interference, and the signal is passed through high pass filter (cut-off frequency 51 Hz) and low-pass filter (cut-off frequency 49 Hz), respectively. Then, the elliptical filter is used to improve the baseline drift of the signal. The window length of the elliptical filter is 100 ms, the attenuation coefficient beta set as 100, and the passband ripple devel set as 0.005. The filtering results are shown in Figure 2 below. The black curve above is the original EMG signal collected by experiment, and the red curve is the filtered signal of the following. It clarifies that the filtering algorithm retains the characteristics of the signal and removes most noise.
2.3. Feature Extraction for Weak Classification—Muscle Neural Activation
The neural dynamic model of EMG signal is defined as the nerve convulsion generated by action potential. There are many criteria for evaluating nerve activity (iEMG, RMS, VAR, et al.) [18]. The sliding standard deviation is used to evaluate nerve activity in this article. Setting the length of the collected original EMG signal sequence as n and the length of the time window as N (). The window is slid backward after calculating the standard deviation of the signal in a long time (the method is shown in Formulas (1) and (2)). The neural activation sequence of the original EMG signal will be obtained after successive calculation.
where is the original EMG value, is the integrated EMG, and u is the nerve activation. In order to eliminate the individual differences of the experimenters, the resting EMG signal x0 of each experimenter’s test muscle in the natural state is recorded as the neural activity value u0 of the muscle in the resting state. Muscle neural activation is the response of muscle to nerve electrical stimulation. The relationship between muscle neural activation a and nerve activation u in the literature is shown in Formula (3) [19]:
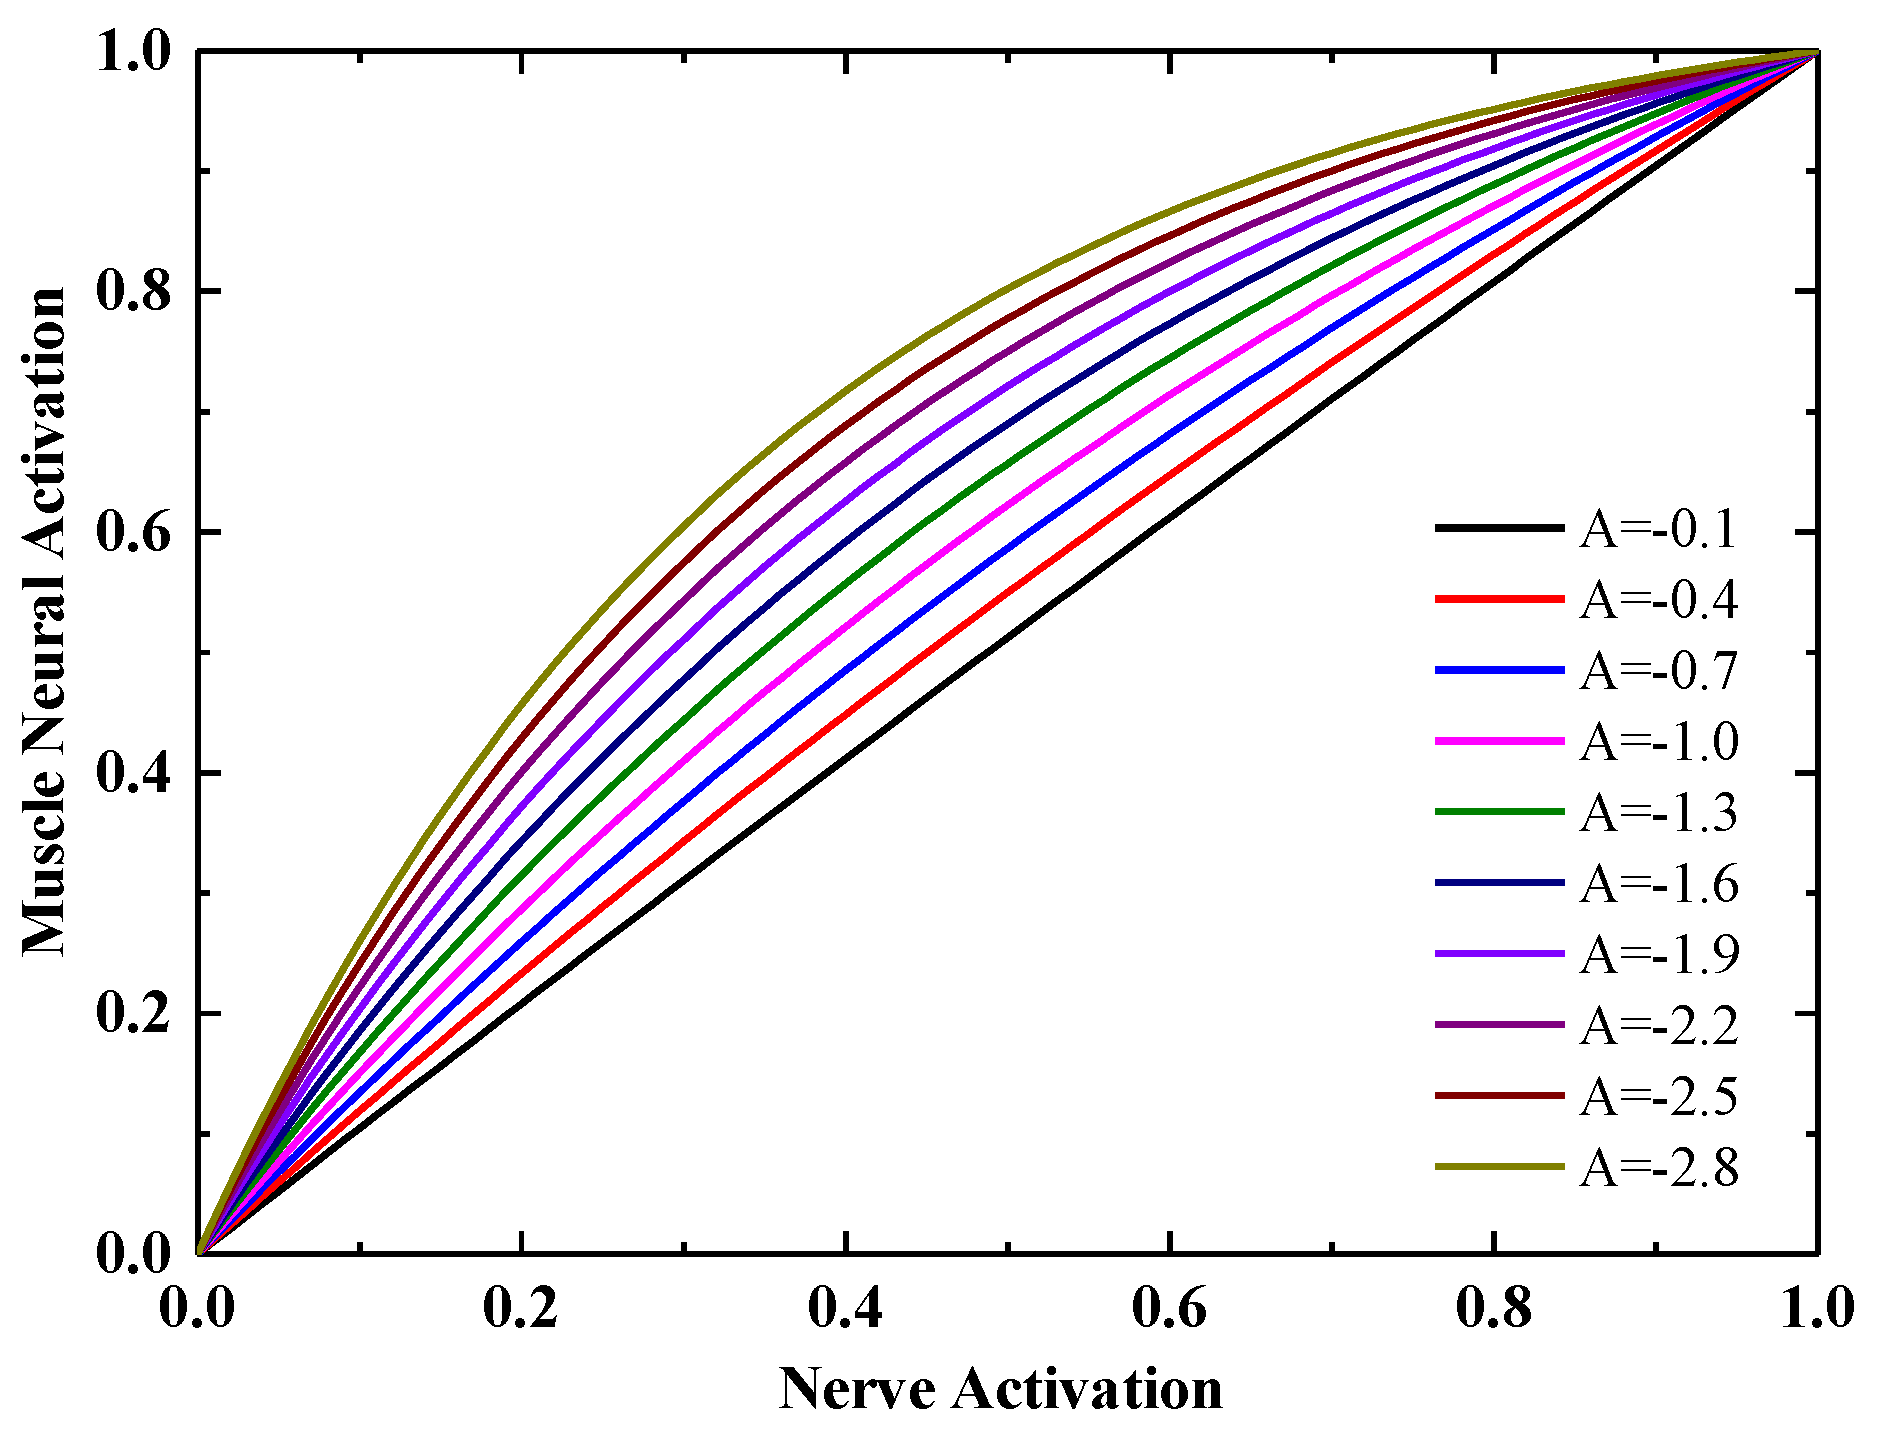
where A is a constant, indicating the degree of nonlinearity, and the value range is −3~0. The following Figure 3 shows the relationship curve between muscle activity and nerve activity under the influence of different constants A. It shows that muscle activity is positively correlated with nerve activity. The smaller A is, the more obvious the linear relationship between muscle activity and nerve activity. Muscle neural activation will not change too much during the surge of nerve activity, which ensures the smoothness of muscle strength eigenvalues. Taking the EMG signal of a thigh raising cycle as an example, Figure 4 compares the difference between the original EMG signal of biceps femoris (after filtering) and its muscle neural activation (A is taken as −0.2). It illustrates that the calculated EMG signal retains the characteristics of the original EMG signal, further filters the signal, and increases the recognizability of the signal. This also shows that EMG signals can reflect the strength of neural signals.
2.4. Design of BP_AdaBoost Classifier
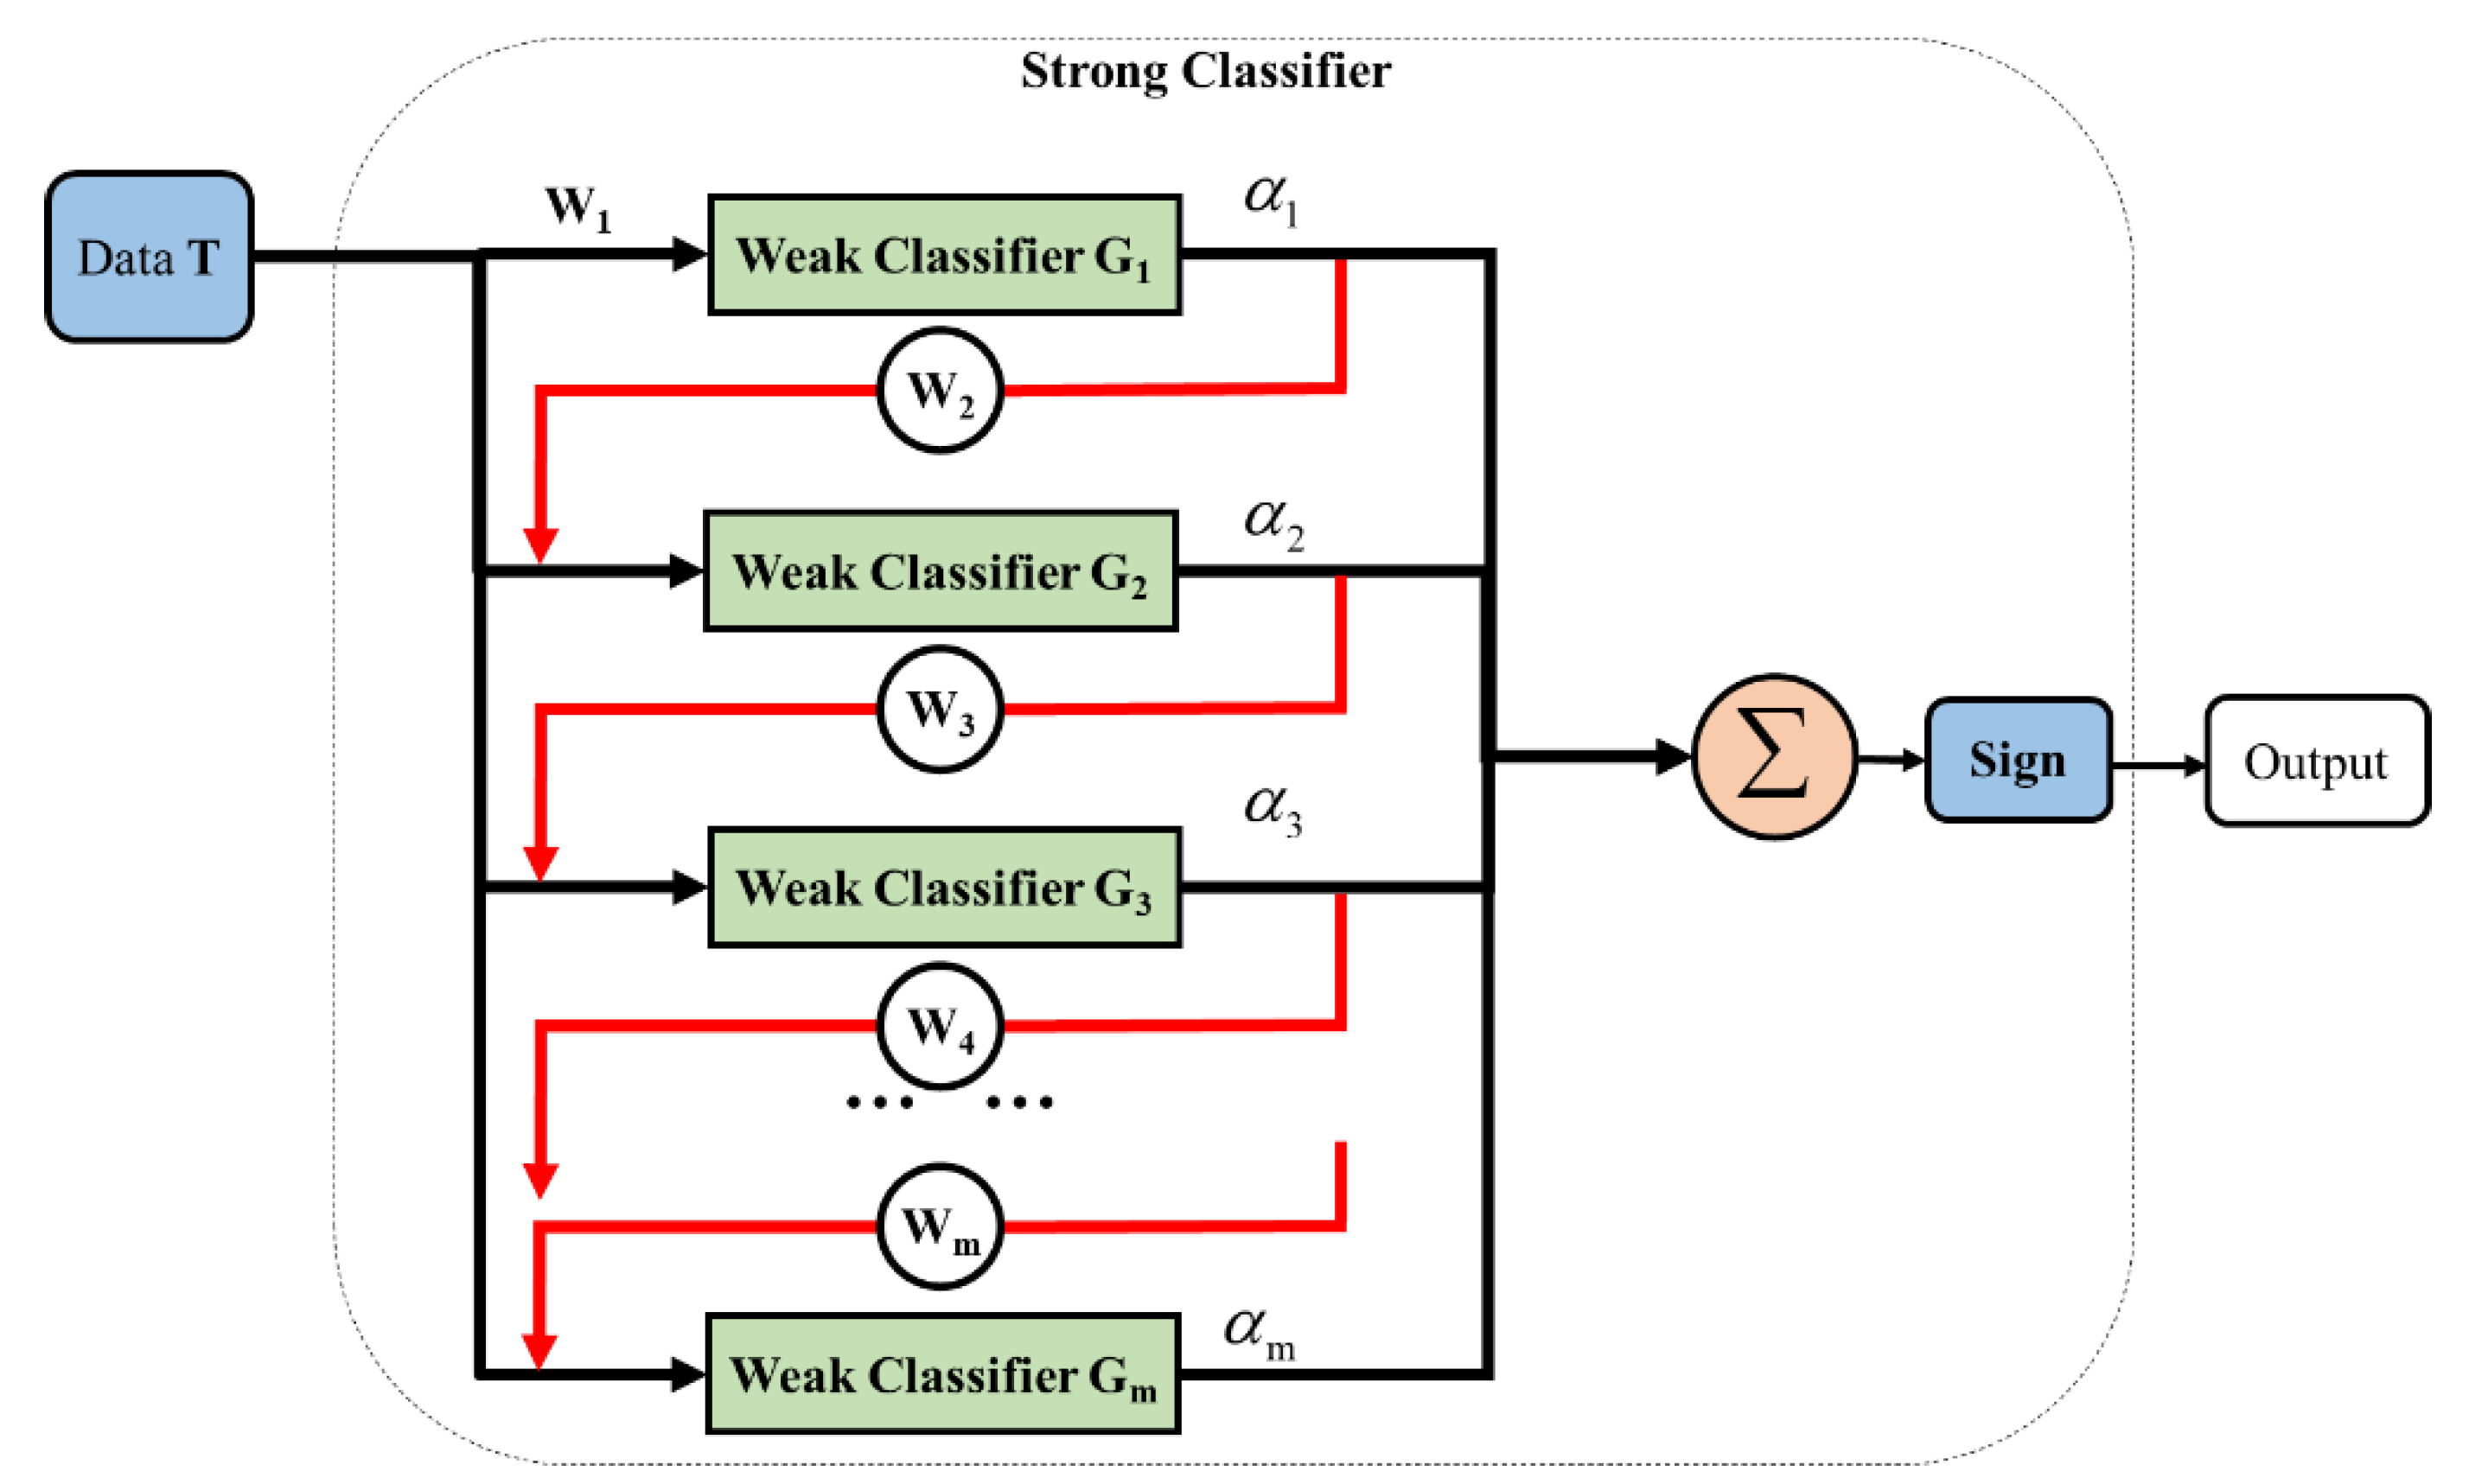
The basic concept of AdaBoost algorithm is that the initial weight w1 is assigned to the data set T (the initial weights w1 are usually the uniform distribution); then, the weak classifier G1 is bestowed to classify the data set T and the weight of this classifier at the time of final result voting is calculated as . Secondly, the weight w through the error of the weak classifier is adjusted and given to data set T again. The voting weight is recalculated. After training m weak classifiers in turn, output m classifiers with sign function [20]. The basic process of AdaBoost is as follows in Figure 5.
Setting the training data set as:
where , . x is the muscle neural activation of EMG signal and y is the object to be classified. The weight distribution of initialization training data is uniform [20]:
where . n is the length of training set data. Furthermore, let M = 1, 2, 3 … m represent the number of weak classifiers. The weak classifier is obtained by using the training data set with weight distribution [20]:
Calculate the classification error rate of on the training data set:
where .
Calculate the weight coefficient of at the final vote [20]:
The logarithm here represents the natural logarithm. Then, the weight distribution of the training data set is updated by the following formula:
Update rule is:
where Zm is the normalization factor.
It makes the weight Dm+1 of m + 1 a probability distribution. Therefore, a linear combination of weak classifiers is constructed:
The final strong classifier is obtained. The output result of the input signal after passing through the strong classifier is voted according to the sign function:
The optimization method of BP neural network classification algorithm is gradient descent method. When encountering complex objective function, its learning speed and convergence speed will become very slow, causing the objective to reach a local minimum and eventually lead to training failure [21]. Therefore, in order to improve the recognition rate of BP neural network algorithm, this article designs BP_AdaBoost reinforcement learning algorithm with BP neural network as weak classifier. Simultaneously, it solves the single binary classification function when the decision tree is used as the weak classifier in the classical AdaBoost algorithm [21].
3. Results and Discussion
3.1. Movement Classification Based on BP_Adaboost
To make the movement separable, this study selects five movements related to knee movement, but the movement modes are different. The similarity of the five movements is that the movement process involves the flexion and extension of knee joint, and the difference is that the muscle force generation modes are different in the movement process. Simultaneously, the feasibility of using the EMG signal as the recognition input and the performance of classifier can be verified. The details are as follows:
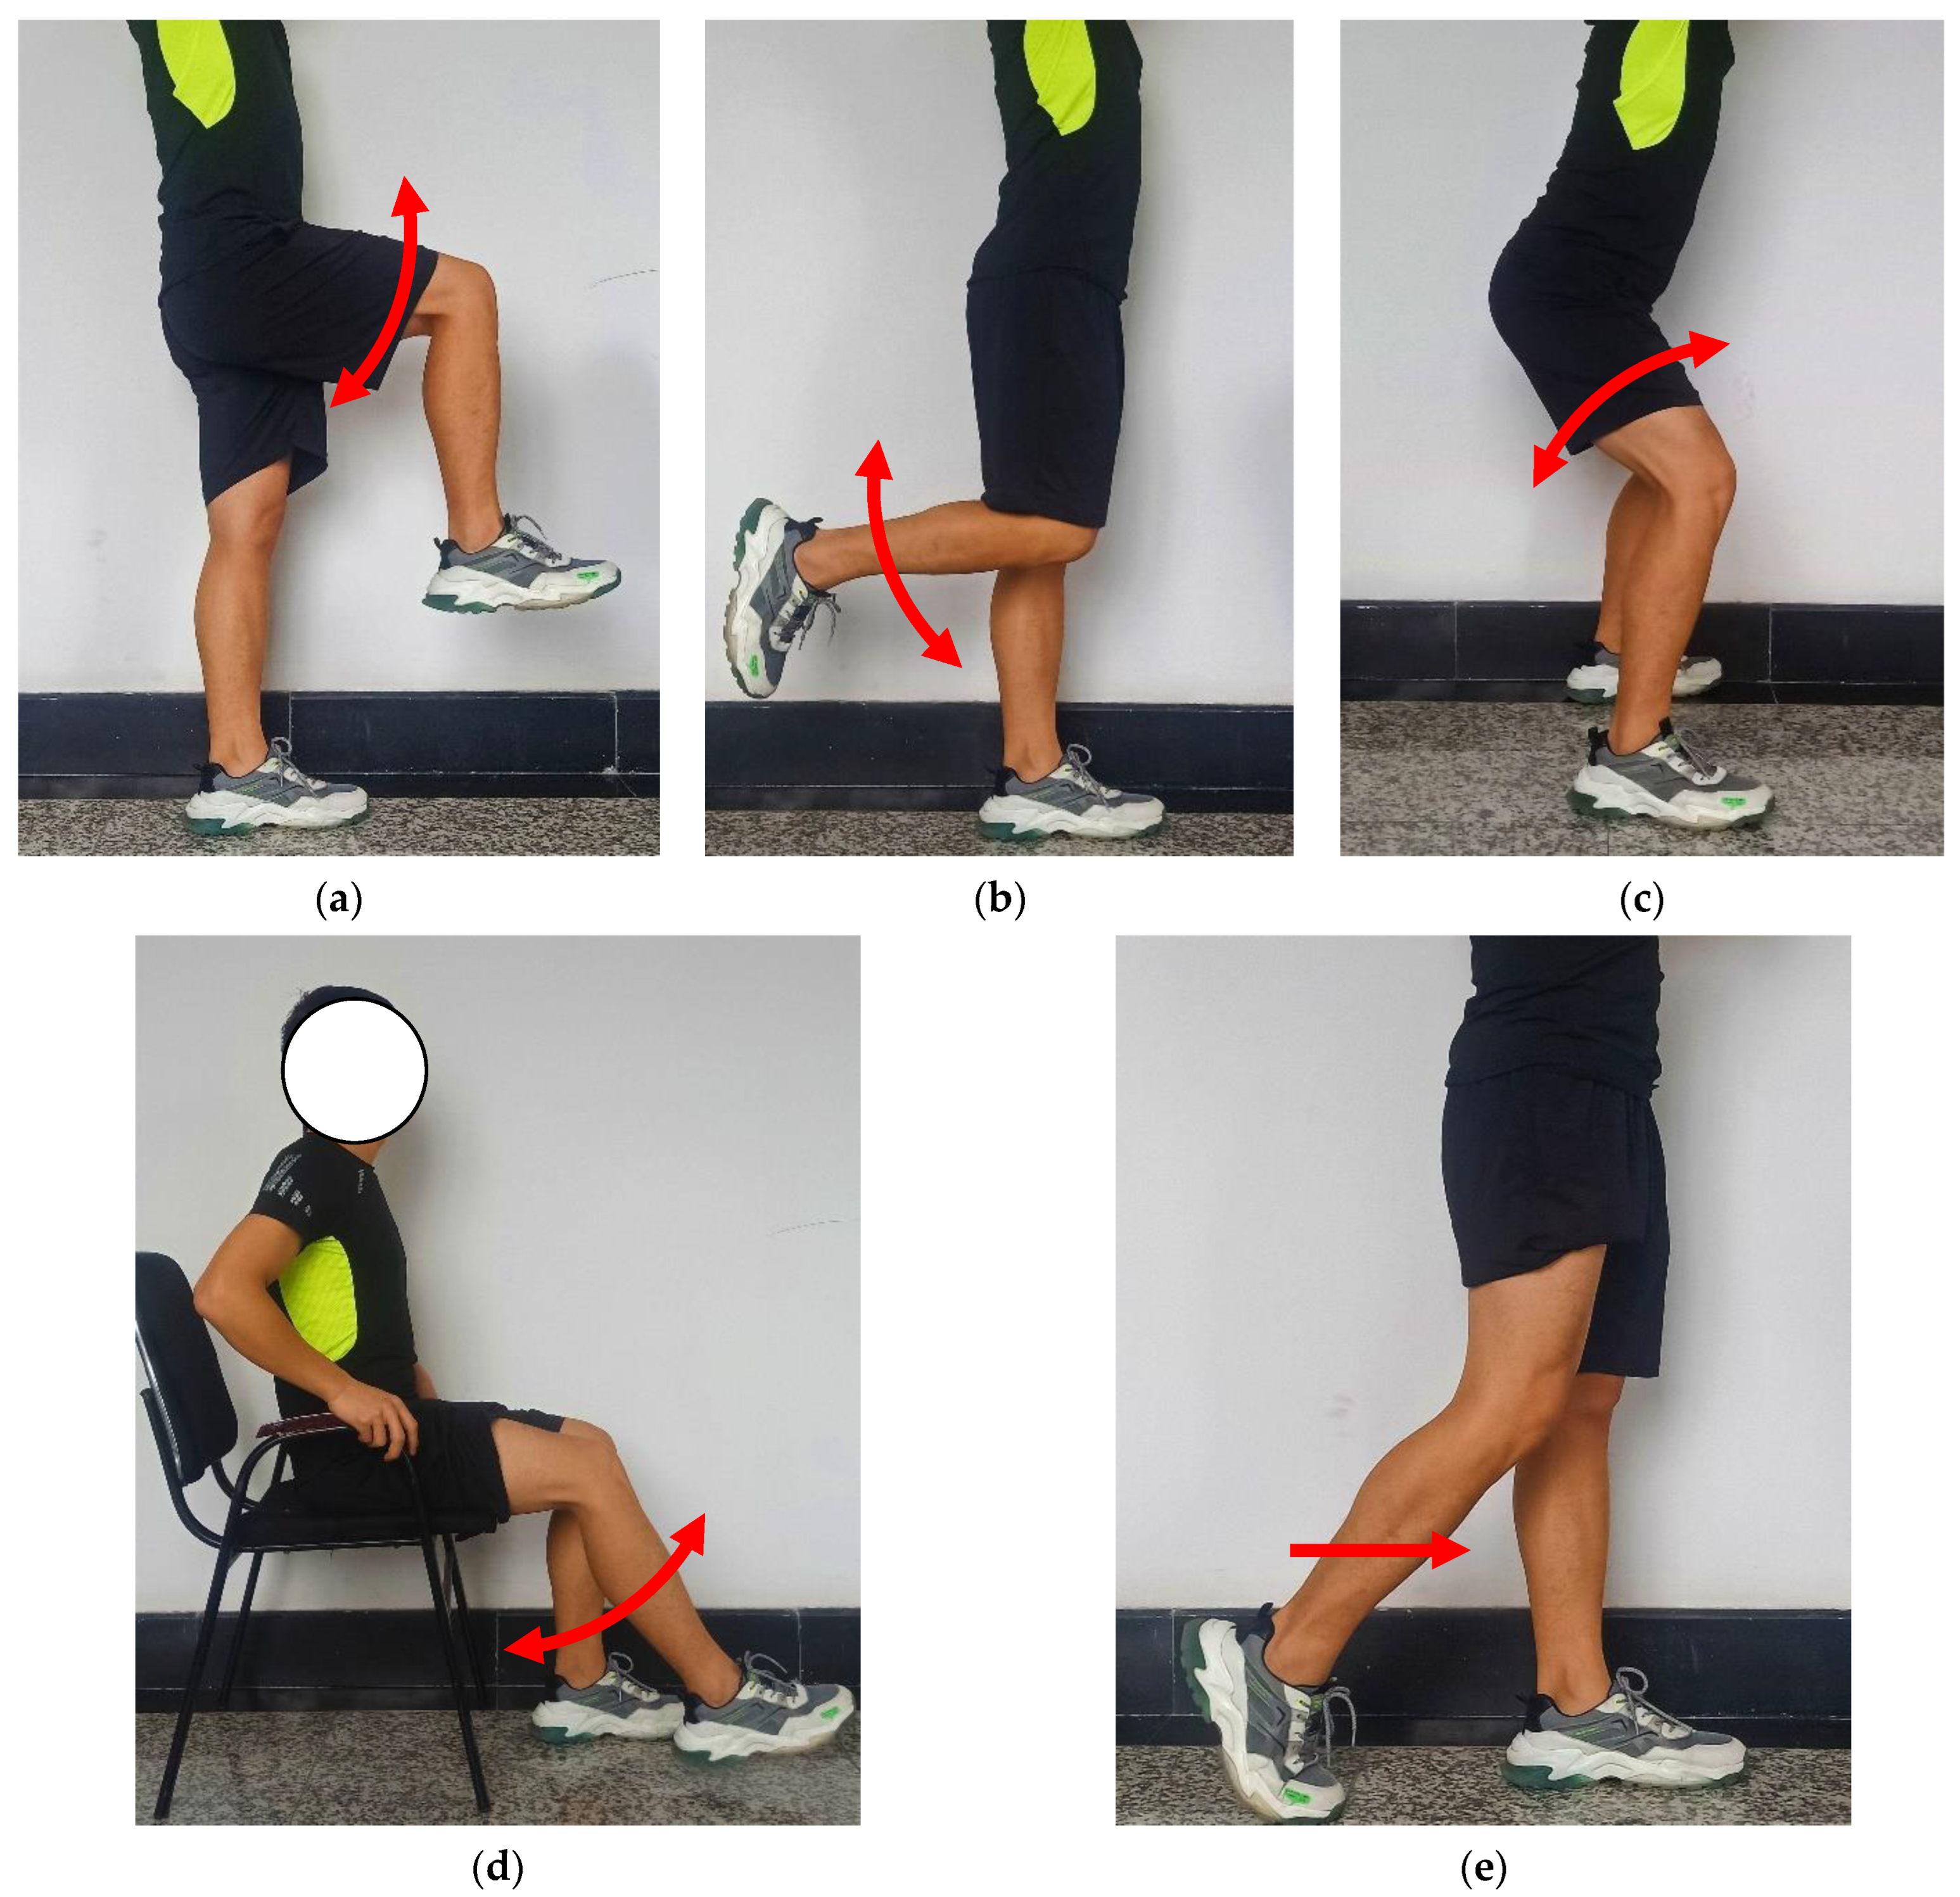
Thigh-raising: In this action, the thigh rises forward and the calf follows naturally. It mainly depends on the strength of the rectus femoris in the front of the thigh to complete the knee bending action. The body’s gravity tends to support the legs (Figure 6a).
Calf-raising: Keeping the thigh still and lifting the calf backward. The knee bending action is mainly completed by the strength of the biceps femoris and calf muscle. The gravity of the human body is biased to supporting the leg (Figure 6b).
Squatting: In this action, the feet are the same width as the shoulder, the lower leg remains motionless, the thigh bends counterclockwise around the knee joint, and the center of gravity of the human body changes up and down. The muscles of the thigh and calf participate in the squat action (Figure 6c).
Knee Bending on Chair: The tester sits on the chair, keeps the test legs and thighs still, and swings the lower legs back and forth to complete the knee bending action. The characteristic of this action is that the lower limb muscles do not need to support the body’s own weight (Figure 6d).
Walking: Walking is a continuous process of knee flexion and extension. This study starts with bipedal standing, starts with the forward step of the test leg, follows up to the other leg, and finally completes the bipedal standing again as a complete gait cycle. During the movement, the center of gravity swings up and down in a small range (Figure 6e).
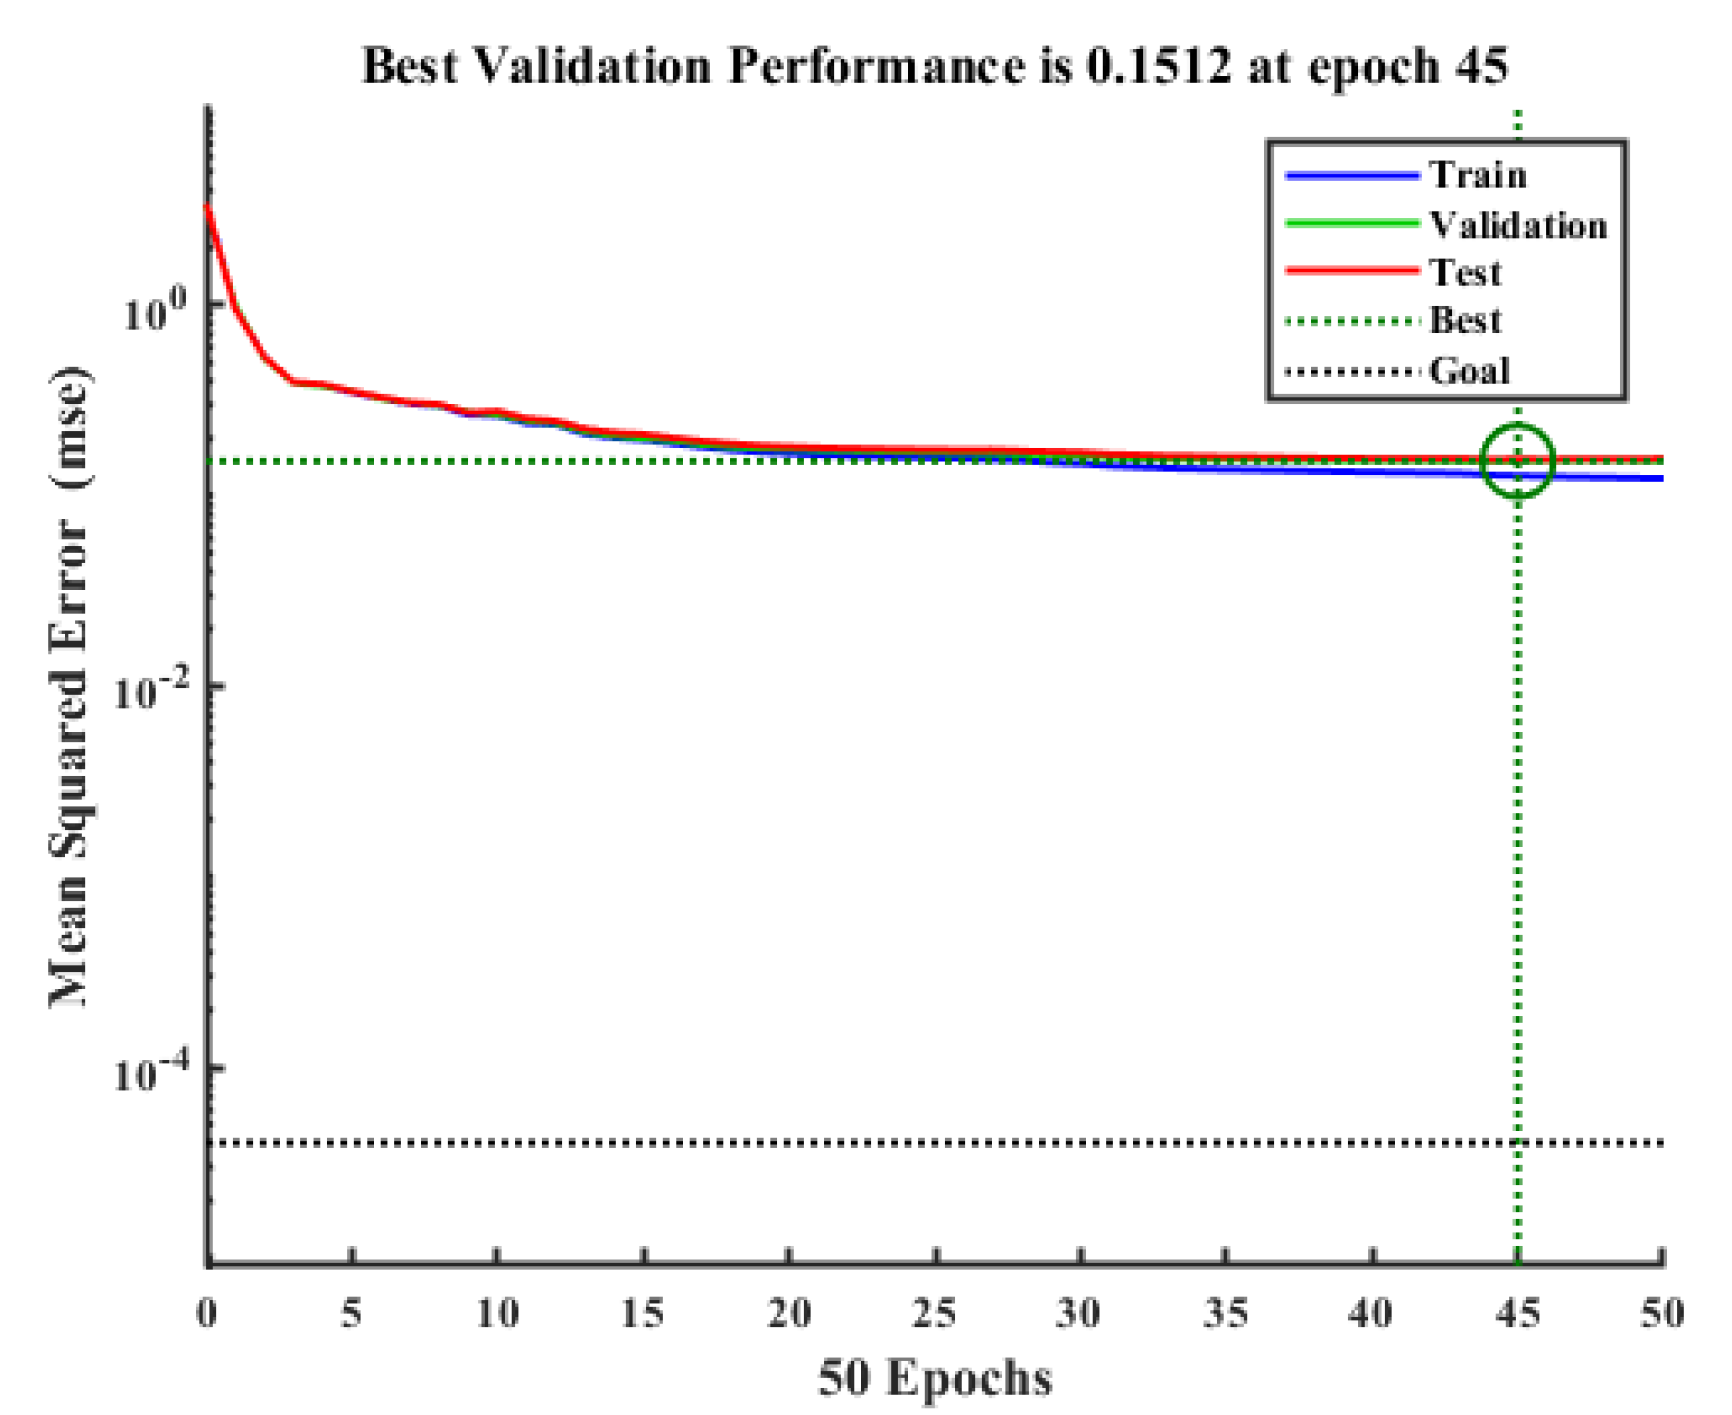
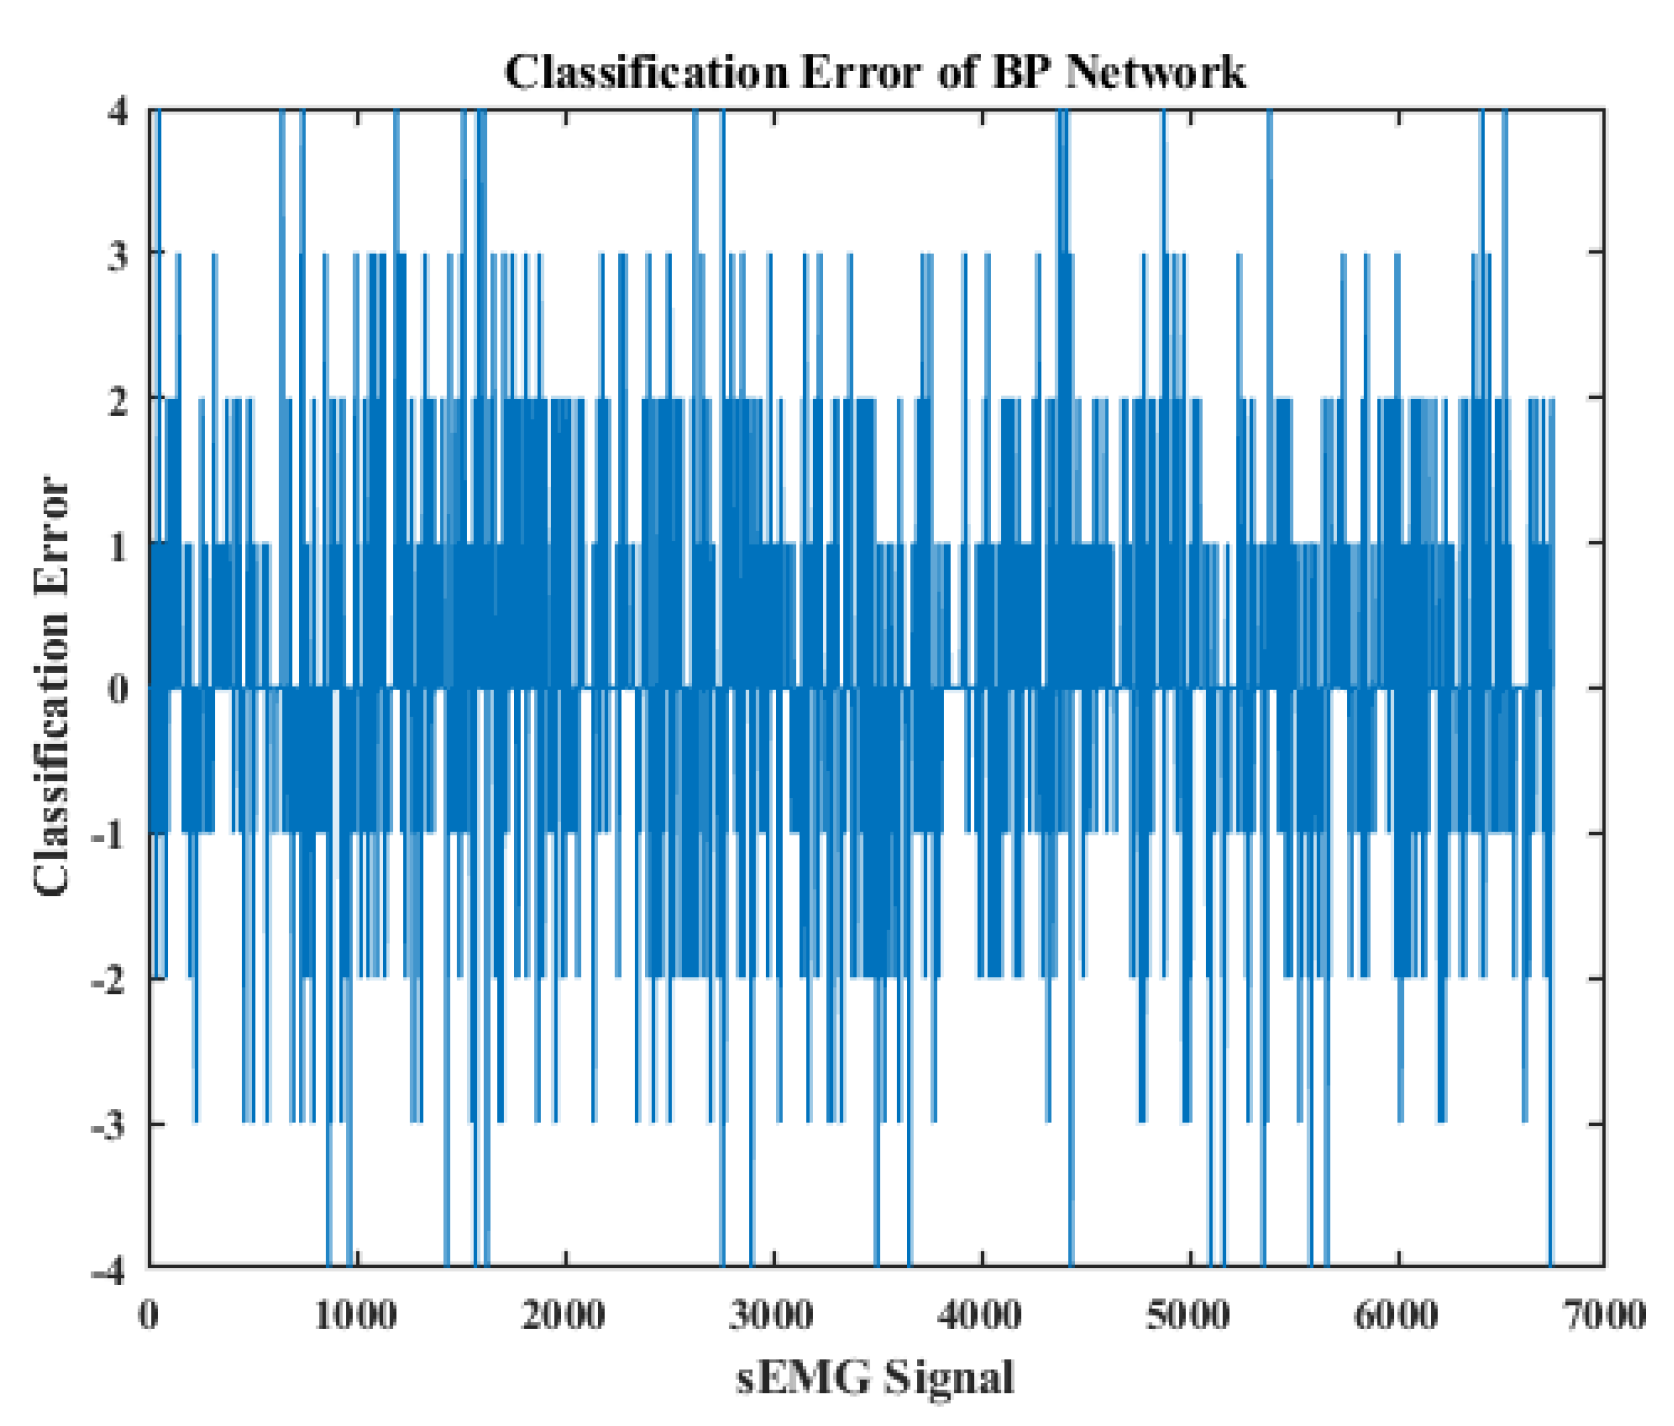
The BP neural network is set as a single hidden layer structure, including an input layer (two nodes, i.e., two muscle activity eigenvalues of two muscles), a hidden layer (including five nodes), and an output layer (including five nodes, i.e., five actions). The learning rate is 0.1, the epoch is 50, and the convergence error is 0.00004; 5 actions are categorized into 1, 2, 3, 4, and 5, respectively. The sampling frequency of the EMG signal is 2000 Hz and 2 s is a movement cycle. Therefore, the 10-cycle signal of each action has 40,000 data points and the size of the total data set is 200,000. We take 70% as the training set, 15% as the verification set, and 15% as the testing set in order to compare the classification effects of BP and BP_AdaBoost. Figure 7 shows the training results by the BP neural network. The best validation performance is 0.1512 at epoch 45. The number of iterations is 45. Figure 8 shows the classification error of five actions. Zero on the vertical axis indicates that the classification is correct. The recognition rates of five actions by the BP neural network classification are 80.2%, 71.9%, 74.9%, 79.3%, and 87.8%, respectively. The average recognition rate is 78.82%.
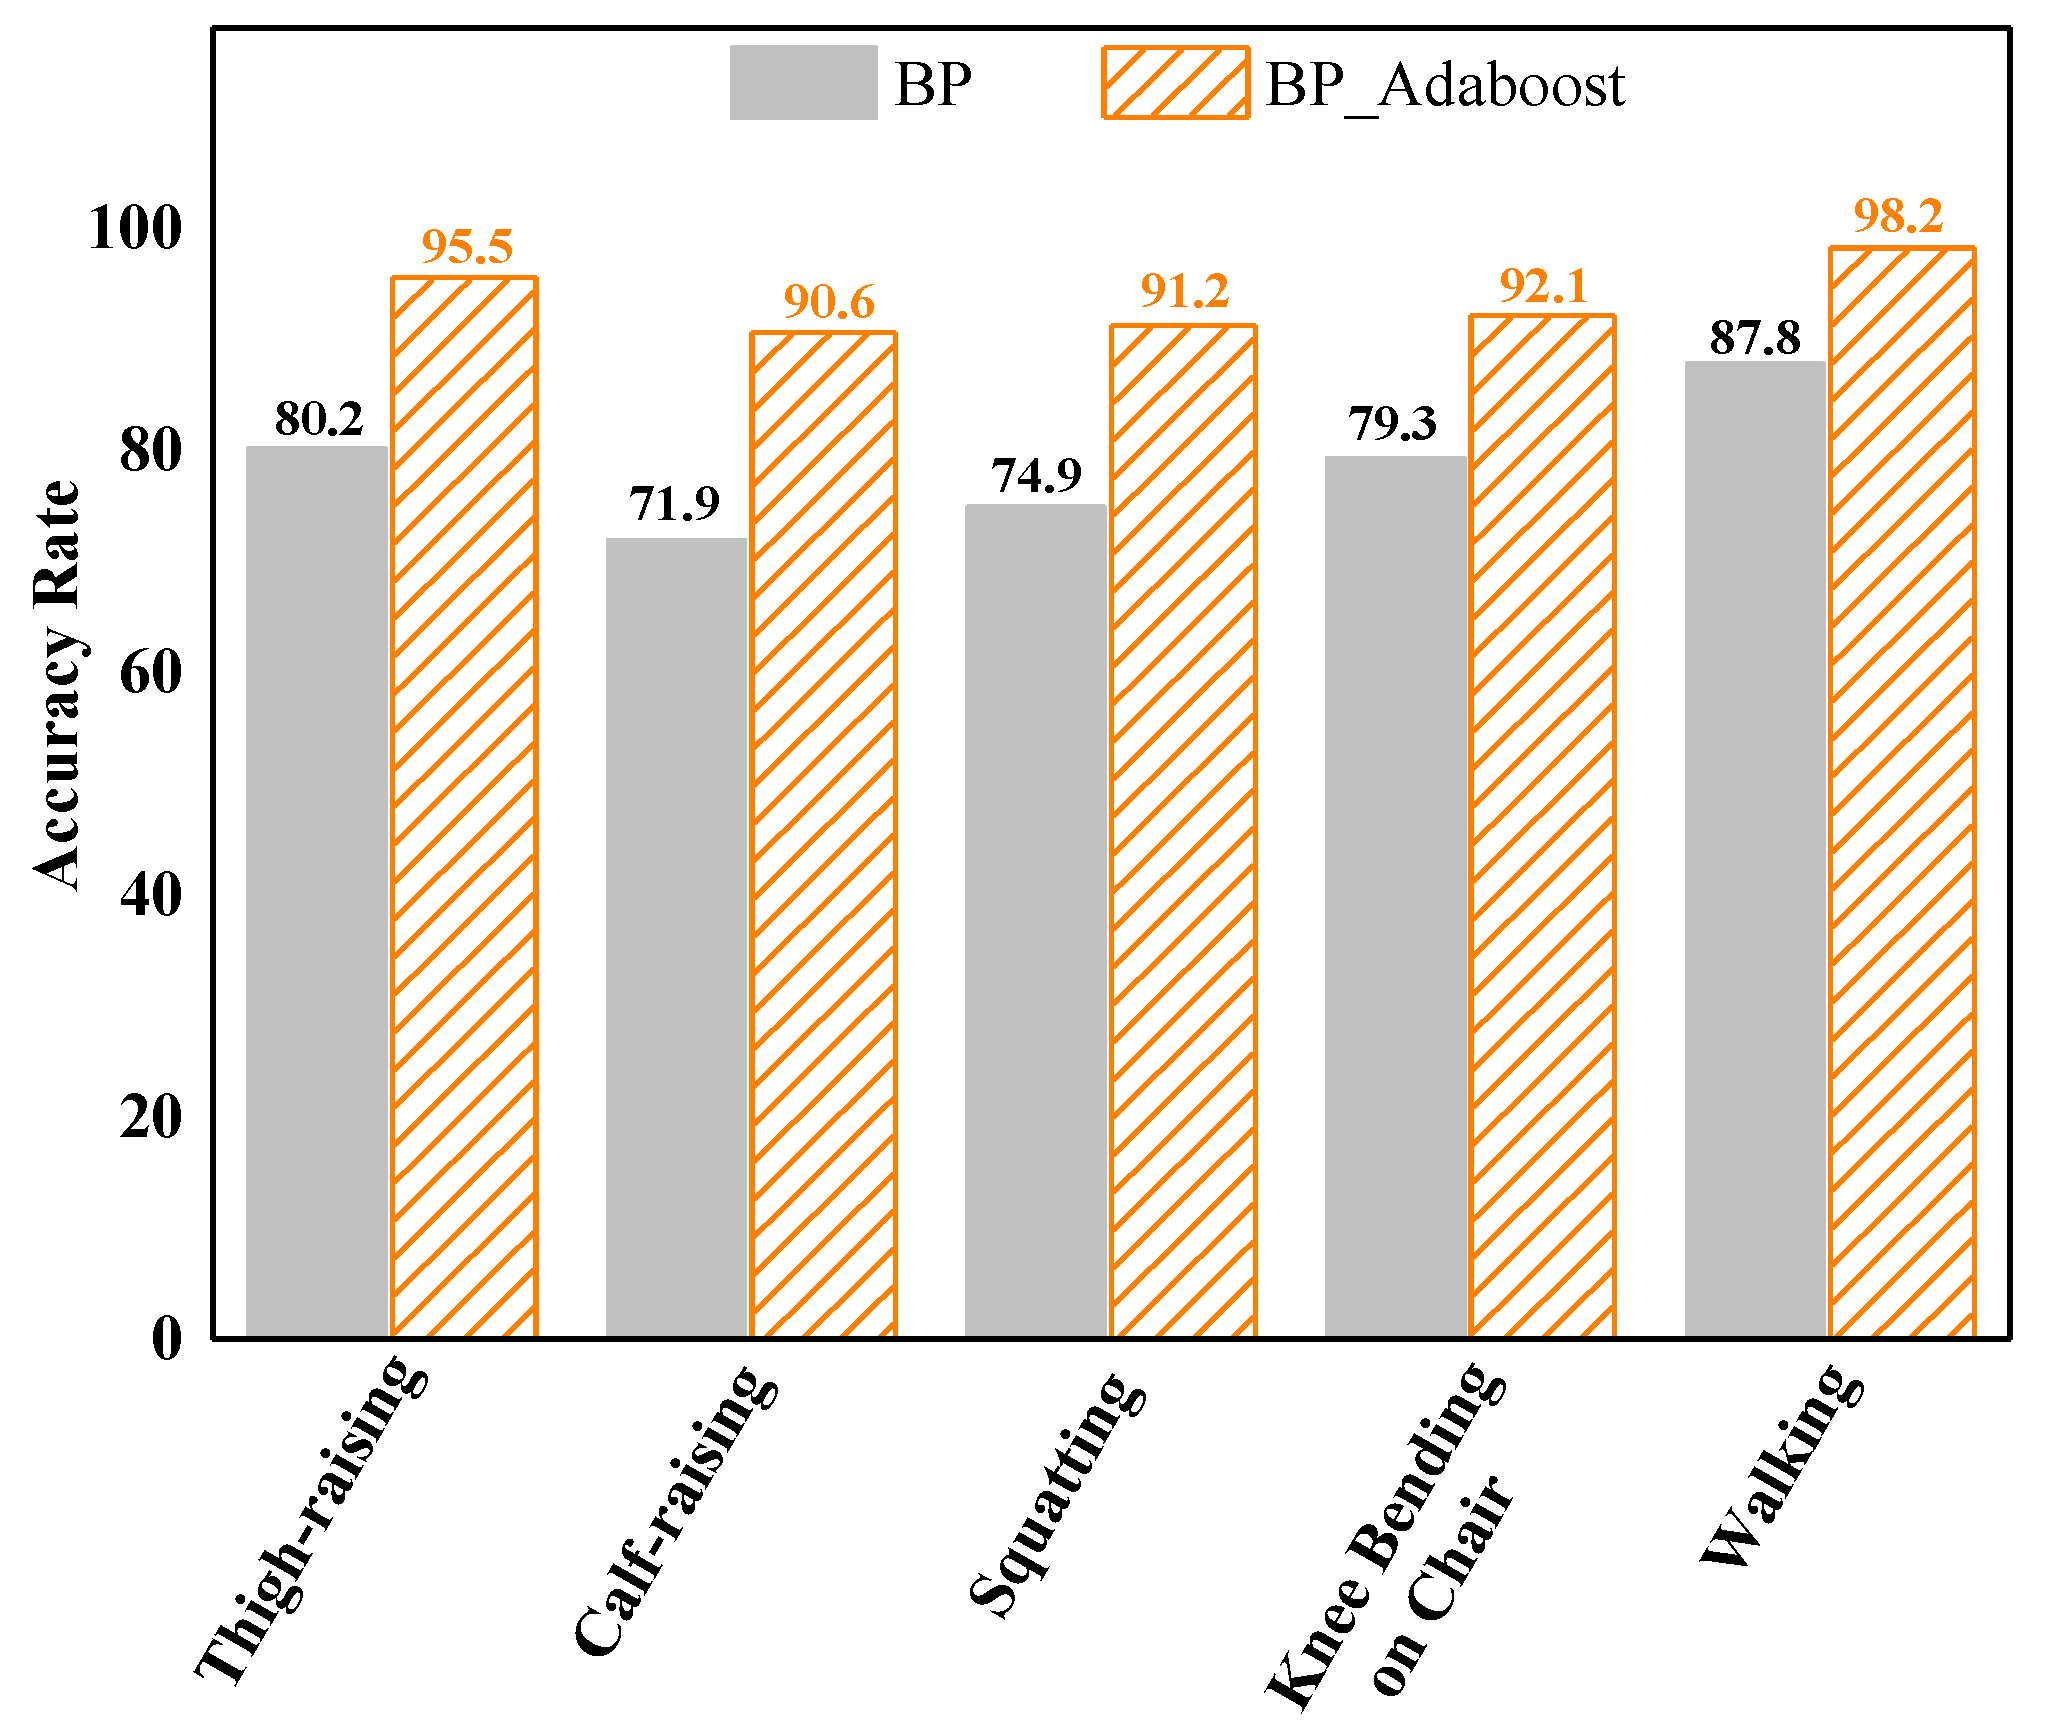
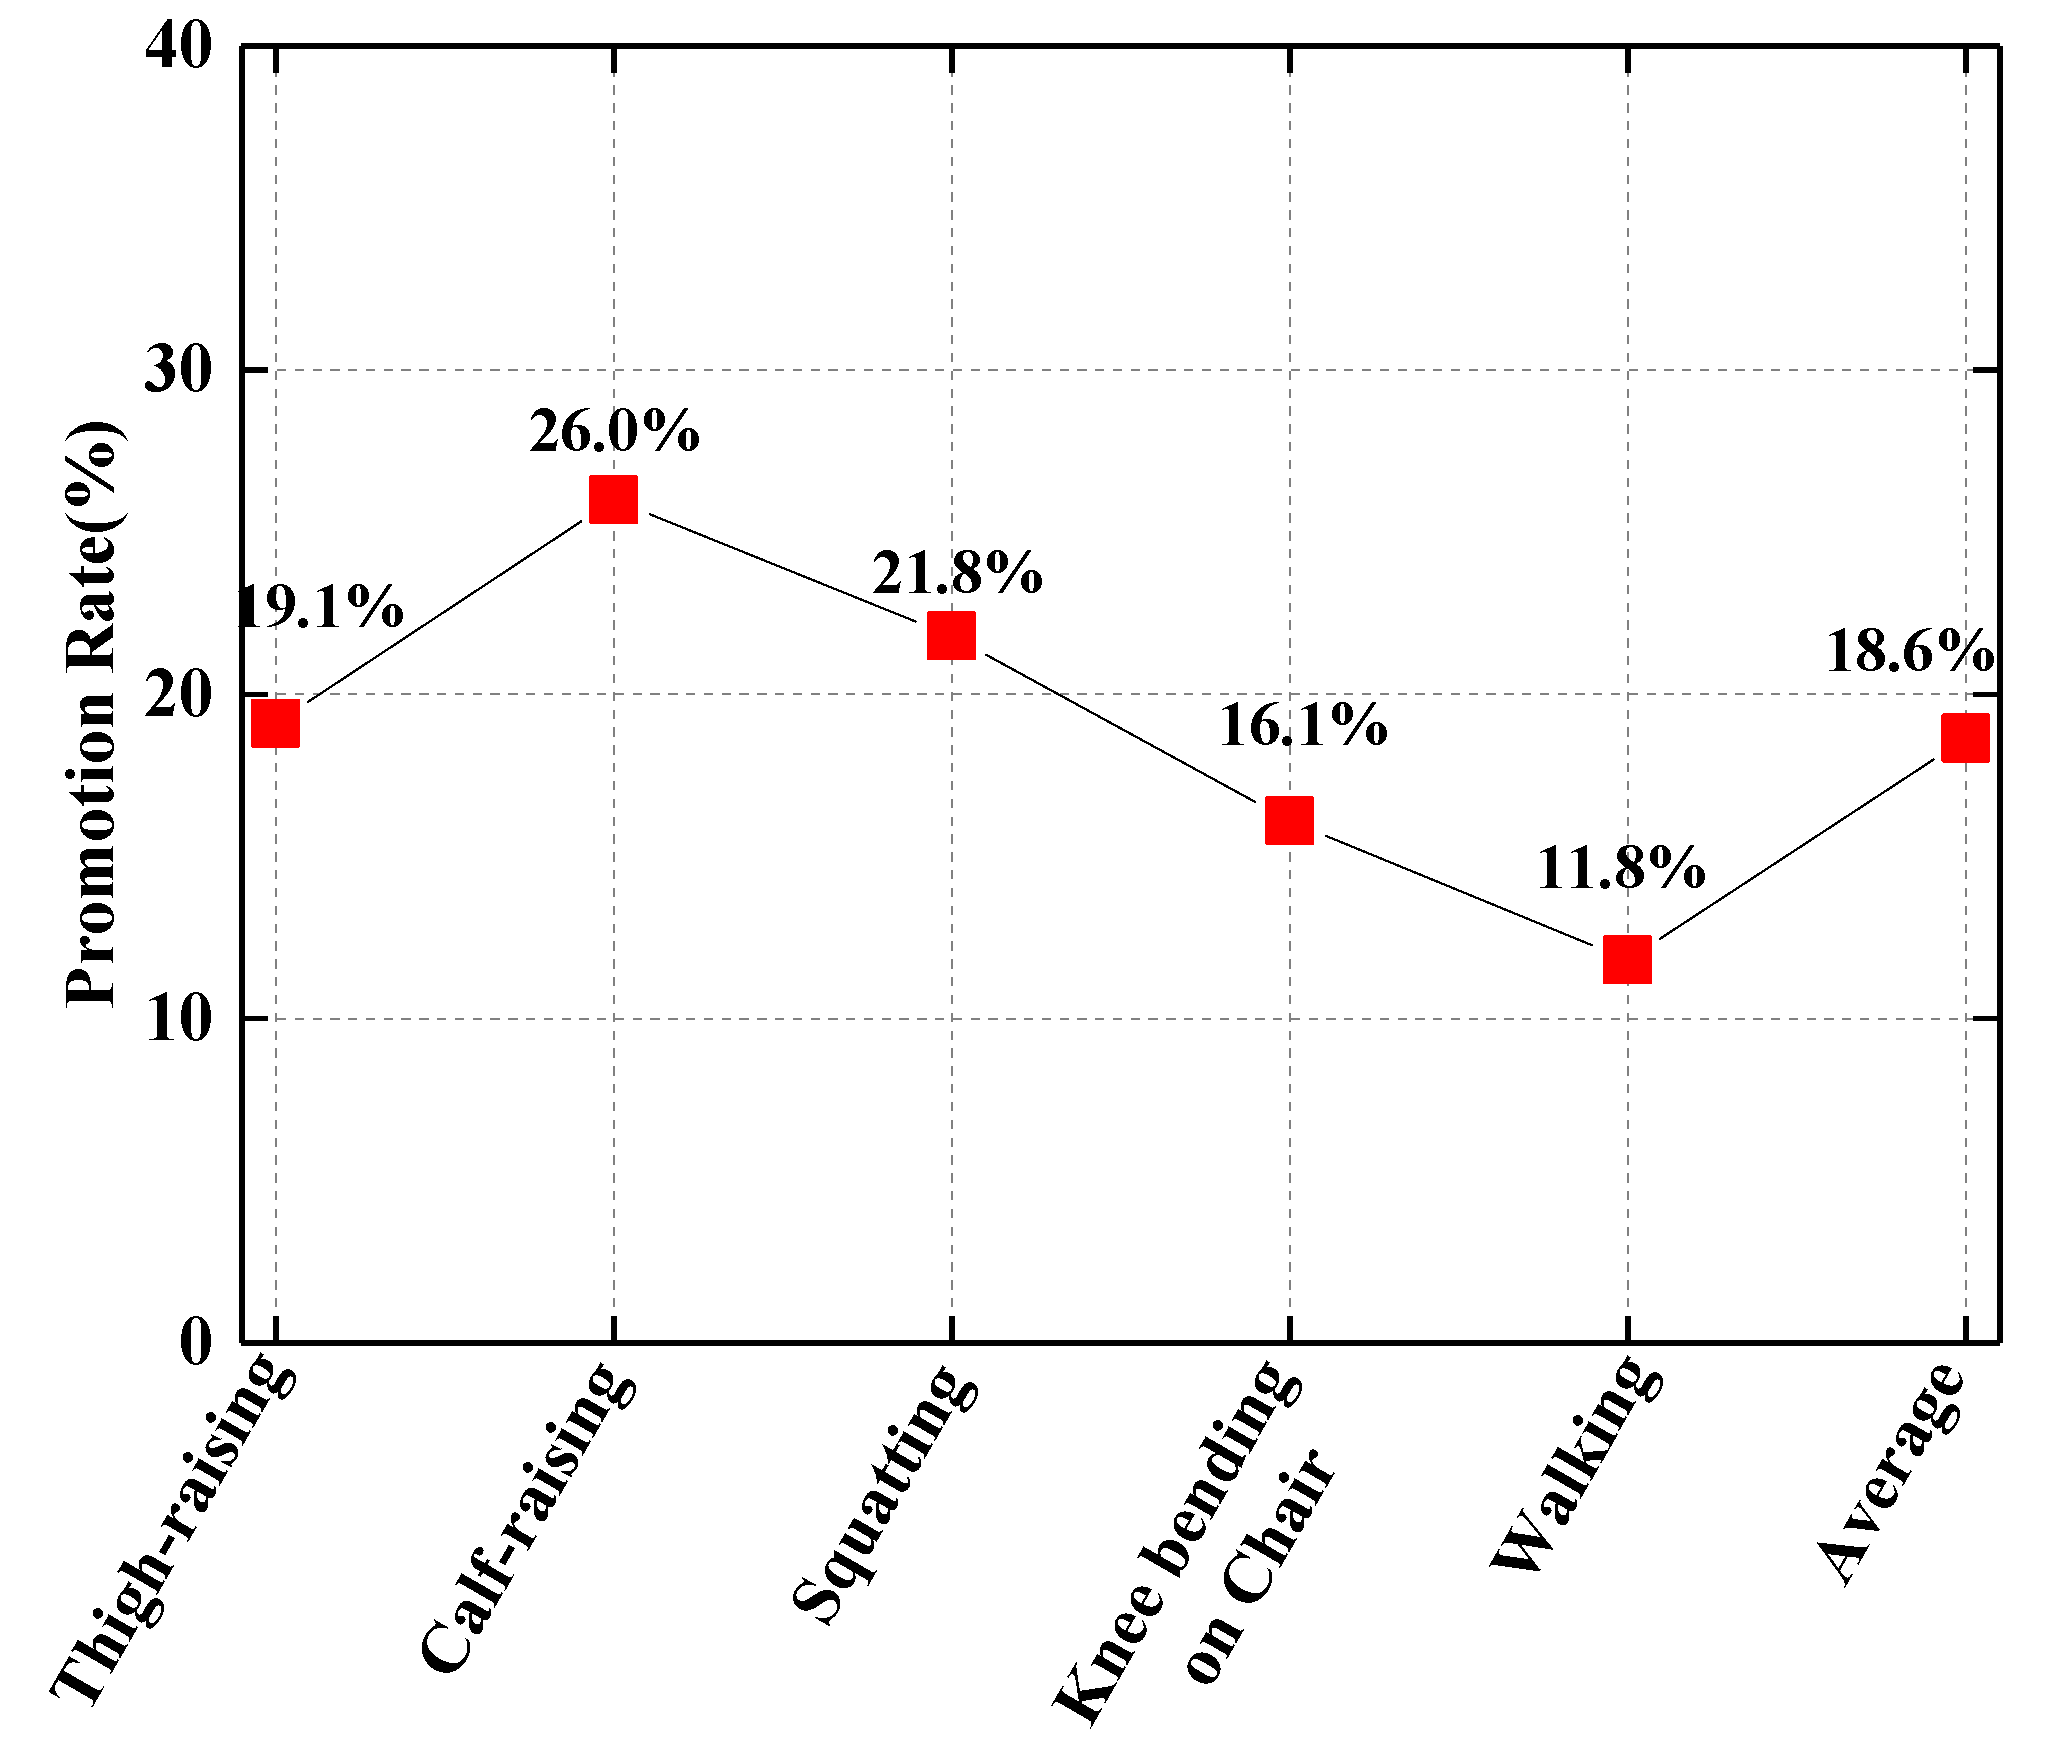
To classify five different knee movements, the data set (muscle nerve activation) was entered into the BP_AdaBoost strong classifier, whose weak classifier number is to 10. The scale assignment of the data set is the same as that of the BP neural network classifier. The results are revealed in Figure 9 and Figure 10 below. They illustrate that BP_AdaBoost greatly improves the BP neural network. The average recognition rate of BP_AdaBoost is 93.52%, which is 14.7% higher than that of BP neural network (78.82%). The figure on the right shows the BP_AdaBoost has a higher lifting rate of five actions than the BP neural network. The calculation formula is:
where r is the improvement of recognition rate by BP_Adaboost, m2 is the recognition rate with BP_Adaboost as the classifier, and m1 is the recognition rate with BP as the classifier. It can be found that BP_AdaBoost can improve the recognition of knee movement from the BP network. The BP_Adaboost recognition mean is 93.52%. Which is only 78.82 in the BP network. The average promotion rate reaches 18.6%. The maximum is knee flexion, and the value reaches 26.0%. The minimum is walking, and the value reaches 11.8%.
3.2. Knee Angle Regression Based on BP_Adaboost
It illustrates from the above research that the BP_AdaBoost strong classifier has a good performance in the recognition of typical movements of human lower limbs with EMG signals as input, and BP_AdaBoost can also be used to design the strong regressor. The design of the BP_AdaBoost strong regressor is similar to that of the BP_AdaBoost strong classifier. The difference is that the BP_AdaBoost strong regressor uses the BP neural network as a weak regressor, which is still a single hidden layer structure, including an input layer (two nodes, i.e., two muscle neural activation eigenvalues of two muscles), a hidden layer (including five nodes), and one output layer (the output is the knee angle). The learning rate is 0.01, the epoch is 50, and the convergence error is 0.00004. After training, predict the output of test samples and adjust the weight value of the test samples according to the prediction results. In this article, the threshold is still set at 0.1. Take the test samples that exceed the threshold as the samples that should strengthen learning. The BP_AdaBoost strong regressor is used to predict the knee angle, and the IMU pose sensor is used to measure the angle changes of thigh and calf in the sagittal plane during walking. The measured value is the difference between the limb and the longitudinal axis. Set the thigh angle as α; the thigh angle is positive when lifting the thigh forward and negative when lifting the thigh backward. Set the calf angle as β; calf lifting forward is positive and backward is negative. When standing α = β = 0. The knee angle is defined as the angle between the thigh and the lower leg θ; the knee angle during walking is calculated as:
θ = 180 − α + β
Of which: α, β, and θ are the angles of thigh, calf, and knee, respectively, which is a generation value, θ. The angle range is 0~180%.
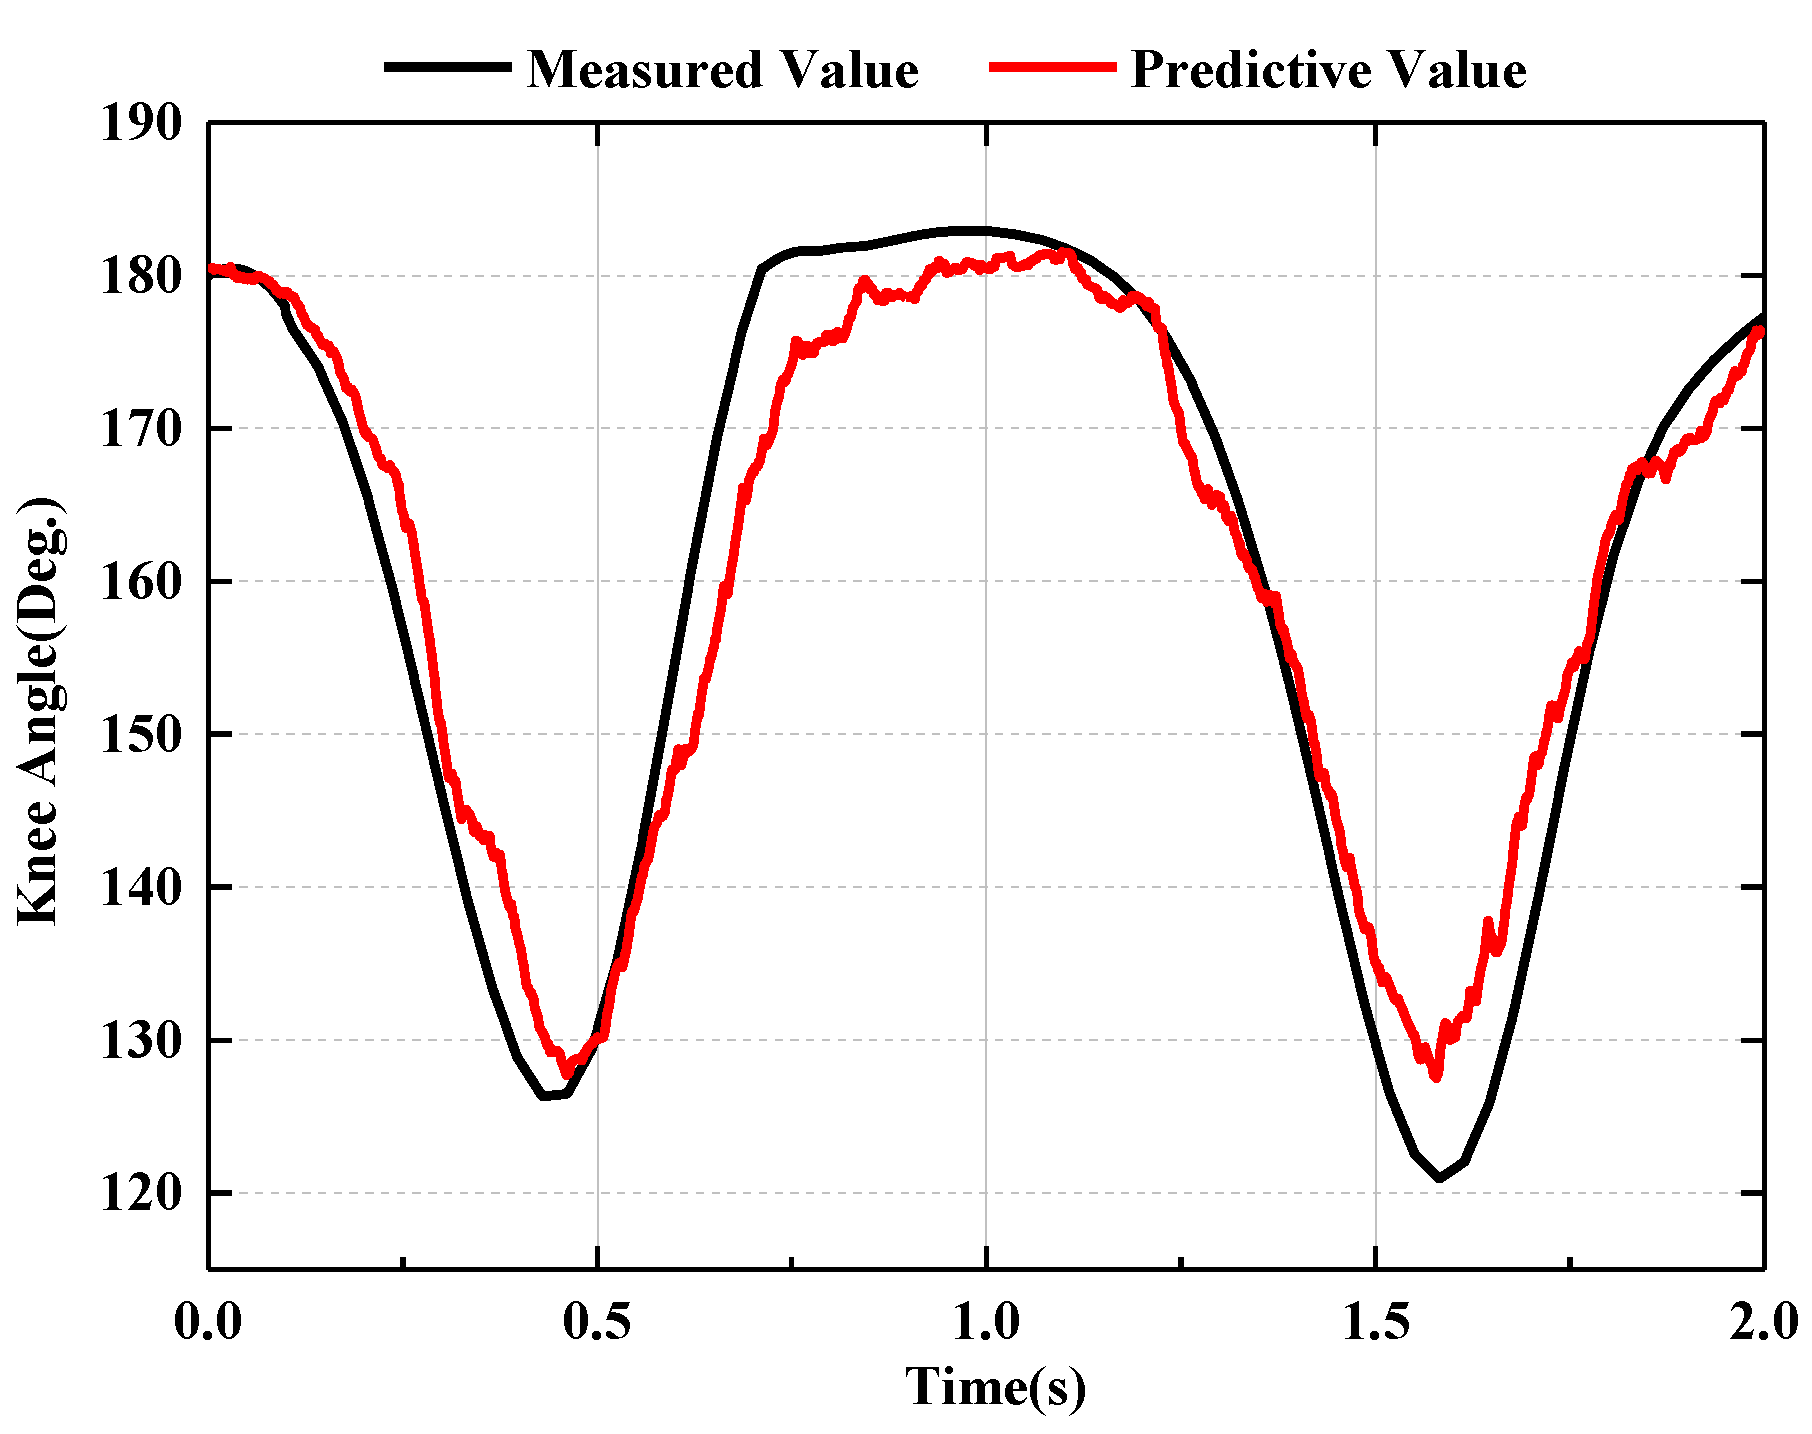
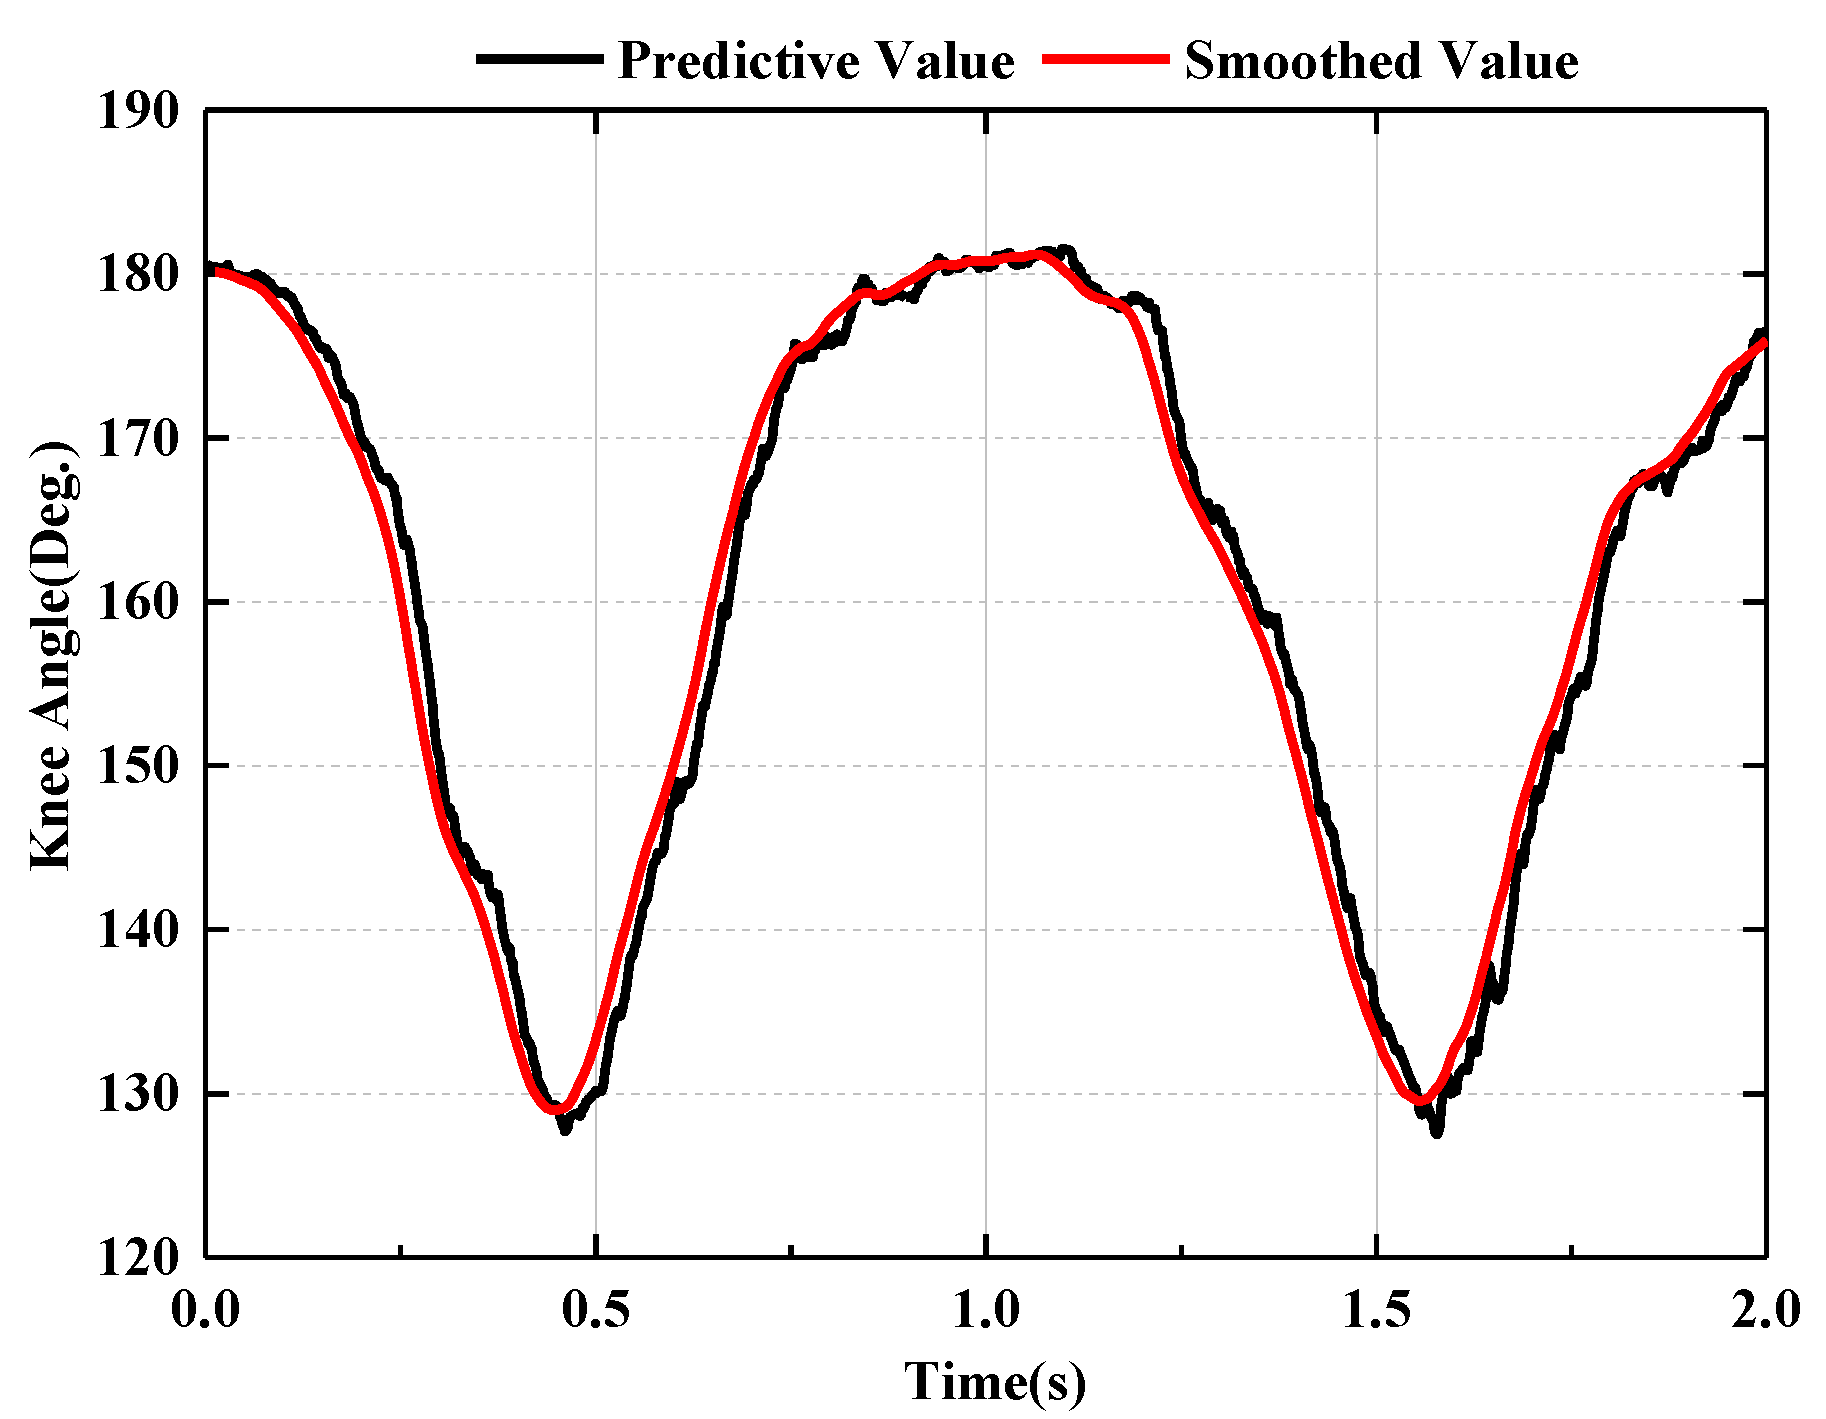
Firstly, the EMG signals of 10 gait cycles are selected as the data set. The size of the feature window is 200 ms. In order to ensure that the signal is not lost, the size of the sliding window is 100 ms and the size of the overlapping window is 100 ms. The number of weak classifiers is set to 10. Figure 11 shows the knee angle measured by IMU and the knee angle predicted by BP_AdaBoost. The black curve is the measured value by IMU and the red curve is the regression value with the EMG neural signal as the input. It can be analyzed that BP_AdaBoost can well predict the knee angle value, but the output result of the algorithm has certain noise. Figure 12 shows the smoothing of the regression value, and the red curve is the regression value after smoothing. The black curve is the regression value with myoelectric signal as the input (that is the red curve in Figure 11). Comparing Figure 11 and Figure 12, it can be determined that the BP_AdaBoost algorithm can realize the regression mapping of the knee joint angle with the EMG signals of rectus femoris and biceps femoris of the thigh as the input.
To verify the superiority of BP_AdaBoost strong predictor with other regression algorithms, this article compares the regression effects of decision Tree, SVR, Gaussian classifier, and BP as a weak classifier, selects the knee angle of five actions as target, and compares the regression errors of their algorithms, as shown in Table 2.
This illustrates that the BP_AdaBoost regressor has the best regression effect. The regression errors of five kinds of knee joint movements were less than 10%. The error of calf-raising is the lowest, only 4.4%, and the average value is 6.384%, which is due to the advantages of the BP neural network algorithm and the characteristics of the EMG signal, as well as the advantages of the BP_AdaBoost combined with the BP weak regressor.
4. Conclusions
(1) The results show that the average recognition rate of five actions by the BP neural network is 78.82%, which proves the separability of muscle nerve signals. The BP_AdaBoost strong classifier designed can improve the recognition of different motion patterns, and the recognition rate is improved by 14.7% compared with the simple BP weak classifier algorithm.
(2) Taking the BP neural network as the weak classifier, the BP_AdaBoost strong classifier is designed, which improves the average recognition rate of BP neural network from 78.82% to 93.52%, and its promotion rate is 18.6%. The BP_AdaBoost regressor can realize the regression mapping of the thigh EMG signal to knee angle. Among many regressors in this article, BP_AdaBoost has the lowest regression error, which is only 6.384%.
Author Contributions
Conceptualization, J.W. and Y.D.; methodology, J.W.; experiment, J.W. and X.S.; validation, J.W. and X.S.; formal analysis, J.W.; investigation, J.W. and X.S.; resources, Y.D.; data curation, J.W. and Y.D.; writing—original draft preparation, J.W.; writing—review and editing, J.W. and Y.D.; visualization, J.W.; supervision, Y.D.; project administration, Y.D.; funding acquisition, Y.D. All authors have read and agreed to the published version of the manuscript.
Funding
This research was funded by the Aerospace Research Project of China under Grant No. 020202. Funder: Yuehong Dai.
Institutional Review Board Statement
Not applicable.
Informed Consent Statement
Informed consent was obtained from all subjects involved in the study.
Data Availability Statement
Data available on request due to privacy. The data presented in this study are available on request from the corresponding author. The data are not publicly available due to the project funding requirement.
Acknowledgments
The authors would like to gratefully acknowledge Peng Tang and Zhaoyang Li for useful discussions and correction of this article.
Conflicts of Interest
This article has not been published and it is not under consideration for publication elsewhere. The authors have no conflicts of interest to disclose and all authors have approved the manuscript for submission.
References
- Liu, L.; Yang, P.; Liu, J. Human Motion Intent Recognition Based on Kernel Principal Component Analysis and Relevance Vector Machine. Robot 2017, 5, 661–669. [Google Scholar]
- Sun, Z.N.; Li, Q.; Liu, Y.F. Research Progress of Computer Vision and Pattern Recognition. Front. Data Comput. 2019, 10, 16. [Google Scholar]
- Wu, X.; Fang, K.; Chen, C.; Zhang, Y. Development of a lower limb multi-joint assistance soft exosuit. Sci. China Inf. Sci. 2020, 63, 1–3. [Google Scholar] [CrossRef]
- Bai, X.J. Research on Neural Signal Acquisition and Stimulation System; Tianjin University: Tianjin, China, 2007; pp. 25–30. [Google Scholar]
- Lu, D.M. Measurement Methods of Sports Biomechanics; Beijing Sport University Press: Beijing, China, 2001; pp. 65–71. [Google Scholar]
- Han, Y.; Wang, X. Biomechanics study of human lower limb walking: Implication for design of power-assisted robot. In Proceedings of the 2010 IEEE/RSJ International Conference on Intelligent Robots & Systems, Taipei, Taiwan, 18–22 October 2010. [Google Scholar]
- Xu, H.Q.; Liu, F.; Nan, J.W. Motion Research of Power-Assisted Lower Extremity Exoskeleton under Walking Process. Mach. Des. Manuf. 2019, 341, 107–110. [Google Scholar]
- Ahmed, T.; Islam, M.K. EMG Signal Classification for Detecting Neuromuscular Disorders EMG Signal Classification for Detecting Neuromuscular Disorders. In Proceedings of the First International Conference on Advances in Smart Sensor, Signal Processing and Communication Technology (ICASSCT 2021), Goa, India, 19–21 March 2021. [Google Scholar]
- Grüneberg, P. Empowering Patients in Interactive Unity with Machines: Engineering the HAL (Hybrid Assistive Limb) Robotic Rehabilitation System. In Humans and Devices in Medical Contexts; Palgrave Macmillan: Singapore, 2021. [Google Scholar]
- Kumar, H.; Goen, A. Comparative Analysis of FIR Digital Filters for Noise Reduction in EMG Signal. Int. J. Adv. Res. 2015, 3, 598–603. [Google Scholar]
- Hasan, U.C. Statistical and Practical Significance of Articles at Sports Biomechanics Conferences. Ann. Appl. Sport Sci. 2021, 9. [Google Scholar] [CrossRef]
- Chowdhury, R.H.; Reaz, M.B.I.; Ali, M.A.B.M.; Bakar, A.A.A.; Chellappan, K.; Chang, T.G. Surface Electromyography Signal Processing and Classification Techniques. Sensors 2013, 13, 12431–12466. [Google Scholar] [CrossRef]
- Kundu, B.; Naidu, D.S. Classification and Feature Extraction of Different Hand Movements from EMG Signal using Machine Leaning based Algorithms. In Proceedings of the 2021 International Conference on Electrical, Communication, and Computer Engineering (ICECCE), Kuala Lumpur, Malaysia, 12–13 June 2021. [Google Scholar]
- Ullah, K.; Kim, J.H. A mathematical model for mapping EMG signal to joint torque for the human elbow joint using nonlinear regression. In Proceedings of the International Conference on Autonomous Robots & Agents (ICARA), Wellington, New Zealand, 10–12 February 2009; IEEE: Piscataway, NJ, USA, 2009. [Google Scholar]
- Pearle, A.D.; Solomon, D.J.; Wanich, T.; Moreau-Gaudry, A.; Granchi, C.C.; Wickiewicz, T.L.; Warren, R.F. Reliability of Navigated Knee Stability Examination. Am. J. Sports Med. 2017, 35, 1315–1320. [Google Scholar] [CrossRef]
- Kim, J.J.; Cho, H.; Park, Y.; Jang, J.; Kim, J.W.; Ryu, J.S. Biomechanical influences of gait patterns on knee joint: Kinematic & EMG analysis. PLoS ONE 2020, 15, e0233593. [Google Scholar]
- Farina, D.; Merletti, R.; Nazzaro, M.; Caruso, I. Effect of joint angle on EMG variable in leg and thigh muscles. IEEE Eng. Med. Biol. Mag. 2001, 20, 62–71. [Google Scholar] [CrossRef]
- Stachaczyk, M.; Atashzar, S.F.; Farina, D. Adaptive Spatial Filtering of High-Density EMG for Reducing the Influence of Noise and Artefacts in Myoelectric Control. IEEE Trans. Neural Syst. Rehabil. Eng. 2020, 28, 1511–1517. [Google Scholar] [CrossRef] [PubMed]
- Cui, X.; Liu, H.; Wu, Q.X. Study on Spacesuit Joint Motion Assistance Based on Neuromuscular Activation Feedback. Manned Spacefl. 2019, 25, 448–453. [Google Scholar]
- Ying, C.; Qi-Guang, M.; Jia-Chen, L.; Lin, G. Advance and Prospects of AdaBoost Algorithm. Acta Autom. Sin. 2013, 39, 745–758. [Google Scholar]
- Jin, W.; Li, Z.J.; Wei, L.S.; Zhen, H. The improvements of BP neural network learning algorithm. In Proceedings of the International Conference on Signal Processing, Beijing, China, 21–25 August 2000; IEEE: Piscataway, NJ, USA, 2002. [Google Scholar]
Figure 1.
Curve of thigh muscle length in a single gait cycle.

Figure 2.
Comparison before and after signal noise reduction.

Figure 3.
Effect of A on muscle neural activation.

Figure 4.
Extraction of muscle activity of biceps femoris.

Figure 5.
Flow chart of AdaBoost algorithm.

Figure 6.
Five kinds of action demonstration: (a) Thigh-raising; (b) Calf-raising; (c) Squatting; (d) Knee Bending on Chair; (e) Walking.
Figure 6.
Five kinds of action demonstration: (a) Thigh-raising; (b) Calf-raising; (c) Squatting; (d) Knee Bending on Chair; (e) Walking.

Figure 7.
Best validation.

Figure 8.
Classification error of BP network.

Figure 9.
Comparison of BP and BP_AdaBoost algorithms.

Figure 10.
Improvement effect of BP_AdaBoost.

Figure 11.
Measured value and regression value.

Figure 12.
Regression value smoothing.


Table 1.
Correlation of thigh muscles.
| Biceps F. | Rectus F. | Vastus I. | Vastus L. | Vastus M. | ||||||
|---|---|---|---|---|---|---|---|---|---|---|
| R | p | R | p | R | p | R | p | R | p | |
| Biceps F. | 1 | −0.932 | 0.000 | −0.468 | 0.001 | −0.468 | 0.001 | −0.467 | 0.001 | |
| Rectus F. | 1 | 0.756 | 0.000 | 0.756 | 0.000 | 0.755 | 0.000 | |||
| Vastus I. | 1 | 1 | 0.000 | 1 | 0.000 | |||||
| Vastus L. | 1 | 1 | 0.000 | |||||||
| Vastus M. | 1 | |||||||||
Table 2.
Error comparison of various regressors (%).
| Regressor | Thigh-Raising | Calf-Raising | Squatting | Knee Bending | Walking | Average |
|---|---|---|---|---|---|---|
| Decision Tree | 35.47 | 33.35 | 23.6 | 14.15 | 22.38 | 25.79 |
| SVR | 15.03 | 14.92 | 10.82 | 23.98 | 17.90 | 16.53 |
| Gaussian Regression | 18.03 | 17.13 | 13.64 | 12.39 | 21.24 | 16.486 |
| BP | 11.02 | 14.51 | 13.70 | 15.18 | 16.22 | 14.126 |
| BP_AdaBoost | 9.02 | 4.44 | 5.7 | 8.24 | 4.52 | 6.384 |
Publisher’s Note: MDPI stays neutral with regard to jurisdictional claims in published maps and institutional affiliations. |
© 2022 by the authors. Licensee MDPI, Basel, Switzerland. This article is an open access article distributed under the terms and conditions of the Creative Commons Attribution (CC BY) license (https://creativecommons.org/licenses/by/4.0/).
Share and Cite
MDPI and ACS Style
Wang, J.; Dai, Y.; Si, X. Classification and Regression of Muscle Neural Signals on Human Lower Extremities via BP_AdaBoost. Appl. Sci. 2022, 12, 5830. https://doi.org/10.3390/app12125830
AMA Style
Wang J, Dai Y, Si X. Classification and Regression of Muscle Neural Signals on Human Lower Extremities via BP_AdaBoost. Applied Sciences. 2022; 12(12):5830. https://doi.org/10.3390/app12125830
Chicago/Turabian StyleWang, Junyao, Yuehong Dai, and Xiaxi Si. 2022. "Classification and Regression of Muscle Neural Signals on Human Lower Extremities via BP_AdaBoost" Applied Sciences 12, no. 12: 5830. https://doi.org/10.3390/app12125830
Note that from the first issue of 2016, this journal uses article numbers instead of page numbers. See further details here.