
Experimental Research on In Situ Uniaxial Tensile Response of Silica-Based PLC Optical Splitters


1
State Key Laboratory of High Performance Complex Manufacturing, College of Mechanical and Electrical Engineering, Central South University, Changsha 410083, China
2
College of Mechanical and Electrical Engineering, Wuyi University, Nanping 354300, China
3
Huangshan Bright Semiconductor Co., Ltd., Huangshan 245021, China
*
Author to whom correspondence should be addressed.
Appl. Sci. 2022, 12(12), 5778; https://doi.org/10.3390/app12125778
Submission received: 11 May 2022
/
Revised: 1 June 2022
/
Accepted: 3 June 2022
/
Published: 7 June 2022
(This article belongs to the Topic Fiber Optic Communication)
Abstract
:In this study, the mechanical and optical properties of silica-based planar lightwave circuit (PLC) optical splitters under uniaxial tensile loading are studied by building an in situ experimental test platform. The tensile test results revealed that the adhesively-bonded fiber array-PLC chip joints are weak areas of the PLC optical splitter. Combined with the real-time monitoring of the optical performance index insertion loss (IL) during the tensile test, it was found that the changing trend of ΔIL-time curves is related to the deformation, damage, and debonding process of the weak area. Based on the experimental results and phenomena, the correspondence between ΔIL at 1.55 μm wavelength and the damage degree of PLC optical splitters is established, that is, ΔIL in (−5 dB; 0 dB], (−15 dB; −5 dB], and (−∞, −15 dB] belong to light damage, moderate damage, and severe damage, respectively. This research can provide a useful reference for damage characteristics analysis and reliability design of PLC optical splitters.
1. Introduction
For a passive optical network (PON), such as an ethernet passive optical network (EPON), broadband passive optical network (BPON), and fiber to the x (FTTX), a fiber optic splitter is one of the essential components in the optical fiber link [1,2]; the PLC optical splitter is one of the most common. Optical splitters are widely used for branching and combining optical signals [3]. Planar monolithically integrated photonic circuit technology, also known as planar lightwave circuits (PLC), is widely used to manufacture optical splitters [4]. PLC optical splitters have the advantages of high integration, good splitting uniformity, low temperature sensitivity, and low loss compared to traditional fused biconical taper optical splitters, so they are more widely used in FTTX transmission [5,6]. In order to reduce the maintenance and operation costs of the optical network, high reliability PLC optical splitters are required [7]. The performance of the PLC optical splitter is mainly determined by the quality of the input/output fiber array and the PLC chip, as well as the fiber array–PLC chip connection technology [8,9]. Soldering, laser welding, and adhesive connection are the three most popular connection techniques in PLC optical splitters packaging [10]. Among these, fiber array–PLC chip connection with UV-curable adhesives has become increasingly popular due to its advantages such as fast curing time, mass production, and low cost [11,12]. However, the reliability of fiber array–PLC chip connection with adhesives is worthy of attention. The fiber array and the PLC chip are interconnected by a UV-curable adhesive, which is essentially a form of the adhesively-bonded joint, where the adhesively-bonded joint is the key area to achieve optical and mechanical interconnection, but is also the weak area of the PLC optical splitter, and is prone to damage and fracture leading to the failure of the optical performance of the device [13,14].
PLC optical splitters, as a key component of PONs, are widely used and researched in recent years [6]. Previous work on the reliability of PLC optical splitters can be classified into two categories, one of which is to conduct environmental and mechanical reliability tests according to relevant standards, such as the Bellcore criterion (GR-1209/1221-CORE), to determine whether it has long-term stable optical performance, and to speculate on the cause of its failure [15,16,17]. The other is focused on the design, manufacturing, and packaging of PLC optical splitters [2,18,19]. However, previous studies usually only focus on the changes of the optical performance indexes of the device before and after the test, and there is a lack of relevant research on the failure behavior and failure mechanism of the device during the test. In addition, the existing studies seldom conduct in-depth research and analysis of specific weak areas, resulting in their failure characteristics still being unclear, especially from a local perspective. Piccirillo et al. [20] conducted temperature and humidity tests and drop tests on commercially available PLC optical splitters and concluded that the critical area of failure was at the adhesively-bonded joint between the fiber array and the chip, but they did not do further analysis of the damage evolution in this critical area. Zheng et al. [17,21] conducted online experiments on PLC optical splitters, studied the real-time changes of its optical performance when it was subjected to temperature load and drop, analyzed the failure phenomena in the experiment, and put forward suggestions for packaging improvements. However, the specific weak areas and their failure characteristics have not been studied in-depth.
For optical communication devices such as PLC optical splitters, its structure is compact and its size is small, especially the adhesive layer at the adhesively-bonded joint is usually very thin (tens or even several microns), and it has the functions of both mechanical and optical interconnection [9]. All of these have aggravated the difficulty of experimental research and simulation research, making the damage behavior of the weak area of PLC optical splitters lack in research. In order to improve the reliability of PLC optical splitters, the characteristics of its weak area should be investigated and evaluated with precision. For PLC optical splitters, in many cases, slight changes in the device may cause rapid attenuation of light, resulting in a large loss of optical power, thus causing the device to fail to work properly. Therefore, in situ monitoring of optical properties may prove suitable for obtaining information on structural damage evolution.
In order to accurately identify and analyze the weak area of the PLC optical splitter and further understand its failure mechanism, this paper investigates the response behavior of the mechanical and optical properties of PLC optical splitters under uniaxial tensile loading by building an online test platform. During the tensile test, the IL of the optical performance index of the sample is monitored in real-time to study the in situ damage evolution monitoring capability of the PLC optical splitter.
2. Experimental Work
2.1. Structure of PLC Optical Splitter
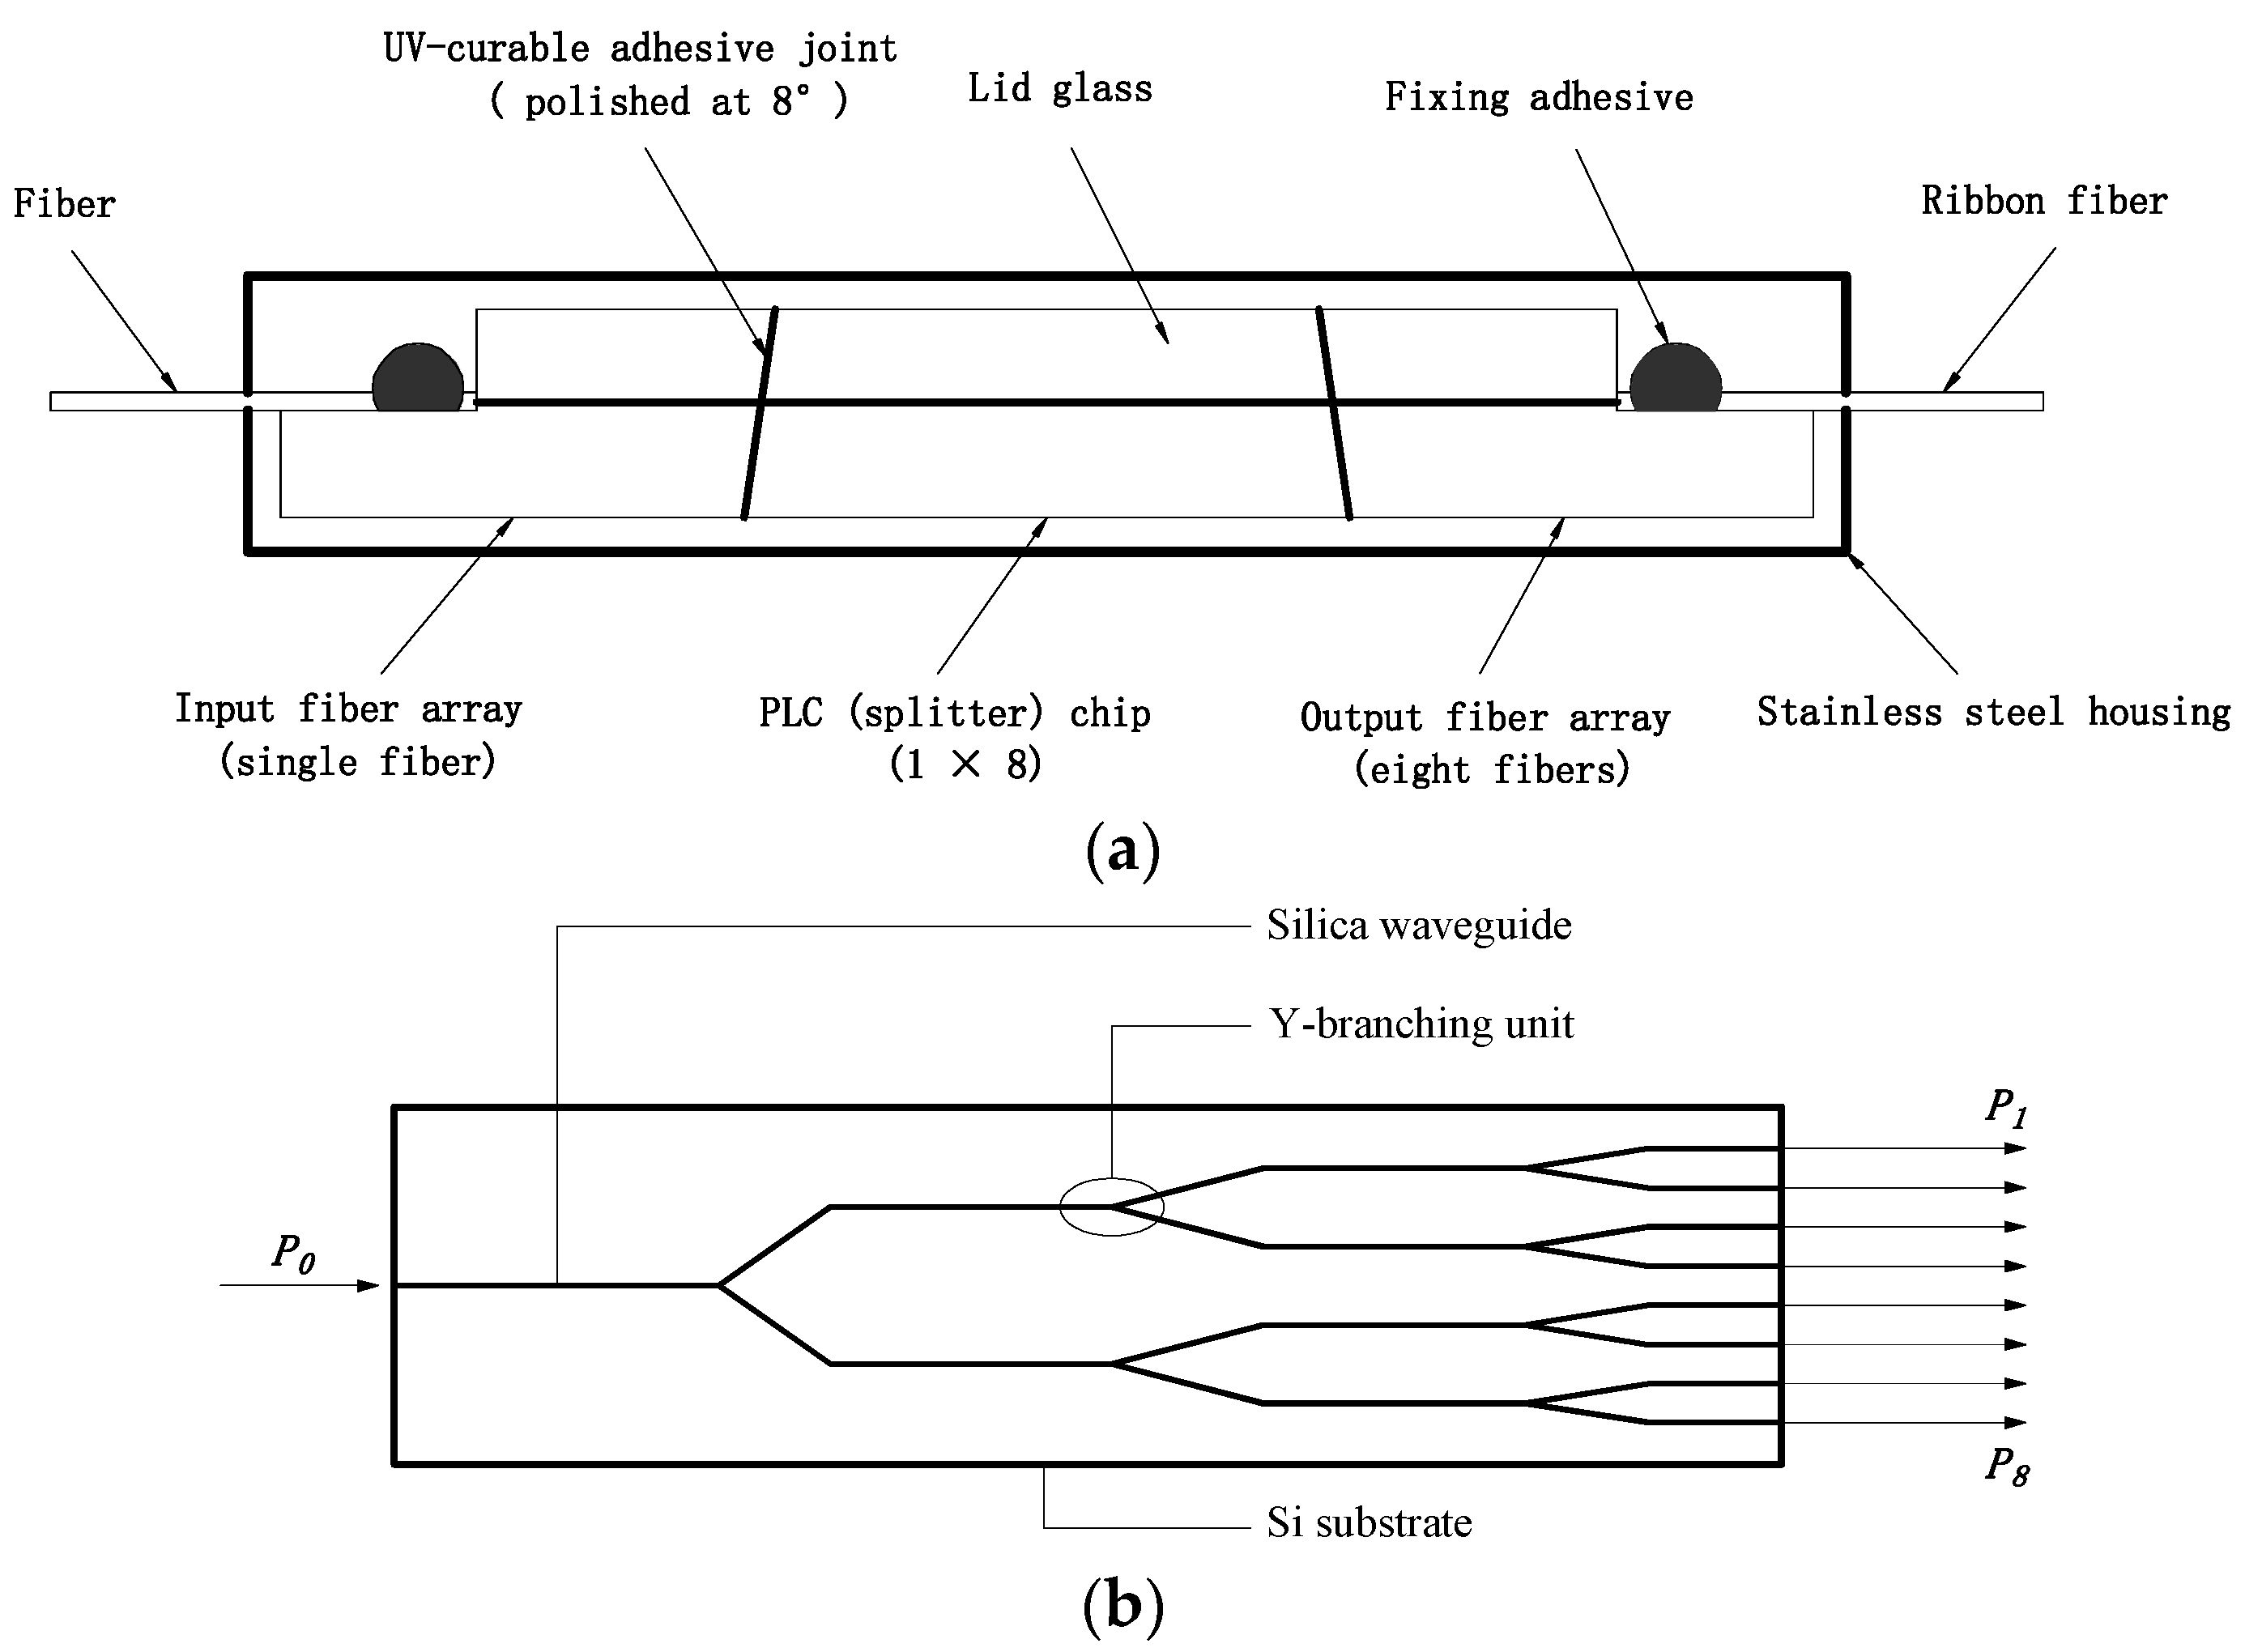
In this research, the same batch of silica-based 1 × 8 PLC optical splitters that were produced by company A was selected as the research object. Figure 1 shows the typical structure of 1 × 8 PLC optical splitters, where the three components, that is, 1-channel input and 8-channel output fiber arrays and a PLC (splitter) chip were aligned precisely (optical axis alignment) and then connected together with a UV-curable adhesive for optical and mechanical interconnection [19]. The fiber array and PLC chip faces were polished at an angle of 8°, which is designed to increase the return loss and ensure stable optical power output [15]. Both the fiber array and the PLC chip structure contained a corresponding glass lid (see Figure 1) with a height of 1 mm, which plays the role of fixing the fiber and protecting the PLC chip, respectively. The total length of the PLC optical splitter module was about 42 mm, the rectangular cross-sectional dimension of the fiber array was W × H (width × height) = 2.5 × 2.5 mm2, and the coverage area of the UV-curable adhesive at the adhesively-bonded joint was similar than the cross-sectional area of the fiber array.
Silica PLCs were invented in the 1980s by using silica-based materials and large-scale integrated circuit process technologies on a si substrate [7]. The waveguide consists of a central core, about 8 μm square, and surrounding cladding. In terms of size and materials, this structure is exactly the same as that of conventional optical fiber. Since PLC chips and fiber arrays of silicon-based/quartz glass materials are chemically and physically stable, it is important to check the reliability of fiber connection parts, which include UV-curable adhesives. In this study, the UV-curable adhesive that was used to interconnect the fiber array to the PLC chip was an acrylate-based adhesive, which is a viscoelastic polymer adhesive [23].
2.2. Test Method
Strength in general stands for resistance to the destructive effects of mechanical factors, such as various loads [24]. The knowledge of adhesive bond strength plays a leading role in the process of their design and operation [25]. In order to simultaneously test the mechanical and optical properties of the PLC optical splitter under uniaxial tensile loading, an online test platform was built in this experiment. The online test platform mainly includes a micro-force universal testing machine (ElectroForce® 3200 Series III test instruments from TA Instruments, Eden Prairie, MN, USA) for uniaxial tensile testing and an optical testing instrument for in situ monitoring and recording of the optical properties. The testing campaign of the online test platform for PLC optical splitters are divided in two main topics: (1) mechanical performance, i.e., under uniaxial tensile tests; and (2) optical performance, i.e., the in situ monitoring of the optical performance evolution of the device during uniaxial tensile tests.
In this work, all the samples were subjected to uniaxial quasi-static tensile tests using a micro-force universal testing machine (ElectroForce® 3200 Series III test instruments with a load resolution of 0.1 N) after removing the outer protective shell (stainless steel housing, see Figure 1). In addition, the input and output ports of the sample were looped with an optical power meter in the online test platform to monitor and record the IL of the eight output ports at a wavelength of 1.55 μm in real-time.
Control for the ElectroForce® 3200 Series III test instruments was provided by the WinTest® Digital Control System. Waveform generation, data acquisition, and instrument control were all provided in the comprehensive WinTest package. The ElectroForce linear motor mover was configured for uniaxial tensile testing system, and its typical control channels include “Disp” (displacement), “Load”, that is, uniaxial tensile testing has displacement control mode and load control mode. A control channel provides a transducer signal as feedback to control the mover in closed-loop control. In displacement control mode, the loading rate is controlled by displacement, and the unit is mm/s; and in load control mode, the loading rate is controlled by force, and the unit is N/s. In order to investigate the effects of different loading control methods and different loading rates on the tensile response of the PLC optical splitter, samples were randomly selected from the same batch of products and divided into three groups according to the loading rate for the uniaxial tensile tests. The tests of the first group were carried in displacement control mode with a loading rate of 0.01 mm/s; the tests of the second and third groups were carried in load control mode with loading rates of 0.1 and 1 N/s, respectively. It should be noted that five samples were selected for each group, and accordingly, a total number of 15 tests were performed to obtain the average failure load at each loading rate. The average failure load was taken as a characterization of the tensile strength of the PLC optical splitter. During the uniaxial tensile test, the load-displacement data and the IL of the eight ports of the specimen were collected for subsequent analysis.
3. Results and Discussion
3.1. Mechanical Test Results
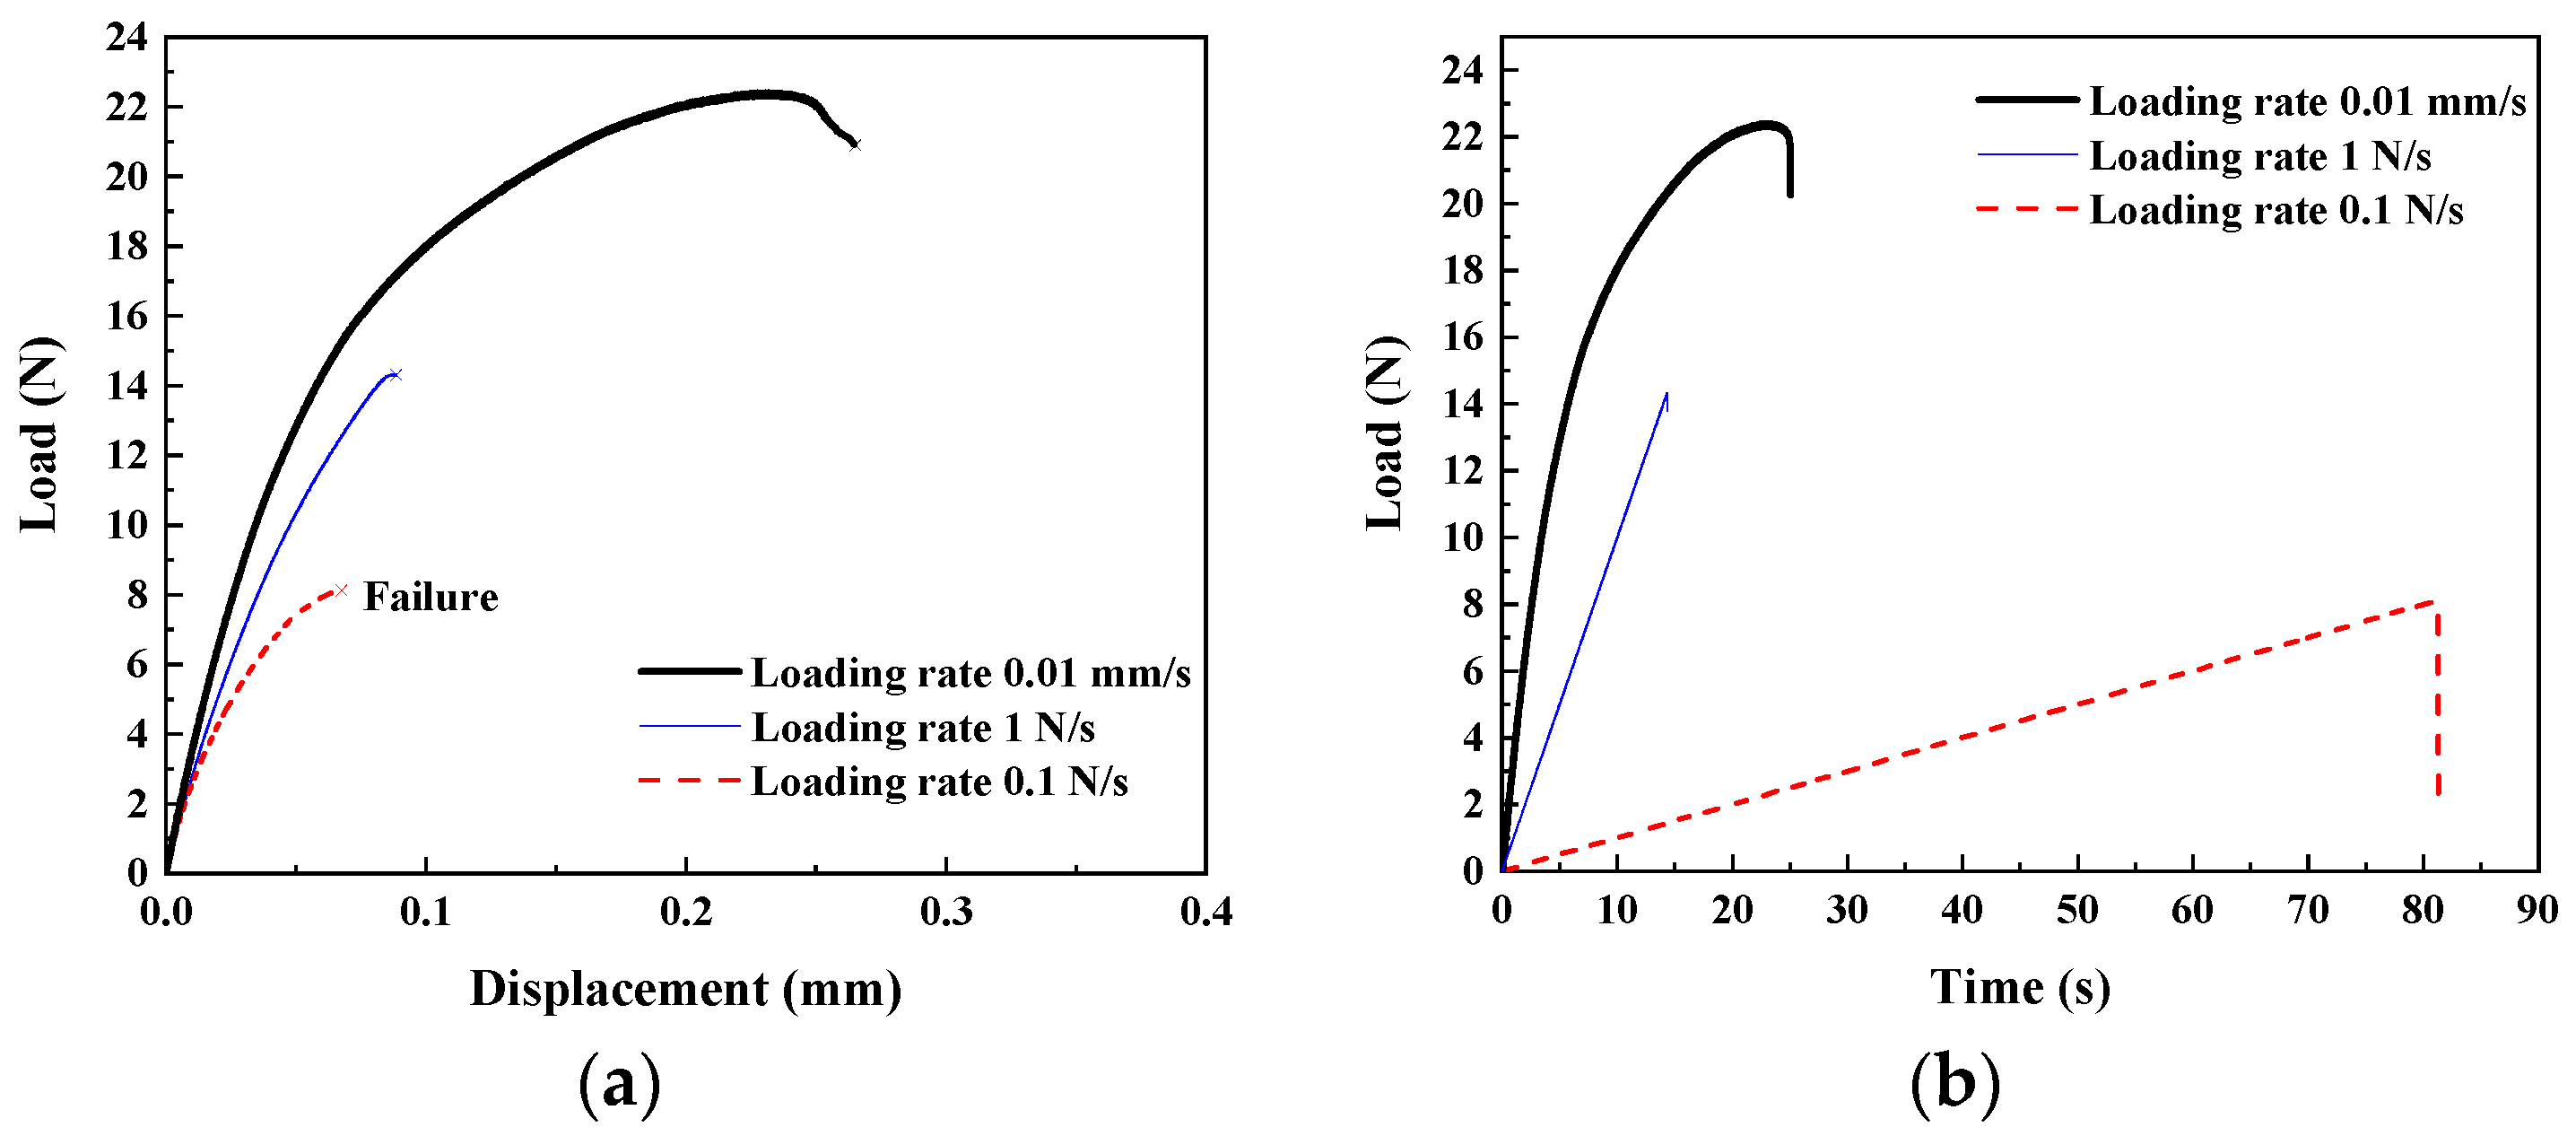
The uniaxial tensile test results are shown in Table 1. Compared with the loading rate of 0.01 mm/s (under displacement control mode), the average failure loads of the loading rates of 0.1 N/s and 1 N/s (under load control mode) were reduced by 64.9% and 29.1%, respectively, which reveals that different loading control modes have different effects on the mechanical properties of the specimens. The average failure load at the loading rate of 1 N/s was higher than that at the loading rate of 0.1 N/s, indicating that the tensile strength is affected by the loading rate. In addition, the experimental results showed a large dispersion of mechanical properties, which may be caused by the complexity of the influencing factors of the adhesively-bonded joints [26].
Figure 2a shows typical load-displacement curves under different loading rates until their final fracture, and Figure 2b shows the load-time curves corresponding to Figure 2a (in order to more completely reflect the changing trend of the load over time, the time that is used in Figure 2b is sometimes slightly longer than the time when the sample finally fractured). All the curves in Figure 2a show linear elasticity at the initial stage. After the load reached the ultimate tensile load, the load-bearing capacity dropped sharply, indicating that the specimen fractured in a sudden and brittle manner. It can be seen from Figure 2b that the influence of different loading control modes can also be regarded as caused by different loading rates from a certain perspective. Therefore, combining the experimental results in Table 1 and Figure 2, it can be concluded that the tensile strength of the PLC optical splitter is influenced by the loading rate. This phenomenon may be related to the viscoelastic effect of the adhesive layer material [27,28].
Since the silica-based/quartz glass material of the fiber arrays and the PLC chip has a large elastic modulus, the deformation under small loads is negligible, so the displacement that was recorded in the experiment can be considered mainly from the damage, deformation and debonding of the adhesive layer. As expected, the fracture of all the specimens occurred at the bonding interface between the fiber array and the PLC chip. According to the specific fracture location, it can be divided into two categories: Type I fracture, fracture at the bonding interface between the 8-channel output fiber array and the PLC chip; and Type II fracture, fracture at the bonding interface between the 1-channel input fiber array and the PLC chip. It is worth noting that after the statistics of the experimental results, we found that almost all the samples were broken at the adhesively-bonded joint of the 8-channel output fiber array-PLC chip, regardless of the loading rate. This indicates that the adhesively-bonded joint of the 8-channel output fiber array-PLC chip is the weakest link of the PLC optical splitter under a tensile load. The reason for this phenomenon may be due to the more complex structure of the end face of the 8-channel output fiber array compared to the 1-channel input fiber array, which makes the bonding interface more stress concentrated and less load-bearing, and therefore, more susceptible to damage.
3.2. Observed Failure Mode
Since the fracture locations of all the specimens appear at the adhesively-bonded joints of PLC optical splitters, it is necessary to understand the failure modes of the adhesive joints. Generally, if the failure of the adherend is not considered, the failure modes of adhesive joints can be classified as [13]: (1) adhesive failure (sometimes referred to as interfacial failure), which occurs at the interface between the adherend and the adhesive; (2) cohesive failure, which reveals good compatibility between the adhesive and adherends and it happens inside the adhesive layer [29]; or (3) mixed failure, which is characterized by the above two different failure modes of superposition.
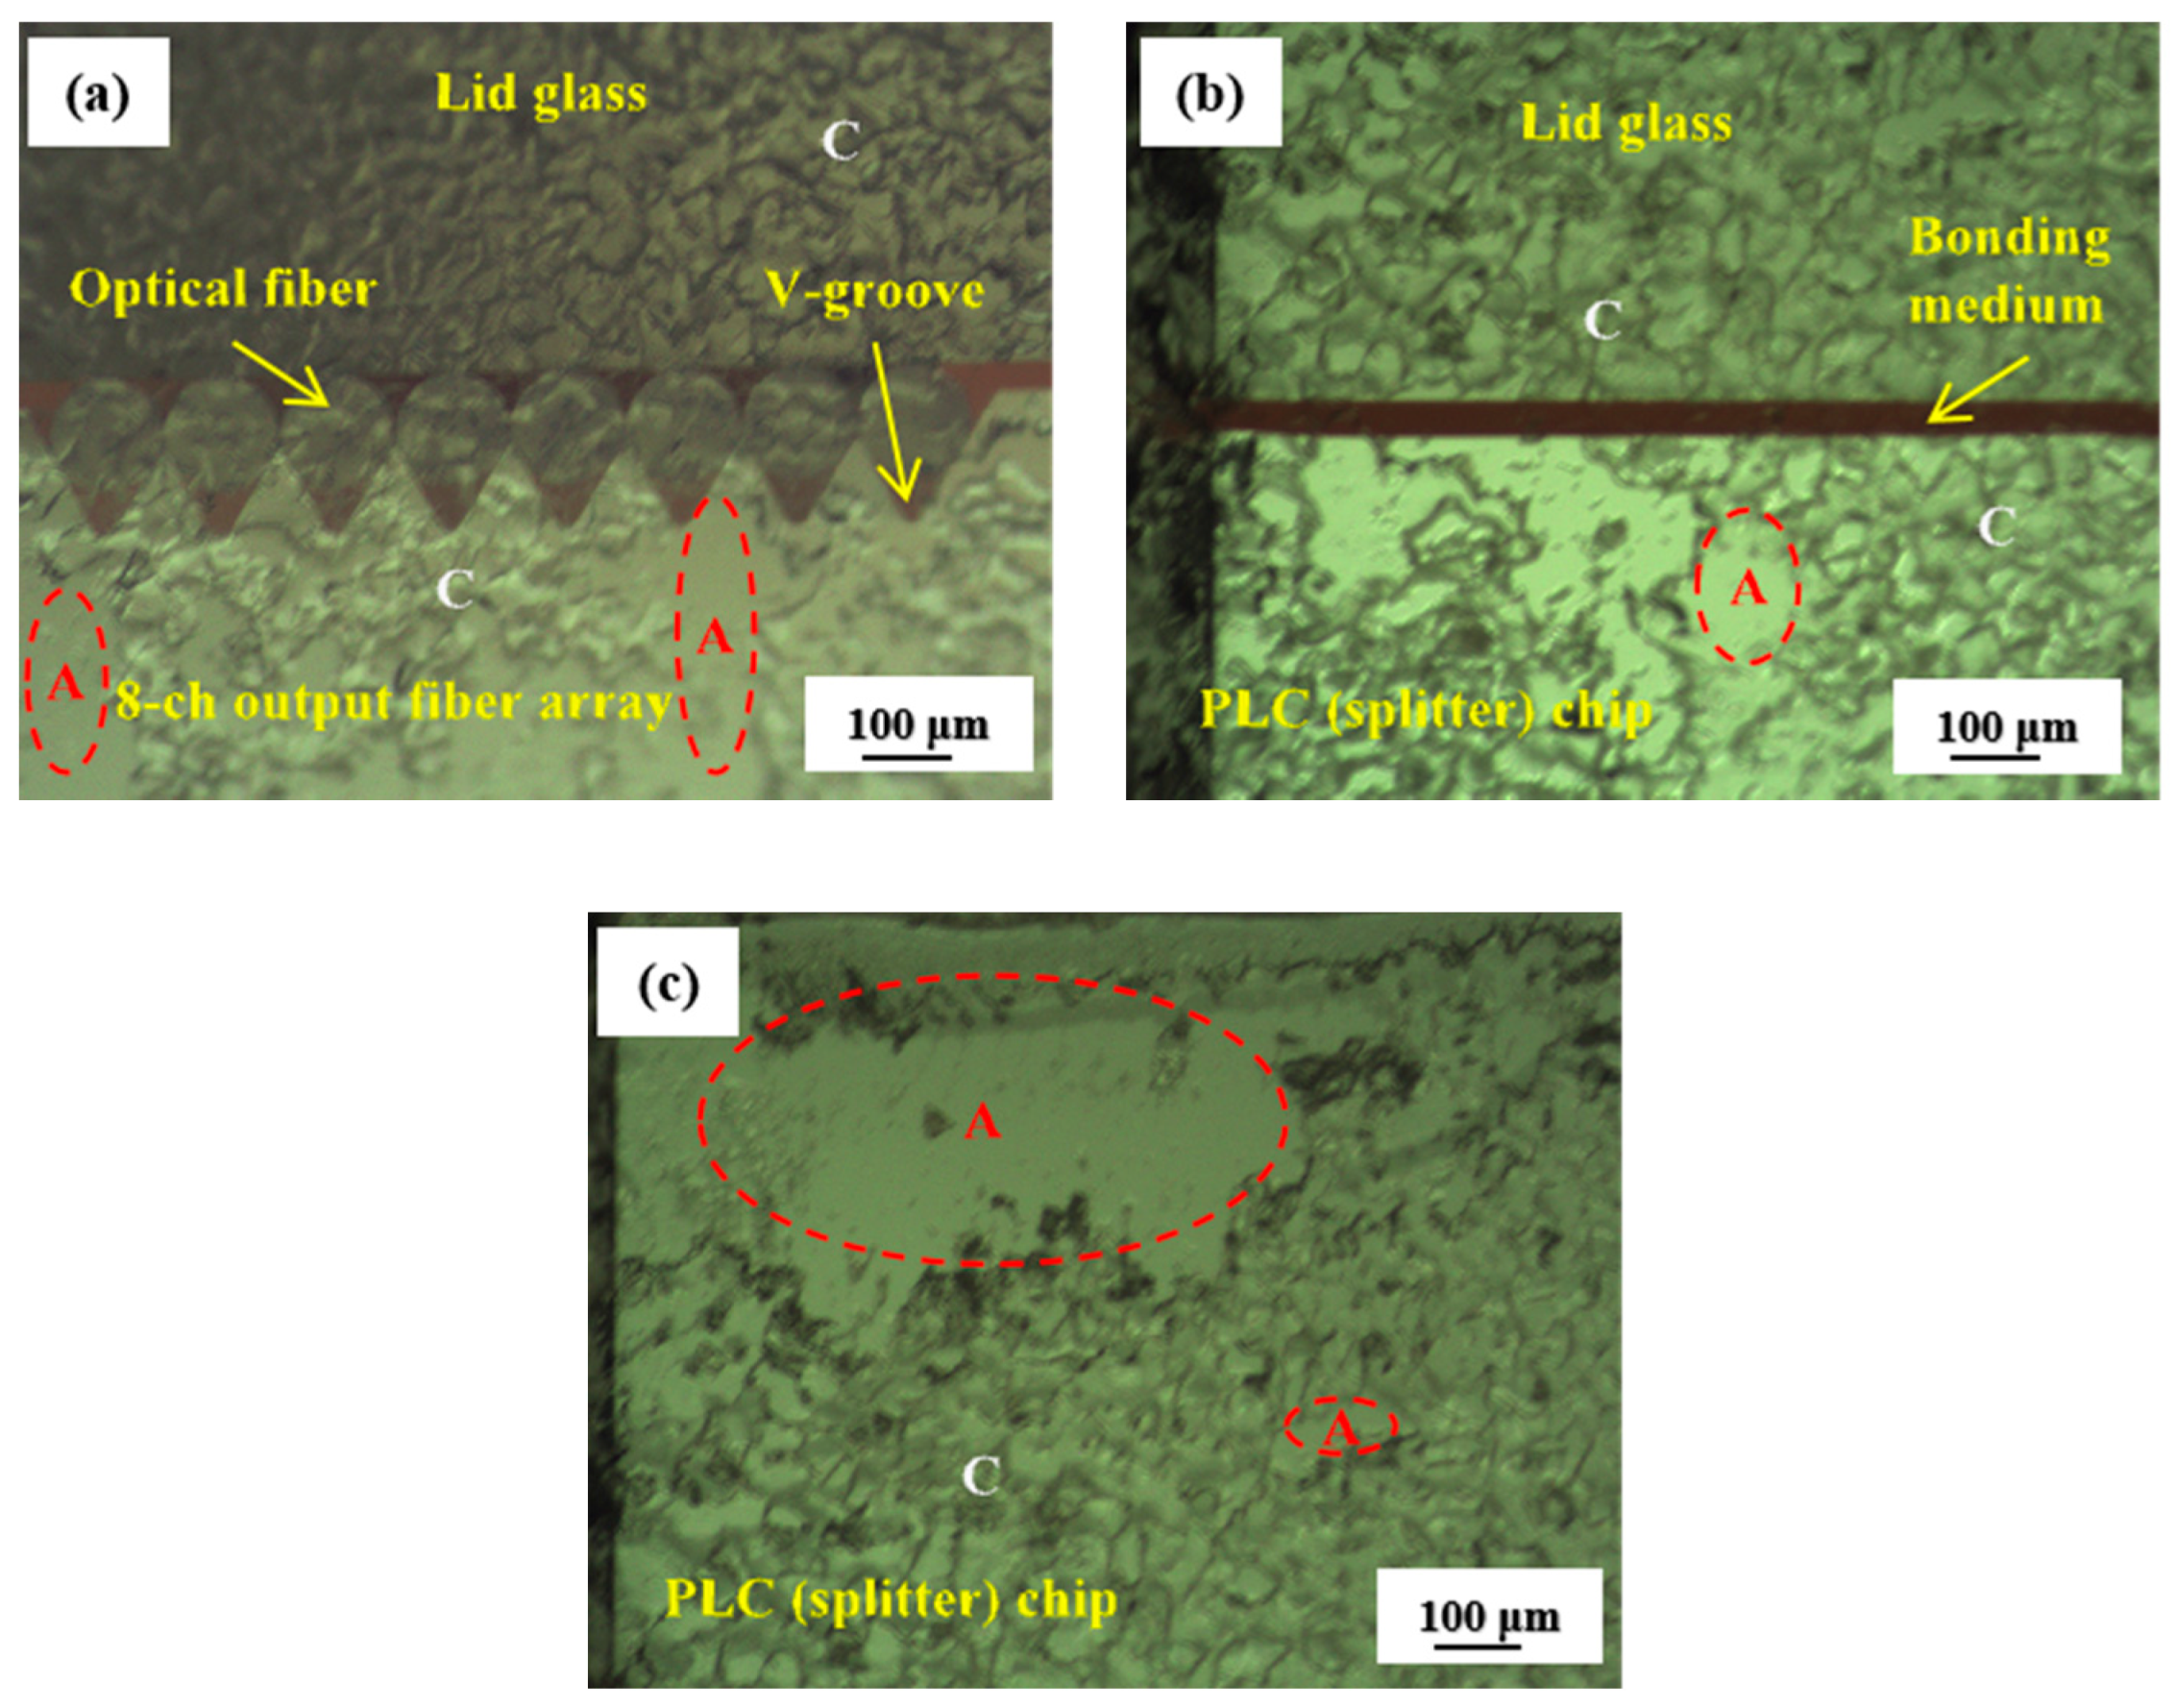
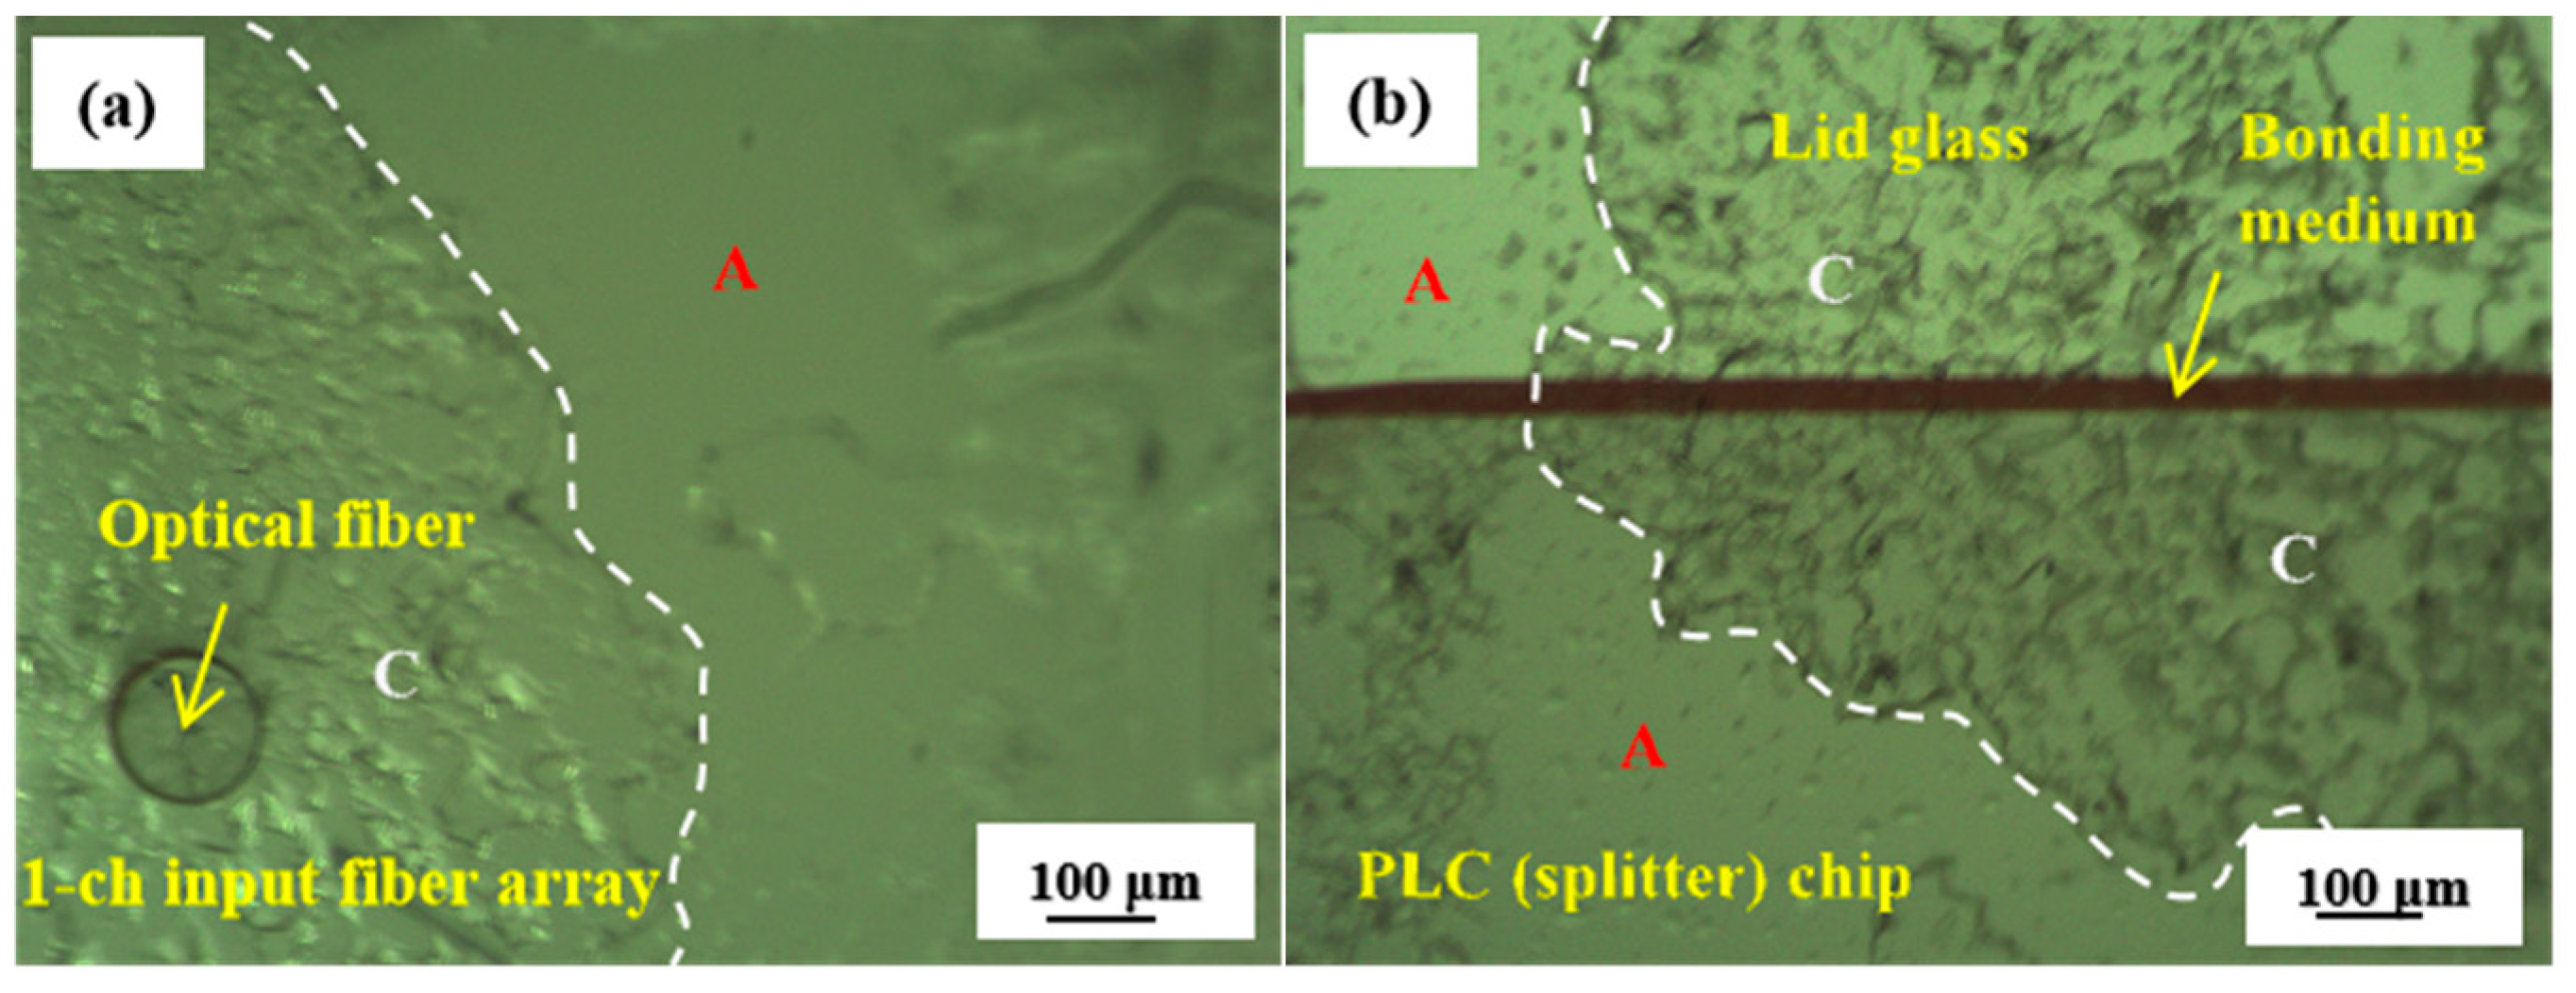
The microstructure and morphology of the fractured surfaces were observed by optical microscopy to investigate the failure mechanisms of the specimens. Typical optical microscopic morphologies of the fracture surfaces for Type I and Type II fractures that were mentioned in Section 3.1 are shown in Figure 3 and Figure 4, respectively. Figure 3 and Figure 4 reveal that the failure modes of the two types of fractures are both mixed failure, that is, both cohesive failure and adhesive failure occurred. Similar phenomena were observed for the other specimens.
In addition, by observing the failure surfaces of multiple specimens, we noticed that adhesive/interfacial failure are usually prone to occur at the edge of the bonding area (similar to Figure 3c and Figure 4), while cohesive failure tends to occur in the vicinity of the V-groove and the optical fiber (similar to Figure 3a and Figure 4a). These phenomena indicate that cracks first occurred at the edge of the bonding area and rapidly extended until the adhesively-bonded joint failed completely. The reason may be related to the stress distribution of the adhesively-bonded joints. Previous works have shown that the edge of the bonding area usually has a high degree of stress concentration, and cracks are easy to form and propagate from here [30,31]. Furthermore, noting that the end face structure of the 8-channel fiber array in Figure 3a is obviously more complex than that of the 1-channel fiber array (Figure 4a), it is not difficult to understand why almost all the specimens were Type I fracture under tensile loading.
3.3. Optical Performance Test Results
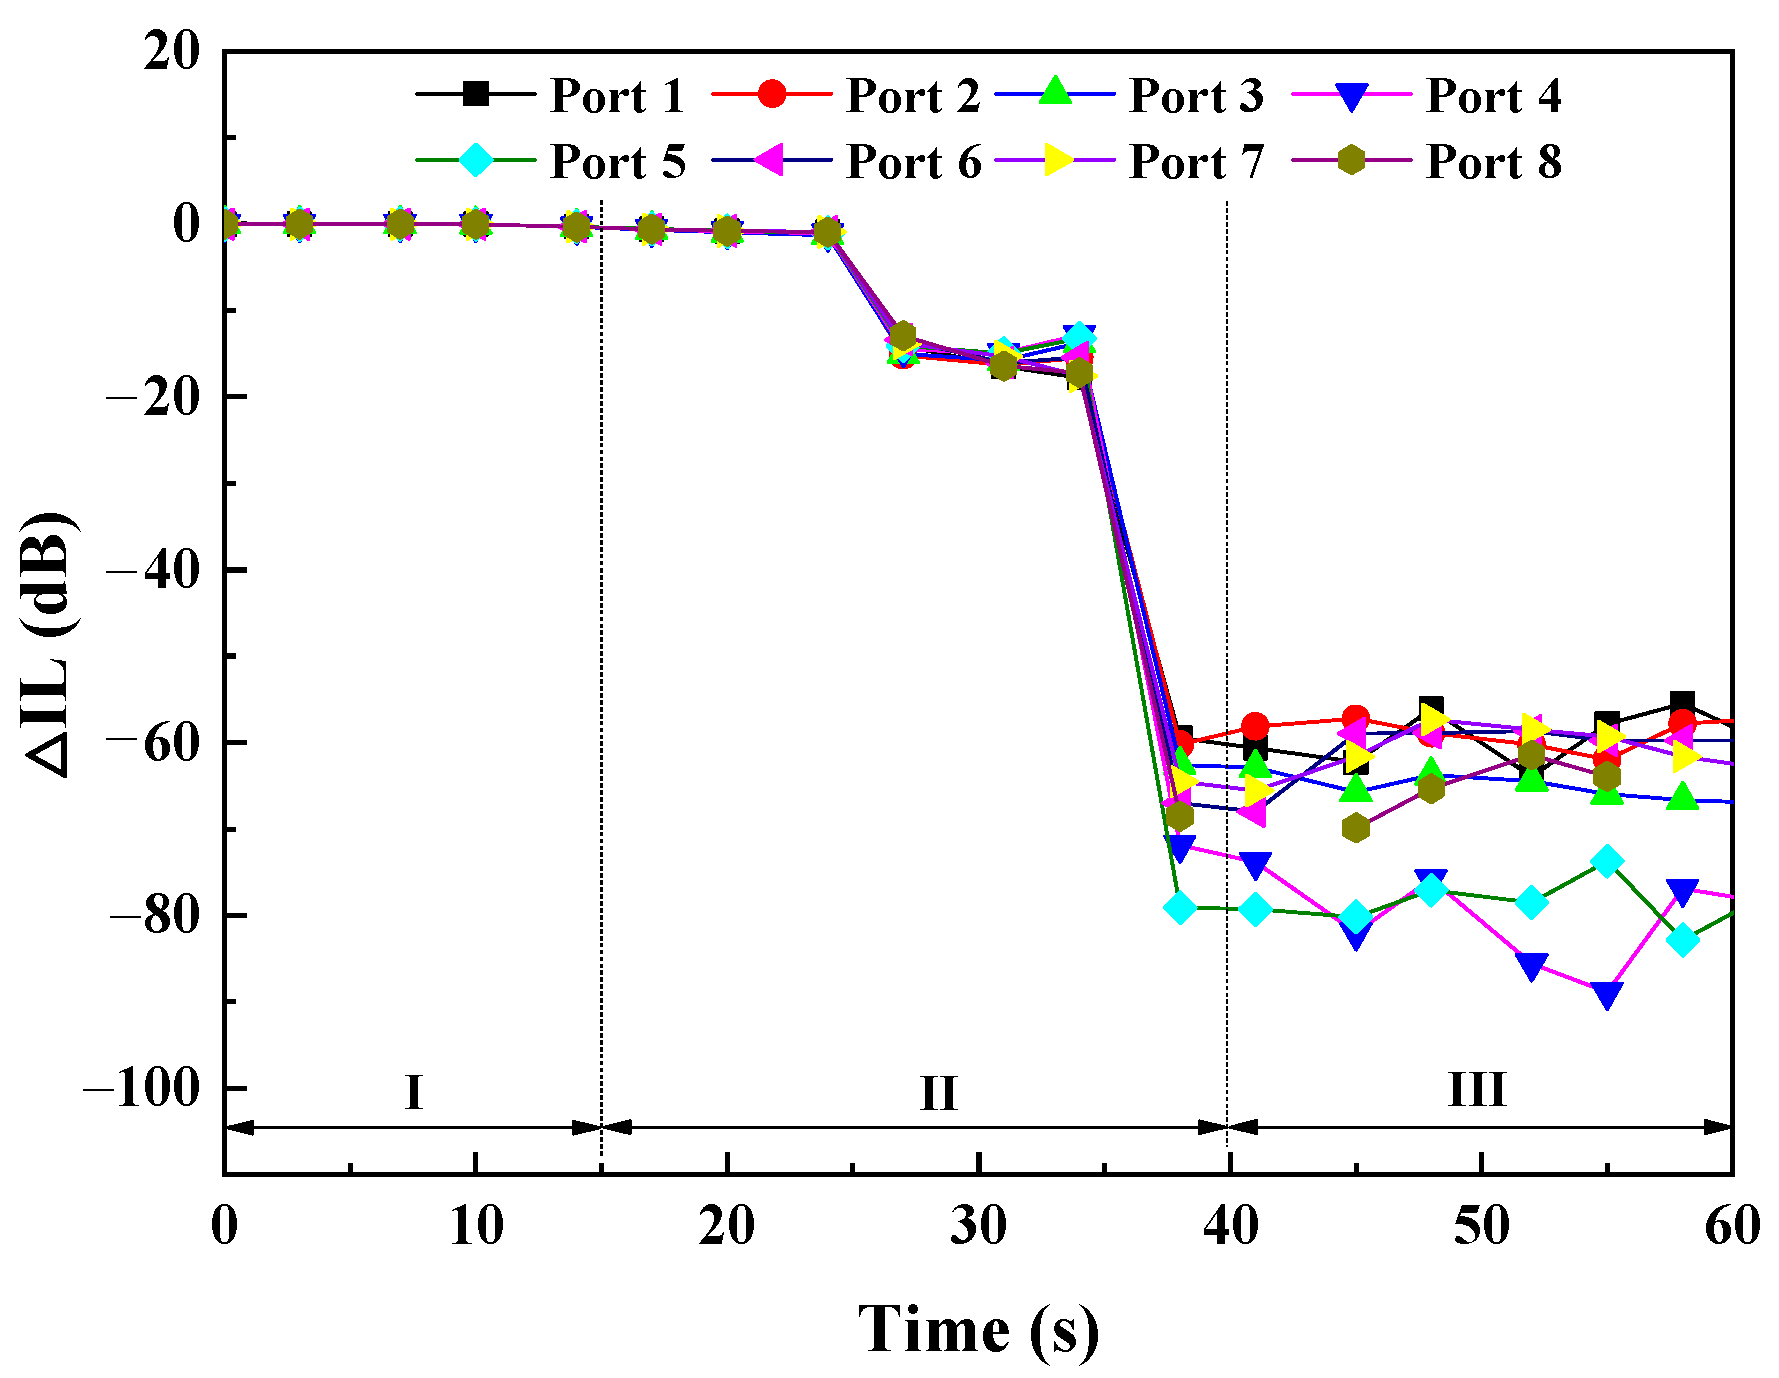
IL is one of the important optical characteristic indexes of PLC optical splitters [10]. Detachment and deviation at the connection interface have the greatest influence on IL. As described in Section 2.2, during the uniaxial tensile test of the specimen, the IL at 1.55 μm wavelength of its eight output ports was monitored in situ by an optical power meter. In order to better compare and analyze the change of the optical performance of the eight ports with the damage degree of the PLC optical splitter, take the 15 s before loading, that is, the sample is in the clamping and static state, as the initial stage of the ΔIL-time curves. Typical ΔIL-time curves that were obtained under displacement and load control mode are shown in Figure 5 and Figure 6, respectively.
Figure 5 shows the ΔIL-time curves of a sample from stable standing to the beginning of uniaxial tensile loading to fracture in displacement-controlled mode. In Figure 5, the ΔIL-time curves can be clearly distinguished into three stages: stable standing Stage I, uniaxial tensile loading Stage II, and post-fracture Stage III. In Stage I, the ΔIL of each port was relatively stable and close to zero; in Stage II, the change of ΔIL of each port was basically similar, i.e., it dropped slowly to around −1 dB at the beginning, then dropped sharply to around −15 dB, and after a short stay (different from the load control mode, in the displacement control mode with a loading rate of 0.01 mm/s, even if the specimen has been fractured, the two fracture surfaces are still very close in the direction of the tensile axis in a short time, so the IL does not change much), the ΔIL of the eight ports dropped steeply to around −60 dB almost at the same instant.
In Figure 5, the ΔIL dropped sharply to about −15 dB, indicating that the damage at the adhesively-bonded joint has accumulated to the point that the adhesive layer loses its load-bearing capacity and partially or completely fractured. The failure characteristics are similar to brittle fractures. The second steep drop of ΔIL, that is, the ΔIL of eight ports dropped sharply to about −60 dB almost at the same time, indicating that the distance between the end face of the PLC chip and the end face of the fiber array are separated to completely lose the optical coupling ability.
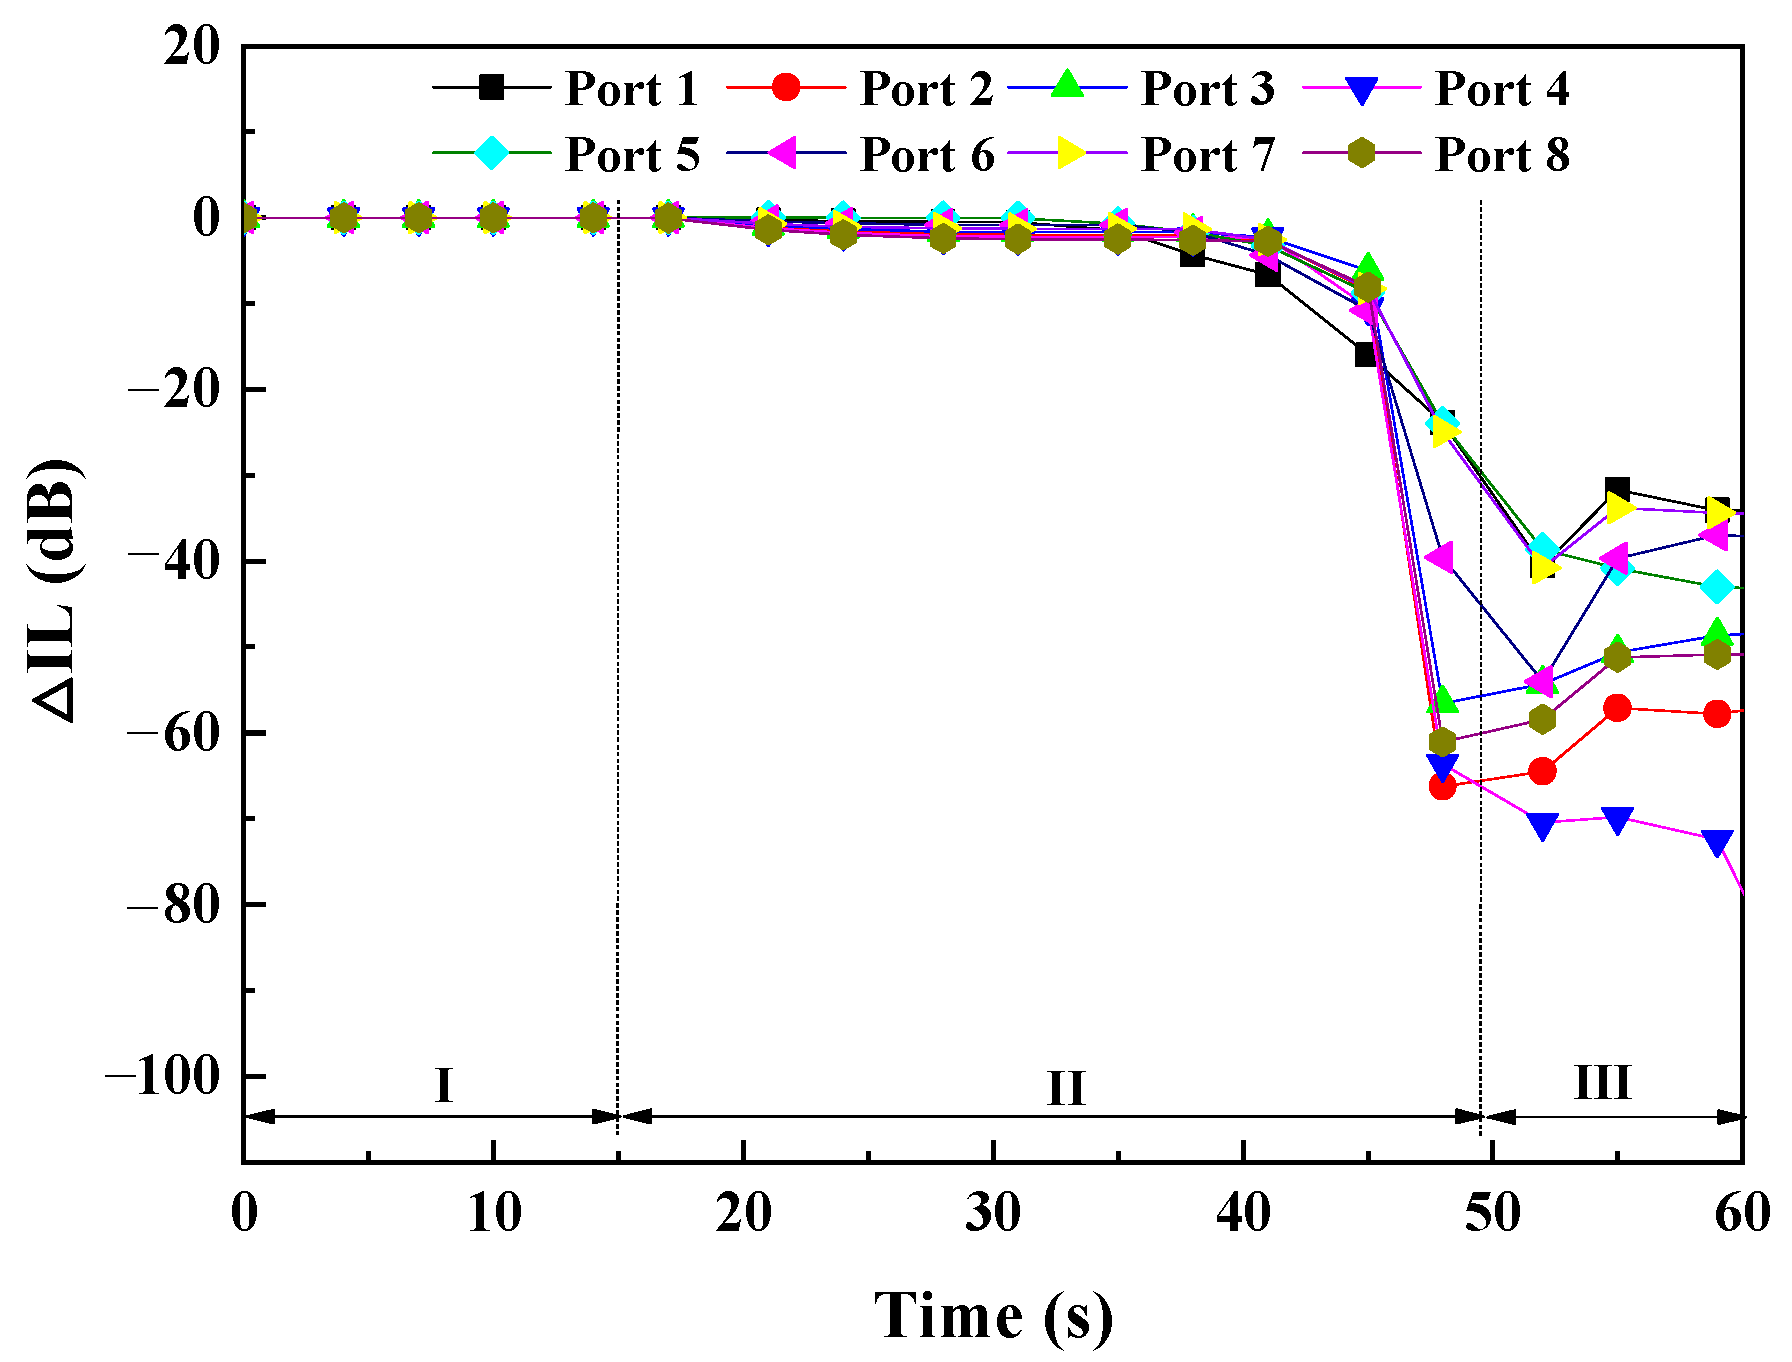
Figure 6 shows the ΔIL-time curves of a sample from stable standing to the beginning of uniaxial tensile loading to fracture in load-controlled mode. Similarly, the ΔIL-time curves can be divided into three stages: stable standing Stage I, uniaxial tensile loading Stage II, and post-fracture Stage III. As shown in Figure 6, in Stage II, the ΔIL of each port under uniaxial tensile loading has a similar trend with time, that is, it starts to slowly decrease relative to Stage I, and then the ΔIL of each port gradually decreases to approximately −10 dB, then quickly dropped below −20 dB. The ΔIL gradually decreases to about −10 dB over time, which reflects the gradual damage process of the adhesive layer. The ΔIL of each port drops sharply below −20 dB, indicating that the bonding interface has been completely separated.
Comparing Figure 5 and Figure 6, it can be observed that the two show significant differences in Stage II. Compared with Figure 5, the ΔIL of the eight ports in Figure 6 shows greater dispersion, and this dispersion becomes more significant with time. This can reflect that before the fracture, the internal damage of the specimen corresponding to Figure 6 was more serious than that of the specimen corresponding to Figure 5. It can be seen from Figure 5 and Figure 6 that after ΔIL < −5 dB, the optical power transmission of each port becomes more unstable, and this phenomenon can be attributed to the generation and further expansion of more micro-cracks at the bonding interface. As shown in Figure 5 and Figure 6, depending on the state of the sample, the ΔIL response in the ΔIL-time curve can be divided into three stages. In particular, in Stage II, the changing trend of the ΔIL-time curve can well reflect the deformation, damage, and debonding process of the adhesive layer under uniaxial tensile loading, revealing the use of measurable optical performance parameter IL can realize the in situ monitoring of the damage evolution process of the PLC optical splitter.
Based on the mechanical and optical performance response that was obtained from the experiment, through comparison and analysis, the corresponding relationship between the ΔIL and the damage degree of the PLC optical splitter is established, as shown in Table 2. In Table 2, the mechanical damage degree of the PLC optical splitter is divided into three categories: light damage, moderate damage, and severe damage, and the corresponding ΔIL values are (−5 dB; 0 dB], (−15 dB; −5 dB], and (−∞, −15 dB], respectively.
It should be pointed out that based on this correspondence, it can be used to preliminarily evaluate the damage degree of the weak area of the PLC optical splitter. However, due to the lack of a stress/strain field description, the characterization of the specific damage in the weak area needs to be further studied. Consequently, more advanced techniques, such as a digital image correlation (DIC) technique, are required for further study.
4. Conclusions
The mechanical and optical properties of the silica-based 1 × 8 PLC optical splitter during the entire loading process until fracture were studied through in situ uniaxial tensile experiments. During the tensile test, the IL of the samples was measured in real-time to explore the in situ damage monitoring capability of PLC optical splitters. The following specific conclusions can be drawn:
- Under uniaxial tensile loading, the tensile strength of the PLC optical splitter shows dependence on the loading rate. This phenomenon may be related to the viscoelastic effect of the adhesive layer material.
- The experimental results show that the fiber array-PLC chip adhesively-bonded joints are the weak areas of the PLC optical splitter. Compared with the adhesively-bonded 1-channel input fiber array-PLC chip joint, the adhesively-bonded 8-channel output fiber array-PLC chip joint is more susceptible to damage.
- The failure modes of the adhesively-bonded fiber array-PLC chip joints of all the samples showed mixed failure modes. Among them, cohesive failure usually occurs near the v-groove and the optical fiber, and adhesive/interfacial failure often occurs at the edge of the bonding interface.
- Based on the experimental results and phenomena, the corresponding relationship between the ΔIL at 1.55 μm wavelength and PLC optical splitters damage degree is established. That is, the ΔIL corresponding to light damage, moderate damage, and severe damage are (−5 dB; 0 dB], (−15 dB; −5 dB], (−∞, −15 dB], respectively.
- This study shows that the local damage behavior of the PLC optical splitter is reflected in the optical activity, and the measurable optical performance index IL provides valuable information about the damage process of its internal materials. A method is proposed to indirectly assess the degree of mechanical damage of PLC optical splitters through measurable optical properties.
Author Contributions
Conceptualization, Y.Z.; Data curation, Y.Z., L.J. and J.C.; Formal analysis, Y.Z. and L.J.; Funding acquisition, Y.Z. and J.D.; Investigation, J.C. and J.L.; Methodology, Y.Z. and L.J.; Project administration, Y.Z.; Resources, J.L. and J.D.; Supervision, J.D.; Writing—original draft, Y.Z. and L.J.; Writing—review & editing, Y.Z., L.J., J.C. and J.L. All authors have read and agreed to the published version of the manuscript.
Funding
This work was financially supported by the National Natural Science Foundation of China (Grant no. 52175445), the State Key Laboratory of High Performance Complex Manufacturing, Central South University (Grant no. ZZYJKT2020-09), and the Natural Science Foundation of Hunan Province, China (Grant no. 2020JJ4247).
Institutional Review Board Statement
Not applicable.
Informed Consent Statement
Not applicable.
Data Availability Statement
Not applicable.
Conflicts of Interest
The authors declare no conflict of interest.
References
- Serecunova, S.; Seyringer, D.; Uherek, F.; Seyringer, H. Waveguide Shape and Waveguide Core Size Optimization of Y-Branch Optical Splitters up to 128 Splitting Ratio. Opt. Commun. 2021, 501, 127362. [Google Scholar] [CrossRef]
- Wang, H.-T.; Chen, C.-F.; Chi, S. A Numerical Solution for Broadband PLC Splitter with Variable Splitting Ratio Based on Asymmetric Three Waveguide Structures. Appl. Sci. 2019, 9, 1892. [Google Scholar] [CrossRef] [Green Version]
- Shi, X.; Yang, W.; Xing, H.; Chen, X. Design of Power Splitters Based on Hybrid Plasmonic Waveguides. Appl. Sci. 2021, 11, 8644. [Google Scholar] [CrossRef]
- Kawachi, M. Silica Waveguides on Silicon and Their Application to Integrated-Optic Components. Opt. Quantum Electron. 1990, 22, 391–416. [Google Scholar] [CrossRef]
- Žuti, I.; Kompanć, A. Testing optical splitters. In Proceedings of the 2014 37th International Convention on Information and Communication Technology, Electronics and Microelectronics (MIPRO), Opatija, Croatia, 26–30 May 2014; pp. 1650–1653. [Google Scholar] [CrossRef]
- Splitter, L.O.P.; Wang, L.; An, J.; Wu, Y.; Zhang, J.; Wang, Y.; Li, J.; Wang, H. Design and Fabrication of Novel Symmetric Low-Loss 1 × 24 Optical Power Splitter. J. Lightwave Technol. 2014, 32, 3112–3118. [Google Scholar] [CrossRef]
- Aratake, A. High Reliability of Silica-Based 1 × 8 Optical Splitter Modules for Outside Plant. J. Lightwave Technol. 2016, 34, 227–232. [Google Scholar] [CrossRef]
- Xiao, G.Z.; Zhang, Z.; Grover, C.P. Adhesives in the Packaging of Planar Lightwave Circuits. Int. J. Adhes. Adhes. 2004, 24, 313–318. [Google Scholar] [CrossRef]
- Zheng, Y.; Duan, J.A. Transmission Characteristics of Planar Optical Waveguide Devices on Coupling Interface. Optik 2013, 124, 5274–5279. [Google Scholar] [CrossRef]
- Ryu, J.H.; Kim, P.J.; Cho, C.S.; Lee, E.-H.; Kim, C.-S.; Jeong, M.Y. Optical Interconnection for a Polymeric PLC Device Using Simple Positional Alignment. Opt. Express 2011, 19, 8571. [Google Scholar] [CrossRef] [PubMed]
- Maruno, T.; Hanawa, F.; Kitoh, T. Low-Loss and Stable Fiber-to-Waveguide Connection Utilizing UV Curable Adhesive. IEEE Photonics Technol. Lett. 1992, 4, 906–908. [Google Scholar] [CrossRef]
- Tan, C.W.; Chan, Y.C.; Chan, H.P.; Leung, N.W.; So, C.K. Investigation on Bondability and Reliability of UV-Curable Adhesive Joints for Stable Mechanical Properties in Photonic Device Packaging. Microelectron. Reliab. 2004, 44, 823–831. [Google Scholar] [CrossRef]
- Yacobi, B.G.; Martin, S.; Davis, K.; Hudson, A.; Hubert, M. Adhesive Bonding in Microelectronics and Photonics. J. Appl. Phys. 2002, 91, 6227–6262. [Google Scholar] [CrossRef]
- Yoshida, J.; Yamada, M.; Terui, H. Packaging and Reliability of Photonic Components for Subscriber Network Systems. IEEE Trans. Compon. Hybrids Manuf. Technol. 1993, 16, 778–782. [Google Scholar] [CrossRef]
- Hibino, Y.; Hanawa, F.; Nakagome, H.; Ishii, M.; Takato, N. High Reliability Optical Splitters Composed of Silica-Based Planar Lightwave Circuits. J. Light. Technol. 1995, 13, 1728–1735. [Google Scholar] [CrossRef]
- Zheng, Y.; Xia, B.; Gao, P.; Wu, X.; Xiao, Z. Novel Research on Reliability of Silica-Based PLC Optical Splitters. Optik 2019, 178, 1294–1301. [Google Scholar] [CrossRef]
- Zheng, Y.; Xia, B.; Jiang, L.; Wu, X.; Duan, J. Research on Drop Reliability of PLC Optical Splitters by Online Test. Optik 2020, 217, 164890. [Google Scholar] [CrossRef]
- Wang, L.; An, J.; Wu, Y.; Wang, Y.; Zhang, J.; Li, J.; Wang, H.; Zhang, X.; Pan, P.; Dai, H.; et al. A Compact 1 × 64 Optical Power Splitter Using Silica-Based PLC on Quartz Substrate. Opt. Laser Technol. 2014, 61, 45–49. [Google Scholar] [CrossRef]
- Wang, L.; An, J.; Wu, Y.; Zhang, J.; Wang, Y.; Li, J.; Wang, H.; Zhang, X.; Pan, P.; Zhang, L.; et al. A Compact and Low-Loss 1 × 8 Optical Power Splitter Using Silica-Based PLC on Quartz Substrate. Opt. Commun. 2014, 312, 203–209. [Google Scholar] [CrossRef]
- Piccirillo, A.; Zaffiro, G.; Tambosso, T.; Gallo, G. Reliability of Optical Branching Devices. IEEE J. Sel. Top. Quantum Electron. 1999, 5, 1413–1417. [Google Scholar] [CrossRef]
- Zheng, Y.; Jiang, L.; Xia, B.; Wu, X.; Duan, J. Online Research on Reliability of Thermal-Vibration Coupling for PLC Optical Splitters. IEEE Trans. Device Mater. Reliab. 2020, 20, 351–357. [Google Scholar] [CrossRef]
- Hibino, Y. Silica-Based Planar Lightwave Circuits and Their Applications. MRS Bull. 2017, 28, 365–371. [Google Scholar] [CrossRef]
- Uddin, M.A.; Chan, H.P. 8—Adhesive technology for photonics. In Advanced Adhesives in Electronics; Woodhead Publishing: Cambridge, UK, 2011; pp. 214–258. [Google Scholar] [CrossRef]
- Rudawska, A.; Debski, H. Experimental and Numerical Analysis of Adhesively Bonded Aluminium Alloy Sheets Joints. Eksploat. Niezawodn. Maint. Reliab. 2011, 1, 4–10. [Google Scholar]
- Mazurkiewicz, D. Tests of Extendability and Strength of Adhesive-Sealed Joints in the Context of Developing a Computer System for Monitoring the Condition of Belt Joints during Conveyor Operation. Eksploat. Niezawodn. Maint. Reliab. 2010, 47, 34–39. [Google Scholar]
- Xun, W.; Jian-ping, L.; Hai-lang, W. Research Progress in Effect of Aluminum Surface Properties on Adhesively Bonded Performance. J. Mater. Eng. 2017, 45, 123–131. [Google Scholar] [CrossRef]
- Galliot, C.; Rousseau, J.; Verchery, G. Drop Weight Tensile Impact Testing of Adhesively Bonded Carbon/Epoxy Laminate Joints. Int. J. Adhes. Adhes. 2012, 35, 68–75. [Google Scholar] [CrossRef]
- Yao, M.; Zhu, D.; Yao, Y.; Zhang, H.; Mobasher, B. Experimental Study on Basalt FRP/Steel Single-Lap Joints under Different Loading Rates and Temperatures. Compos. Struct. 2016, 145, 68–79. [Google Scholar] [CrossRef]
- Liu, J.; Guo, T.; Hebdon, M.H.; Liu, Z.; Wang, L. Bonding Behaviors of GFRP/Steel Bonded Joints after Wet-Dry Cyclic and Hygrothermal Curing. Appl. Sci. 2020, 10, 5411. [Google Scholar] [CrossRef]
- Kanani, A.Y.; Hou, X.; Laidlaw, R.; Ye, J. The Effect of Joint Configuration on the Strength and Stress Distributions of Dissimilar Adhesively Bonded Joints. Eng. Struct. 2021, 226, 111322. [Google Scholar] [CrossRef]
- Wang, S.; Liang, W.; Duan, L.; Li, G.; Cui, J. Effects of Loading Rates on Mechanical Property and Failure Behavior of Single-Lap Adhesive Joints with Carbon Fiber Reinforced Plastics and Aluminum Alloys. Int. J. Adv. Manuf. Technol. 2020, 106, 2569–2581. [Google Scholar] [CrossRef]
Figure 1.
The typical structure of 1 × 8 PLC optical splitters: (a) side view of a PLC optical splitter module and (b) the top view of the PLC (splitter) chip [22].
Figure 1.
The typical structure of 1 × 8 PLC optical splitters: (a) side view of a PLC optical splitter module and (b) the top view of the PLC (splitter) chip [22].

Figure 2.
(a) Typical load-displacement curves under different loading rates until their ultimate failure. (b) Load-time curves corresponding to (a).
Figure 2.
(a) Typical load-displacement curves under different loading rates until their ultimate failure. (b) Load-time curves corresponding to (a).

Figure 3.
Typical optical micrograph of fracture surfaces of a Type I fracture: (a) 8-channel fiber array end face; (b) PLC chip end face (the bonging medium in the picture is used to bond the lid glass to the PLC chip); (c) edge of PLC chip end face. (A = adhesive/interfacial failure, C = cohesive failure).

Figure 4.
Typical optical micrograph of failure surfaces of a Type II fracture: (a) 1-channel fiber array end face; (b) PLC chip end face. (A = adhesive/interfacial failure, C = cohesive failure).
Figure 4.
Typical optical micrograph of failure surfaces of a Type II fracture: (a) 1-channel fiber array end face; (b) PLC chip end face. (A = adhesive/interfacial failure, C = cohesive failure).

Figure 5.
Typical ΔIL-time curves at 1.55 μm wavelength for eight output ports in a 1 × 8 PLC optical splitter module in displacement control mode.
Figure 5.
Typical ΔIL-time curves at 1.55 μm wavelength for eight output ports in a 1 × 8 PLC optical splitter module in displacement control mode.

Figure 6.
Typical ΔIL-time curves at 1.55 μm wavelength for eight output ports in a 1 × 8 PLC optical splitter module in load control mode.
Figure 6.
Typical ΔIL-time curves at 1.55 μm wavelength for eight output ports in a 1 × 8 PLC optical splitter module in load control mode.


Table 1.
Summary of the test results of the 1 × 8 PLC optical splitter modules.
| Loading Control Modes | Loading Rate | Average Failure Load (N) | Standard Deviation (N) | No. of Specimens |
|---|---|---|---|---|
| Displacement control | 0.01 mm/s | 16.31 | 2.07 | 5 |
| Load control | 0.1 N/s | 5.73 | 4.71 | 5 |
| Load control | 1 N/s | 11.56 | 6.11 | 5 |
Table 2.
The corresponding relationship between ΔIL at 1.55 μm wavelength and the damage degree of PLC optical splitters.
Table 2.
The corresponding relationship between ΔIL at 1.55 μm wavelength and the damage degree of PLC optical splitters.
| Insertion Loss Change (ΔIL) | Classification of Damage Degree |
|---|---|
| (−5 dB; 0 dB] | The bonding layer is slightly deformed with dispersed micro-defects and micro-cracks, that is, light damage. |
| (−15 dB; −5 dB] | As the deformation of the bonding layer increases, the micro-defects and micro-cracks of the bonding layer further extend and the propagation of some micro-cracks may cause local debonding of the interface, that is, moderate damage. |
| (−∞, −15 dB] | Crack unstable propagation, adhesively-bonded joints lose load-bearing capacity, and the bonding interface is almost or completely separated, that is, severe damage. |
Publisher’s Note: MDPI stays neutral with regard to jurisdictional claims in published maps and institutional affiliations. |
© 2022 by the authors. Licensee MDPI, Basel, Switzerland. This article is an open access article distributed under the terms and conditions of the Creative Commons Attribution (CC BY) license (https://creativecommons.org/licenses/by/4.0/).
Share and Cite
MDPI and ACS Style
Zheng, Y.; Jiang, L.; Cheng, J.; Liu, J.; Duan, J. Experimental Research on In Situ Uniaxial Tensile Response of Silica-Based PLC Optical Splitters. Appl. Sci. 2022, 12, 5778. https://doi.org/10.3390/app12125778
AMA Style
Zheng Y, Jiang L, Cheng J, Liu J, Duan J. Experimental Research on In Situ Uniaxial Tensile Response of Silica-Based PLC Optical Splitters. Applied Sciences. 2022; 12(12):5778. https://doi.org/10.3390/app12125778
Chicago/Turabian StyleZheng, Yu, Lianqiong Jiang, Jie Cheng, Jianzhe Liu, and Ji’an Duan. 2022. "Experimental Research on In Situ Uniaxial Tensile Response of Silica-Based PLC Optical Splitters" Applied Sciences 12, no. 12: 5778. https://doi.org/10.3390/app12125778
Note that from the first issue of 2016, this journal uses article numbers instead of page numbers. See further details here.