1. Introduction
With the development of the social economy, people pay more attention to water environment problems. At the same time, the problem of point source pollution is gradually being solved and effectively controlled [
1]. However, non-point source pollution with urban rainwater runoff pollution as the main pollution source threatens the health of the urban water environment [
2]. Research on the urban water environment shows that even if the problem of urban sewage pollution is solved, urban rainwater runoff pollution will still hinder the improvement of receiving water quality [
3]. Even with diverted drainage systems, stormwater runoff pollution can degrade water quality and accelerate biodiversity loss in rivers [
4]. Rainwater runoff that is dumped directly into an urban water body without taking necessary precautions will harm the urban water ecosystem. As a result, adopting steps to reduce stormwater runoff pollution is critical to improving the urban water environment.
Traditional stormwater management methods are not enough to solve the problem of stormwater runoff pollution, such as drainage system renovation or traditional grey infrastructure construction [
5]. In recent years, the construction of sponge cities in China, the Sustainable Urban Drainage System (SUDS) in the UK, Water Sensitive Urban Design (WSUD) in Australia, and LID in North America have all brought new ideas to widely used urban stormwater management and demonstrated that Effective in stormwater management [
6]. China is carrying out extensive sponge city construction, and one of the purposes of sponge city construction is to reduce pollution from stormwater runoff [
7]. Enhancing sponge cities with recommended strategies can increase the economic, environmental, and architectural sustainability of metropolitan regions [
8]. Since 2015, China has carried out sponge city construction pilot projects in 30 cities in two batches, accumulating a lot of practical experience and theoretical research, especially in the control of runoff pollution based on initial runoff volume capture [
9]. From 2021 to the next five years, China will systematically carry out the construction of sponge cities in the whole region, which will bring new opportunities for research related to the reduction of runoff pollution. When dealing with high-frequency rainfall, LID facilities primarily focus on rainwater source control, which has a good runoff control impact and may effectively minimize total runoff, peak volume, and the peak present time [
10]. Different LID facility combination schemes can be quantitatively analyzed using model simulation, taking into account various factors such as total runoff control, pollutant control, and cost to conduct a structured evaluation of facility combination schemes and select the optimal scheme for current conditions [
11].
The stormwater management model (SWMM), MIKE Urban, Info Works ICM, and other drainage models have been widely used in stormwater management and achieved satisfactory results [
12]. The SWMM model is often used to simulate the rainwater runoff control effect of LID facilities, and the potential factors affecting the LID runoff control effect can be analyzed through multiple rainfall simulations [
13]. Over the years, the code integrity of the SWMM model has continued to increase, and it is widely used in China. At present, the research on the rainwater runoff and pollutant control effects of actual projects in the acceptance of sponge cities mainly relies on SWMM [
14].
Some research has concentrated on the scouring effect during the early stages of rainfall, demonstrating that sponge city source facilities have a positive impact on runoff pollution management [
15]. In the related research on the reduction of rainwater runoff pollution, some studies directly use the control volume of rainwater runoff to represent the amount of runoff pollution reduction [
16,
17]. However, the relationship between volume control rate and pollutant control rate is not clear. There are some studies that focus specifically on reducing the overall number of pollutants. By comparing the total reduction of runoff pollutants before and after the construction of the facility, the effect of the facility in controlling runoff pollution is measured [
18]. However, further research on the relationship between pollution reduction and facility size (runoff volume control) is needed. Traditional runoff pollution control impact evaluations cannot account for the interaction between facility type, design size, rainfall intensity, rainfall duration, and rainfall return period on runoff pollution reduction.
One of the sponge city construction core indexes mentioned in
Sponge City Construction Technical Guide-Low Impact Development Rainwater System (Trial) is the annual runoff volume control rate. The design rainfall (H) can be determined through the total runoff control rate, and then the design scale of low-impact development facilities for sponge city construction can be determined through the design rainfall (H). Therefore, the determination of the total annual runoff control rate is directly related to the determination of the size of the source facilities of the sponge city construction, which in turn affects the removal effect of runoff pollutants. The above analysis shows that the control of runoff pollution is mainly achieved through volume control in the construction of sponge cities, and the calculation of runoff pollution is based on the total amount of runoff pollution and the response connection between particular runoff volume and runoff pollutant reduction is yet unknown. The implementation of the total runoff control target includes the reduction and utilization of rainwater, and the main technical measures include infiltration technology and storage technology, and relevant facilities include permeable pavement, grass planting ditch, bioretention pond, rainwater tank, wet pond, rainwater wetland and large (multi-functional) storage facilities [
19].
Existing studies mainly focus on the runoff control effect and pollutant reduction effect of a single facility or catchment zone [
20,
21]. There is a dearth of analysis and study on the reduction effect of rainwater runoff pollution under various facilities and scenarios, with total annual runoff control as the main indication in the development of sponge city. The total annual runoff control rate is calculated using the year as the time unit, and the runoff volume is mostly regulated by the facility’s scale and size. The runoff pollution induced by small and medium-sized rainfall, particularly the early rainfall with the initial scouring impact, is substantially more problematic since the pollutants do not correlate to the rainfall uniformly [
22]. The total control mode only controls the total runoff volume and cannot reflect the control proportion of pollution. This leads to ambiguous answers to a number of concerns, including the control effect of source facilities on runoff pollution under various land use features and the scope of initial runoff volume capture rate application.
This work offers a novel dimensionless constant (Dc) for the control impact of runoff pollution in order to explore the response connection between the initial runoff volume capture of sponge city construction and the control of runoff pollution. The following quantitative analyses were performed using the SWMM model: (1) the relationship between the scale of sponge city construction facilities (the control rate of total annual runoff) and the volume control of runoff; (2) the response relationship between the design size of typical source volume control facilities (bioretention, permeable pavement, rain barrels) and the reduction of pollutants in urban stormwater runoff; (3) effects of different facility combinations, underlying surface types and other factors on the control effect of stormwater runoff pollution. The relevant research methods used in this study can aid in the selection and optimization of sponge facilities during the planning and design stages, as well as provide a decision-making basis for sponge facility operation and maintenance during the maintenance and management stages, and guide the further development of sponge cities construction.
2. Methods
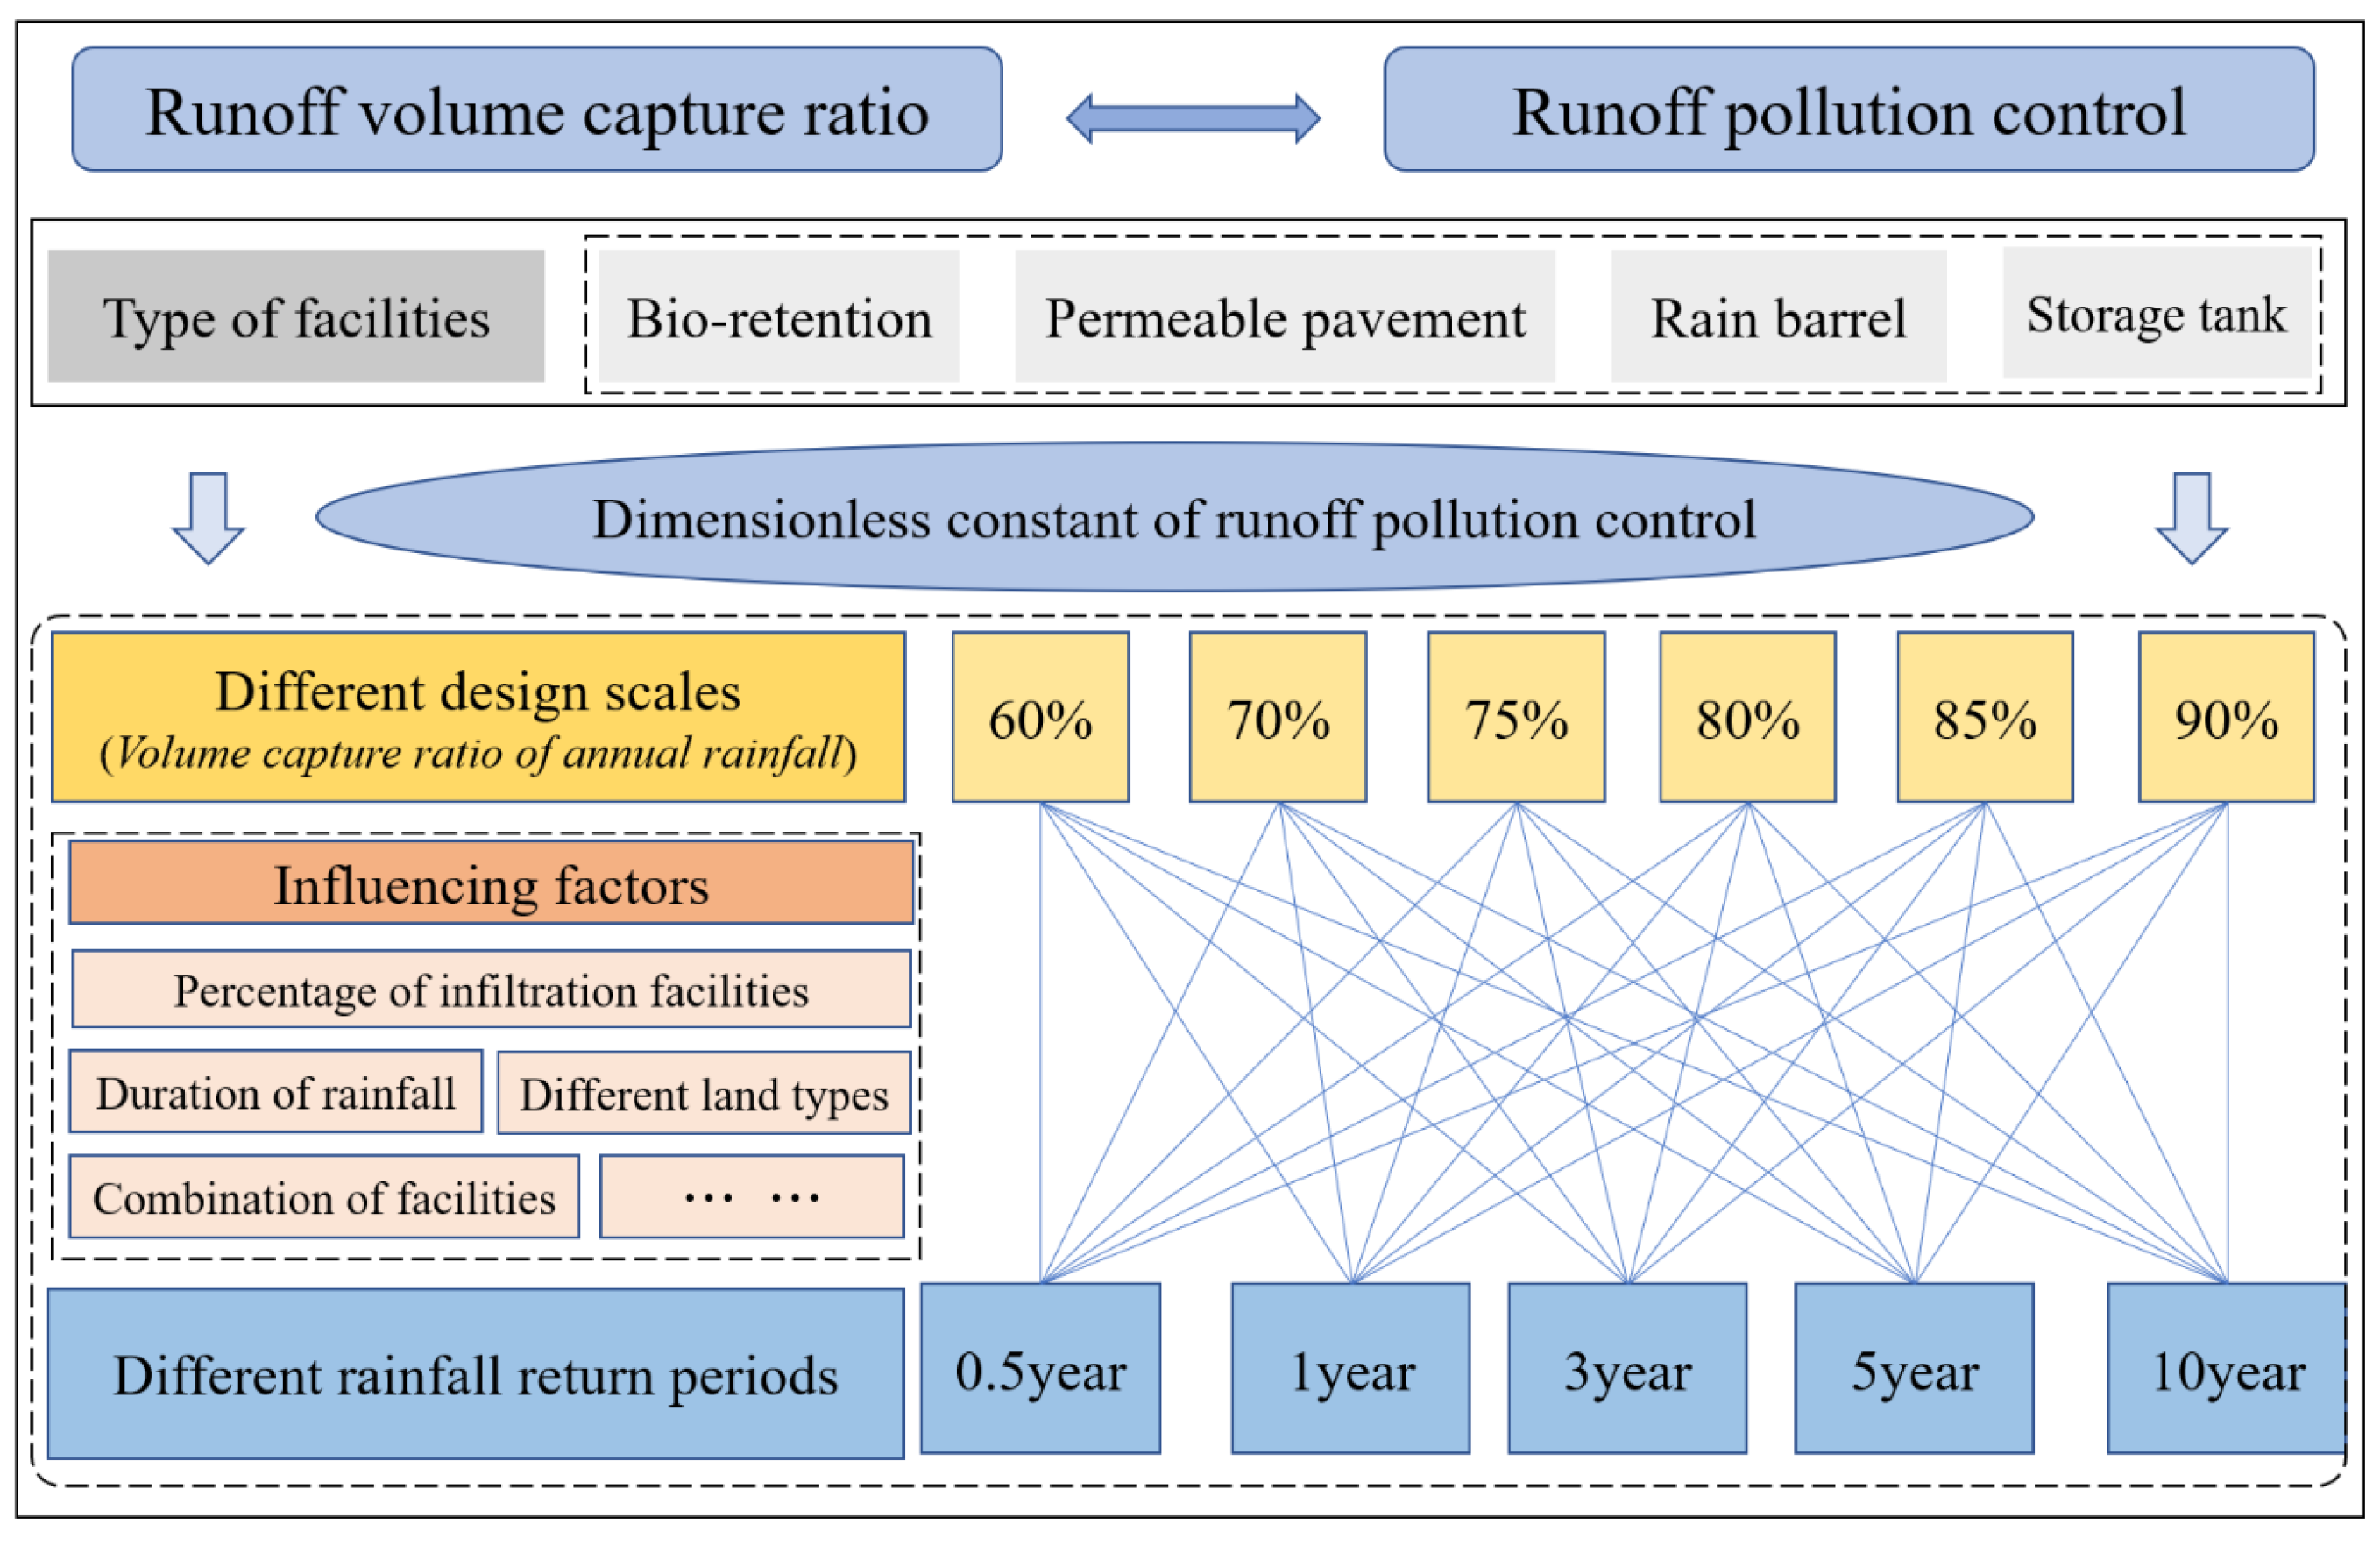
The comprehensive methodological framework is presented in
Figure 1 and is used to evaluate the control effect of source facilities on runoff pollution in sponge city construction, to analyze the response relationship between runoff volume control and runoff pollution control, and to evaluate the control effect of source facilities on runoff pollution under various circumstances.
2.1. Study Area
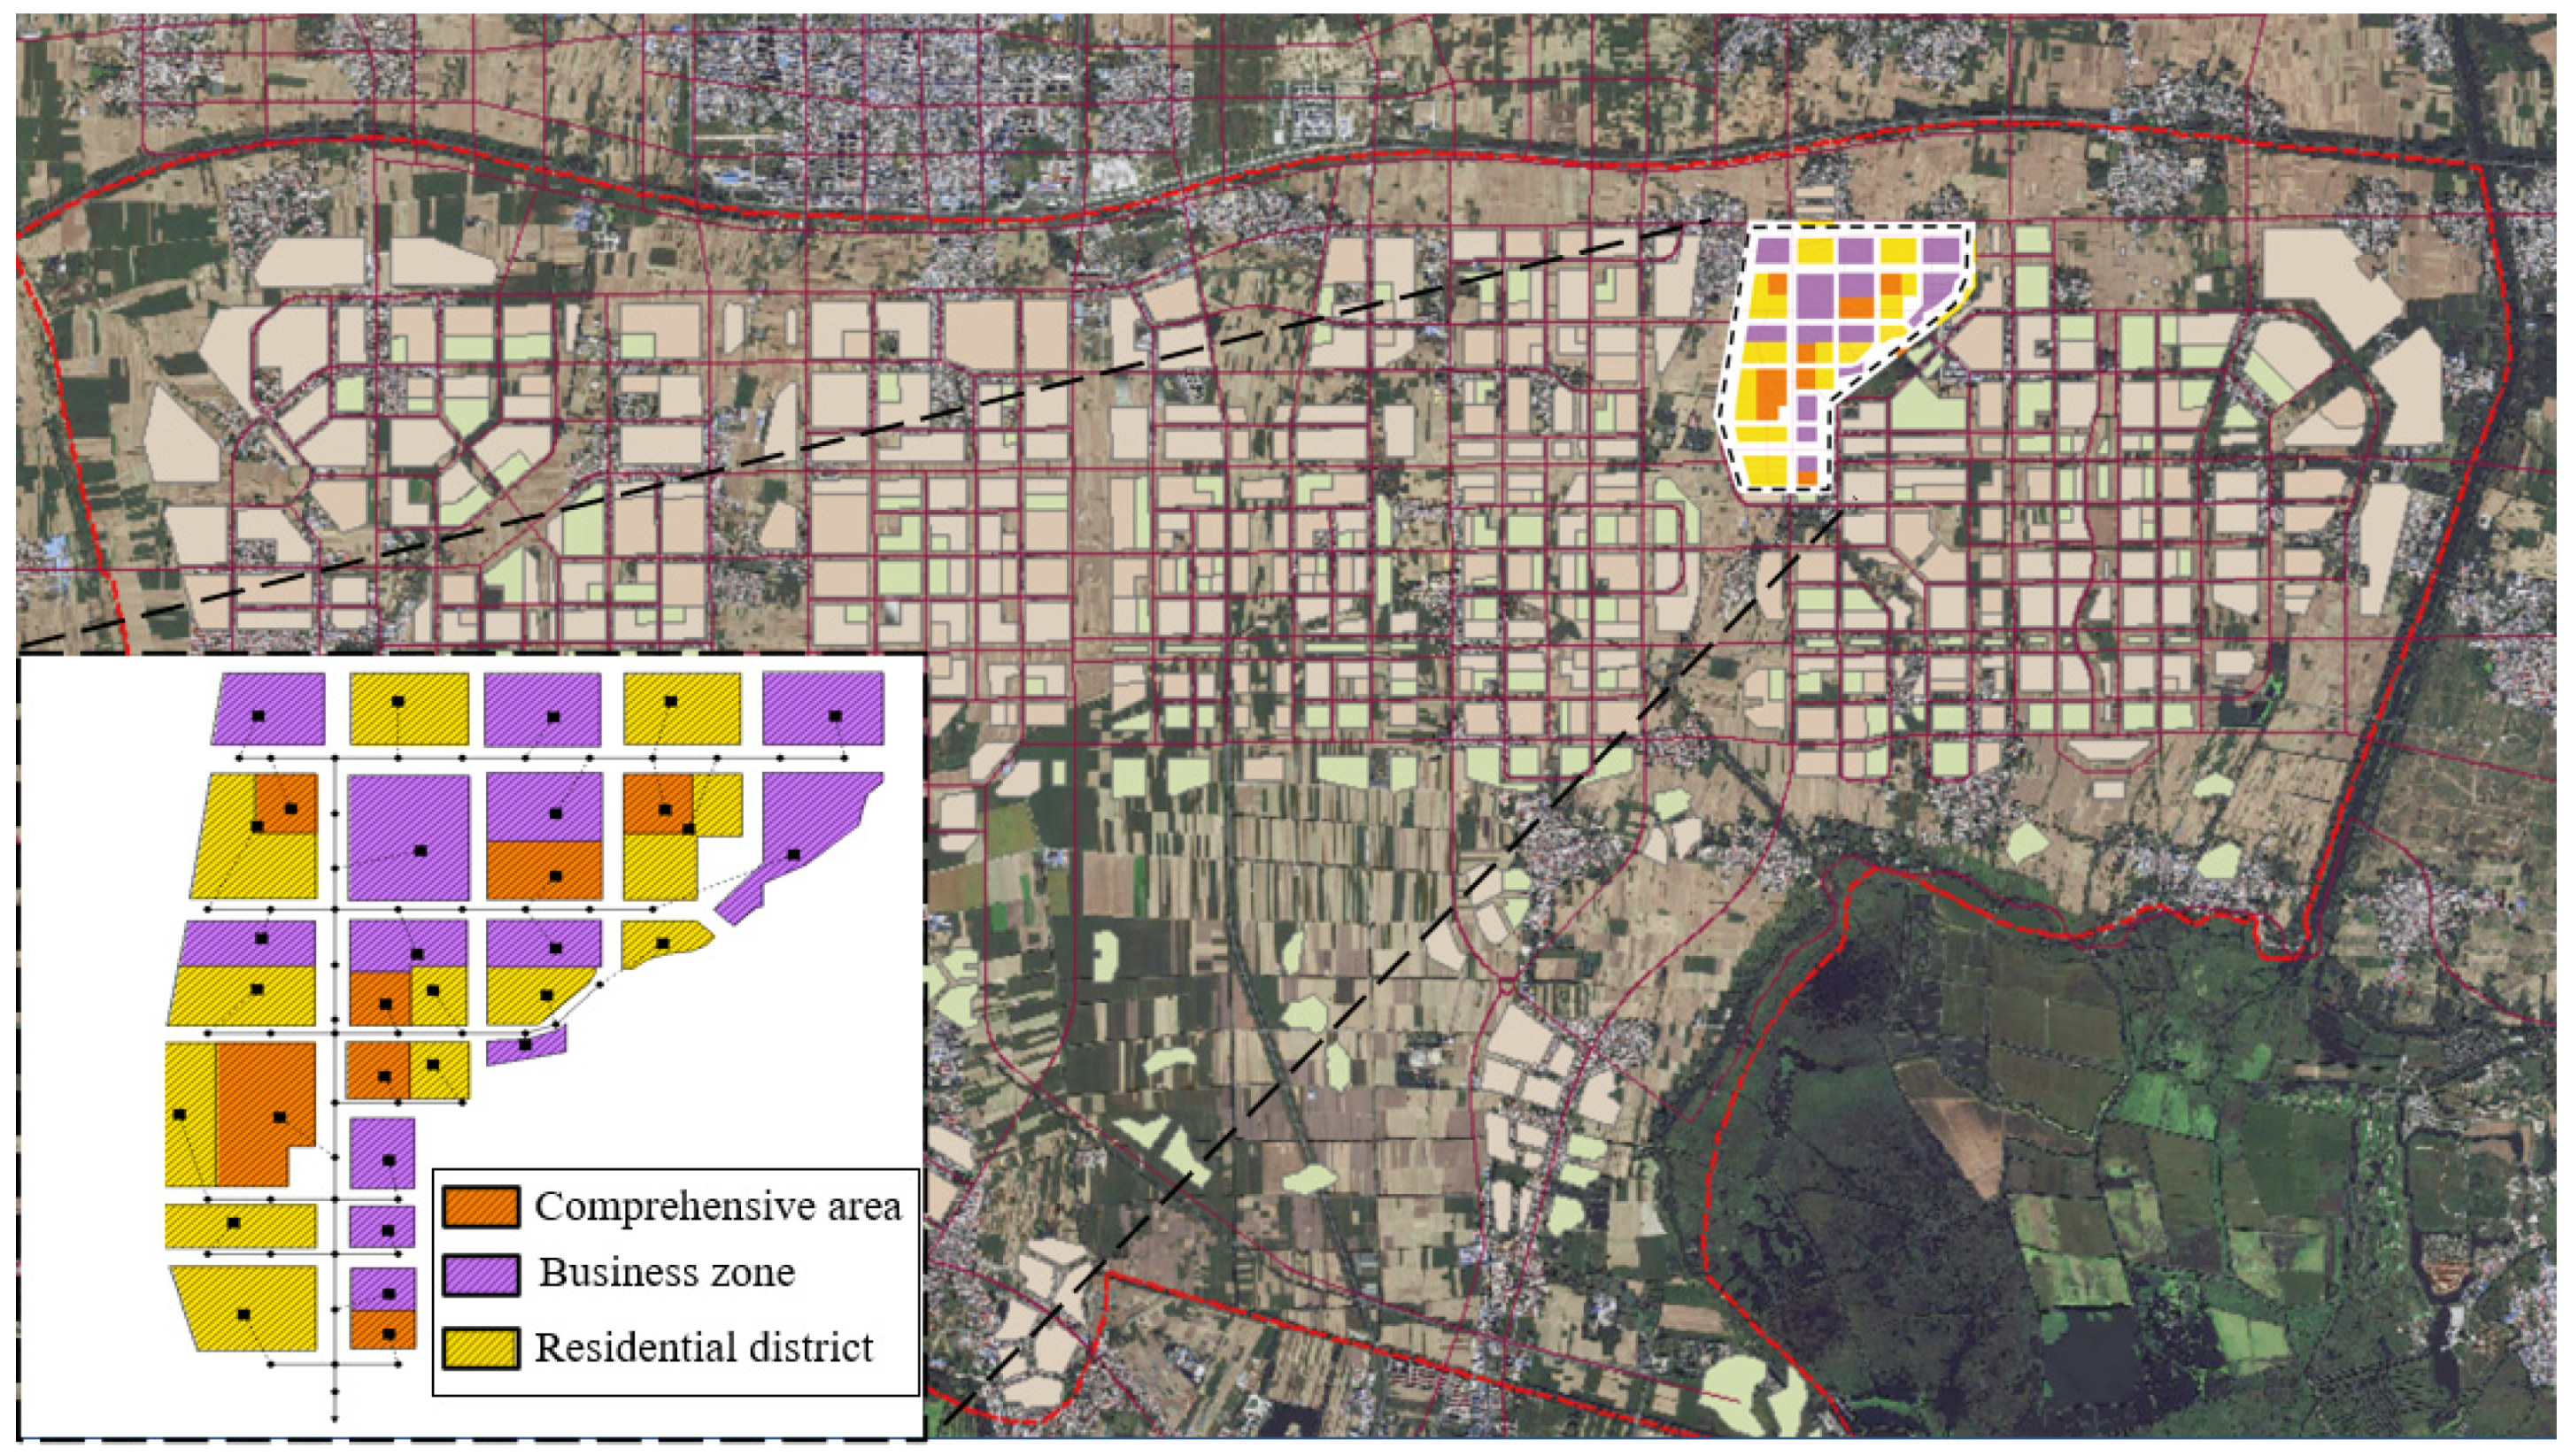
In a city in northern China, an area with an independent municipal pipeline network in the central part is selected as the generalized model area. The total area of the catchment in the study is 243 hm2, the maximum distance from north to south is 2.7 km, and the maximum distance from east to west is 2.1 km. The study area is divided into 32 sub-catchment areas, including 12 residential areas with a total area of 99 hm2; 13 commercial areas with a total area of 100 hm2; and 7 comprehensive areas with a total area of 44 hm2. The smallest plot area is 2 hm2, the largest plot area is 17 hm2, and the average plot size is 7.5 hm2.
Figure 2 depicts a geographical overview. Different colored blocks depict various forms of intended land use, such as comprehensive areas, commercial areas, and residential areas. Varied land use groups have different proportions of different types of underlying surfaces: residential area (20% roads, 50% buildings, 30% green spaces), commercial area (20% roads, 60% buildings, 20% green spaces), comprehensive area (30% roads, 40% buildings, 30% green spaces).
2.2. Model Description and Setup
2.2.1. Model Setup
SWMM is the most widely known open-source software that can be used for hydraulic and water quality simulation of urban stormwater networks and LID facilities [
6,
23]. SWMM version 5.1 of the United States (US) Environmental Protection Agency (EPA) was used for modeling both conventional drainage systems and LIDs [
24]. This study is based on SWMM 5.1 version.
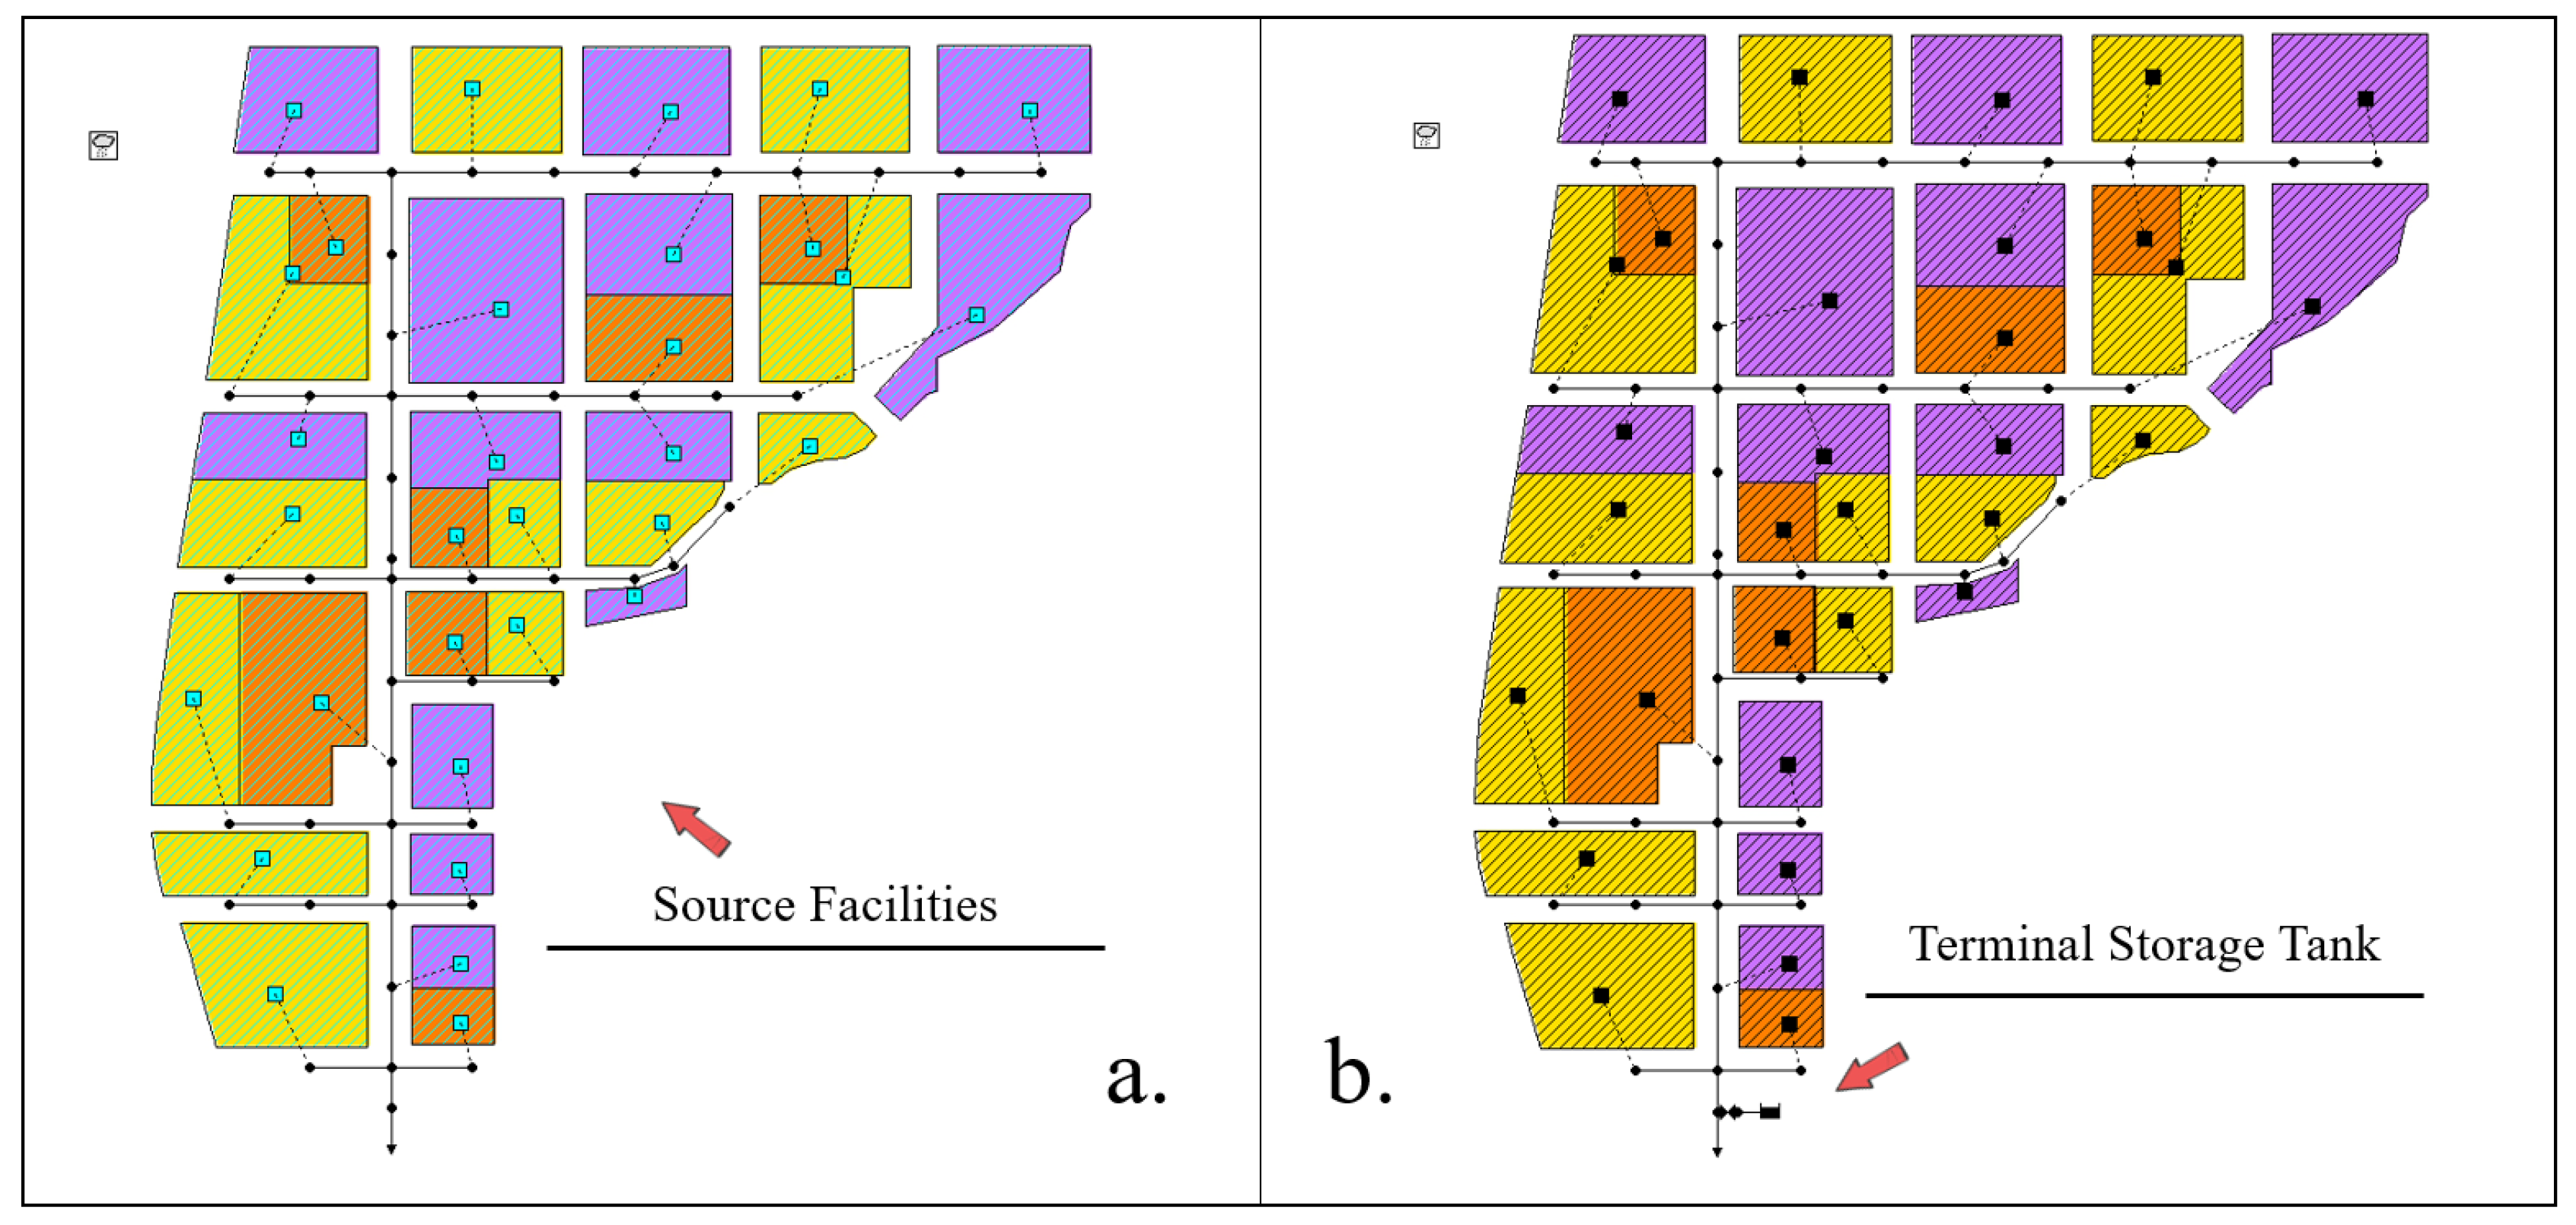
The performance of the LID practices in this study was evaluated by three groups. In Group 1, there are no stormwater runoff management measures in place; Set volume control measures for the source in Group 2 and the terminal in Group 3. The three groups are subdivided into multiple SWMM models according to different design scales (divided by 60%, 70%, 75%, 80%, 85%, and 90% of the total annual runoff control rate). The municipal rainwater pipeline is computed using a 5-year recurrence period, the pipe top is flat connected, and various control mechanisms are utilized to verify that the model’s hydrology and hydraulic parameters are consistent, as shown in
Figure 3.
Public green space, roadways, and building roofs are among the underlying surface types employed in the model of this research region. The parameters of the sub-catchment mainly include area, slope, impermeability, and width of the catchment. The water impermeability of the catchment area will be adjusted according to the proportion of regional green space. The infiltration calculation model is the Horton model, and the hydraulic calculation model is the Dynamic Wave. When calculating the comprehensive runoff coefficient, the runoff coefficient of green space is taken as 0.15, the runoff coefficient of buildings (roofs) is taken as 0.8, and the runoff coefficient of roads is taken as 0.9. The effective storage volume (Vs) includes the volume of the top of the facility and the water storage space inside the structure. The calculation formula is as follows: Vs = volume of stagnation layer-volume occupied by vegetation in the water storage part + void volume inside the structure.
2.2.2. Model Calibration and Validation
The study area mentioned in this article is currently under construction and is still in the planning phases. As a result, the data identified cannot be utilized to verify simulations. In order to address this problem, this study draws on the research group’s previous model parameters, which were simulated and confirmed to meet needs. The Nash–Sutcliffe Efficiency coefficient (E
NS) is used to determine the accuracy of the simulation results of the hydrological model, and this coefficient has a value between −∞ and 1. An E
NS value close to 1 indicates the simulation results have high credibility [
25]. In this study, three LID facilities, such as bioretention ponds, permeable pavements, and rainwater buckets, which are frequently used in sponge city construction, were selected as typical source volume control facilities. They are studied before referring to the parameter settings in the SWMM model [
26]. In the previous research of the research group, the settings of relevant parameters have been verified. The E
NS between the monitored values and the model simulation values were calculated, with values of 0.81, 0.98, 0.74, and 0.76, respectively [
27]. The parameter settings in this study were directly adopted from the previous studies.
2.3. Assessment and Analysis Method
2.3.1. Design Rainfall
The total yearly runoff of several design scales (60%, 70%, 75%, 80%, 85%, 90%) was regulated using 0.5-year, 1-year, 3-year, 5-year, and 10-year return period 2 h rainfall data. The simulation results are processed using the control ratio idea, and the regional model of various control facilities is simulated. The current Chinese standard is used in rainfall intensity calculation [
28]. The local rainfall intensity can be calculated as follows:
where i is the intensity of the rainfall (mm/min),
P is the return period (years), and
t is the duration of the rainfall (h).
The “Guidelines for the Construction of Sponge City” has set divisions for the total annual runoff control rate, which are I: 85% to 90%, II: 80% to 85% III: 75% to 85%, IV: 70% to 85%, V: 60–85% [
29]. As a consequence, the primary control scales used in this study were 60%, 70%, 75%, 80%, 85%, 90%. At the same time, different rainfall intensities were set in order to evaluate the control impact of sponge city amenities on runoff pollution under varied rainfall intensities. Due to the obvious relative research and real rainfall frequency, 0.5 years, 1 year, 3 years, 5 years, and 10 years were chosen.
2.3.2. Evaluation Indicators
The runoff pollution reduction rate, or the ratio between the pollutant removal amount and the total quantity of runoff pollutants, is usually used to characterize the effect of sponge facilities on runoff pollution reduction [
30]. However, this strategy does not account for variations in rainfall circumstances or the impact of various facilities on runoff management. The approach is unable to effectively define the control impact of source facilities or to objectively assess the control effect of various facilities on runoff pollution.
For the construction of sponge cities, the total annual runoff control rate is one of the most important design parameters. Its significance refers to the percentage of annual controlled rainfall in a certain site through natural and artificial infiltration, accumulation, evaporation, transpiration, and other methods to the total annual rainfall [
29]. Statistical methods are used to calculate the control rate of the total annual runoff. According to the observation data of daily precipitation in a certain area for many years (generally longer than 30 years to reflect the precipitation law), the effective precipitation events are screened. Then, count the ratio (α) of the total rainfall less than a certain day’s rainfall (H) to the total rainfall. The corresponding rainfall is the design rainfall H when the total annual runoff control rate is α. From the above description, we can see that the more accurate expression of “annual total runoff control rate” should be “annual rainfall total control rate”. In fact, although “rainfall” and “runoff” are closely related, they are not equivalent. Only when the rainfall is converted into runoff, the pollutants carried in it will pollute the water environment, and the goal of sponge city construction is to remove the pollutants in the runoff.
The effect of sponge city construction is to control runoff pollution by controlling the volume of runoff, but this effect has a limit because the source facilities are designed according to the design rainfall, and when the rainfall is less than the design rainfall, it will be completely absorbed and dealt with. If the rainfall exceeds the design rainfall, however, the surplus will be released through overflow if it is not appropriately handled. For example, if a source facility is designed to control 25 mm of rainfall, then a 40 mm daily rainfall will result in 15 mm of rainfall overflow discharge [
22]. However, due to the overflow of 15 mm, the pollution load of the 25 mm part could not be absorbed and dealt with and was brought into the natural water body due to mixing and overflow, causing pollution. This brings difficulties to the scientific evaluation of the control effect of source facilities on runoff pollution. The relationship between runoff volume control and runoff pollution control in sponge city development construction is not evident from the above study, and the present research and evaluation indicators are difficult to describe.
In order to scientifically evaluate the control effect of source facilities on runoff pollution, this study proposes dimensionless constant of runoff pollution control (Dc). The formula for calculating the overall pollutant mass reduction rate of a single rainfall simulation result by the total runoff volume reduction rate simulated by the field is presented in Formula (5). The Dc value is 1 when reducing 1% of the runoff volume can control 1% of the pollutant load.
where
Q(
t) is the instantaneous flow rate at time
t of the rainfall, the unit is L/s;
ρ(
t) is the instantaneous runoff pollutant concentration at time
t, the unit is mg/L;
T is the time it takes for rain to produce runoff and for the runoff to end, the unit is min;
M is the total pollution load during the rainfall process, mg;
V is the volume of runoff discharged during the rainfall process, the unit is L.
The essence of the Dc value is to “normalize” the runoff pollution control effects (let them return to the same “base”, which is the runoff volume control). This dimensionless constant is used to scientifically evaluate the runoff pollution control effect of different facilities in the field of rainfall, and provide guidance for the selection and scale design of facilities under different conditions. The Dc value is similar to the initial scour effect discrimination method proposed by Geiger, that is, the cumulative load-cumulative volume fraction curve M(V) curve. However, there are obvious differences. The difference is that the M(V) curve is used intuitively to determine whether the initial effect exists or not; a curve corresponds to a rainfall, while the Dc curve proposed in this study, rainfall is only a point in the curve. The goal of this approach is to assess how well the facility controls runoff pollutants. A rainfall simulation result can only provide one Dc value, but many Dc values may be acquired by modifying the facility’s design scale and running repeated simulations of the same rainfall. The horizontal axis is set as the volume control rate of rainwater runoff, and the vertical axis is the Dc value. A Dc curve can be obtained, which can intuitively reflect the relationship between the runoff volume control of the facility and the runoff pollution control under certain conditions. Under the same conditions (same rainfall characteristics and the same facility scale), the larger the Dc value, the better the facility’s control effect on runoff pollution. The Dc value can be used for comparison and screening between different facilities in the design stage and can also be used in the operation and maintenance stage to compare the runoff pollution control performance of the same facility, thereby providing decision-making basis for maintenance management.
2.4. The Design of Source Facilities
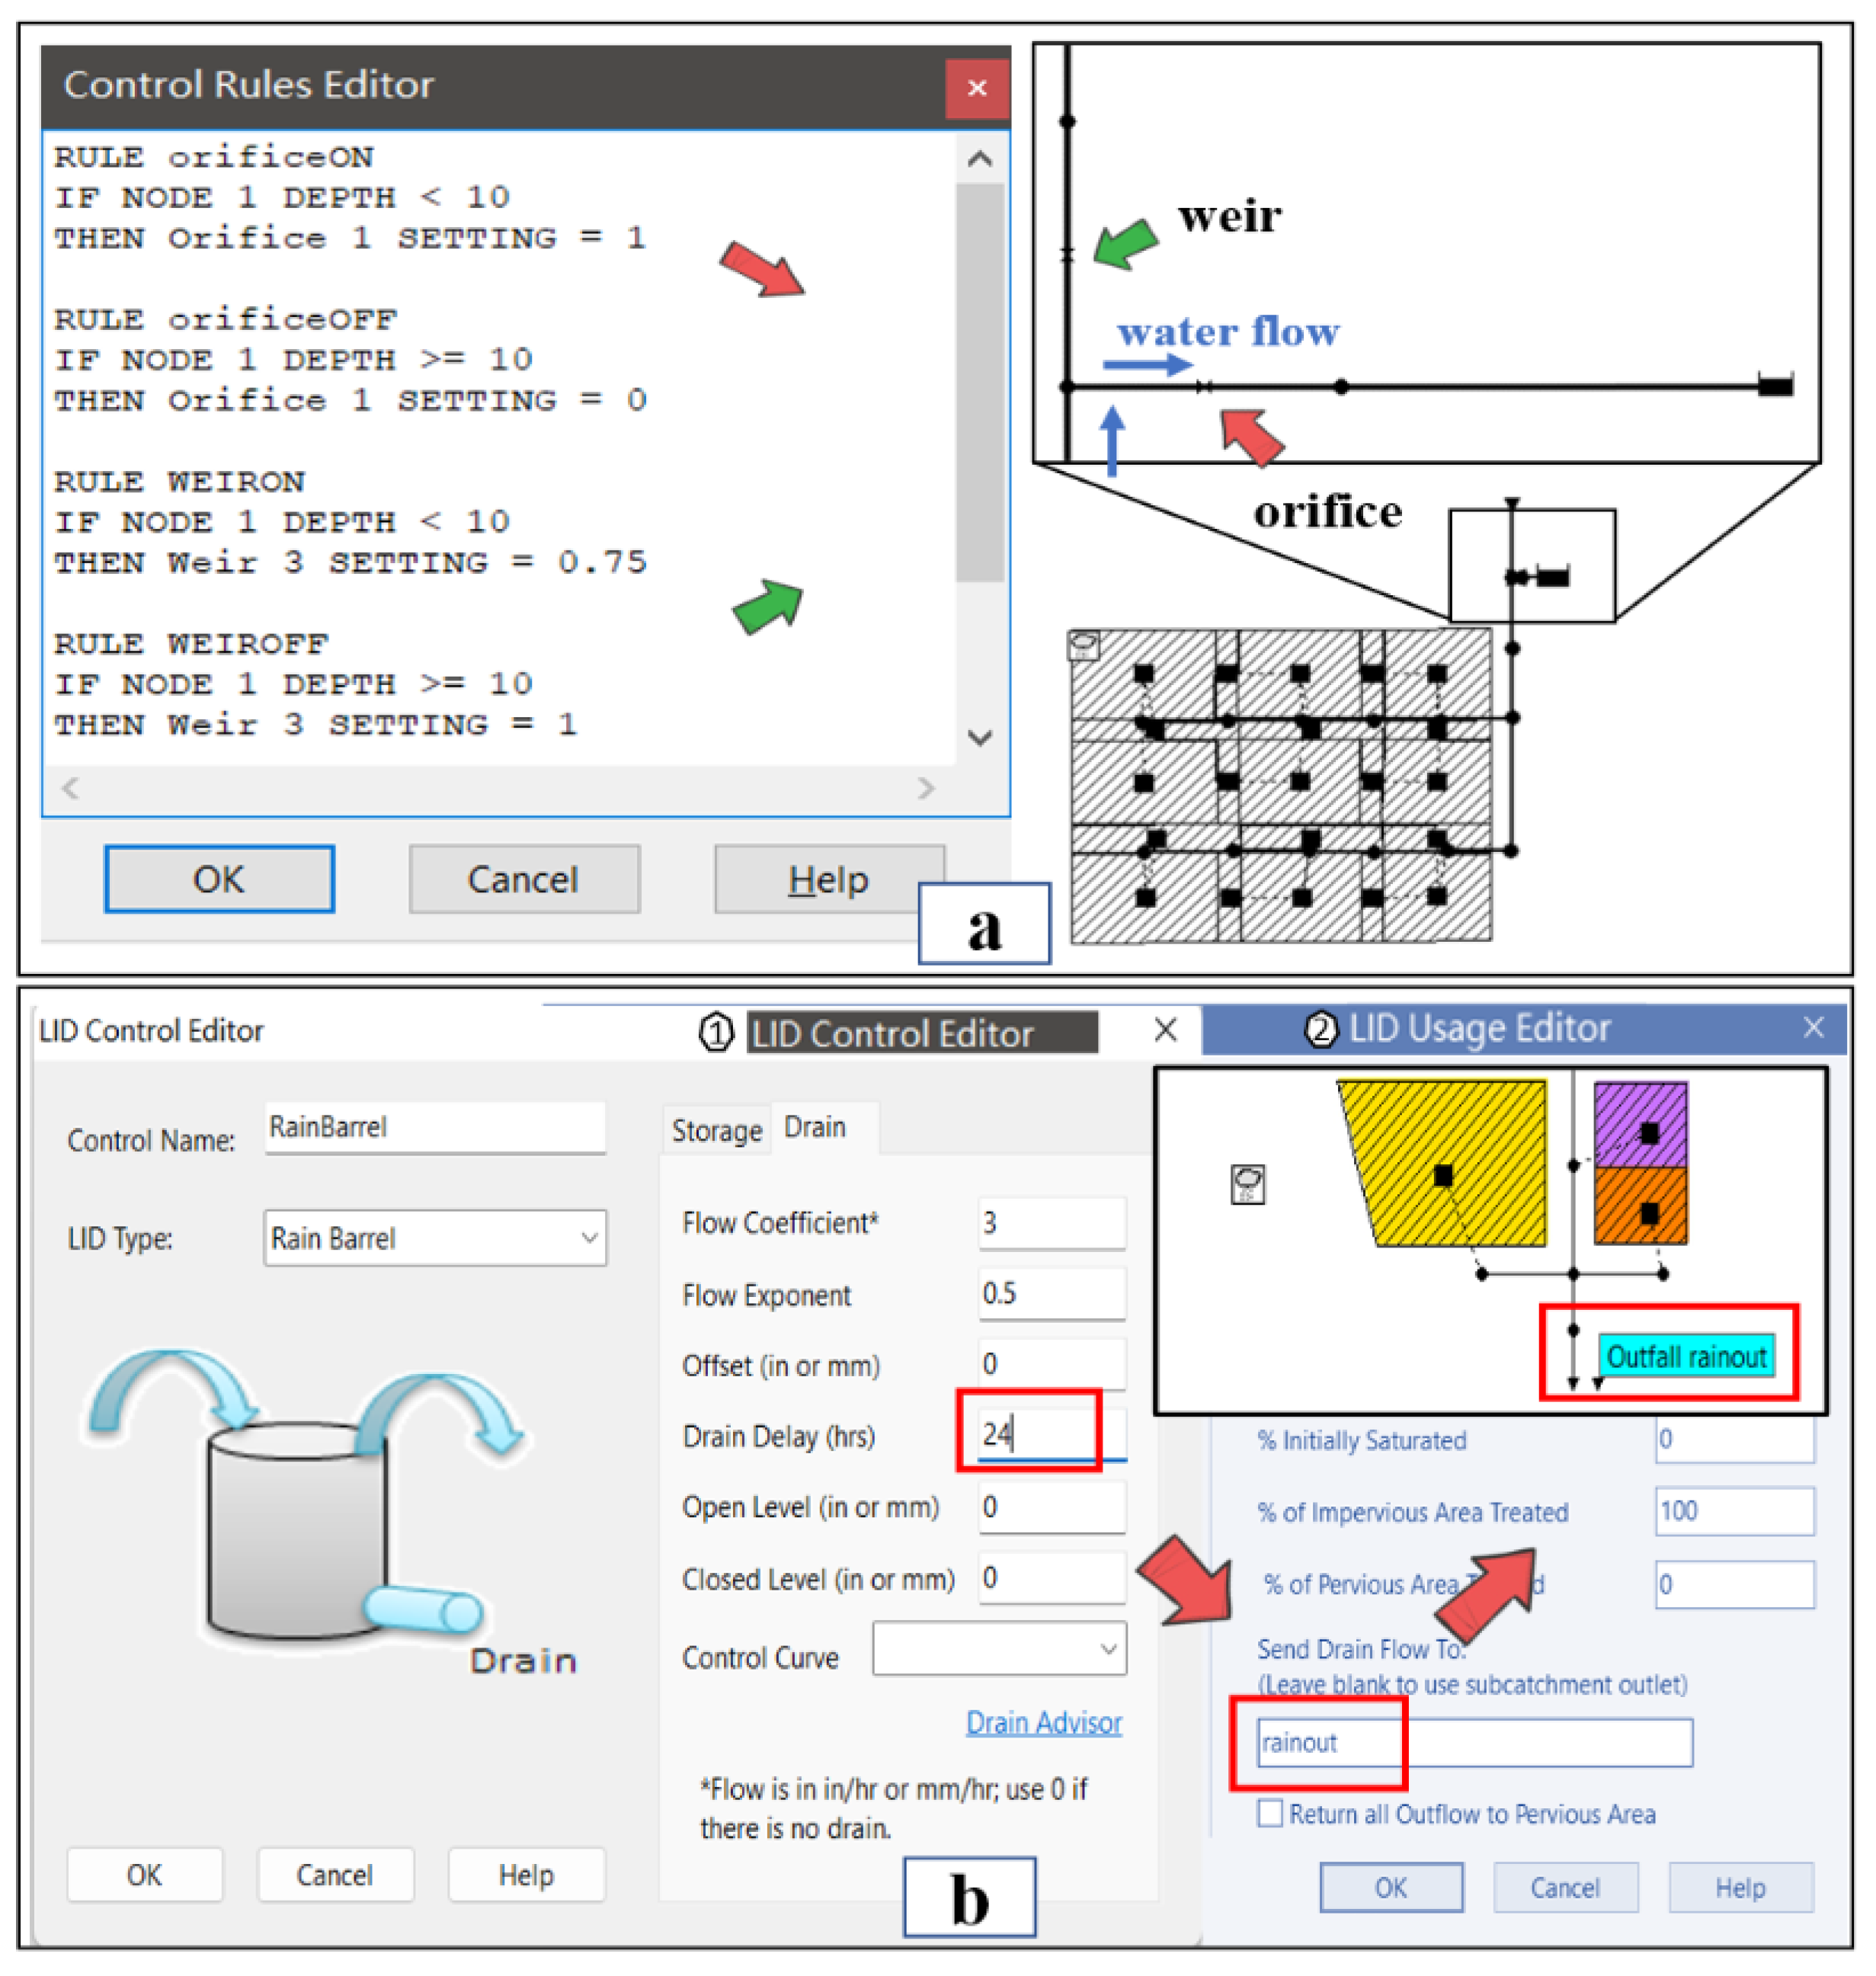
Three typical LID facilities, such as bioretention, permeable pavements, and rain barrels, which are frequently used in sponge city construction, are selected as source volume control facilities. Bioretention and permeable pavements have both infiltration and storage functions. Rain barrels are primarily rainwater storage facilities. In SWMM, LID facilities with infiltration structures such as bioretention and permeable pavements can be directly simulated without any additional settings. However, storage facilities such as rain barrels and storage tanks will not drain by themselves, and drainage rules need to be added manually. The working rules of the rain barrels are as follows: drainage starts 24 h after the rain starts, and the rainwater collected in the rainwater barrels is drained within 24 h−48 h. The discharged rainwater is used according to the reuse of water resources, and no pollutants are discharged; that is, the rainwater collected in the barrel is calculated as 100% of the pollutants removed.
The construction method of the terminal adjustment storage tank: use the orifice as the inlet gate of the terminal adjustment storage tank. When the water depth of the storage tank does not reach the maximum depth, the opening degree of the orifice is “1” (fully open). When the water depth of the reservoir reaches the set value, the opening degree of the orifice is “0” (fully closed). Using the weir as the interception means, when the water depth of the reservoir does not reach the maximum depth, the opening degree of the weir mouth is 75%; when the water depth of the reservoir reaches the set value, the opening degree of the weir mouth is 1. The rain barrel needs to retain the rainwater for more than 24 h before drainage, and the removal rate of pollutants in the rainwater retained in the rain barrel can reach 80% [
31]. Regulations for water quality treatment of rainwater in the storage tank: when the hydraulic retention time (HRT) is less than 24 h, the removal rate is (HRT/24 h) × 80%; when the HRT exceeds 24 h, the removal rate is 80%.
Figure 4. shows the particular setup methods for the terminal storage tank and the rain barrel.
3. Results and Discussion
3.1. Response Relationship between Volume Capture Ratio of Annual Rainfall and Runoff Volume Capture Ratio
The key indicator of the total annual runoff control rate of sponge city construction is to control runoff pollution and restore the natural hydrological state before development by controlling the volume of runoff [
32]. In the construction of sponge cities, the total annual runoff control is used to calculate and set the scale of the source facilities. As analyzed in the previous
Section 2.3.2, the more accurate expression of the total annual runoff control rate should be “the total annual rainfall control rate”. The influence of runoff pollution reduction should be concentrated on the runoff volume control. The proposed total annual runoff control rate index may be used to calculate design rainfall and infer the type and scale of rainwater control facilities. Under the conditions set in this study, the relationship between the total annual runoff control rate and the runoff volume control rate is shown in
Figure 5.
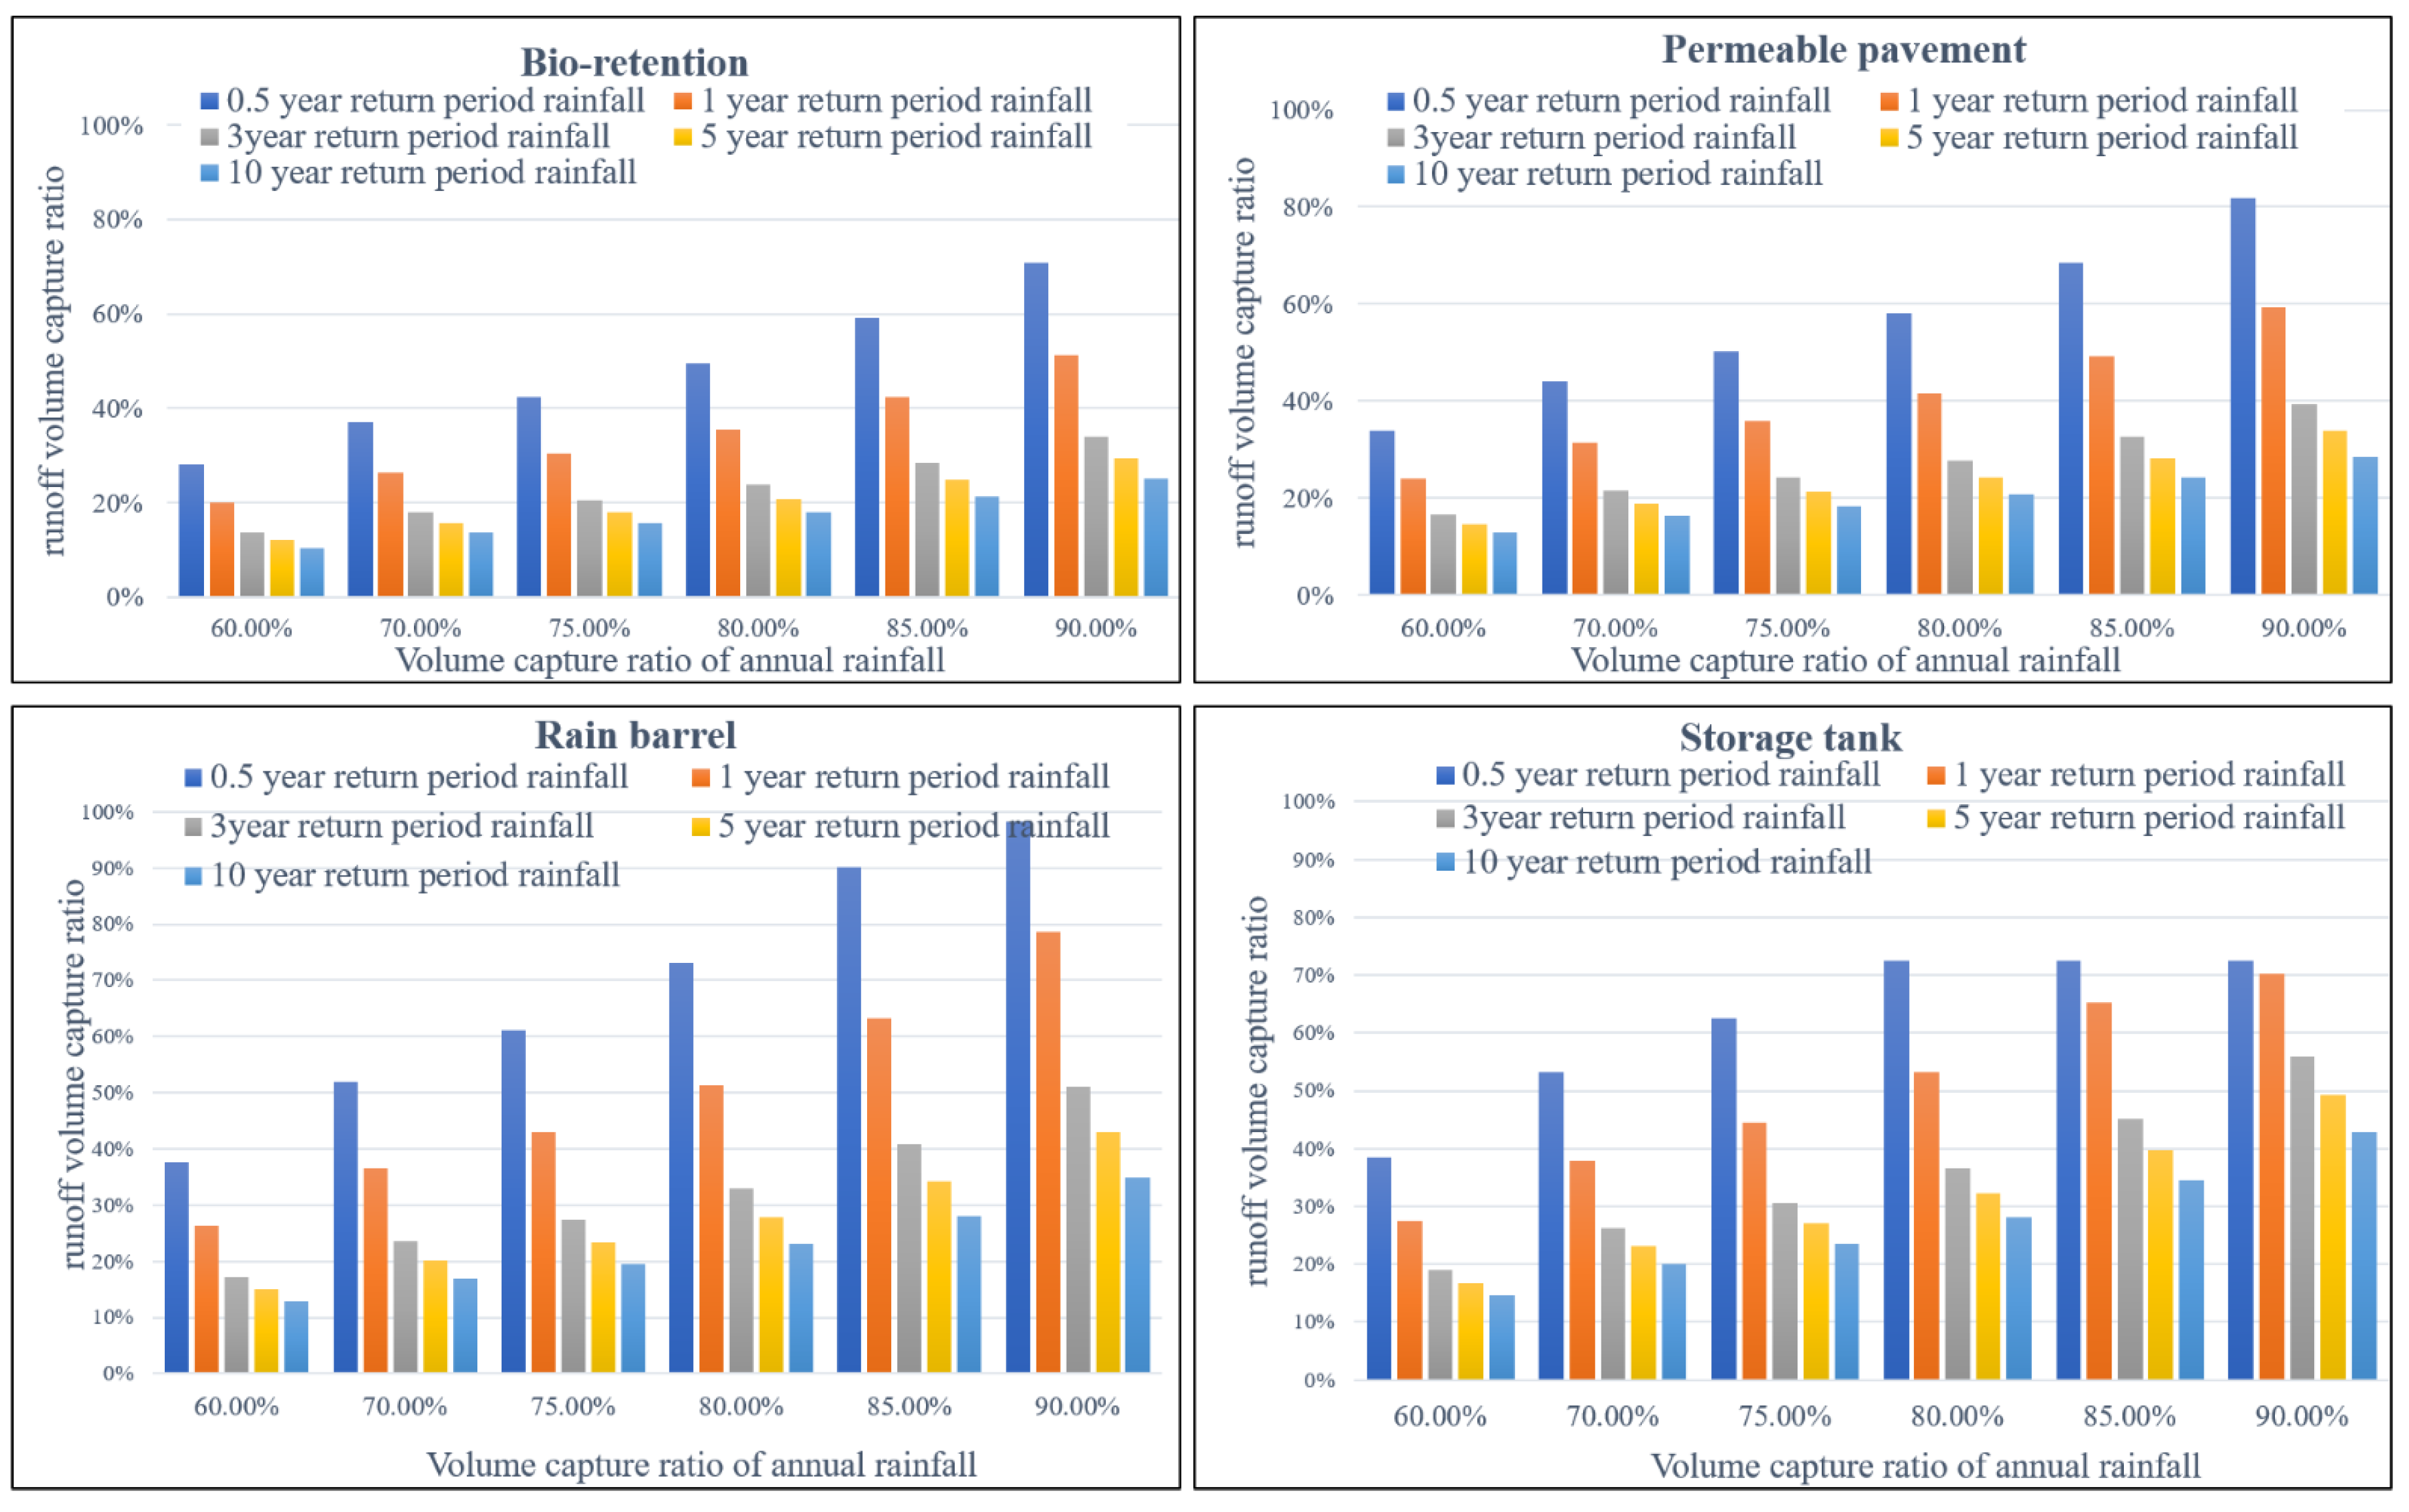
The four facilities of bioretention, permeable pavement, rainwater barrel, and storage tank all increased with the expansion of scale, as shown in
Figure 5, and the runoff volume control rate steadily increased. The runoff volume control rate gradually decreased as the rainfall return period increased at the same design scale, that is, the same annual total runoff control rate. Under the same rainfall return period, the runoff volume control rate differs for various facilities. For example, for rain barrels, when the total runoff control rate of the year is 90%, the runoff volume control rate is close to 100%. Under the same conditions, the runoff volume control rate of the other three facilities is about 70%. For the design rainfall with a 10-year return period, the total runoff control rate of the year is 90%, the maximum runoff volume controlled by the terminal storage tank is 43%, and the minimum volume controlled by the bioretention tank is 24%. As a consequence, depending on the circumstances, it is required to make a rational decision on whether to employ source or terminal facilities. In addition, for the storage tank, under the design rainfall return period of 0.5 years, the value continues to increase after the total annual runoff control rate reaches 80%, but the corresponding runoff volume control rate remains at 70%. This is because when the design scale reaches 80% (and possibly 75−80%), the generated runoff rainwater is fully collected. Therefore, in the actual design stage, the design scale of the facility cannot be blindly increased, and the scale of the facility must be set scientifically and reasonably according to the target.
Overall, rainfall and runoff have a strong nonlinear relationship, which verifies the results of J Xia’s research [
33]. Rainfall is the direct source of runoff, and runoff control can be achieved through rainfall control. The runoff coefficient, which is strongly connected to soil moisture, precipitation intensity, underlying surface combination, and facility type, affects the runoff volume control rate. Since the runoff coefficient varies depending on the circumstances, the runoff volume control rate varies as well. What we need to concentrate on is the pollution transported in the runoff volume. As a consequence, in the follow-up research, the dimensionless constant Dc is used as the independent variable, and the runoff volume control rate is used as the dependent variable.
3.2. Simulation Analysis of the Control Effect of Initial Runoff Volume Capture Facilities on Runoff Pollution Reduction
Simulate the regional models of different control facilities using 0.5-year, 1-year, 3-year, 5-year, and 10-year return period 2 h rainfall data for different design scales (according to 60%, 70%, 75%, 80%, 85%, and 90% of the total annual runoff control rate), and draw a curve for the Dc value obtained through the simulation results, as shown in
Figure 6.
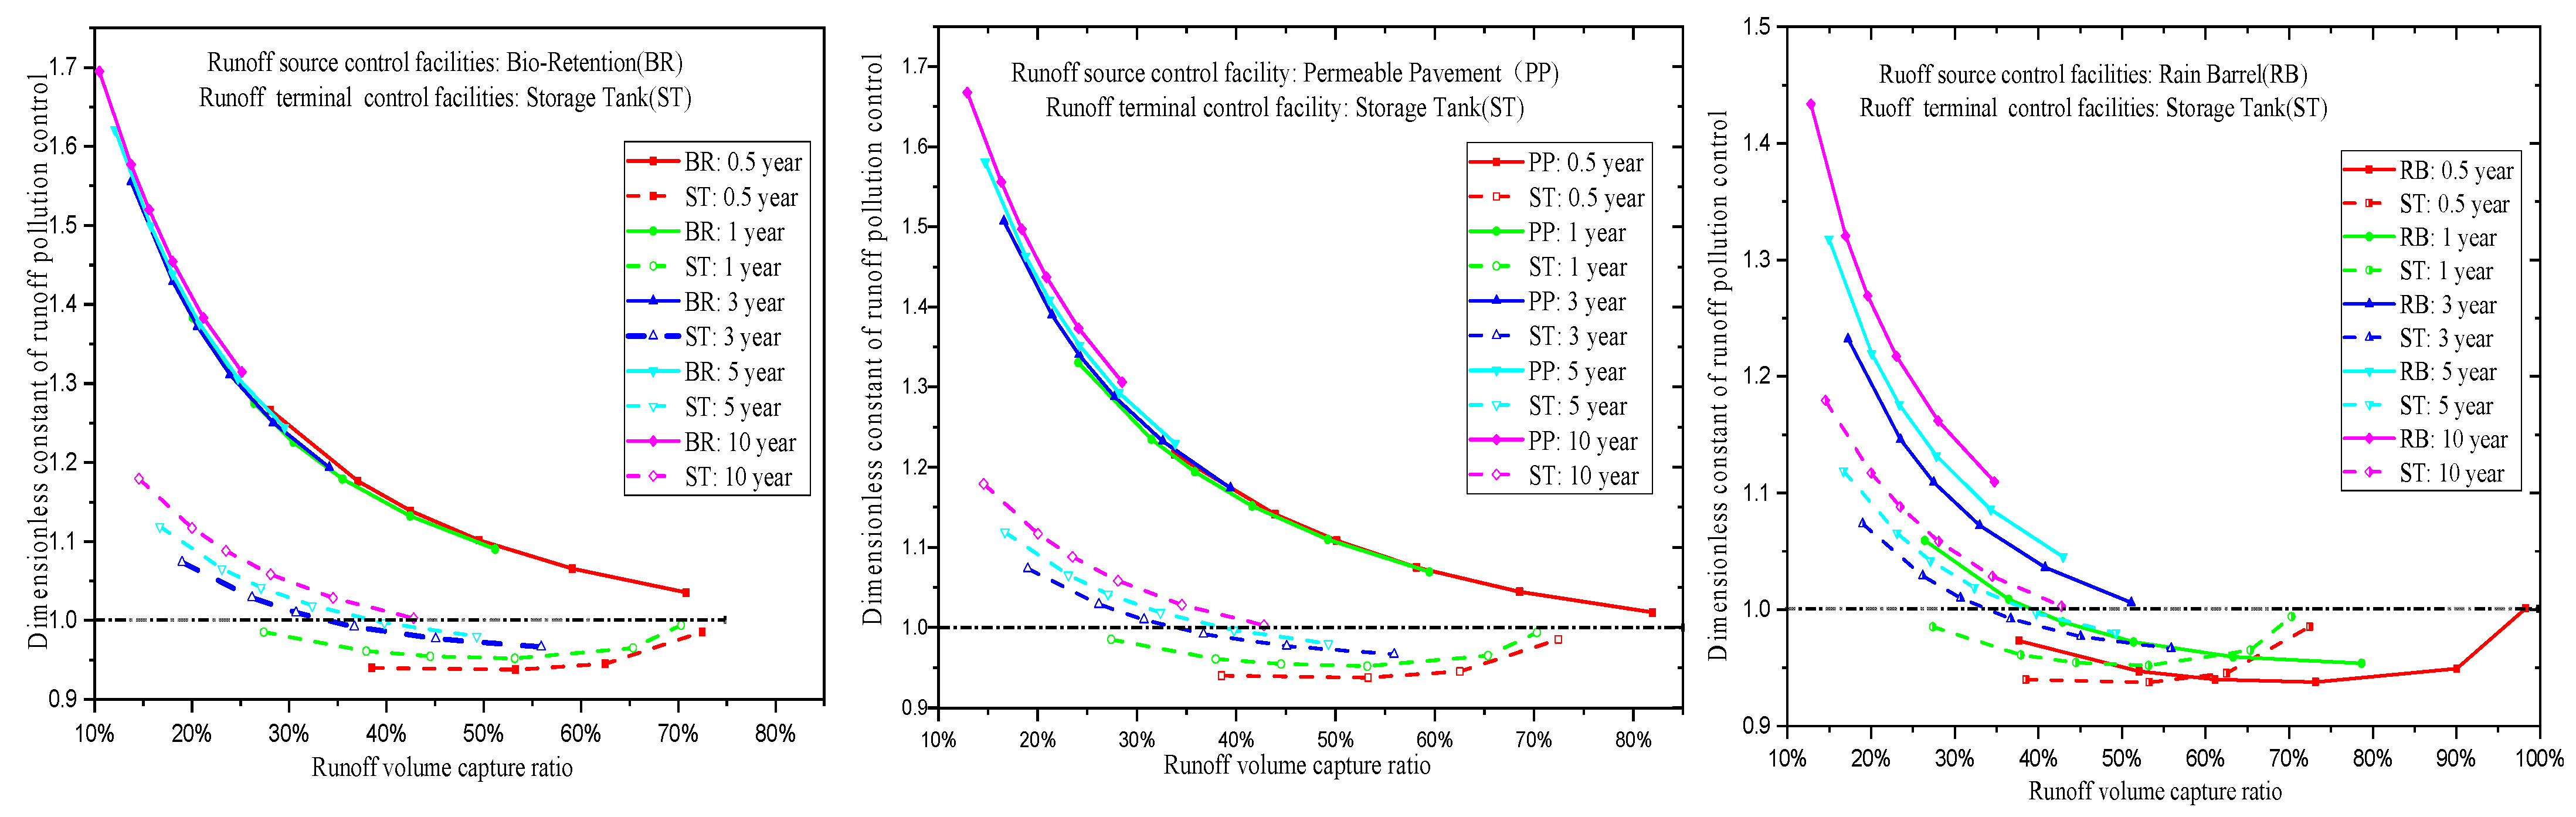
The Dc value of the source volume control facility is much higher than that of the terminal volume control facility under different return period rainfall conditions under the same rainwater runoff volume control rate, as shown in
Figure 6. The Dc value of source facilities with osmotic function (bioretention, permeable pavement) is higher than that of terminal facilities, while the Dc value of source facilities with regulation and storage function (rain barrel) and terminal storage tank is relatively low. For the three source facilities, including bioretention, permeable pavement, and rainwater bucket, under the same design rainfall return period, with the increase in the runoff volume control rate, the Dc value gradually decreased. In this study, when the bioretention facility has a runoff volume of about 10% under the 10-year rainfall return period, the Dc value is the highest at 1.7 and then gradually decreases until it approaches 1.
Under short-duration and high-return period rainfall, the source control facilities for the two initial runoff volume control implementations of bioretention and permeable pavement cannot provide normal rainwater storage performance. As a result, the curvature of the high return period curve gradually becomes consistent with the curvature of the low return period curve as the facility’s design scale grows larger. For the facilities with storage functions such as rainwater barrels and terminal storage tanks, it shows a trend of first decreasing and then increasing until it approaches one. For example, with a return period of 0.5 years, the Dc value remains around 0.95, and when the scale of the facility continues to expand, the Dc value approaches 1. Overall, as the scale of the facility increases (the runoff volume control rate is increasing), the final Dc value approaches one for both the source facility and the terminal facility. The formula shows that as the facility scale is increased, such as in extreme circumstances, all runoff rainwater is managed, suggesting that all contaminants in the rainfall runoff are also controlled. From Formula (5), the denominator value is one, and the value of the numerator is also one, so the Dc value is one.
Although the pollutant control effect of terminal facilities is not as good as that of source facilities, the terminal facilities can obtain more volume control of rainwater runoff under the large return period in a single rainfall simulation. If we just examine the simulation results in the rainfall simulation, it appears that the terminal facilities can achieve a superior runoff control rate, pollution control rate, and peak shaving impact in a single rainfall under the same design scale. The source facilities have not had time to play their role due to the design rainfall circumstances in the high return period, and the runoff will flow to the end. The terminal facilities appear to be more effective in terms of reducing total pollutants, which also misleads the runoff pollution control measures adopted by engineering designers during the planning and design stage. In fact, numerous environmental parameters such as rainfall period, rainfall intensity, rainfall interval, facility type, type of underlying surface of the catchment area, and pollutant control facility will all impact the runoff pollution control rate.
3.3. Influence of Different Facility Combinations on Runoff Pollution Control Effect
One of the obstacles that bother engineering designers in the process of sponge city construction is the selection of facility types and the appropriate combination of multiple facilities. By using model simulation, several studies have examined how to obtain the most construction benefit, economic benefit, and ecological advantage from a mix of diverse facility types [
34]. Bioretention, permeable pavement, and rain barrels are still selected as three typical facilities in this section of the study, and they are mixed in different proportions, with the model to be used to simulate rainfall events under various rainfall conditions of return periods. The comprehensive design storage volume required by the plot to achieve the total runoff control rate in a specific year is calculated using the volume methods and then assigned to each facility using the facility ratio, with the floor space required by each facility evaluated separately. As shown in
Figure 7, the parameters are set up in the SWMM model, and the simulation results are processed using the dimensionless constant curve.
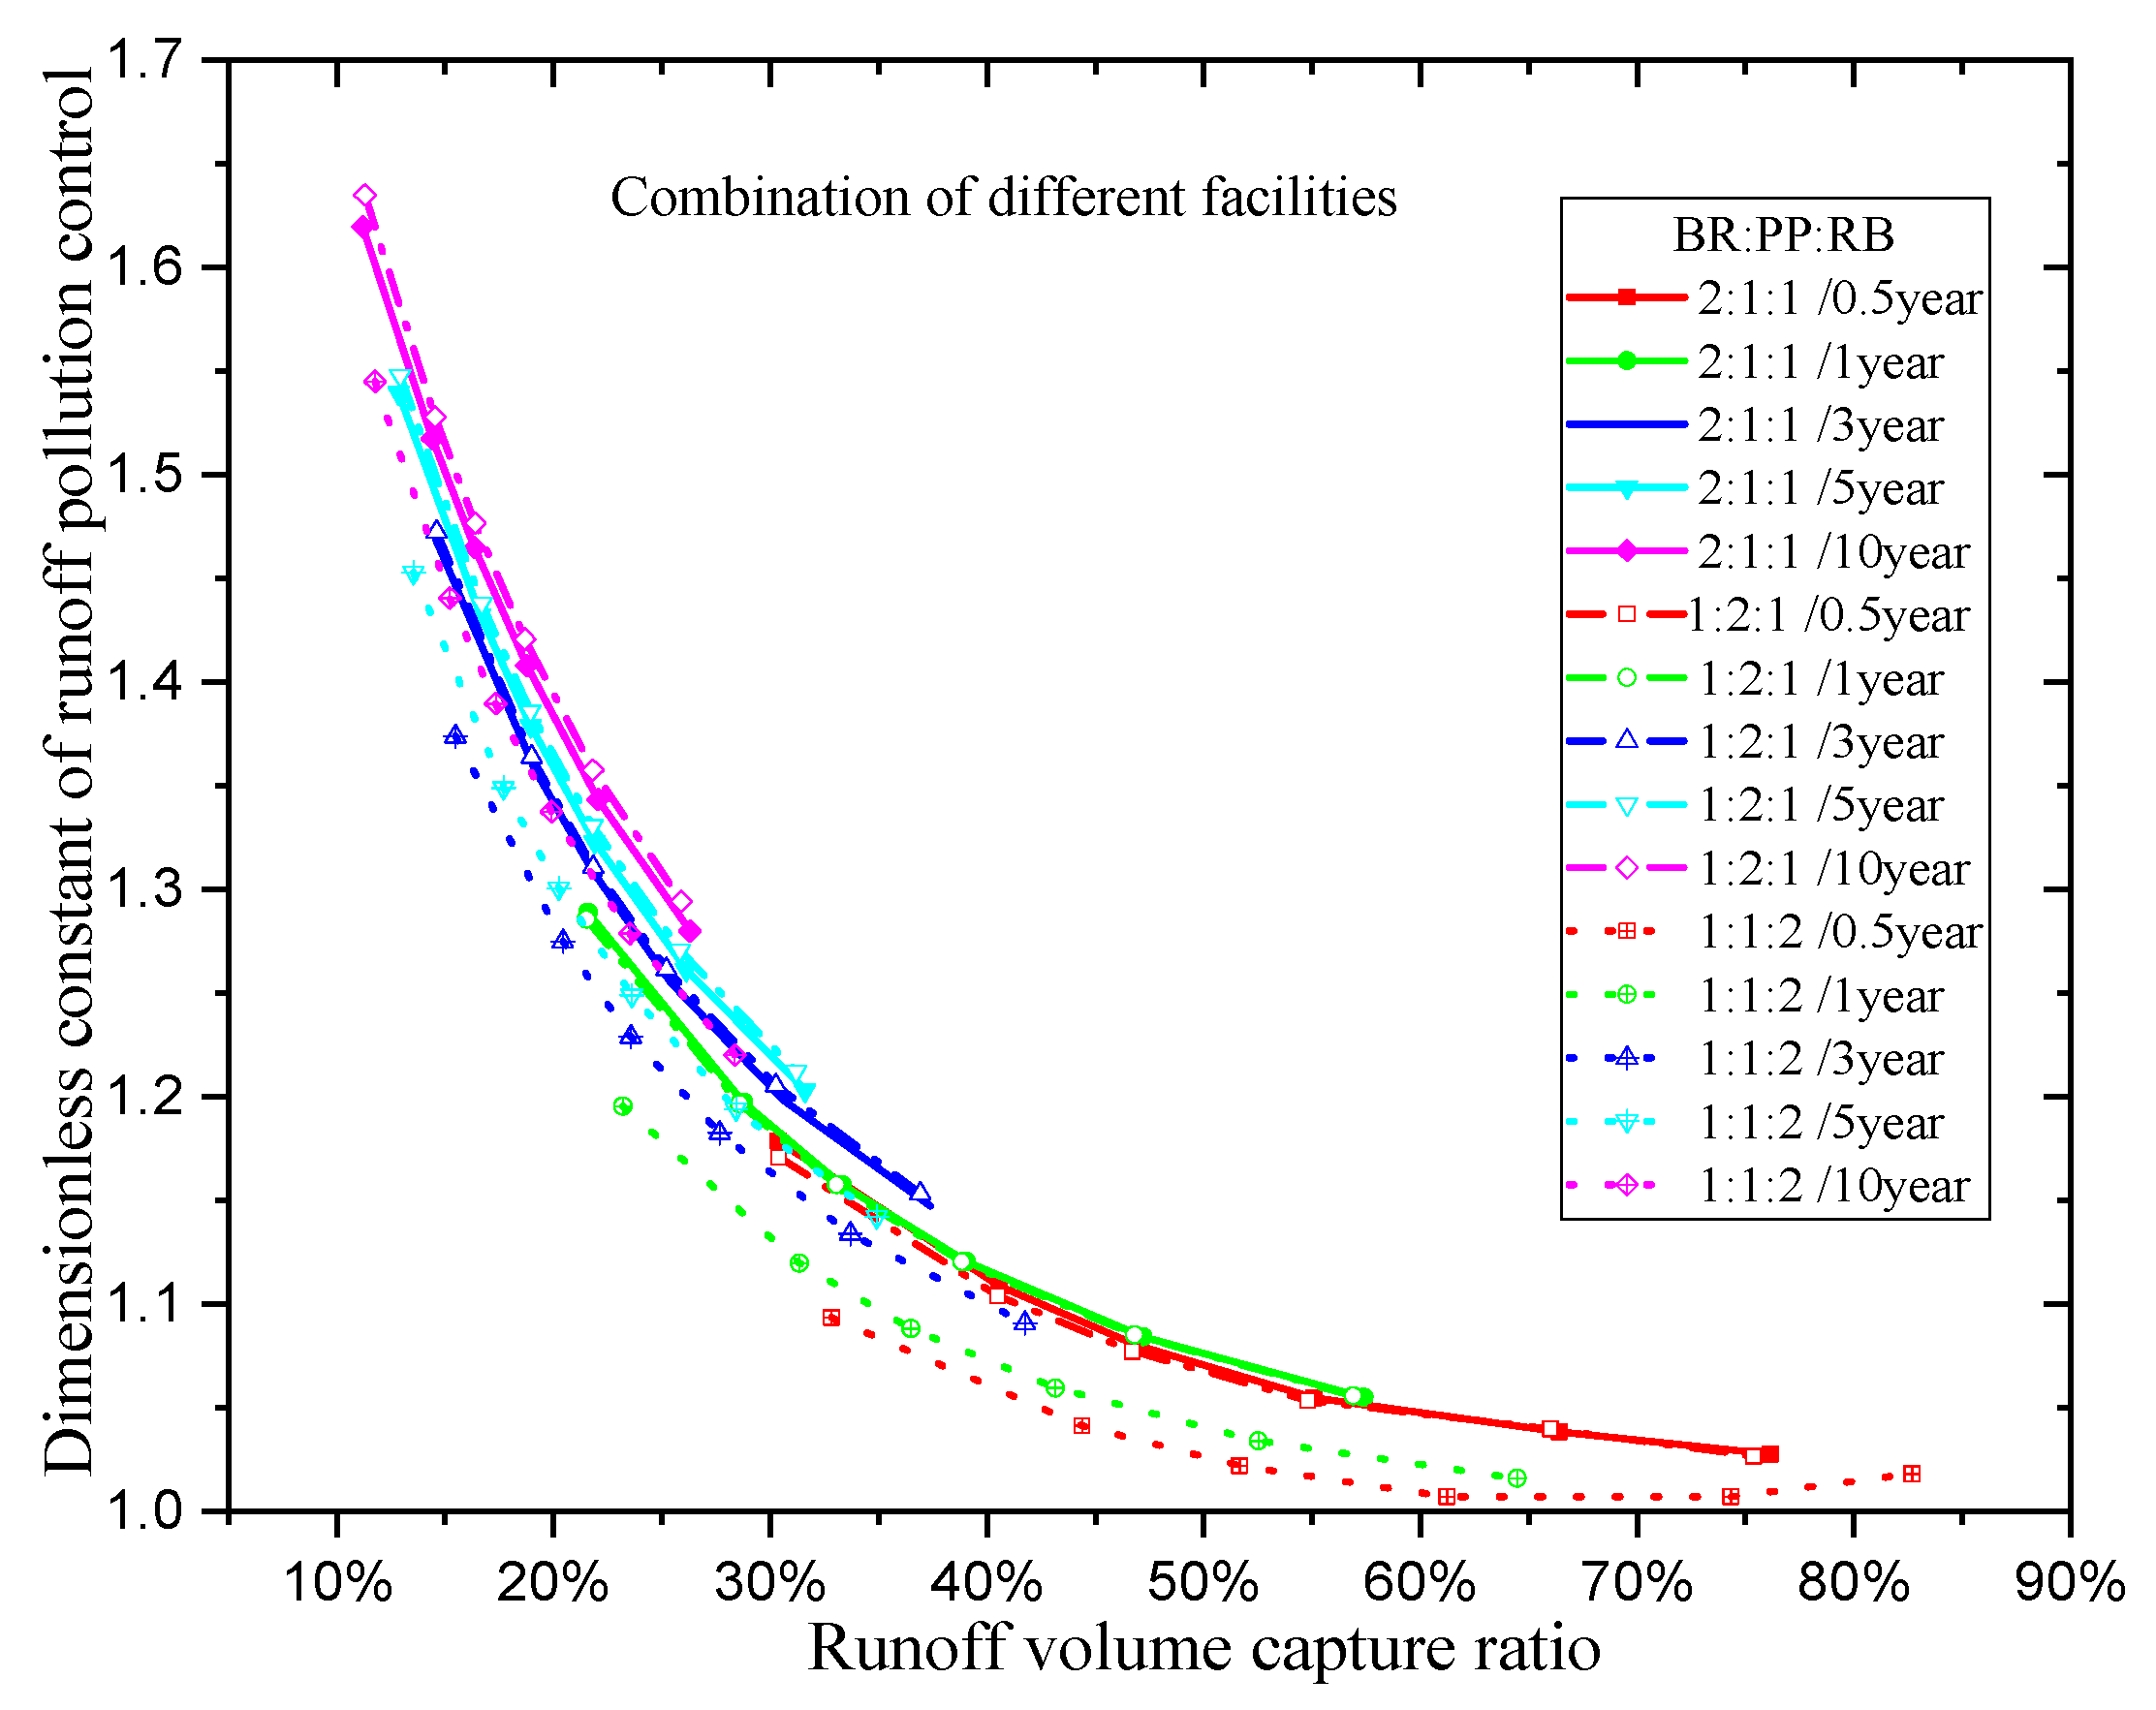
As shown in
Figure 7, when the design rainfall return period is 10 years, the Dc value where the ratio of bioretention to the permeable pavement to rain barrel is 1:2:1 has the highest performance, that is the best runoff pollution control effect. Under the same design scale, the Dc value is the worst when the design rainfall return period is 0.5 years and the bioretention: permeable pavement: rainwater bucket is 1:1:2. According to the results of rainfall simulations, the combination can achieve higher Dc values when the percentage of facilities with higher Dc values of individual facilities is greater. The Dc value of the overall facility combination is lower when the fraction of facilities having a lower Dc value is greater. In order to achieve initial runoff volume management, the combination of LID facilities with infiltration function should be chosen as much as possible. This section of the research method helps engineering designers how to analyze. This approach may be used to find the best combination scheme of different facilities in advance of the actual planning and design procedures.
3.4. Effects of Different Underlying Surface Types on Runoff Pollution Control in the Same Catchment Zone
In the same catchment zone, different underlying surface types cause runoff pollutants in diverse situations. In comparison, runoff pollution is more serious when the underlying surface is roads [
35]. Therefore, it is very necessary to study the influence of source facilities on runoff pollution control under different types of underlying surfaces. The typical types of underlying surfaces include roads, green spaces, and buildings. As a consequence, the types of underlying surfaces are simplified in this section, and the intended land use classifications are no longer rigorously followed. Green space, roads, and buildings are all utilized in the same way. Simultaneously, the model’s parameters relating to the land use type of the study area are updated in response to changes in the proportion of green space, roadways, and building area, and related research shows that the proportion of road area in typical blocks in China is between 20% and 40% [
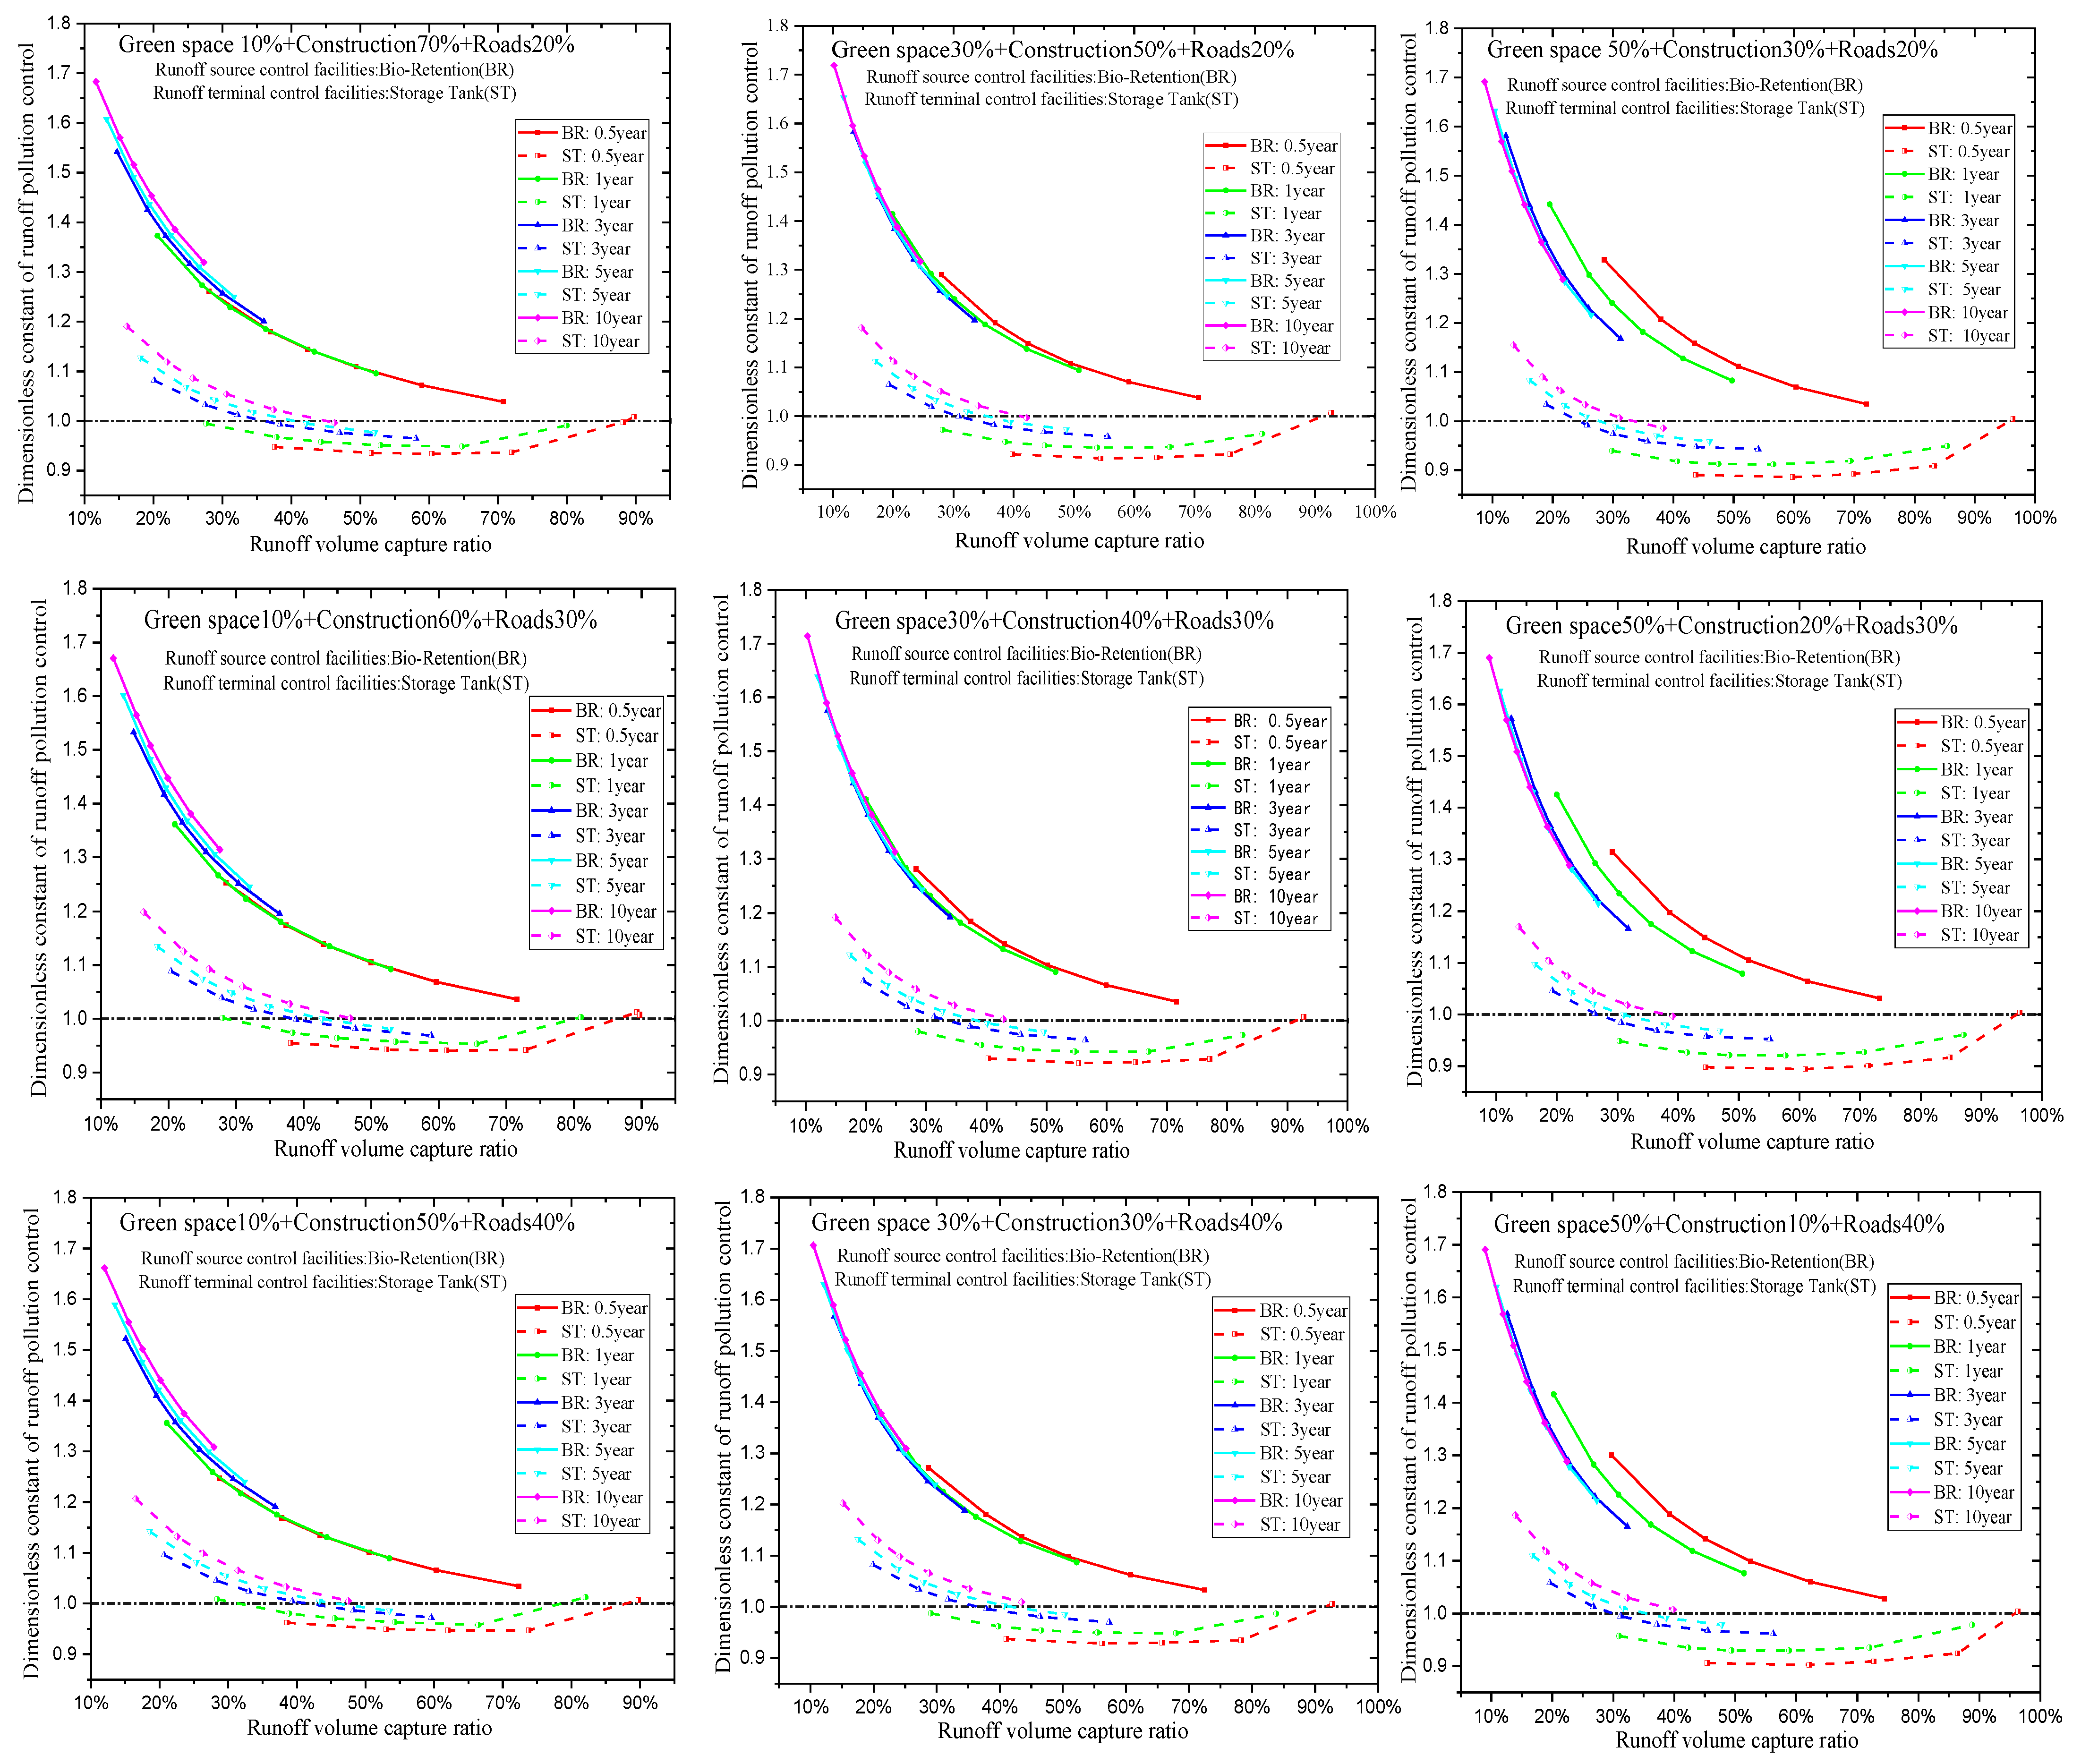
36]. In this part of the study, the proportion of roads was set to 20%, 30%, and 40%, and the proportion of green space was set to 10%, 30%, and 50%, respectively, and the remaining part was the building area, with a total of nine combination scenarios. Due to the change in the proportion of land use types, the comprehensive runoff coefficient will change accordingly, so it is necessary to recalculate the corresponding volume control facility scale in each scenario and update it to the model. The bioretention is used as the representative of the initial runoff volume control facility, and the terminal interception tank is used as the representative of the end volume control facility. As shown in
Figure 8, each scenario continues to apply the 0.5, 1, 3, 5, and 10-year rainfall return period 2 h rainfall for simulation, and the corresponding curve is produced based on the Dc value obtained from the simulation.
Every three photographs in the horizontal direction form a group in
Figure 8, and the proportion of the modified green space represented by these three pictures is ranked from left to right based on the green space rates of 10%, 30%, and 50%. The proportion of road area, which is divided according to the proportions of 20%, 30%, and 40% of the road from top to bottom, is the vertical change between each group. According to the modeling results, increasing the amount of green space enhanced the control rate of the runoff volume of the source and terminal facilities under the low return period. Since the green area may influence a portion of the runoff volume, it can also help to prevent runoff pollution. The Dc values of source and terminal facilities are influenced by changes in the percentage of roads and buildings. The larger the road area, the more significant the runoff pollution, and the higher the need for source or terminal facilities to be built. As a result, the effect of the type of underlying surface should be fully considered during the sponge city construction process.
This section focuses on the impact of source facilities, such as bioretention, on runoff pollution under various types of underlying surfaces. Other forms of source facilities include permeable pavement, rain barrels, and rain gardens. The methods of analysis described above can be used. Simulation calculations are carried out in actual engineering practice according to the types of different underlying surfaces and varied source facilities in order to obtain the best runoff pollution control effect.
4. Conclusions
This paper focuses on the response relationship between initial runoff volume control and runoff pollution control in sponge city construction, proposes a dimensionless constant Dc to evaluate the effect of runoff pollution control, and quantitatively evaluates the relationship between volume control and runoff pollution control through the Dc curve. The following are the key findings:
The dimensionless constant Dc could be used to quantify the control impacts of various facilities on stormwater runoff pollution, as well as to directly represent the relationship between sponge facilities and runoff pollution control. It may be used to optimize the selection of sponge facilities at the planning and design stage by comparing the control impacts of source and terminal facilities on runoff pollution. When comparing the performance of the same facility in different scenarios, it can also offer a foundation for the operation and maintenance of sponge facilities at the operation management stage.
Demonstrate that rainfall and runoff have a nonlinear relationship. The removal of contaminants transported in runoff is the most important aspect of runoff pollution control. The Dc value of source facilities is generally higher than that of terminal control facilities, demonstrating that source facilities reduce stormwater runoff pollution more effectively than terminal control facilities.
In order to accomplish initial runoff volume management and runoff pollution control, the fraction of sponge facilities with infiltration functions should be raised as much as possible. The facility with infiltration function has a greater capacity to control runoff pollution than the facility with regulating and storage function under the parameters of this article. The combination can achieve a higher Dc value when the percentage of facilities with a higher Dc value of a single facility is higher, suggesting a stronger runoff pollution control effect.
The impact of various underlying surfaces on runoff pollution control should be fully considered when constructing rainwater facilities. Under the same catchment zone, the green space accounts for a large proportion, the Dc value of the source facilities and terminal facilities decreases, and the control rate of runoff pollutants decreases. Simulation calculations should be carried out according to the types of different underlying surfaces and different source facilities in order to obtain the best runoff pollution control effect.


