Article

Quantitative Assessment and Grading of Hardware Trojan Threat Based on Rough Set Theory

School of Reliability and Systems Engineering, Beihang University, Beijing 100191, China
*
Author to whom correspondence should be addressed.
Appl. Sci. 2022, 12(11), 5576; https://doi.org/10.3390/app12115576
Submission received: 26 April 2022 / Revised: 30 May 2022 / Accepted: 30 May 2022 / Published: 31 May 2022
(This article belongs to the Topic Advanced Systems Engineering: Theory and Applications)

Abstract

:
The globalization of integrated circuit (IC) design and fabrication has given rise to severe concerns with respect to modeling strategic interaction between malicious attackers and Hardware Trojan (HT) defenders using game theory. The quantitative assessment of attacker actions has made the game very challenging. In this paper, a novel rough set theory framework is proposed to analyze HT threat. The problem is formulated as an attribute weight calculation and element assessment in an information system without decision attributes. The proposed method introduces information content in the rough set that allows calculation of the weight of both core attributes and non-core attributes. For quantitative assessment, the HT threat is characterized by the closeness coefficient. In order to allow HT defenders to use fast and effective countermeasures, a threat classification method based on the k-means algorithm is proposed, and the Best Workspace Prediction (BWP) index is used to determine the number of clusters. Statistical tests were performed on the benchmark circuits in Trust-hub in order to demonstrate the effectiveness of the proposed technique for assessing HT threat. Compared with k-means, equidistant division-based k-means, and k-means++, our method shows a significant improvement in both cluster accuracy and running time.

1. Introduction

The past decade has witnessed a dramatic increase in the cognitive and organizational complexity of integrated circuit (IC) fabrication and design, pushing the IC industry towards vertical specialization. Various stages of IC fabrication and design are being outsourced to offshore foundries and relocated across national boundaries. However, this geographical dispersion of IC design activities can lead to malicious modifications in the IC supply chain [1]. There are many opportunities for perpetrators and insiders to introduce a malicious design into an IC, which can be extremely difficult to detect by conventional testing and verification methods [2]. A Hardware Trojan (HT) is a malicious design that lies inactive until it is activated by rare and unknown conditions [3]. After being activated, it can cause catastrophic damage to electronic systems or leak confidential information stored by the IC [4,5]. Defending against HTs and detecting them faces many challenges, ranging from circuit design and testing to economic issues [6], and resource limitations prevent testing all possible HT types within specific circuits [7].
This motivates the need for a mathematical framework to understand the strategic interactions between the HT designer and the defender. Recently, a number of studies have focused on modeling their strategic interactions using game theory in order to anticipate the outcome of such interactions [8,9]. Here, we propose a game-theoretical framework based on fuzzy theory to obtain the optimal strategy [10]. The aforementioned works have highlighted the advantages of game theory for the development of better HT detection strategies. The shortcoming of these works, however, is that the payoffs of actions must be set artificially. These works do not take into account this subjectivity, which significantly impacts the game results and affects the resulting optimal attack and defense strategies.
For defenders, the works in [11,12] quantitatively analyze the security and vulnerability of the IC. Saha et al. [11] have proposed a mathematical framework that considers complex circuit-level dependencies and ranks HT insertion sites inside the IC. Guo et al. [12] introduced QIF-Verilog as a new language-based framework to evaluate the trustworthiness of an IC at the register transfer level (RTL). To an extent, these can help to quantitatively assess the payoffs of the defense strategies. While interesting, most of these existing works do not consider the payoffs of HT insertion strategies.
In order to fill this gap, we introduced the Rough Set Theory(RST) to quantitatively assess the HT threat for the payoff of its insertion strategies. Over the past ten years, RST has become a topic of great interest to researchers for quantitative analysis and has been applied in many domains. The degree of correlation or difference among the indexes has been applied to risk assessment [13] and safety evaluation [14]. Subsequently, other evaluation methods have been integrated when determining the weights, such as the information entropy method [15] and the fuzzy analytic hierarchy process [16]. Similar to threat assessment of HTs, these evaluate the characteristics of objects according to the objects’ related attributes. This similarity motivates the application of the RST to HT threat assessment. Although interesting, the above works assume that the samples have decision attributes for quantitative assessment using RST. However, for the HT threat, it is notable that samples have no prior data. In RST, HT threats form an information system without decision attributes. Considering this situation, it is both critical and challenging to assess the threat quantitatively.
In this paper, we propose a modern approach for quantitative assessment of HT threat based on RST. We introduce information content in the rough set for weight determination of all the attributes. Our method achieves quantitative assessment based on the Technique for Order Preference by Similarity to an Ideal Solution (TOPSIS). Owing to its excessive comprehensiveness, using TOPSIS as continuous data is not conducive to defenders being able to make fast and effective defense decisions. To this end, we exploited Equal Frequency Division (EFD) and k-means in order to discretize the data of the HT threat. This can effectively simplify the data to improve the decision-making efficiency of defenders. The primary contributions of our work are summarized as follows.
  • We leverage RST and TOPSIS for the quantitative assessment of HT threat. Based on the attributes of the relevant HTs in an existing HT library, Trust-hub, we measure HT threat, adopting rough set theory for weight calculation and TOPSIS for quantitative assessment. The closeness coefficient is used to characterize the threat.
  • In order to address the lack of decision attributes in the corresponding information system, we introduce information content to calculate the weight of each attribute. Based on the information content and the significance of the attribute, the weights of both core and non-core attributes are obtained.
  • K-means is used to discretize threat data. Aiming at the unstable clustering results in the preliminary work, we propose the EFD method to preprocess the data and obtain the initial cluster center. Compared with other initial center optimization methods, this is more efficient and accurate.
  • We use BWP to characterize the effectiveness of clustering in order to solve the problem of the number of clusters being unavailable in advance. The number of clusters with the largest BWP is taken as the optimal choice for HT threat grading.
The rest of this paper is arranged as follows: Section 2 describes the system model and assessment formulation; the proposed discretization based on EFD and the determination method of the number of clusters are shown in Section 3; Section 4 represents and discusses the statistical testing results based on HT benchmarks from Trust-hub; finally, Section 5 concludes the paper.

2. System Model and Assessment Formulation

2.1. Information System and Attributes

Rough Set Theory uses an Information System (IS) to represent knowledge, which is usually expressed as follows:
I S = ( U , A , V , f )
where U represents the universal set, a finite non-empty set with n elements, U = { x 1 , x 2 , , x n } , A expresses the attribute set (a non-empty finite set with m attributes), A = { a 1 , a 2 , , a m } , V = a A , V a is a nonempty set of attribute values, and f : U × A V expresses an information function that maps an element in U to exactly one value in V, which means a A , x U , f ( x , a ) V a .
For HT threat, we established an information system according to 94 independent HTs and their characteristics on the Trust-hub website. Over the past few years, there have been efforts to develop comprehensive HT taxonomies based on their implementation and effect [2]. Shakya et al. [17] have further improved the taxonomies in earlier works by including the physical characteristics of HTs. HT taxonomy can be broken down into Insertion Phase, Abstraction Level, Activation Mechanism, Effect, Location, and Physical Characteristics. The HTs on the Trust-hub website are classified based on these categories. Among them, the classification results according to physical characteristics are not independent of each other. For example, the HT coded B19-T200 belongs to both ‘Distribution’ and ‘Layout Same’. In this case, rough sets cannot be applied to assign values to this attribute. Therefore, the information system for HTs was established using the other five attributes.
It is worth noting that the value assigned to each HT class may be different depending on the host IC and the relevant use case. The value should be determined according to the specific IC and its application scenario. Here, we take a Field Programmable Gate Array (FPGA) used as a communication system as an example to demonstrate our weightened assessment and grading scheme. The values of each class of attributes are shown in Table 1. Table 1 is ordered based on its first and second column according to the ‘Chip-level Trojan Taxonomy’ catalogue from Trust-hub. This sorting can help to quickly find the value corresponding to the HT Taxonomy.

2.1.1. Insertion Phase

The Insertion Phase corresponds to the phase in the life cycle of the IC where an HT may be inserted. According to the existing HT samples, this attribute contains two classes, which are D e s i g n and F a b r i c a t i o n . In the phase of IC design, considering that the design needs to be mapped to the physical circuit, developers are constrained by its function, logic, timing, and physical conditions [18]. Considering this situation, they often use third-party IP cores or standard units to economize design costs and reduce difficulty. IP cores and standard units used without explicit authorization are easy to implant with an HT [19]. In the fabrication phase, subtle changes in the mask reduce the IC performance or change its function. Attackers often implant HTs into an IC by modifying its mask. At the end of each phase, the IC designers and testers test and correct the IC. The fabrication phase follows the design phase. In the fabrication phase, it is possible to detect an HT inserted during the design phase. From this point of view, the threat of an HT being inserted in the fabrication phase is higher than the threat during the design phase.

2.1.2. Abstraction Level

Developers use hardware description language to describe the designed IC at different levels of abstraction [20]. Correspondingly, an HT can be designed with four levels of abstraction, which are, in decreasing order, the R e g i s t e r   T r a n s f e r , the G a t e , the L a y o u t , and the P h y s i c a l level. At the register transfer level, each module of the IC is described in terms of signals, registers, and Boolean functions. An adversary has full access to the functionality as well as the implementation of the modules, and can easily change them at this level. A design is represented as a list of gates and their interconnections at the gate level. Here, an adversary can insert HTs as the relevant gates and their interconnections. At the layout level, the impact of HTs on power consumption or delay characteristics can be planned. HTs can be realized even by changing the parameters of the original circuit’s transistors. All circuit components s well as their dimensions and locations are determined at the physical level, which is the lowest level of abstraction. Attackers may insert HTs by modifying the size of wires or the distance between circuit components. It can be seen that as the abstraction level is reduced, attackers tend to implant HTs more specifically and carefully. This makes such HTs more difficult to detect, and thus more threatening.

2.1.3. Activation Mechanism

Common activation mechanisms of existing HTs include T i m e - b a s e d , P h y s i c a l - C o n d i t i o n - b a s e d , and U s e r   I n p u t b a s e d , while other HTs are A l w a y s   O n . Always-on HTs are activated as soon as their hosting designs are powered on. In the case of an FPGA, they are usually inserted with the attack effect of degraded performance, which is difficult to detect. In addition, they can carry out long-term attacks on ICs; thus, they pose the greatest threat. HTs activated by u s e r   i n p u t perform specific functions based on specific user input. They can achieve a precision strike and are highly threatening. T i m e - b a s e d HTs have a long latency period and pose a low threat. HTs activated by physical conditions pose the lowest threat, as the attacker must know the specific application of the IC in advance. An FPGA, for example, can be used in aerospace or automobiles. In different application scenarios, the physical conditions of the IC are quite different. Under extreme conditions, the P h y s i c a l C o n d i t i o n - B a s e d HTs may not be triggered in the IC life cycle. For example, an HT activated by the operating frequency of a high-speed communication system cannot be triggered in a low-speed communication system.

2.1.4. Effect

The attack effects of HTs can be divided into D e n i a l - o f - S e r v i c e , I n f o r m a t i o n   L e a k a g e , F u n c t i o n   C h a n g e , and D e g r a d e d   P e r f o r m a n c e . After a Denial-of-service HT completes its attack, the whole chip becomes unresponsive; the threat of this HT is the greatest. HTs which leak core information of the IC are highly threatening. In a communication system, Function Change HTs usually change communication content. They pose a low threat, as they only change specific functions of the chip; other functions can continue to operate normally. Performance-degrading HTs do not change the function of the chip, and have the lowest threat.

2.1.5. Location

The higher the integration of the insert location, the stronger concealment an HT has, meaning that it is more threatening. The inserted locations of HTs on Trust-hub include P r o c e s s o r s , M e m o r y , I / O s , C l o c k   G r i d s , P o w e r   S u p p l y and O t h e r , in order of integration degree from high to low. In an FPGA, the I/O comprises three drivers: the input buffer, the output buffer, and the three-state control, which can support a variety of I/O standards. In a communication system, there are only a few clock domains; thus, the integration of the I/O is usually higher than that of the Clock Grid.

2.2. Weight Calculation and Quantitative Assessment

In the framework of RST, the quantitative assessment of HT threat can be transformed into an attribute weight calculation of the information system. The existing attribute weight calculation needs a decision attribute as a reference, while the weight of the core attribute cannot be calculated in an information system lacking decision attributes. Thus, we use the information content and significance of each attribute here in order to obtain the relevant weights for both core and non-core attributes. As a linear superposition of all attribute values and their significance cannot directly assess HT threat, in order to solve this problem we propose a learning algorithm based on the weight of the attributes and the TOPSIS method to measure the HT threat.

2.2.1. Core Attribute

In RST, for every set of attributes P A an indiscernibility relation I N D ( P ) can be defined in the following way:
I N D ( P ) = { ( x , y ) U × U | a A , f ( x , a ) = f ( y , a ) }
where I N D ( P ) is the equivalence class in U and IND ( P ) = a P IND ( { a } ) . The equivalence class I N D ( P ) is called the elementary set in P because it represents the smallest discernible groups of elements. For any element x i U , the equivalence class of x in relation to I N D ( P ) is represented as [ x i ] I N D ( P ) .
For an a i A , if I N D ( A ) = I N D ( A a i ) , the attribute a i is called superfluous. Otherwise, the attribute a i is indispensable in A.
A subset B A is called a reduct of I S if and only if I N D ( A ) = I N D ( B ) and B is independent of A. The set of all reducts in I S is denoted by R E D ( I S ) or R E D ( A ) .
The core of A is the set of all indispensable attributes of A, denoted by C o r e ( A ) = R E D ( A ) .
If the set of attributes is dependent, it may be desirable to find all possible minimal subsets of the attributes. This leads to the same number of elementary sets as the whole set of attribute reducts and finding the set of all indispensable attributes as the core.
The concepts of core and reduct are two fundamental concepts in RST. The reduct is the essential part of an I S which can discern all objects discernible by the original I S , while the core is the common part of all reducts.

2.2.2. Information Content

The concept of information content in information theory [21] is introduced into the information system. In an information system, S = ( U , A , V , f ) , P A , and U / I N D ( P ) = { X 1 , X 2 , , X n } . The information content of P is as follows:
I ( P ) = i = 1 n X i U 1 X i U = 1 1 U 2 i = 1 n X i 2
where X is the base of set X and X i / U represents the probability of equivalence class X i in U. An equivalence class contains multiple elements, all of which constitute U. The sum of the probabilities of all equivalence classes in U is 1, i = 1 n x i U = 1 , and Equation (3) holds.

2.2.3. Significance of Attribute

The significance of attributes enables us to evaluate attributes by assigning a real number from the closed interval [0,1] that expresses the importance of an attribute in an information system. The significance of an attribute a can be evaluated by measuring the effect of removing the attribute a A from the attribute set A.
For any attribute a A , we define its significance, sig A { a } ( a ) , for A as follows:
sig A { a } ( a ) = I ( A ) I ( A { a } )
In particular, when A = { a } , sig ( a ) represents sig ϕ ( a ) :
sig ( a ) = s i g ϕ ( a ) = I ( A ) I ( ϕ ) = I ( { a } )
where U / I N D ( ϕ ) = { U } and I ( ϕ ) = 0 .
The significance of a A is measured by the changes in information content caused by the removal of a from A. If and only if sig A { a } ( a ) > 0 is a A indispensable in A while Core ( A ) = { a A | sig A { a } ( a ) > 0 } .
In an information system S = ( U , A , V , f ) and C A , for any attribute a ( A C ) we define its significance, sig C ( a ) , as follows:
sig C ( a ) = sig ( C { a } ) { a } ( a ) = I ( C { a } ) I ( C )
The significance of a ( A C ) is measured by the changes in information content caused by the adjunction of a to C.

2.2.4. Weight of Attributes

The existing weighting methods directly assign the attribute significance as the weight to the relevant non-core attribute. Additionally, the calculation of the core attribute weight needs the support of the decision attribute. However, as an information system, HT threats have only information attributes and no decision attributes; thus, the weight of core attributes cannot be calculated by traditional methods. Therefore, we propose a weight calculation method based on information content, which covers both core attributes and non-core attributes, as shown below:
W ( a ) = s i g A { a } ( a ) , if a C sig C ( a ) · I ( C ) , if a C

2.2.5. Quantitative Assessment Algorithm Based on TOPSIS

The number of classes in each attribute is different, and the significance does not have the evaluation function. In light of this situation, we propose a learning algorithm, summarized in Algorithm 1, based on the attribute weight and the TOPSIS method for quantitative assessment.
Algorithm 1 Quantitative Assessment Algorithm
  • Input: HT information system, I S = ( U , A , V , f )
  • Output: Threat value of each element in the information system, C C i
  • Initialize  Core ( A ) = Φ
  • Calculate the information content of the information system I ( A ) = 1 1 U 2 i = 1 n X i 2
  • Calculate the significance of each attribute a i A , sig A { a i } ( a i ) = I ( A ) I ( A { a i } )
  • For i = 1:m do
  •    If  sig A { a i } ( a i ) 0  then
  •         Core ( A ) = Core ( A ) { a i }
  •    End if
  • End for
  • Let  C = Core ( A )
  • Calculate the information content of the core, I ( C )
  • Calculate the weight of each attribute, W ( a j )
  • Calculate the standardized matrix, z i j = x i j i = 1 n x i j 2
  • Calculate the positive and negative ideal reference points, Z + , Z
  • Calculate the distances to the positive and negative ideal reference points, D i + , D i
  • Calculate the closeness coefficient of each HT, C C i
  • Return  C C i .
In RST, the information system can be concisely expressed in matrix format as follows:
X = x 11 x 12 x 1 m x 21 x 22 x 2 m x n 1 x n 2 x n m
where X is the attribute matrix, X i j is the observed value of each element for i = 1 , 2 n , and j = 1 , 2 m .
In order to eliminate anomalies with different measurement units and scales, the initial matrix should be standardized. The standardized matrix is expressed as follows:
Z = z 11 z 12 z 1 m z 21 z 22 z 2 m z n 1 z n 2 z n m , z i j = x i j i = 1 n x i j 2
The positive and negative ideal reference points can be outlined as follows:
Z + = max z 11 , z 21 , , z n 1 , max z 12 , z 22 , , z n 2 , , max z 1 m , z 2 m , , z n m = Z 1 + , Z 2 + , , Z m +
Z = min z 11 , z 21 , , z n 1 , min z 12 , z 22 , , z n 2 , , min z 1 m , z 2 m , , z n m = Z 1 , Z 2 , , Z m
The distances to the positive and negative ideal reference points are calculated using the following formulas:
D i + = j = 1 m w j Z j + z i j 2 , D i = j = 1 m w j Z j z i j 2
where w j is the weight of each attribute as determined by the proposed method and D i + and D i are the distances to the positive and negative ideal reference points, respectively.
The closeness coefficient (CC) of each element can be calculated as follows:
C C i = D i D i + + D i
After the CCs have been calculated, the HT threat can be determined. The higher the value of the CC, the higher the HT threat is.

3. Assessment of Grade Division and Grade Quantity

3.1. EFD-Based K-Means for Grade Division

Continuous data are too detailed to describe HT threat, which is adverse to the defender’s preparing fast and effective HT countermeasures. By discretizing the threat data for HTs, these can be effectively simplified. This facilitates the presentation of the HT threat in order to improve the decision-making efficiency of the defenders. The k-means clustering algorithm is used here to discretize the threat data and realize the classification of HT threat. In the preliminary experiment, there are two problems with using k-means to classify the data on HT threat. One is that the clustering results are unstable, and the other is that the number of clusters is uncertain.
HT threat data of different types varies greatly in shape and size. In order to minimize the sum of squared errors, it is possible to segment the large clusters. In addition, when using the sum of squared errors as the criterion function to measure the clustering effect, the best clustering result corresponds to the extreme point of the criterion function. There are many local minima in the criterion function, and each step of the k-means algorithm is carried out in the direction of reducing the criterion function value. If an initial clustering center is selected near a local minimum, the algorithm converges at this local minimum. In the k-means algorithm, the initial clustering center is randomly selected from the data, which may lead to a locally optimal solution rather than a globally optimal solution. This means that the clustering results have great uncertainty. The selection of the initial clustering center is thus an important factor affecting the clustering results.
In this study, EFD was used to preprocess the data and the intermediate objects of each cluster in the result were selected as the initial clustering center for the k-means algorithm. This improves the uncertainty of clustering results caused by the random selection of initial clustering centers and modifies the cluster of objects to improve the accuracy of clustering. The EFD-based method for initial clustering centers selection is as follows:
The original n objects are arranged from small to large and form a set, S = { x 1 , x 2 , , x p i , , x n } .
p i = i n k + ( i 1 ) n k 2
where i = 1 , 2 , , k , · indicates rounding, k is the number of the clusters, and x p i is the ith initial cluster center.

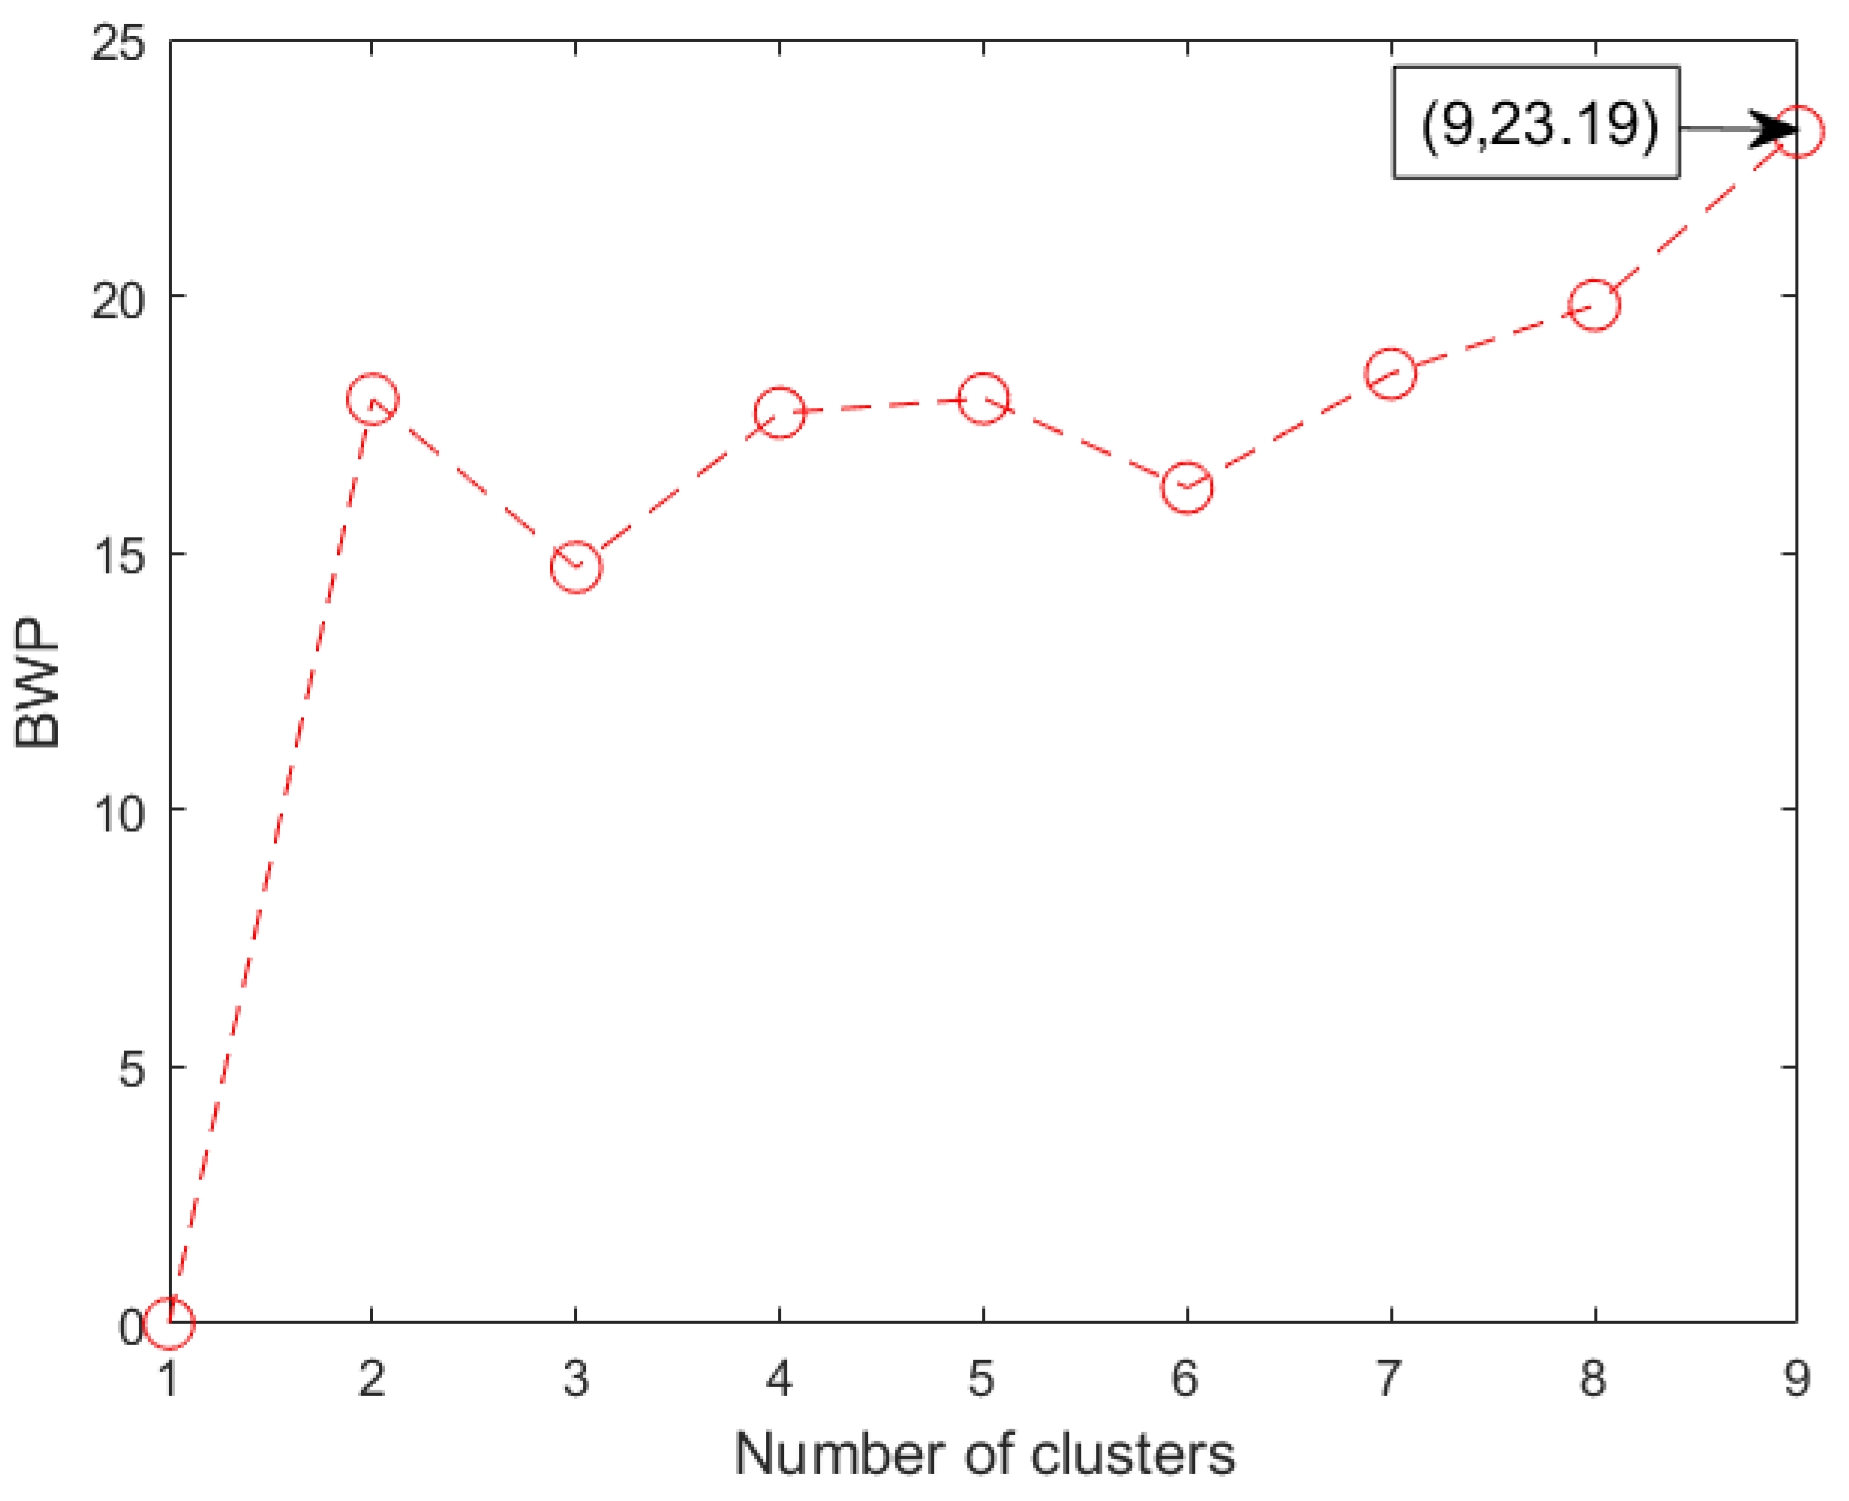
3.2. Determination of Grade Quantity Based on BWP

Due to the uncertain number of clusters, here, we use BWP to evaluate the clustering results and determine the optimal number of clusters. In general, a good clustering result should reflect the internal structure of the dataset as much as possible in order to ensure that the objects within the same cluster are as similar as possible and the objects in various clusters are as different as possible. From the perspective of distance measure, it is the optimal clustering result that minimizes the intra-cluster distance and maximizes the inter-cluster distance. BWP is used to reflect the intra-cluster tightness and inter-cluster separation of the clustering result [22].
Assume a dataset with n objects, S = { x 1 , x 2 , , x n } , and suppose that n objects are divided into k clusters; we define the inter-cluster distance, b ( j , i ) , of an object i in cluster j as the minimum average distance between object i and the object of each other cluster. Its calculation is as follows:
b ( j , i ) = min 1 c k , c j 1 n c p = 1 n c x p c x i j 2
where c and j are the relevant cluster numbers, n c represents the number of objects in cluster C, x p c represents the p t h object in cluster C, and · 2 is the square of the Euclidean distance.
Similarly, we can define the intra-cluster distance, w ( j , i ) , of an object i in cluster j as the average distance from this object to other objects in cluster j. Its calculation is as follows:
w ( j , i ) = 1 n j 1 p = 1 , p i n j x p j x i j 2
The cluster effectiveness of object i in cluster j is defined as B W P ( j , i ) . The effectiveness of the clustering result is the sum of B W P ( j , i ) , the calculation method for which is as follows:
B W P = BWP ( j , i ) = b ( j , i ) w ( j , i ) b ( j , i ) + w ( j , i )
Theoretically, the larger b ( j , i ) is, the higher the separation between clusters, and the smaller w ( j , i ) is, the higher the tightness within the cluster. The clustering result with the largest B W P is the most effective, and its number of clusters is defined as the number of HT threat grades.

4. Case Study

4.1. Test Setup

The information system for HT threat was established based on 94 HTs and their characteristics obtained from the Trust-hub website, which contained 96 HTs. Two HTs were removed as there was no classification label for them. According to the above analysis, the attributes of the information system are I n s e r t i o n   P h a s e , A b s t r a c t i o n   L e v e l , A c t i v a t i o n   M e c h a n i s m , E f f e c t , and L o c a t i o n . MATLAB was used to realize the k-means algorithm on a computer with an Intel i7-7700 CPU and 8 GB RAM.

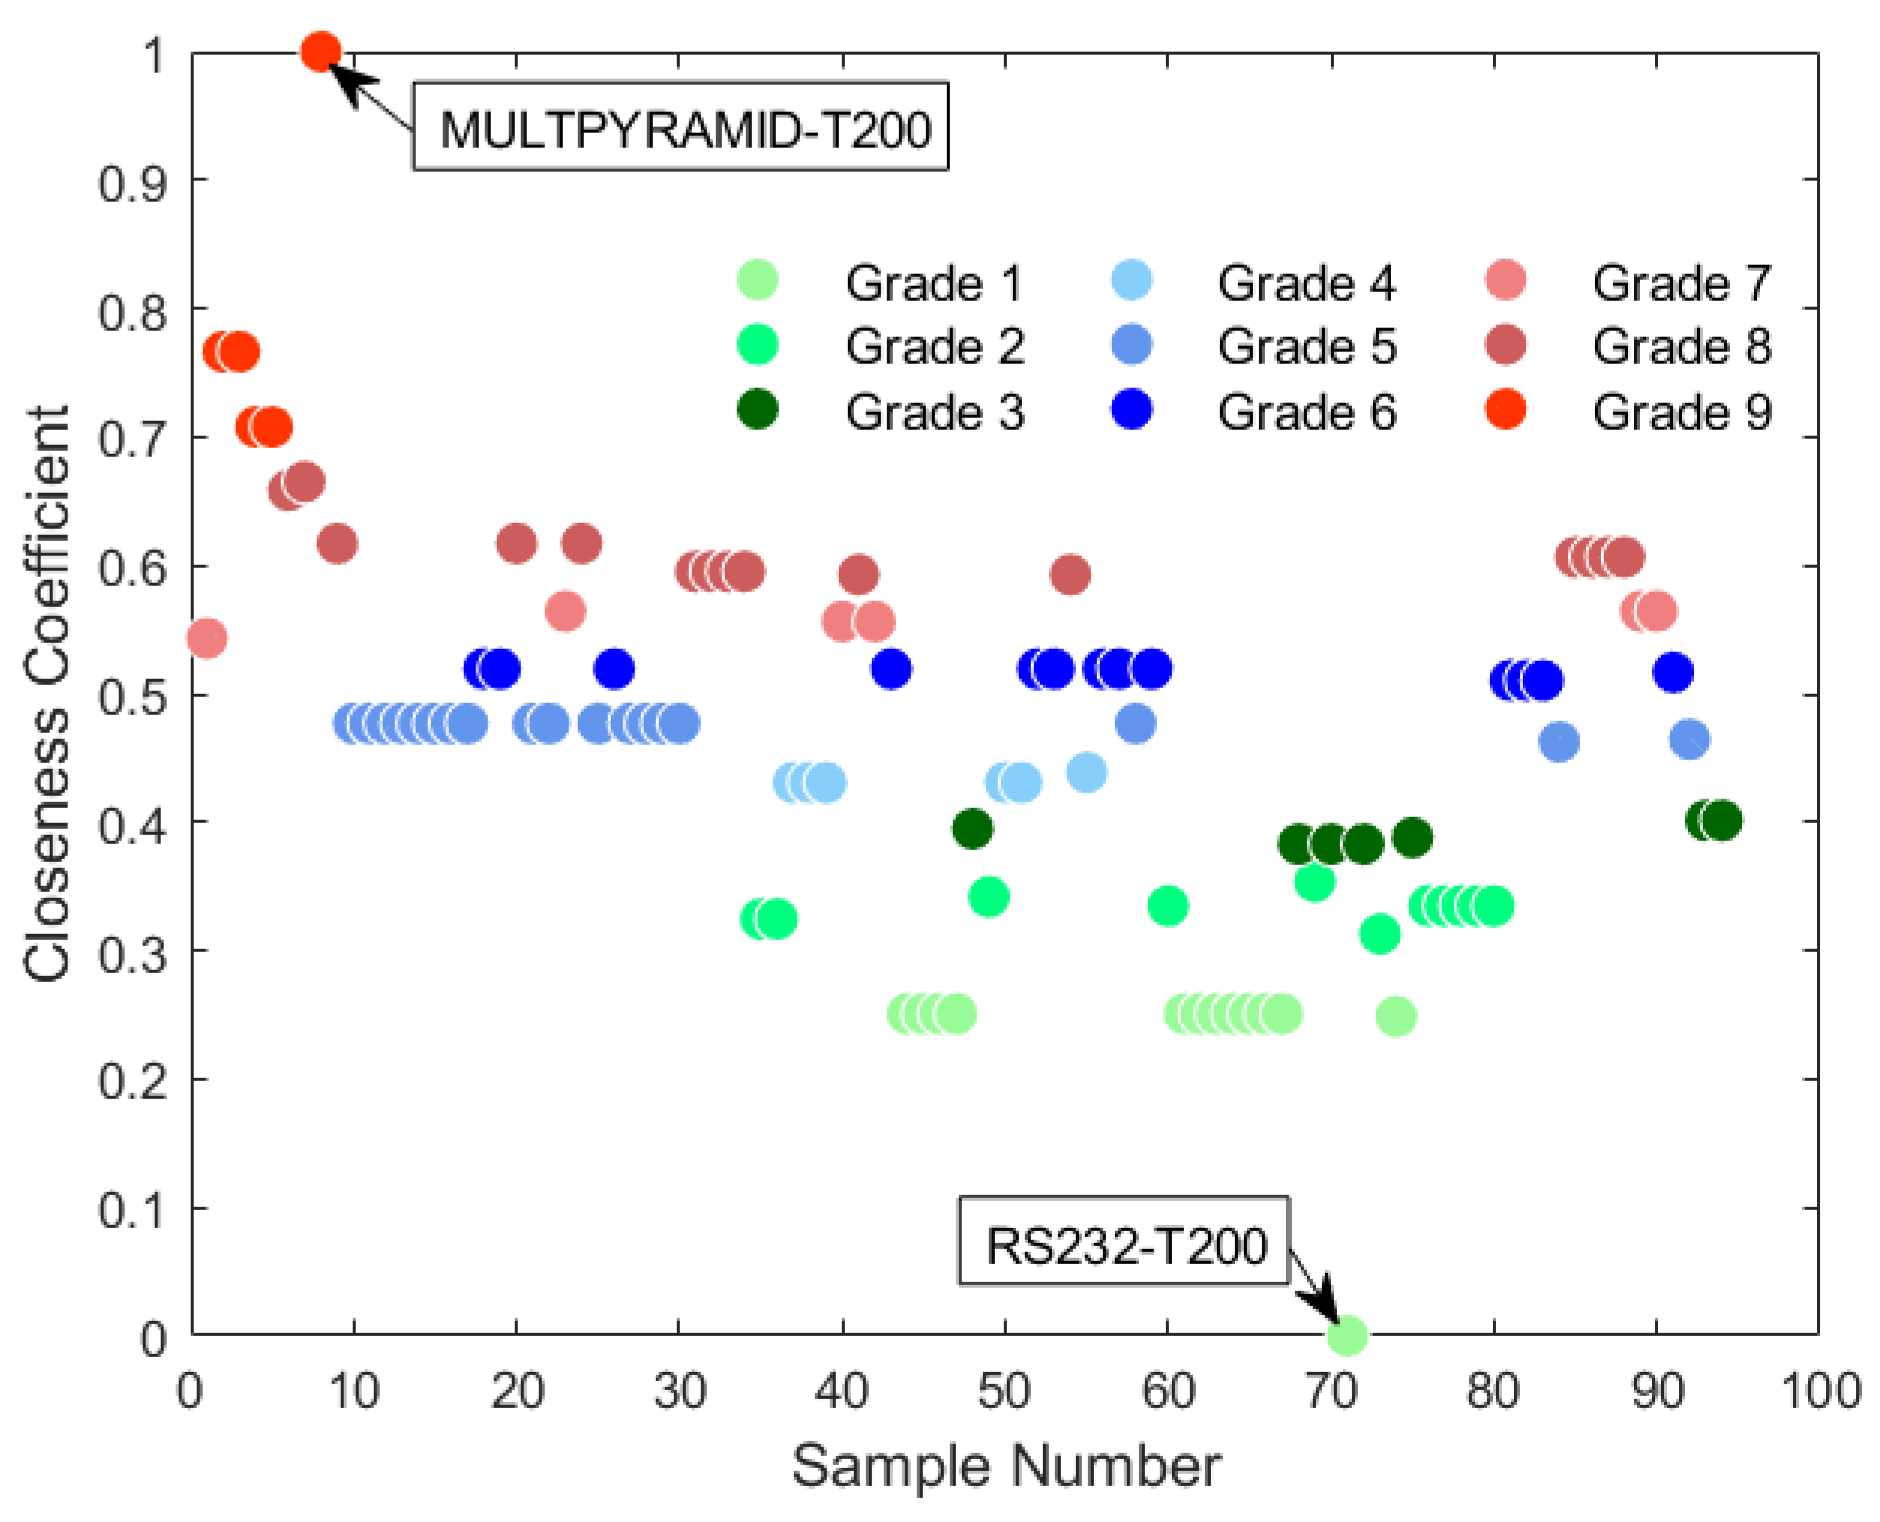
4.2. Quantitative Assessment Results

Using Algorithm 1, the weight of each attribute and whether it was a core attribute was established as shown in Table 2. The core attributes in the HT threat information system are A b s t r a c t i o n   L e v e l , A c t i v a t i o n   M e c h a n i s m , E f f e c t , and L o c a t i o n . According to Algorithm 1, the process of calculating the weight is as follows:
I ( A ) = I ( C ) = 1 15 × 1 2 + 6 × 2 2 + 4 × 3 2 + 2 × 4 2 + 6 2 + 9 2 + 11 2 + 16 2 94 2 = 0.929
si g C ( a 1 ) = si g ( C { a 1 } ) { a 1 } ( a 1 ) = I ( C { a 1 } ) I ( C ) = 0
s i g A { a 2 } ( a 2 ) = 1 52 2 + 26 2 + 16 2 94 2 = 0.588
s i g A { a 3 } ( a 3 ) = 1 27 2 + 51 2 + 5 2 + 11 2 94 2 = 0.607
s i g A { a 4 } ( a 4 ) = 1 7 2 + 25 2 + 26 2 + 36 2 94 2 = 0.701
s i g A { a 5 } ( a 5 ) = 1 29 2 + 2 2 + 6 2 + 4 2 + 1 2 + 52 2 94 2 = 0.592
In order to verify the weight calculation method based on RST, we compared the results of the Entropy Weight Method (EWM) [23] with the results of the proposed method, as shown in Table 2. It can be seen that the weights for the five attributes of the two methods are in the same order, namely, E f f e c t , A c t i v a t i o n   M e c h a n i s m , L o c a t i o n , A b s t r a c t i o n   L e v e l , and I n s e r t i o n   P h a s e , ordered from highest to lowest. In terms of running time, RST requires 1.92 ms, while EWM requires 1.61 ms. In addition, the RST algorithm can be used for attribute reduction in order to simplify calculation. The I n s e r t i o n   P h a s e is a non-core attribute and its weight is zero, indicating that the I n s e r t i o n   P h a s e attribute is redundant. In the original data, the difference in the I n s e r t i o n   P h a s e was the smallest. This means that the discrimination of HT threat is small during the I n s e r t i o n   P h a s e . From the attributes shown in Table 1, the values for the I n s e r t i o n   P h a s e are related to the A b s t r a c t i o n   L e v e l and A c t i v a t i o n   M e c h a n i s m .
All the HTs inserted in the fabrication phase are described at the layout level as well as being always activated, and vice versa. Therefore, there is a high positive correlation between I n s e r t i o n   P h a s e and both A b s t r a c t i o n   L e v e l and A c t i v a t i o n   M e c h a n i s m . The I n s e r t i o n   P h a s e attribute can be replaced by the attributes of A b s t r a c t i o n   L e v e l and A c t i v a t i o n   M e c h a n i s m . In reality, for HTs inserted in the fabrication phase, their A b s t r a c t i o n   L e v e l and A c t i v a t i o n   M e c h a n i s m are rather limited.
According to the results of the attribute weight analysis, the A b s t r a c t i o n   L e v e l , A c t i v a t i o n   M e c h a n i s m , E f f e c t , and L o c a t i o n are the core attributes, and are the most important indices for assessing HT threat. Numerically, the weight of E f f e c t is the largest and that of A b s t r a c t i o n   L e v e l is the lowest. In fact, HT threats are mainly determined by their attack effects. In comparison, the description language used has relatively low impact on the HT threat.
Our overall threat analysis of the 94 HTs is shown in Figure 1. Among them, the threat of multpyrmid-T200 is the greatest, with a CC of 1. This is because the multpyrmid-T200 HT is inserted during the Fabrication phase, is included in the layout design, is always active, causes denial of service, and resides in the processor. It has the highest value on all five attributes, serving as the positive ideal reference point in TOPSIS. On the contrary, the threat of RS232-T200 is the lowest; with a CC of 0. It is inserted at the Design phase, is included in the Register Transfer level, is activated by a Physical Condition, results in Degraded Performance, and resides at a location, Other, that is not one of the five specifically named in Table 1. It has the lowest value on all five attributes, serving as the negative ideal reference point in TOPSIS.

4.3. Preliminary Experiment of Threat Discretization

The threat analysis results were clustered 10,000 times using the k-means algorithm. The mode of the clustering result was selected as the reference. If the clustering result was different from the mode of the clustering results, it was regarded as an error. The number of errors in the 10,000 clustering results was used to characterize the stability and accuracy of the clustering results. The higher the number of errors, the less stable and accurate the clustering is. In [24], the rationality of the empirical rule k n is proved theoretically, where k is the number of clusters and n is the number of samples. As the number of clusters is undetermined, there are 94 instances of the information system for n = 94 and 2 k 9 . The results with 10,000 clusterings carried out by randomly selecting the initial cluster center are shown in Figure 2.
It can be concluded that when k = 3 , the number of errors is the lowest. However, the error is rather high, even for the best case, as the error proportion for k = 3 is nearly 37%. When k > 3 , the proportion of errors is higher than 50%, up to 98%, and thus the clustering results are unstable. In this case, the data on HT threats cannot be discretized by the k-means algorithm directly, and further improvement is needed.

4.4. Clustering Results and Optimal Cluster Selection

We used the k-means++ algorithm [25], equidistant division (ED) [26], and EFD to select the initial clustering center. The results of our analysis of 10,000 clusterings is shown in Table 3. The ‘running time’ in the table refers to the time spent executing the clustering algorithm 10,000 times with MATLAB, and was recorded using the ‘tic toc’ function.
It can be seen from the table that when k > 3 , the error proportion of both the k-means++ algorithm and the ED-based k-means is higher than 20%. Hence, when the number of clusters is high, the traditional methods demonstrate poor stability in the clustering of HT threat data. Using EFD to select the initial clustering center can reduce the number of errors to zero. When 2 k 9 , the number of errors is zero, and thus the clustering results are highly stable. In terms of running time, EFD-based k-means has the shortest time at of 245.99 s. Obviously, in the discretization of HT threat data, the EFD-based method is much better than the other two clustering algorithms and has ideal results with regards to both stability and operation time.
We used the BWP index to characterize the effectiveness of clustering and determine the optimal number of clusters. For 2 k 9 , the BWP indices of the EFD-based clustering are as shown in Figure 3. When k = 9 , the BWP index is the largest, which is much higher than for the other cases. This indicates that the separation between clusters and the tightness within clusters are the best. It is worth noting that, according to Figure 3, when k 6 the BWP index increases with the increment of k. However, according to the empirical rule in [24], k 9 . The higher k is, the better the clustering effect; however, this means that there is more detailed information on HT threats is, which is not conducive to the defender being able to prepare fast and effective countermeasures. Therefore, when discretizeing the HT threat we divided it into nine grades, as shown in Figure 1.
The improved k-means algorithm clearly classifies the threat from high to low, and the separation degree of each level is rather high. The Effect of the five HTs with the highest threat is denial of service, and their activation mechanism is A l w a y s O n , which is consistent with the actual situation. The thirteen HTs posing the lowest threat level are all activated by physical conditions. Thus, it can be seen that the E f f e c t and A c t i v a t i o n   M e c h a n i s m are the main factors affecting HT threat, which is consistent with the weight calculation results; the correctness of the proposed method is thus verified.

5. Conclusions

This paper suggests a new scheme for the quantitative assessment of HT threat through calculation of the weights of their attributes based on RST and TOPSIS. A novel attribute weight calculation method that introduces the use of the information content and attribute significance into the rough set theory is proposed. This method can calculate the weights for both core and non-core attributes of the information system without the use of decision attributes. TOPSIS is incorporated into the proposed method for the quantitative analysis of HT threat, which is characterized by the closeness coefficient. A clustering method based on the k-means algorithm and equal frequency division is proposed for the improvement of clustering and prompt countermeasure deployment. In contrast to many other k-means algorithm-based clustering methods, this method has the advantages of high accuracy and short running time, as demonstrated in this paper by statistical testing using 94 benchmark HT circuits found on Trust-hub. The BWP index was used to determine the number of clusters and verify the effectiveness of clustering. This type of quantitative assessment is particularly useful for calculating of the payoff of the attackers’ actions in HT-related game theory.

Author Contributions

Formal analysis, D.Y.; Methodology, D.Y.; Validation, J.H.; Writing—original draft, D.Y.; Writing—review & editing, C.G. All authors have read and agreed to the published version of the manuscript.

Funding

This research received no external funding.

Institutional Review Board Statement

Not applicable.

Informed Consent Statement

Not applicable.

Conflicts of Interest

The authors declare no conflict of interest.

References

  1. Karri, R.; Rajendran, J.; Rosenfeld, K.; Tehranipoor, M. Trustworthy Hardware: Identifying and Classifying Hardware Trojans. Computer 2010, 43, 39–46. [Google Scholar] [CrossRef]
  2. Tehranipoor, M.; Koushanfar, F. A Survey of Hardware Trojan Taxonomy and Detection. Des. Test Comput. IEEE 2010, 27, 10–25. [Google Scholar] [CrossRef]
  3. Kim, L.; Villasenor, J. Dynamic Function Replacement for System-on-Chip Security in the Presence of Hardware-Based Attacks. IEEE Trans. Reliab. 2014, 63, 661–675. [Google Scholar] [CrossRef]
  4. Rudra, M.; Daniel, N.; Nagoorkar, V.; Hoe, D. Designing Stealthy Trojans with Sequential Logic: A Stream Cipher Case Study. Proc.-Des. Autom. Conf. 2014, 1, 1–4. [Google Scholar] [CrossRef]
  5. Yang, K.; Hicks, M.; Dong, Q.; Austin, T.; Sylvester, D. A2: Analog Malicious Hardware. IEEE Symp. Secur. Priv. 2016, 5, 18–37. [Google Scholar] [CrossRef]
  6. Bhunia, S.; Abramovici, M.; Agrawal, D.; Bradley, P.; Hsiao, M.; Plusquellic, J.; Tehranipoor, M. Protection against Hardware Trojan Attacks: Towards a Comprehensive Solution. Des. Test IEEE 2013, 30, 6–17. [Google Scholar] [CrossRef]
  7. Chakraborty, R.; Wolff, F.; Paul, S.; Papachristou, C.; Bhunia, S. MERO: A Statistical Approach for Hardware Trojan Detection. In Cryptographic Hardware and Embedded Systems—CHES. Lecture Notes in Computer Science; Springer: Berlin/Heidelberg, Germany, 2009; Volume 5747, pp. 396–410. [Google Scholar] [CrossRef] [Green Version]
  8. Graf, J. Trust games: How game theory can guide the development of hardware Trojan detection methods. In Proceedings of the IEEE International Symposium on Hardware Oriented Security & Trust, McLean, VA, USA, 3–5 May 2016; pp. 91–96. [Google Scholar] [CrossRef]
  9. Kamhoua, C.; Zhao, H.; Rodriguez, M.; Kwiat, K. A Game-Theoretic Approach for Testing for Hardware Trojans. IEEE Trans.-Multi-Scale Comput. Syst. 2016, 2, 199–210. [Google Scholar] [CrossRef]
  10. Yang, D.; Gao, C.; Huang, J. Dynamic Game for Strategy Selection in Hardware Trojan Attack and Defense. IEEE Access 2020, 8, 213094–213103. [Google Scholar] [CrossRef]
  11. Saha, S.; Chakraborty, R.; Mukhopadhyay, D. Testability Based Metric for Hardware Trojan Vulnerability Assessment. In Proceedings of the Euromicro Conference on Digital System Design, Limassol, Cyprus, 31 August–2 September 2016; pp. 503–510. [Google Scholar] [CrossRef]
  12. Guo, X.; Dutta, R.; He, J.; Tehranipoor, M.; Jin, Y. QIF-Verilog: Quantitative Information-Flow based Hardware Description Languages for Pre-Silicon Security Assessment. In Proceedings of the IEEE International Symposium on Hardware Oriented Security and Trust, McLean, VA, USA, 5–10 May 2019; pp. 91–100. [Google Scholar] [CrossRef]
  13. Gao, C.L.; Li, S.C.; Wang, J.; Li, L.; Lin, P. The Risk Assessment of Tunnels Based on Grey Correlation and Entropy Weight Method. Geotech. Geol. Eng. 2018, 36, 1621–1631. [Google Scholar] [CrossRef]
  14. Wei, J.; Zhou, L.; Wang, F.; Wu, D. Work safety evaluation in Mainland China using grey theory. Appl. Math. Model. 2015, 39, 924–933. [Google Scholar] [CrossRef]
  15. Shi, H.; Li, W.; Meng, W. A New Approach to Construction Project Risk Assesment Based on Rough Set and Information Entropy. In Proceedings of the International Conference on Information Management, Innovation Management and Industrial Engineering, Taipei, Taiwan, 19–21 December 2008; Volume 1, pp. 187–190. [Google Scholar] [CrossRef]
  16. Hatefi, S.; Tamosaitiene, J. Construction Projects Assessment Based on the Sustainable Development Criteria by an Integrated Fuzzy AHP and Improved GRA Model. Sustainability 2018, 10, 991. [Google Scholar] [CrossRef] [Green Version]
  17. Shakya, B. Benchmarking of Hardware Trojans and Maliciously Affected Circuits. J. Hardw. Syst. Secur. 2017, 1, 85–102. [Google Scholar] [CrossRef]
  18. Jin, Y.; Makris, Y. Hardware Trojans in Wireless Cryptographic ICs. Des. Test Comput. IEEE 2010, 27, 26–35. [Google Scholar] [CrossRef]
  19. Banga, M.; Hsiao, M. A Region Based Approach for the Identification of Hardware Trojans. In Proceedings of the IEEE International Workshop on Hardware-Oriented Security and Trust, Anaheim, CA, USA, 9 June 2008; pp. 40–47. [Google Scholar] [CrossRef]
  20. Wolff, F.; Papachristou, C.; Bhunia, S.; Chakraborty, R. Towards Trojan-Free Trusted ICs: Problem Analysis and Detection Scheme. In Proceedings of the Conference on Design, Automation and Test in Europe, Munich, Germany, 10–14 March 2008; pp. 1362–1365. [Google Scholar] [CrossRef]
  21. Liu, S.; Forrest, J. On measures of information content of grey numbers. Kybernetes 2006, 35, 899–904. [Google Scholar] [CrossRef]
  22. Zhou, S.B.; Xu, Z.Y.; Tang, X.Q. Method for determining optimal number of clusters in K -means clustering algorithm. J. Comput. Appl. 2010, 30, 1995–1998. [Google Scholar] [CrossRef]
  23. Yang, J.Y.; Zhang, L.L. Fuzzy Comprehensive Evaluation Method on Water Environmental Quality Based on Entropy Weight with Consideration of Toxicology of Evaluation Factors. Adv. Mater. Res. 2012, 356, 2383–2388. [Google Scholar] [CrossRef]
  24. Sun, Z.J.; Liang, Y.Q.; Fan, J. Optimization Study and Application on the K Value of K-Means Algorithm. J. Bioinform. Intell. Control. 2013, 2, 223–227. [Google Scholar] [CrossRef]
  25. Arthur, D.; Vassilvitskii, S. K-Means++: The Advantages of Careful Seeding. In Proceedings of the Eighteenth Annual ACM-SIAM Symposium on Discrete Algorithms, New Orleans, LA, USA, 7–9 January 2007; Volume 8, pp. 1027–1035. [Google Scholar]
  26. Li, G.; Tang, J. A New K-Neighbor Search Algorithm Based on Variable Incremental Dynamic Grid Division. In Proceedings of the International Symposium on Computational Intelligence and Design, Hangzhou, China, 11–12 December 2010; pp. 167–170. [Google Scholar] [CrossRef]
Figure 1. Threat-grading results for the 94 HTs found on Trust-hub.
Applsci 12 05576 g001
Figure 2. Instability analysis of k-means clustering results for different values of k.
Applsci 12 05576 g002
Figure 3. Cluster Validity Analysis of the proposed method with different values of k.
Applsci 12 05576 g003
Table 1. Selected Attributes Analysis for HT Threats.
AttributeClassValue
Insertion PhaseDesign1
Fabrication2
Abstraction LevelRegister Transfer1
Gate2
Layout3
Physical4
Activation MechanismAlways On4
Time-Based2
Physical-Condition-Based1
User Input3
EffectChange Functionality2
Degrade Performance1
Information Leakage3
Denial of Service4
LocationProcessor6
Memory5
I/O4
Power Supply2
Clock Grid3
Others1
Table 2. Weight Analysis and Core Attribute Judgment.
CategoryInsertion
Phase
Abstraction
Level
Activation
Mechanism
EffectLocation
Core AttributeNoYesYesYesYes
Weight for RST00.5880.6070.7010.592
Weight for EWM0.0570.1250.2190.3950.202
Table 3. Comparison of the effects of four clustering methods on the number of errors and the running time.
CategoryNumber of ErrorsRunning
Time (s)
K = 2K = 3K = 4K = 5K = 6K = 7K = 8K = 9
k-means49863706584062208197921494979632259.355
k-means++0244754682047976781649716229303.718
ED-based k-means0446297438425538513449845211283.319
EFD-based k-means00000000245.997
Publisher’s Note: MDPI stays neutral with regard to jurisdictional claims in published maps and institutional affiliations.

