1. Introduction
The protein content of a sea cucumber is high, but its sugar content is low, so it has great nutritional and medicinal value. However, because of their seasonal production and easy self-dissolution, sea cucumbers should be processed early in their production cycle to facilitate their transport, storage, and nutritional value retention. Drying is one of the most important methods used to process sea cucumbers.
Duan [
1] and Yuan [
2] introduced the current methods of drying sea cucumbers by using modern food processing practices. They all mentioned in their research that the drying of seafood should be carried out at a lower temperature. Mu et al. [
3] concluded that the heat pump drying speed is faster when the drying air has lower relative humidity, higher velocity, and smaller size. Zheng [
4] described the development of heat pump drying technology and its application in drying agricultural by-products. Sun et al. [
5] studied the convective drying process and characteristics of sea cucumbers at different temperatures, and the optimum drying temperature was determined to be 45 °C.
In order to further refine the optimal drying process and improve the quality of the dry product, mathematical simulation methods are used for the heat pump drying research [
6]. For example, Zhao H B et al. [
7] studied the water loss of cabbage seeds by heat pump drying and established four different drying models when the temperature of the dry air and the relative humidity were different. Chen G X et al. [
8] established a three-dimensional physical model of a large warehouse to study its heat and moisture transfer processes of cooling, drying, and ventilation. Wang Y F [
9] studied specific drying processes with numerical simulation and experimental verification to explore the effects of pressure, temperature, wind speed, and air humidity on tea drying. Zheng B H et al. [
10] established a thermal and mass transfer model of wood to simulate the relationship between temperature and moisture content with drying time. It can be seen that the change in wind speed will also have a great impact on the drying process. Kong N H [
11] discussed the effects of drying parameters in-depth, looking at the effects of hot air temperature, initial moisture content, and hot air speed on monomer corn granule drying characteristics and stress. Li W R et al. [
12] studied the heat pump drying characteristics of mushrooms. The experimental results showed that the drying temperature of the heat pump suitable for mushroom is 55 °C. B. A. Fu et al. [
13] established a mathematical model of intermittent infrared convection. The results showed that the final product quality after batch infrared convective drying was higher than that of convective hot air drying. Daniel I et al. [
14] developed a mathematical model of infrared and hot wind combined drying in which the relationship between temperature, shrinkage, and diffusion rate was considered to accurately predict the change in moisture content and temperature distribution in sweet potatoes. C.L. Hii et al. [
15] studied a dynamic model of cocoa bean heat pump drying under varied conditions. A shrinkage factor was incorporated into the heat and mass transfer model.
In recent years, with the further study of heat and mass transfer in porous media, a porous media model of materials has been used to analyse the heat and mass transfer characteristics in drying processes. Sabarez et al. [
16] described the coupled transfer of momentum, heat, and mass in air and food and predicted the convective drying process of plums. Zhu D G et al. [
17] established a two-dimensional mathematical model of heat and mass transfer in the convective drying of food. Yuan et al. [
18] built a porous media network model based on an analysis of the parameters of natural porous media and analysed the moisture migration mechanism in the drying process. Chen et al. [
19] carried out a numerical simulation of the water migration and three-phase transformation process in porous thermal insulation materials under large temperature differences based on the thermodynamic equilibrium hypothesis and dynamic boundary conditions.
It can be seen from the above literature that temperature and wind speed are two important factors affecting the drying process. As a typical porous medium, sea cucumber contains different components such as liquid water and steam. At present, the heat mass coupling transfer mechanism of sea cucumber under different working conditions is not clear. In this paper, a heat and mass transfer model in a porous medium was established to understand, in depth, the heat-moisture coupled transfer characteristics of sea cucumbers during heat pump drying, which helps to master the convective drying mechanism and optimize the convective drying process of seafood.
2. Materials and Methods
2.1. Experimental Materials
Three groups of experimental materials were selected, and two parallel contrast samples were identified in each group. The body weight of sea cucumber No. 1 was (30 ± 0.5) g, and the radii of length and width were 43 ± 2 mm and 24 ± 2 mm, respectively. The body weight of sea cucumber No. 2 was (18.9 ± 0.5) g, and the radii of length and width were 35 ± 2 mm and 20 ± 2 mm, respectively. The body weight of sea cucumber No. 3 was (17.2 ± 0.5) g, the radii of length and width were 35 ± 2 mm and 18 ± 2 mm, respectively.
2.2. Instruments and Equipment
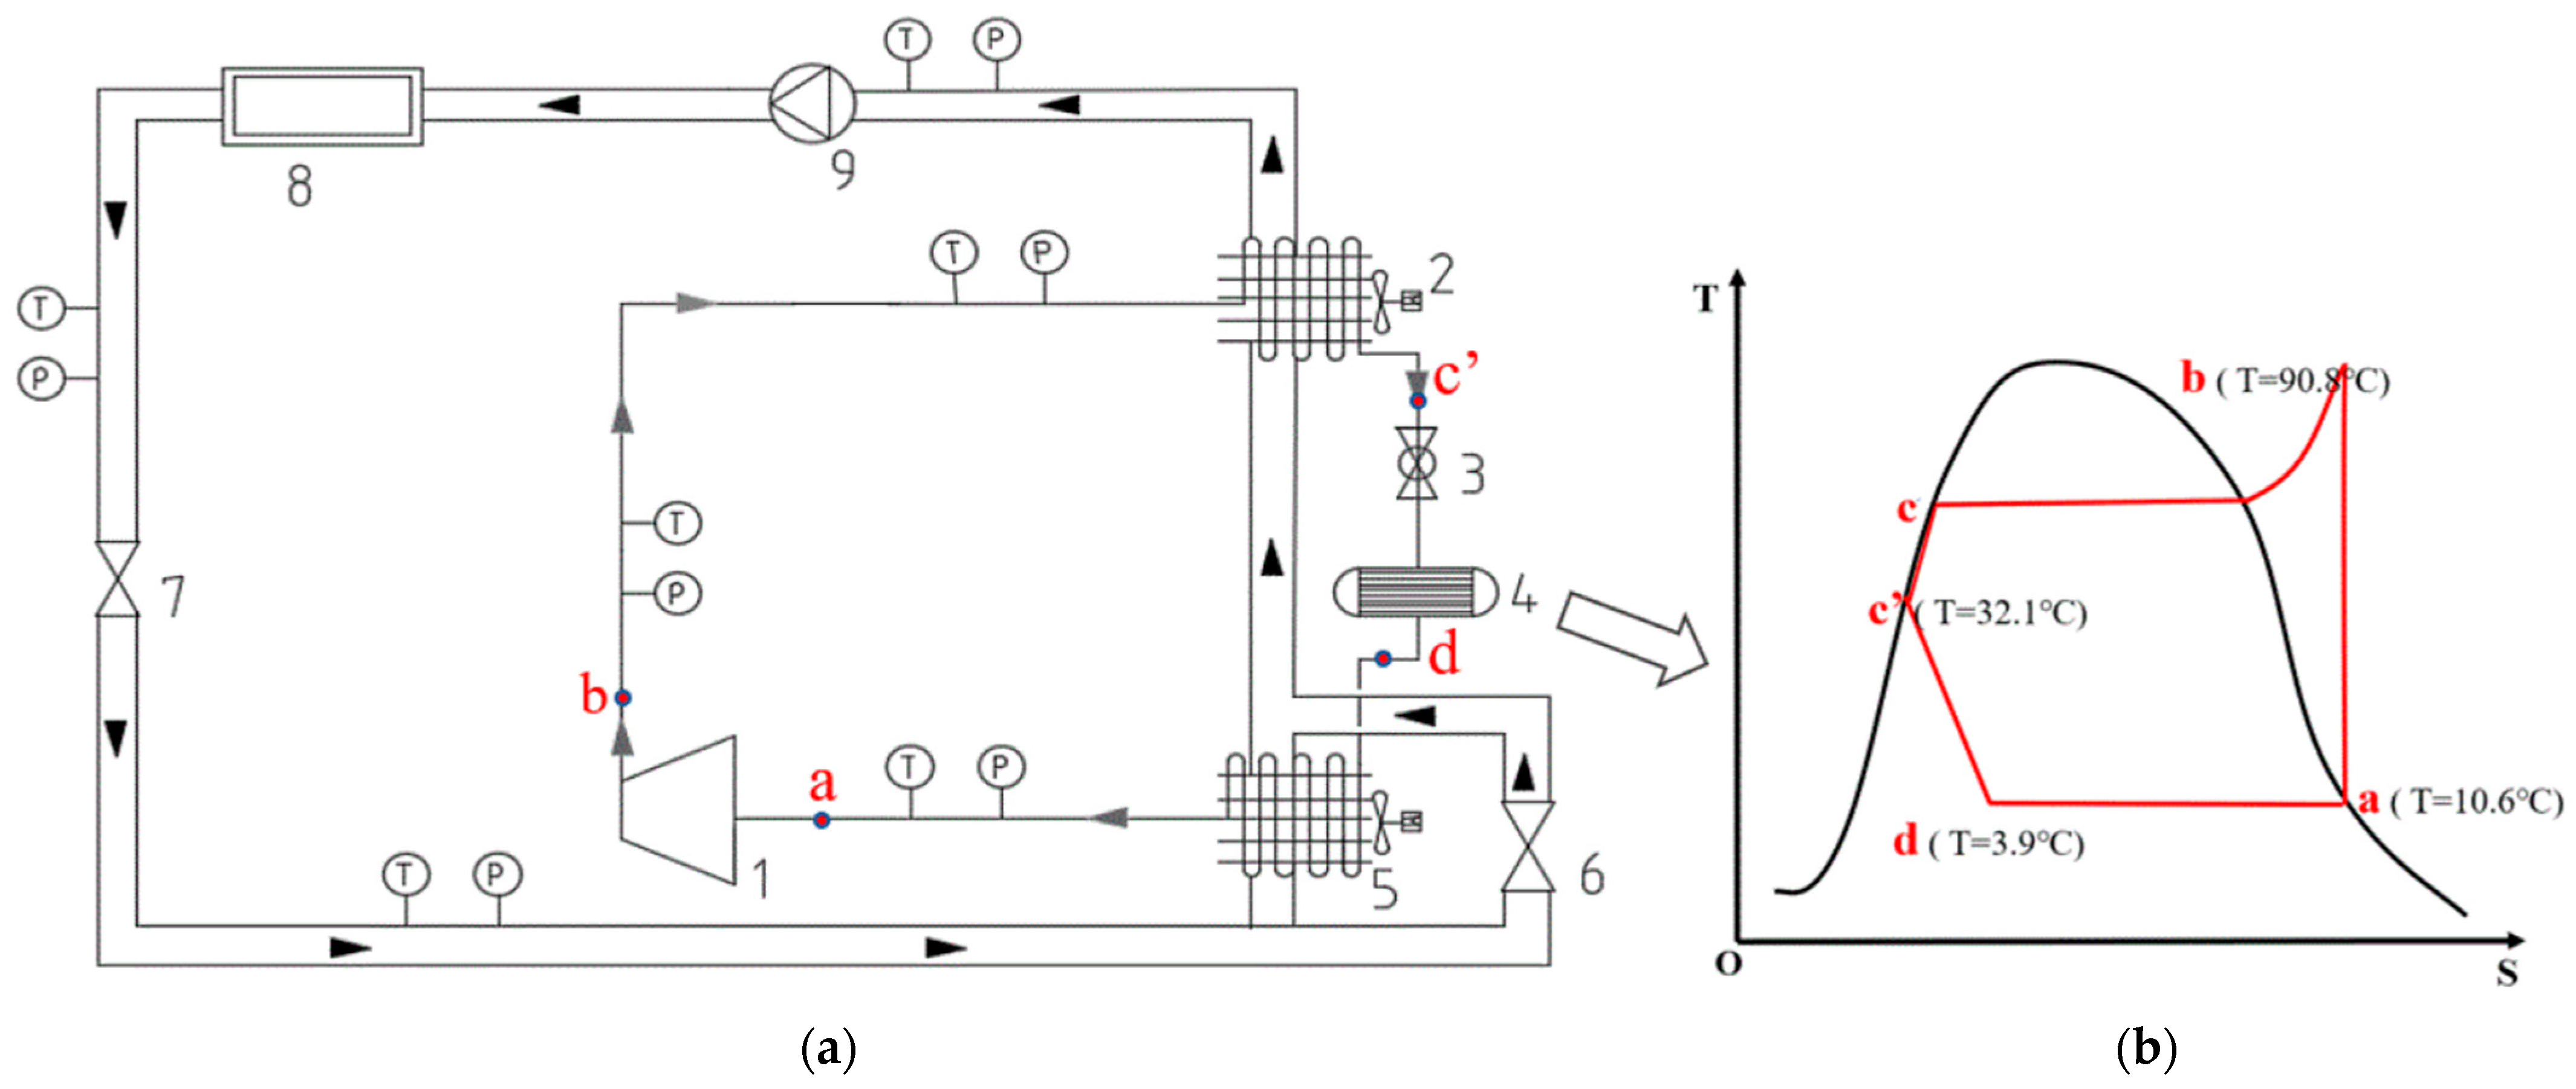
The measuring instruments included the YH-A6002 electronic balance (Shanghai Yingheng Weighing Equipment Co., Ltd., Shanghai, China, accuracy is ±0.001 g), PT100 thermal resistances (Xi’an Xiaxi Electronic Technology Co., Ltd., Xi’an, China, accuracy is ±1 °C), hot wire anemometer (Qingdao Juchuang Environmental Protection Group Co., Ltd., Qingdao, China, accuracy is ±0.5 m/s), and heat pump drying equipment (
Figure 1).
The experimental system consists of a heat pump circuit and a dry air circuit. The heat pump loop includes a compressor (1), condenser (2), throttle valve (3), reservoir (4), evaporator (5), and corresponding connecting pipeline; the dry air loop includes a drying oven (8), circulating fan (9), air flow regulating valve, bypass valve, and other components. The device utilizes a reverse Carnot cycle to recover waste air heat at the outlet of the drying oven to realize cyclic heating. When the refrigerant enters the compressor (1), it is heated and high-pressure gas flows into the condenser (2), heats the dry air and condenses into liquid, enters the throttle valve through the reservoir (4), and becomes a low temperature and low-pressure gas–liquid mixture to flow back to the evaporator (5) to absorb heat. In the drying air circuit, the air enters the condenser (2) to absorb heat and temperature rises, then enters the drying equipment driven by the fan to dry the material, then absorbs the moisture of the material and flows out of the drying equipment. After passing through the airflow regulating valve, the air is divided into two paths, one through the first bypass (6) to the evaporator to dehumidify, the other through the second bypass (7) ventilation regulating valve. The two air paths are mixed and then heated in the condenser to complete the air loop circulation. The side ventilation regulating valve can regulate the temperature and humidity of the dry air.
2.3. Experimental Steps
Before each test, the heat pump’s drying temperature was set to 40 °C, 33 °C, and 30 °C (temperature difference ±1 degrees Celsius). The experiment began after the temperature was stable. The wind speed in the drying equipment was set to 3.3 m/s. The steps were:
- (a)
For pretreatment, a fresh sea cucumber was boiled in water for 10 min.
- (b)
The boiled sea cucumber was weighed and its initial size was measured.
- (c)
The sea cucumber was put into the drying equipment, and the air outlet temperature was set to one of the above temperatures in turn. Two temperature measuring points were arranged on the surface and inside of the sample. After the drying machine was running, the sea cucumber was weighed and measured every 20 min. The length of the test was set at 600 min.
- (d)
The above steps were repeated three times, and their average results were analyzed.
2.4. Test Quantity and Calculating Formulas
- (1)
Dry-base moisture
Dry-base moisture content was determined by the atmospheric drying method specified in the GB/T5009.3-2016 National Food Safety Standard.
where
is the moisture content on dry basis,
is the water concentration,
is the vapor concentration,
is the porosity, and
is the density of the solid skeleton.
- (2)
Relative deviation rate
where
is the experimental value and
is the simulated value.
- (3)
Correlation coefficient
where
y is the fitting value,
is the corresponding experimental value,
m is the number of data,
i is the group experiment, and
j is the number of constants.
2.5. Physical Model
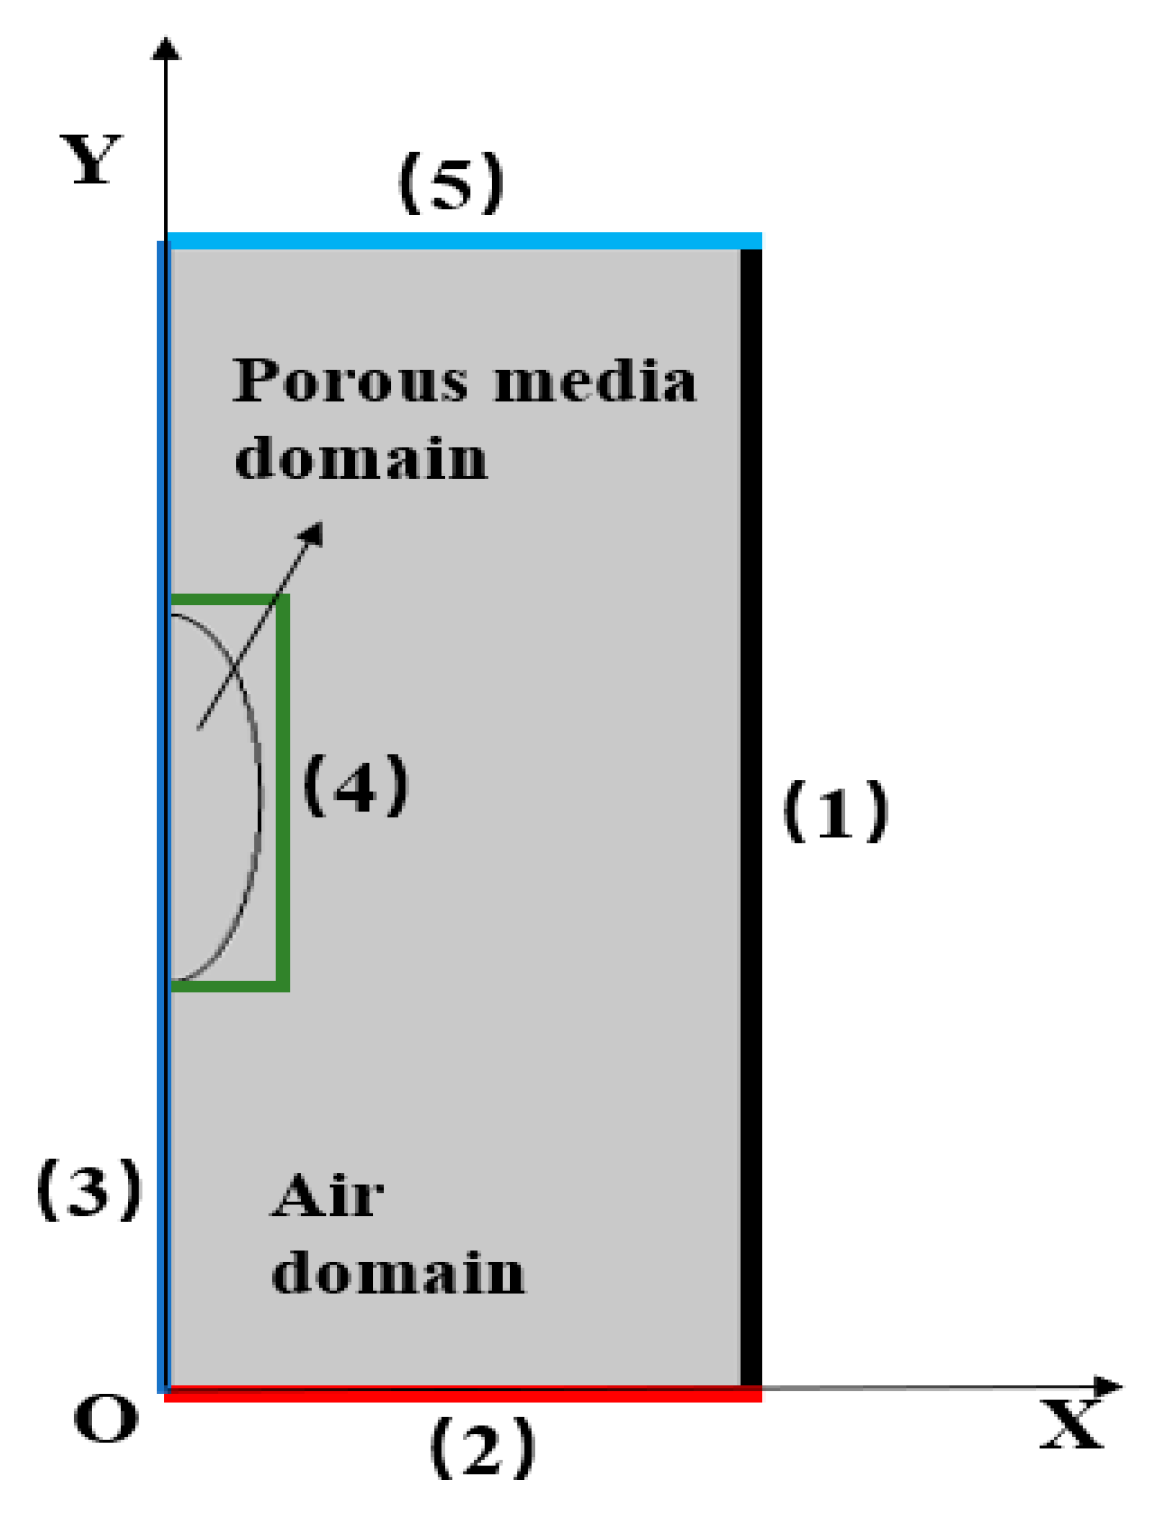
In order to simplify the model and improve the efficiency of its numerical simulation, the following assumptions are proposed: hot air enters the inlet of the drying equipment and flows through the ellipsoidal material to be dried in the axial direction, the temperature and moisture content of the sea cucumber were uniformly distributed in its initial state, and the effect of porosity change on internal water transfer due to volume shrinkage of the sea cucumber during drying was neglected.
Under the above assumptions, a two-dimensional axisymmetric model of heat pump drying of sea cucumber was established by taking the whole sea cucumber as the test sample and considering its axisymmetric characteristics, as shown in
Figure 2.
2.6. Governing Equations
The sea cucumber is a heterogeneous porous medium [
20]. Its volume component is defined as
The porosity
is described as
where
is the solid phase component,
is the liquid phase component,
is the gas phase component, and
is the porosity.
The water saturation
Sw and the air saturation
Sg are defined as the volume fractions of water and gas in the pore volume, respectively.
The water concentration of the porous medium is defined as [
21]
where
is the porosity,
is the density of the fluid,
is the water saturation, and
is the molecular weight.
The vapor concentration at ambient temperature is defined as [
21]
where
is the air temperature,
R is the gas constant
is the vapor concentration.
The evaporation source phase
is defined as [
21]
where
is the evaporation rate constant,
is the molecular weight,
is the vapor concentration, and
is the saturated vapor concentration.
The dry basis moisture content of sea cucumber is defined as [
21]
where
is the moisture content on dry basis,
is the water concentration,
is the vapor concentration,
is the porosity, and
is the density of the solid skeleton.
The momentum equation in the drying oven is
The momentum equation in the porous medium region is
where
is the density
is the dynamic viscosity of air,
is the turbulent viscosity,
t is the time,
is the relaxation function, and
is the porosity.
The mass transfer of vapor occurs in the drying oven and porous media, whereas that of water occurs only in the porous media. The mass equations for the drying oven and porous media are described as follows:
Mass equations for vapor and water in the porous media:
Mass equation for vapor in the drying oven:
where
and
are the mass fluxes of vapor and water, respectively.
is the water concentration, and
is the vapor concentration.
The mass flux of vapor in the porous media can be described as [
22]
The mass flux of water in the porous media can be described as [
22]
where
is the superficial velocity of the fluid,
is the vapor diffusion coefficient, and
is capillary diffusion coefficient.
The heat transfer equation in the drying oven is
The heat transfer equation in the porous medium is
The effective thermophysical parameters are defined as
where
, and
are the effective density, specific heat capacity, and thermal conductivity, respectively, calculated by weighting each component, liquid water and air, respectively.
is the latent heat of evaporation,
is the water saturation, and
is the temperature.
2.7. Boundary Condition
For a better understanding, the boundary conditions of the above physical model are shown in
Figure 2. Each boundary condition is described as follows: labels (1) and (3) represent the outer wall and rotation boundary of the drying oven, respectively. Label (2) represents the inlet of the drying oven, where the air velocity and temperature are constant, and (4) represents the contact surface between the sea cucumber and hot air. There was no water seepage on the surface during the process; hence, the normal gradient of the water concentration was zero. Label (5) is the outlet of the drying oven; hence, the normal gradient of all physical variables was zero. The boundary conditions of the drying oven are listed in
Table 1, respectively.
3. Results and Discussions
3.1. Analysis of Temperature and Dry Basis Moisture Content Changes
Based on the above model, combined with the experimental boundary conditions, the inlet speed of the drying oven is 3.3 m/s, the inlet temperatures are 30 °C, 33 °C, and 40 °C, and the inlet pressure is 101,325 Pa.
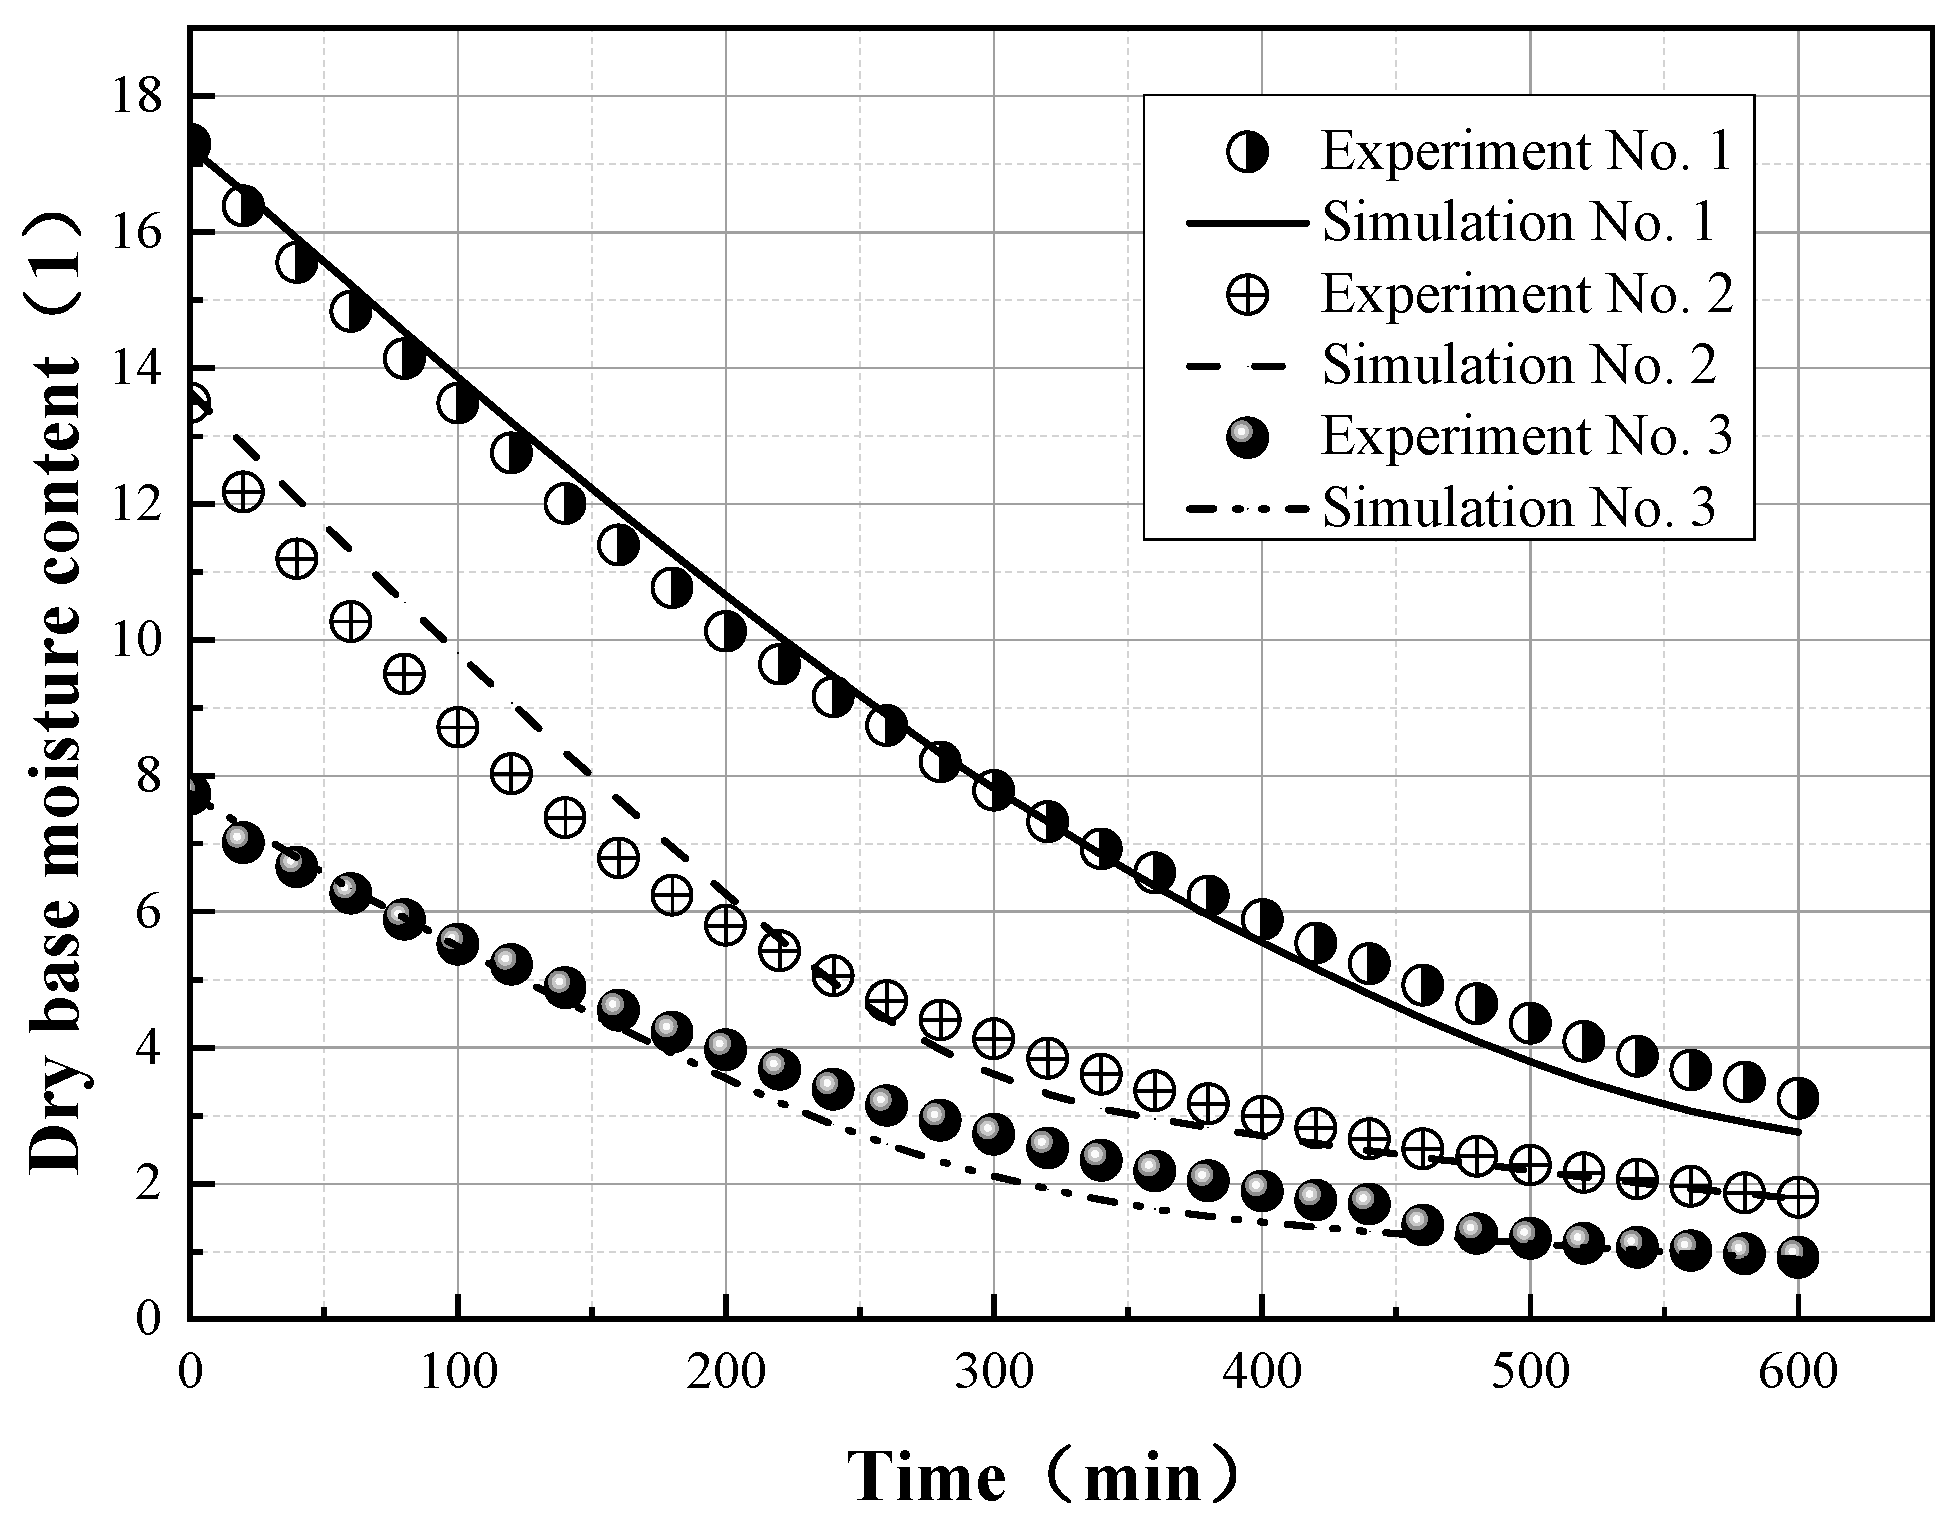
Under different drying inlet temperature conditions, the simulated dry-base water contents of samples No. 1–3 were compared with experimental data, as shown in
Figure 3.
From
Figure 3, it can be seen that both the simulated and experimental values of dry-base water content decrease exponentially.
The overall comparison shows that the experimental values of dry-base water content in the initial stage are lower than the simulated values, basically coincide with the simulated values in the middle stage, and, in the later stage, are slightly higher than the experimental values. The trends of simulated and experimental dry-base water contents are virtually the same. The correlation coefficients were 0.969, 0.975, and 0.943, respectively. Specifically, the difference between simulated and experimental values of sea cucumber No. 1 was the largest at 60 min, with a relative deviation rate of 5.2% and a numerical value of 52%. At 80 min for sea cucumber No.2, the maximum difference between the simulated and experimental values of water content in the dry basis appeared, and the relative deviation rate was 11%. The maximum difference between the simulated and experimental values of the dry-base moisture content of sea cucumber No. 3 appeared at 120 min, with a difference of 15% and a relative deviation rate of 2.7%.
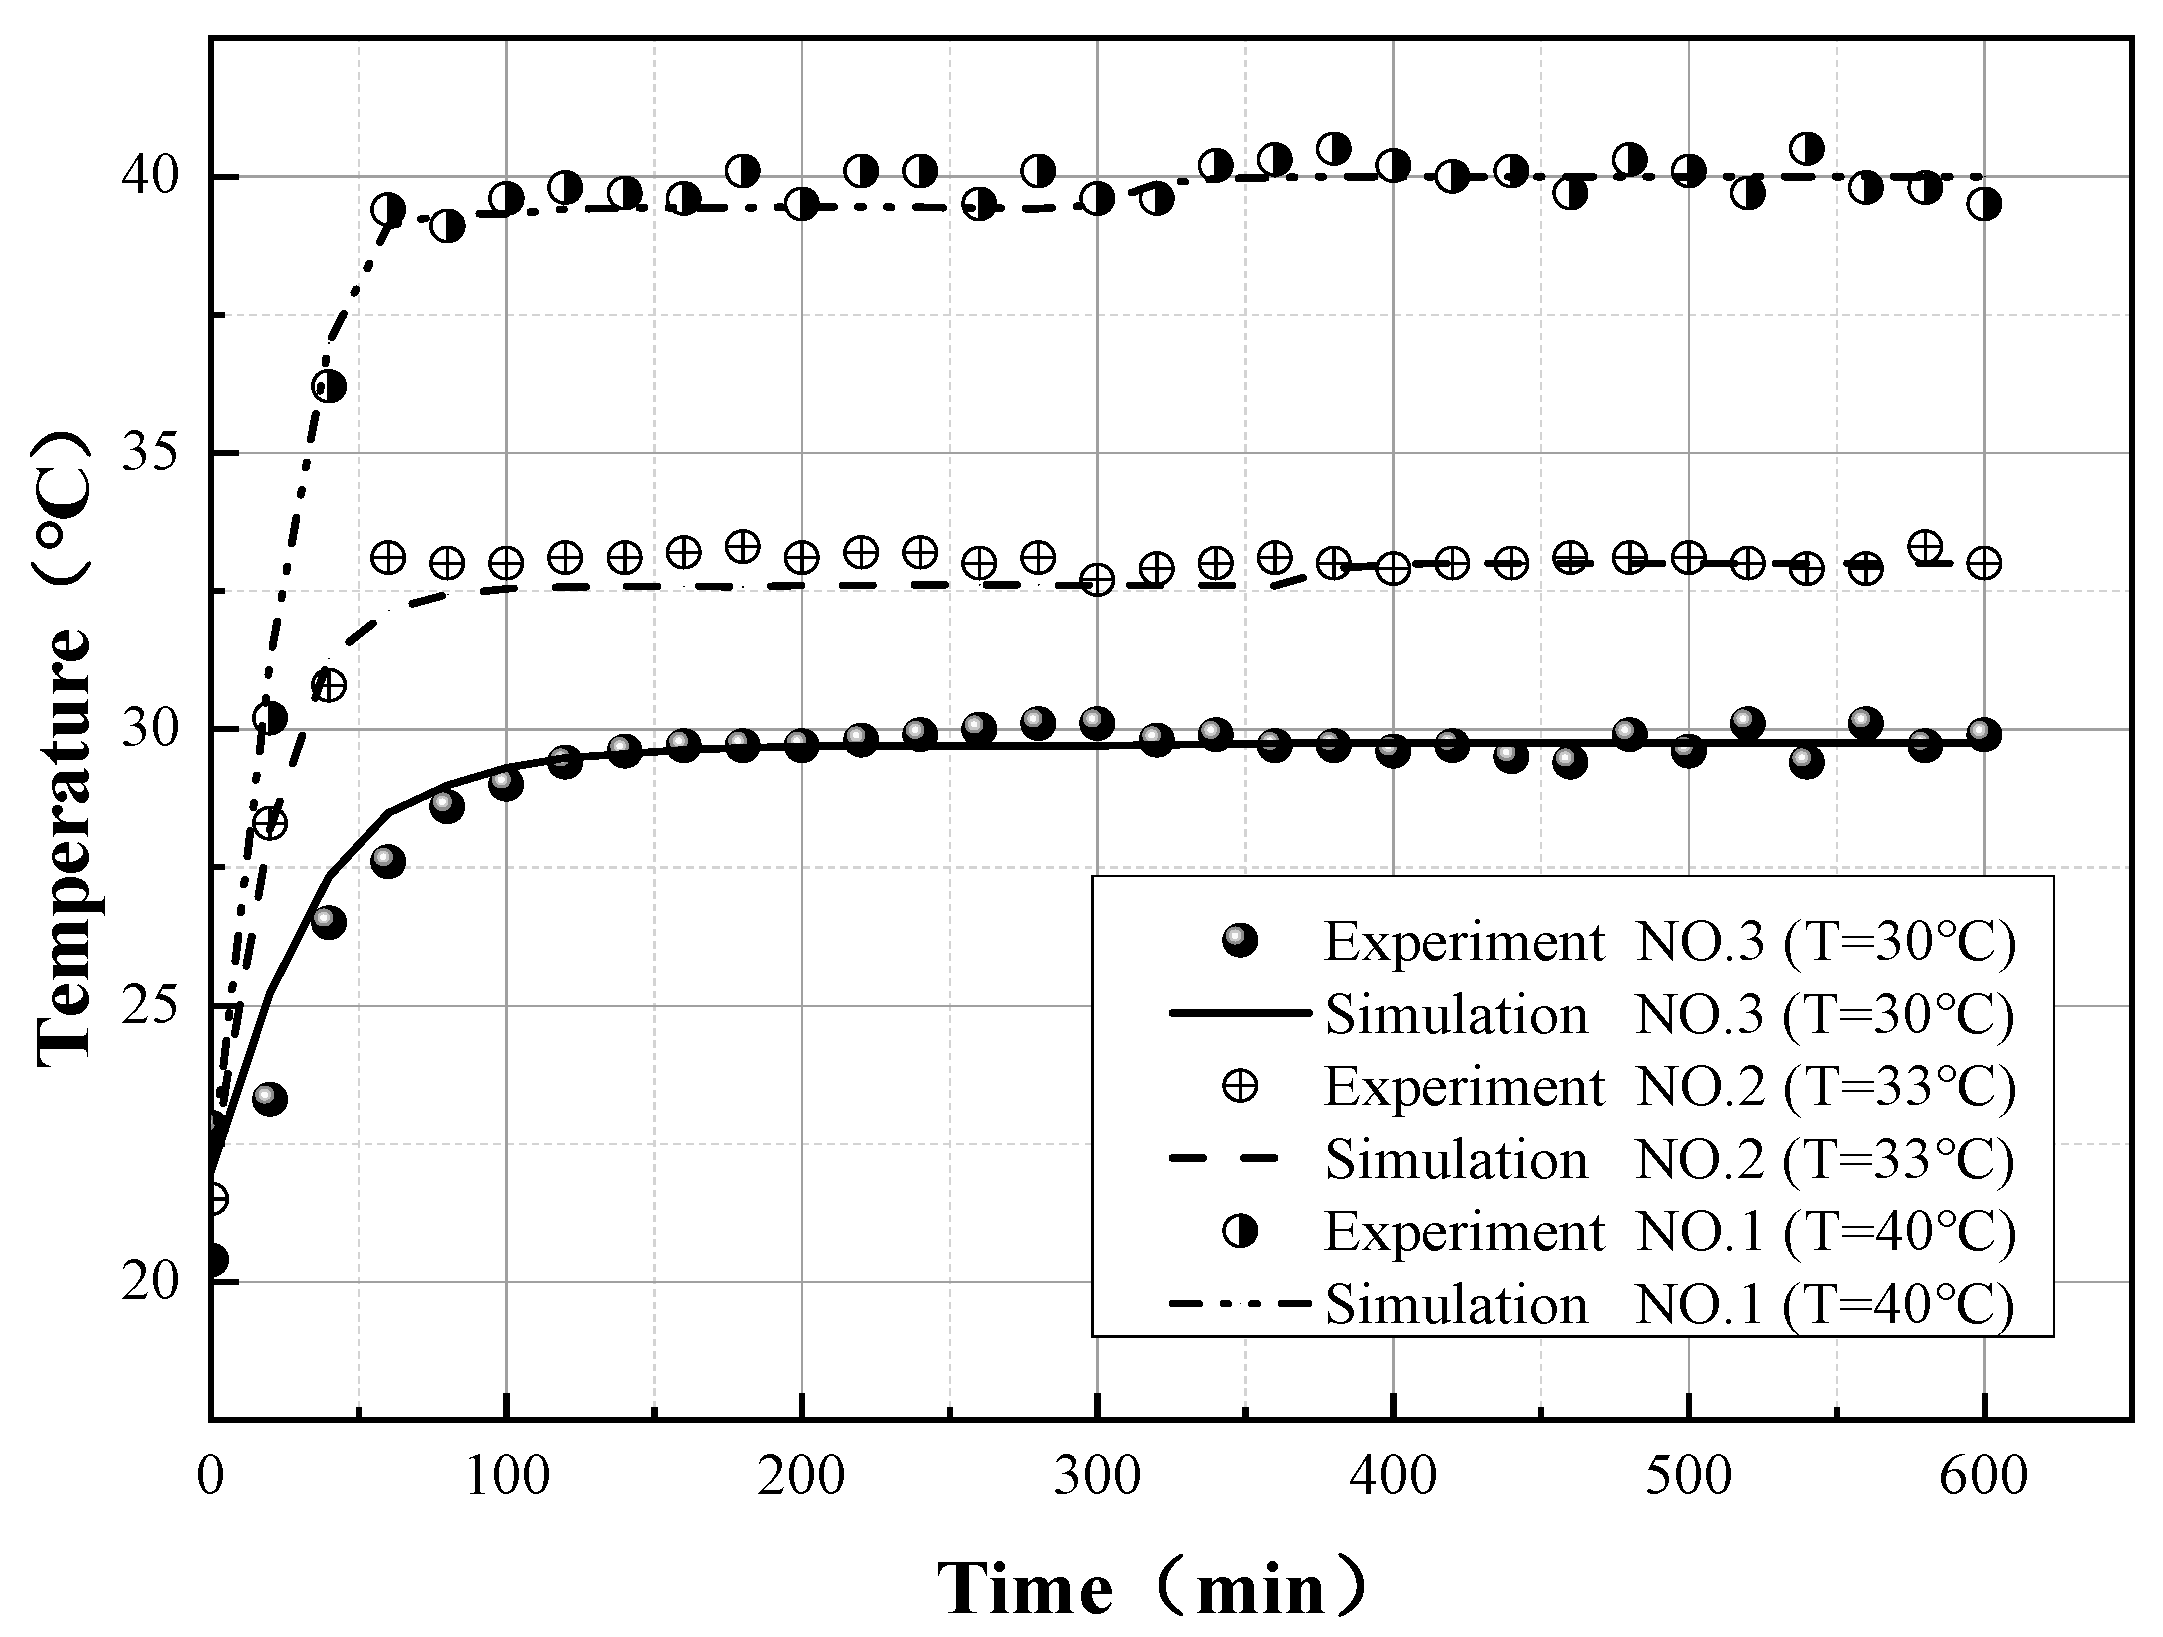
Temperature measuring points were arranged on the middle of the sea cucumbers’ surfaces. The experimental and simulated temperatures seen at the measuring points are shown in
Figure 4.
It can be seen from
Figure 4 that at varying inlet temperatures, the temperatures at the measuring points in the simulation and experimental values gradually increase and, finally, tend to be stable. According to the theory of pervaporation front, the water evaporation process occurs on the surface, and the evaporation from this thin layer changes the surface temperature of the sea cucumber. In the initial stage, the experimental heating rate is higher than that of the simulation, the maximum temperature difference between them is 3 °C, and the experimental and simulation temperatures are both near the stable inlet temperature in the later stage. The correlation coefficients between the experimental and simulation temperatures of three samples are 0.989, 0.986, and 0.971, respectively.
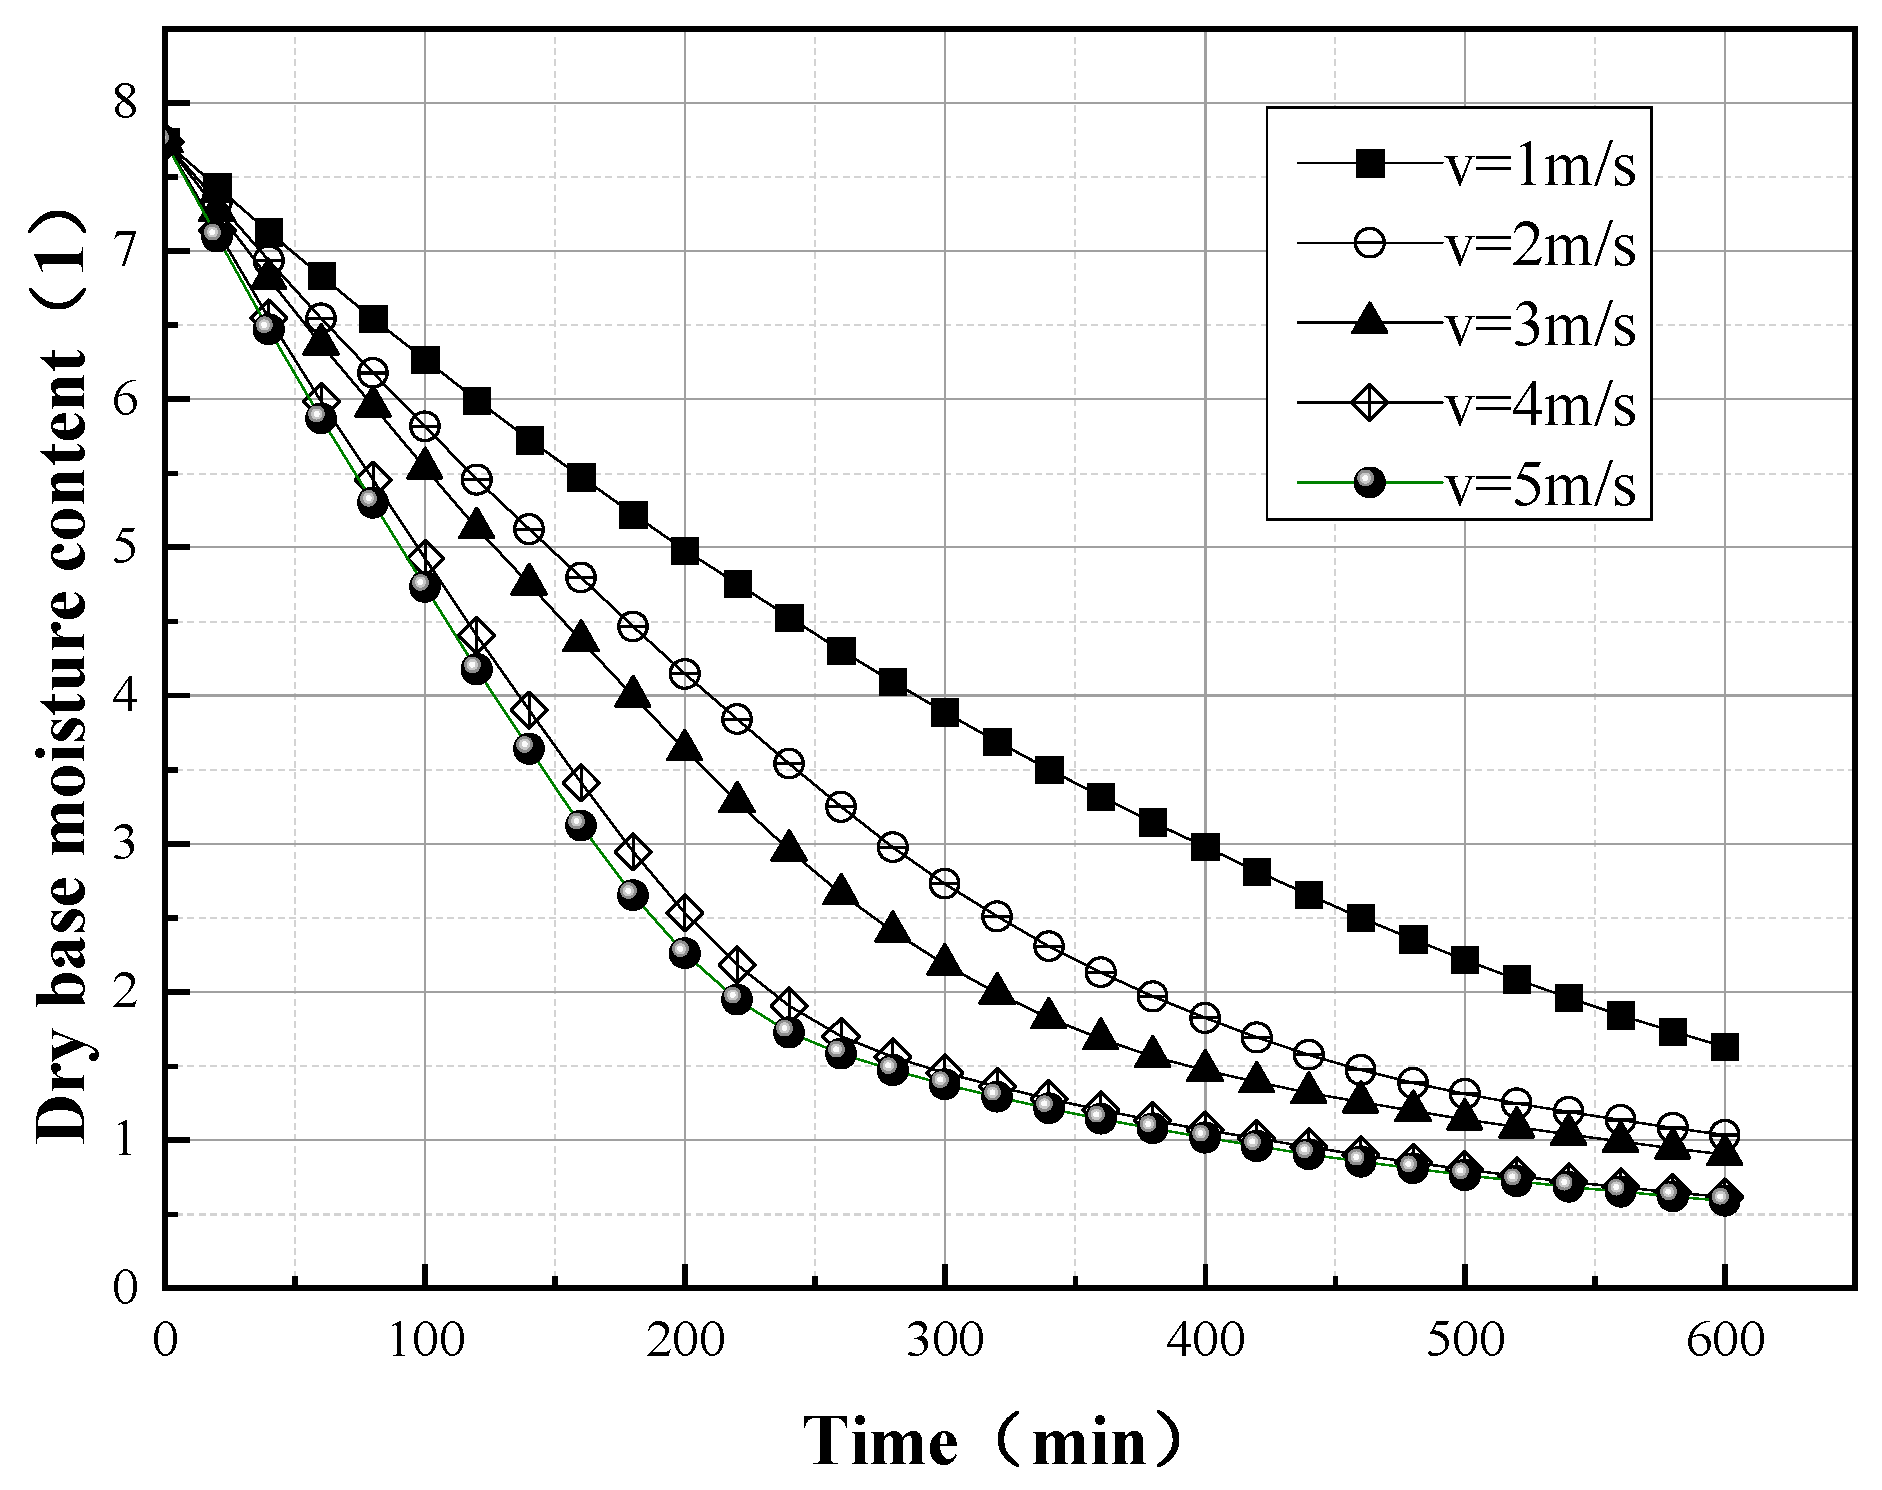
3.2. Effect of Wind Speed on Heat and Mass Transfer Process
Taking the No. 3 sea cucumber as an example, the heat and mass parameters of sea cucumbers during heat pump drying were analyzed by changing the inlet air velocity of the model to 5 m/s, 4 m/s, 3 m/s, 2 m/s, and 1 m/s. The dry-base moisture parameters during heat pump drying were obtained, as shown in
Figure 5.
From
Figure 5, we can see that with an increase in inlet air velocity, the rate of water reduction will accelerate. This shows that the drying air velocity is an important parameter in the drying process. A high wind speed can quickly eradicate the moisture content of the material in its initial drying stage, thus accelerating the drying process. When the wind speed is low, the drying time becomes longer. It can be seen from the figure that when the wind speed is 4 m/s, the moisture content of the dry-base decreases to 100% after 400 min; when the wind speed is 2 m/s, drying needs to proceed to 600 min before the dry-base moisture content reaches that value. As the wind speed is increased, it is seen that there is little difference in the drying rate when the wind speed reaches 4 m/s and 5 m/s. Therefore, it can be concluded that 4 m/s is an economical wind speed for the model.
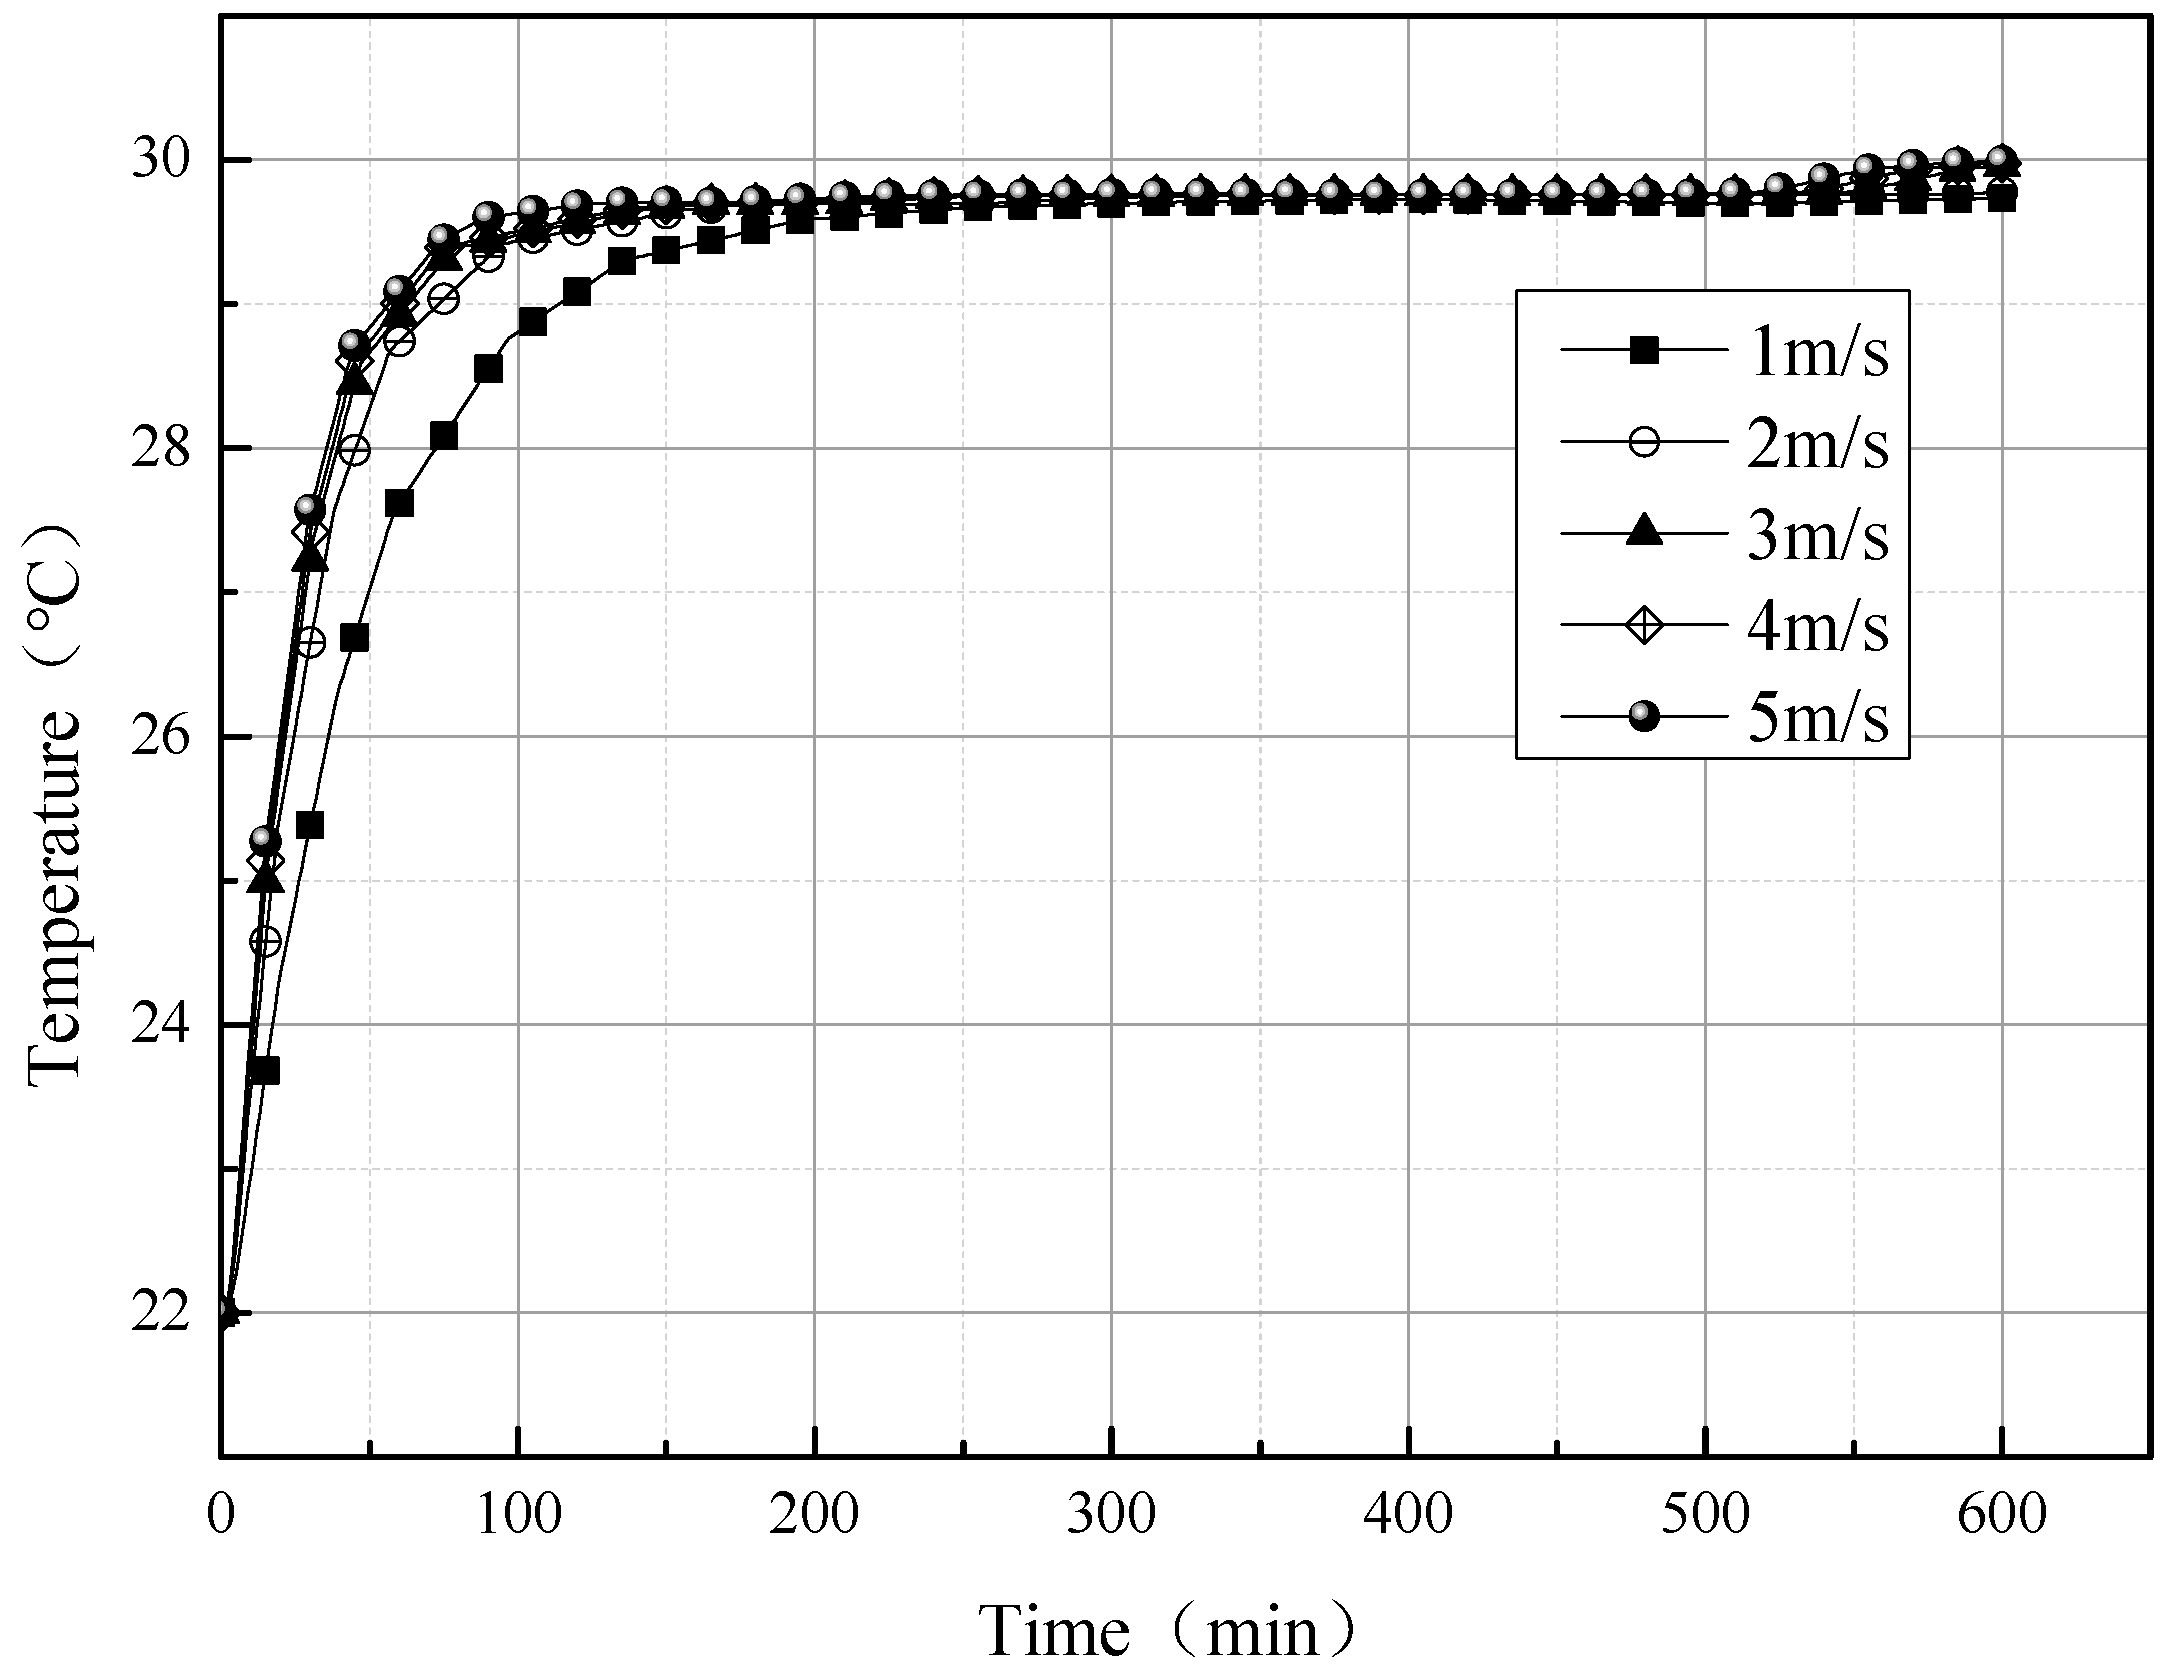
A plot of the temperature change at the surface point of the sea cucumber’s material in the model for different wind speeds is shown in
Figure 6.
It can be seen from
Figure 6 that for different inlet wind speeds, the temperature of the material at this measurement point increases rapidly, then slowly rises to the trend of the inlet temperature. Moreover, the higher the hot air speed is, the shorter the time required for the sea cucumber’s temperature to reach the inlet temperature. For example, when the hot air rate is 5 m/s, the material temperature reaches a stable value at 100 min; when the hot air rate is 1 m/s, the material surface takes 250 min to reach a stable temperature. The final temperature for 5 m/s is 0.2 °C higher than it is for 1 m/s. There is little difference between the temperature plots of 4 m/s and 5 m/s. It can be seen from the analysis of the simulation results that the material temperature rises rapidly after the start of drying; this is because there is a large temperature difference between the material and the drying medium, and the material temperature is lower than the medium temperature, so there is convective heat transfer from the drying medium to the material. The material temperature rises with the drying process, the moisture inside the material evaporates and absorbs heat, and the material temperature rises slowly. After 600 min, the free water inside the material has evaporated completely, and the surface temperature of the material gradually approaches the inlet temperature of the drying oven.
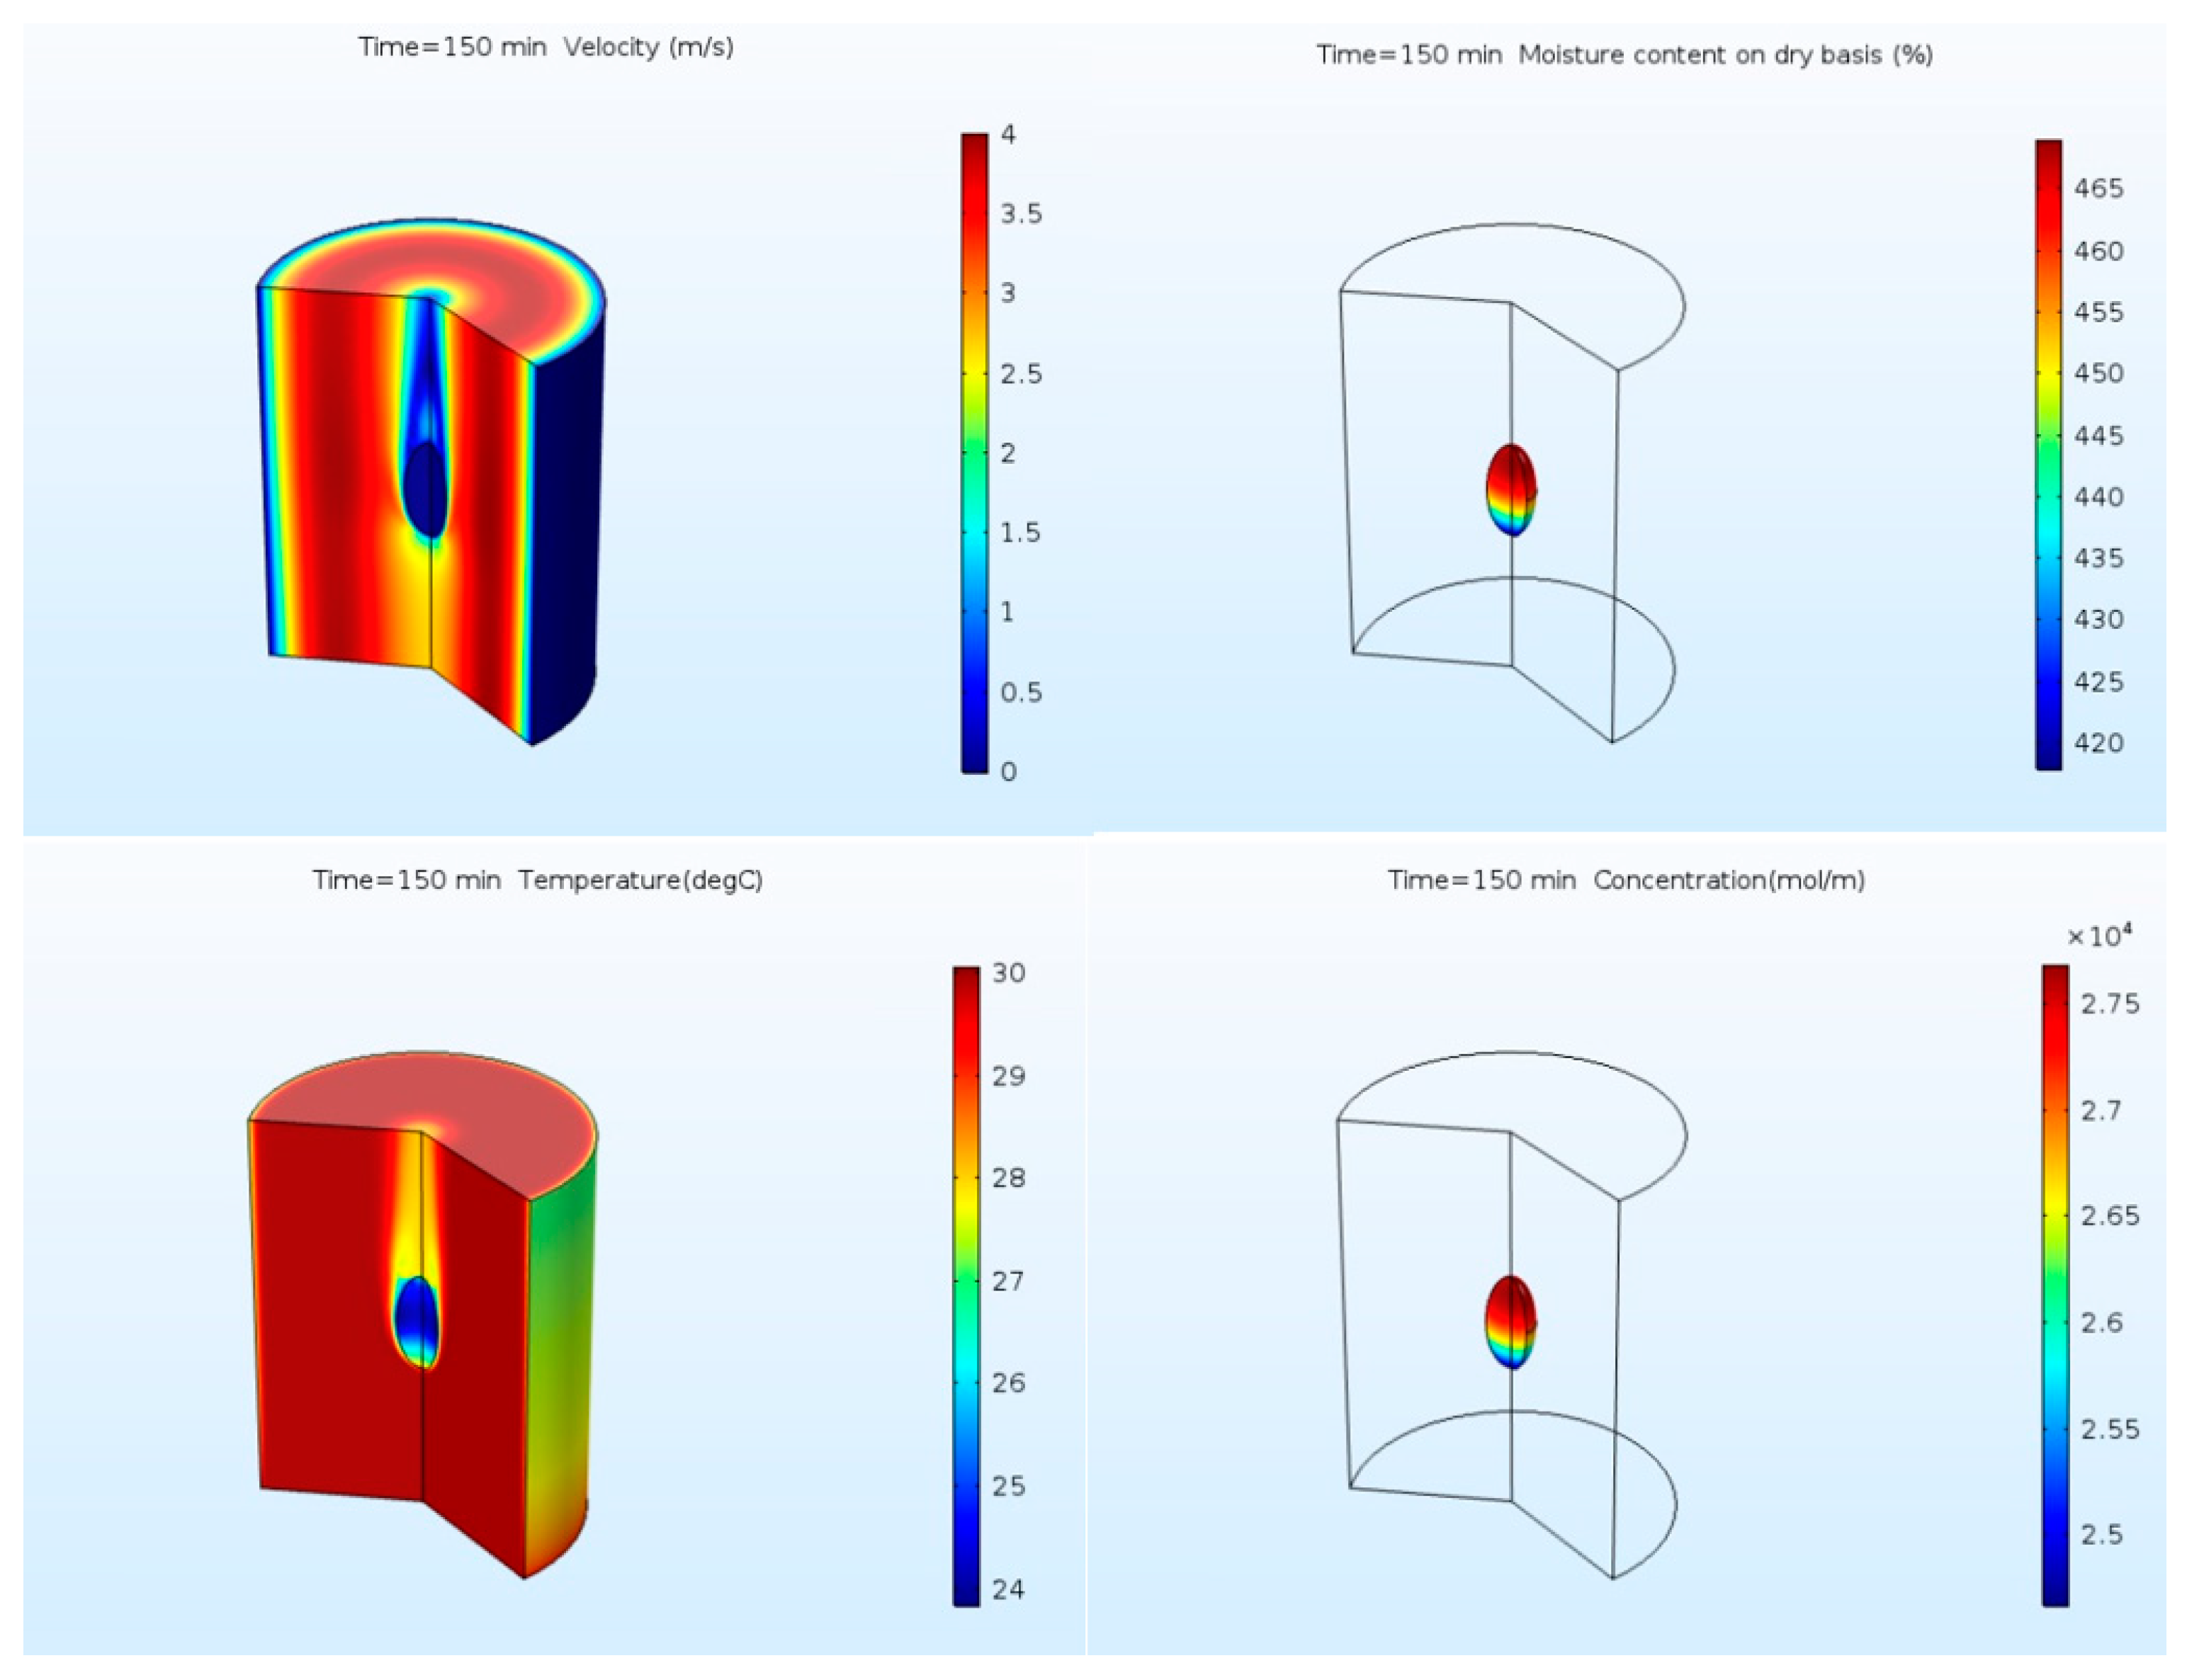
3.3. Internal Heat and Mass Transfer Law
Taking sea cucumber No. 3 as an example, the variation in dry air velocity, dry-base moisture content, temperature, and concentration in the drying chamber and in the sea cucumber were analyzed for a drying time of 150 min, as shown in
Figure 7. As the drying air flows in the chamber, the flow field in the drying chamber changes according to the cross-section area as it flows through the sea cucumber’s surface, so the maximum flow rate appears on both sides of the windward end of the drying material. The air velocity distribution affects water evaporation on the sea cucumber’s surface and leads to a change in its water content. For example, at 150 min and a velocity of 3.3 m/s in the model, the dry-base moisture content changes to 4.20, and the concentration is 25,000 mol/m
3 at the upwind. At the downwind of the sea cucumber, the dry-base moisture content is 4.65, and the concentration is 27,500 mol/m
3. The difference in the dry-base moisture content and internal concentration between the two positions is 50% and 2500 mol/m
3, respectively. The difference in the dry-base moisture content increases continuously with drying. At the same time, the air velocity distribution affects temperatures in the materials. The temperature on the windward end is higher than the windward end, which also affects the moisture uniformity in the material during the drying process.
4. Conclusions
In this paper, a mathematical model of the mass transfer and heat transfer characteristics of sea cucumbers is established based on their physical changes during convective drying. The sea cucumbers’ transient temperature field and moisture concentration field while drying were simulated, and their dry-base moisture contents, calculated by the Comsol Multiphysics software, were compared to experimental results. The results were as follows:
According to the simulation results, the water content of the sea cucumbers decreases from the surface to the interior, and the temperature decreases from the oven inlet to its outlet during the drying process. In the simulation results, the moisture content at the center points of three different samples decreased from the initial values of 17.29, 13.48, and 7.73 to 3.25, 1.80, and 0.66, respectively. The temperatures reached 40 °C, 33 °C, and 30 °C, which were the same as the inlet temperatures. As drying time increases, the temperature inside the material increases gradually until it reaches an equilibrium temperature. The time to reach the equilibrium temperature decreases with increased inlet wind speed.
For varied inlet temperatures, the change in sample water content simulation results and the experimental results are in good agreement, proving that the model can be used to study sea cucumber drying. The simulated moisture content is slightly lower than the experimental value in the early stage of drying and slightly higher in the later stage, which may be due to a reduced evaporation rate caused by the sea cucumber’s size shrinkage and porosity change. The shrinkage model can be considered in the next study to make the simulation results more accurate.
In the drying process, the moisture concentration changes faster in the windward end than in the wind end, which indicates that the single wind direction design of the drying oven in the experiment cannot meet the requirement for uniform distribution of moisture in the drying material. For drying large quantities of product in a large-scale commercial system, a reversible axial flow fan could reverse the airflow direction periodically to effectively shorten the drying time and ensure uniform drying.


