
Time-Invariant Features-Based Online Learning for Long-Term Notification Management: A Longitudinal Study


1
AI SoC Research Division, Artificial Intelligence Research Laboratory, Electronics and Telecommunications Research Institute (ETRI), Daejeon 34129, Korea
2
SoC Platform Research Center, Korea Electronics Technology Institute (KETI), Seongnam-si 13509, Korea
3
The Division of Computer Convergence, Chungnam National University, Daejeon 34134, Korea
*
Author to whom correspondence should be addressed.
Appl. Sci. 2022, 12(11), 5432; https://doi.org/10.3390/app12115432
Submission received: 23 April 2022
/
Revised: 24 May 2022
/
Accepted: 26 May 2022
/
Published: 27 May 2022
(This article belongs to the Topic Human–Machine Interaction)
Abstract
:The increasing number of daily notifications generated by smartphones and wearable devices increases mental burdens, deteriorates productivity, and results in energy waste. These phenomena are exacerbated by emerging use cases in which users are wearing and using an increasing number of personal mobile devices, such as smartphones, smartwatches, AirPods, or tablets because all the devices can generate redundant notifications simultaneously. Therefore, in addition to distraction, redundant notifications triggered by multiple devices result in energy waste. Prior work proposed a notification management system called PASS, which automatically manipulates the occurrence of notifications based on personalized models. However, machine-learning-based models work poorly against new incoming notifications because prior work has not investigated behavior changes over time. To reduce the gap between modeling and real deployment when the model is to be used long-term, we conducted a longitudinal study with data collection over long-term periods. We collected an additional 11,258 notifications and analyzed 18,407 notifications, including the original dataset. The total study spans two years. Through a statistical test, we identified time-invariant features that can be fully used for training. To overcome the accuracy drop caused by newly occurring data, we design windowing time-invariant online learning (WTOL). In the newly collected dataset, WTOL improves the F-score of the original models based on batch learning from 44.3% to 69.0% by combining online learning and windowing features depending on time sensitivity.
1. Introduction
Notifications are an essential function to inform users of urgent or useful information. In spite of their usefulness, frequently sending notifications to users at inopportune moments could harm their engagement with the task at hand and productivity. Prior studies have investigated the negative effects of notifications [1,2,3] and proposed a variety of intelligent notification systems that manage notification delivery at an opportune moment when users can conveniently deal with new incoming messages [4,5,6,7,8,9]. To help a system recognize when users can tolerate an incoming notification, interruptibility models were proposed and trained with notification contents [4,5], breakpoints [6], or important usage information [7]. Furthermore, Mehrotra et al. [8] and Pradhan et al. [9] proposed a smart notification manager that directly manipulates notification occurrences based on machine-learning models. In addition to studies on notifications by smartphones, recent studies have analyzed and managed notifications triggered by smartwatches [10,11,12]. Meanwhile, interruptibility research has been extended to multi-device environments [12,13,14,15,16]. In multi-device environments, in addition to user distraction, energy waste caused by redundant notifications increases. To suppress redundant notifications between smartphones and smartwatches, PASS [17] proposed a matching-learning-based notification manager that automatically defers phone-preferable notification delivery and consecutively forwards them when a watch-preferable notification occurs.
However, there is still a lack of longitudinal studies to understand user behavior changes over time and to evaluate the quality of models. Most of the models were built and evaluated using batch learning, which splits data into training and testing sets. batch-learning-based models face a drop in accuracy when deployed in the wild for long-term periods owing to a lack of updates on newly available data. The accuracy drop is mainly caused by the existence of changing data, which is different from the situation when the model was trained; the changes include changes in users’ context, personalized content in a notification, social relationships, or breaking news. Over passing periods, such drastic changes may lead to incorrect classification. Therefore, there is a need to retrain these models. However, to the best of our knowledge, this has not been entirely investigated and remains an open issue in notification management in multi-device environments.
In this paper, we focus on a longitudinal study to reduce energy consumption in multi-device environments. Our study is the first to investigate the effects of user behavior change over time in intelligent notification systems. From the longitudinal study, we aimed to answer the following research questions: (i) How accurate are batch-learning-based models for long-term periods? (ii) How can invariant features be distinguished over long-term periods? (iii) How can the accuracy drop caused by user behavior change over long-term periods be overcome? To answer these research questions, we reused the existing models trained in PASS [17] that reduce redundant notifications in multi-device environments and directly deployed the trained models to multiple users for multiple years. After an average of 593 days from the end of the prior experiment [17], we collected an additional 11,258 notifications over 68 days on average from five users who participated in the original experiment. Data collection spanned approximately two years.
With the new dataset, we performed the following experiments and discovered interesting aspects that are related to the aforementioned research questions. First, as shown in Table 1, batch-learning-based models show a drastic drop in accuracy when deployed in the real world over long-term periods without any model update. Second, to discover time-invariant features, we conducted a chi-square test for independence. A Chi-square test compares two categorical variables in a contingency table to investigate whether they are related. In our case, each categorical variable was generated using features based on the raw data during each period of data collection. As a within-subject experiment, we performed a chi-square test on each user’s features extracted from the new dataset. From this test, we can identify the features that are time invariant: 7 features out of 50 (five users × ten features) show low correlation (independence) between the two sets of data gathered during each period. Third, we designed windowing and time-invariant feature-based online learning (WTOL) to overcome the significant accuracy drop over time against a long-term dataset. Considering the time-invariant features discovered by statistical tests, WTOL partially uses the collected dataset to reduce the variation in features when the model is trained. In other words, time-variant features should be partially used to perform online learning because the data trend is different over time. Owing to adaptive windowing according to the time sensitivity, WTOL outperforms batch-learning models and simple online learning models by up to +24.7% and +14.3% in terms of the F-score, respectively.
The main contributions of our work are summarized as:
- To investigate users’ behavior changes over time and the effect of these changes on the quality of models, we collected in the wild notifications from five users who participated in the previous experiments. For 63 days, on average, 11,258 notifications were gathered 593 days after the end of the original experiment. To our knowledge, this is the first in the wild dataset in terms of multiple devices and long-term periods.
- We discovered time-invariant features among 50 features (five users × 10 features) by conducting a chi-square test for independence.
- To the best of our knowledge, this study is the first to highlight the problem that the accuracy of the trained model drastically drops when it is deployed in the real world; it also states the reasons. To compensate for the accuracy drop from batch learning, we present a method based on online learning of windowing-time-invariant features.
2. Related Work
With a variety of sensors mounted on smartphones, several researchers have studied intelligent notification systems [4,5,6,7,8,9,18,19]. Pielot et al. and Pejovic et al. unobtrusively captured user contexts and system configurations regarding the preference of notifications [18,19]. To improve the performance of interruptibility models, Fischer et al. and Mehrotra et al. employed notification content as a feature to build a machine-learning model [4,5]. Fischer et al. [6] and Attelia [7] proposed a system to predict breakpoints in which users can receive notifications with low interruptions. Furthermore, with the trained models, an intelligent notification coordinator was proposed [8,9].
Several studies have investigated smartwatch notifications [10,11,12]. Visuri et al. [10] performed a quantitative analysis using a large number of notifications (2.8 million) collected from in the wild. Cecchinato et al. [11] conducted qualitative user interviews. Such studies revealed that users are willing to optimize notification configurations based on the sender, topic, or even location. In addition to a single personal device, interruptibility works have been extended to multi-device environments [12,13,14,15,16]. These studies considered the emerging situation in which many people carry multiple mobile devices daily. In this emerging circumstance, PASS tackled the problem of reducing notification delivery to a smartwatch from a smartphone to reduce user distraction. However, there is still a lack of longitudinal studies that investigate user behavior changes over time and evaluate the quality of models on an in the wild long-term dataset. Most existing studies experience accuracy drops caused by extreme changes in a newly collected dataset.
Online learning has been used in the following domains to adapt to changing or new behavior from new data: human activity recognition [20,21,22], speech recognition [20,21], and intrusion detection [23]. However, previous studies did not consider multi-device environments.
There have been long-term studies on in the wild data analysis [24,25,26]. Jeong et al. [24] conducted a longitudinal study on smartwatch wearing habits. Okoshi et al. [25] performed an analysis on a large number of notifications from the production-level service, Yahoo JAPAN. Aku et al. [26] conducted a study on the usage style transformation for the long-term usage of smartwatches. However, prior studies did not consider adaptation to new data or multi-device environments. Therefore, there is scope to study users’ behavioral changes over long-term periods. To the best of our knowledge, our study is the first to investigate the accuracy drop of prediction models induced by newly available data in multi-device environments.
3. Dataset
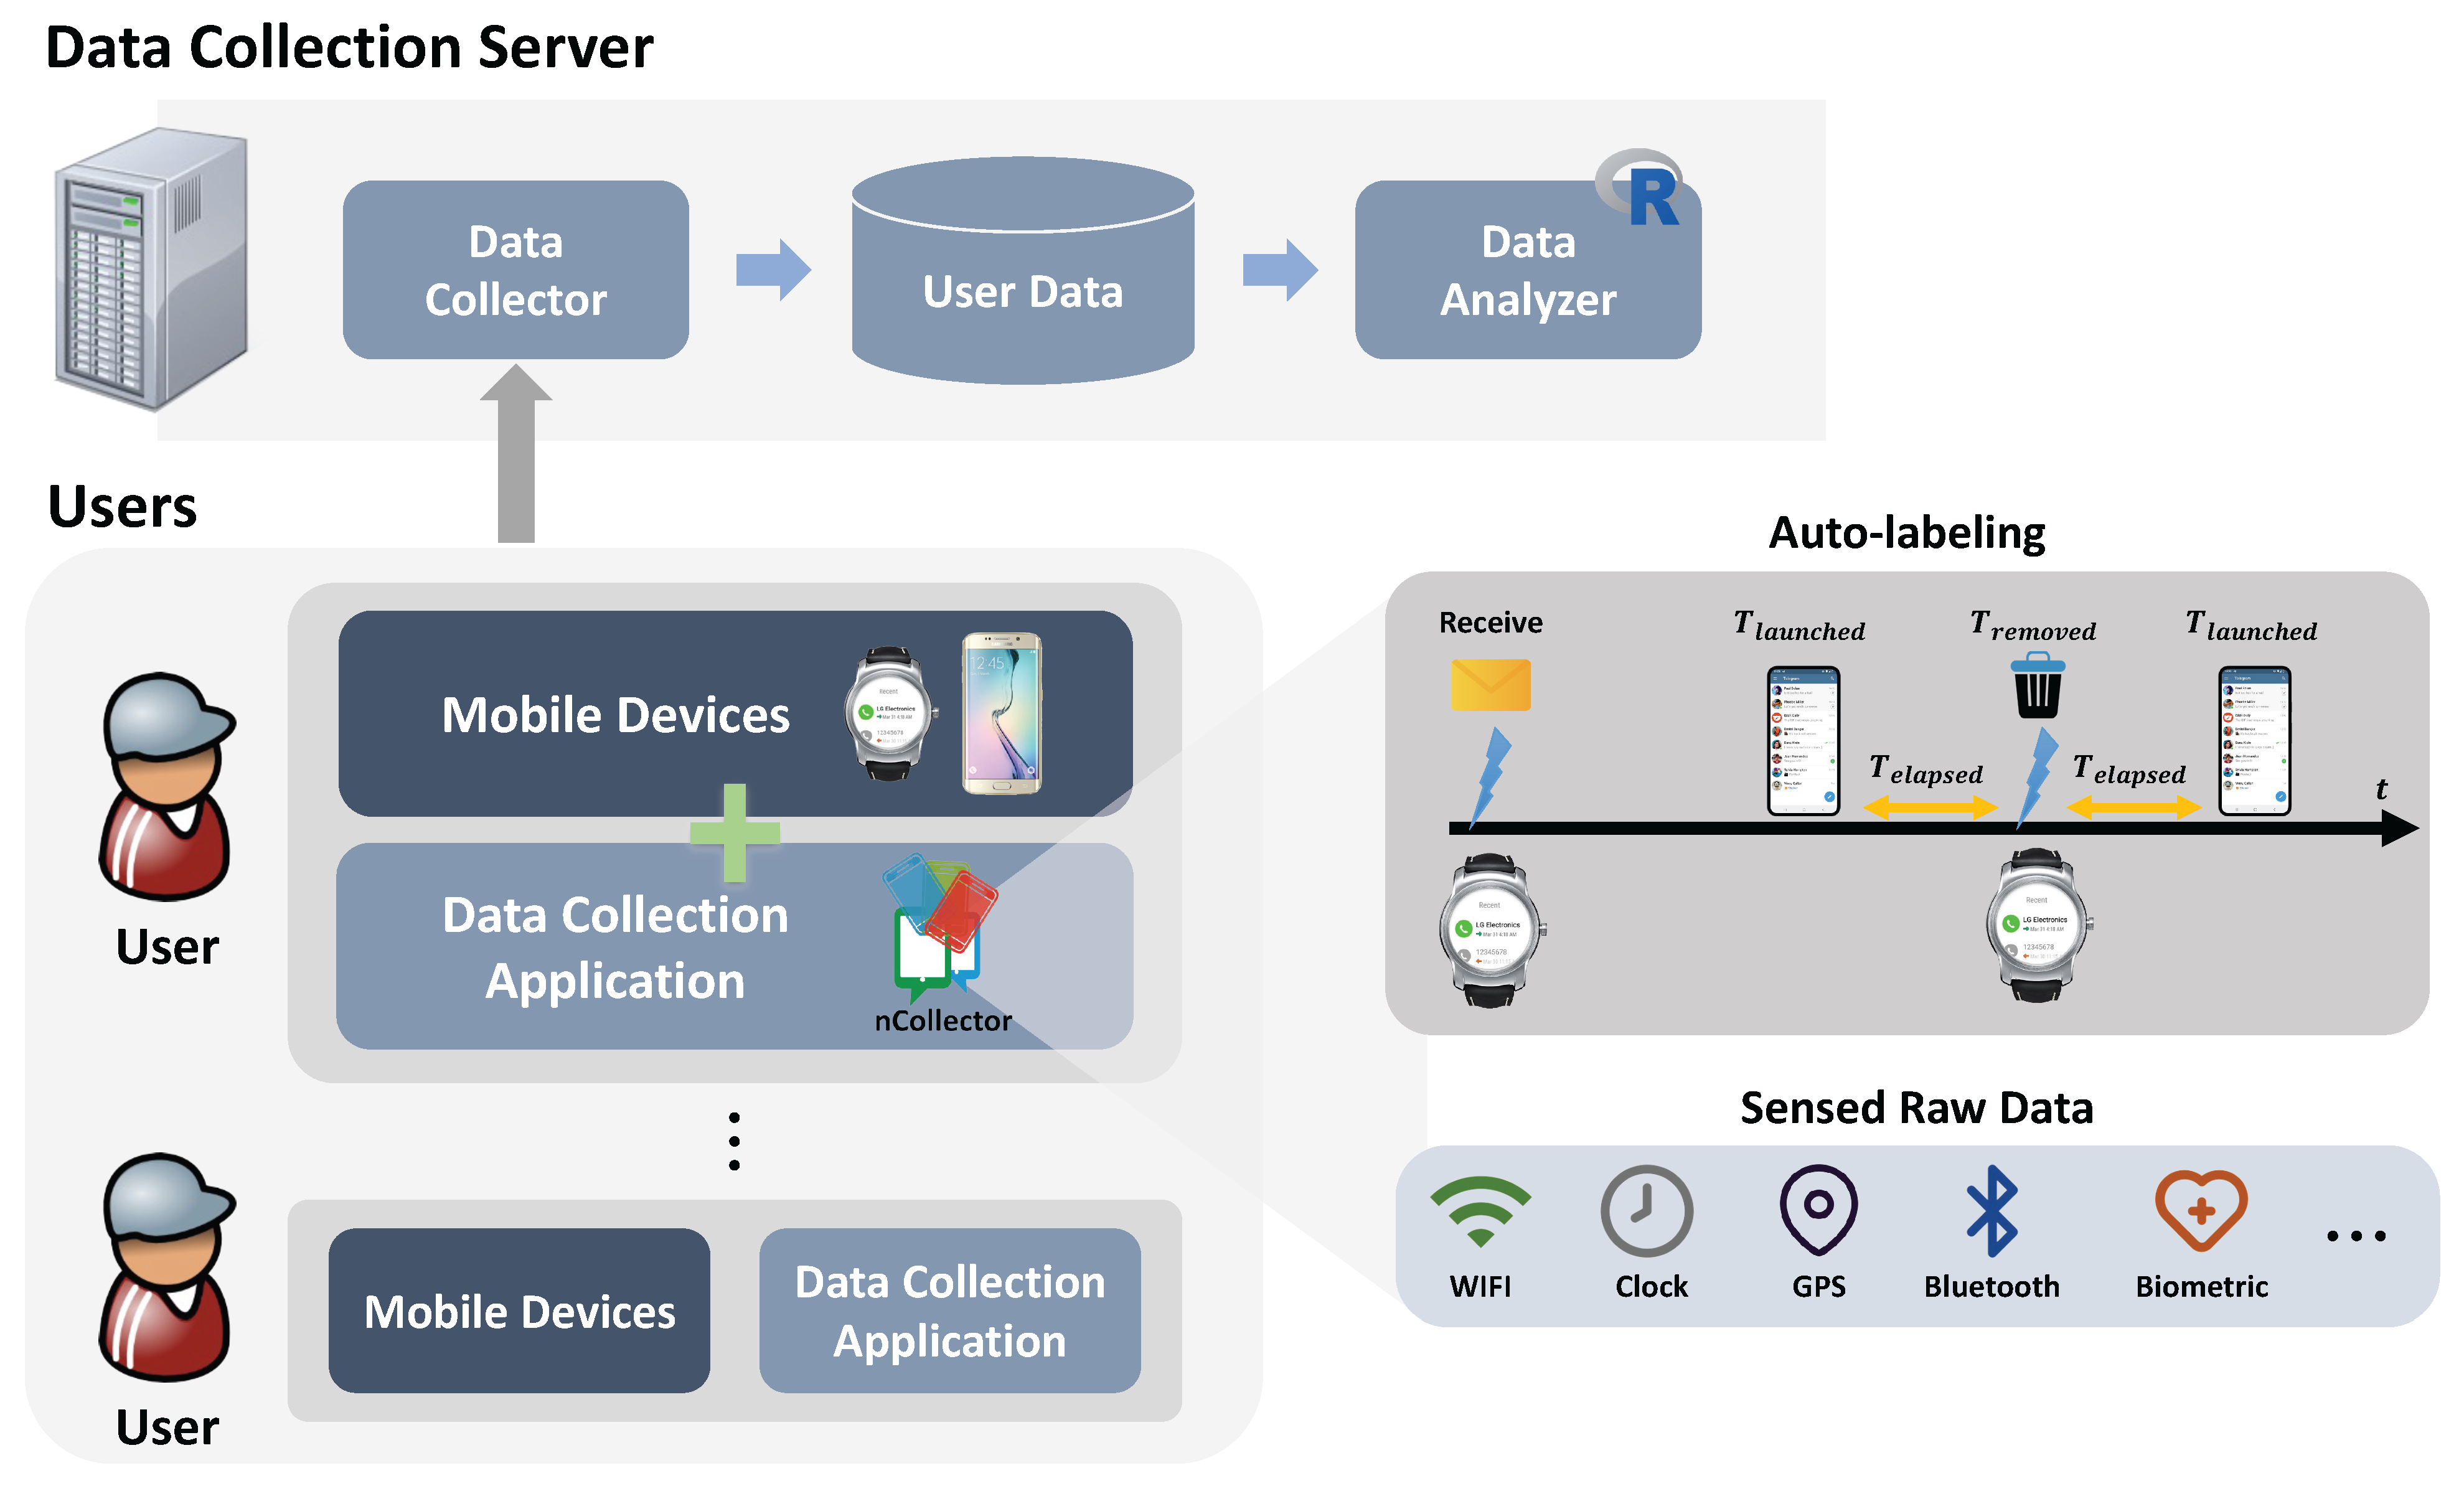
To investigate users’ behavior changes over long-term periods, we collected additional data from the same user group for 68 days, approximately 2 years after the previous experiment was conducted [17]. As shown in Figure 1, we used the existing framework consisting of an Android application, data server, and data analyzer for data collection and analysis. We briefly recap the existing framework and describe the sensor data capture and features extraction process.
- Data Collection Application. We reused a data collection application called nCollector, which determines the label of notifications and senses user contexts when a notification appears. Specifically, the contexts sensed by nCollector are notification contents, users’ physical activities, time, and phone status. Subsequently, the 10 features listed in Table 2 were extracted from the sensed data. As listed in Table 2, the label of the notification type is determined based on whether the application that triggered the notification was launched at a certain time. Auto-labeling in Figure 1 provides an overview of how the notification type is determined. Therefore, nCollector keeps track of whether an application that triggers a notification is launched before or after this notification is removed.Two time variables ( and ) are relevant to user decisions. Subsequently, the elapsed time was computed as . If is less than or equal to 10 s , nCollector judges that a user has used the smartphone to handle further interaction with the notification. We carefully defined a heuristic parameter of 10 s because 25% of the response time for notifications is less than 10 s, and the curve of the response time stabilizes at this point. Even though the quality of modeling strongly depends on the accuracy of auto-labeling, we bring it into this study as a practical method in a real-world scenario because an on-body sensor or user interruption for questionnaire answering is not realistic.
- Data Collection Server. We reused the developed Data Collection Server using Java Sever Pages (JSP) and a Bash Shell script on Ubuntu Linux. The labeled notification and context were conveyed to the server. To avoid frequent data transmission and vast data sizes, data are formatted by JSON, and its transmission occurs once at the end of a day.
- Data Analyzer. We reused Data Analyzer on Windows 7 using several R packages: JSON parer (jsonlite), parallel computing (doParallel), text handling (text-mining), and machine learning (caret).
We requested 11 users who participated in the previous experiment join the new experiment. Of the 11 users, 5 agreed to take part in this experiment. Table 3 shows the participant demographics for the additional experiments. Their ages differ from those of the previous experiment because the new data collection started two years after the original experiment.
Table 4 shows details of collected data across two periods. During 68 days on average, we collected an additional 11,258 notifications. For analysis, we used 18,407 notifications, including the previous dataset (7149 notifications on only 5 users). The whole period for data collection lies across 2 years. Active days for data collection are more than 100 days on average. All the data was collected from the multi-device environment where users use a smartphone and a smartwatch.
4. Features Analysis to Discover Long-Term Characteristic
We considered the following 10 features: (1) sender app name, (2) title, (3) time of day, (4) day of the week, (5) recent phone usage, (6) proximity, (7) priority, (8) physical activity, (9) phone status, and (10) relative seen time. Table 2 shows 10 features and the considered label. For the 10 features, we investigated features in which distribution was changed as time goes on during multiple years. Therefore, we identify the features that are time invariant. For the analysis, we conducted a chi-squared test of independence on the 10 features between the first and second periods. With such statistical tests, we discover which variable is dependent on passing time.
The chi-square test of independence was used to analyze the contingency table formed by the categorical variables. The test evaluates whether there is a significant association between the categories of the two variables. In our study, the two categorical variables were defined as the first and second periods, as listed in Table 4. As a within-subject experiment, a chi-square test was applied to each user’s features.
The chi-square test provides a method for testing the association between the row and column variables in a two-way table (contingency table). The null hypothesis assumes no association between the two periods, as listed in Table 4. In other words, none of the features varied according to the passing time. In contrast, the alternative hypothesis claims that some associations exist. This implies that the feature is sensitive to changing time.
The chi-square test is based on a test statistic that measures the divergence of the observed data from the values expected under the null hypothesis of no association. This requires the calculation of the expected values based on the data. Once the expected values were computed (we computed them using the R package), the chi-square test statistic was computed as
where k, , are the number of categories, observed frequency counts in each category, and expected frequency counts in each category, respectively.
If the p-value is less than or equal to , the null hypothesis () is rejected in favor of the alternative hypothesis (). However, if the p-value is greater than , then the null hypothesis is accepted (). In our case, the high correlation features (p-value ) indicate that they were different over time. Table 5 shows the results of the chi-square test. As a result, only 7 features were independent p-value among the possible 50 features (5 users × 10 features). Specifically, out of 50 as calculated by 5 users × 10 features, Table 6 and Table 7 represent the contingency tables of the time-invariant (p) and time-variant features (p), respectively. Consequently, we consider these seven features as time-invariant features. We bring the insight modeling phase to mitigate the negative effects caused by outdated datasets.
5. Building Prediction Models
For modeling, the naïve Bayes algorithm was used to train the notification usage patterns of users. The naïve Bayes algorithm demands low computational resources compared with neural networks and XGBoost [27]. With the naïve Bayes model, a notification can be determined to be either phone-preferable or watch-preferable. The model takes 10 features listed in Table 2 as inputs.
The naïve Bayes model is based on conditional probability. The conditional probability denotes the probability of notification N for type T on context feature occurring. A context feature is a given condition that causes notification N. In Bayes’ theorem, the probability of notification N for type T under a given context feature is defined as
where is the probability of a given context feature occurring when notification N arrives, and is the probability of whether a notification type is phone-preferable. is the probability of a given context feature occurring when a notification arrives. The features are summarized in Table 2.
To apply Bayes’ theorem to our classification problem, we finally used the naïve Bayes algorithm, which assumes that all the aforementioned features in the dataset are equally important and independent. The naïve Bayes algorithm can be summarized by the following formula:
In the naïve Bayes rule, the probability of notification N for type T, given a context feature provided by features through , is equal to the product of the probabilities of each piece of context feature conditioned on notification , the prior probability of notification , and a scaling factor , where Z is . Finally, the naïve Bayes classifier combines this model with the following decision rule.
This rule selects the hypothesis that is the most probable, called the maximum a posteriori probability. Corresponding to this rule, the Bayes classifier assigns notification type T to the prediction label .
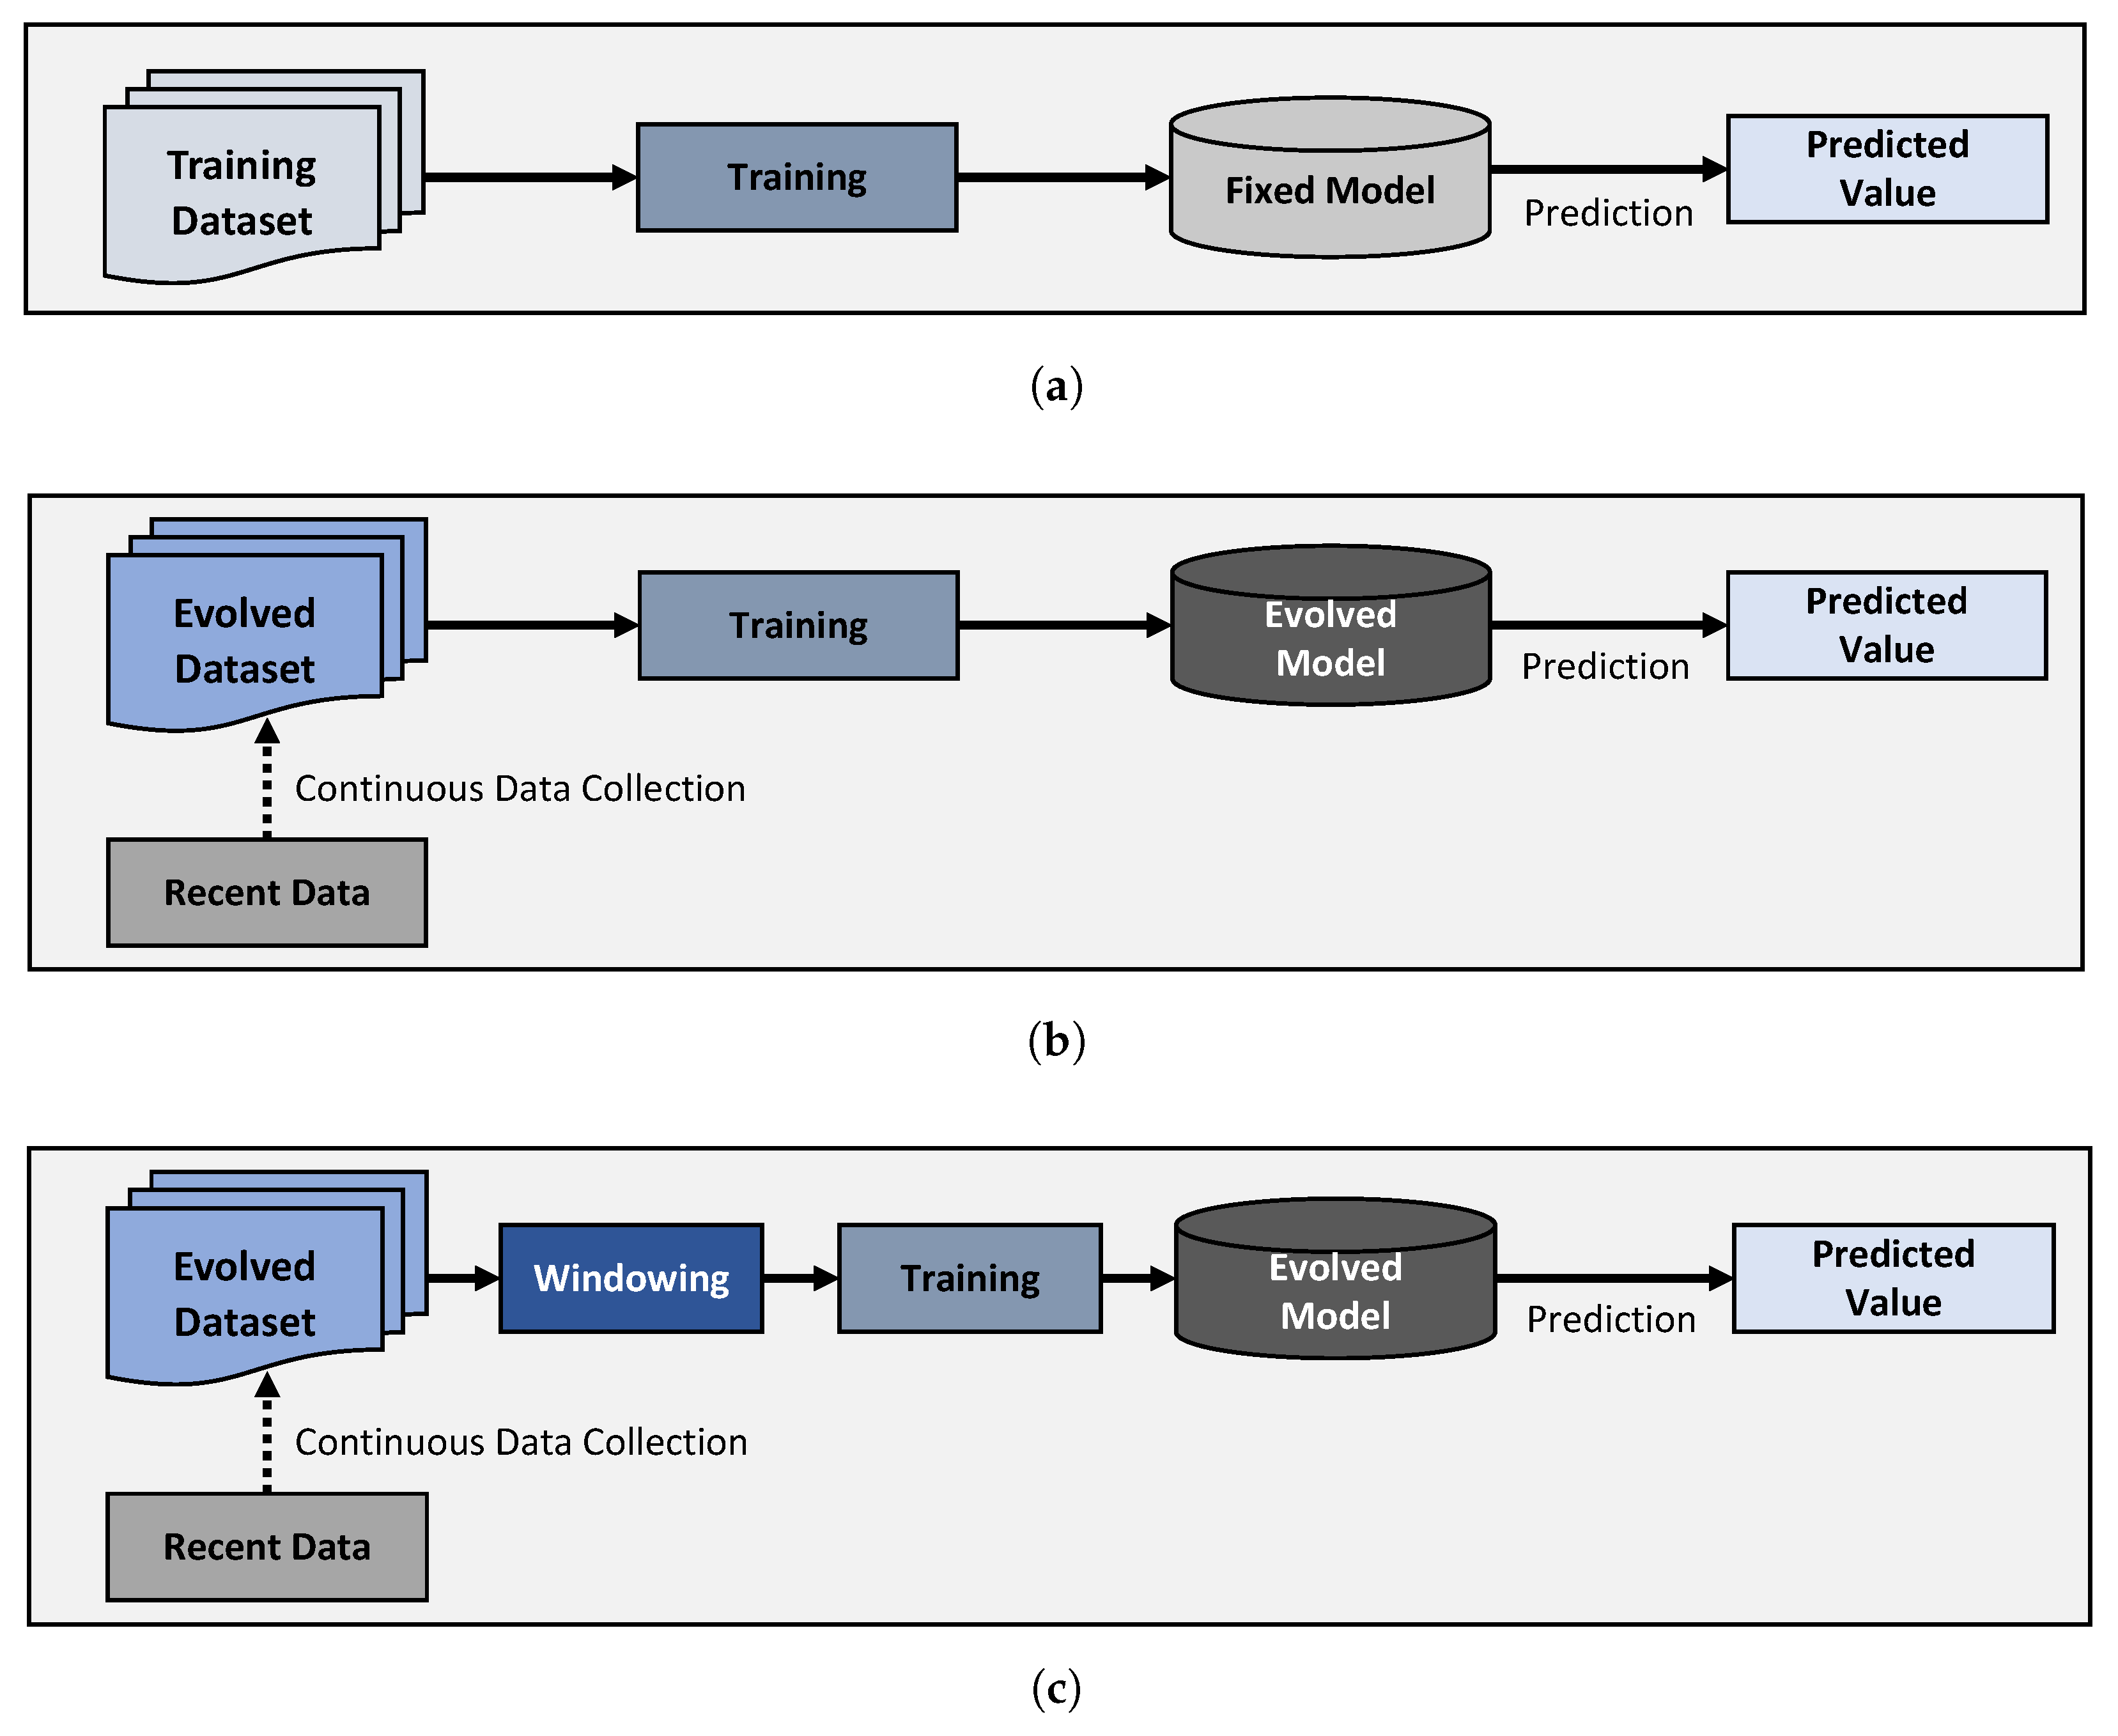
Based on the naïve Bayes algorithm, we built three types of models: batch learning (BL), plain online learning (PLO), and WTOL. Figure 2 shows how the working of the three differs from each other. The details of each model are as follows:
- Batch learning (BL). As shown in Figure 2a, the BL algorithm uses batches of collected notifications and sensed data to train a personalized model. BL then predicts the label of the test data using the relationship between the labels and sensed contexts. The BL does not require additional computations after the models are built. However, BL does not have the chance to update the models against new data. Therefore, the models were trained using datasets collected for the first and second periods.
- Plain online learning (POL). As shown in Figure 2b, POL continuously updates the models with new incoming data. The model was iteratively updated with the entire dataset collected during the entire period from day 1 to today i. Therefore, an updated model was built every day. In our study, the quality of the classifiers was evaluated using a newly available dataset on day .
- Windowing and time-invariant features based online learning (WTOL). As shown in Figure 2c, unlike POL, WTOL uses only the entire dataset for seven time-invariant features as listed in Table 5. It partially takes time-variant features by windowing to eliminate an outdated trend in the dataset because these features are different over passing time. The evaluation method for the WTOL was the same as that for the POL.
6. Evaluation
In this section, we show how accurately the proposed online learning-based classifiers predict long-term periods compared to prior work based on batch-learning-based classifiers. Online learning-based classifiers were periodically trained with new incoming data. We evaluated three types of models using an in the wild long-term dataset. For the long-term dataset collection, we recruited five participants from the same people who participated in the data collection experiment. The collected number of notifications is 11,258 for approximately two months.
Unlike batch-learning validation, which is evaluated by splitting the training and validation datasets, we used the collected dataset to verify the quality of classifiers based on three types of models. We repeatedly built all classifiers with the dataset collected by the end of each day and verified each classifier by new incoming notifications on the following day (i.e., , where i is the current day). Specifically, on day i, a model was trained using a dataset from days 1 to i, and it was tested to predict the device preference of notifications appearing on day .
To demonstrate the effectiveness of the proposed method, we built three types of models: BL, PLO, and WTOL. The details of how the models were trained and evaluated are as follows. BL indicates that the models were not updated after they were built. POL indicates that the models were continuously updated from the incoming data. This model was built with a dataset from day 1 to day i. In addition, the quality of the classifiers was evaluated using a newly available dataset on day . WTOL indicates that the models were updated from partial ones out of the entire dataset except the time-invariant seven features as listed in Table 5. The time-invariant features were determined using the chi-square test.
For the evaluation, we used the following metrics: (1) Precision refers to the proportion of predicted positives that are truly identified. To compute precision, the number of phone-preferable notifications that were truly predicted was divided by the number of predicted notifications. (2) Recall refers to the proportion of actual positives that are identified. To measure recall, the number of phone-preferable notifications that were truly predicted was divided by the number of actual phone-preferable notifications. (3) The F-score refers to the mixture of precision and recall, which is computed as
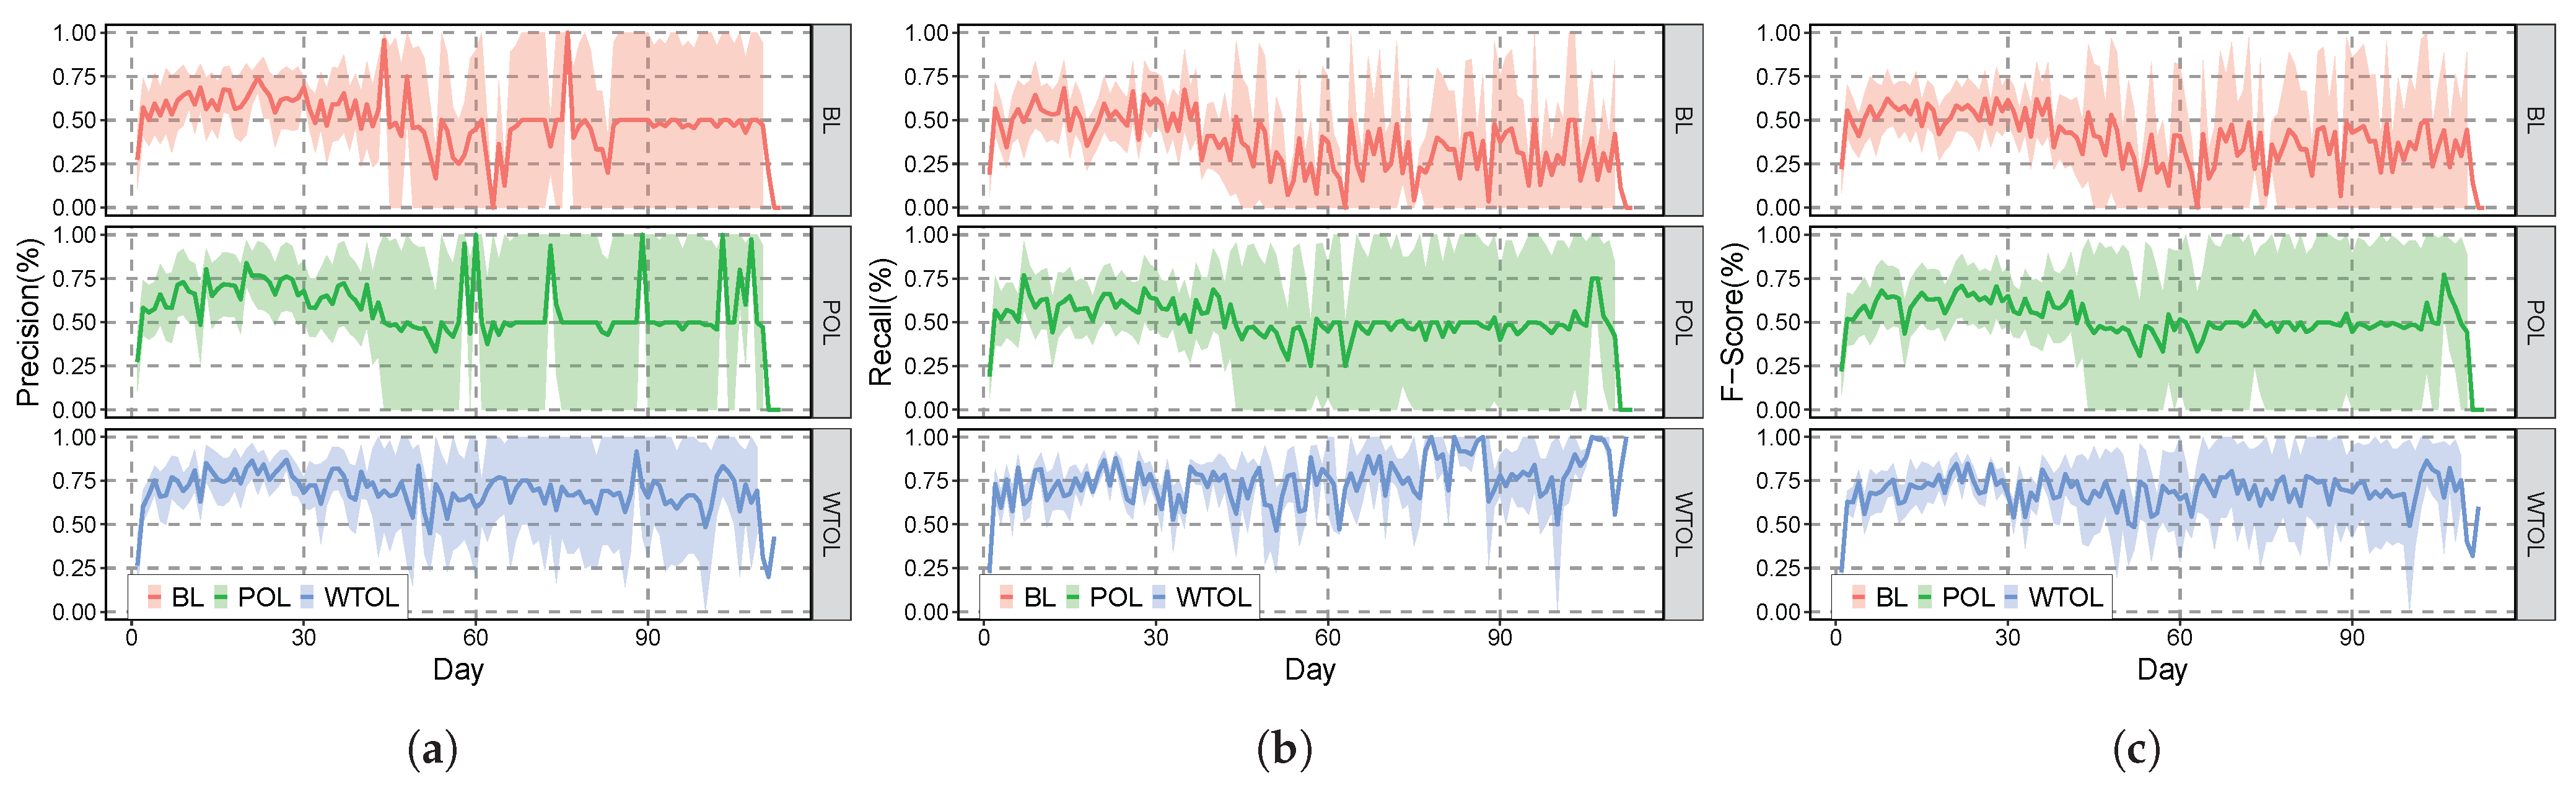
Figure 3 represents the evaluation results across the second period, starting 593 days after the end of the first experiment. Approximately two years after the end of the first data collection, the BL models do not correctly predict new incoming notifications. As shown in Table 1, the BL model achieved an F-score of 77.2%. However, on the first day after two years, the F-score of the BL model drastically changed from 77.2% to 22.1%. The BL model does not stabilize over the entire second period because BL does not adapt to changing or new behavior from new incoming data.
Similar to BL, the F-scores of POL and WTOL decreased drastically on the first day of the second period. In contrast to BL, POL recovered the F-score from 22.1% to 64.9% after 10 days. However, the POL was simply retrained with the entire dataset without considering the variation in the dataset. In this case, time-variant features hinder adaptation to new patterns. Therefore, the F-score of the POL was saturated after a few days.
On day 10, WTOL showed an F-score of 75.6%. Moreover, the WTOL showed the best prediction results in terms of precision, recall, and F-score. All improvements stemmed from the combination of feature windowing and online learning. Windowing features according to time sensitivity eliminate strong variations between the two periods.
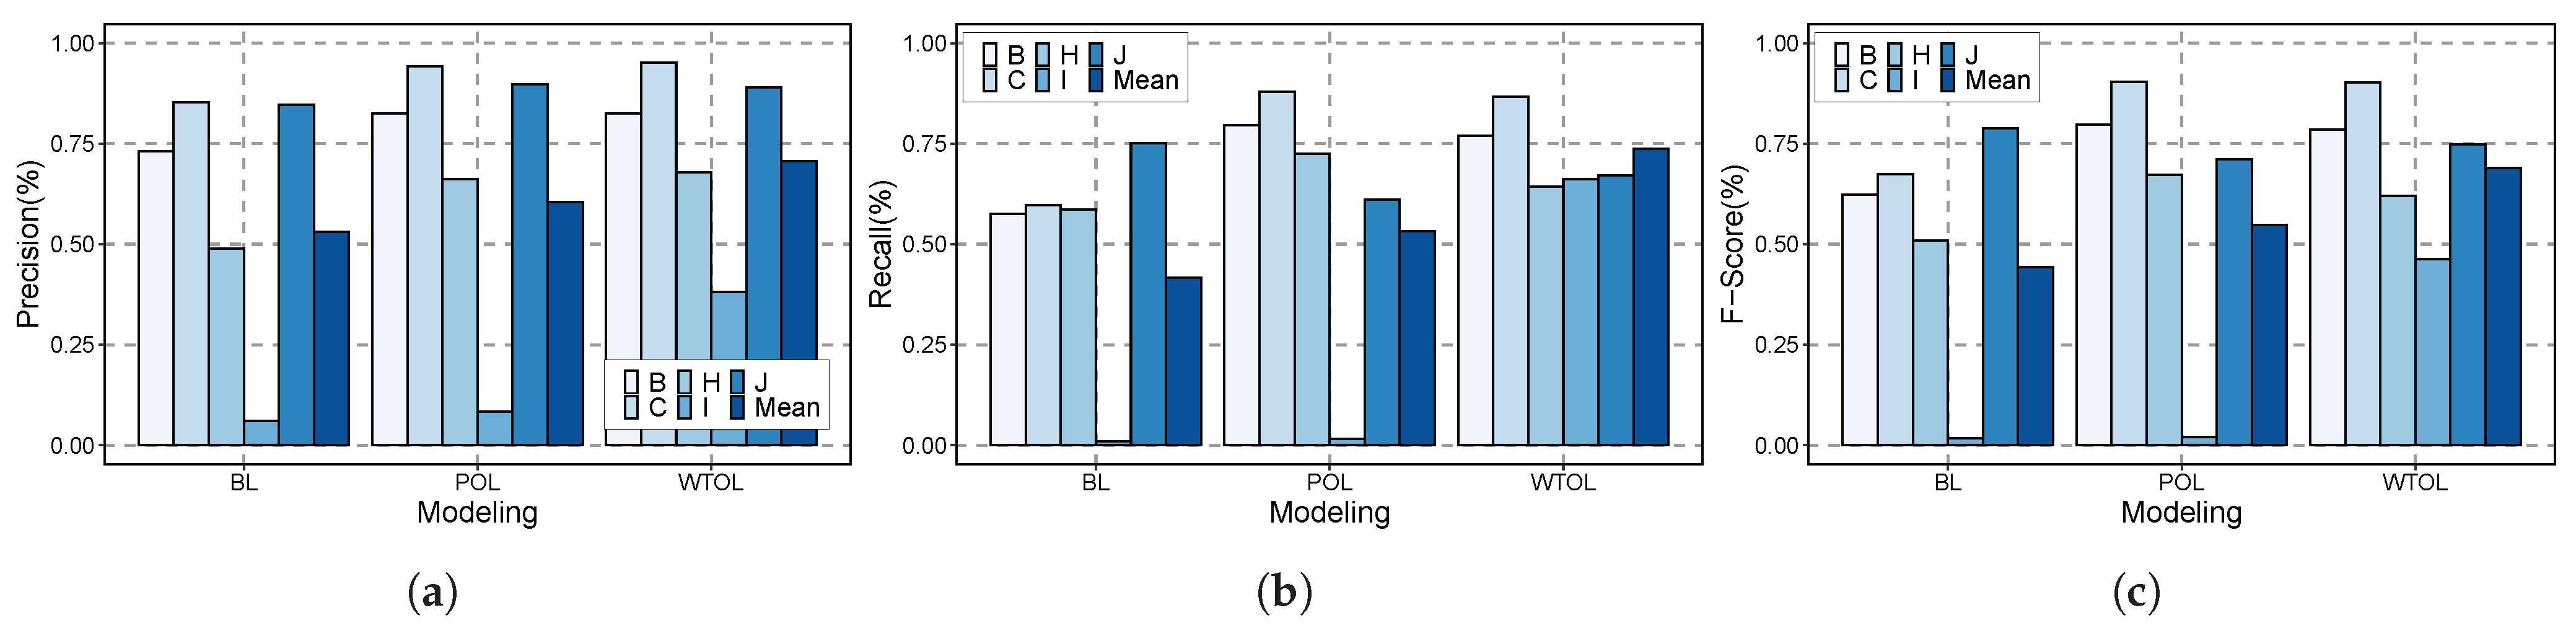
In summary, as shown in Figure 4, WTOL outperformed BL and POL with a precision of 70.7%, recall of 73.8%, and F-score of 69.0%. WTOL achieved the best result spanning across all users. Specifically, in the case of user I, WTOL dramatically improved the prediction result compared to BL and POL. User I shows the distinct changes in usage patterns. Therefore, BL and POL suffer from an accuracy drop due to the change in user behavior. WTOL is robust to severe usage changes thanks to time-invariant features and online learning.
7. Conclusions
In this paper, we proposed an intelligent notification systems called WTOL to mitigate energy consumption induced by redundant notifications between a smartphone and a smartwatch. The proposed system not only works in multi-device environments but also keeps the quality of models for long-term periods of time. With in the wild data collection for a long period of two years, we verified that the combination of windowing depending on time-variant and online learning effectively adapts to either changing or new behavior. By doing that, WTOL is improved as more and more data become available over passing time. WTOL outperformed BL and POL by up to an F-score of 24.7%. Therefore, thanks to resilience to changing behavior, WTOL could predict device preferences of notifications without severe accuracy drop over time.
Author Contributions
Conceptualization, J.L.; methodology, J.L.; investigation, J.L.; writing—original draft preparation, J.L.; writing—review and editing, J.L., S.P. and H.K.; project administration, J.L., T.K. and H.K. All authors have read and agreed to the published version of the manuscript.
Funding
This work was supported by Institute of Information & communications Technology Planning & Evaluation (IITP) grant funded by the Korea government (MSIT) (No. 2018-0-00769, Neuromorphic Computing Software Platform for Artificial Intelligence Systems).
Institutional Review Board Statement
Not applicable.
Informed Consent Statement
Not applicable.
Conflicts of Interest
The authors declare no conflict of interest.
References
- Iqbal, S.T.; Horvitz, E. Notifications and awareness: A field study of alert usage and preferences. In Proceedings of the ACM International Conference on Computer Supported Cooperative Work (CSCW), Savannah, GA, USA, 6–10 February 2010; pp. 27–30. [Google Scholar] [CrossRef]
- Horvitz, E.; Koch, P.; Apacible, J. BusyBody: Creating and fielding personalized models of the cost of interruption. In Proceedings of the ACM International Conference on Computer Supported Cooperative Work (CSCW), Chicago, IL, USA, 6–10 November 2004; pp. 507–510. [Google Scholar] [CrossRef]
- Leiva, L.; Böhmer, M.; Gehring, S.; Krüger, A. Back to the App: The Costs of Mobile Application Interruptions. In Proceedings of the 14th International Conference on Human-Computer Interaction with Mobile Devices and Services, San Francisco, CA, USA, 21–24 September 2012; pp. 291–294. [Google Scholar]
- Fischer, J.E.; Yee, N.; Bellotti, V.; Good, N.; Benford, S.; Greenhalgh, C. Effects of content and time of delivery on receptivity to mobile interruptions. In Proceedings of the ACM International Conference on Human Computer Interaction with Mobile Devices and Services (MobileHCI), Lisbon, Portugal, 7–10 September 2010; pp. 103–112. [Google Scholar] [CrossRef]
- Mehrotra, A.; Musolesi, M.; Hendley, R.; Pejovic, V. Designing content-driven intelligent notification mechanisms for mobile applications. In Proceedings of the ACM International Joint Conference on Pervasive and Ubiquitous Computing (UbiComp), Osaka, Japan, 7–11 September 2015; pp. 813–824. [Google Scholar]
- Fischer, J.E.; Greenhalgh, C.; Benford, S. Investigating episodes of mobile phone activity as indicators of opportune moments to deliver notifications. In Proceedings of the ACM International Conference on Human Computer Interaction with Mobile Devices and Services (MobileHCI), Stockholm, Sweden, 30 August–2 September 2011; pp. 181–190. [Google Scholar] [CrossRef]
- Okoshi, T.; Nozaki, H.; Nakazawa, J.; Tokuda, H.; Ramos, J.; Dey, A.K. Towards attention-aware adaptive notification on smart phones. Pervasive Mob. Comput. 2016, 26, 17–34. [Google Scholar] [CrossRef]
- Mehrotra, A.; Hendley, R.; Musolesi, M. PrefMiner: Mining User’s Preferences for Intelligent Mobile Notification Management. In Proceedings of the 2016 ACM International Joint Conference on Pervasive and Ubiquitous Computing (UbiComp’16), Heidelberg, Germany, 12–16 September 2016; pp. 1223–1234. [Google Scholar] [CrossRef]
- Pradhan, S.; Qiu, L.; Parate, A.; Kim, K.H. Understanding and managing notifications. In Proceedings of the INFOCOM 2017-IEEE Conference on Computer Communications, Atlanta, GA, USA, 1–4 May 2017; pp. 1–9. [Google Scholar]
- Visuri, A.; Sarsenbayeva, Z.; van Berkel, N.; Goncalves, J.; Rawassizadeh, R.; Kostakos, V.; Ferreira, D. Quantifying Sources and Types of Smartwatch Usage Sessions. In Proceedings of the 2017 CHI Conference on Human Factors in Computing Systems (CHI ’17), Denver, CO, USA, 6–11 May 2017; pp. 3569–3581. [Google Scholar] [CrossRef] [Green Version]
- Cecchinato, M.E.; Cox, A.L.; Bird, J. Always On(Line)?: User Experience of Smartwatches and Their Role Within Multi-Device Ecologies. In Proceedings of the 2017 CHI Conference on Human Factors in Computing Systems (CHI ’17), Denver, CO, USA, 6–11 May 2017; pp. 3557–3568. [Google Scholar] [CrossRef]
- Weber, D.; Voit, A.; Kratzer, P.; Henze, N. In-situ Investigation of Notifications in Multi-device Environments. In Proceedings of the 2016 ACM International Joint Conference on Pervasive and Ubiquitous Computing (UbiComp’16), Heidelberg, Germany, 12–16 September 2016; pp. 1259–1264. [Google Scholar] [CrossRef]
- Monge Roffarello, A.; De Russis, L. Coping with digital wellbeing in a multi-device world. In Proceedings of the 2021 CHI Conference on Human Factors in Computing Systems, Yokohama, Japan, 8–13 May 2021; pp. 1–14. [Google Scholar]
- Mehrotra, A.; Hendley, R.; Musolesi, M. NotifyMeHere: Intelligent notification delivery in multi-device environments. In Proceedings of the 2019 Conference on Human Information Interaction and Retrieval, Glasgow, UK, 10–14 March 2019; pp. 103–111. [Google Scholar]
- Weber, D. Towards smart notification management in multi-device environments. In Proceedings of the 19th International Conference on Human-Computer Interaction with Mobile Devices and Services, Vienna, Austria, 4–7 September 2017; pp. 1–2. [Google Scholar]
- Voit, A.; Weber, D.; Henze, N. Qualitative investigation of multi-device notifications. In Proceedings of the 2018 ACM International Joint Conference and 2018 International Symposium on Pervasive and Ubiquitous Computing and Wearable Computers, Singapore, 8–12 October 2018; pp. 1263–1270. [Google Scholar]
- Lee, J.; Lee, U.; Kim, H. PASS: Reducing Redundant Notifications between a Smartphone and a Smartwatch for Energy Saving. IEEE Trans. Mob. Comput. 2019, 19, 2656–2669. [Google Scholar] [CrossRef]
- Pielot, M.; Oliveira, R.D.; Kwak, H.; Oliver, N. Didn’t you see my message? Predicting attentiveness to mobile instant messages. In Proceedings of the ACM International Conference on Human Factors in Computing Systems (CHI), Toronto, ON, Canada, 26 April–1 May 2014; pp. 3319–3328. [Google Scholar]
- Pejovic, V.; Musolesi, M. InterruptMe: Designing intelligent prompting mechanisms for pervasive applications. In Proceedings of the ACM International Joint Conference on Pervasive and Ubiquitous Computing (UbiComp), Seattle, WA, USA, 13–17 September 2014; pp. 897–908. [Google Scholar]
- Gong, T.; Kim, Y.; Shin, J.; Lee, S.J. MetaSense: Few-shot adaptation to untrained conditions in deep mobile sensing. In Proceedings of the 17th Conference on Embedded Networked Sensor Systems, New York, NY, USA, 10–13 November 2019; pp. 110–123. [Google Scholar]
- Gong, T.; Kim, Y.; Choi, R.; Shin, J.; Lee, S.J. Adapting to Unknown Conditions in Learning-based Mobile Sensing. IEEE Trans. Mob. Comput. 2021. Early Access. [Google Scholar] [CrossRef]
- Sztyler, T.; Stuckenschmidt, H. Online personalization of cross-subjects based activity recognition models on wearable devices. In Proceedings of the 2017 IEEE International Conference on Pervasive Computing and Communications (PerCom), Kona, HI, USA, 13–17 March 2017; pp. 180–189. [Google Scholar]
- Gumus, F.; Sakar, C.O.; Erdem, Z.; Kursun, O. Online Naive Bayes classification for network intrusion detection. In Proceedings of the 2014 IEEE/ACM International Conference on Advances in Social Networks Analysis and Mining (ASONAM 2014), Beijing, China, 17–20 August 2014; pp. 670–674. [Google Scholar]
- Jeong, H.; Kim, H.; Kim, R.; Lee, U.; Jeong, Y. Smartwatch wearing behavior analysis: A longitudinal study. Proc. ACM Interact. Mob. Wearable Ubiquitous Technol. 2017, 1, 1–31. [Google Scholar] [CrossRef]
- Okoshi, T.; Tsubouchi, K.; Tokuda, H. Real-world product deployment of adaptive push notification scheduling on smartphones. In Proceedings of the 25th Acm Sigkdd International Conference on Knowledge Discovery & Data Mining, Anchorage, AK, USA, 4–8 August 2019; pp. 2792–2800. [Google Scholar]
- Visuri, A.; van Berkel, N.; Goncalves, J.; Rawassizadeh, R.; Ferreira, D.; Kostakos, V. Understanding usage style transformation during long-term smartwatch use. Pers. Ubiquitous Comput. 2021, 25, 535–549. [Google Scholar] [CrossRef]
- Sagi, O.; Rokach, L. Ensemble learning: A survey. Wiley Interdiscip. Rev. Data Min. Knowl. Discov. 2018, 8, e1249. [Google Scholar] [CrossRef]
Figure 1.
Overall framework for data collection and analysis.

Figure 2.
Three training methods: (a) batch learning; (b) plain online learning; and (c) windowing time-invariant online learning.
Figure 2.
Three training methods: (a) batch learning; (b) plain online learning; and (c) windowing time-invariant online learning.

Figure 3.
The inference results over time: (a) precision; (b) recall; and (c) F-score.

Figure 4.
The inference results over time: (a) Precision (b) Recall, and (c) F-Score.


Table 1.
Results of accuracy drop against a new dataset collected over long-term periods.
| Original Model | New Dataset | |
|---|---|---|
| Precision | 80.2% | 53.1% () |
| Recall | 76.2% | 41.7% () |
| F-Score | 77.2% | 44.3% () |
Table 2.
Collected notification label and context features.
| Type | Name | Sensed Raw Data |
|---|---|---|
| Label | Notification Type | Whether the application that triggered the notification was launched at a certain time |
| Feature | Sender App Name | Installed package name of mobile applications |
| Feature | Title | Title from the Notification bar |
| Feature | Time of Day | Millisecond time stamp |
| Feature | Day of the Week | Millisecond time stamp |
| Feature | Recent Phone Usage | Whether the time difference between the last screen ON and Notification arrival time is in one minute or not |
| Feature | Proximity | Whether the user is proximate to the phone |
| Feature | Priority | Notification’s priority developer configured. The default value is zero |
| Feature | Physical Activity | The user’s activity is provided by SensorManager |
| Feature | Interactive Status | True if the device is in an interactive state in which the device is awake and ready to interact with the user |
| Feature | Relative Seen Time | Whether the time difference between the last screen ON and Notification arrival time is equals to zero or not |
Table 3.
Participant demographics.
| # of Users | Age | Occupation |
|---|---|---|
| 5 (4 male and 1 female) | 25, 26, 27, 31(2) | Students(4), Office Workers(1) |
Table 4.
Summary of the collected dataset in two separate periods (first and second).
| User | Date | Day | # of Notis. | Label | ||||
|---|---|---|---|---|---|---|---|---|
| First | Second | First | Second | First | Second | First | Second | |
| B | 16.2.3–16.3.17 | 17.11.28–17.12.30 | 35 | 33 | 1276 | 1232 | 992/354 | 252/980 |
| (622 days later) | ||||||||
| C | 16.1.22–16.3.6 | 17.09.11–17.12.31 | 43 | 110 | 578 | 2700 | 220/358 | 265/2435 |
| (555 days later) | ||||||||
| H | 16.2.7–16.3.17 | 17.11.18–17.12.30 | 26 | 43 | 275 | 988 | 79/196 | 443/545 |
| (612 days later) | ||||||||
| I | 16.2.3–16.3.6 | 17.09.08–17.12.30 | 33 | 113 | 4196 | 4948 | 308/3888 | 3323/1625 |
| (552 days later) | ||||||||
| J | 16.2.3–16.3.6 | 17.11.20–17.12.30 | 33 | 41 | 824 | 1390 | 42/782 | 262/1128 |
| (625 days later) | ||||||||
Table 5.
Long-term feature analysis with chi-square test. * denotes the p-value . The colored cells indicate long-term features (time-invariant features).
Table 5.
Long-term feature analysis with chi-square test. * denotes the p-value . The colored cells indicate long-term features (time-invariant features).
| User | Sender App Name | Title | Time of Day | Day of the Week | Recent Phone Usage | Proximity | Priority | Physical Activity | Phone Status | Relative Seen Time |
|---|---|---|---|---|---|---|---|---|---|---|
| B | ||||||||||
| C | ||||||||||
| H | ||||||||||
| I | ||||||||||
| J |
Table 6.
Contingency table from Title in user H. This feature is considered as time-invariant because p-value .
Table 6.
Contingency table from Title in user H. This feature is considered as time-invariant because p-value .
| Title | First Period | Second Period |
|---|---|---|
| Personal message A | 25 | 53 |
| Personal message B | 29 | 99 |
| Personal message C | 7 | 23 |
Table 7.
Contingency table from Title in user I. This feature is considered as time-variant because p-value .
Table 7.
Contingency table from Title in user I. This feature is considered as time-variant because p-value .
| Title | First Period | Second Period |
|---|---|---|
| Personal message A | 36 | 62 |
| Personal message B | 21 | 10 |
Publisher’s Note: MDPI stays neutral with regard to jurisdictional claims in published maps and institutional affiliations. |
© 2022 by the authors. Licensee MDPI, Basel, Switzerland. This article is an open access article distributed under the terms and conditions of the Creative Commons Attribution (CC BY) license (https://creativecommons.org/licenses/by/4.0/).
Share and Cite
MDPI and ACS Style
Lee, J.; Park, S.; Kim, T.; Kim, H. Time-Invariant Features-Based Online Learning for Long-Term Notification Management: A Longitudinal Study. Appl. Sci. 2022, 12, 5432. https://doi.org/10.3390/app12115432
AMA Style
Lee J, Park S, Kim T, Kim H. Time-Invariant Features-Based Online Learning for Long-Term Notification Management: A Longitudinal Study. Applied Sciences. 2022; 12(11):5432. https://doi.org/10.3390/app12115432
Chicago/Turabian StyleLee, Jemin, Sihyeong Park, Taeho Kim, and Hyungshin Kim. 2022. "Time-Invariant Features-Based Online Learning for Long-Term Notification Management: A Longitudinal Study" Applied Sciences 12, no. 11: 5432. https://doi.org/10.3390/app12115432
Note that from the first issue of 2016, this journal uses article numbers instead of page numbers. See further details here.