2. System Model: Data Mining Approach
In all biomedical applications, the major need is to gather the data from various sources for comparison cases, and any redundant data must be removed from the system. Therefore, the proposed technique provides high importance to data-mining procedures, in addition to fuzzy incorporation systems. In the first step, the initial strength of biomedical signals must be monitored, and it can be mathematically represented by using Equation (1).
where
denotes the stored reference vector, and
represents the observed strength vector values.
From Equation (1), we can see that both vector values that are distributed in different regions are calculated, and a test is made at the initial stage. If the biomedical signal strengths are higher, then there is no necessity for boosting the process. During the testing process, the strength of the biomedical signals is much higher without any attenuation. Therefore, a cross-point intersection of signals can be formulated by using Equation (2), as follows:
where
denotes data mining of
ith set paths,
represents the cipher score values, and
indicates the maximum threshold values.
From Equation (2), a set of intersection points of different biomedical signals is observed and is later separated into distinct forms. This leads to the calculation of distance between two signals; as in many signal-processing techniques, the closer the signal levels are, the higher the accuracy of the fuzzy incorporated systems will be. Therefore, after intersection points, the distance measurements of biomedical signals are calculated by using Equation (3).
where
denotes the mean distance of signals, and
represents the input reference representation of signals.
Equation (3) denotes the difference between the mean distances that will provide variation, and, at this point, maximization can be performed within quick representation points. This maximization of points provide conjoint correlation between sets of points, and it can be mathematically modeled by using Equation (4).
where
and
denote the coefficient matrix of
x and
y parameters, respectively; and
represents the independent correlation matrix.
From Equation (4), we can see that the square of difference between the coefficients will provide higher values; thus, the values in the upper segment will rise to a larger extent. Therefore, the criteria for selecting signals can be given as follows:
where
,
, and
denote the dimensional feature set of input and output variables.
The process of selecting signals will vary for each iteration; hence, Equation (5) can be redesigned in mathematical terms, where the signals can be differentiated by using Equation (6), as follows:
where
indicates the absolute signaling factor terms, and
denotes the length of total signal representations.
The membership set can be used for defining a set of biomedical signal representations where multiple inputs and outputs can be defined. This can be expressed in mathematical form, as follows:
where
denotes the membership function in de-fuzzified output at the receiver, and
represents the output functions.
All the equations that are represented in the system model are implanted with fuzzy logic under three different levels: high, medium, and low. Therefore, the integration process is discussed in
Section 3.
3. Optimization Using Fuzzy Systems
The major advantage of using the Fuzzy Interface System Algorithm (FISA) is that the input properties of biomedical signals are not clear; thus, the system produces very low robustness. To increase the robustness of the proposed method, precise inputs are evaded, thus integrating only supporting inputs that avoid fault data in the system [
19,
20,
21]. Since FISA has low imprecise data, the integrated sensor will function effectively, and if any fault is identified, the sensor function stops with immediate effect. In this case, the program can be changed with respect to specification tuning parameters, wherein the cost of such changes will be much lower. Thus, the membership of fuzzy can be represented by using upper and lower bounds as follows:
where
and
denote the data set in lower and upper boundaries.
Using the boundaries in Equation (8), a minimization function can be directed by using a coefficient matrix term wherein the centroid method is implemented. This can be represented as a two-unit exemplification, using Equation (9):
where
denotes the coefficient factor of the
ith and
kth terms; and
represents the distance between the
x and
z sub-points.
The above equation can be linked to a trajectory function by using cluster weights that are represented by using Equation (10):
Whenever fuzzy set relationships are established, the binary form of fuzzy must be defined by using a constant integer set as a simple solution that can be achieved at sequential time steps. This can be represented by using Equation (11):
where
and
represent the threshold limits of minimum and maximum cases, respectively; and
denotes the activation function.
In Equation (11), the activation function is expressed in terms of the next periodic function, as the presence of uncontrolled values can be represented by using a stringent function, which is exponential in nature. These exponential characteristics can be defined by using Equation (12):
where
denotes the initial input activation constant, which is assumed to be of 15 periods.
In Equation (12), the activation function will remain active for a period of 15 s, and, after a certain time, it will automatically reach the permeation state, as power consumption during signal transmission can be reduced to larger extent. Therefore, to reduce the loss in signal, a square function must be defined in logic functionalities, which can be expressed by using Equation (13):
where
denotes the square function; and
and
represents number of signals and database signals, respectively.
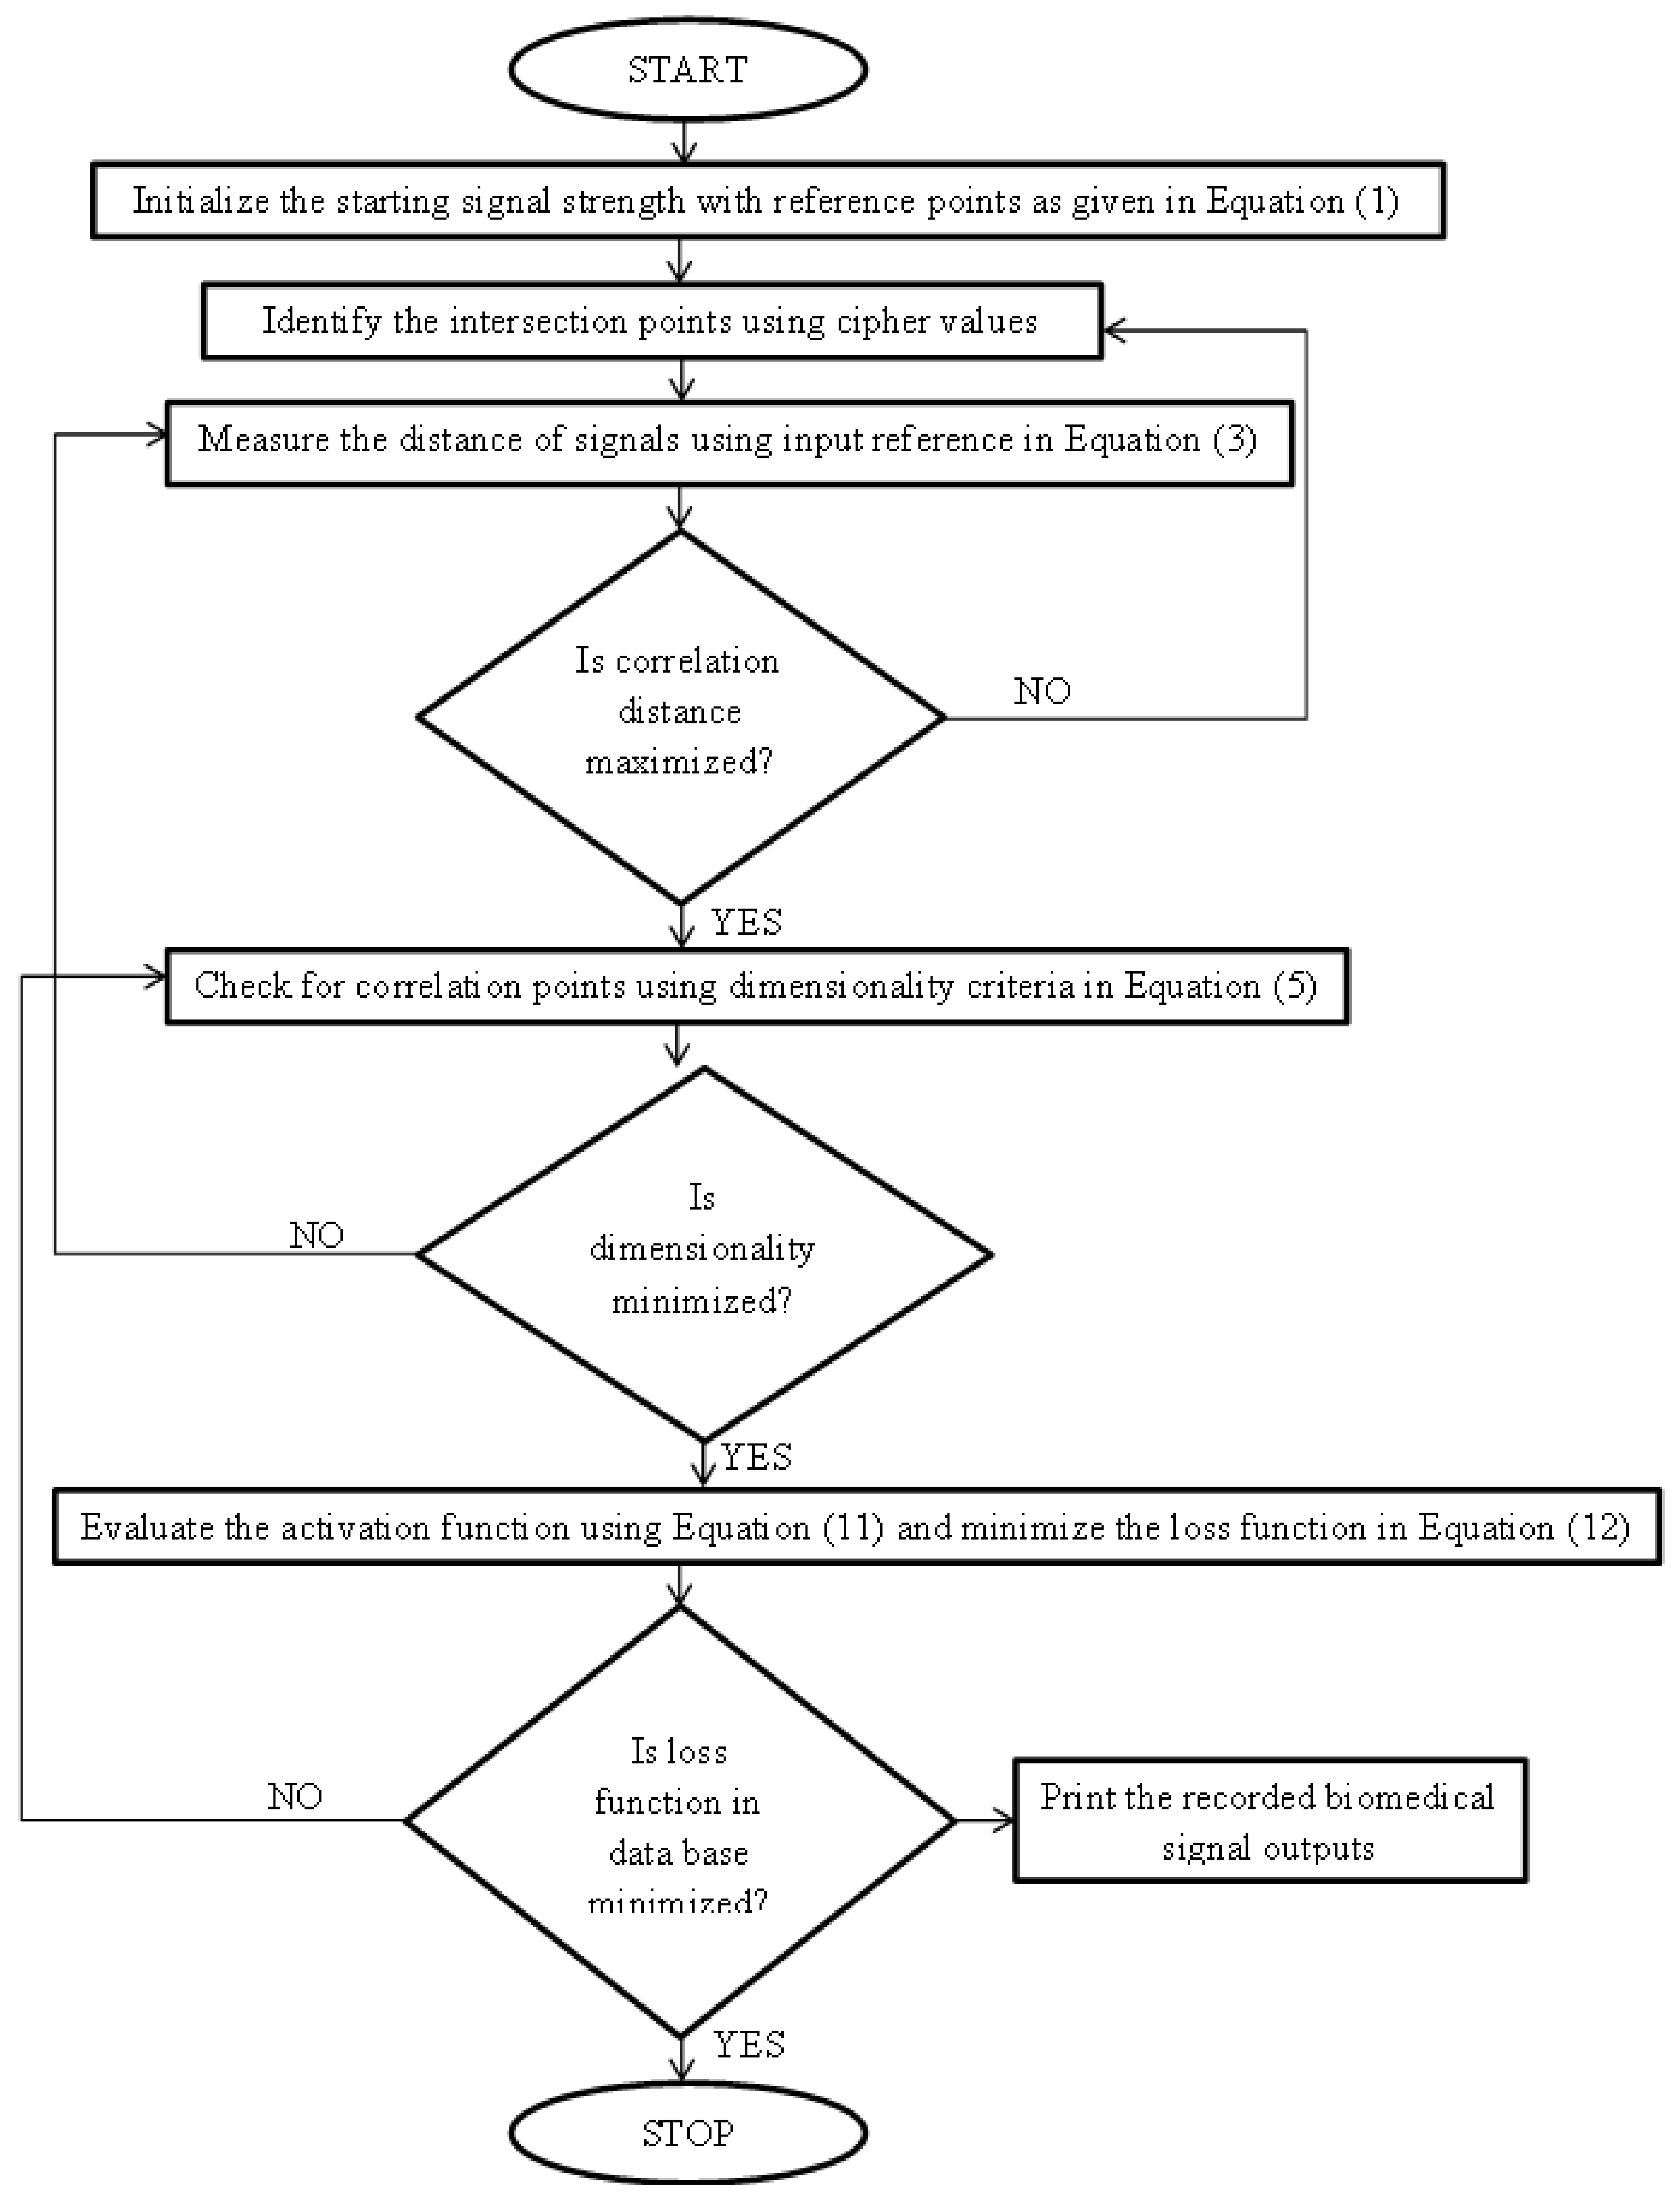
If Equation (13) is minimized, then the accuracy of proposed method can be increased to a great extent. However, it cannot be implemented in the same constraint as a single case; therefore, it is integrated with loop Equations, as shown in
Figure 2. The combined effective outcomes are discussed in the subsequent section.
4. Results and Discussion
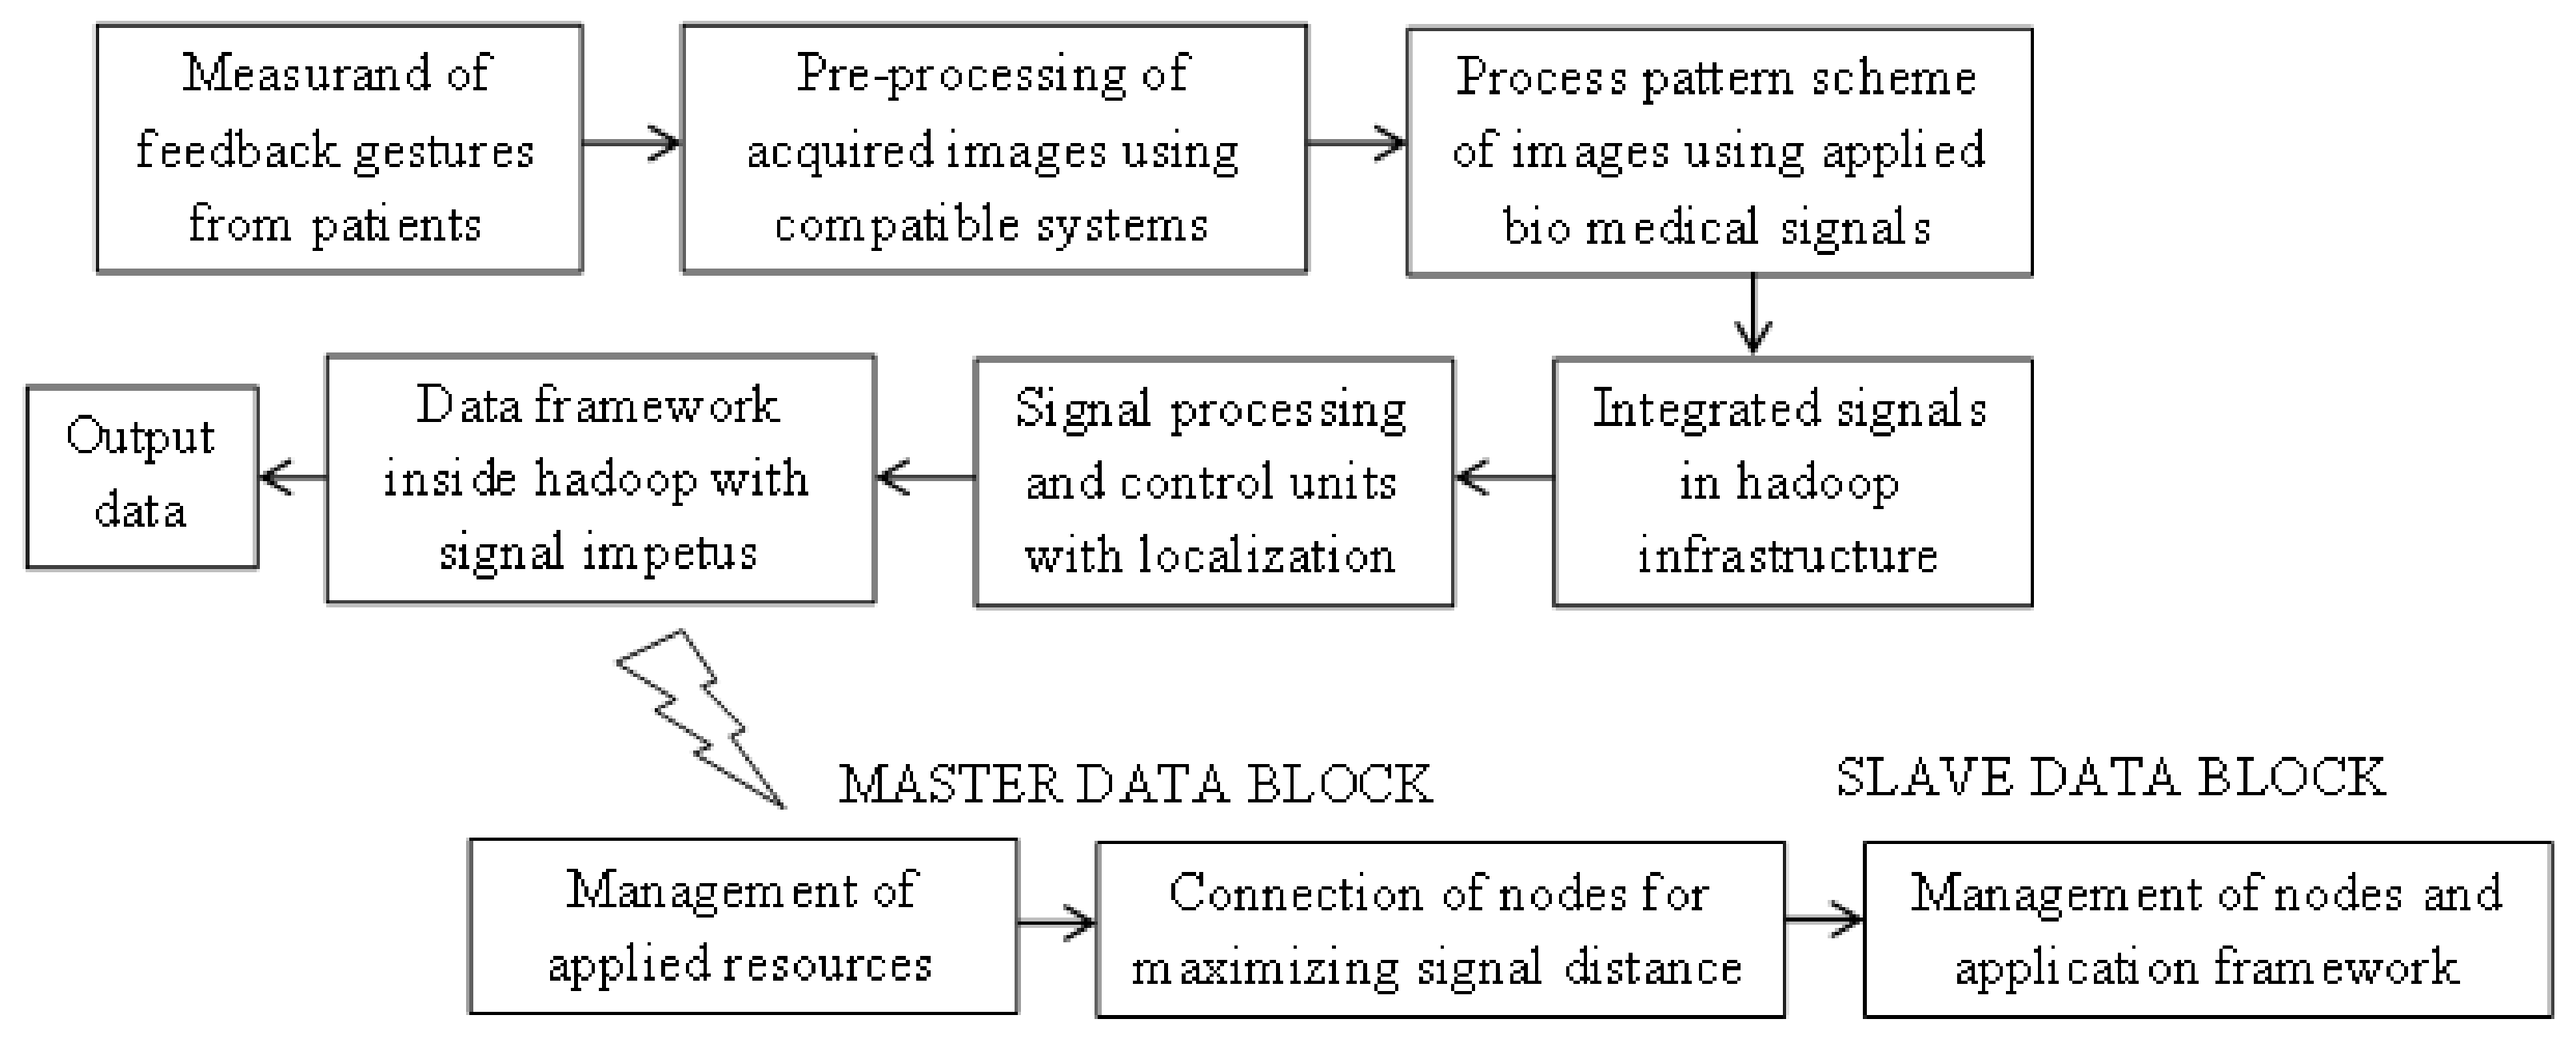
The output values of the developed system model are integrated for the purpose of data analysis using fuzzy systems. Since, in fuzzy systems, binary representations are made, probabilistic determinations will be made for decisions, thus dividing the input ecological data at maximized signal distance. In order to establish a complete relationship with knowledge representation, it is necessary to implement the data that are processed with master and slave blocks in a Hadoop infrastructure, using fuzzy interface systems. Thus, the developed system model is integrated with loop mechanisms with a high correlation matrix, using activation functions. Furthermore, the integrated process will have high similarities for all divided clusters, but this is eliminated by using fuzzy interface systems. This makes the signals to travel at maximized distance without any duplication representations. The outcome of the integrated system model a with fuzzy system is deliberated with simulation analysis in this section, where a Hadoop physical system is represented with a cluster formation technique. Moreover, for the tranquil analysis, the input and output nodes are separated, and individual node configurations are added in the specifications, where, in both nodes, the biomedical signals are passed at various points. During this signal flow point, three stages are designed, namely incorporation, dispensation, and cognitive therapy. For all of the abovementioned stages, a set of layered tools are organized, and they are examined under five different scenarios as follows:
---------------------------------------------------------------------------------------------------------------
Scenario 1: Amount of signal strength;
Scenario 2: Measurement of signal distance;
Scenario 3: Minimization of loss function;
Scenario 4: Fuzzy-signal correlation;
Scenario 5: Cost of implementation.
---------------------------------------------------------------------------------------------------------------
All five scenarios will exhibit unique characteristics in the designed system model; therefore, a high-end processor is used for simulation with MATLAB. Furthermore, for biomedical signal transmission, reception data are collected from the control center; therefore, more readings are congregated to examine the possible outcomes. The configuration setup with a data set is given in
Table 1.
The biomedical signals that are represented in this process consist of time-series representations of all medical events in biological arrangement. By using such arrangements, it is possible to record all activities inside the body, such as the temperament rate, muscle contradictions, etc. The abovementioned monitored signals are obtained by analyzing the materials that are present inside the body systems, using a biomedical signal scanner.
Since the data that are collected from the patients are numerical in character, they cannot be processed at various stages, due to incomplete information in the central database. As a result, the data-mining methodology cannot be applied at various stages, as only manual changing process is present. To avoid the aforementioned condition and to convert the representation of the system, a signal representation technique is followed in medical treatment. This automatic procedure provides complete details of persistent characteristics where a sensor is used in the intermediate process as a channel to sense the values, and it reports the same to the control center. Moreover, the sensor can sense the received signals only when the signal strength is much higher; otherwise, intermediate noise will be present that will occupy the entire space in the system. The automatic signal representation is very important, as it gives rise to the perception learning mechanism, using fuzzy set models with limited exploration. Furthermore, if perception learning is precise with the maximization of signal strength, then the proposed system will provide a clear insight about classification features.
Figure 3 and
Table 2 show the signal strength of the acquired data that can be visualized by using normalized frequency values. Before plotting the strength of the signal, the noise present in the system is removed and filtered by using the fuzzy least-square method. Therefore, the system is completely set as noise-free, and the received signal strength is maximized. This can be observed from the number of signal records, as it increases to a high amount; the low signal representations are transformed to high signals in both existing [
6] and proposed models. However, the augmentation of signal strength in the proposed fuzzy model is much higher, as the Hadoop physical structure is incorporated in the system. Furthermore, if the signal does not reach a maximum value, it is stationary at average values, thus maintaining complete operation at a minimized risk factor.
Since the process carried out in the proposed method is discussed with the received signal, it is classified with low, center (medium), and upper strengths. All three values specify that, when the process is integrated by using the fuzzy set, it should not be lesser or greater than the reference data set of signals that is indicated in
Table 1. The major reason for dividing these values is that a greater number of signals will be passed if the number of patients is higher; therefore, to avoid correlations with different signals, they are grouped as low-, medium-, and high-range signals.
Due to incorporation of fuzzy set an intersection occurs in signal transmission process and these intersection points must be different for all signals. Therefore, a distance transmission technique is incorporated for biomedical signals for recording multiple values in the system. The distance of biomedical signals is measured by using the installed electrodes at several points in real-time implementation. For each time period the electrodes will change the position as the signal type will differ at applied input side. Moreover, fuzzy systems will develop a set of distance with respect to signals which are measured using a serrate electrode. Both the values of electrodes are combined as mean values as given in Equation (3). Furthermore, the distance of measurement is separated by using sample frequency values for processing the signals, which are represented as reference representations. The installed electrodes also vary according to the number of signals that are received from different patients. The entire system was notified once the values are exceeded with compared reference values. In such a case, the system can be prevented from entering in the same node; therefore, signal distance can be measured at this point. If the signals are closer at the intersection point, then a high risk factor will be assured, whereas, if the signals are farther away from intersection points, the risk factor can be reduced to a great extent. Usually, the signals are measured from bonce position to the bottom of the pole by using a data-acquisition device; therefore, it is better to incorporate the points at the first stage, before measurement. This gives a clear insight about distance, and if any wrong values are measured, then points can be changed with immediate effect.
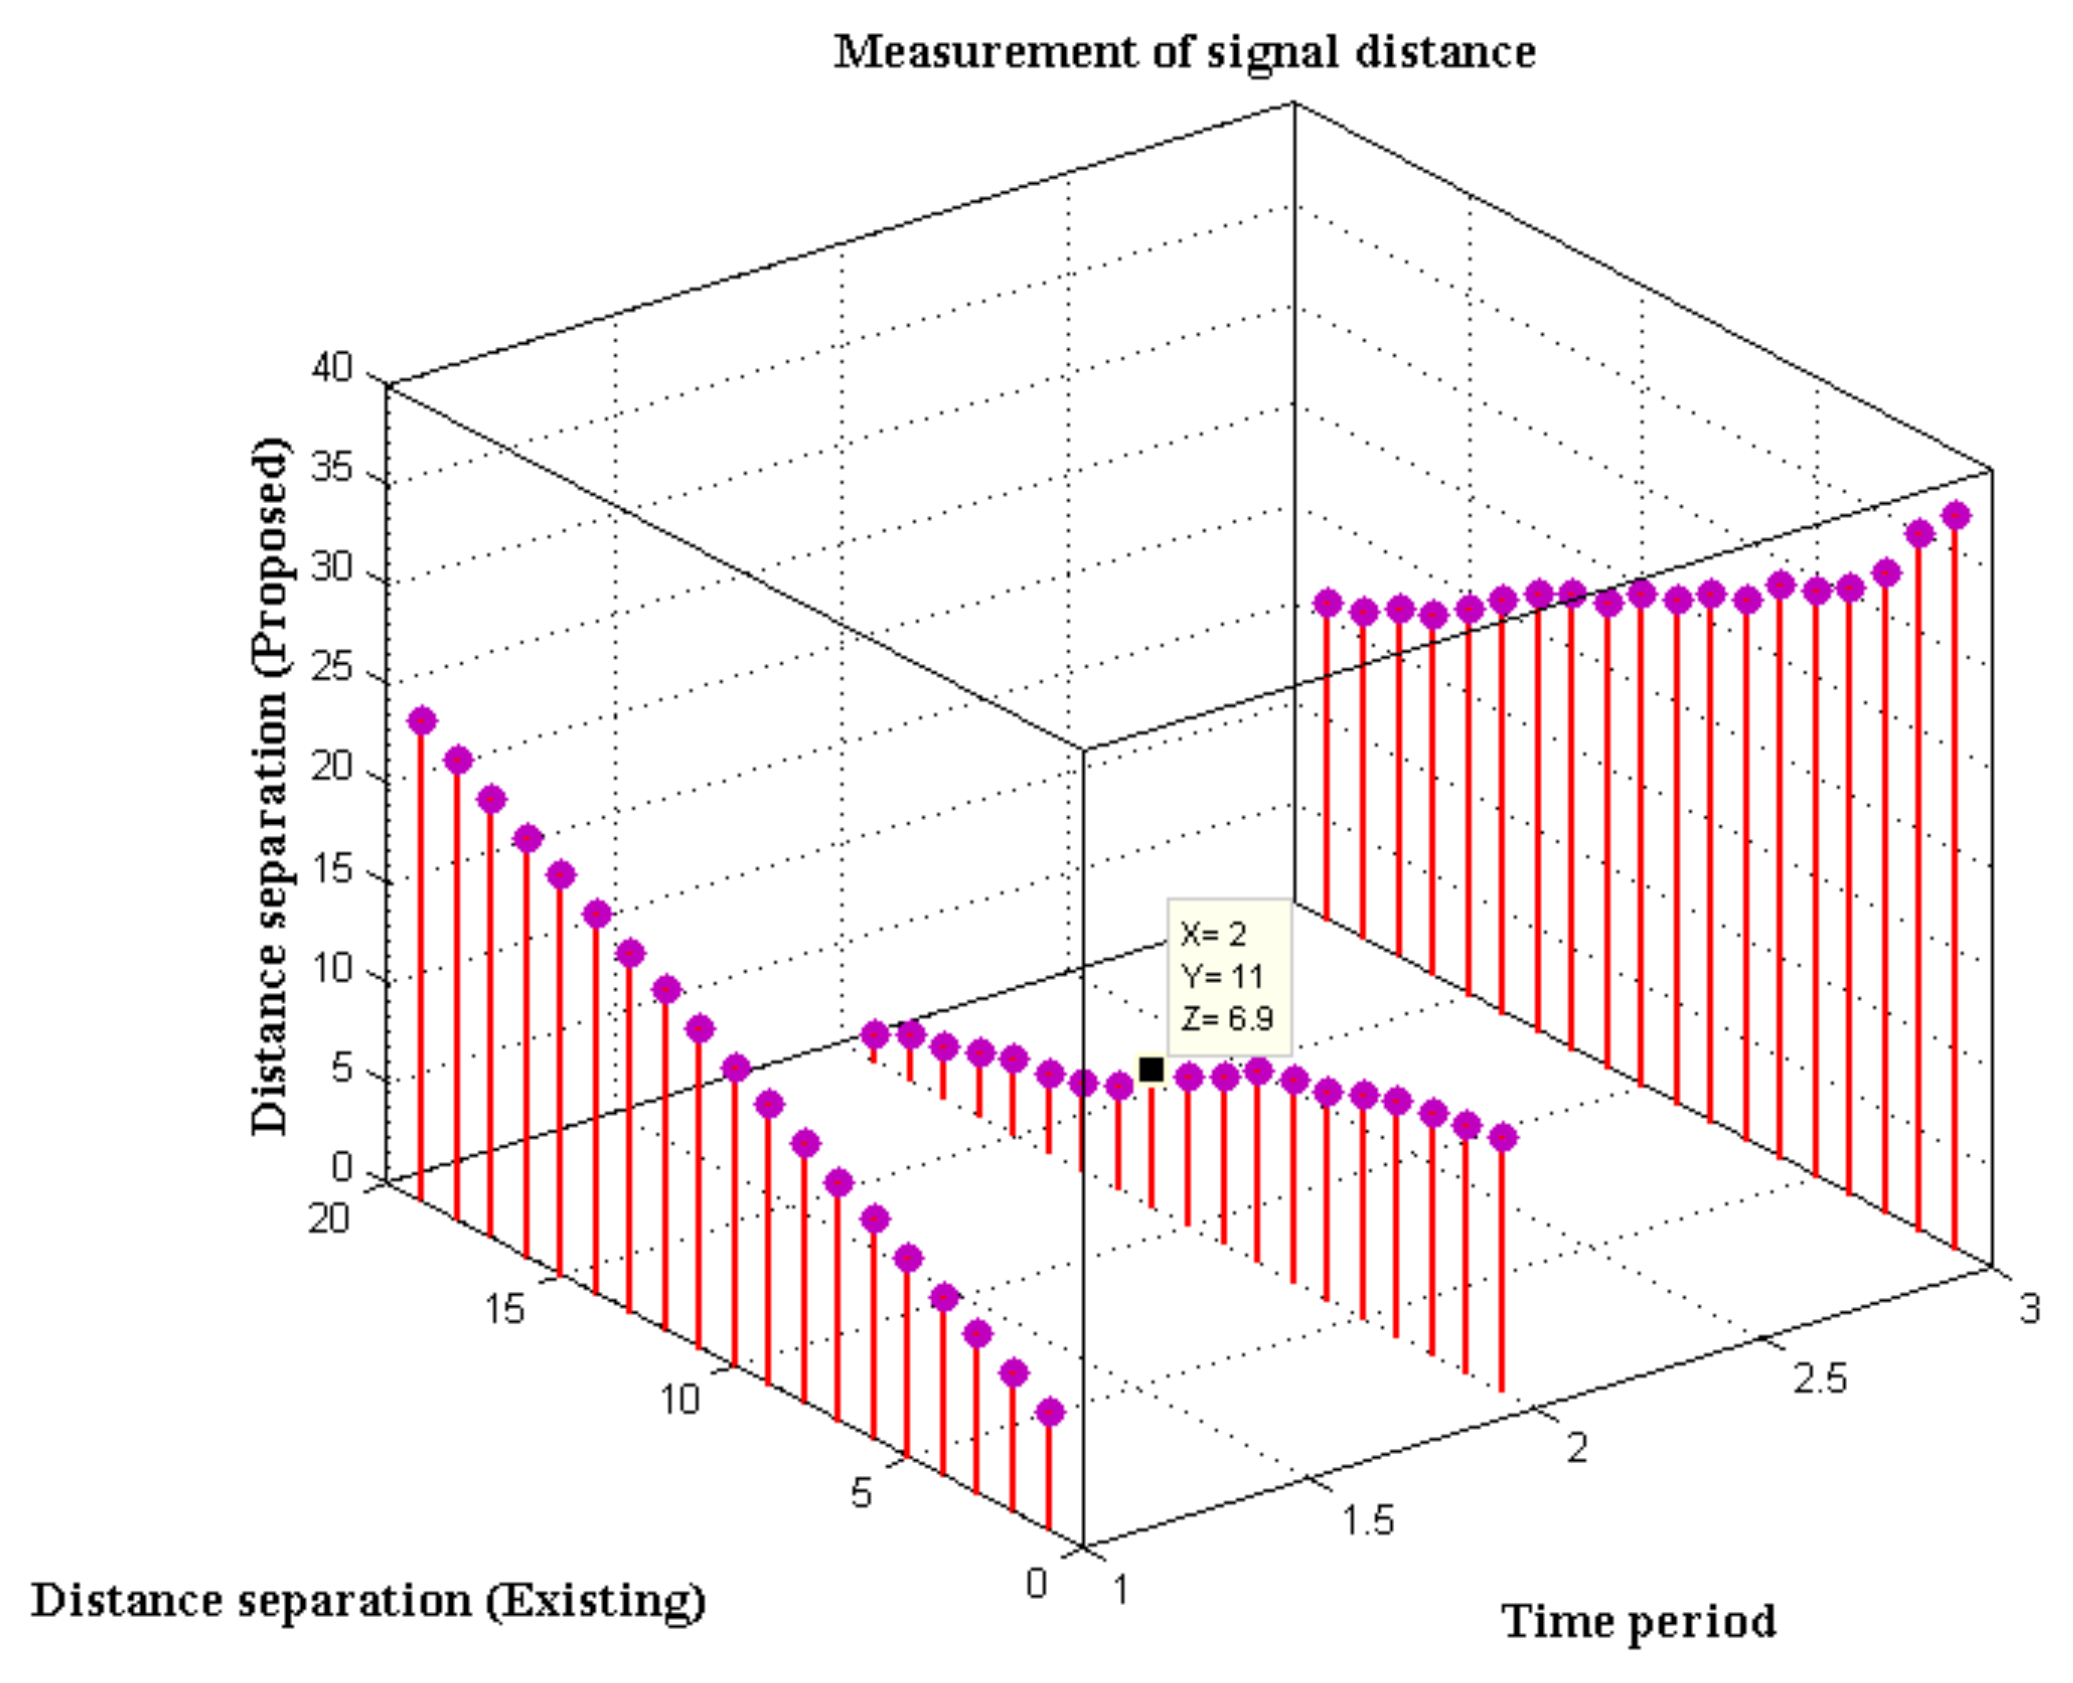
Figure 4 and
Table 3 show the simulated distance of biomedical signals with two pole points, and in the proposed method, the points are not varied until maximum signal transmission is observed. The varying distance is measured for time periods that start at 6:00 h and end at 24:00 h, and in this intermediate period, the distance of measurement cannot be varied, as the tolerant limits remain in a steady condition. Moreover, the separated clusters will have individual separated distance; thus, they are grouped within the primary cluster. It can be observed that, even during changing hours, the distance of separation is maximized for the proposed method, whereas, in the existing system [
6,
15], the separated distance of all combined signals is much lower. Due to the low signal representations, a correlation factor is determined in the existing models, but low correlation factors exist in the fuzzy interference system. This proves that, at varying time factors, the proposed method can provide accurate signals at distant points without any interruption from other clustered signals.
The handling capability of biomedical signals using fuzzy system can be proved by using a loss-function parametric evaluation, wherein low loss must be achieved. This loss function can be determined by using the database reference set and square of logical functionalities, wherein the enhanced signal outputs are represented. During this determination process, the loss function is mapped with real period representations that are associated with various clusters. However, a least-square technique can be applied in this case to prevent such signal losses in the system. In addition, the distance of measurement that is observed in Scenario 2 is also higher; therefore, the proposed system will provide a much lower loss, and the problem of uncertainty can also be solved. The biomedical signals exhibit two different properties, namely variance and symmetric, for which values in terms of magnitude are measured. Thus, the two property limits are examined and after careful experimentation error in loss values are found and plotted in
Figure 5.
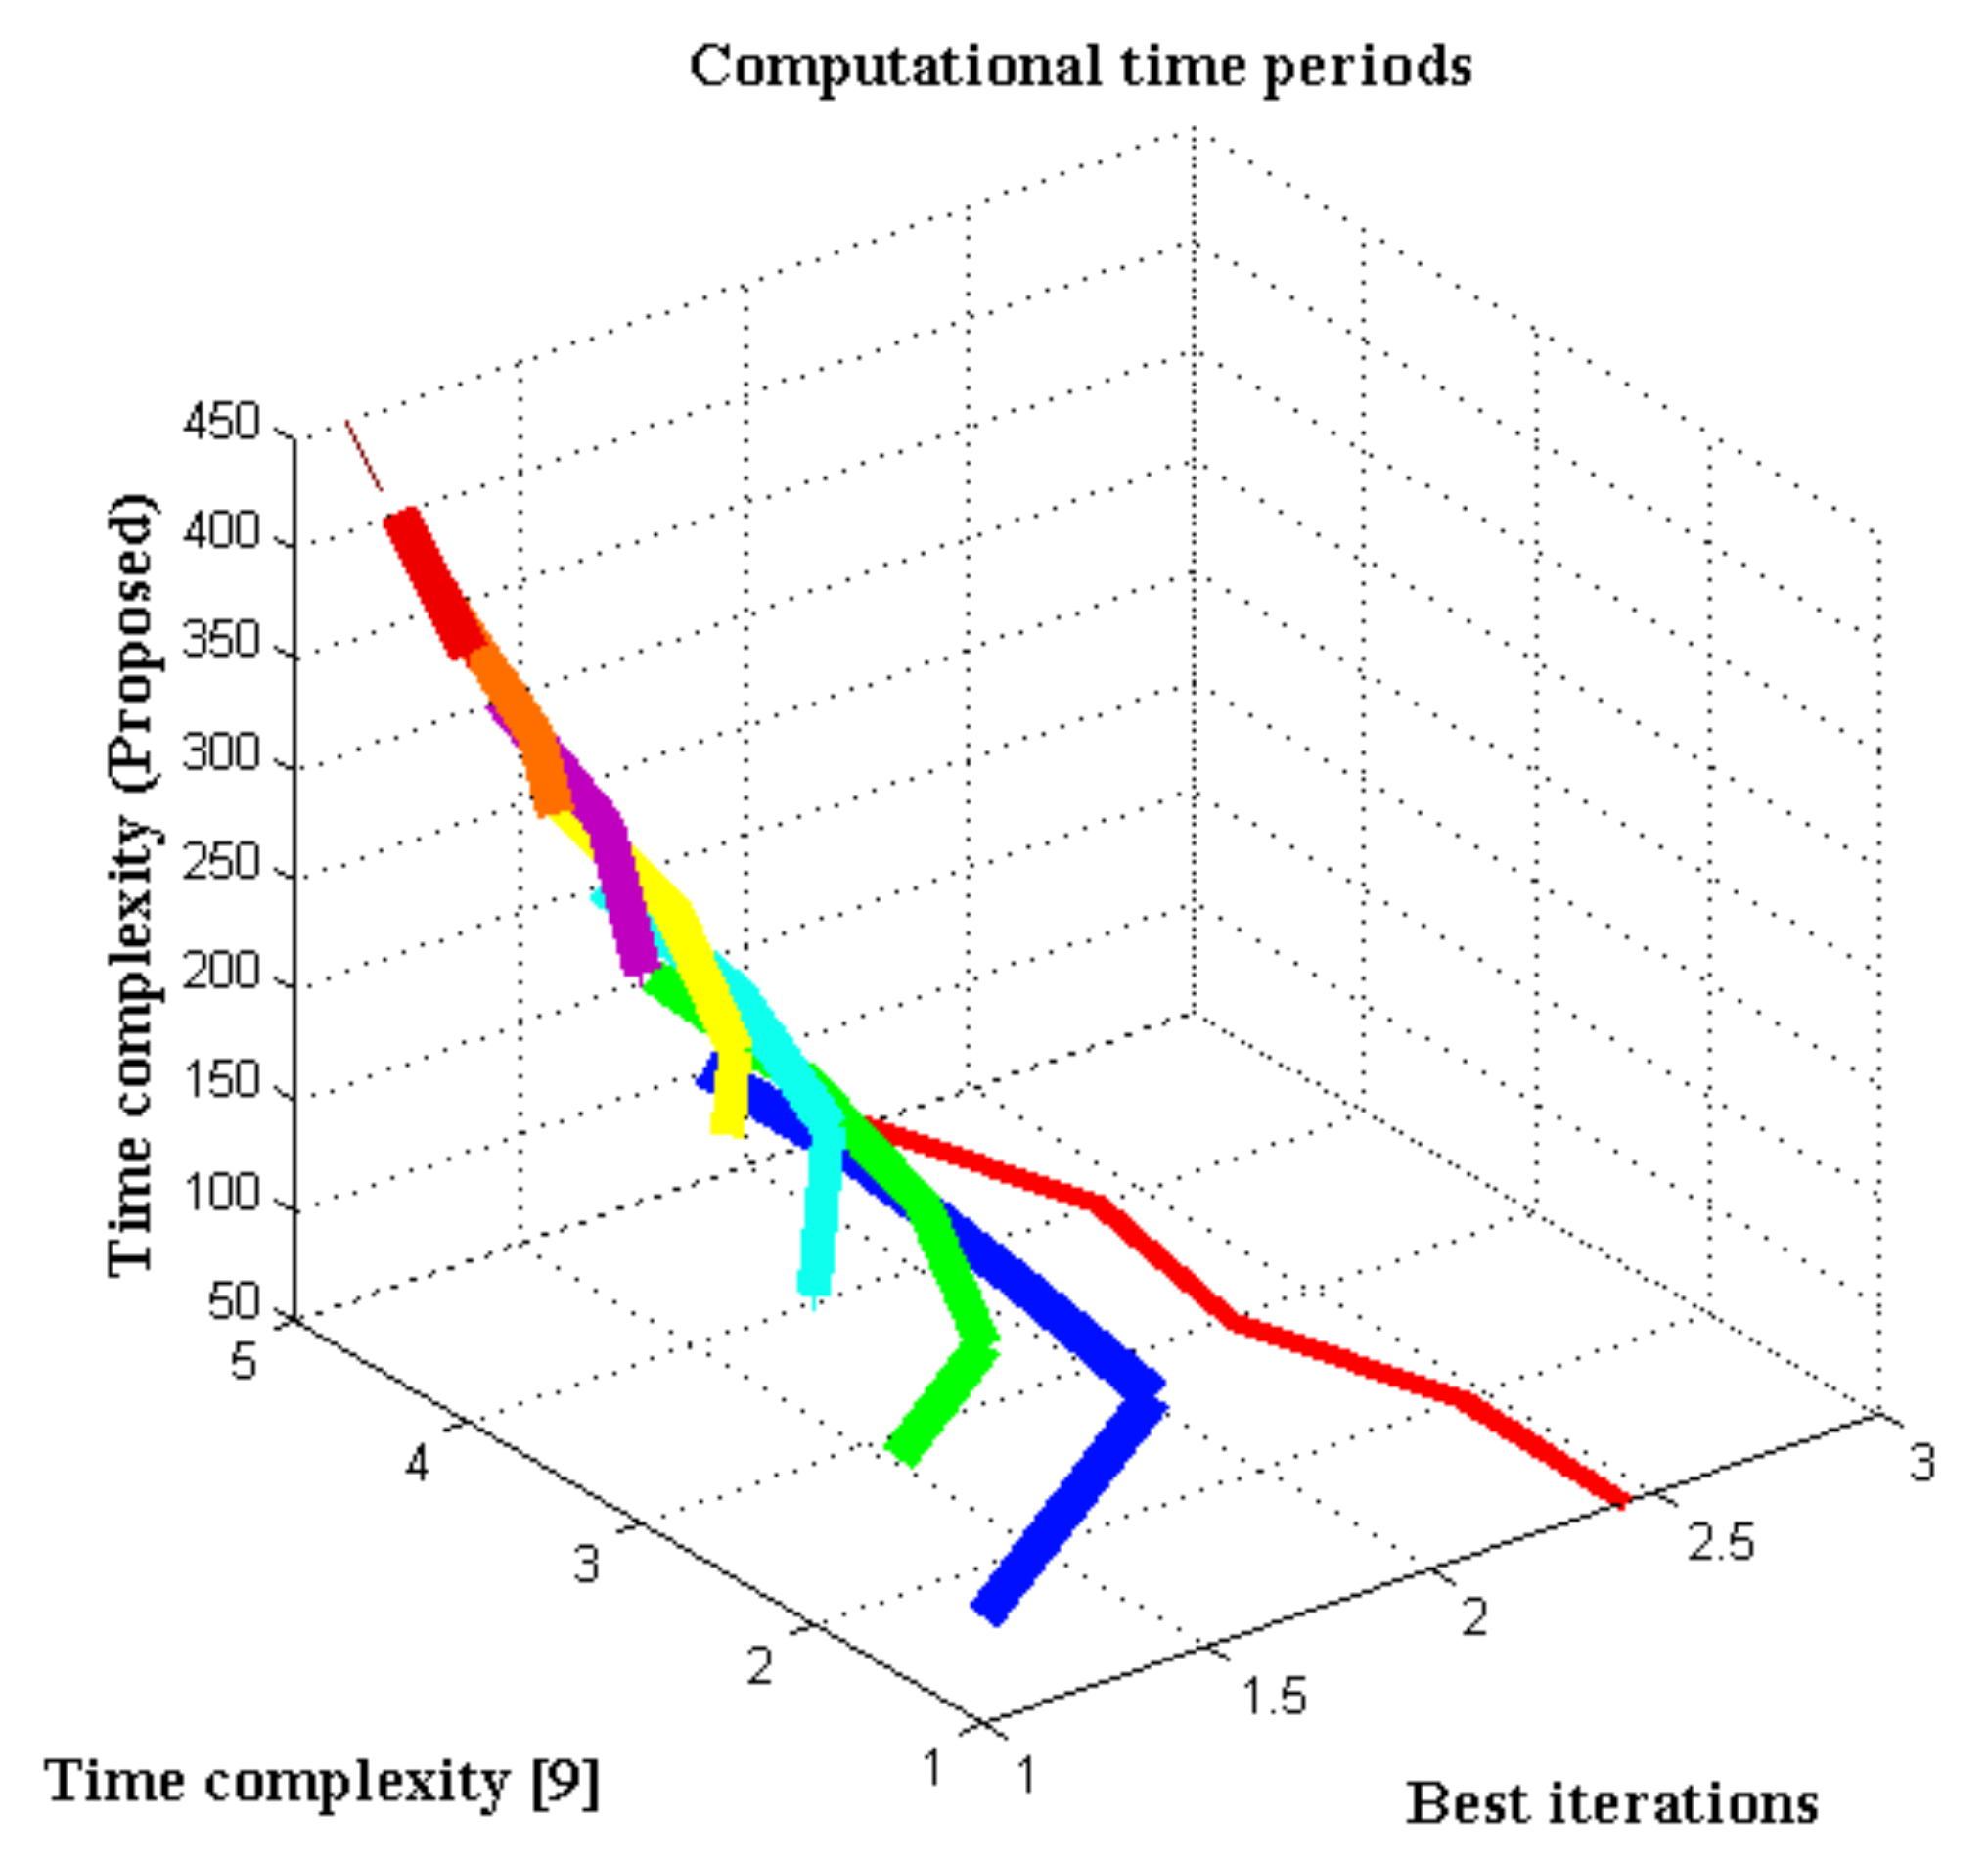
From
Figure 5 and
Table 4, it can be perceived that, if the errors are present at one side of the plot, it will be propagated through all distinct directions. The simulation plot is represented with a number of iterations, and for each variation, the total loss in the system is calculated. The major reason for plotting the number of iterations is that the expected output will be compared with achieved fuzzy set outputs, and if any variations are observed, then the error for that particular period will be indicated. Furthermore, at high state iterations, the proposed method achieved zero loss conditions, as compared to the existing method [
6,
15], which is plotted without comparison, as data from other systems cannot be measured. In addition, the loss function can also be measured by using prediction values, but negative values in the biomedical systems are negligible if it falls below the value of 1. The loss values that are mentioned in
Table 4 were calculated by using an analytical equation that was designed by using Equation (12). At the first stage, the database signals that are given in
Table 1 and number of original signals are compared, thereafter providing the angular square function of transmitting signals.
In this scenario, the correlation of fuzzy signals is detected to represent the individual signals with a set of coefficient matrices. This type of correlation is applied in biomedical signals at both the transmission and reception stage, where the delays of the signals are measured. If the delay of a signal at transmission is high, then the coefficient matrix will have high cross-correlation, whereas, if the delay is less, then the correlation of signals can also be reduced. If the receiver is considered, the delay should be much less, as the data-mining process is handled at the receiver section for the fuzzy interpolation set. To have a low correlation matrix, intermediate rules are defined in the data set by using different scaling factors and a low sampling rate. Furthermore, for defining the matrix type, two different constant terms are indicated with distances from sub-points where membership function can be established. Using the defined function, the link that exists with different signals can be easily modified, and correct linking periods can be measured. The corrected linking periods are plotted in
Figure 6.
From
Figure 6 and
Table 5, it can be detected that the correlation points of the fuzzy sets for biomedical signals provide good representation points for the projected system model, whereas an average set of points is obtained in existing models [
6,
15], as the intersection of membership functions are not defined. In the simulation point, the input values are changed from 0.1 to 0.5, and for each point, membership correlation is checked. During the initial period, the correlation is below the value of 1, whereas, after setting the input values to 0.3, the membership of the proposed fuzzy set crossed 1, and it is defined as an intermediate correlation set. However, for existing models, the correlation is much higher, and the signal rate, in this case, will be maximized, thus leading to a high state of power consumption. Conversely, at the final input stage, the proposed method provides only 1.5 values of parallel association between input and output links.
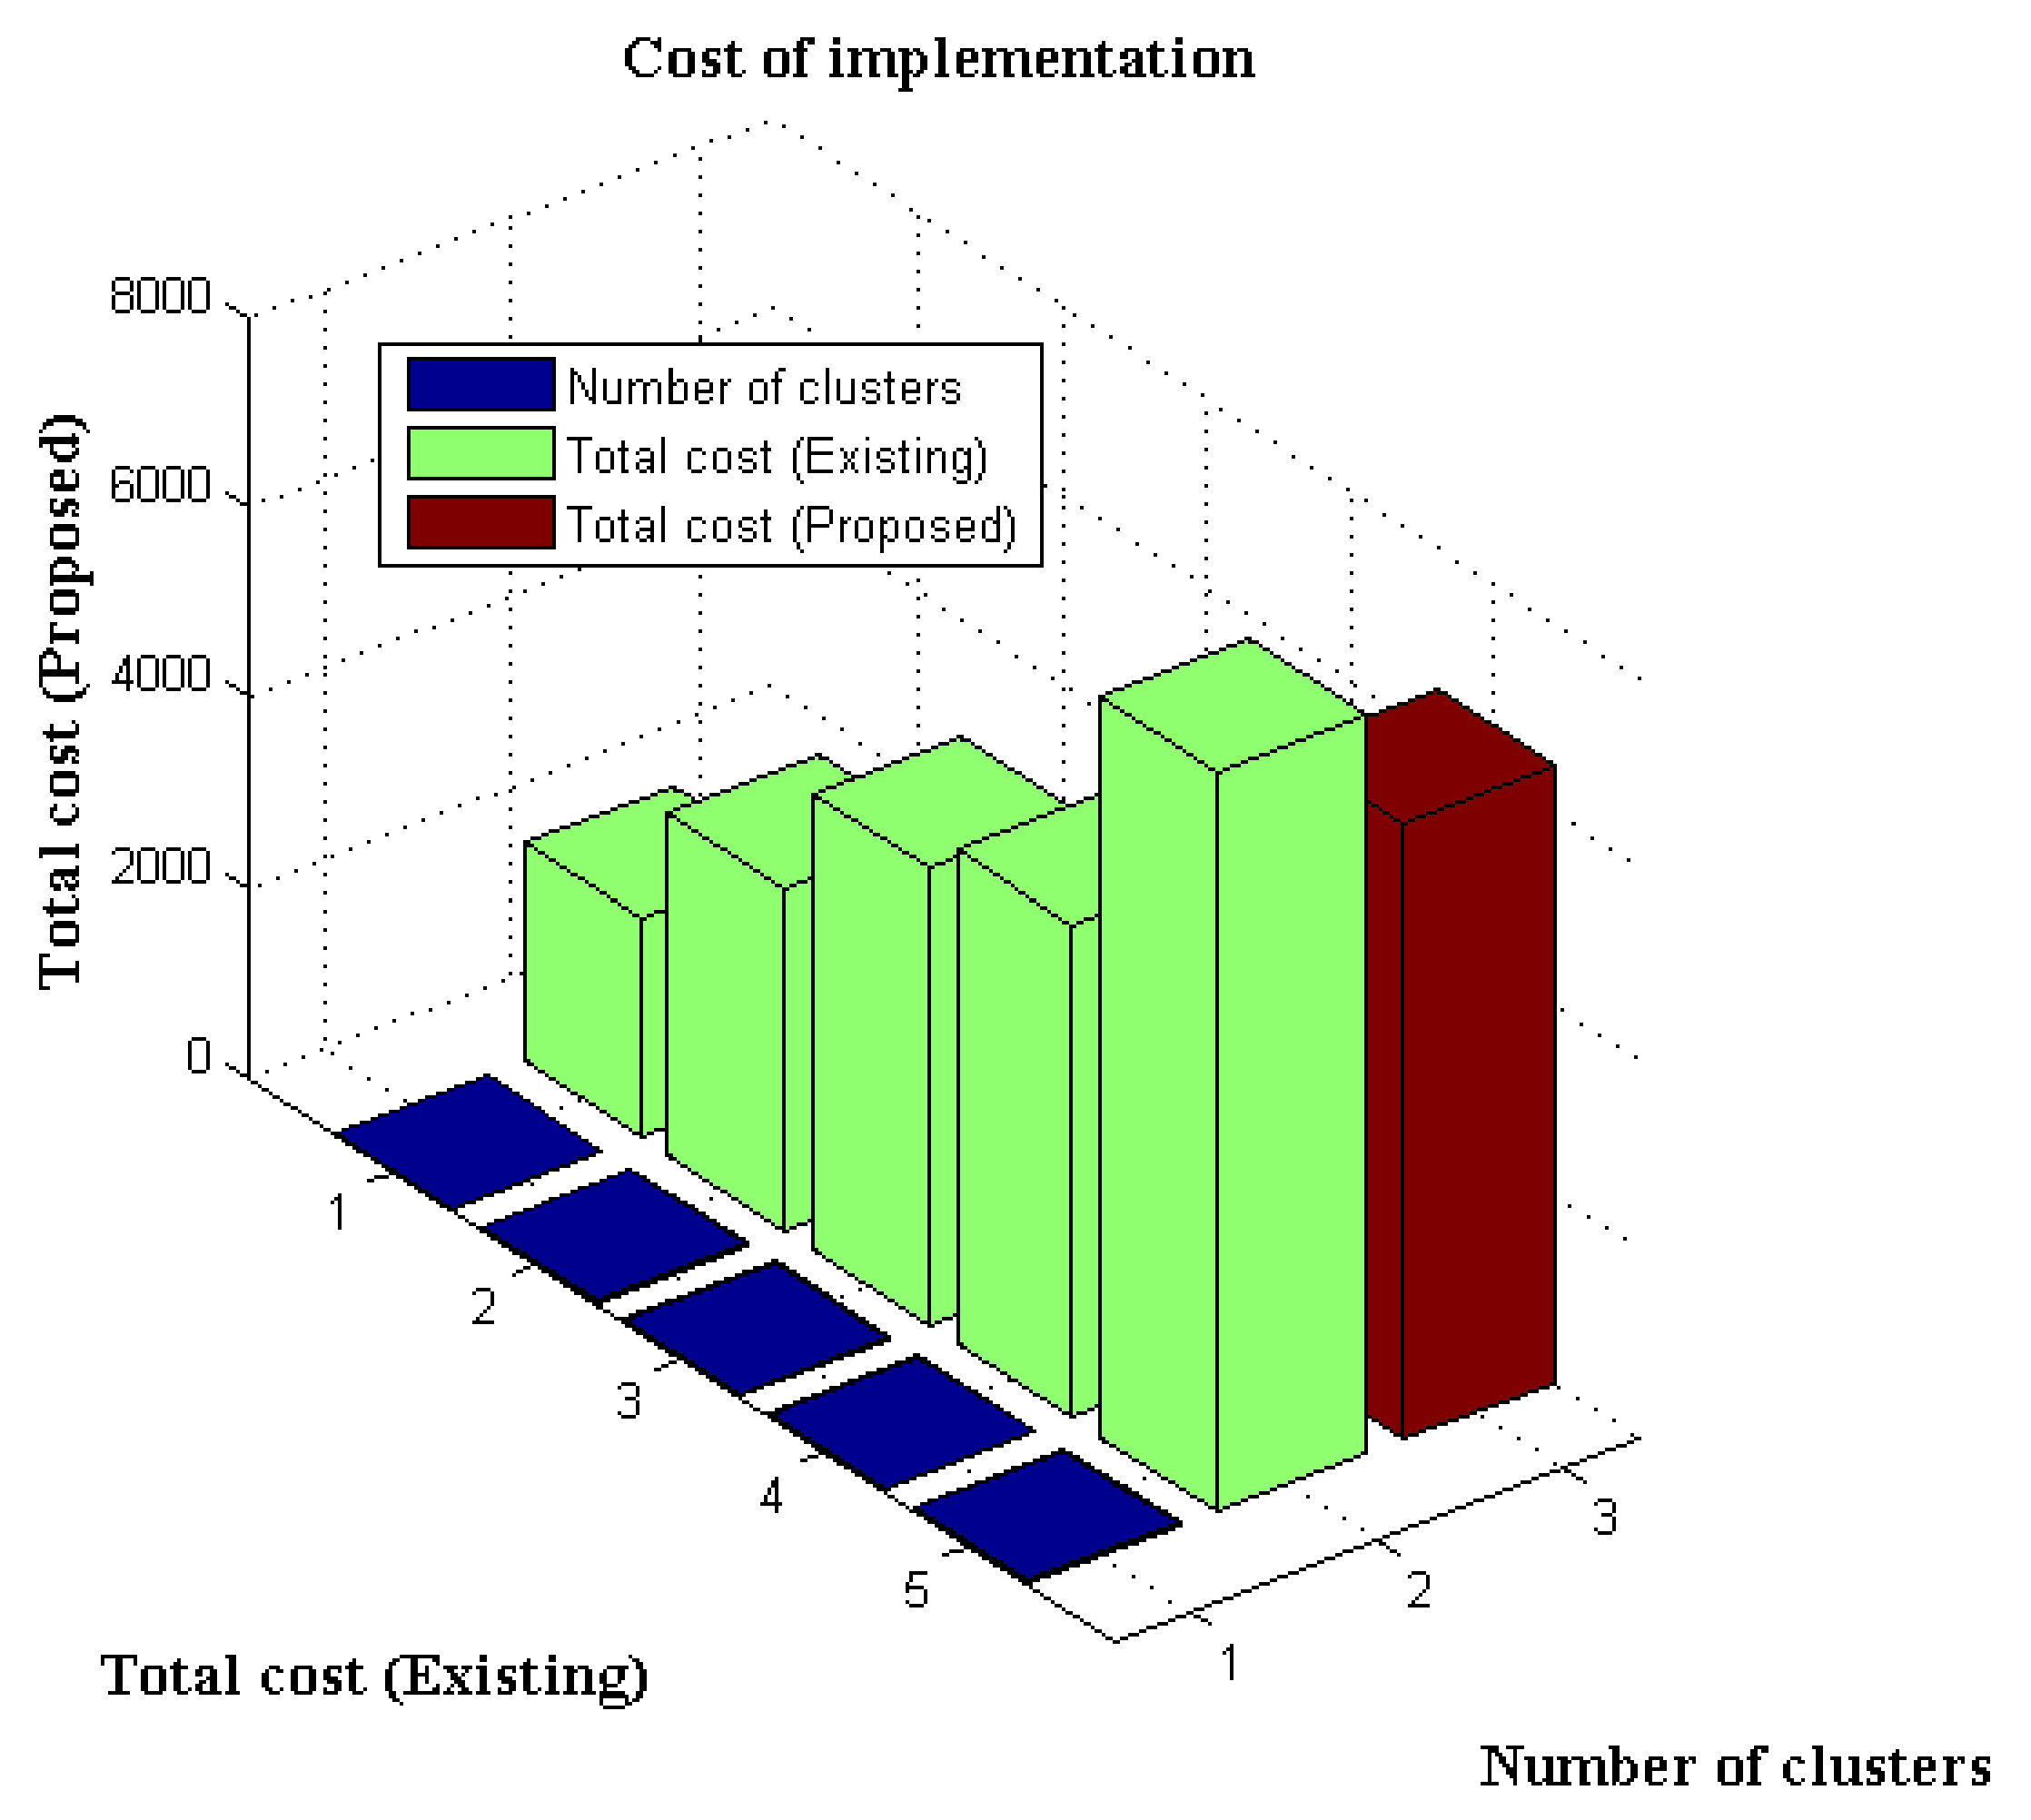
In this scenario, the cost of the data-management system is calculated for managing a large volume of data. In Hadoop systems, the size of the physical infrastructure is much higher as compared to other systems; therefore, the cost of variation directly depends on the system. The basic cost of both the hardware and software specifications in the Hadoop system varies from 1000 dollars, whereas it increases for every technological standpoint. However, in the proposed system, the biomedical signals are transmitted inside the designed Hadoop infrastructure, and the clusters of Hadoop will transfer the connection to external pathways. Therefore, the total cost of installation is calculated with a number of clusters, sensors for signal transmission, and reception with Hadoop infrastructures. Furthermore, there is a need to store the data signals, as the information is necessary for the future; hence, the cost of a single disk management system is also added as an integration cost. The total cost of the designed system is simulated in
Figure 7.
From
Figure 7 and
Table 6, it can be observed that the setup cost is plotted for both the existing [
6,
15] and proposed method. In this comparison, the case number of clusters is varied, thus increasing the cost of implementation from initial to last state. Consequently, the proposed method implements much lower cost as compared to the existing method, for which, in the initial demonstration state, the process building cost only 1000 dollars. Then, updating with a greater number of clusters added extra cost with beneficial systems to the public, varying up to 6500 dollars. Under the same circumstances, the existing method adds a total cost of 7800 dollars, which is much higher due to the surplus infrastructure in the integration process.


 ,
, 


