
Evaluation of Proton-Induced Biomolecular Changes in MCF-10A Breast Cells by Means of FT-IR Microspectroscopy

 ,
,  , , , , , , , and
Abstract
:1. Introduction
2. Materials and Methods
2.1. Cell Culture
2.2. Cell Irradiation and Fixation
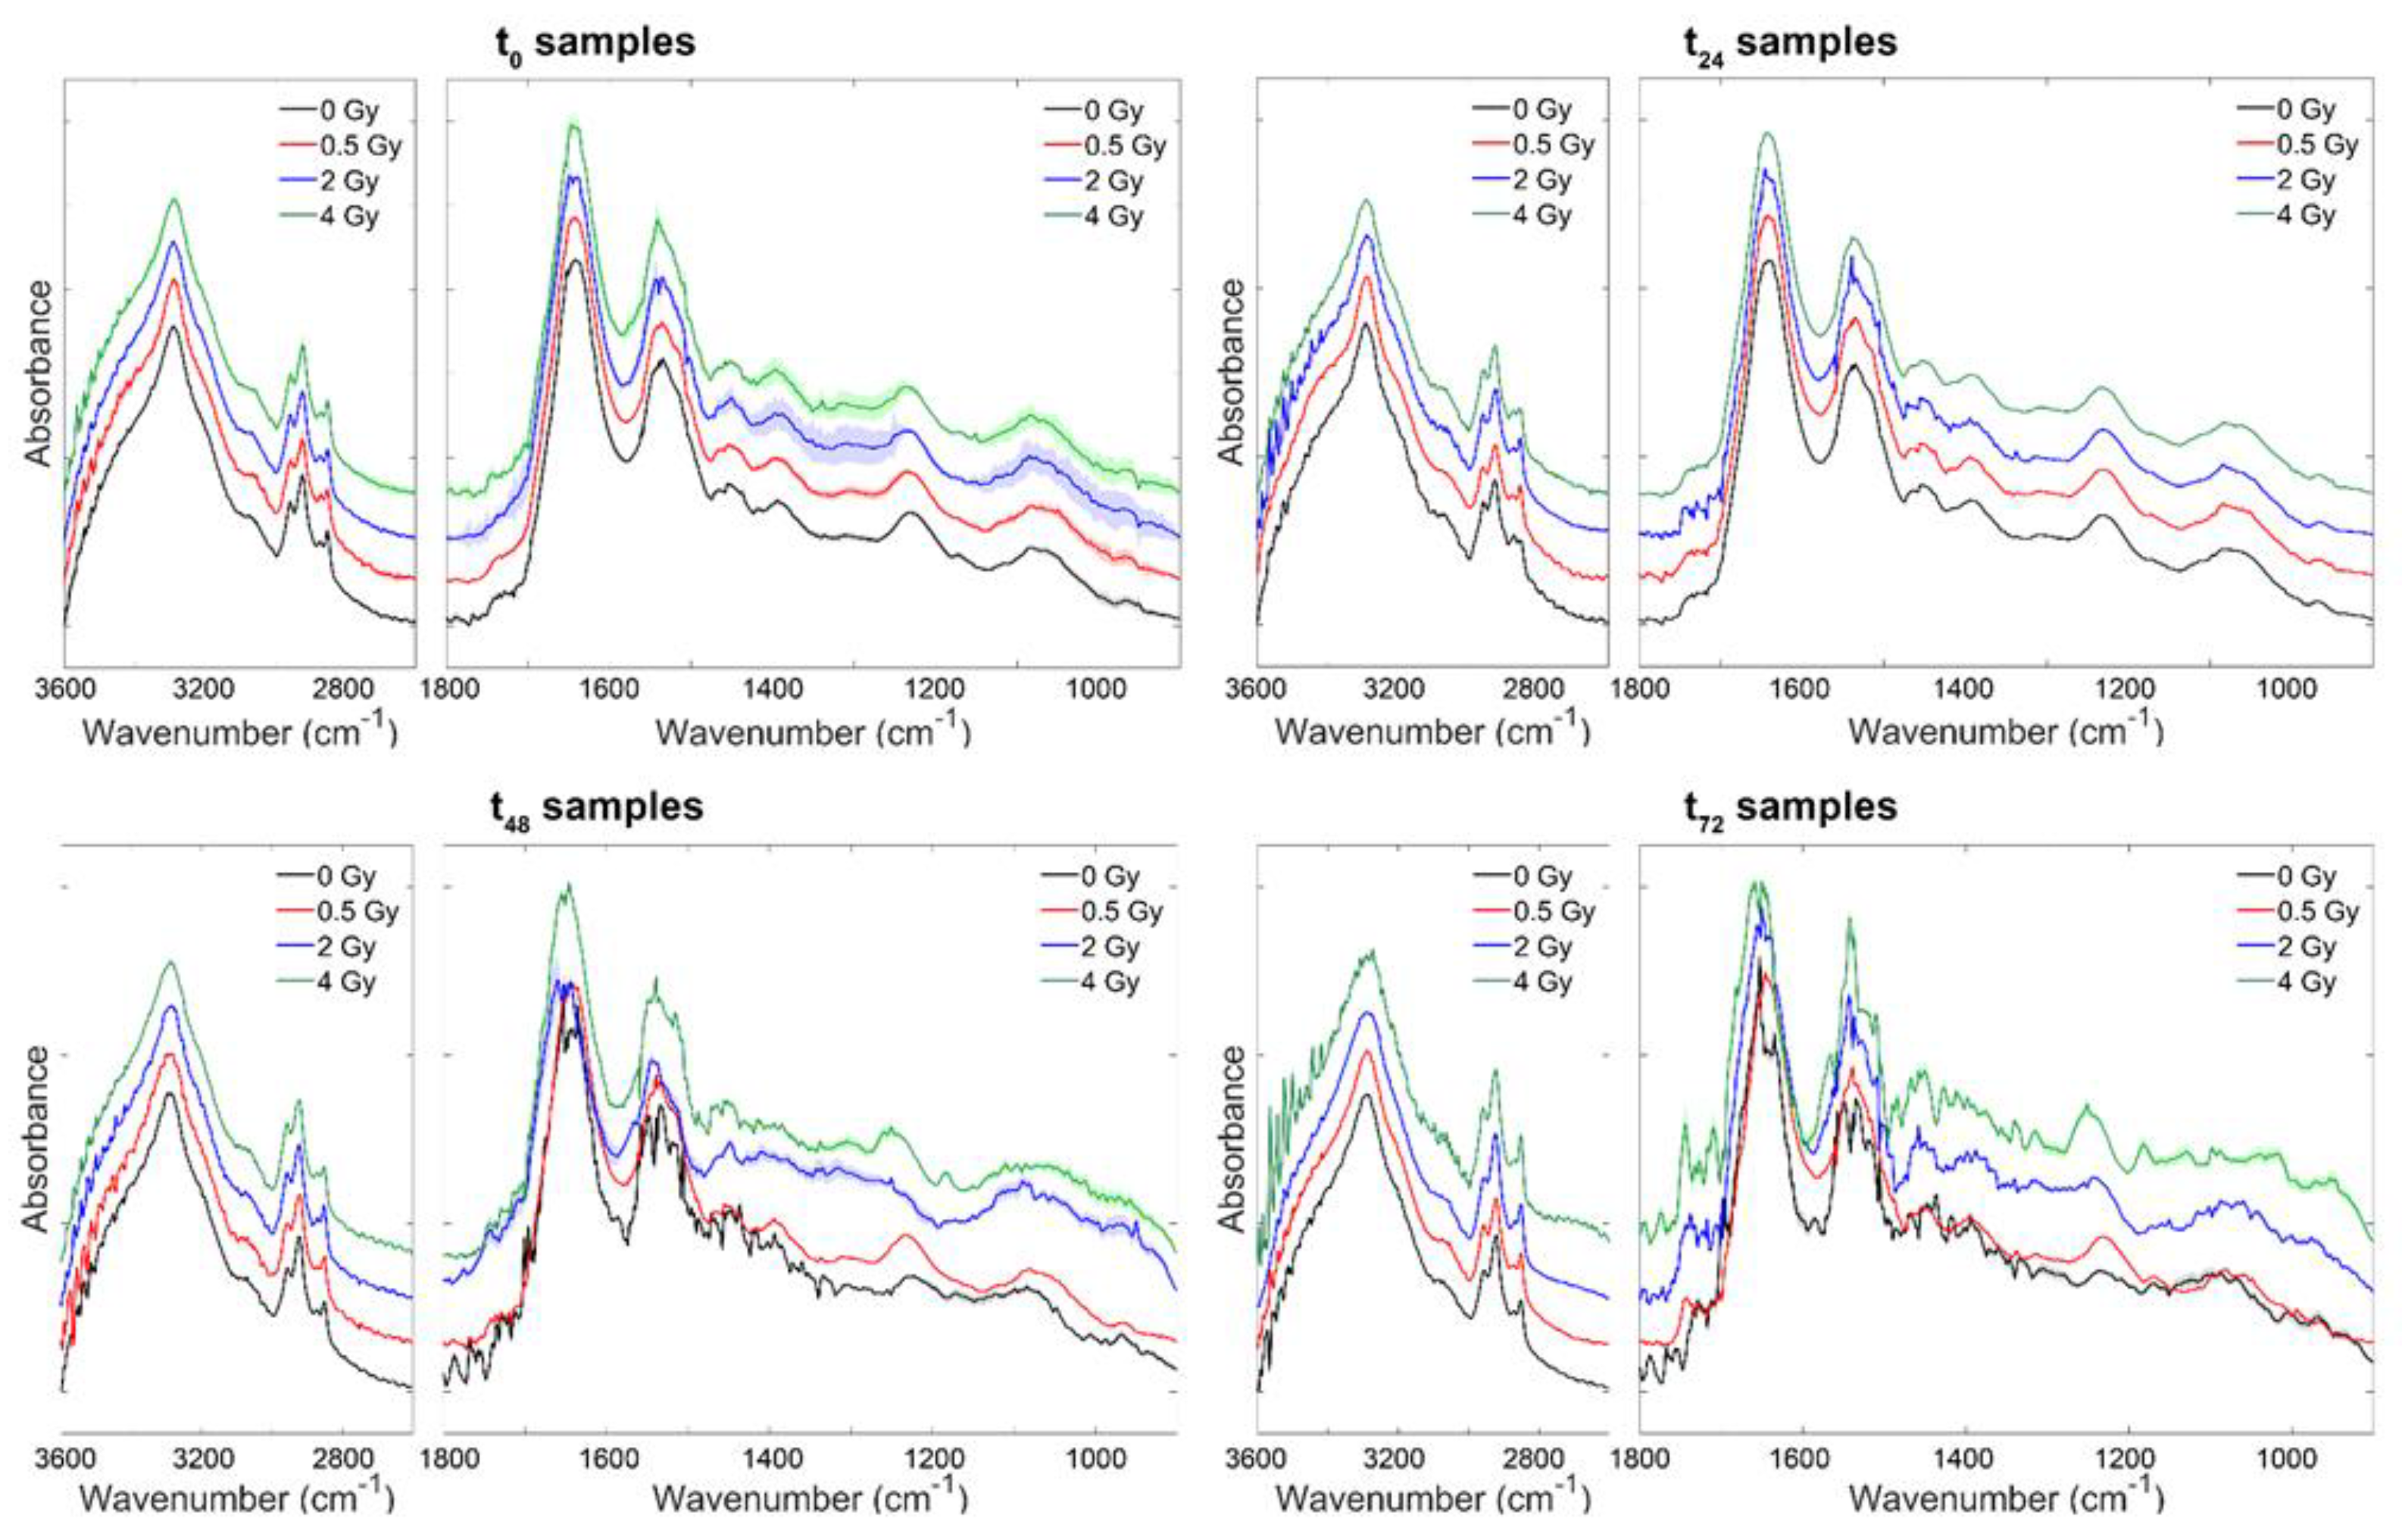
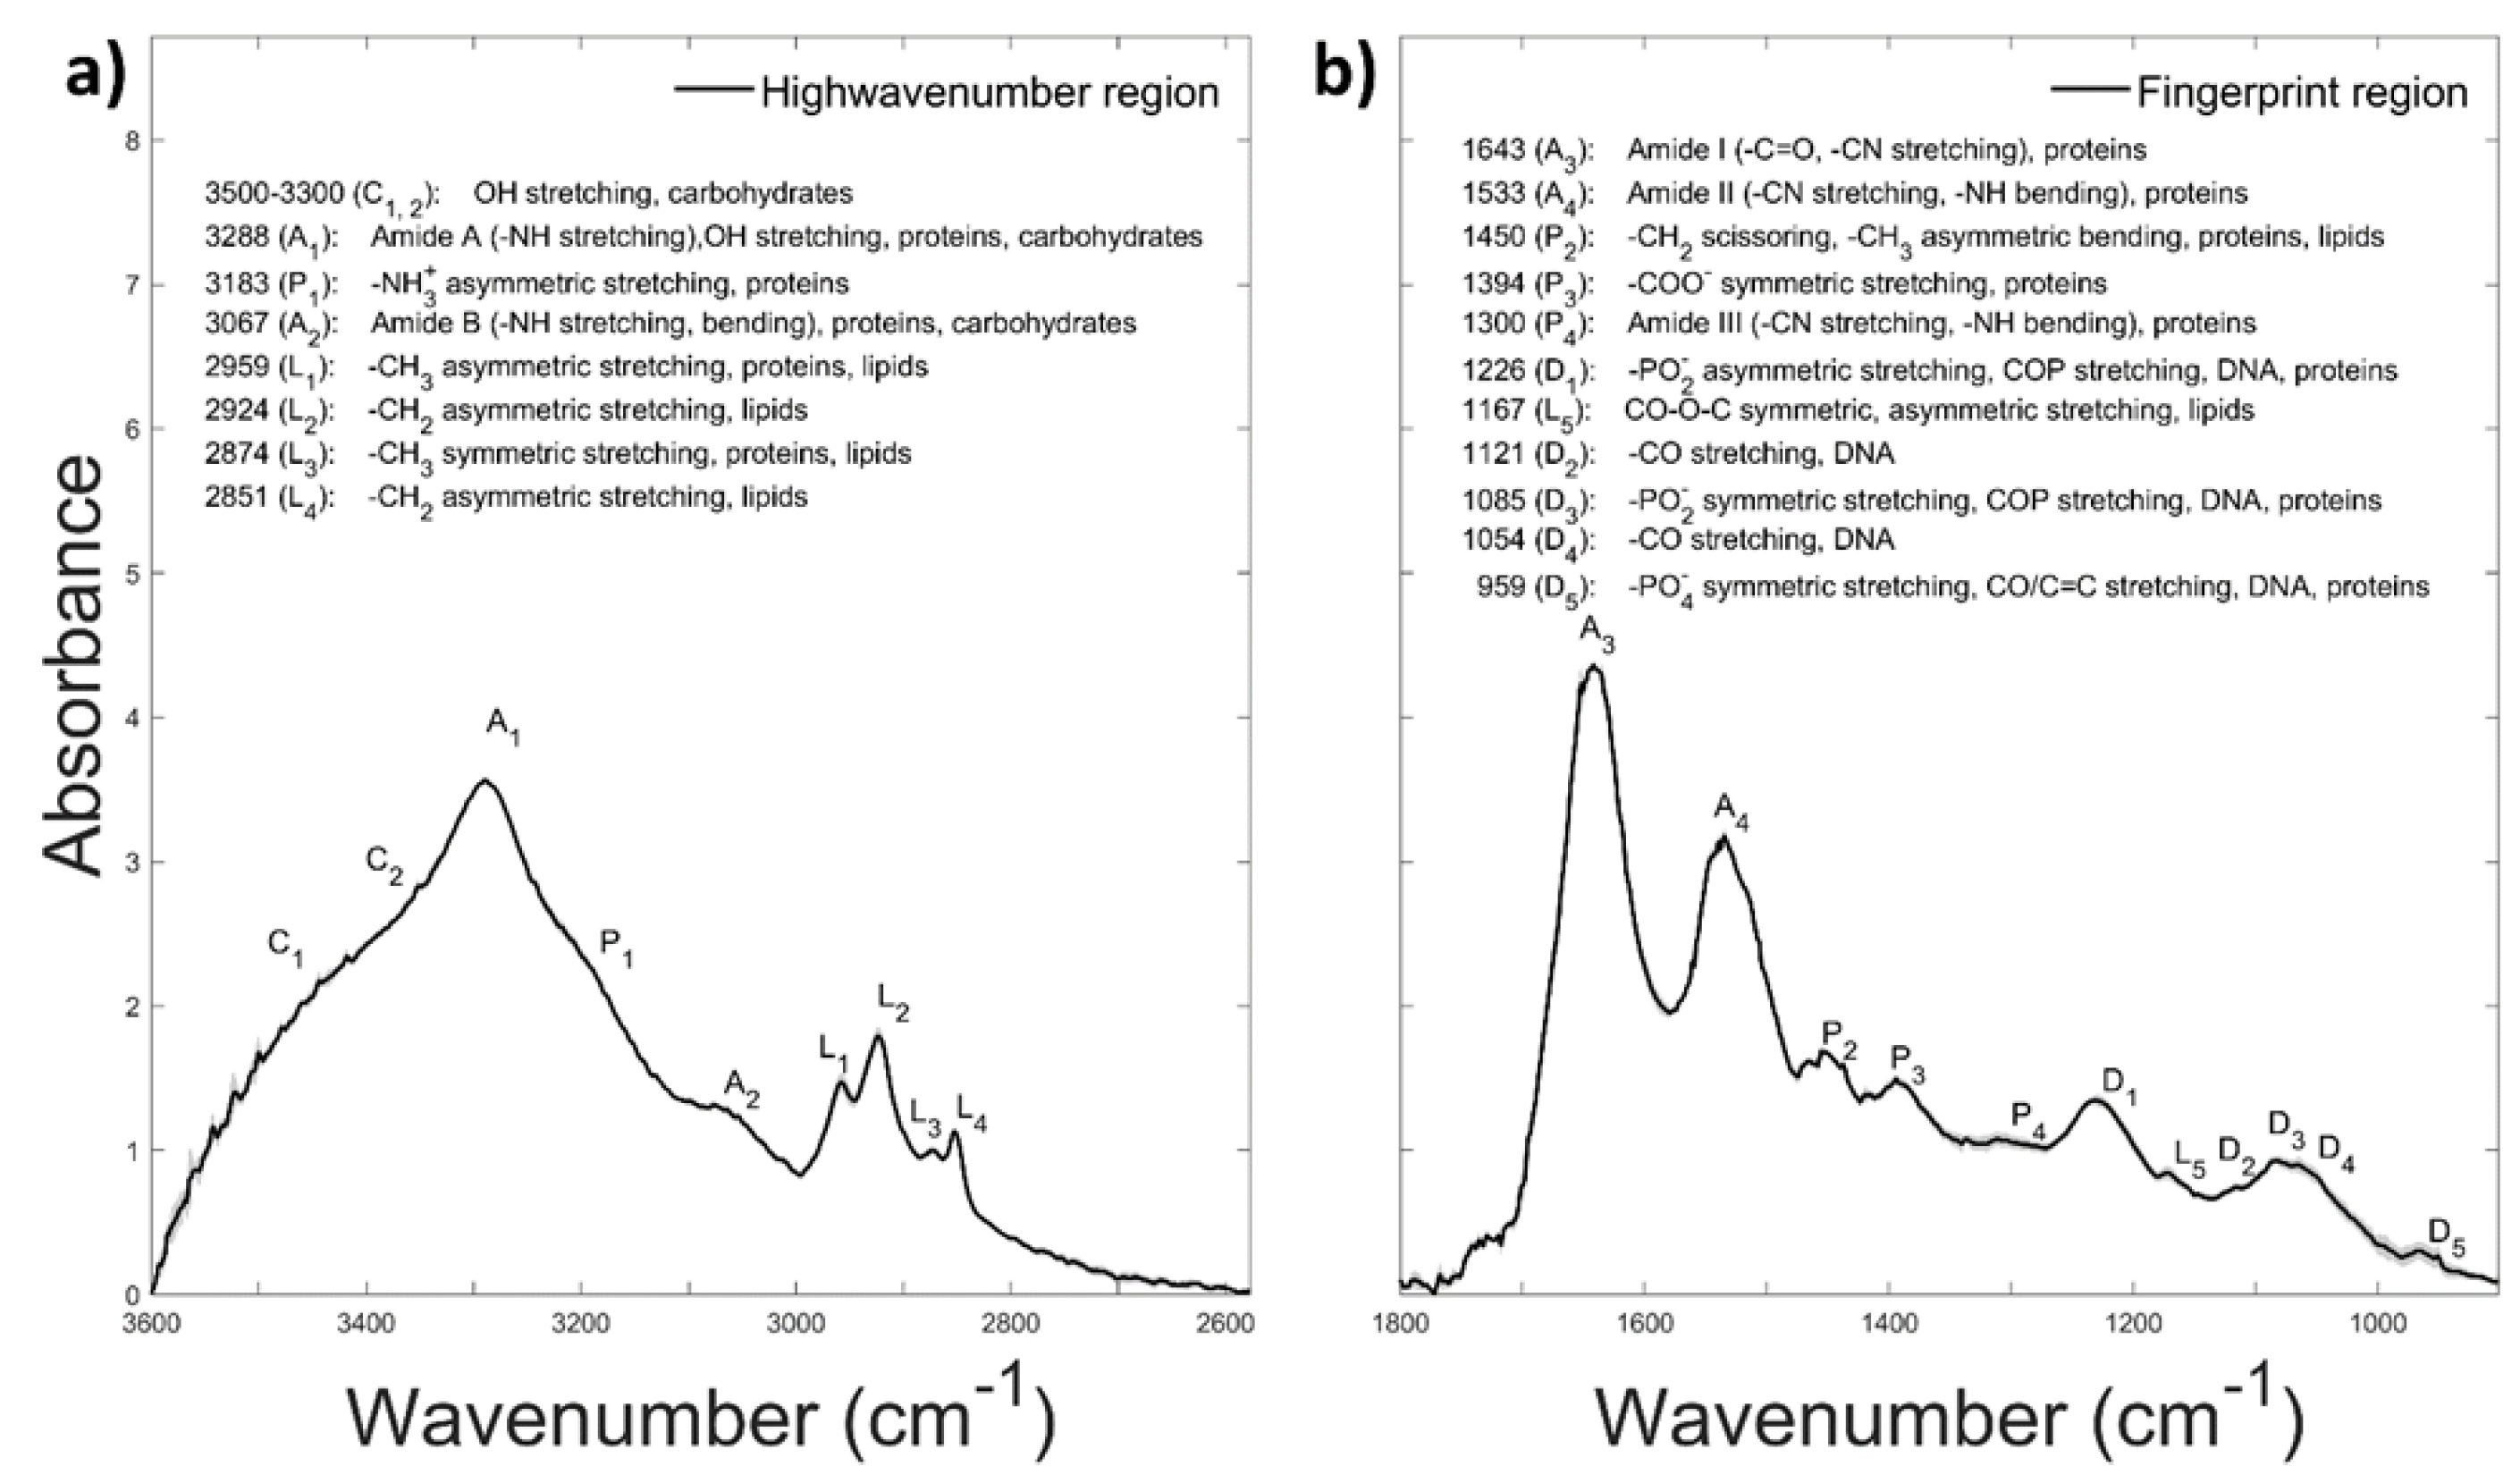
2.3. FT-IR Spectra Measurements
2.4. Data Analysis
3. Results and Discussion
4. Conclusions
Supplementary Materials
Author Contributions
Funding
Institutional Review Board Statement
Informed Consent Statement
Data Availability Statement
Conflicts of Interest
References
- Qu, Y.; Han, B.; Yu, Y.; Yao, W.; Bose, S.; Karlan, B.Y.; Giuliano, A.E.; Cui, X. Evaluation of MCF10A as a Reliable Model for Normal Human Mammary Epithelial Cells. PLoS ONE 2015, 10, e0131285. [Google Scholar] [CrossRef] [Green Version]
- Soule, H.D.; Maloney, T.M.; Wolman, S.R.; Peterson, W.D., Jr.; Brenz, R.; McGrath, C.M.; Russo, J.; Pauley, R.J.; Jones, R.F.; Brooks, S.C. Isolation and characterization of a spontaneously immortalized human breast epithelial cell line, MCF-10. Cancer Res. 1990, 50, 6075–6086. [Google Scholar] [PubMed]
- Debnath, J.; Mills, K.R.; Collins, N.L.; Reginato, M.J.; Muthuswamy, S.K.; Brugge, J.S. The role of apoptosis in creating and maintaining luminal space within normal and oncogene-expressing mammary acini. Cell 2002, 111, 29–40. [Google Scholar] [CrossRef] [Green Version]
- Chimal-Ramirez, G.K.; Espinoza-Sánchez, N.A.; Utrera-Barillas, D.; Benítez-Bribiesca, L.; Velázquez, J.R.; Arriaga-Pizano, L.A.; Monroy-García, A.; Reyes-Maldonado, E.; Domínguez-López, M.L.; Piña-Sánchez, P.; et al. MMP1, MMP9, and COX2 expressions in promonocytes are induced by breast cancer cells and correlate with collagen degradation, transformation-like morphological changes in MCF-10A acini, and tumor aggressiveness. BioMed Res. Int. 2013, 2013, 279505. [Google Scholar] [CrossRef] [Green Version]
- Allen-Petersen, B.L.; Carter, C.J.; Ohm, A.M.; Reyland, M.E. Protein kinase Cdelta is required for ErbB2-driven mammary gland tumorigenesis and negatively correlates with prognosis in human breast cancer. Oncogene 2014, 33, 1306–1315. [Google Scholar] [CrossRef] [Green Version]
- Keller, P.J.; Lin, A.F.; Arendt, L.M.; Klebba, I.; Jones, A.D.; Rudnick, J.A.; DiMeo, T.A.; Gilmore, H.; Jefferson, D.M.; Graham, R.A.; et al. Mapping the cellular and molecular heterogeneity of normal and malignant breast tissues and cultured cell lines. Breast Cancer Res. 2010, 12, R87. [Google Scholar] [CrossRef] [PubMed] [Green Version]
- Jung, N.; Maguer-Satta, V.; Guyot, B. Early Steps of mammary stem cell transformation by exogenous signals; effects of bisphenol endocrine disrupting chemicals and bone morphogenetic proteins. Cancers 2019, 11, 1351. [Google Scholar] [CrossRef] [Green Version]
- Bravatà, V.; Minafra, L.; Cammarata, F.P.; Pisciotta, P.; Lamia, D.; Marchese, V.; Petringa, G.; Manti, L.; Cirrone, G.A.P.; Gilardi, M.C.; et al. Gene expression profiling of breast cancer cell lines treated with proton and electron radiations. Br. J. Radiol. 2018, 91, 20170934. [Google Scholar] [CrossRef]
- Cammarata, F.P.; Bravatà, V.; Minafra, L.; Pisciotta, P.; Musso, R.; Pucci, G.; Scazzone, C.; Manti, L.; Militello, C.; Petringa, G.; et al. Breast cancer cells treated with proton beam: Immunological features and gene signatures. Il Nuovo Cimento 2018, 6, 202–207. [Google Scholar]
- Bravatà, V.; Cammarata, F.P.; Minafra, L.; Pisciotta, P.; Scazzone, C.; Manti, L.; Savoca, G.; Petringa, G.; Cirrone, G.A.P.; Cuttone, G.; et al. Proton-irradiated breast cells: Molecular points of view. J. Radiat. Res. 2019, 60, 451–465. [Google Scholar] [CrossRef]
- Juerß, D.; Zwar, M.; Giesen, U.; Nolte, R.; Kriesen, S.; Baiocco, G.; Puchalska, M.; van Goethem, M.J.; Manda, K.; Hildebrandt, G. Comparative study of the effects of different radiation qualities on normal human breast cells. Radiat. Oncol. 2017, 12, 159. [Google Scholar] [CrossRef] [PubMed] [Green Version]
- Bláha, P.; Feoli, C.; Agosteo, S.; Calvaruso, M.; Cammarata, F.P.; Catalano, R.; Ciocca, M.; Cirrone, G.A.P.; Conte, V.; Cuttone, G.; et al. The proton-boron reaction increases the radiobiological effectiveness of clinical low- and high-energy proton beams: Novel experimental evidence and perspectives. Front. Oncol. 2021, 11, 682647. [Google Scholar] [CrossRef] [PubMed]
- Manti, L.; Perozziello, F.M.; Borghesi, M.; Candiano, G.; Chaudhary, P.; Cirrone, G.A.P.; Doria, D.; Gwynne, D.; Leanza, R.; Prise, K.M.; et al. The radiobiology of laser-driven particle beams: Focus on sub-lethal responses of normal human cells. J. Instrum. 2017, 12, C03084. [Google Scholar] [CrossRef] [Green Version]
- Lundkvist, J.; Ekman, M.; Ericsson, S.R.; Isacsson, U.; Jonsson, B.; Glimelius, B. Economic evaluation of proton radiation therapy in the treatment of breast cancer. Radiother. Oncol. 2005, 75, 179–185. [Google Scholar] [CrossRef] [PubMed]
- Cuaron, J.J.; MacDonald, S.M.; Cahlon, O. Novel applications of proton therapy in breast carcinoma. Chin. Clin. Oncol. 2016, 5, 52–58. [Google Scholar] [CrossRef] [PubMed] [Green Version]
- Peters, L.J. The ESTRO Regaud lecture. Inherent radiosensitivity of tumor and normal tissue cells as a predictor of human tumor response. Radiother. Oncol. 1990, 17, 177–190. [Google Scholar] [CrossRef]
- Oike, T.; Komatsu, S.; Komatsu, Y.; Nachankar, A.; Darwis, N.D.M.; Shibata, A.; Ohno, T. Reporting of methodologies used for clonogenic assays to determine radiosensitivity. J. Rad. Res. 2020, 6, 828–883. [Google Scholar] [CrossRef]
- Meade, A.; Clarke, C.; Byrne, H.; Lyng, F. Fourier transform infrared microspectroscopy and multivariate methods for radiobiological dosimetry. Radiat. Res. 2010, 173, 225–237. [Google Scholar] [CrossRef] [PubMed]
- Gault, N.; Rigaud, O.; Poncy, J.L.; Lefaix, J.L. Infrared microspectroscopy study of γ-irradiated and H2O2-treated human cells. Int. J. Radiat. Biol. 2005, 81, 767–779. [Google Scholar] [CrossRef]
- Matthews, Q.; Brolo, A.; Lum, J.; Duan, X.; Jirasek, A. Raman spectroscopy of single human tumour cellsexposed to ionizing radiation in vivo. Phys. Med. Biol. 2011, 56, 19–38. [Google Scholar] [CrossRef] [Green Version]
- Lipiec, E.; Kowalska, J.; Lekki, J.; Wiechec, A.; Kwiatek, W.M. FT-IR Microspectroscopy in Studies of DNA Damage Induced by Proton Microbeam in Single PC-3 Cells. Acta Phys. Pol. A 2012, 121, 506–509. [Google Scholar] [CrossRef]
- Lipiec, E.; Birarda, G.; Kowalska, J.; Lekki, J.; Vaccari, L.; Wiecheć, A.; Wood, B.R.; Kwiatek, W.M. A new approach to studying the effects of ionising radiation on single cells using FT-IR synchrotron microspectroscopy. Radiat. Phys. Chem. 2013, 93, 135–141. [Google Scholar] [CrossRef]
- Lipiec, E.; Bambery, K.R.; Heraud, P.; Hirschmugl, C.; Lekki, J.; Kwiatek, W.M.; Tobin, M.J.; Vogel, C.; Whelan, D.; Wood, B.R. Synchrotron FT-IR shows evidence of DNA damage and lipid accumulation in prostate adenocarcinoma PC-3 cells following proton irradiation. J. Mol. Struct. 2014, 1073, 134–141. [Google Scholar] [CrossRef]
- Ricciardi, V.; Portaccio, M.; Perna, G.; Lasalvia, M.; Capozzi, V.; Cammarata, F.P.; Pisciotta, P.; Petringa, G.; Delfino, I.; Manti, L.; et al. FT-IR transflection micro-spectroscopy study on normal human breast cells after exposure to a proton beam. Appl. Sci. 2021, 11, 540. [Google Scholar] [CrossRef]
- Kim, B.; Bae, H.; Lee, H.; Lee, S.; Park, J.C.; Kim, K.R.; Kim, S.J. Proton beams inhibit proliferation of breast cancer cells by altering DNA methylation status. J. Cancer 2016, 7, 344–352. [Google Scholar] [CrossRef] [Green Version]
- Du Plessis, P.C. Variations in Radiosensitivity of Breast Cancer and Normal Breast Cell Lines Using a 200MeV Clinical Proton Beam. Master’s Thesis, Faculty of Health and Wellness Sciences, Cape Peninsula University of Technology, Cape Town, South Africa, 2018. Available online: http://etd.cput.ac.za/handle/20.500.11838/2970 (accessed on 2 February 2021).
- Lasalvia, M.; Perna, G.; Pisciotta, P.; Cammarata, F.P.; Manti, L.; Capozzi, V. Raman spectroscopy for the evaluation of the radiobiological sensitivity of normal human breast cells at different time points after irradiation by a clinical proton beam. Analyst 2019, 144, 2097–2108. [Google Scholar] [CrossRef]
- Kumar, S.; Verma, T.; Mukherjee, R.; Ariese, F.; Somasundaram, K.; Umapathy, S. Raman and infra-red microspectroscopy: Towards quantitative evaluation for clinical research by ratiometric analysis. Chem. Soc. Rev. 2016, 45, 1879–1900. [Google Scholar] [CrossRef] [PubMed]
- Liu, H.; Su, Q.; Sheng, D.; Zheng, W.; Wang, X. Comparison of red blood cells from gastric cancer patients and healthy persons using FTIR spectroscopy. J. Mol. Struct. 2017, 1130, 33–37. [Google Scholar] [CrossRef]
- Kar, S.; Katti, D.R.; Katti, K.S. Fourier transform infrared spectroscopy based spectral biomarkers of metastasized breast cancer progression. Spectrochim Acta A Mol. Biomol. Spectrosc. 2019, 208, 85–96. [Google Scholar] [CrossRef] [PubMed]
- Bel’skaya, L.V. Use of IR spectroscopy in cancer diagnosis. A review. J. Appl. Spectrosc. 2019, 86, 187–205. [Google Scholar] [CrossRef]
- Ricciardi, V.; Portaccio, M.; Manti, L.; Lepore, M. An FT-IR microspectroscopy ratiometric approach for monitoring X-ray irradiation effects on SH-SY5Y human neuroblastoma cells. Appl. Sci. 2020, 10, 2974. [Google Scholar] [CrossRef]
- Cirrone, G.A.P.; Cuttone, G.; Lojacono, P.A.; Lo Nigro, S.; Mongelli, V.; Patti, I.V.; Privitera, G.; Raffaele, L.; Rifuggiato, D.; Sabini, M.G.; et al. A 62-MeV proton beam for the treatment of ocular melanoma at Laboratori Nazionali del Sud-INFN. IEEE Trans. Nucl. Sci. 2004, 51, 3568–3662. [Google Scholar] [CrossRef]
- Bassan, P.; Byrne, H.J.; Bonnier, F.; Lee, J.; Dumas, P.; Gardner, P. Resonant Mie scattering in infrared spectroscopy of biological materials–understanding the ‘dispersion artefact’. Analyst 2009, 134, 1586–1593. [Google Scholar] [CrossRef] [PubMed]
- Bassan, P.; Kohler, A.; Martens, H.; Lee, J.; Byrne, H.J.; Dumas, P.; Gazi, E.; Brown, M.; Clarke, N.; Gardner, P. Resonant Mie scattering (RMieS) correction of infrared spectra from highly scattering biological samples. Analyst 2010, 135, 268–277. [Google Scholar] [CrossRef]
- Lasch, P. Spectral pre-processing for biomedical vibrational spectroscopy and microspectroscopic imaging. Chem. Intell. Lab. Syst. 2012, 117, 100–114. [Google Scholar] [CrossRef] [Green Version]
- Stancik, A.L.; Brauns, E.B. A simple asymmetric lineshape for fitting infrared absorption spectra. Vibr. Spectr. 2008, 47, 66–69. [Google Scholar] [CrossRef]
- Williams, B.W. Protein secondary structure analysis using Raman Amide I and Amide III spectra. Meth. Enzymol. 1986, 130, 311–331. [Google Scholar]
- Cai, S.; Singh, B.R. Identification of β-turn and random coil amide III infrared bands for secondary structure estimation of proteins. Biophys. Chem. 1999, 80, 7–20. [Google Scholar] [CrossRef]
- Mei, Y.; Miller, L.; Gao, W.; Gross, R.A. Imaging the distribution and secondary structure of immobilized enzymes using infrared microspectroscopy. Biomacromolecules 2003, 4, 70–74. [Google Scholar] [CrossRef]
- Coe, J.V.; Nystrom, S.V.; Chen, Z.; Li, R.; Verreault, D.; Hitchcock, C.L.; Allen, H.C. Extracting infrared spectra of protein secondary structures using a library of protein spectra, and the Ramachandran plot. J. Phys. Chem. B 2015, 119, 13079–13092. [Google Scholar] [CrossRef]
- Apple, S.; Pucci, R.; Lowe, A.C.; Shintaku, I.; Shapourifar-Tehrani, S.; Moatamed, N. The Effect of delay in fixation, different fixatives, and duration of fixation in estrogen and progesterone receptor results in breast carcinoma. Am. J. Clin. Pathol. 2011, 135, 592–598. [Google Scholar] [CrossRef]
- Van Seijen, M.; Brcic, L.; Gonzales, A.N.; Sansano, I.; Bendek, M.; Brcic, I.; Lissenberg-Witte, B.; Korkmaz, H.I.; Geiger, T.; Kammler, R.; et al. Impact of delayed and prolonged fixation on the evaluation of immunohistochemical staining on lung carcinoma resection specimen. Virchows Arch. 2019, 475, 191–199. [Google Scholar] [CrossRef] [PubMed] [Green Version]
- Yoshida, S.; Koike, K. Lipid and membrane dynamics in biological tissues—Infrared spectroscopic studies. Adv. Planar Lipid Bilayers Liposomes 2011, 13, 1–32. [Google Scholar]
- Sailer, K.; Viaggi, S.; Nusse, M. Radiation–induced structural modifications in dsDNA analysed by FT–Raman spectroscopy. Int. J. Radiat. Biol. 1996, 69, 601–613. [Google Scholar] [CrossRef] [PubMed]
- Delfino, I.; Portaccio, M.; Della Ventura, B.; Mita, D.G.; Lepore, M. Enzyme distribution and secondary structure of sol-gel immobilized glucose oxidase by micro-attenuated total reflection FT-IR spectroscopy. Mater. Sci. Eng. C 2013, 33, 304–310. [Google Scholar] [CrossRef]
- Gault, N.; Lefaix, J.L. Infrared microspectroscopic characteristics of radiation-induced apoptosis in human lymphocytes. Radiat. Res. 2003, 160, 238–250. [Google Scholar] [CrossRef]
- Gasparri, F.; Muzio, M. Monitoring of apoptosis of HL60 cells by Fourier-transform infrared spectroscopy. Biochem. J. 2003, 369, 239–248. [Google Scholar] [CrossRef] [Green Version]
- Delfino, I.; Perna, G.; Ricciardi, V.; Lasalvia, M.; Manti, L.; Capozzi, V.; Lepore, M. X-ray irradiation effects on nuclear and membrane regions of single SH-SY5Y human neuroblastoma cells investigated by Raman micro-spectroscopy. J. Pharm. Biomed. Anal. 2019, 164, 557–573. [Google Scholar] [CrossRef] [PubMed]
- Kuhar, N.; Sil, S.; Verma, T.; Umapathy, S. Challenges in application of Raman spectroscopy to biology and materials. RSC Adv. 2018, 8, 25888–25908. [Google Scholar] [CrossRef] [Green Version]
- Lipiec, E.; Wood, B.R.; Kulik, A.; Kwiatek, W.M.; Dietler, G. Nanoscale investigation into the cellular response of glioblastoma cells exposed to protons. Anal. Chem. 2018, 90, 7644–7650. [Google Scholar] [CrossRef]
- Dovbeshko, G.; Gridina, N.Y.; Kruglova, E.B.; Pashchuk, O.P. FT-IR Spectroscopy studies of nucleic acid damage. Talanta 2000, 53, 233–246. [Google Scholar] [CrossRef]
- Vileno, B.; Jeney, S.; Sienkiewicz, A.; Marcoux, P.R.; Miller, L.M.; Forró, L. Evidence of lipid peroxidation and protein phosphorylation in cells upon oxidative stress photo-generated by fullerols. Biophys. Chem. 2010, 152, 164–169. [Google Scholar] [CrossRef] [PubMed] [Green Version]
- Whelan, D.R.; Bambery, K.R.; Puskar, L.; McNaughton, D.; Wood, B.R. Quantification of DNA in simple eukaryotic cells using Fourier transform infrared spectroscopy. J. Biophotonics 2013, 6, 775–784. [Google Scholar] [CrossRef] [PubMed]
- Wood, B.R. The importance of hydration and DNA conformation in interpreting infrared spectra of cells and tissues. Chem. Soc. Rev. 2016, 45, 1980–1998. [Google Scholar] [CrossRef]
- Gault, N.; Rigaud, O.; Poncy, J.L.; Lefaix, J.L. Biochemical alterations in human cells irradiated with alpha particles delivered by macro- or microbeams. Radiat. Res. 2007, 167, 551–562. [Google Scholar] [CrossRef]
- Zelig, U.; Kapelushnik, J.; Moreh, R.; Mordechai, S.; Nathan, I. Diagnosis of cell death by means of infrared spectroscopy. Biophys. J. 2009, 97, 2107–2114. [Google Scholar] [CrossRef] [Green Version]
- Barth, A. Infrared spectroscopy of proteins. Biochim. Biophys. Acta 2007, 1767, 1073–1101. [Google Scholar] [CrossRef] [Green Version]
- Pelton, J.T.; McLean, L.R. Spectroscopic methods for analysis of protein secondary structure. Anal. Biochem. 2000, 277, 167–176. [Google Scholar] [CrossRef]


| Ratio | Biomolecular Origin | Indication |
|---|---|---|
| Ax/Ay | ||
| A1226/A1450 | PO2− as. ν/CH3 as. δ, CH2 sc. | DNA modification (DNA1) |
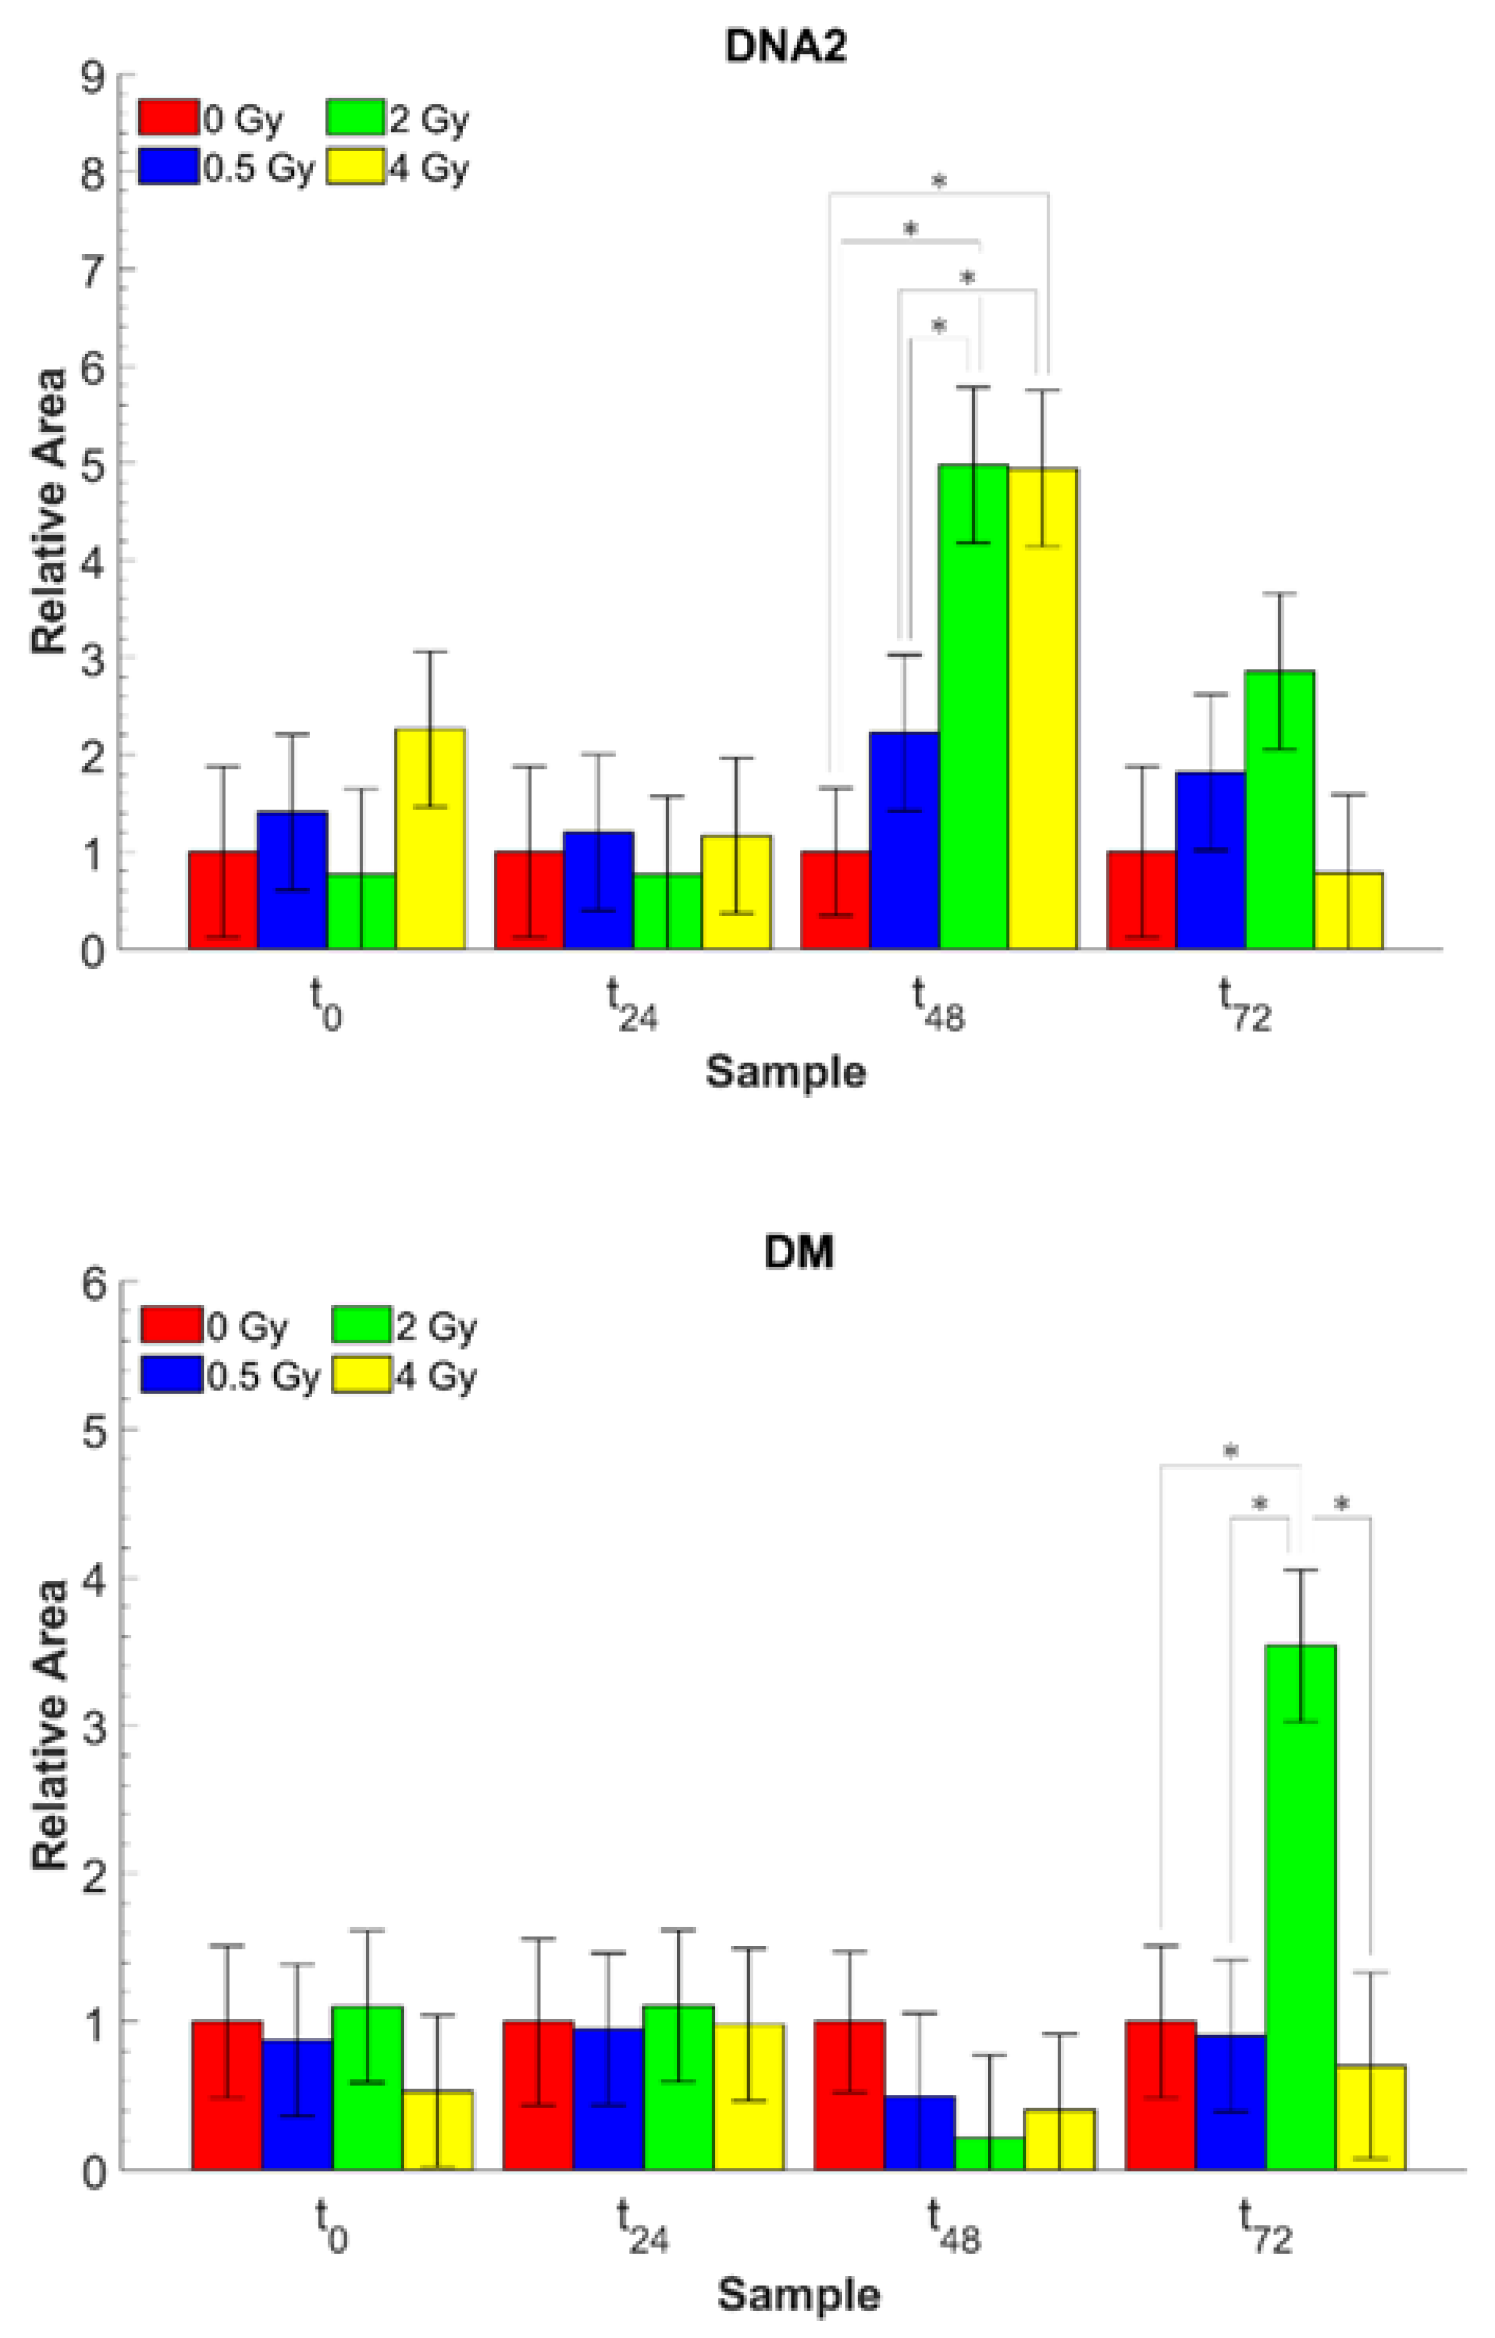
| A1085/A1450 | PO2− s. ν/CH3 as. δ, CH2 sc. | DNA modification (DNA2) |
| A1226/A1085 | PO2− as. ν, C-O-P ν/PO2− s. ν, C-O-P ν | DNA modification (DM) |
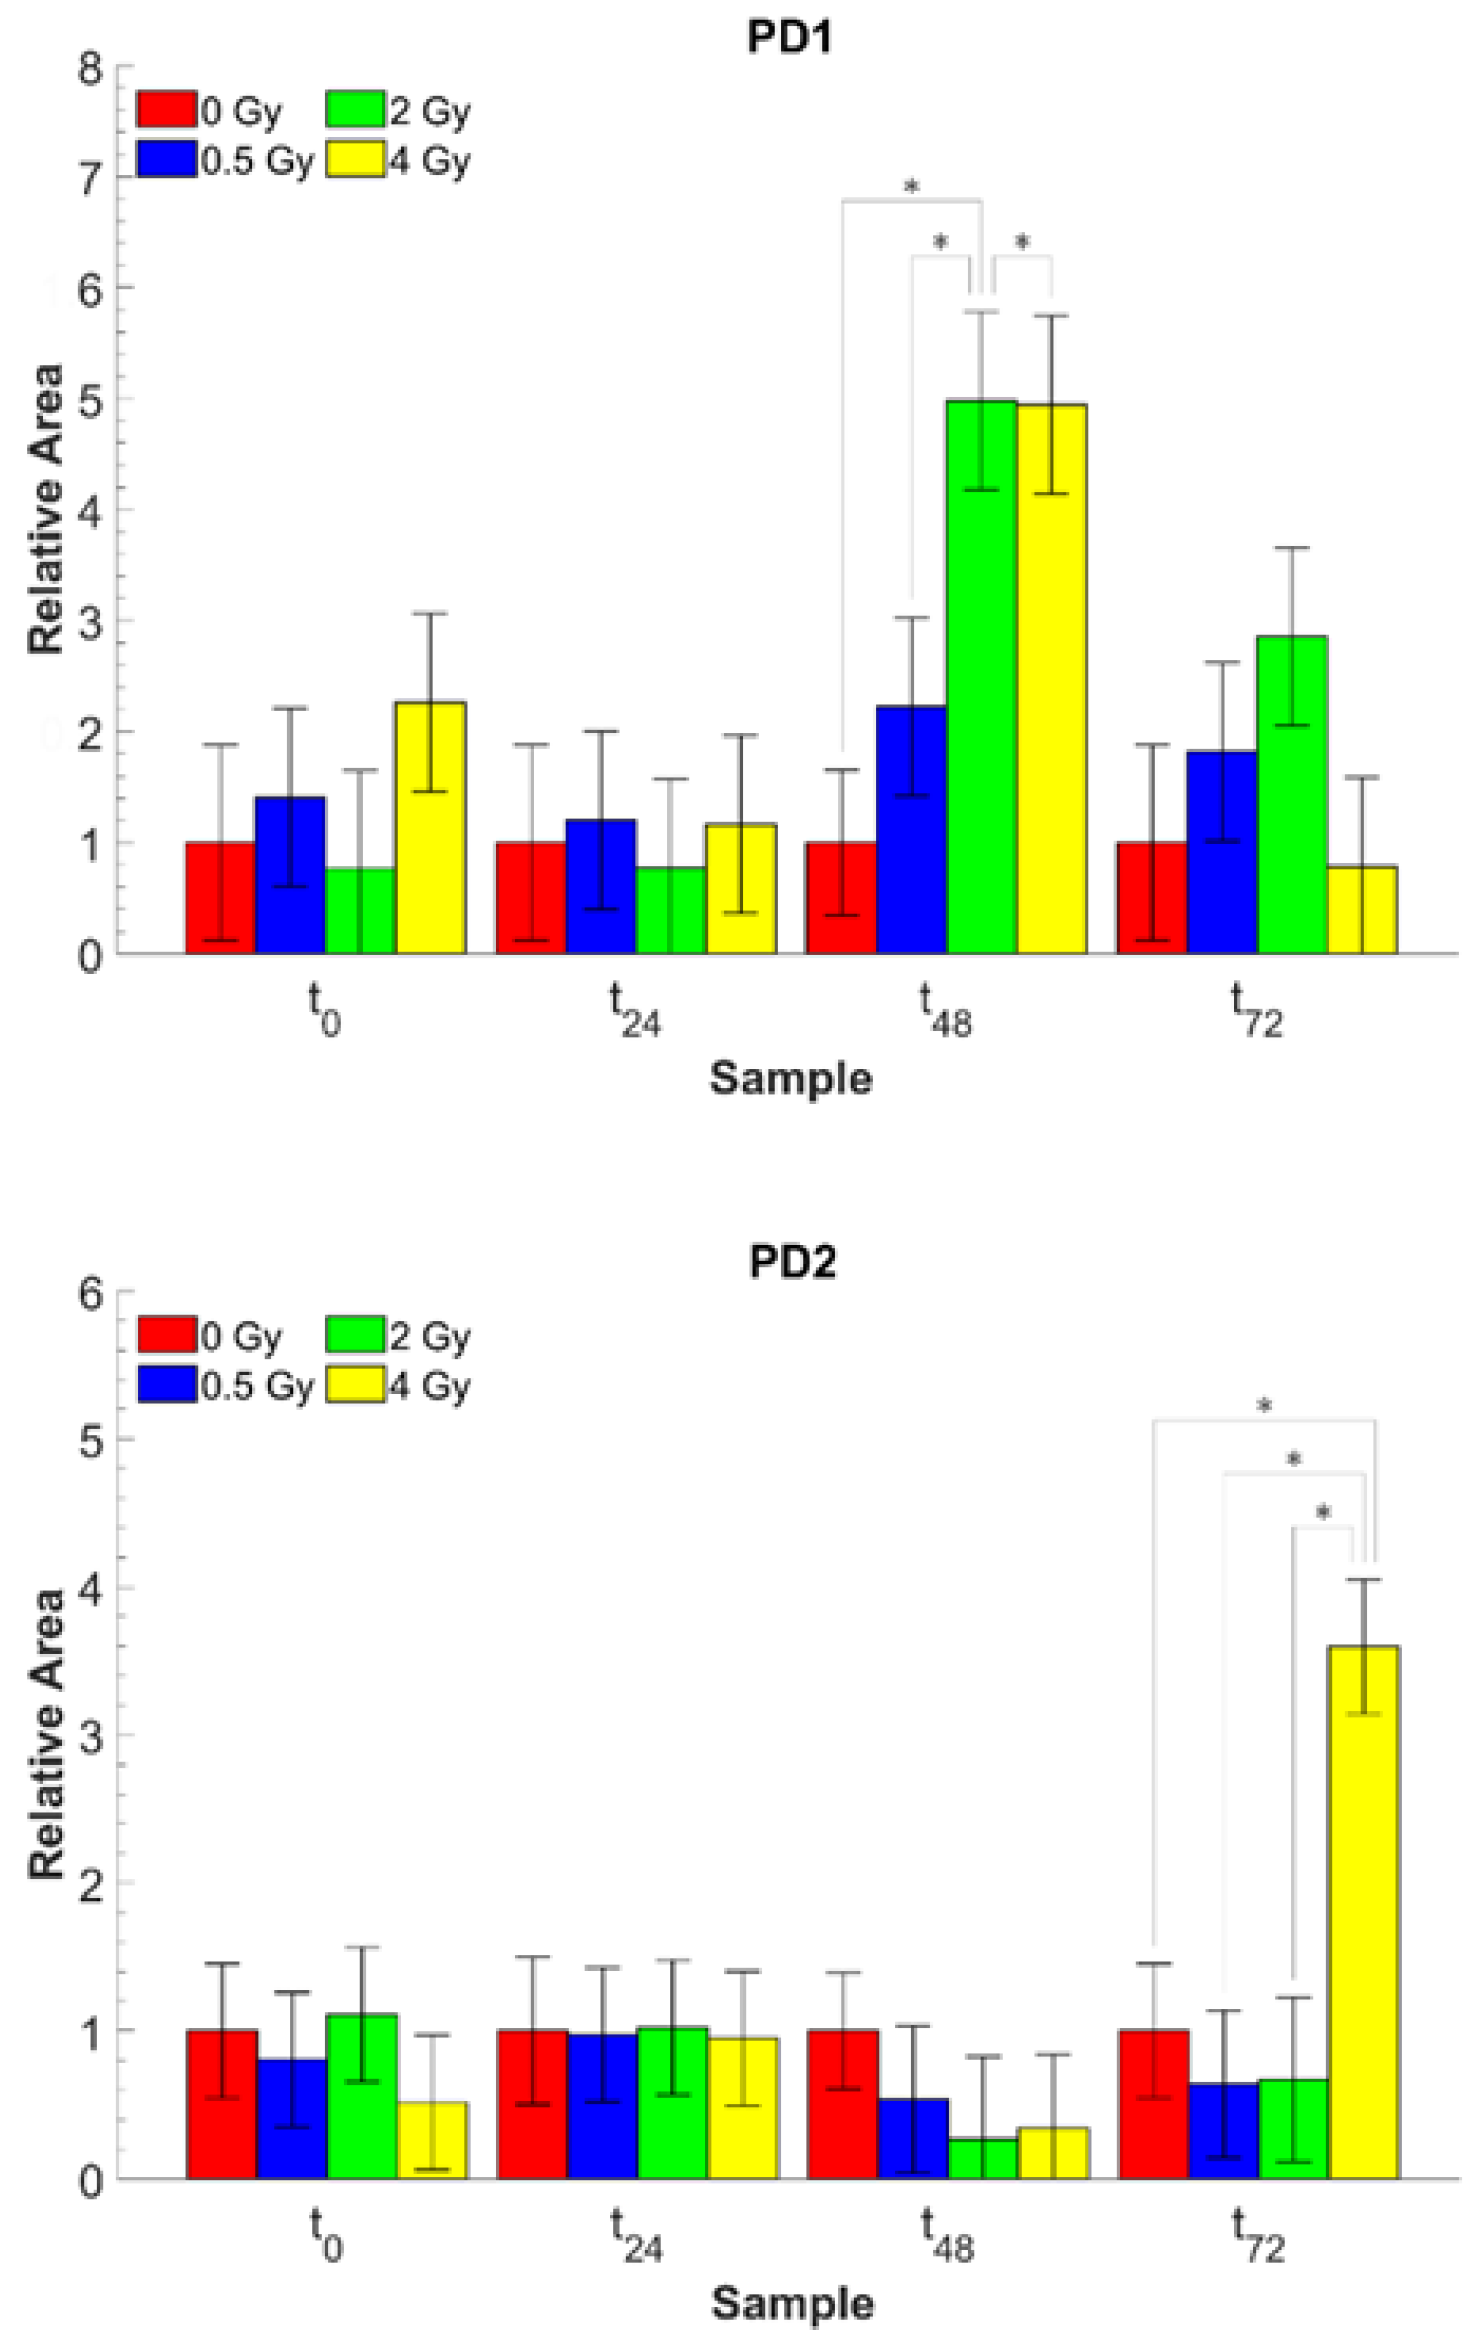
| A1643/A1226 | Amide I/PO2− as. ν | Protein/DNA content (PD1) |
| A1643/A1085 | Amide I/PO2− s. ν | Protein/DNA content (PD2) |
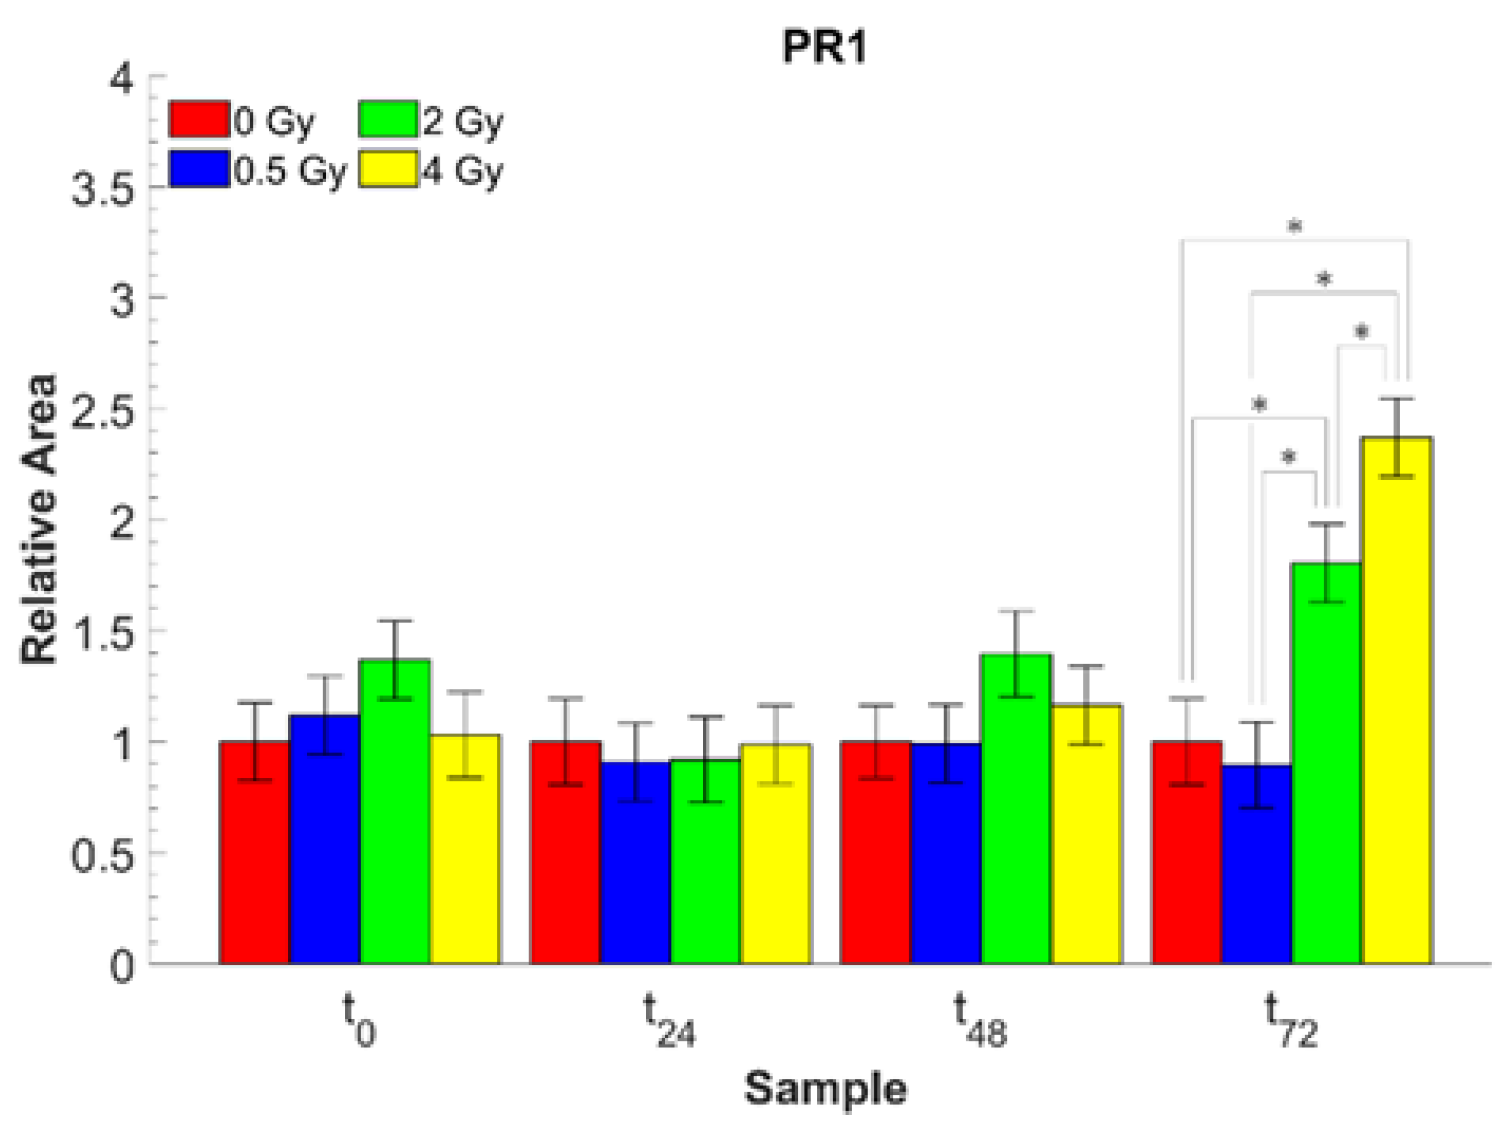
| A1643/A1533 | Amide I/Amide II | Protein rearrangement (PR1) |
| A1226/A2959 | PO2− as. ν, C-O-P ν/CH3 as. ν | Protein phosphorylation (PP1) |
| A1085/A2959 | PO2− s. ν, C-O-P ν/CH3 as. ν | Protein phosphorylation (PP2) |
| A2924/A2959 | CH2 as. ν/CH3 as. ν | Lipid saturation (LS) |
| A1533/A2959 | Amide II/CH3 as. ν | Protein/Lipid content (PL1) |
| A1394/A2959 | COO- s. ν/CH3 as. ν | Protein/Lipid content (PL2) |
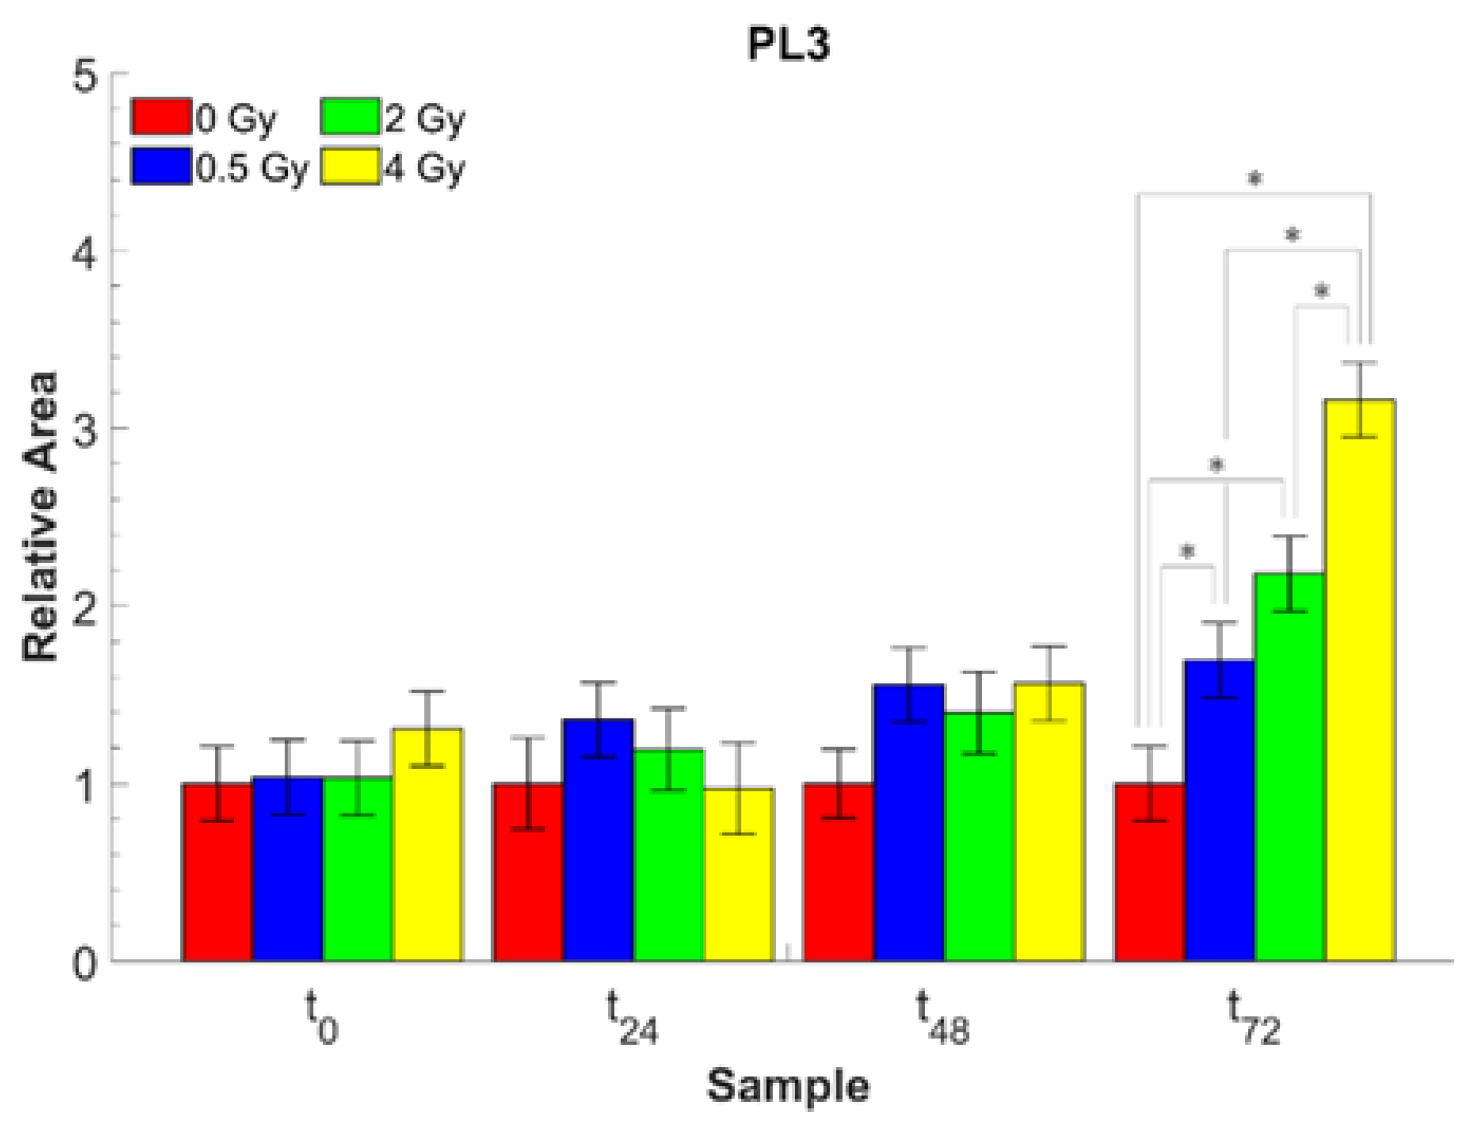
| A1643/A2959 | Amide I/CH3 as. ν | Protein/Lipid content (PL3) |
Publisher’s Note: MDPI stays neutral with regard to jurisdictional claims in published maps and institutional affiliations. |
© 2022 by the authors. Licensee MDPI, Basel, Switzerland. This article is an open access article distributed under the terms and conditions of the Creative Commons Attribution (CC BY) license (https://creativecommons.org/licenses/by/4.0/).
Share and Cite
Ricciardi, V.; Portaccio, M.; Lasalvia, M.; Cammarata, F.P.; Pisciotta, P.; Perna, G.; Capozzi, V.; Petringa, G.; Manti, L.; Lepore, M. Evaluation of Proton-Induced Biomolecular Changes in MCF-10A Breast Cells by Means of FT-IR Microspectroscopy. Appl. Sci. 2022, 12, 5074. https://doi.org/10.3390/app12105074
Ricciardi V, Portaccio M, Lasalvia M, Cammarata FP, Pisciotta P, Perna G, Capozzi V, Petringa G, Manti L, Lepore M. Evaluation of Proton-Induced Biomolecular Changes in MCF-10A Breast Cells by Means of FT-IR Microspectroscopy. Applied Sciences. 2022; 12(10):5074. https://doi.org/10.3390/app12105074
Chicago/Turabian StyleRicciardi, Valerio, Marianna Portaccio, Maria Lasalvia, Francesco Paolo Cammarata, Pietro Pisciotta, Giuseppe Perna, Vito Capozzi, Giada Petringa, Lorenzo Manti, and Maria Lepore. 2022. "Evaluation of Proton-Induced Biomolecular Changes in MCF-10A Breast Cells by Means of FT-IR Microspectroscopy" Applied Sciences 12, no. 10: 5074. https://doi.org/10.3390/app12105074