Article

One-Class LSTM Network for Anomalous Network Traffic Detection

1
School of Cyberspace Security, Beijing University of Posts and Telecommunications, Beijing 100876, China
2
School of Information Science and Engineering, Shandong University, Qingdao 266237, China
3
School of Software, Shandong University, Jinan 250101, China
4
School of Computer Science and Technology, Beijing Institute of Technology, Beijing 100081, China
5
Optical Advanced Research Center, Shandong University, Qingdao 266237, China
6
Joint SDU-NTU Centre for Artificial Intelligence Research (C-FAIR), Shandong University, Jinan 250101, China
*
Authors to whom correspondence should be addressed.
Appl. Sci. 2022, 12(10), 5051; https://doi.org/10.3390/app12105051
Submission received: 8 April 2022 / Revised: 15 May 2022 / Accepted: 16 May 2022 / Published: 17 May 2022
(This article belongs to the Topic Cyber Security and Critical Infrastructures)

Abstract

:
Artificial intelligence-assisted security is an important field of research in relation to information security. One of the most important tasks is to distinguish between normal and abnormal network traffic (such as malicious or sudden traffic). Traffic data are usually extremely unbalanced, and this seriously hinders the detection of outliers. Therefore, the identification of outliers in unbalanced datasets has become a key issue. To help solve this challenge, there is increasing interest in focusing on one-class classification methods that train models based on the samples of a single given class. In this paper, long short-term memory (LSTM) is introduced into one-class classification, and one-class LSTM (OC-LSTM) is proposed based on the traditional one-class support vector machine (OC-SVM). In contrast with other hybrid deep learning methods based on auto-encoders, the proposed method is an end-to-end training network that uses a loss function such as the OC-SVM optimization objective for model training. A comprehensive experiment on three large complex network traffic datasets showed that this method is superior to the traditional shallow method and the most advanced deep method. Furthermore, the proposed method can provide an effective reference for anomaly detection research in the field of network security, especially for the application of one-class classification.

1. Introduction

When analyzing real-world data, the common requirement is to determine which instances are completely different from the others. Such instances are called outliers, and the task of anomaly detection is to identify all such instances in a data-driven manner [1]. Generally, this is regarded as an unsupervised learning problem, and it is assumed that most training datasets consist of normal data, among which the anomalous samples are unknown. According to a recent study [2], unsupervised anomaly detection has proven to be very effective and plays a key role in a variety of applications, such as fraud detection, network intrusion prevention, and fault diagnosis [3,4,5]. One-class classification is a widely used and effective unsupervised technique that learns from samples belonging to a single class while treating samples belonging to other classes as anomalies. The most representative methods of this type are the one-class support vector machine (OC-SVM) [6] and support vector data description (SVDD) [7]. However, the performance of these shallow models is suboptimal, especially on large quantities of high-dimensional data (e.g., network traffic data). It is still an open and challenging research problem to learn the inherent characteristics effectively when only one class of samples is given.
With the development of artificial intelligence in recent years, deep neural networks have been widely used in the field of information security due to their powerful feature learning capabilities [8,9,10]. In general, the training of a deep learning model requires a complete and detailed sample set that must contain labeled samples of all traffic types appearing in the network communication. Manually labeling such samples is time-consuming and laborious, especially for large-scale backbone network traffic [11]. In addition, this process may not cover all network anomaly types, such as complex network attack behaviors and advanced persistent threats. On the other hand, due to the low incidence rates of many network anomalies, it is usually difficult to collect enough anomaly data for training. Data imbalances seriously affect the performance of classifiers, making many models that are effective on balanced datasets perform poorly in terms of anomaly detection in real-world network traffic applications [12]. As the data in these domains are growing rapidly in size and dimensionality, people require effective and efficient ways to detect anomalies in large quantities of high-dimensional data [13].
Traditional unsupervised techniques commonly used in anomaly detection include k-means (k-means), isolation forest (IF), self-organizing maps (SOM), density-based noisy spatial clustering (density-based spatial clustering of applications with noise, DBSCAN), one-class support vector machine (OC-SVM), etc. [8]. However, traditional shallow unsupervised models still perform poorly on complex high-dimensional datasets. Especially when only normal type samples are given, the question of how to better learn their inherent properties is still an open and challenging research problem. To improve the performance of the unsupervised classification model and solve the problem of insufficient training data in network traffic anomaly detection, an interesting approach is to complete the one-class classification task through the use of a deep learning method. In this paper, LSTM is introduced into one-class classification, and OC-LSTM is proposed based on the traditional OC-SVM. In contrast with other hybrid deep learning methods based on auto-encoders, the proposed method is an end-to-end training network that uses a loss function such as the OC-SVM optimization objective for model training.
In a word, traditional shallow learning methods cannot adapt to the dynamic growth of network traffic. They cannot meet the requirements for intelligent analysis and the prediction of large-scale high-dimensional traffic data. Therefore, designing fast and efficient anomaly detection algorithms according to the characteristics of traffic data has become an urgent goal in the field of network security. In this paper, we study network intrusion detection based on the deep learning method in order to reduce the workload of security practitioners and enhance the network situational awareness of security systems, and provide strong support for the improvement of China’s network security technology system and the construction of the network power strategy. The main contributions of this paper can be summarized as follows:
(1)
In this paper we propose an unsupervised anomaly detection algorithm based on the one-class long short-term memory (OC-LSTM) network. The model is an end-to-end single-class neural network with a specially designed loss function equivalent to the optimization objective of a single-class SVM.
(2)
By directly adopting the objective of representation learning for anomaly detection, OC-LSTM can directly process raw data without using unsupervised transfer learning for further feature extraction. This will help to discern complex anomalies in large datasets, especially when the decision boundary between normal and anomalous data is highly nonlinear.
The rest of the paper is structured as follows. In Section 2, a detailed overview of related research regarding one-class classification and anomaly detection is given. Section 3 outlines the main models of the proposed OC-LSTM method. The experimental setup, including the dataset used, the compared methods, and the evaluation metrics, is described in Section 4. An in-depth discussion and analysis of the obtained experimental results regarding OC-LSTM and other state-of-the-art methods are the focus of Section 5. Section 6 provides the conclusions of this paper, as well as the main points and directions of future work.

2. Background and Related Work

Before introducing the OC-LSTM method, this paper briefly reviews one-class classification and presents existing deep learning-based unsupervised anomaly detection methods.

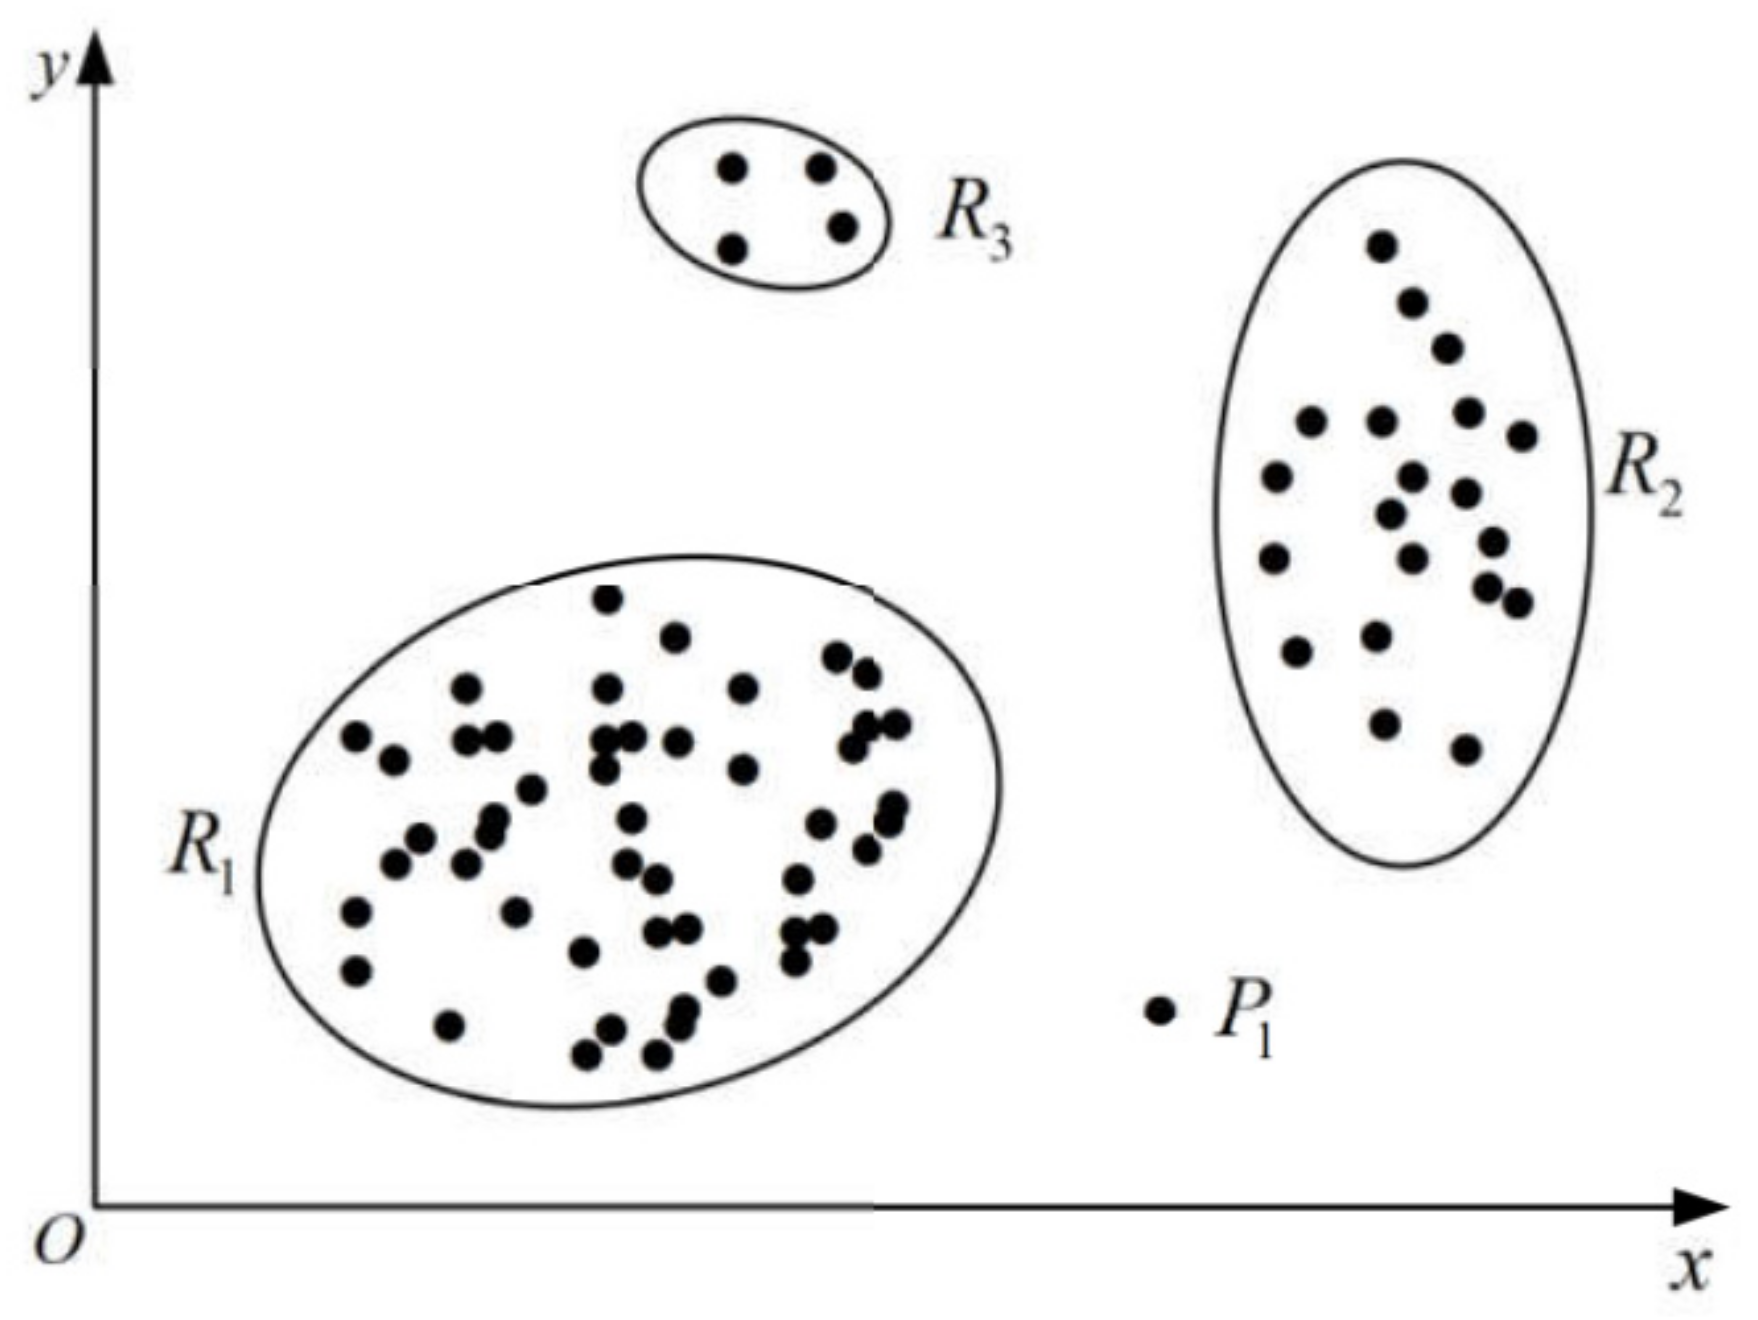
2.1. Anomaly Detection

In data mining and statistics literature, anomalies are also called abnormal data, outliers or deviant data. Anomalies can be caused by errors in the data, but also sometimes indicate the presence of new, previously unknown underlying processes. In fact, Hawkins defines an outlier as an observation that is so different from other observations that there is good reason to speculate that it is produced by a different mechanism. As shown in Figure 1, the regions R 1 and R 2 that contain most of the observations are considered normal data instance regions, whereas the regions R 3 and P 1 , which are far from most of the data points, contain only a few data points, and are considered exceptions. Often caused by system failures, illegal operations, external attacks, etc., this situation often conveys and reveals valuable information and exciting insights that exist in the data. Anomaly detection is an indispensable part of various modern discriminant models and decision-making systems. Traditional anomaly detection methods are mainly divided into four categories: based on the statistical distribution, based on distance, based on density, and based on clustering.

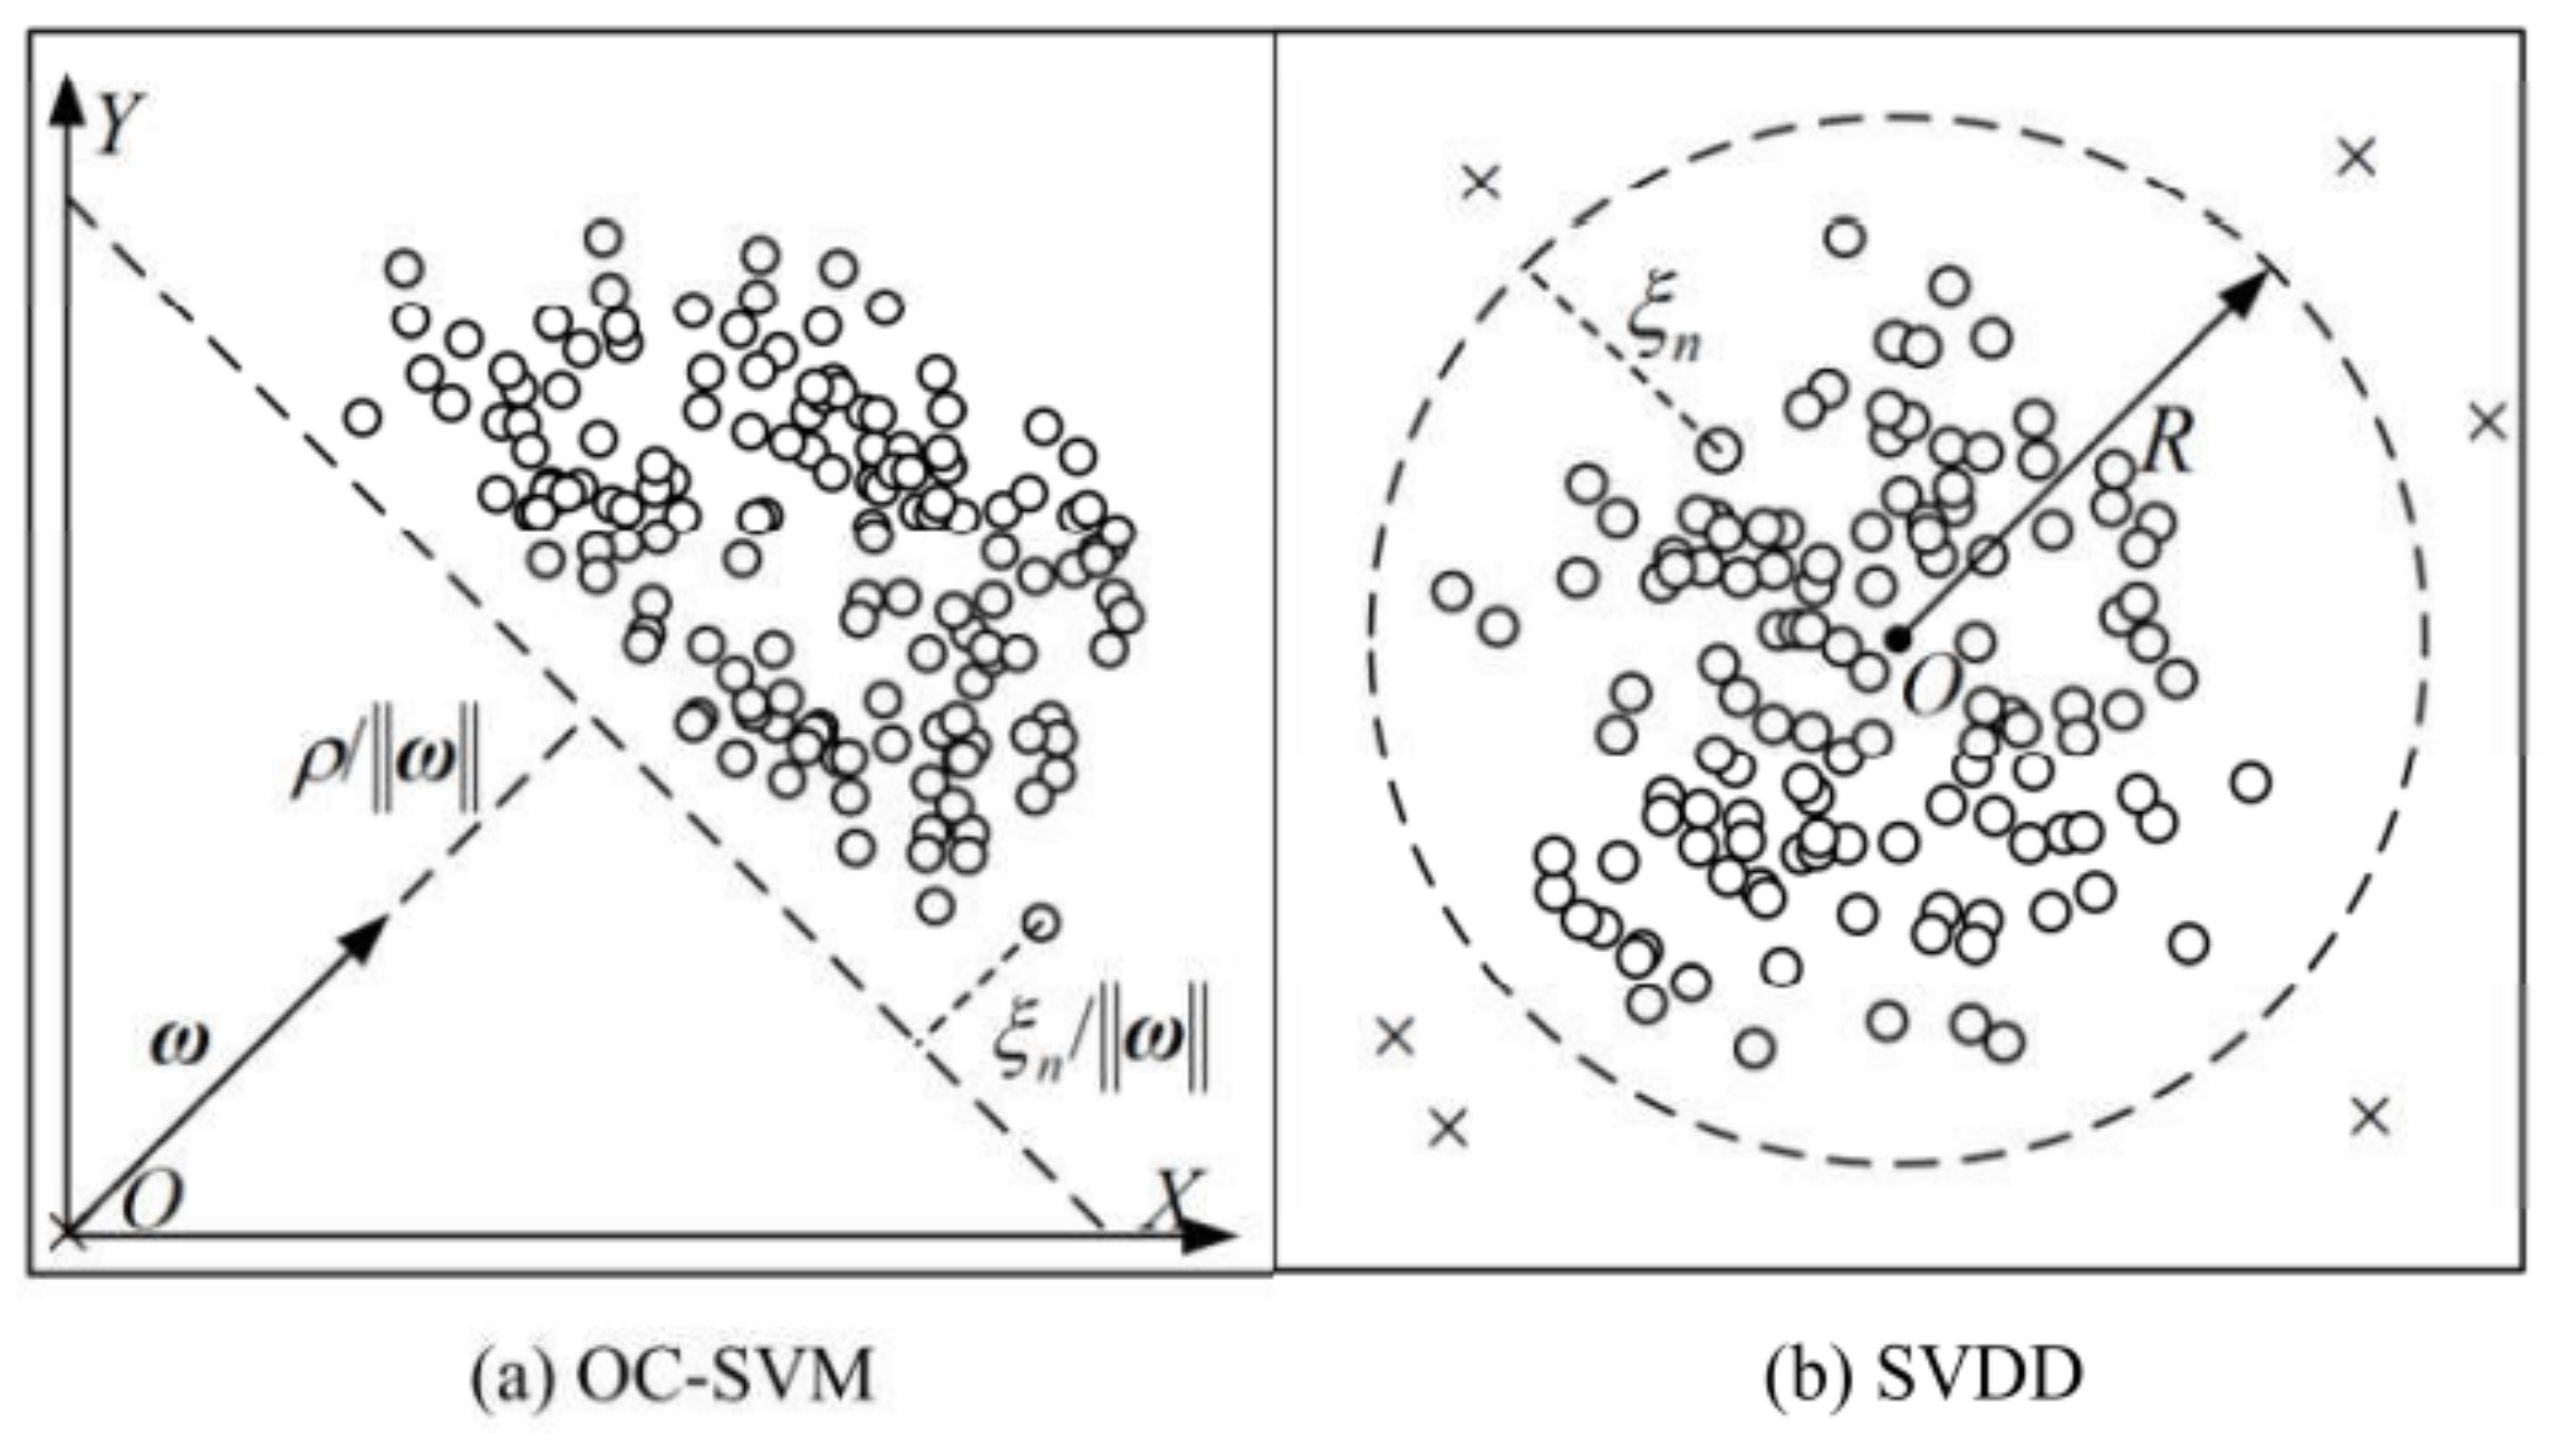
2.2. One-Class Classification

One-class classification refers to the classification learning model that only provides samples belonging to a certain class [14]. In contrast with the task of multiclass classification, which learns distinguishing features by comparing multiple samples of different classes, the key problem of one-class classification is how to effectively capture features related to a single class [15]. The one-class classification problem is described below. For a given training sample x from class A , the purpose is to learn the scoring function f ( x ) :   x R . In R , a higher value indicates that the sample x is more likely to belong to class A . Therefore, for the test sample x , its score f ( x ) can be calculated and evaluated to determine whether it belongs to class A . In the one-class classification task, there are sufficient samples belonging to the target category and very few outliers; that is, the negative category sample portion is not available or not present. This property of the given dataset makes decision boundary detection a complex and challenging task [16].
There has been much work performed on one-class classification, usually focusing on feature fitting or feature mapping. Among them, the OC-SVM [6] is a one-class unsupervised approach that is widely used in document classification, disease diagnosis, fraud detection, etc. Intuitively, in OC-SVM, all data points are treated as instances with positive labels, whereas the origin is treated as the only instance with negative labels, as shown in Figure 2a. Its main idea is to train a model (hyperplane) to achieve the maximum possible separation between the target data and coordinate origin, that is
min ω , ρ   1 2 ω 2 + 1 v N i = 1 N ξ i ρ s . t .   ( ω Φ ( x i ) ) ρ ξ i ,   ξ i 0
where ω is the weight of the support vector, ρ is the distance between the hyperplane and the origin of the coordinates, and v ( 0 ,   1 ] is used to control the trade-off between the maximum distance from the origin to the hyperplane and the number of data points allowed to cross the hyperplane. Training data x n X , i = 1 , 2 , , N are mapped to a high-dimensional feature space by the kernel function Φ ( ) , and their distance from the classified hyperplane is ξ i / ω . The decision function in the feature space is similar to the second-class SVM and is described by
f ( x i ) = sgn [ ω Φ ( x i ) ρ ]
and most of the training set lies in the region f ( x ) > 0 .
However, the performance of the OC-SVM on complex, high-dimensional datasets is not optimal. Based on the OC-SVM, the support vector data description (SVDD) [7] method was proposed to map an original image to a hypersphere instead of a hyperplane, as shown in Figure 2b. The primal problem in SVDD is
min R , ξ   R 2 + 1 v N i = 1 N ξ i s . t .   Φ ( x i ) a 2 R 2 + ξ i ,   ξ i 0
where a is the hypersphere center and R is the hypersphere radius. Again, slack variables ξ i 0 allow for a soft boundary, and a hyperparameter v ( 0 ,   1 ] controls the trade-off between the penalties ξ i and the volume of the sphere. The OC-SVM and SVDD are closely related and are still limited to complex datasets. These kernel-based approaches often fail in high-dimensional, data-rich scenarios due to their poor computational scalability and the curse of dimensionality.

2.3. Deep Learning for Unsupervised Anomaly Detection

Anomaly detection is an important topic in data science research [17]. The aim in unsupervised anomaly detection is to find a separation rule between anomalous and normal data without labels. In recent years, with the unprecedented success of deep neural networks as feature extractors for processing image, audio, and text data [18], several hybrid models that combine deep learning and the OC-SVM have emerged [19,20]. The hybrid model uses a pretrained deep learning model to acquire rich representational features and is then fed into shallow anomaly detection methods, such as the OC-SVM. However, these hybrid OC-SVM methods are decoupled because their feature learning is task-agnostic and is not customized for anomaly detection [21].
In addition to hybrid approaches, another common method of anomaly detection is based on the use of deep auto-encoders such as the robust deep autoencoder (RDAE) [2] and robust convolution autoencoder (RCAE) [22]. The input data X of a deep autoencoder is decomposed into two parts, L D and S , where L D represents the latent representation of the hidden layer and S represents the noise and outliers that are difficult to reconstruct. Therefore, the optimization objective function is:
min θ ,   S + L D D θ ( E θ ( L D ) ) 2 + λ S T 2 , 1 s . t .     X = L D + S
Back-propagation and the alternating direction method of multipliers (ADMM) can be used to solve the above optimization problems, and the reconstruction error is employed as an anomaly score [23].
Auto-encoders have the objective of dimensionality reduction and do not target anomaly detection directly. However, the main difficulty of this approach is the question of how to choose the right degree of compression. Apart from auto-encoders, some deep models train neural networks by minimizing the volume of the hypersphere surrounding the data or the distance between the data and the hyperplane [20,24]. However, such experiments are still based on features extracted via deep auto-encoders or pre-trained models [25,26]. In our experiments, we carried out a detailed comparison between the proposed OC-LSTM and the abovementioned anomaly detection methods.

3. Materials and Methods

This section introduces a one-class LSTM (OC-LSTM) neural network model that employs the representation learning objective directly for anomaly detection. This makes it possible to discern anomalies in complex and large data sets, especially when the decision boundaries between the normal and anomalous data are highly nonlinear. We present the OC-LSTM objective, its optimization process, and the associated algorithm.

3.1. OC-LSTM Objective and Optimization Process

The OC-LSTM is a simple feed-forward network, which can be regarded as a neural architectural design with an OC-SVM-equivalent loss function. The optimization problem of the OC-SVM is shown in Equation (1), and it can be written as follows:
min ω , ρ   1 2 ω 2 + 1 v N i = 1 N max ( 0 ,   ρ ω Φ ( x i ) ) ρ
Assuming that a simple network consists of a hidden LSTM layer with a linear activation function g ( ) and an output node, the scalar output from the hidden layer to the output node is W , and the weight matrix from the input to the hidden layer is V . The objective function of the network can be formulated as:
min W , V , ρ   1 2 W 2 + 1 2 V 2 + 1 v N i = 1 N max ( 0 ,   ρ W g ( V x i ) ) ρ
Thus, it is possible to leverage the transfer learning features obtained using an LSTM layer by replacing ω Φ ( x i ) with W g ( V x i ) [21].
However, the cost of this change is that the objective function becomes nonconvex and therefore the global optimal solution cannot be obtained. Fortunately, the alternating minimization method can be used to optimize the objective [21]. Therefore, the optimization problems of W , V , and ρ can be defined as
argmin W , V   1 2 W 2 + 1 2 V 2 + 1 v N i = 1 N max ( 0 ,   ρ y ^ i )
argmin ρ   1 v N i = 1 N max ( 0 ,   ρ y ^ i ) ρ
where y ^ i = W g ( V x i ) . Equation (7) can be optimized using the standard back-propagation (BP) algorithm as shown in Section 3.2, and Theorem 1 in [21] has proven that v = 1 N i = 1 N ( ρ y ^ i > 0 ) , which means that the optimal value of ρ in Equation (8) is the v t h quantile of { y ^ i } i = 1 N . Finally, the decision function can be defined as
f ( x i ) = sign ( y ^ i ρ ) ,     i = 1 ,   ,   N
The proof process of (8) is as follows:
argmin ρ   1 v N i = 1 N max 0 ,   ρ y ^ i ρ = argmin ρ   1 v N i = 1 N max 0 ,   ρ y ^ i ( ρ 1 N i = 1 N y ^ i ) = argmin ρ   1 v N i = 1 N max 0 ,   ρ y ^ i 1 N i = 1 N ( ρ y ^ i ) = argmin ρ i = 1 N max 0 ,   ρ y ^ i v   .   1 N i = 1 N ( ρ y ^ i ) = argmin ρ i = 1 N [ max 0 ,   ρ y ^ i v   .   ρ y ^ i ] = argmin ρ i = 1 N 1 v   ·   ρ y ^ i ρ y ^ i > 0 v   ·     ρ y ^ i   ρ y ^ i 0  
The derivative of (10) is obtained as:
F r = i = 1 N 1 v   r > y ^ i v   r y ^ i
Let F r = 0; when ρ y ^ i > 0 we can get:
1 v   ·   i = 1 N ρ y ^ i > 0 = v   ·   i = 1 N ρ y ^ i 0   1 v   ·   i = 1 N ρ y ^ i > 0 = v   ·   i = 1 N 1 ( ρ y ^ i > 0 )   1 v   ·   i = 1 N ρ > y ^ i = v   ·   N v   ·   i = 1 N ρ > y ^ i   i = 1 N ρ y ^ i > 0 = v   ·   N   ρ = v   ·   i = 1 N y ^ i

3.2. OC-LSTM Algorithm

The training process of the OC-LSTM model is shown in Algorithm 1. First initialize ρ in the third line. Then use the standard BP algorithm to train the parameters ( W ,   V ) of the neural network in the sixth line. The seventh line updates the parameter ρ with the value of the v t h aliquot of { y ^ i } i = 1 N . Equivalent to Equation (6), the cost function of the network is
C =   1 2 W 2 + 1 2 V 2 + 1 v N i = 1 N max ( 0 ,   ρ y ^ i ) ρ
where y ^ is the network output value. Then, the value of ρ is a network parameter, which can be understood as the radius of the hypersphere. It is updated according to the solution of Equation (8). In the experimental section, the original data are used as the network input instead of the features extracted from the autoencoder. This indicates that the proposed OC-LSTM is an end-to-end one-class classification method, which is different from other deep-learning-based anomaly detection methods. When the network parameters converge, the classification results of the original data can be obtained through the decision function.
Algorithm 1 OC-LSTM algorithm
1:Input:   Set   of   training   data   x i ,   i = 1 , , N
2:Output:   Set   of   decision   scores   f ( x i ) ,     i = 1 , , N
3: Initialize   ρ =1.0
4: t 0
5:While (convergence not achieved) do
6:    Optimize   Equation   ( 7 )   using   BP ,   and   find   ( W t + 1 ,   V t + 1 )
7:    ρ t + 1   the   v t h   quantile   of   { y ^ i t + 1 } i = 1 N
8:    t t + 1
9:End while
10: Compute   decision   scores   S i = y ^ i ρ   for   each   x i
11:If ( S i 0 ) then
12:    x i is the normal data
13:else
14:    x i is the anomalous data
15:Return f ( x i ) = s i g n ( y ^ i ρ ) ,   i = 1 ,   ,   N

4. Experimental Setup

This section introduces the experimental setup in detail, including the data used, the compared methods, and the detailed experimental implementation.

4.1. Compared Methods

In this study we selected three different types of detection algorithms—the shallow model, deep model, and the OC-LSTM algorithm presented in this paper. For each type, three representative and novel algorithms were selected for comparison, all of which are widely used in the task of anomaly detection, and these are described in detail below.

4.1.1. Shallow Baseline Models

(1)
OC-SVM/SVDD as per the formulation in [6]. When the Gaussian kernel function is used, these two methods are equivalent and are asymptotically consistent density-level set estimators. For the OC-SVM/SVDD models, the kernel size is the reciprocal of the number of features, and the fraction of outliers v ( 0 ,   1 ) is set according to the obtained outlier proportions.
(2)
Isolation Forest (IF) as per the formulation in [27]. The amount of contamination is set according to the proportion of outliers in the dataset, and the number of base estimators in the ensemble is 100, as recommended in [24].
(3)
Kernel Density Estimation (KDE) as per the formulation in [28]. The bandwidth of the Gaussian kernel is selected from h { 2 0.5 ,   2 1 ,   ,   2 5 } using the log-likelihood score, and the best result is reported.

4.1.2. Deep Baseline Models

(1)
Deep Convolution Autoencoder (DCAE) as per the formulation in [29]. The encoder part and decoder part of the DCAE architecture contain four portions. Every portion contains a convolutional layer, a batch normalization (BN) layer, an exponential linear unit (ELU) layer, and a down-sampling/up-sampling layer, which can provide a better representation of the convolutional filters. The DCAE is trained using a mean-squared error (MSE) loss function to enable the hidden layers to encode high-quality, nonlinear feature representations of the input data.
(2)
One-class neural network (OC-NN) as per the formulation in [21]. A feed-forward neural network consisting of a single hidden layer with linear activation functions is trained with the OC-NN objective. The optimal value of the parameter v ( 0 ,   1 ) , which is equivalent to the percentage of anomalies in each dataset, is set according to the respective outlier proportions.
(3)
Soft-Bound SVDD and One-Class Deep SVDD as per the formulation in [24]. For the encoder, we employed the same network architectures as those used for the DCAE models. An initial learning rate η = 10−4 with a two-phase learning rate schedule was employed following the implementation used in [24].

4.1.3. One-Class LSTM (OC-LSTM)

Unlike one-class deep SVDD and other deep baseline models, OC-LSTM is an end-to-end training network and does not rely on a pretrained model. The original data were fed as input to a feed-forward neural network consisting of a single LSTM layer, along with linear activation functions, as recommended in [20] for producing the best results. The number of hidden units within each LSTM cell of the model h { 32 ,   64 ,   128 ,   256 } was tuned via a grid search. Note that the main reason for using an LSTM layer instead of other types of layers is that the experiment in [21] proved that LSTM is a better feature extractor for structured data. The extracted features were then fed into a classification network that was characterized by a fully connected neural network. The fully connected layer (followed by a softmax regression layer) assigned a confidence score to each feature representation and the output of the classification network was the confidence score. The learning and drop-out rates were sampled from a uniform distribution in the range [0.01, 0.001] in order to obtain the best performance. The optimal value of the parameter v [ 0 ,   1 ) was set according to the respective outlier proportions. The Adam optimizer was used to minimize the squared error loss, and the other parameters were set to their default values. The entire network was trained end-to-end using the loss function as described in Equation (6).

4.2. Datasets

Although the proposed method applies to any feature representation context, our main concern is large-scale network traffic data. We compared all methods on three widely used real-world datasets, as summarized in Table 1. Each of the data sets was further processed to create a good anomaly detection task, as described in the next section.
(1)
The NSL-KDD dataset is the benchmark dataset in the field of network security, and it can provide consistent and comparable evaluation results for different research works [30]. Furthermore, the number of records in the NSL-KDD datasets is reasonable, and each record contains 41-dimensional features. The anomaly data mainly include thirty-nine types of network attacks across four categories.
(2)
The CIC-IDS2017 dataset contains benign data and the most up-to-date common attacks, so it resembles true real-world data [31]. The data contain a total of five days of network traffic in July 2017. The implemented attacks include Brute-Force FTP, Brute Force SSH, DoS, Heartbleed, Web Attack, PortScan, Infiltration, Botnet, and DDoS. In this study we randomly selected Friday’s traffic as the experimental dataset, which contained two types of abnormalities, DDoS and PortScan.
(3)
MAWILab is a database that assists researchers in evaluating traffic anomaly detection methods [32,33]. The dataset has been updated daily since 2001 to include new traffic from upcoming applications and anomalies; this has been ongoing for over 20 years. In this study, the data collected on the first collection day in January and December 2020 were selected as the experimental dataset. We used the code provided in [1] to process the original network traffic and extract the inherent features. The processed data contained 109-dimensional features, and the data distribution is shown in the table above.

4.3. Evaluation Criteria

Anomaly detection is an unsupervised learning problem, and model evaluation in this scenario is challenging. To effectively measure and compare the performances of different models, the area under curve (AUC) was chosen as the main evaluation index, as it is the most commonly used metric for one-class problems. The AUC is defined as the area under the receiver operating characteristic (ROC) curve, which is independent of the selected threshold and can provide an assessment of the overall performance of the given classification model.
However, when the sample proportion changes, the insensitivity of the AUC makes it difficult to observe the changes in model performance. The precision-recall curve (PRC) is a useful measure of prediction success when the classes are very imbalanced. In practical applications, the data are usually severely unbalanced, so the PRC can help to understand the actual effects of the classifier and then improve and optimize the model on this basis. Therefore, in the experiment, the ROC was used to judge the advantages and disadvantages of the given classifier, whereas the results displayed by the PRC were used to measure the classifier’s ability on unbalanced data.

5. Experimental Results and Discussion

In this section, the empirical results produced by the proposed OC-LSTM network on real-world datasets are presented and compared with those of several state-of-the-art baseline models, as illustrated in Section 4. For all datasets, all anomaly samples from the training set were removed for one-class training, and two standard metrics, the AUPRC and AUROC, were used to evaluate the predictive performance of each method according to the ground truth labels. Publicly available implementations in scikit-learn were used for the OC-SVM, IF, and KDE methods. For the DCAE, OC-NN, soft-bound deep SVDD, and one-class deep SVDD, the codes released by their respective authors were used for comparison. For our proposed OC-LSTM, TensorFlow [34] and Keras were used for the experiment. All the experimental results are the average performances obtained with the 10-fold cross-validation method.

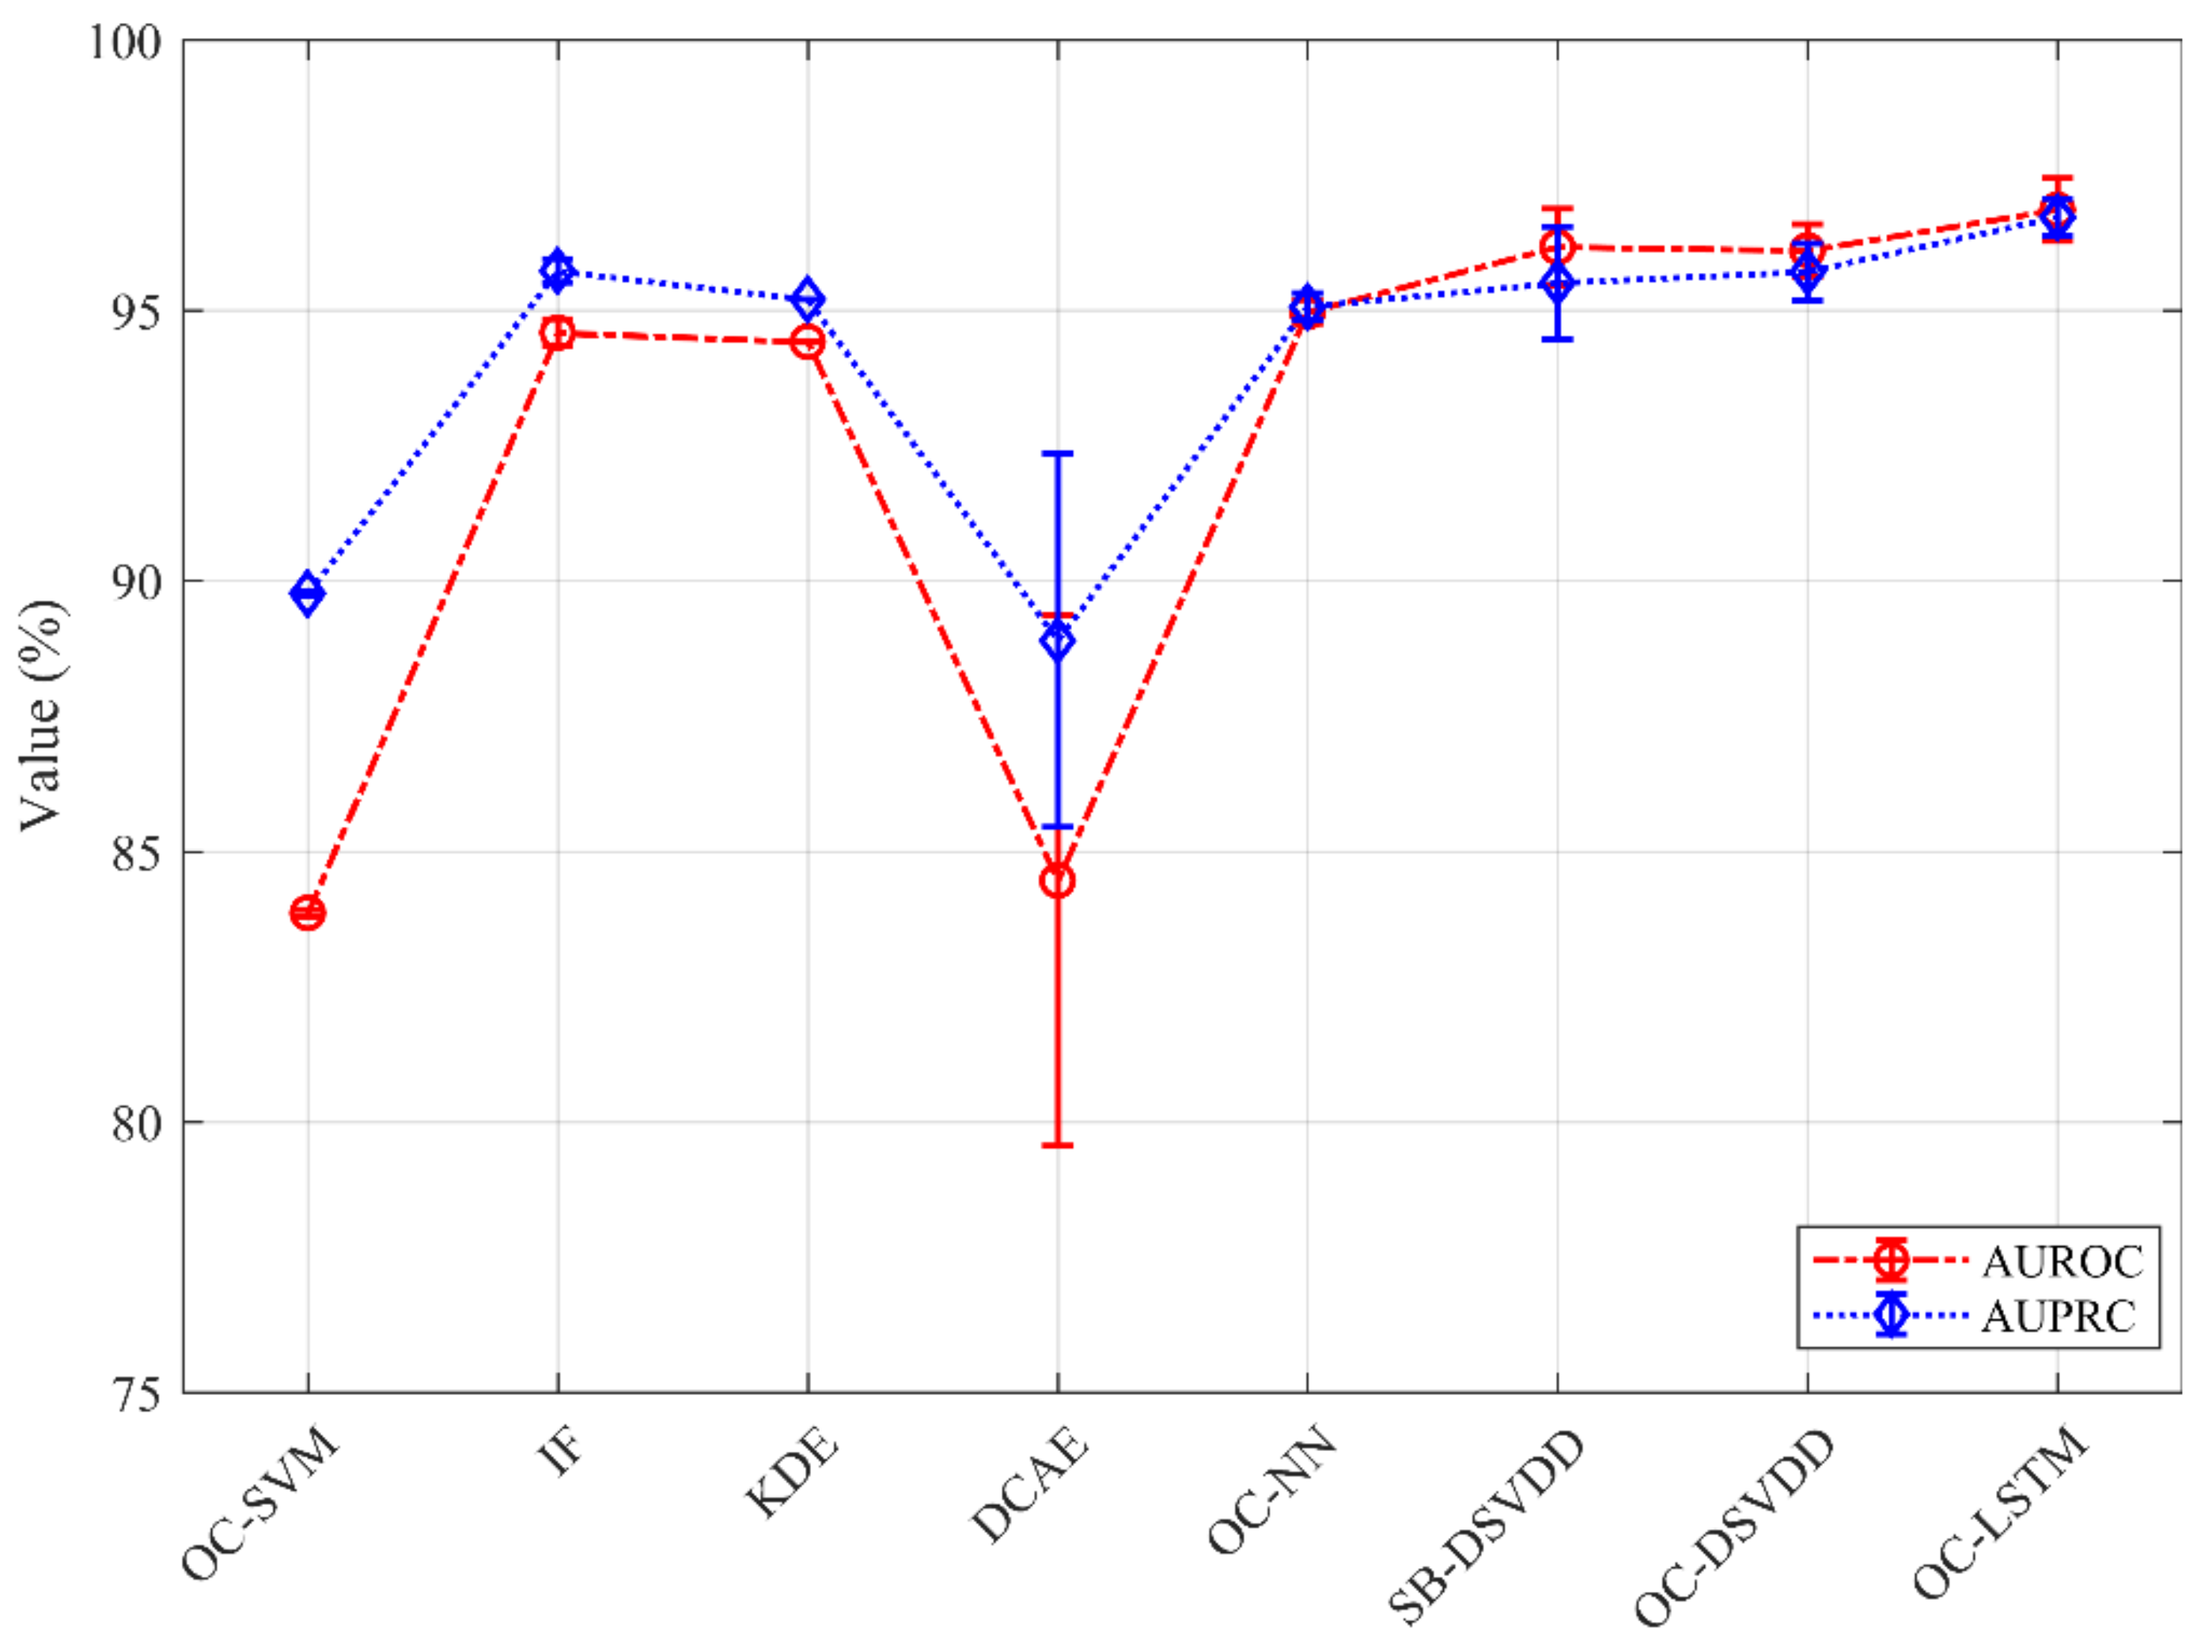
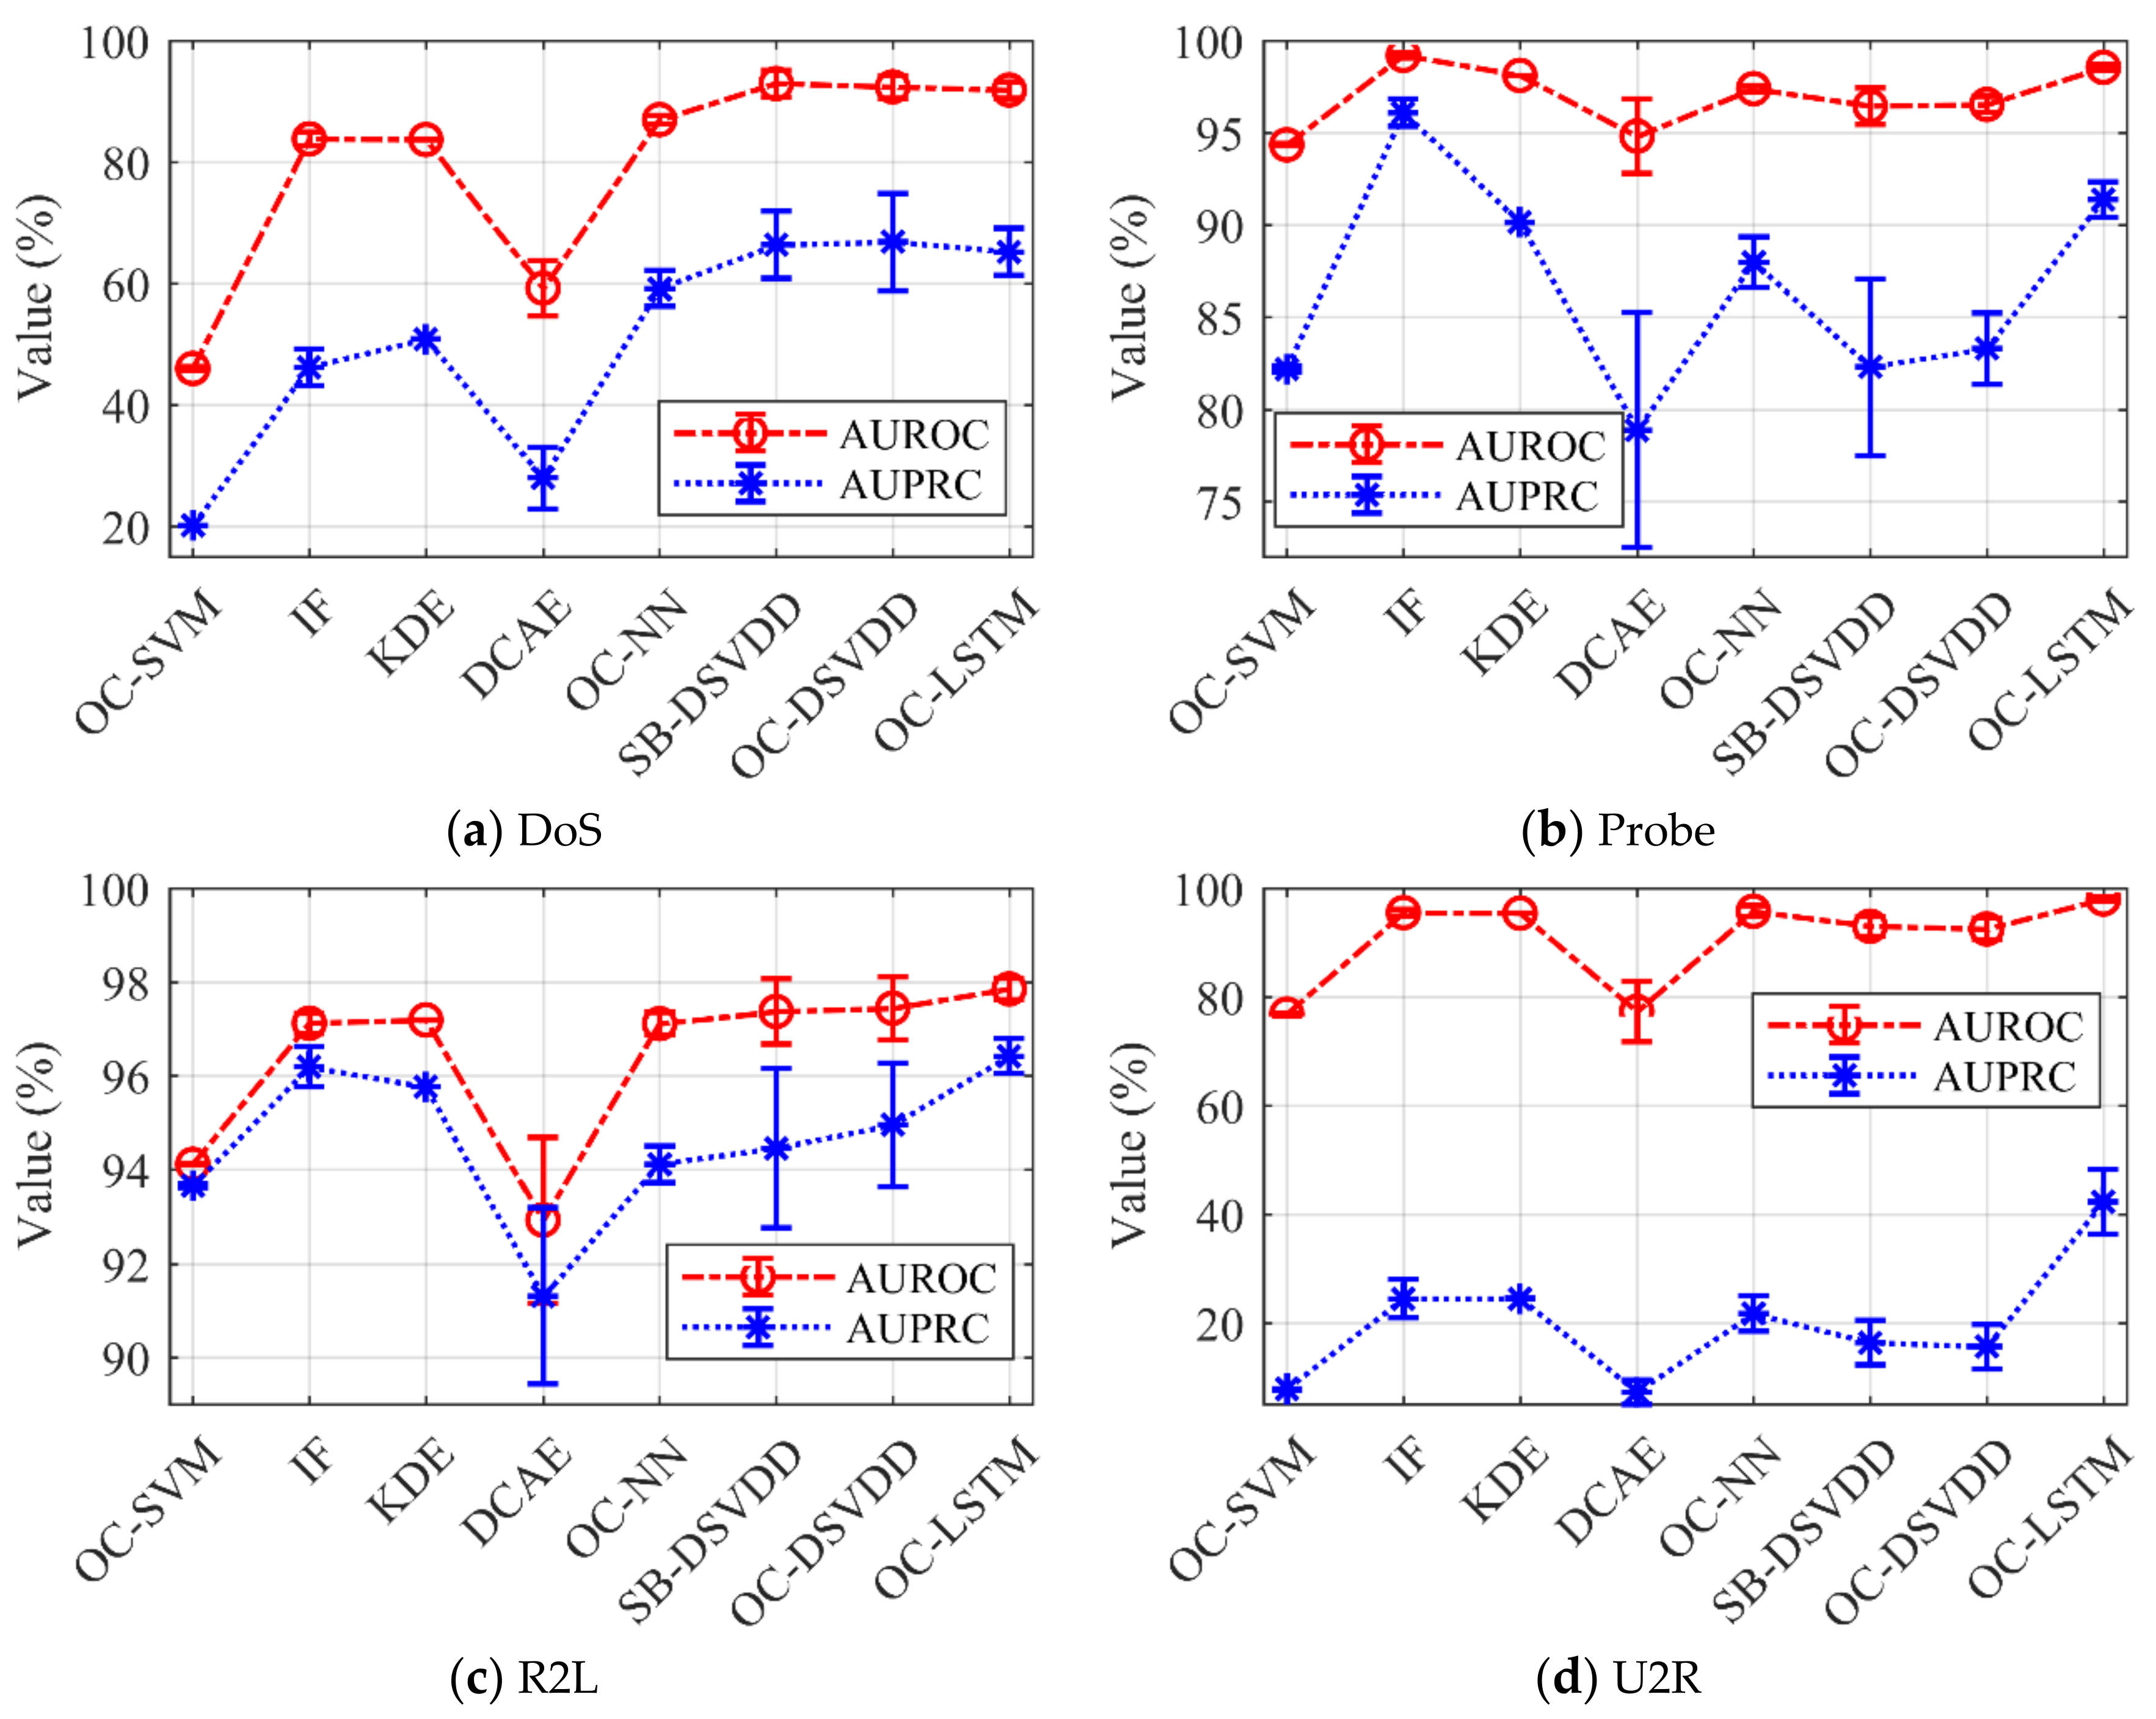
5.1. One-Class Classification on NSL-KDD

NSL-KDD contained four different anomaly categories from which we could construct a one-class classification dataset. One of the categories was abnormal, and the samples of the other categories represented normal data. We used the original training and test split in the experiment, and only performed training with the training set examples from the respective normal class. We preprocessed all records with numeralization using a one-hot encoder, rescaled them to [0, 1] via min-max-scaling, and finally obtained 121-dimensional experimental data. Figure 1 shows the error graph of the abnormal detection performance of different models. The optimizer used in the DCAE model was the stochastic gradient descent (SOD) recommended by the original author, so the performance of the model was not stable. The AUROC and AUPRC indicators in the detection results variances were large. It can be clearly seen from Figure 3 that the method proposed in this paper achieved excellent performance, reaching 96.86% ± 0.58% and 96.72% ± 0.34% on the AUROC and AUPRC metrics, respectively. In addition, the anomaly detection performance of the deep models was generally better than that of the shallow models.
In order to evaluate the detection ability of each model for different anomaly (attack) types, in this study we combined normal types with different anomaly types to construct different single-classification tasks. Figure 4 shows the detection performance of different models for various types of anomalies, in which the R2L class of anomaly was difficult to identify, and the AUROC performance of the model was generally low. In addition, due to the serious unevenness in the number of normal and abnormal samples in the test set, the proportion of R2L abnormal samples was about 10%, whereas the proportion of U2R abnormal samples was less than 1%, so the AUPRC of each model in the abnormal types R2L and U2R was relatively poor, as shown in Figure 4c,d. However, the OC-LSTM model proposed in this chapter is stable in all four types of anomalies and significantly outperforms the detection performance of other shallow and deep single-classification models. AUROC indicators are 97.85% ± 0.23, 98.55% ± 0.15, 91.86% ± 1.33 and 98.01% ± 0.34, respectively. AUPRC indicators are 96.42% ± 0.37, 91.38% ± 0.96, 65.18% ± 3.84 and 42.24% ± 5.98, respectively. All experimental results were convincing, with shallow benchmark methods outperforming some of the deep models in the detection performance of individual anomaly types, whereas the deep single-class model showed more robust detection performance overall. It is worth noting that the detection performance of the shallow benchmark model IF, as shown in Figure 4b, was better than that of other deep single-classification models in relation to the Probe-type abnormalities.
The results are presented in Table 2 and Table 3, where “total” indicates all categories of attacks that were considered anomalous. Among these, the R2L anomaly class was difficult to identify, so the AUROC performance of each method was generally not good. In addition, due to the extremely uneven amount of positive and negative samples in the test set, the AUPRC performance for the R2L and U2R classes was particularly poor. However, the proposed OC-LSTM maintained high and stable detection performance in terms of both the AUROC and AUPRC, and it clearly outperformed both the shallow and deep competitors on NSL-KDD. These results are convincing, but for certain classes, the shallow baseline methods outperformed the deep models, whereas the deep models showed robust performances overall. It is interesting to note that the shallow IF method performed better than the deep methods on one of the four classes.

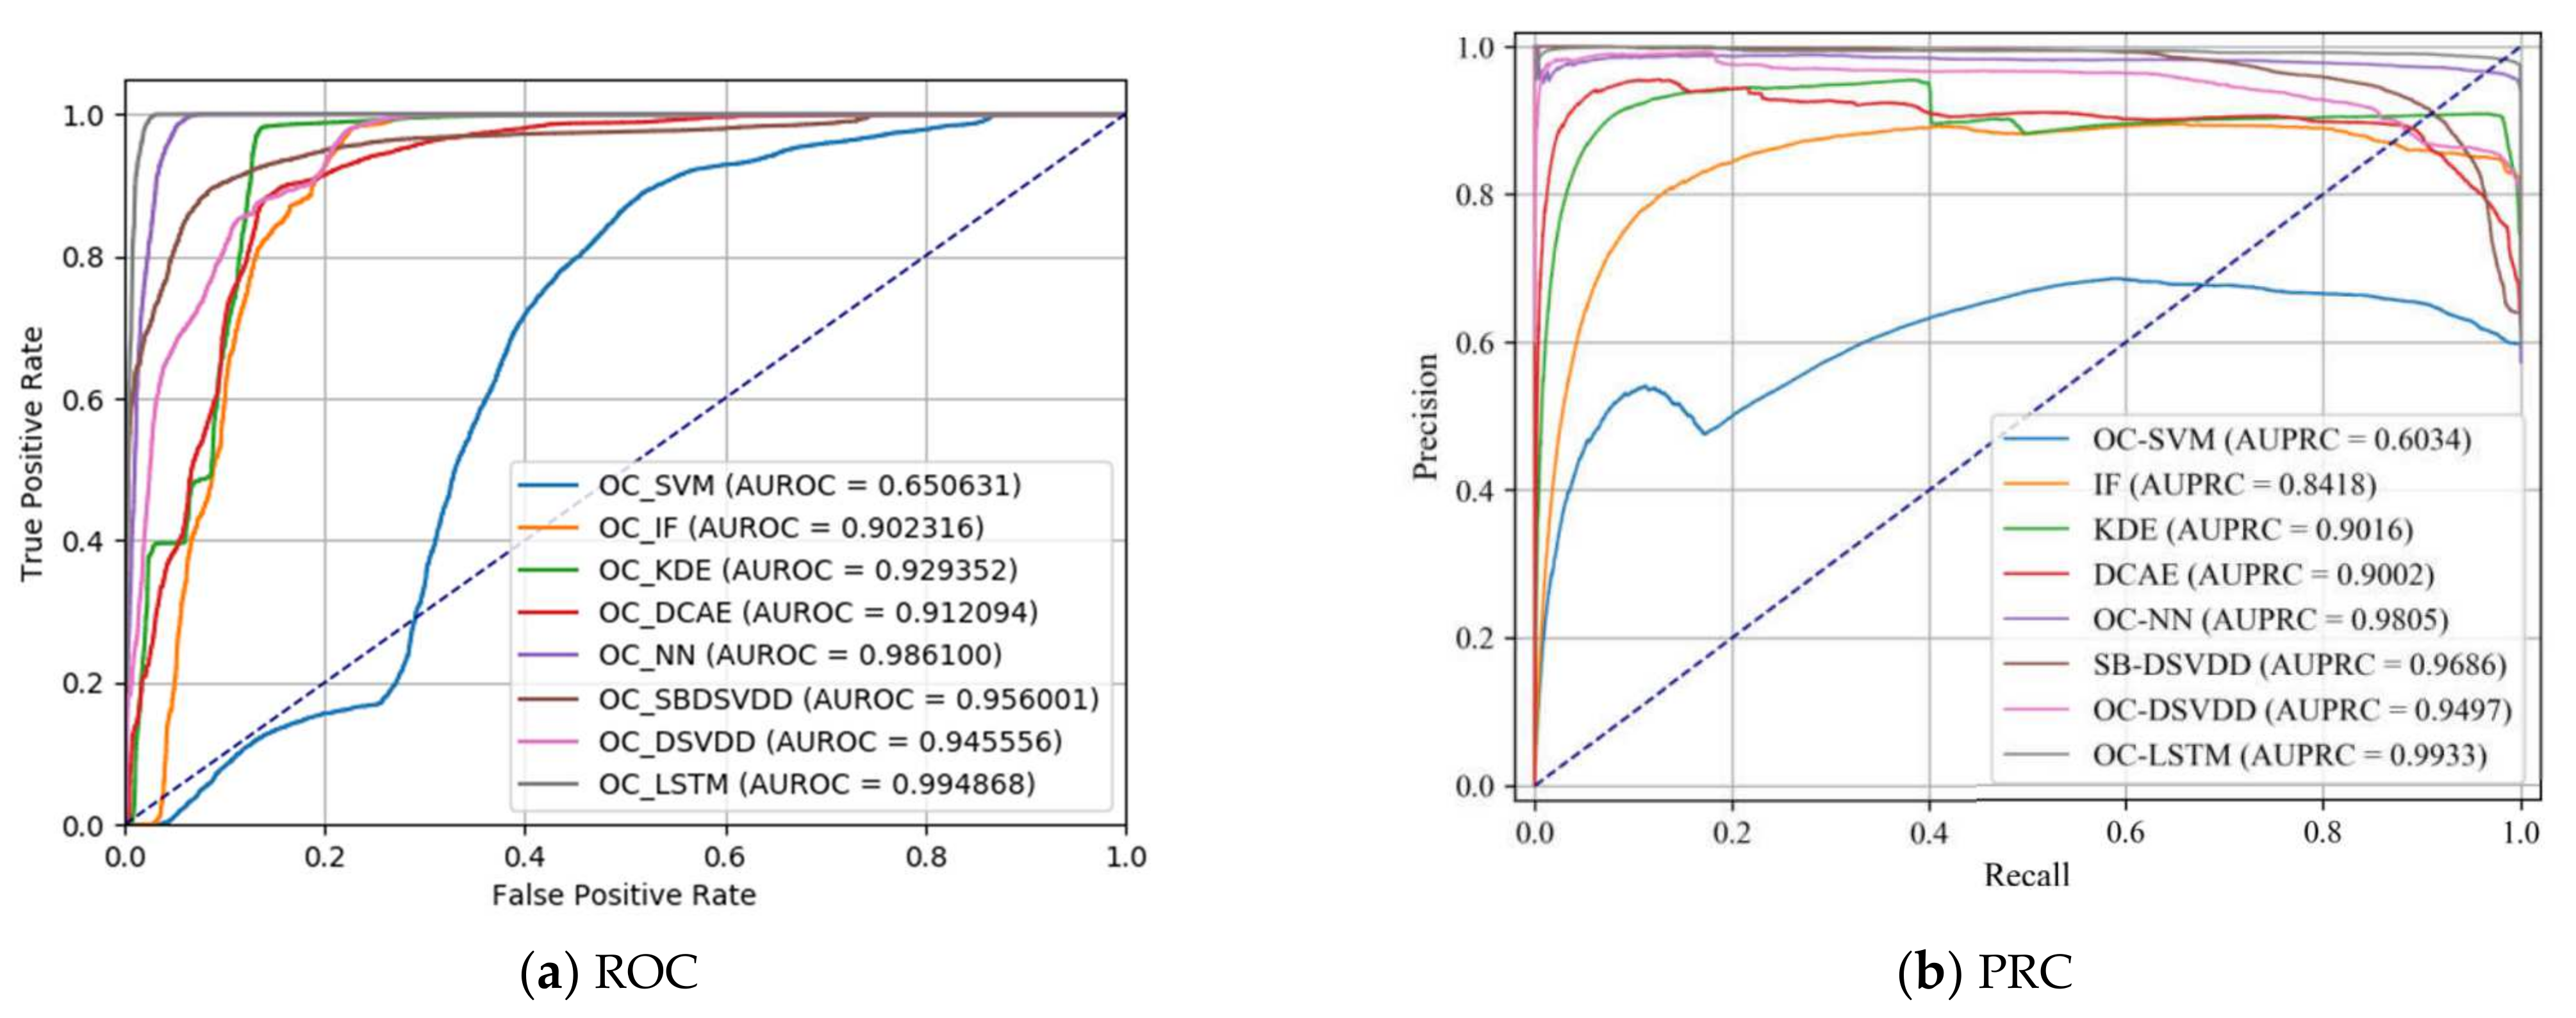
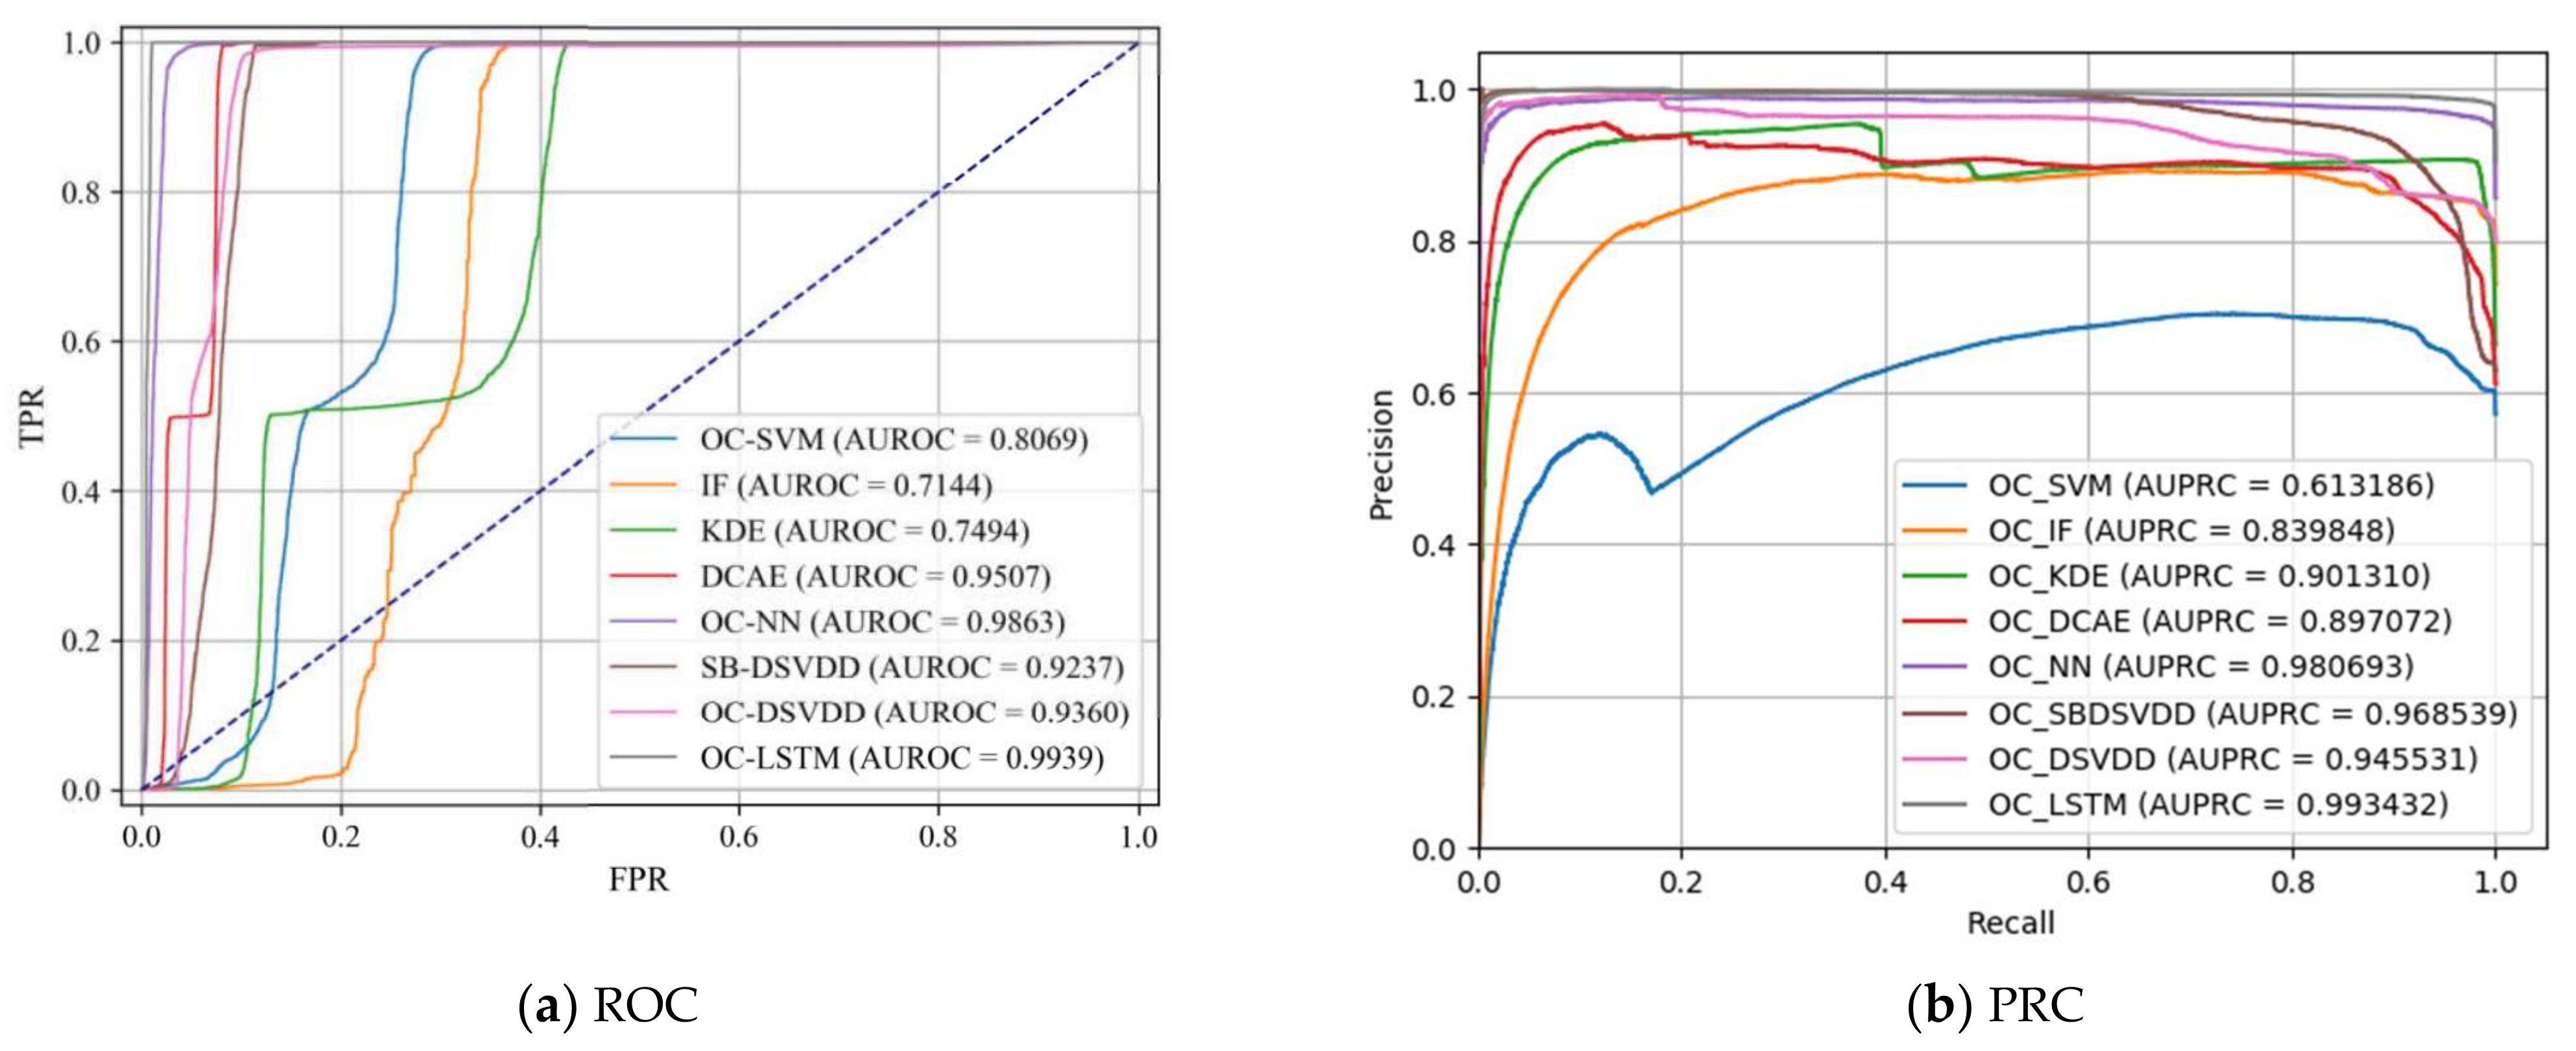
5.2. One-Class Classification on CIC-IDS2017

Two sub-datasets from CIC-IDS2017, CIC-DDoS, and CIC-PortScan were selected as experimental data. We randomly selected 90% records from CIC-DDoS as the training set and the rest as the test set. At the same time, CIC-PortScan data were also used as a test set to measure the generalization abilities of the models, as this is quite important in the field of network security.
Table 4 illustrates that the OC-LSTM model performed significantly better than the existing state-of-the-art methods. It is evident that the ability of the OC-LSTM model to extract progressively rich representations of complex sequential data within the hidden LSTM layer of the feed-forward network induced better an anomaly detection performance. In addition, the LSTM model also showed great generalization performance on the CIC-PortScan dataset. In contrast, the generalization performance of conventional methods such as soft-bound deep SVDD and one-class deep SVDD was poor, which means that they may not be suitable for applications in complex and changeable large-scale network traffic anomaly detection tasks. Note that the IF and DCAE methods performed better on CIC-PortScan, mainly because of the difference caused by the different types of anomalies in the two datasets. In addition, due to the use of SGD optimization (as recommended in [24]), soft-bound and one-class deep SVDD exhibited higher standard deviations than those of the other methods. The PRC and ROC for each model on the CIC-DDoS dataset are shown in Figure 5 and Figure 6, respectively.

5.3. One-Class Classification on MAWILab

In the field of network security, people are mostly inclined to effectively detect anomalous traffic in large-scale networks in order to ensure privacy and security. In this experiment, we examined the performances of the proposed algorithms in detecting original network traffic. We considered the raw network traffic dataset MAWILab, for which we performed a series of preprocessing and feature engineering steps to obtain 109-dimensional structured data.
The experiment was performed on two data subsets separated by one year to measure the models‘ abilities to detect highly variable network anomalies. The ratio of the number of samples in the training set to the number of samples in the test set was nine to one, and the test set comprised anomaly instances with normal samples for the sake of having balanced data. Note that due to the large amount of data in the training set, the shallow baseline models could not complete the training process in a reasonable time frame. Therefore, we randomly sampled the training set again and selected 10% of the data for the training of the shallow baseline models. This also reflects the superiority of the deep anomaly detection methods, that is, they can handle a large amount of complex data.
Table 5 presents the AUROC and AUPRC scores obtained by the various methods. The results on this dataset confirm that the performances of the deep methods were generally better than those of the shallow models, but individual shallow learning methods had more stable performance. The proposed OC-LSTM method undoubtedly outperformed all the deep models, with high AUROC and AUPRC values. Notably, the one-class deep SVDD method performed slightly better than its soft-boundary counterpart on both datasets.

5.4. The Anomaly Detection System

In order to verify the practicability of the above abnormal network traffic detection methods, our team designed a real-time dynamic monitoring system for network abnormality detection combined with a deep learning model and verified the effectiveness of the system in an ultra-large-scale high-speed network traffic environment.
The intelligent network anomaly detection real-time dynamic monitoring system used a browser/server (browser/server, B/S) structure. The system obtained traffic information by deploying security engines at various key points of the network. The system used an encrypted secure network to exchange information with the control center to achieve network data acquisition, analysis, and detection. At the same time, according to the results of the detection of abnormal traffic, the abnormal behavior that violates the security policy was merged and recorded or automatically filtered and blocked, and relevant information was sent to the control center in real time.
Based on the algorithm presented in this paper, the anomaly detection module in this system was constructed. The anomaly detection link was responsible for building a model to intelligently analyze the processed data and output the detection results. The network detection module implemented packet capture based on WinPcap and Tshark, and the feature engineering was implemented based on C++, and multi-threading was used to improve the processing speed of the system in the face of high-speed network traffic. The processed data contained 109-dimensional features. Based on the OC-LSTM algorithm proposed in this paper, the captured features were classified and trained, and then the classification model and prediction results were output and visualized. Among these, if the classification result was abnormal, a warning would be sent to the security center for blocking.

5.5. Discussion

In this study, we conducted experiments on three public datasets, and the proposed OC-LSTM algorithm achieved excellent results compared with other methods. As mentioned, on the NSL-KDD dataset, based on the total of all types of attacks, the method proposed in this paper achieved excellent performance, reaching 96.86% ± 0.58% and 96.72% ± 0.34% on the AUROC and AUPRC metrics, respectively. However, in the single-category classification, the IF algorithm obtained 99.20% ± 0.13% and 96.08% ± 0.74% on the AUROC and AUPRC metrics, respectively, when the data type was Probe. This shows that this shallow network model was not accurate in identifying all the data types. However, it achieved better results than our algorithm for the Probe data type. When the data type was R2L, the soft-bound deep SVDD algorithm achieved 92.92% ± 2.22% on AUROC, and the one-class deep SVDD achieves 66.82% ± 8.01% on AUPRC.
The OC-LSTM algorithm proposed in this paper achieved excellent results in relation to all data types on the other two data sets. However, there were also deficiencies in terms of specific data types. This shows that the algorithm still has room for improvement in identifying specific features. Furthermore, in designing a network anomaly detection system, to avoid this from happening, we adopted the form of an ensemble network. Some of the comparison methods and the OC-LSTM employed in this study were integrated in the server, and different weights were assigned to them for joint training. In this way, the advantages of various methods could be integrated, thereby greatly improving the accuracy and usability of anomaly detection of the system.

6. Conclusions

In this study, a one-class LSTM (OC-LSTM) method was proposed for end-to-end anomaly traffic detection on large-scale networks, and it was trained using a loss function similar to the OC-SVM optimization target. The advantage of the OC-LSTM is that it constructs the hidden layer features for the special task of anomaly detection. The proposed approach is quite different from the recently proposed hybrid approach based on auto-encoders or pre-trained models, which use deep learning features as the input for the anomaly detector. A series of comprehensive experiments on three complex network security data sets were conducted to demonstrate the consistent ability of our method to work well on a variety of one-class classification applications, which proves that the proposed method has significantly better performance than the most existing state-of-the-art anomaly detection methods. In future work, we will continue to refine our model and system to improve the accuracy and usability of this anomaly detection approach.

Author Contributions

Conceptualization, Y.L. and Y.X. (Yingying Xu); methodology, Y.C. and X.L.; validation, J.H., C.W. and W.G.; writing—original draft preparation, Y.L.; writing—review and editing, Y.C. and Y.X. (Yang Xin); supervision, Z.L. and L.C. All authors have read and agreed to the published version of the manuscript.

Funding

This work was supported in part by the Major Fundamental Research of Natural Science Foundation of Shandong Province under Grant ZR2019ZD05; Joint fund for Smart Computing of Shandong Natural Science Foundation under Grant ZR2020LZH013; open project of State Key Laboratory of Computer Architecture CARCHA202002; Qingdao Municipal Science and Technology Benefit People Demonstration and Guidance Special Project under Grant 21-1-4-sf-2-nsh; the Major Scientific and Technological Innovation Project in Shandong Province under Grant 2021CXG010506 and 2022CXG010504.

Institutional Review Board Statement

Not applicable.

Informed Consent Statement

Not applicable.

Data Availability Statement

Not applicable.

Conflicts of Interest

The authors declare no conflict of interest.

References

  1. Chandola, V.; Banerjee, A.; Kumar, V. Outlier detection: A survey. ACM Comput. Surv. 2007, 14, 15. [Google Scholar]
  2. Zhou, C.R.; Paffenroth, C. Anomaly detection with robust deep autoencoders. In Proceedings of the 23rd ACM SIGKDD International Conference on Knowledge Discovery and Data Mining, Halifax, NS, Canada, 13–17 August 2017; pp. 665–674. [Google Scholar]
  3. Rodríguez-Ruiz, J.; Mata-Sánchez, J.I.; Monroy, R.; Loyola-González, O.; López-Cuevas, A. A one-class classification approach for bot detection on Twitter. Comput. Secur. 2020, 91, 101715. [Google Scholar] [CrossRef]
  4. Perera, P.; Patel, V.M. Learning deep features for one-class classification. IEEE Trans. Image Process. 2019, 28, 5450–5463. [Google Scholar] [CrossRef] [PubMed] [Green Version]
  5. Li, D.; Deng, L.; Lee, M.; Wang, H. IoT data feature extraction and intrusion detection system for smart cities based on deep migration learning. Int. J. Inf. Manag. 2019, 49, 533–545. [Google Scholar] [CrossRef]
  6. Schölkopf, B.; Platt, J.C.; Shawe-Taylor, J.; Smola, A.J.; Williamson, R.C. Estimating the support of a high-dimensional distribution. Neural. Comput. 2001, 13, 1443–1471. [Google Scholar] [CrossRef] [PubMed]
  7. Tax, D.M.; Duin, R.P. Support vector data description. Mach. Learn. 2004, 54, 45–66. [Google Scholar] [CrossRef] [Green Version]
  8. Mishra, P.; Varadharajan, V.; Tupakula, U.; Pilli, E.S. A Detailed Investigation and Analysis of Using Machine Learning Techniques for Intrusion Detection. IEEE Commun. Surv. Tutor. 2019, 21, 686–728. [Google Scholar] [CrossRef]
  9. Nisioti, A.; Mylonas, A.; Yoo, P.D.; Katos, V. From Intrusion Detection to Attacker Attribution: A Comprehensive Survey of Unsupervised Methods. IEEE Commun. Surv. Tutor. 2018, 20, 3369–3388. [Google Scholar] [CrossRef]
  10. Cui, Z.; Xue, F.; Cai, X.; Cao, Y.; Wang, G.; Chen, J. Detection of Malicious Code Variants Based on Deep Learning. IEEE Trans. Ind. Inform. 2018, 14, 3187–3196. [Google Scholar] [CrossRef]
  11. Li, Y.; Xu, Y.; Liu, Z.; Hou, H.; Zheng, Y.; Xin, Y.; Zhao, Y.; Xin, Y.; Zhao, Y.; Cui, L. Robust detection for network intrusion of industrial IoT based on multi-CNN fusion. Measurement 2020, 154, 107450. [Google Scholar] [CrossRef]
  12. Chalapathy, R.; Chawla, S. Deep learning for anomaly detection: A survey. arXiv 2019, arXiv:1901.03407. [Google Scholar]
  13. Aldweesh, A.; Derhab, A.; Emam, A.Z. Deep learning approaches for anomaly-based intrusion detection systems: A survey, taxonomy, and open issues. Knowl. Based Syst. 2020, 189, 105124. [Google Scholar] [CrossRef]
  14. Khan, S.S.; Madden, M.G. One-class classification: Taxonomy of study and review of techniques. Knowl. Eng. Rev. 2014, 29, 345–374. [Google Scholar] [CrossRef] [Green Version]
  15. Krawczyk, B.; Galar, M.; Woźniak, M.; Bustince, H.; Herrera, F. Dynamic ensemble selection for multi-class classification with one-class classifiers. Pattern Recogn. 2018, 83, 34–51. [Google Scholar] [CrossRef]
  16. Wan, M.; Shang, W.; Zeng, P. Double Behavior Characteristics for One-Class Classification Anomaly Detection in Networked Control Systems. IEEE Trans. Inf. Forensics Secur. 2017, 12, 3011–3023. [Google Scholar] [CrossRef]
  17. Chalapathy, R.; Khoa, N.L.D.; Chawla, S. Robust Deep Learning Methods for Anomaly Detection. In Proceedings of the 26th ACM SIGKDD International Conference on Knowledge Discovery & Data Mining, Virtual Event, CA, USA, 6–10 July 2020; pp. 3507–3508. [Google Scholar]
  18. Xu, Y.; Liu, Z.; Li, Y.; Hou, H.; Cao, Y.; Zhao, Y.; Guo, W.; Cui, L. Feature data processing: Making medical data fit deep neural networks. Future Gener. Comput. Syst. 2020, 109, 149–157. [Google Scholar] [CrossRef]
  19. Muhammad, S.; Cheol-Hong, K.; Jong-Myon, K. A hybrid feature model and deep-learning-based bearing fault diagnosis. Sensors 2017, 17, 2876. [Google Scholar]
  20. Erfani, S.M.; Rajasegarar, S.; Karunasekera, S.; Leckie, C. High-dimensional and large-scale anomaly detection using a linear one-class SVM with deep learning. Pattern Recogn. 2016, 58, 121–134. [Google Scholar] [CrossRef]
  21. Chalapathy, R.; Menon, A.K.; Chawla, S. Anomaly detection using one-class neural networks. arXiv 2018, arXiv:1802.06360. [Google Scholar]
  22. Chalapathy, R.; Menon, A.K.; Chawla, S. Robust, deep and inductive anomaly detection. In Proceedings of the Joint European Conference on Machine Learning and Knowledge Discovery in Databases Springer, Skopje, Macedonia, 18–22 September 2017; pp. 36–51. [Google Scholar]
  23. Chen, J.; Sathe, S.; Aggarwal, C.; Turaga, D. Outlier detection with autoencoder ensembles. In Proceedings of the 2017 SIAM International Conference on Data Mining, Houston, TX, USA, 27–29 April 2017; pp. 90–98. [Google Scholar]
  24. Ruff, L.; Vandermeulen, R.; Goernitz, N.; Deecke, L.; Siddiqui, S.A.; Binder, A.; Kloft, M. Deep one-class classification. In Proceedings of the International Conference on Machine Learning, Vienna, Austria, 10–15 July 2018; pp. 4393–4402. [Google Scholar]
  25. Oza, P.; Patel, V.M. One-Class Convolutional Neural Network. IEEE Signal Proc. Let. 2019, 26, 277–281. [Google Scholar] [CrossRef] [Green Version]
  26. Schlachter, P.; Liao, Y.; Yang, B. Deep one-class classification using intra-class splitting. arXiv 2019, arXiv:1902.01194. [Google Scholar]
  27. Liu, F.T.; Ting, K.M.; Zhou, Z. Isolation Forest; IEEE: Piscataway, NJ, USA, 2008; pp. 413–422. [Google Scholar]
  28. Parzen, E. On estimation of a probability density function and mode. Ann. Math. Stat. 1962, 33, 1065–1076. [Google Scholar] [CrossRef]
  29. Masci, J.; Meier, U.; Cireşan, D.; Schmidhuber, J. Stacked Convolutional Auto-Encoders for Hierarchical Feature Extraction; Springer: Berlin/Heidelberg, Germany, 2011; pp. 52–59. [Google Scholar]
  30. Tavallaee, M.; Bagheri, E.; Lu, W.; Ghorbani, A.A. A Detailed Analysis of the KDD CUP 99 Data Set; IEEE: Piscataway, NJ, USA, 2009; pp. 1–6. [Google Scholar]
  31. Sharafaldin, I.; Lashkari, A.H.; Ghorbani, A.A. Toward generating a new intrusion detection dataset and intrusion traffic characterization. ICISSp 2018, 1, 108–116. [Google Scholar]
  32. Fontugne, R.; Borgnat, P.; Abry, P.; Fukuda, K. Mawilab: Combining diverse anomaly detectors for automated anomaly labeling and performance benchmarking. In Proceedings of the 6th International Conference; Springer: Berlin/Heidelberg, Germany, 2010; pp. 1–12. [Google Scholar]
  33. Kim, C.; Sim, J.; Choi, J. Generating labeled flow data from MAWILab traces for network intrusion detection. In Proceedings of the ACM Workshop on Systems and Network Telemetry and Analytics, Phoenix, AZ, USA, 25 June 2019; pp. 45–48. [Google Scholar]
  34. Abadi, M. Tensorflow: Large-scale machine learning on heterogeneous distributed systems. arXiv 2016, arXiv:1603.04467. [Google Scholar]
Figure 1. An example of two-dimensional data anomaly detection.
Applsci 12 05051 g001
Figure 2. Schematic diagram of the classic single classification algorithm.
Applsci 12 05051 g002
Figure 3. Anomaly detection performance of each model on NSL-KDD.
Applsci 12 05051 g003
Figure 4. The detection performance of different models on NSL-KDD for various types of anomalies.
Applsci 12 05051 g004
Figure 5. The ROC and PRC for each model on the CIC-DDoS dataset.
Applsci 12 05051 g005
Figure 6. The ROC and PRC for each model on the CIC-PortScan dataset.
Applsci 12 05051 g006
Table 1. Summary of the datasets used in the experiments.
DatasetsInstancesAnomaliesFeatures
NSL-KDDKDDTrain+67,343 (53.46%)58,630 (46.54%)41
KDDTest+9711 (43.08%)12,833 (56.92%)41
CIC-IDS 2017CIC-DDoS97,718 (43.29%)128,027 (56.71%)78
CIC-PortScan127,537 (44.52%)158,930 (55.48%)78
MAWILabMAWILab-2020010222,228,204 (97.06%)673,825 (2.94%)109
MAWILab-2020120325,195,651 (96.80%)832,028 (3.20%)109
Table 2. Average AUROC values as percentages with StdDevs per method on NSL-KDD.
Anomaly ClassOC-SVM/
SVDD
IFKDEDCAEOC-NNSoft-Bound
Deep SVDD
One-Class
Deep SVDD
OC-LSTM
DoS94.11 ± 0.0297.12 ± 0.2297.19 ± 0.0092.92 ± 1.7697.11 ± 0.2497.37 ± 0.7097.44 ± 0.6797.85 ± 0.23
Probe94.34 ± 0.0799.20 ± 0.1398.11 ± 0.0094.81 ± 2.0297.39 ± 0.1696.44 ± 0.9996.53 ± 0.4498.55 ± 0.15
R2L45.95 ± 0.2883.80 ± 1.2083.68 ± 0.0359.19 ± 4.5786.97 ± 0.7092.92 ± 2.2292.39 ± 1.8691.86 ± 1.33
U2R76.82 ± 0.1795.51 ± 0.6495.41 ± 0.0177.29 ± 5.5395.77 ± 1.0093.00 ± 1.7892.50 ± 2.0598.01 ± 0.34
Total83.86 ± 0.0694.59 ± 0.2594.42 ± 0.0184.46 ± 4.9194.97 ± 0.2296.17 ± 0.7196.11 ± 0.4896.86 ± 0.58
Table 3. Average AUPRC values as percentages with StdDevs per method on NSL-KDD.
Anomaly ClassOC-SVM/
SVDD
IFKDEDCAEOC-NNSoft-Bound
Deep SVDD
One-Class
Deep SVDD
OC-LSTM
DoS93.65 ± 0.0496.19 ± 0.4395.76 ± 0.0091.31 ± 1.8894.11 ± 0.3994.45 ± 1.7094.95 ± 1.3296.42 ± 0.37
Probe82.16 ± 0.1896.08 ± 0.7490.13 ± 0.0178.88 ± 6.3687.97 ± 1.3782.28 ± 4.7883.27 ± 1.9491.38 ± 0.96
R2L20.14 ± 0.0946.14 ± 3.0050.80 ± 0.0628.00 ± 5.1059.13 ± 2.9766.34 ± 5.5666.82 ± 8.0165.18 ± 3.84
U2R7.83 ± 0.0624.42 ± 3.5624.42 ± 0.047.20 ± 2.2021.68 ± 3.2816.34 ± 4.1315.57 ± 4.1042.24 ± 5.98
Total89.77 ± 0.0395.73 ± 0.2295.20 ± 0.0088.90 ± 3.4595.07 ± 0.2595.51 ± 1.0495.71 ± 0.5396.72 ± 0.34
Table 4. Average AUROC and AUPRC as percentages with StdDevs per method on CIC-IDS2017.
MethodCIC-DDoSCIC-PortScan
AUROCAUPRCAUROCAUPRC
OC-SVM/SVDD66.46 ± 0.9061.56 ± 0.7971.92 ± 0.0862.32 ± 0.06
IF90.75 ± 1.9284.95 ± 2.3574.64 ± 5.4267.11 ± 4.74
KDE92.81 ± 0.3489.78 ± 0.6974.98 ± 0.2067.79 ± 0.15
DCAE90.62 ± 2.5189.10 ± 5.1294.75 ± 4.2990.62 ± 7.37
OC-NN99.07 ± 0.2698.90 ± 0.4198.53 ± 0.7197.35 ± 1.48
Soft-Bound Deep SVDD95.94 ± 2.8396.56 ± 1.9388.49 ± 7.7882.47 ± 9.59
One-Class Deep SVDD97.59 ± 1.1297.72 ± 0.9285.50 ± 4.9179.25 ± 6.20
OC-LSTM99.24 ± 0.1499.15 ± 0.1699.66 ± 0.1999.07 ± 0.39
Table 5. Average AUROC and AUPRC values as percentages with StdDevs per method on MAWILab.
MethodMAWILab-20200102MAWILab-20201203
AUROCAUPRCAUROCAUPRC
OC-SVM/SVDD90.66 ± 0.2383.59 ± 0.4187.58 ± 0.3080.19 ± 0.51
IF94.58 ± 0.4290.43 ± 0.8689.35 ± 1.0486.51 ± 1.29
KDE92.17 ± 0.2186.81 ± 0.5589.81 ± 0.2485.17 ± 0.31
DCAE94.78 ± 1.0492.49 ± 1.4092.50 ± 1.3190.45 ± 1.53
OC-NN96.42 ± 0.3094.90 ± 0.4893.96 ± 0.2192.71 ± 0.51
Soft-Bound Deep SVDD94.89 ± 0.7391.49 ± 1.4690.96 ± 2.9088.53 ± 1.60
One-Class Deep SVDD95.00 ± 0.7391.70 ± 1.2691.79 ± 2.3090.04 ± 1.80
OC-LSTM97.36 ± 0.4996.70 ± 0.7294.58 ± 0.4793.23 ± 0.64
Publisher’s Note: MDPI stays neutral with regard to jurisdictional claims in published maps and institutional affiliations.

